Embed Size (px)
Citation preview
Policy Research Working Paper 7135
Economic Effects of the Syrian War and the Spread of the Islamic State on the Levant
Elena IanchovichinaMaros Ivanic
Middle East and North Africa RegionOffice of the Chief EconomistDecember 2014
WPS7135P
ublic
Dis
clos
ure
Aut
horiz
edP
ublic
Dis
clos
ure
Aut
horiz
edP
ublic
Dis
clos
ure
Aut
horiz
edP
ublic
Dis
clos
ure
Aut
horiz
edP
ublic
Dis
clos
ure
Aut
horiz
edP
ublic
Dis
clos
ure
Aut
horiz
edP
ublic
Dis
clos
ure
Aut
horiz
edP
ublic
Dis
clos
ure
Aut
horiz
ed
Produced by the Research Support Team
Abstract
The Policy Research Working Paper Series disseminates the findings of work in progress to encourage the exchange of ideas about development issues. An objective of the series is to get the findings out quickly, even if the presentations are less than fully polished. The papers carry the names of the authors and should be cited accordingly. The findings, interpretations, and conclusions expressed in this paper are entirely those of the authors. They do not necessarily represent the views of the International Bank for Reconstruction and Development/World Bank and its affiliated organizations, or those of the Executive Directors of the World Bank or the governments they represent.
Policy Research Working Paper 7135
This paper is a product of the Office of the Chief Economist, Middle East and North Africa Region. It is part of a larger effort by the World Bank to provide open access to its research and make a contribution to development policy discussions around the world. Policy Research Working Papers are also posted on the Web at http://econ.worldbank.org. The authors may be contacted at [email protected].
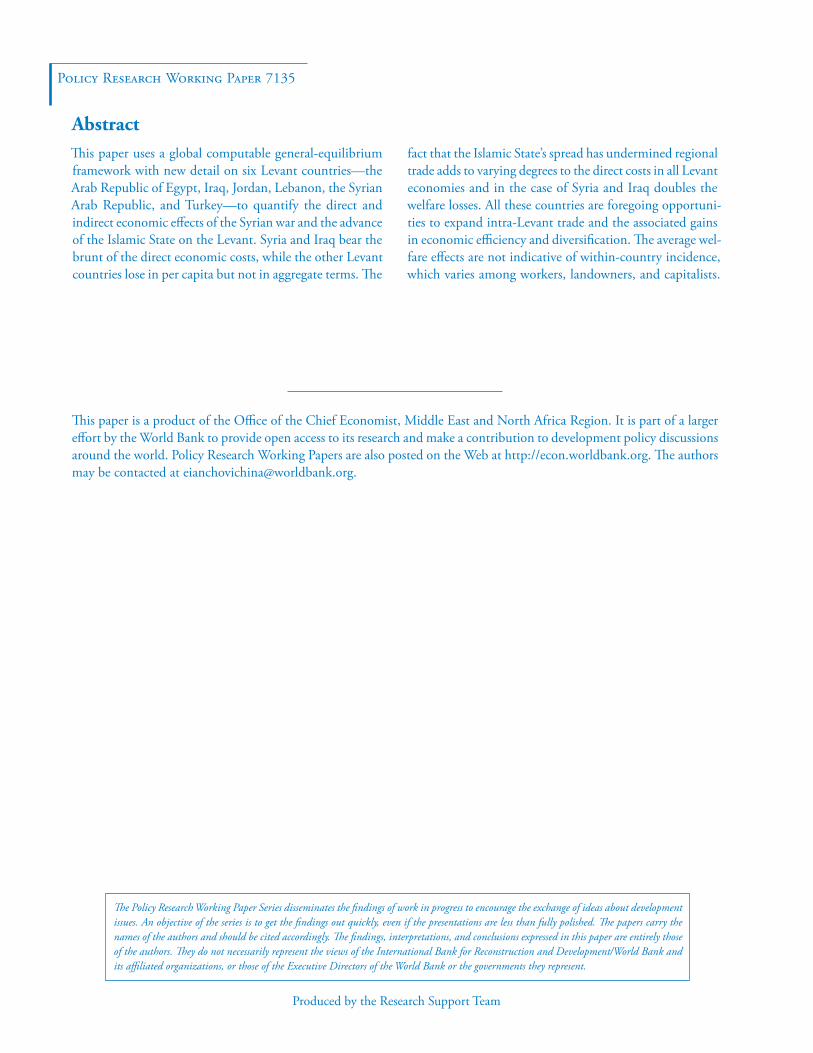
This paper uses a global computable general-equilibrium framework with new detail on six Levant countries—the Arab Republic of Egypt, Iraq, Jordan, Lebanon, the Syrian Arab Republic, and Turkey—to quantify the direct and indirect economic effects of the Syrian war and the advance of the Islamic State on the Levant. Syria and Iraq bear the brunt of the direct economic costs, while the other Levant countries lose in per capita but not in aggregate terms. The
fact that the Islamic State’s spread has undermined regional trade adds to varying degrees to the direct costs in all Levant economies and in the case of Syria and Iraq doubles the welfare losses. All these countries are foregoing opportuni-ties to expand intra-Levant trade and the associated gains in economic efficiency and diversification. The average wel-fare effects are not indicative of within-country incidence, which varies among workers, landowners, and capitalists.
Economic Effects of the Syrian War and the Spread of the Islamic State on the Levant∗
Elena Ianchovichina♦ and Maros Ivanic♣
JEL classification: F14, F15, F51
Keywords: Syrian war, Islamic State, trade restrictions, deep trade integration, the Levant, Iraq, Syria, Jordan, Lebanon, Turkey, Egypt, general equilibrium effects
∗ We are grateful to Shantayanan Devarajan for his comments on previous drafts of this paper. We also thank Sibel Kulaksiz, Jorge Araujo, and participants in the 17th annual conference on global economic analysis in Dakar for comments on earlier versions of this paper. ♦ Elena Ianchovichina is lead economist in the Chief Economist Office, Middle East and North Africa Region, the World Bank, 1818 H Street NW, Washington, DC 20433, USA, Tel: +1 202 458 8910, E-mail: [email protected] . ♣ Maros Ivanic is research economist in the Development Research Group, World Bank. 1818 H Street NW, Washington, DC 20433, USA, Tel: +1 202 473 2604, E-mail: [email protected].
1. Introduction
On the eve of the Arab Spring, six countries in the greater Levant--Turkey, the Syrian Arab
Republic, Iraq, Jordan, Lebanon, and the Arab Republic of Egypt--were considering reforms that
would have deepened their trade ties and accelerated economic growth, diversification, and job
creation. Specific attention was placed on liberalizing agricultural trade with Turkey, reducing
the restrictiveness of non-tariff measures, improving transport logistics, and liberalizing intra-
Levant trade in services. These reforms were considered essential for stimulating regional trade
and were the main components of a reform package that would have been negotiated and
implemented as part of a new Levant economic zone (World Bank, 2013).1 In 2011, many of
these countries embarked on political transitions that took priority over other issues. In Syria,
initial demonstrations quickly turned into an uprising which grew into a civil war and resulted in
widespread devastation with spillovers to neighboring countries. This war and the subsequent
advance of the Islamic State of Iraq and Syria (ISIS) – collectively referred to in this paper as the
Levant conflict or war – imposed enormous human, social, and economic costs and put a halt to
the regional trade integration process, thus undermining development with serious implications
for the future of the Levant.
Despite the widespread interest in the Levant war, there are no systematic analyses of its regional
and country-specific economic effects. This paper addresses this gap and contributes to the
literature a general equilibrium assessment of the Levant conflict, factoring in both the effects of
war and the associated disintegration of regional trade. The paper is related to and combines
features of two distinct literatures – on trade reform and restrictions (Trela and Whalley, 1990;
1 We refer to the new Levant economic zone as simply the Levant or the Levant area, although the geographic Levant area includes other countries and territories. The six economies would have composed the new Levant economic zone.
2
de Melo and Winters, 1992; Yang et al., 1997; Ianchovichina and Martin, 2004; Walmsley et al.
2006; Anderson et al. 2006); and on natural disasters and wars (Grobar and Gnanselvam, 1993;
Collier, 1999; Rose and Liao, 2005; Okuyama, 2007). Grobar and Gnanselvam (1993) use a case
study approach relying on national accounts data to examine the economic effects of the Sri
Lankan civil war and the potential future costs associated with a continuation of the conflict.
Collier (1999), who provides an ex post assessment of all civil wars between 1960 and 1990,
finds that war affects not only the level but also the composition of economic activity, especially
for manufacturing and some services sectors in Uganda. Input-output (IO) models, as in Rose et
al. (1997), are the most widely used modeling tools for ex-ante assessments of the higher-order
effects of both natural and man-made disasters. The popularity of these models is based mainly
on their ability to reflect the interdependencies within a regional economy and their simplicity,
but they have rigid structure with respect to substitution among inputs and imports. These
models also lack explicit resource constraints and responsiveness to price changes (Rose, 2004).
Unlike these widely used approaches for evaluation of disasters, this paper relies on a global
computable general equilibrium (CGE) framework, documented in Hertel (1997). The model has
been widely used in global, regional, and country-specific trade liberalization assessments and
offers advantages in terms of ensuring consistency through explicit constraints while including
important sectoral detail, such as input and import substitutability and price responsiveness. The
paper demonstrates the advantages of the GE approach over these simpler conventional
frameworks by assessing the “pure” general equilibrium (GE) effects of conflict, defined as the
difference between the non-linear and linear solutions to the model, where by linear we mean a
first-order approximation of the solution with data coefficients kept constant at initial levels. The
pure GE effects differ in sign and size and are significant for Syria and Iraq, the two countries
3
most directly affected by the Levant war. Thus, the results indicate that simpler linear approaches
would misstate the “true” effects of war, making it difficult to determine the direction of bias.
Although widely used and comprehensive in many ways, the GTAP 8 database has insufficient
information on the Levant economies. Therefore, we modify the database and add to it input-
output, trade, and protection data on Lebanon, Syria, Iraq, Jordan, and several other Middle East
and North African (MENA) economies, including West Bank and Gaza, Yemen, Algeria, and
Libya. This major modification required balancing both bilateral trade flows and macroeconomic
country aggregates in the global database and was warranted in order to reflect accurately the
regional spillover effects of the Levant war. We also adjusted trade preferences in all MENA
countries in order to reflect accurately existing global, regional, and bilateral trade agreements
and avoid overestimating the trade-related effects of foregone reforms.
Simulation results reported in the paper indicate the qualitative changes likely to occur as a result
of the conflict and regional trade disintegration while the magnitudes of the direct war effects
reflect the intensity and scope of the conflict as of mid-2014. The results suggest that Syria and
Iraq bear the brunt of the direct war costs, losing 14% and 16% in per capita welfare,
respectively. The embargo on trade with Syria is a major factor behind this country’s real GDP
decline, which is estimated at 30% and is much larger than its per capita output decline of 13%,
due to the effect of Syrian refugees and war casualties on the population count. All other Levant
economies lose in per capita terms, but not in aggregate terms because the inflows of refugees
boost population numbers, and therefore aggregate consumption, investment, and labor supply.
Lebanon’s per capita welfare losses are largest and reach close to 11%, while those of Turkey,
Egypt, and Jordan do not surpass 1.5%. The difference between aggregate and per capita welfare
effects are most pronounced in Lebanon, where the increase in the refugee-to-citizen ratio is
4
greatest, and minimal for Turkey and Egypt, where refugees account for a small share of the
population.
The direct effects of the Levant war are an understatement of the real economic costs of the
Levant conflict. Recall that these countries were embarking on a process of regional trade
integration just before the outbreak of war. If the foregone benefits of this integration, especially
those associated with failed services liberalization, are included then the total costs of war for
Syria and Iraq almost double, reaching 23% and 28%, respectively, and escalate to 10% for
Egypt and 9% for Jordan. Furthermore, the average welfare effects are not indicative of the
incidence within countries. In Syria, all economic agents are hurt but landowners lose the most
as people abandon their homes and farms in search of security. By contrast, in Lebanon and
Turkey, land and capital owners benefit while workers lose because the large number of refugees
put pressure on demand and augment labor supply.
The remainder of this paper is structured as follows. Section 2 presents the features of the CGE
model and the data modifications. Section 3 discusses the simulation design, including the main
features of the pre-war plans for trade integration reforms and the war scenario. Section 4
presents the simulation results focusing on welfare, sectoral outputs, factor prices, and the pure
GE effects. Finally, we summarize and offer concluding remarks in section 5.
2. Features of the CGE model and data modifications
The multi-country, multi-sector CGE model, used in this paper and documented in Hertel (1997),
is well-suited and widely used for quantitative, ex-ante investigations of the effects of regional
trade agreements. In this model, firms are assumed to produce for domestic and export markets,
using constant-returns-to-scale technology and a mix of primary and intermediate inputs.
5
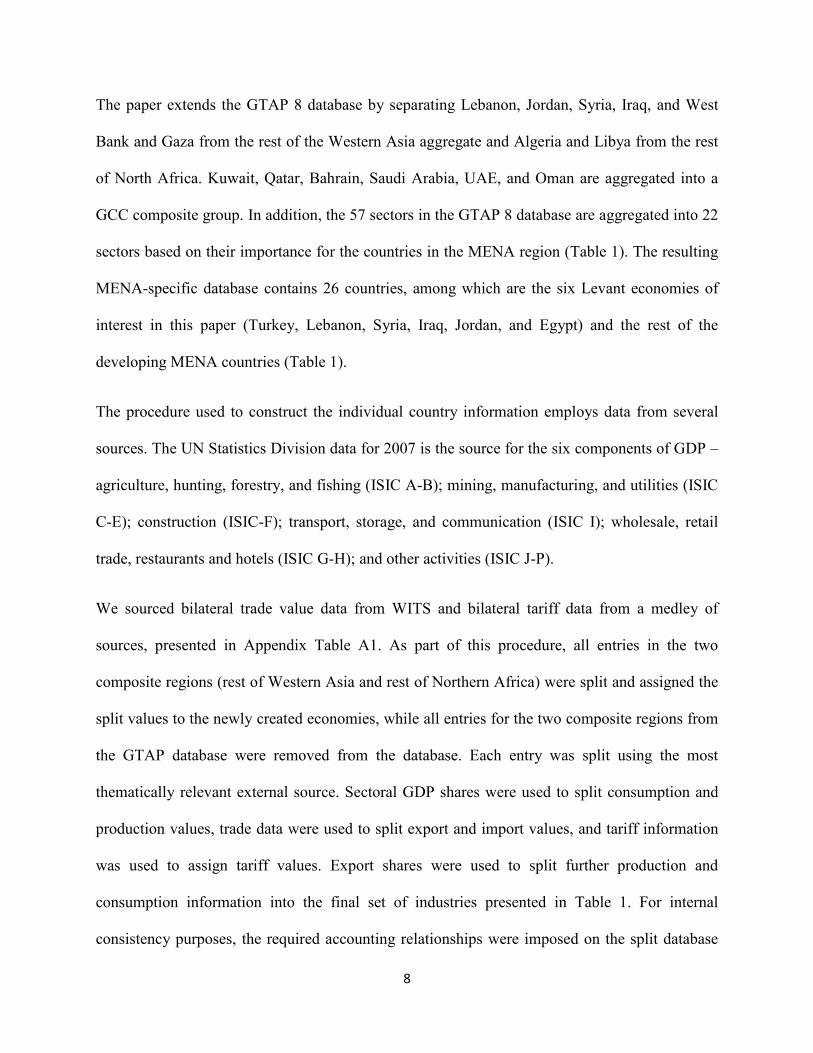
Intermediate products are either produced domestically or imported and substitute imperfectly,
following the Armington structure. Product differentiation between imported and domestic goods
and among imports from different regions allow for two-way trade in each product category,
depending on the ease of substitution between products from different regions. Land, physical
capital, skilled, and unskilled labor, and in some sectors a natural resource factor, are used as
primary factor inputs into production. The model takes into account the role of overall resource
constraints in determining sectoral output supply, has an explicit treatment of international trade
and transport margins, a “global” bank mediating between world savings and investment, and a
consumer demand system designed to capture differential price and income responsiveness
across countries. The accounting relationships and behavioral linkages constrain outcomes in
ways not possible with partial equilibrium models. Each country’s exports of a particular good
equal total imports of this good in other countries, net of shipping costs; global investment equals
global savings; aggregate output determines aggregate income in each country; global supply and
demand for individual goods balance; demand equals supply for each factor in a country;
increases in total factor productivity which raise competitiveness also raise factor prices and help
offset the original increase in competitiveness. The results obtained with the model are indicative
of medium term outcomes as factor inputs are perfectly mobile across sectors and returns adjust
to changes in economic conditions.
6
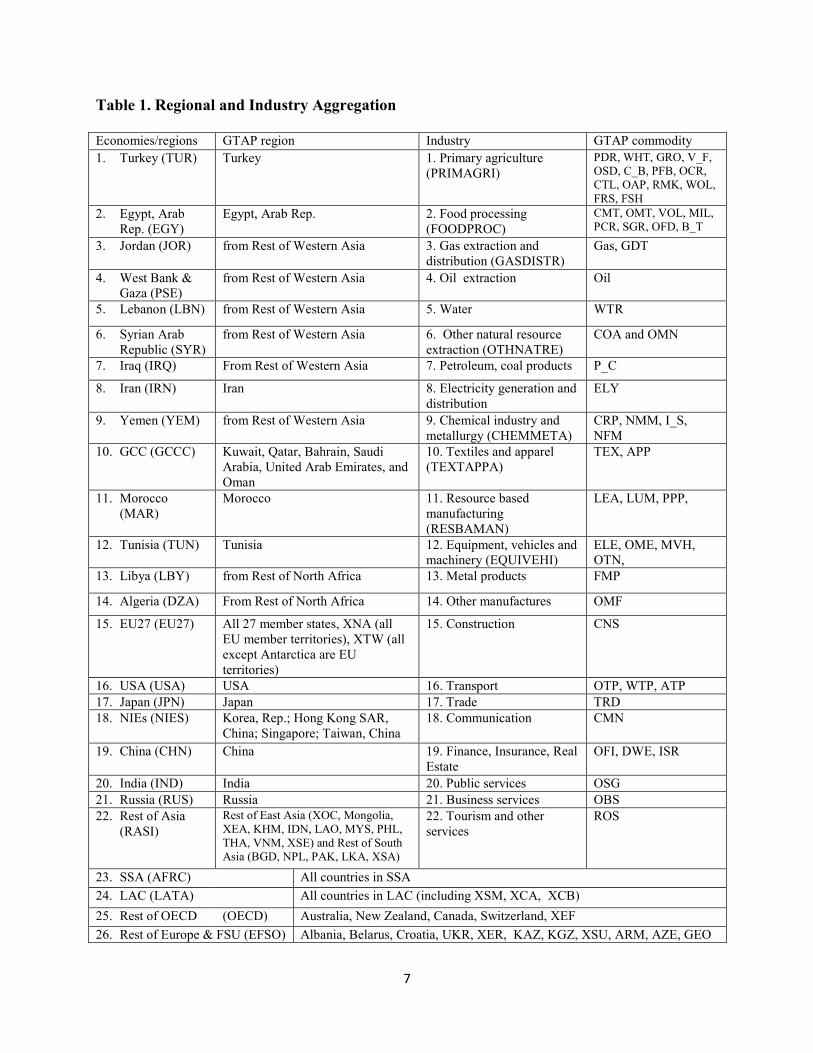
Table 1. Regional and Industry Aggregation
Economies/regions GTAP region Industry GTAP commodity 1. Turkey (TUR) Turkey 1. Primary agriculture
(PRIMAGRI) PDR, WHT, GRO, V_F, OSD, C_B, PFB, OCR, CTL, OAP, RMK, WOL, FRS, FSH
2. Egypt, Arab Rep. (EGY)
Egypt, Arab Rep. 2. Food processing (FOODPROC)
CMT, OMT, VOL, MIL, PCR, SGR, OFD, B_T
3. Jordan (JOR) from Rest of Western Asia 3. Gas extraction and distribution (GASDISTR)
Gas, GDT
4. West Bank & Gaza (PSE)
from Rest of Western Asia 4. Oil extraction Oil
5. Lebanon (LBN) from Rest of Western Asia 5. Water WTR
6. Syrian Arab Republic (SYR)
from Rest of Western Asia 6. Other natural resource extraction (OTHNATRE)
COA and OMN
7. Iraq (IRQ) From Rest of Western Asia 7. Petroleum, coal products P_C
8. Iran (IRN) Iran 8. Electricity generation and distribution
ELY
9. Yemen (YEM) from Rest of Western Asia 9. Chemical industry and metallurgy (CHEMMETA)
CRP, NMM, I_S, NFM
10. GCC (GCCC) Kuwait, Qatar, Bahrain, Saudi Arabia, United Arab Emirates, and Oman
10. Textiles and apparel (TEXTAPPA)
TEX, APP
11. Morocco (MAR)
Morocco 11. Resource based manufacturing (RESBAMAN)
LEA, LUM, PPP,
12. Tunisia (TUN) Tunisia 12. Equipment, vehicles and machinery (EQUIVEHI)
ELE, OME, MVH, OTN,
13. Libya (LBY) from Rest of North Africa 13. Metal products FMP
14. Algeria (DZA) From Rest of North Africa 14. Other manufactures OMF
15. EU27 (EU27) All 27 member states, XNA (all EU member territories), XTW (all except Antarctica are EU territories)
15. Construction CNS
16. USA (USA) USA 16. Transport OTP, WTP, ATP 17. Japan (JPN) Japan 17. Trade TRD 18. NIEs (NIES) Korea, Rep.; Hong Kong SAR,
China; Singapore; Taiwan, China 18. Communication CMN
19. China (CHN) China 19. Finance, Insurance, Real Estate
OFI, DWE, ISR
20. India (IND) India 20. Public services OSG 21. Russia (RUS) Russia 21. Business services OBS 22. Rest of Asia
(RASI) Rest of East Asia (XOC, Mongolia, XEA, KHM, IDN, LAO, MYS, PHL, THA, VNM, XSE) and Rest of South Asia (BGD, NPL, PAK, LKA, XSA)
22. Tourism and other services
ROS
23. SSA (AFRC) All countries in SSA 24. LAC (LATA) All countries in LAC (including XSM, XCA, XCB) 25. Rest of OECD (OECD) Australia, New Zealand, Canada, Switzerland, XEF 26. Rest of Europe & FSU (EFSO) Albania, Belarus, Croatia, UKR, XER, KAZ, KGZ, XSU, ARM, AZE, GEO
7
The paper extends the GTAP 8 database by separating Lebanon, Jordan, Syria, Iraq, and West
Bank and Gaza from the rest of the Western Asia aggregate and Algeria and Libya from the rest
of North Africa. Kuwait, Qatar, Bahrain, Saudi Arabia, UAE, and Oman are aggregated into a
GCC composite group. In addition, the 57 sectors in the GTAP 8 database are aggregated into 22
sectors based on their importance for the countries in the MENA region (Table 1). The resulting
MENA-specific database contains 26 countries, among which are the six Levant economies of
interest in this paper (Turkey, Lebanon, Syria, Iraq, Jordan, and Egypt) and the rest of the
developing MENA countries (Table 1).
The procedure used to construct the individual country information employs data from several
sources. The UN Statistics Division data for 2007 is the source for the six components of GDP –
agriculture, hunting, forestry, and fishing (ISIC A-B); mining, manufacturing, and utilities (ISIC
C-E); construction (ISIC-F); transport, storage, and communication (ISIC I); wholesale, retail
trade, restaurants and hotels (ISIC G-H); and other activities (ISIC J-P).
We sourced bilateral trade value data from WITS and bilateral tariff data from a medley of
sources, presented in Appendix Table A1. As part of this procedure, all entries in the two
composite regions (rest of Western Asia and rest of Northern Africa) were split and assigned the
split values to the newly created economies, while all entries for the two composite regions from
the GTAP database were removed from the database. Each entry was split using the most
thematically relevant external source. Sectoral GDP shares were used to split consumption and
production values, trade data were used to split export and import values, and tariff information
was used to assign tariff values. Export shares were used to split further production and
consumption information into the final set of industries presented in Table 1. For internal
consistency purposes, the required accounting relationships were imposed on the split database
8
using iterative proportional fitting and the procedure was repeated until the database was
balanced and consistent with all external targets.
Another important modification was the implementation of the Pan-Arab Free Trade Area
(PAFTA), 2 the bilateral preferences associated with the Euromed Association Agreements
(AAs), and the bilateral FTAs with Turkey into the tariff rate structure of the GTAP 8 database.3
We obtained information on bilateral preferences at the most disaggregate product level from a
variety of sources, including MFN and non-MFN rates from WTO data, country tariff data, and
in the case of the European Union, Eurostat (see Appendix Table A1). Bilateral rates among
PAFTA members were set at zero to reflect free trade in agricultural goods and manufactures.
Whenever bilateral country tariff information and non-MFN rates from WTO sources were not
available, we assumed reciprocity and applied the rates extended by the partner. In the absence
of such rates we applied the MFN WTO rates. Duties on imports from countries outside the
MENA region were left unchanged whenever the importing country was part of the GTAP
database. In those cases when the country information had to be created from a composite
region, we applied WTO MFN rates or used country information. The detailed data on bilateral
tariff lines were aggregated into weighted average rates for the 22 sectors in the paper using
bilateral import data from WITS for 2007.4 Whenever such data were not available, imports were
inferred from exports for 2007 or from WITS data for 2008.
2 PAFTA led to the removal of tariffs on intra-regional trade in manufactured and agricultural products in the mid-2000s. 3 During the 2000s most MENA countries negotiated these agreements with the objective of extending the free trade area created by PAFTA to the North by including two major markets and potential locomotives of growth – the European Union (EU) and Turkey. 4 This year was chosen in order to match the benchmark year of the GTAP 8 Data base.
9
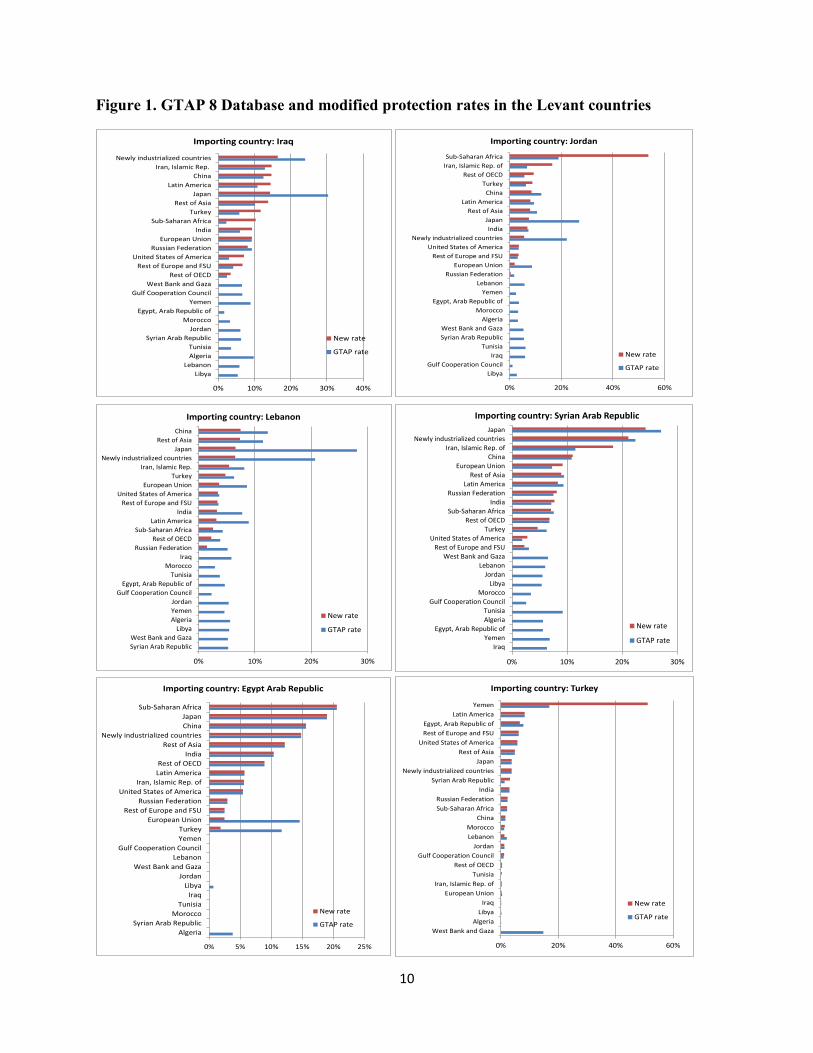
Figure 1. GTAP 8 Database and modified protection rates in the Levant countries
0% 10% 20% 30% 40%
LibyaLebanon
AlgeriaTunisia
Syrian Arab RepublicJordan
MoroccoEgypt, Arab Republic of
YemenGulf Cooperation Council
West Bank and GazaRest of OECD
Rest of Europe and FSUUnited States of America
Russian FederationEuropean Union
IndiaSub-Saharan Africa
TurkeyRest of Asia
JapanLatin America
ChinaIran, Islamic Rep.
Newly industrialized countries
Importing country: Iraq
New rate
GTAP rate
0% 20% 40% 60%
LibyaGulf Cooperation Council
IraqTunisia
Syrian Arab RepublicWest Bank and Gaza
AlgeriaMorocco
Egypt, Arab Republic ofYemen
LebanonRussian Federation
European UnionRest of Europe and FSU
United States of AmericaNewly industrialized countries
IndiaJapan
Rest of AsiaLatin America
ChinaTurkey
Rest of OECDIran, Islamic Rep. ofSub-Saharan Africa
Importing country: Jordan
New rate
GTAP rate
0% 10% 20% 30%
Syrian Arab RepublicWest Bank and Gaza
LibyaAlgeriaYemenJordan
Gulf Cooperation CouncilEgypt, Arab Republic of
TunisiaMorocco
IraqRussian Federation
Rest of OECDSub-Saharan Africa
Latin AmericaIndia
Rest of Europe and FSUUnited States of America
European UnionTurkey
Iran, Islamic Rep.Newly industrialized countries
JapanRest of Asia
China
Importing country: Lebanon
New rate
GTAP rate
0% 10% 20% 30%
IraqYemen
Egypt, Arab Republic ofAlgeriaTunisia
Gulf Cooperation CouncilMorocco
LibyaJordan
LebanonWest Bank and Gaza
Rest of Europe and FSUUnited States of America
TurkeyRest of OECD
Sub-Saharan AfricaIndia
Russian FederationLatin America
Rest of AsiaEuropean Union
ChinaIran, Islamic Rep. of
Newly industrialized countriesJapan
Importing country: Syrian Arab Republic
New rate
GTAP rate
0% 5% 10% 15% 20% 25%
AlgeriaSyrian Arab Republic
MoroccoTunisia
IraqLibya
JordanWest Bank and Gaza
LebanonGulf Cooperation Council
YemenTurkey
European UnionRest of Europe and FSU
Russian FederationUnited States of America
Iran, Islamic Rep. ofLatin AmericaRest of OECD
IndiaRest of Asia
Newly industrialized countriesChinaJapan
Sub-Saharan Africa
Importing country: Egypt Arab Republic
New rate
GTAP rate
0% 20% 40% 60%
West Bank and GazaAlgeria
LibyaIraq
European UnionIran, Islamic Rep. of
TunisiaRest of OECD
Gulf Cooperation CouncilJordan
LebanonMorocco
ChinaSub-Saharan AfricaRussian Federation
IndiaSyrian Arab Republic
Newly industrialized countriesJapan
Rest of AsiaUnited States of America
Rest of Europe and FSUEgypt, Arab Republic of
Latin AmericaYemen
Importing country: Turkey
New rate
GTAP rate
10
These tariff rate modifications are essential for this analysis as suggested by the substantial
differences between the tariff rates available in the GTAP 8 database, especially those implied
for Jordan, Iraq, Lebanon, and Syria (Figure 1), and the updated tariff rates, presented by
country, product, and source in Appendix Tables B1-B6. Since the GTAP tariffs attributed to
Jordan, Iraq, Lebanon, and Syria are composite rates, they do not correspond to the actual trade
profile of these countries. Therefore, the new tariff rates differ from the GTAP ones both because
of differences in the tariff lines and trade composition. By contrast, the tariff information on
Egypt and Turkey in the GTAP 8 database represents relatively accurately existing preferences
(Figure 1).
3. Simulation design
The pre-war efforts for deeper trade integration in the Levant are reflected in the pre-simulation
analysis. Starting from the newly constructed database, the pre-simulation analysis implements
the deep trade initiatives discussed by the Levant countries prior to the onset of the Syrian war in
2011. The context for these reforms and the shocks associated with each of these reforms are
presented in section 3.1. The updated database from the pre-simulation analysis, which
represents an integrated Levant in a peaceful alternative world, is the starting point for the
simulation analysis of the Syrian conflict and the spread of ISIS as well as the disintegration of
the deep regional trade ties. The design of the war and disintegration scenarios are presented in
section 3.2.
11
3.1 Construction of the pre-simulation database
On the eve of the Arab Spring, the Levant economies were eager to move forward with plans for
a new Levant Economic Zone (LEZ) which would have enforced deep trade concessions and
therefore generated potentially bigger gains than those associated with past shallow trade
agreements.5 It would have removed tariffs on agricultural and processed foods trade between
Turkey and the five Levant countries and would have liberalized transport and trade in other
services within the LEZ. Reforms were expected to address the constraints to a strong supply
response by reducing the negative effect of public monopolies in key services sectors, 6
harmonizing business and investment climate rules and regulations,7 especially those governing
investments in services, improving domestic and cross-border infrastructure and logistics and the
implementation capacity in junior partner countries.8 The hope was that reforms would propel
convergence toward best practices and thus advance private sector development in the greater
Levant area.
Importantly, the regional trade agreement would have underpinned political and security
arrangements in the region, consolidated the bilateral FTAs of Egypt, Lebanon, Jordan, and Syria
with Turkey, and improved market access for Turkey and Iraq to each other’s economies. The
negotiations were expected to be constrained by Turkey’s pre-existing agreements. Turkey
5 In MENA, the benefits of trade liberalization, involving mainly tariff removal on manufactured goods, have been limited (Testas, 1998, 2002; Al-Atrash and Yousef, 2000; and Freund and Portugal-Perez, 2012). Konan (2003) and Bchir et al. (2006) argued that the benefits would increase with deepening of the commitments, especially the opening of the services sectors. Barriers to trade in services were higher than in economies with similar incomes in other parts of the world (Hoekman and Sekkat, 2010) and their removal was expected to lead to a significant productivity boost in services and the boarder economy (Hoekman and Messerin 2001). 6 See, for example, studies by Hoekman and Zarrouk (2000) and Rosotto, Sekkat, and Varoudakis (2005). 7 Using a survey of firms in eight Arab countries, Zarrouk (2003) estimated that in 2000 the cost of getting goods across borders was on average 10 percent of the value of transported cargo. Prohibitions, arbitrary changes in documentary requirements, surcharges, and discriminatory taxes imposed severe costs on intra-Arab trade. 8 Recent assessments suggest that progress has been made in terms of reducing the frequency and restrictive power of non-tariff measures (NTMs) (Augier et al. 2012).
12
would have been unable to make further concessions on manufactured goods’ tariff because of
its customs union with the European Union. Therefore, it was assumed that other Levant
countries would be reluctant to open further their markets for manufactured imports from
Turkey. However, because the customs union excludes agricultural trade, Turkey would have
been able to remove or significantly reduce its agricultural and food tariffs on trade within the
Levant. The concessions would have been sizable as tariffs on Turkey’s imports of agricultural
goods and processed foods from many of the Levant economies were much higher than tariffs on
manufactured imports from these same countries (see Appendix Table A1).
This momentum for deep trade reform is reflected in the pre-simulation scenario in the following
way. Tariffs on imported food and agricultural products are set to zero in the six Levant
economies. Any tariff revenue loss due to this reform is assumed to be compensated by a
consumption tax increase so as to keep the tax revenue constant as a share of income.
Improvements in transport logistics is assumed to result in cost reductions associated with a more
efficient process of shipping goods within the Levant area. The shocks are proportionate to the
reductions needed to bring down the transport cost of a standard container unit to and from these
countries to those of a leading country in the region, including MENA and Turkey. Information
on transport costs comes from the World Bank’s Doing Business database. 9 In the case of
exporting a container, the lowest cost country in the developing part of the Mediterranean region
is Morocco. In the case of importing a container Egypt is the lowest cost country, while Jordan is
the lowest cost country without access to the Mediterranean.
9 Unlike Balistreri, Tarr, and Yonesawa (2014) we cannot employ the database on ad valorem equivalents of the costs of time in exporting and importing as this database does not have information on four of the six Levant economies of interest to us – Lebanon, Jordan, Syria, and Iraq.
13
Since the GTAP model does not differentiate across firms based on their ownership structure, as
in Tarr and Rutherford (2010), cross-broader services trade liberalization is reflected following
Walmsley et al. (2006) and representing the opening of the service sectors to foreign competition
as an efficiency improvement. Doytch and Uctum (2011) show that service FDI spurs growth in
the sector while a number of papers (Haskel et al., 2007; Markusen et al. 2005) show a positive
association between a firm’s productivity and the extent of foreign ownership of the firm. Haskel
et al. (2007) find a robust and significant positive correlation between the productivity of British
firms and the extent of foreign ownership whereas Markusen et al. (2005) argue that foreign
presence in services provides substantial benefits to domestic firms. The efficiency boost to
service companies engaged in cross-border service trade is implemented as a productivity shock
which lowers the effective prices of imported services. In order to estimate the size of the
productivity shocks, services productivity Π is represented as a function of the trade
restrictiveness policies affecting this sector, given by index Ψ, and other factors, represented as
Ω. This way productivity Π is given by Π(Ψ, Ω) and the percentage change in productivity is
𝛱𝛱� = 𝜀𝜀𝛹𝛹� , where ε is the elasticity of the productivity Π to change in the index Ψ. With the
elasticity ε equal to 1, changes in the trade restrictiveness index Ψ translate into changes in
productivity.10,11 Using the World Bank’s Services Trade Restrictions (STR) database, which
contains values of the STR index (STRI) for several service sectors in the Levant countries, and
assuming that trade liberalization will reduce the STRI to the minimum of the corresponding
indexes in the Euromed area, we computed the implied productivity changes. Sectoral STRIs
were available only for financial services and insurance, communications, trade, transportation,
10 This approach allows us to assess the effect of services liberalization without estimating the ad valorem tariff equivalents of the policies restricting trade in services. The process of computing the tariff equivalents is complex and requires additional information which was not available for the Levant countries. 11 Although the STR indexes are not constructed with regard to a specific factor such as productivity, their construction takes into account supply implications and thus the productivity levels in the sector.
14
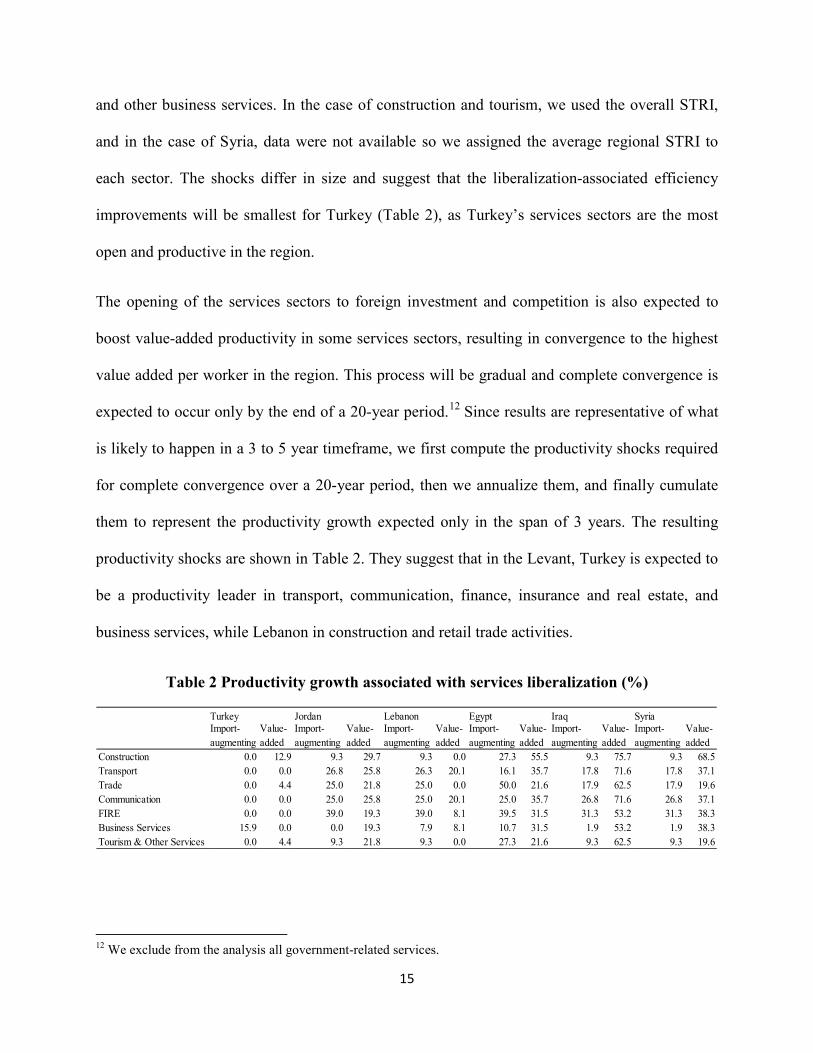
and other business services. In the case of construction and tourism, we used the overall STRI,
and in the case of Syria, data were not available so we assigned the average regional STRI to
each sector. The shocks differ in size and suggest that the liberalization-associated efficiency
improvements will be smallest for Turkey (Table 2), as Turkey’s services sectors are the most
open and productive in the region.
The opening of the services sectors to foreign investment and competition is also expected to
boost value-added productivity in some services sectors, resulting in convergence to the highest
value added per worker in the region. This process will be gradual and complete convergence is
expected to occur only by the end of a 20-year period.12 Since results are representative of what
is likely to happen in a 3 to 5 year timeframe, we first compute the productivity shocks required
for complete convergence over a 20-year period, then we annualize them, and finally cumulate
them to represent the productivity growth expected only in the span of 3 years. The resulting
productivity shocks are shown in Table 2. They suggest that in the Levant, Turkey is expected to
be a productivity leader in transport, communication, finance, insurance and real estate, and
business services, while Lebanon in construction and retail trade activities.
Table 2 Productivity growth associated with services liberalization (%)
12 We exclude from the analysis all government-related services.
Turkey Jordan Lebanon Egypt Iraq SyriaImport-augmenting
Value-added
Import-augmenting
Value-added
Import-augmenting
Value-added
Import-augmenting
Value-added
Import-augmenting
Value-added
Import-augmenting
Value-added
Construction 0.0 12.9 9.3 29.7 9.3 0.0 27.3 55.5 9.3 75.7 9.3 68.5Transport 0.0 0.0 26.8 25.8 26.3 20.1 16.1 35.7 17.8 71.6 17.8 37.1Trade 0.0 4.4 25.0 21.8 25.0 0.0 50.0 21.6 17.9 62.5 17.9 19.6Communication 0.0 0.0 25.0 25.8 25.0 20.1 25.0 35.7 26.8 71.6 26.8 37.1FIRE 0.0 0.0 39.0 19.3 39.0 8.1 39.5 31.5 31.3 53.2 31.3 38.3Business Services 15.9 0.0 0.0 19.3 7.9 8.1 10.7 31.5 1.9 53.2 1.9 38.3Tourism & Other Services 0.0 4.4 9.3 21.8 9.3 0.0 27.3 21.6 9.3 62.5 9.3 19.6
15
The macroeconomic closure for this simulation is consistent with the medium-term timeframe
and assumes a constant level of employment, with perfect mobility of skilled and unskilled labor
between sectors and none between countries or regions. Since the model does not keep track of
differences between foreign and domestic assets, we assume that Levant countries’ trade
balances are fixed as a share of the size of the economy.
3.2 Simulation scenario of war and trade disintegration in the Levant
We consider trade disintegration an indirect but essential effect of the Levant conflict. Therefore,
the database obtained from the pre-simulation scenario of deep trade liberalization is the initial
point for the war and trade disintegration scenarios. We implement shocks that completely
reverse the deep trade reforms discussed in 3.1 as well as shocks reflecting: (i) the change in
population and labor force size due to loss of life in Syria; (ii) the change in population and labor
force size due to refugee movements across countries; (iii) infrastructure destruction in Syria;
(iv) increases in trade costs in the Levant; (v) embargo on trade with Syria; and (vi) deterioration
in productivity in Iraq. The CGE framework then helps us assess the implications of these shocks
on other economic variables in the model. Next, the paper presents details on the elements of the
war scenario and the changes to the macroeconomic closure in order to accommodate labor
mobility across countries in response to refugee movements.
The war in Syria triggered massive displacement of people and outflows of Syrian refugees into
neighboring countries, especially Jordan and Lebanon. In order to implement cross-border
movements of people in the model, we relax the assumption of no international labor mobility
and adjust the population and labor force of both refugee-receiving and refugee-sending
countries, using information from UNHCR Population STATICS and ILOSTAT Database.
16
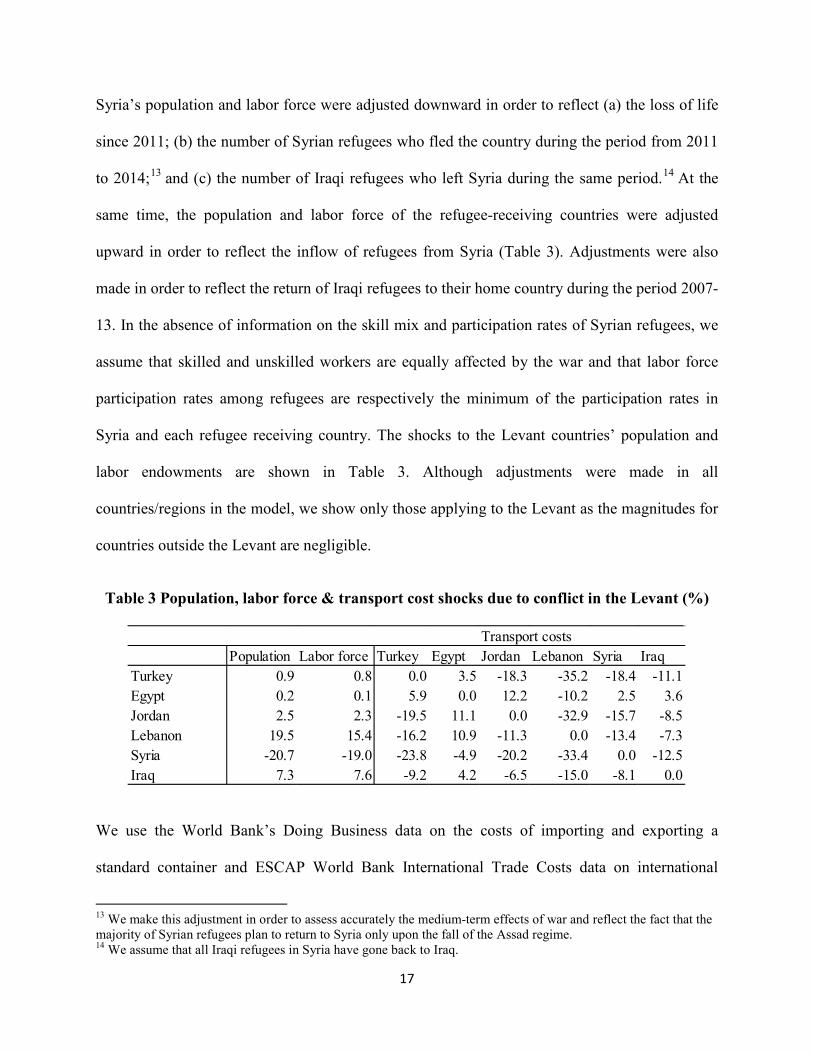
Syria’s population and labor force were adjusted downward in order to reflect (a) the loss of life
since 2011; (b) the number of Syrian refugees who fled the country during the period from 2011
to 2014;13 and (c) the number of Iraqi refugees who left Syria during the same period.14 At the
same time, the population and labor force of the refugee-receiving countries were adjusted
upward in order to reflect the inflow of refugees from Syria (Table 3). Adjustments were also
made in order to reflect the return of Iraqi refugees to their home country during the period 2007-
13. In the absence of information on the skill mix and participation rates of Syrian refugees, we
assume that skilled and unskilled workers are equally affected by the war and that labor force
participation rates among refugees are respectively the minimum of the participation rates in
Syria and each refugee receiving country. The shocks to the Levant countries’ population and
labor endowments are shown in Table 3. Although adjustments were made in all
countries/regions in the model, we show only those applying to the Levant as the magnitudes for
countries outside the Levant are negligible.
Table 3 Population, labor force & transport cost shocks due to conflict in the Levant (%)
We use the World Bank’s Doing Business data on the costs of importing and exporting a
standard container and ESCAP World Bank International Trade Costs data on international
13 We make this adjustment in order to assess accurately the medium-term effects of war and reflect the fact that the majority of Syrian refugees plan to return to Syria only upon the fall of the Assad regime. 14 We assume that all Iraqi refugees in Syria have gone back to Iraq.
Transport costsPopulation Labor force Turkey Egypt Jordan Lebanon Syria Iraq
Turkey 0.9 0.8 0.0 3.5 -18.3 -35.2 -18.4 -11.1Egypt 0.2 0.1 5.9 0.0 12.2 -10.2 2.5 3.6Jordan 2.5 2.3 -19.5 11.1 0.0 -32.9 -15.7 -8.5Lebanon 19.5 15.4 -16.2 10.9 -11.3 0.0 -13.4 -7.3Syria -20.7 -19.0 -23.8 -4.9 -20.2 -33.4 0.0 -12.5Iraq 7.3 7.6 -9.2 4.2 -6.5 -15.0 -8.1 0.0
17
shipping costs to compute the increase in transport costs due to the Levant war. The escalation of
transport costs is represented as deterioration in the efficiency of shipping goods from each of
the six Levant economies. The numbers in Table 3 reflect the fact that during the period between
2007 and 2014 the costs of importing and exporting goods and shipping them across borders
within the Levant increased substantially, except in the case of Egypt.
Oil exports from Syria are assumed to decline dramatically (by 90%) due to a combination of
factors, including sanctions imposed by the EU and the US and loss of infrastructure. We assume
that 20% of Syria’s physical capital has been destroyed - a decline as large as the decline in
Syria’s labor force. In Iraq, we assume the advance of ISIS has led to a 5 % decline in total
productivity. The decline in oil exports from Syria and Iraq is offset by a corresponding increase
in the production of oil by the GCC countries so that the effect on the world oil price is
negligible. This is a realistic assumption because Saudi Arabia has the spare capacity to fully
offset a drop in Iraqi and Syrian oil exports. We also assume that Syria’s nonoil exports are
affected by restrictions on trade between US and Syria and EU and Syria in specific categories,
including equipment and vehicles, chemicals, metals, and capital goods.
4. Simulation results
4.1 Welfare effects
The results suggest that Syria and Iraq bear the brunt of the direct war losses as the conflict drags
down their per capita welfare by 14% and 16%, respectively. Neighboring Levant economies
lose to varying degrees, with per capita welfare declining by almost 11% in Lebanon, less than
18
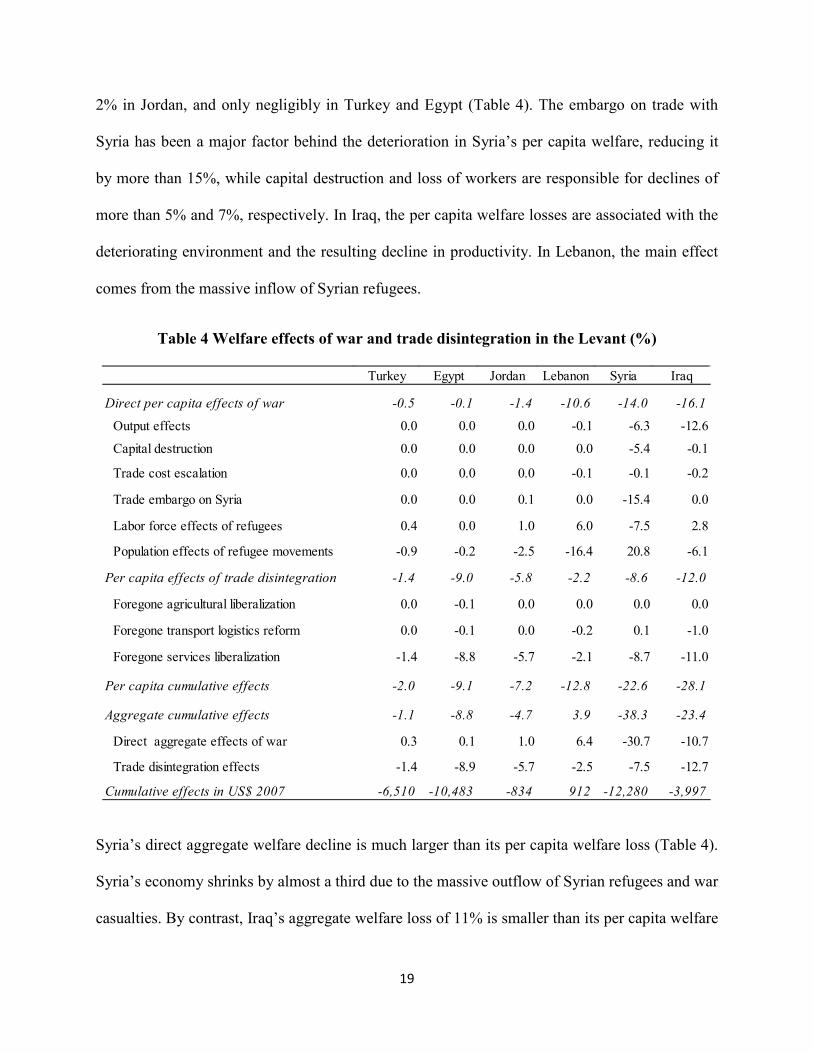
2% in Jordan, and only negligibly in Turkey and Egypt (Table 4). The embargo on trade with
Syria has been a major factor behind the deterioration in Syria’s per capita welfare, reducing it
by more than 15%, while capital destruction and loss of workers are responsible for declines of
more than 5% and 7%, respectively. In Iraq, the per capita welfare losses are associated with the
deteriorating environment and the resulting decline in productivity. In Lebanon, the main effect
comes from the massive inflow of Syrian refugees.
Table 4 Welfare effects of war and trade disintegration in the Levant (%)
Syria’s direct aggregate welfare decline is much larger than its per capita welfare loss (Table 4).
Syria’s economy shrinks by almost a third due to the massive outflow of Syrian refugees and war
casualties. By contrast, Iraq’s aggregate welfare loss of 11% is smaller than its per capita welfare
Turkey Egypt Jordan Lebanon Syria Iraq
Direct per capita effects of war -0.5 -0.1 -1.4 -10.6 -14.0 -16.1
Output effects 0.0 0.0 0.0 -0.1 -6.3 -12.6
Capital destruction 0.0 0.0 0.0 0.0 -5.4 -0.1
Trade cost escalation 0.0 0.0 0.0 -0.1 -0.1 -0.2
Trade embargo on Syria 0.0 0.0 0.1 0.0 -15.4 0.0
Labor force effects of refugees 0.4 0.0 1.0 6.0 -7.5 2.8
Population effects of refugee movements -0.9 -0.2 -2.5 -16.4 20.8 -6.1
Per capita effects of trade disintegration -1.4 -9.0 -5.8 -2.2 -8.6 -12.0
Foregone agricultural liberalization 0.0 -0.1 0.0 0.0 0.0 0.0
Foregone transport logistics reform 0.0 -0.1 0.0 -0.2 0.1 -1.0
Foregone services liberalization -1.4 -8.8 -5.7 -2.1 -8.7 -11.0
Per capita cumulative effects -2.0 -9.1 -7.2 -12.8 -22.6 -28.1
Aggregate cumulative effects -1.1 -8.8 -4.7 3.9 -38.3 -23.4
Direct aggregate effects of war 0.3 0.1 1.0 6.4 -30.7 -10.7
Trade disintegration effects -1.4 -8.9 -5.7 -2.5 -7.5 -12.7
Cumulative effects in US$ 2007 -6,510 -10,483 -834 912 -12,280 -3,997
19
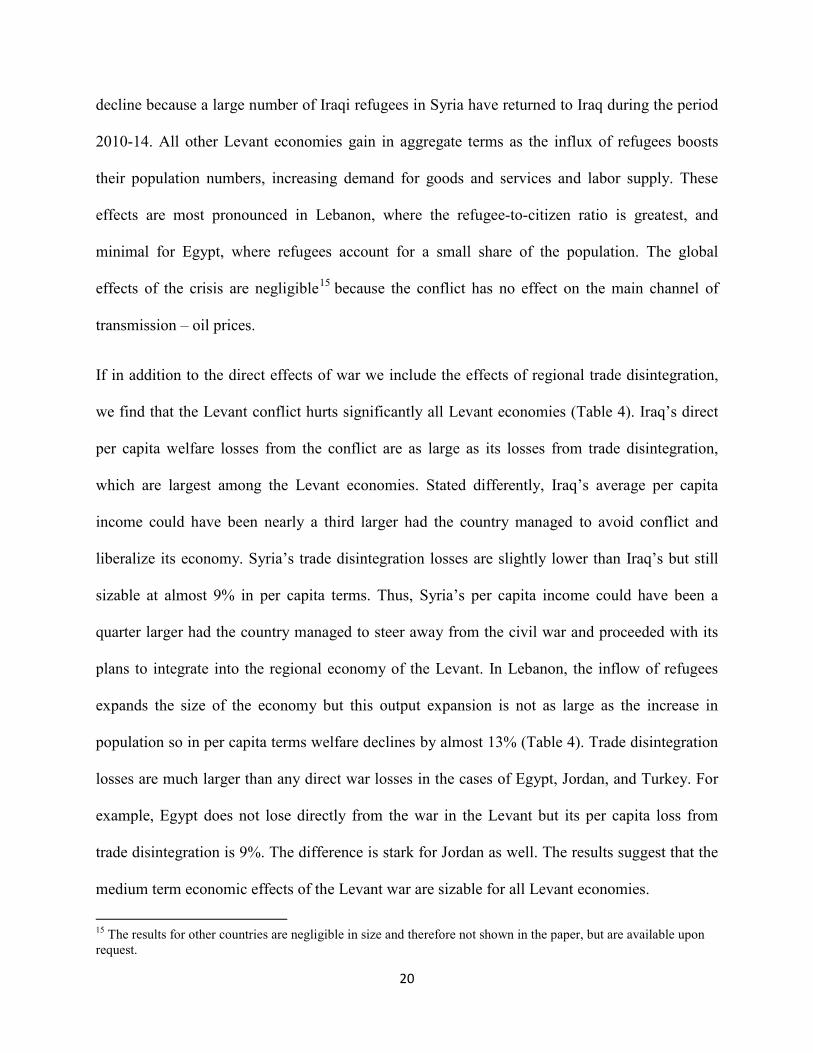
decline because a large number of Iraqi refugees in Syria have returned to Iraq during the period
2010-14. All other Levant economies gain in aggregate terms as the influx of refugees boosts
their population numbers, increasing demand for goods and services and labor supply. These
effects are most pronounced in Lebanon, where the refugee-to-citizen ratio is greatest, and
minimal for Egypt, where refugees account for a small share of the population. The global
effects of the crisis are negligible15 because the conflict has no effect on the main channel of
transmission – oil prices.
If in addition to the direct effects of war we include the effects of regional trade disintegration,
we find that the Levant conflict hurts significantly all Levant economies (Table 4). Iraq’s direct
per capita welfare losses from the conflict are as large as its losses from trade disintegration,
which are largest among the Levant economies. Stated differently, Iraq’s average per capita
income could have been nearly a third larger had the country managed to avoid conflict and
liberalize its economy. Syria’s trade disintegration losses are slightly lower than Iraq’s but still
sizable at almost 9% in per capita terms. Thus, Syria’s per capita income could have been a
quarter larger had the country managed to steer away from the civil war and proceeded with its
plans to integrate into the regional economy of the Levant. In Lebanon, the inflow of refugees
expands the size of the economy but this output expansion is not as large as the increase in
population so in per capita terms welfare declines by almost 13% (Table 4). Trade disintegration
losses are much larger than any direct war losses in the cases of Egypt, Jordan, and Turkey. For
example, Egypt does not lose directly from the war in the Levant but its per capita loss from
trade disintegration is 9%. The difference is stark for Jordan as well. The results suggest that the
medium term economic effects of the Levant war are sizable for all Levant economies.
15 The results for other countries are negligible in size and therefore not shown in the paper, but are available upon request.
20
Consistent with the results in the literature, most of the disintegration losses stem from foregone
services liberalization, whereas those from foregone agricultural liberalization and transport
logistics reform are negligible, although the sectoral effects are sizable for some sectors, as
discussed in the next section, and for landlocked Iraq which loses 1% from foregone transport
logistics reform. The foregone services liberalization generates sizable welfare losses as barrier
to entry hurt productivity and put upward pressure on production costs as well as the costs of
importing services within the Levant. The results, however, differ across countries reflecting the
different extent of productivity loss. As a productivity leader in the Levant, Turkey’s losses are
small and stem mainly from failed liberalization of construction and business services. 16 By
contrast, Iraq’s service sectors are among the most inefficient in the Levant so its welfare loss
from failed services liberalization of 11% is largest. Syria and Egypt also lose to a substantial
degree, reflecting the fact that their service sectors are more protected and less efficient than
those of Jordan and Lebanon.17
4.2 Sectoral effects
The direct sectoral effects of the conflict are negative and sizable across the board only in Syria
and Iraq (Table 5), where the war has led to a productivity decline, and in the case of Syria
considerable capital destruction and loss of labor. In fact, Jordan and Lebanon register sectoral
expansions in response to the refugees’ effect on the demand for goods and services and supply
of labor. The direct sectoral effects of conflict in Turkey and Egypt are negligible. Regional trade
16 According to the STRI data, Lebanon and Jordan have the least restrictive policies in terms of foreign presence in construction and business services in the Levant, respectively. 17 The inflow of refugees has created serious challenges, among which crime, congestion, and a strain on public systems for delivering basic services. This analysis does not factor in these challenges nor provides estimates of the financing needed to address them.
21
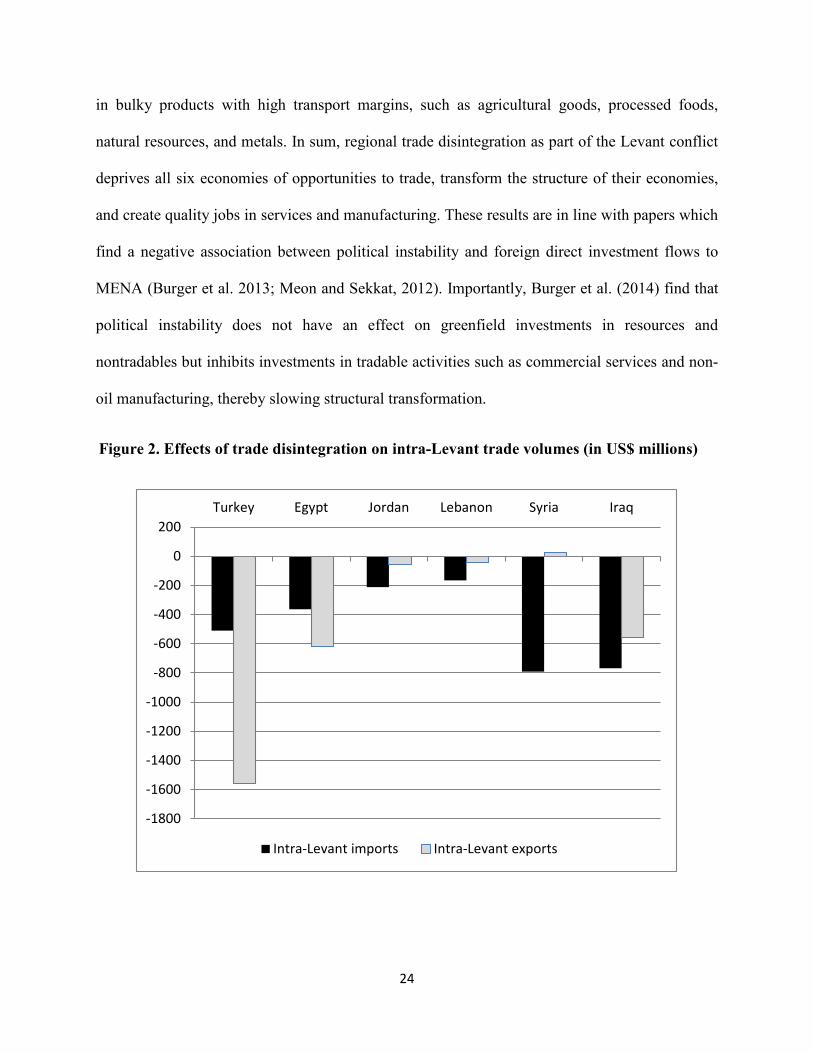
disintegration, however, drags down intra-Levant trade (Figure 2), services productivity as well
as the cost of producing and importing services within the Levant area with negative effects for
output of services in all Levant economies (Table 5). To the extent that services are used as
intermediate inputs into other services, the Levant economies see broad-based contraction of
economic activity. The effects, however, differ by country. Turkey’s economy is relatively
unscathed by the trade disintegration because it already has the most open services sectors in the
Levant (Table 2). It suffers losses mostly because of foregone opening of business services and
construction. Given its size, however, Turkey’s trade losses are largest in dollar terms as it
foregoes nearly US$1.6 billion in exports to Levant countries (Figure 2).
22
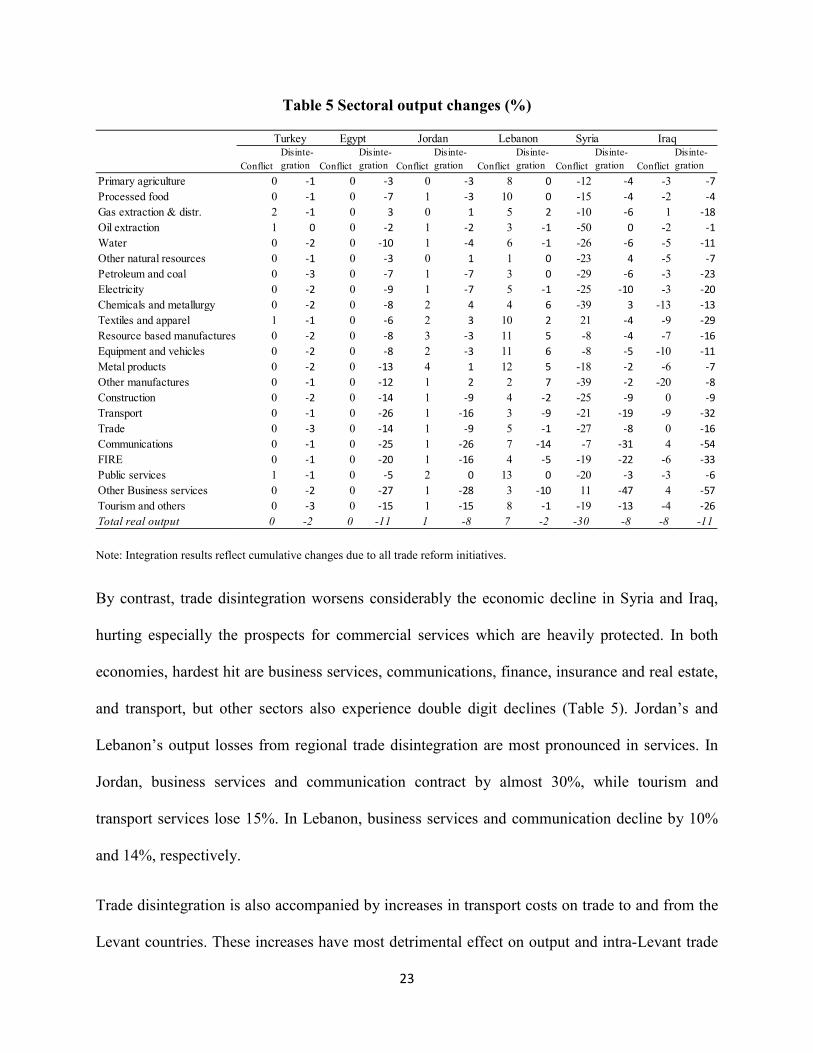
Table 5 Sectoral output changes (%)
Note: Integration results reflect cumulative changes due to all trade reform initiatives.
By contrast, trade disintegration worsens considerably the economic decline in Syria and Iraq,
hurting especially the prospects for commercial services which are heavily protected. In both
economies, hardest hit are business services, communications, finance, insurance and real estate,
and transport, but other sectors also experience double digit declines (Table 5). Jordan’s and
Lebanon’s output losses from regional trade disintegration are most pronounced in services. In
Jordan, business services and communication contract by almost 30%, while tourism and
transport services lose 15%. In Lebanon, business services and communication decline by 10%
and 14%, respectively.
Trade disintegration is also accompanied by increases in transport costs on trade to and from the
Levant countries. These increases have most detrimental effect on output and intra-Levant trade
Turkey Egypt Jordan Lebanon Syria Iraq
Conflict Disinte-gration Conflict
Disinte-gration Conflict
Disinte-gration Conflict
Disinte-gration Conflict
Disinte-gration Conflict
Disinte-gration
Primary agriculture 0 -1 0 -3 0 -3 8 0 -12 -4 -3 -7Processed food 0 -1 0 -7 1 -3 10 0 -15 -4 -2 -4Gas extraction & distr. 2 -1 0 3 0 1 5 2 -10 -6 1 -18Oil extraction 1 0 0 -2 1 -2 3 -1 -50 0 -2 -1Water 0 -2 0 -10 1 -4 6 -1 -26 -6 -5 -11Other natural resources 0 -1 0 -3 0 1 1 0 -23 4 -5 -7Petroleum and coal 0 -3 0 -7 1 -7 3 0 -29 -6 -3 -23Electricity 0 -2 0 -9 1 -7 5 -1 -25 -10 -3 -20Chemicals and metallurgy 0 -2 0 -8 2 4 4 6 -39 3 -13 -13Textiles and apparel 1 -1 0 -6 2 3 10 2 21 -4 -9 -29Resource based manufactures 0 -2 0 -8 3 -3 11 5 -8 -4 -7 -16Equipment and vehicles 0 -2 0 -8 2 -3 11 6 -8 -5 -10 -11Metal products 0 -2 0 -13 4 1 12 5 -18 -2 -6 -7Other manufactures 0 -1 0 -12 1 2 2 7 -39 -2 -20 -8Construction 0 -2 0 -14 1 -9 4 -2 -25 -9 0 -9Transport 0 -1 0 -26 1 -16 3 -9 -21 -19 -9 -32Trade 0 -3 0 -14 1 -9 5 -1 -27 -8 0 -16Communications 0 -1 0 -25 1 -26 7 -14 -7 -31 4 -54FIRE 0 -1 0 -20 1 -16 4 -5 -19 -22 -6 -33Public services 1 -1 0 -5 2 0 13 0 -20 -3 -3 -6Other Business services 0 -2 0 -27 1 -28 3 -10 11 -47 4 -57Tourism and others 0 -3 0 -15 1 -15 8 -1 -19 -13 -4 -26Total real output 0 -2 0 -11 1 -8 7 -2 -30 -8 -8 -11
23
in bulky products with high transport margins, such as agricultural goods, processed foods,
natural resources, and metals. In sum, regional trade disintegration as part of the Levant conflict
deprives all six economies of opportunities to trade, transform the structure of their economies,
and create quality jobs in services and manufacturing. These results are in line with papers which
find a negative association between political instability and foreign direct investment flows to
MENA (Burger et al. 2013; Meon and Sekkat, 2012). Importantly, Burger et al. (2014) find that
political instability does not have an effect on greenfield investments in resources and
nontradables but inhibits investments in tradable activities such as commercial services and non-
oil manufacturing, thereby slowing structural transformation.
Figure 2. Effects of trade disintegration on intra-Levant trade volumes (in US$ millions)
-1800
-1600
-1400
-1200
-1000
-800
-600
-400
-200
0
200Turkey Egypt Jordan Lebanon Syria Iraq
Intra-Levant imports Intra-Levant exports
24
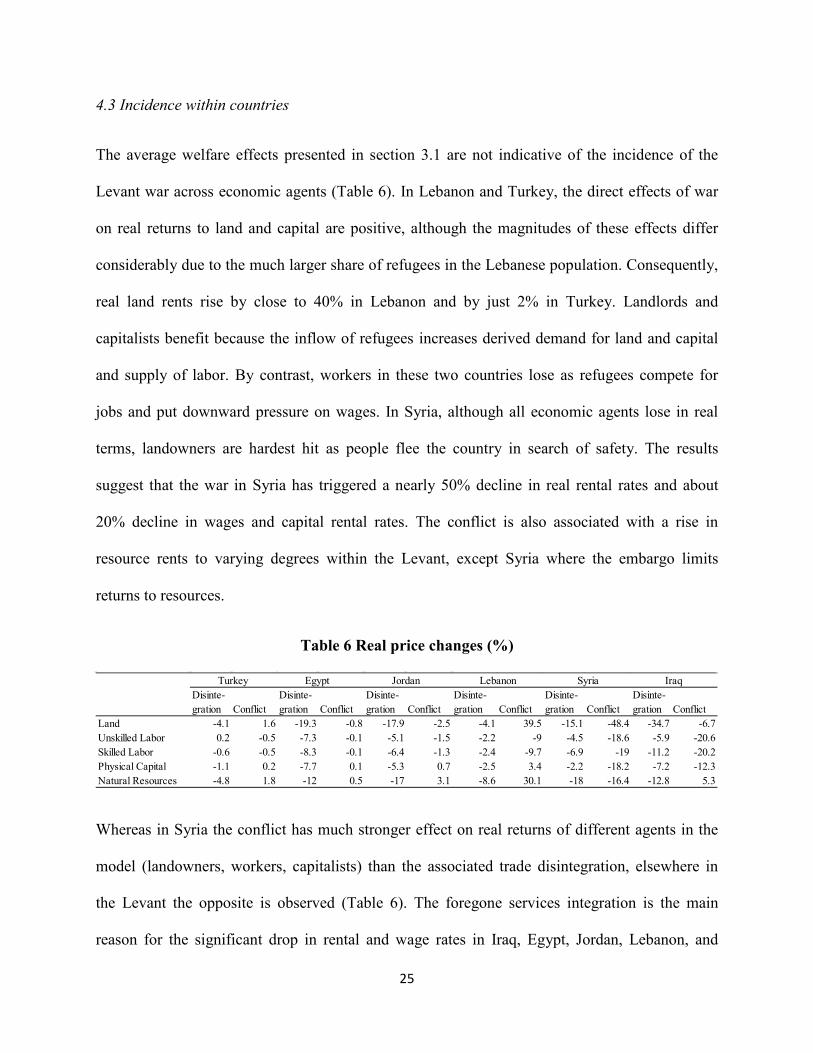
4.3 Incidence within countries
The average welfare effects presented in section 3.1 are not indicative of the incidence of the
Levant war across economic agents (Table 6). In Lebanon and Turkey, the direct effects of war
on real returns to land and capital are positive, although the magnitudes of these effects differ
considerably due to the much larger share of refugees in the Lebanese population. Consequently,
real land rents rise by close to 40% in Lebanon and by just 2% in Turkey. Landlords and
capitalists benefit because the inflow of refugees increases derived demand for land and capital
and supply of labor. By contrast, workers in these two countries lose as refugees compete for
jobs and put downward pressure on wages. In Syria, although all economic agents lose in real
terms, landowners are hardest hit as people flee the country in search of safety. The results
suggest that the war in Syria has triggered a nearly 50% decline in real rental rates and about
20% decline in wages and capital rental rates. The conflict is also associated with a rise in
resource rents to varying degrees within the Levant, except Syria where the embargo limits
returns to resources.
Table 6 Real price changes (%)
Whereas in Syria the conflict has much stronger effect on real returns of different agents in the
model (landowners, workers, capitalists) than the associated trade disintegration, elsewhere in
the Levant the opposite is observed (Table 6). The foregone services integration is the main
reason for the significant drop in rental and wage rates in Iraq, Egypt, Jordan, Lebanon, and
Turkey Egypt Jordan Lebanon Syria IraqDisinte-gration Conflict
Disinte-gration Conflict
Disinte-gration Conflict
Disinte-gration Conflict
Disinte-gration Conflict
Disinte-gration Conflict
Land -4.1 1.6 -19.3 -0.8 -17.9 -2.5 -4.1 39.5 -15.1 -48.4 -34.7 -6.7Unskilled Labor 0.2 -0.5 -7.3 -0.1 -5.1 -1.5 -2.2 -9 -4.5 -18.6 -5.9 -20.6Skilled Labor -0.6 -0.5 -8.3 -0.1 -6.4 -1.3 -2.4 -9.7 -6.9 -19 -11.2 -20.2Physical Capital -1.1 0.2 -7.7 0.1 -5.3 0.7 -2.5 3.4 -2.2 -18.2 -7.2 -12.3Natural Resources -4.8 1.8 -12 0.5 -17 3.1 -8.6 30.1 -18 -16.4 -12.8 5.3
25
Turkey. As barriers to trade in services increase, factor productivity deteriorates leading to
declines in real factor returns, especially land and resource rents.
4.4 Pure general equilibrium effects
The global CGE model used in the paper allows for interaction of markets which could lead to
significant non-linearities and sizable feedback effects in response to equilibrium price changes,
even when underlying preferences and production processes are well behaved. In order to assess
the importance of these effects, we compute the pure GE effects, defined as the difference
between the nonlinear and the linear solutions of the model.18 The size of the pure GE results
reveals to what extent the CGE model enables us to assess more precisely the effects of war and
trade disintegration shocks on different aspects of the Levant economies by capturing the
feedback effects between markets. Large pure GE effects would signal that the feedback effects
due to changes in prices associated with the war shock are substantial and should not be ignored
in such assessments. Furthermore, if the sign of the pure GE effects varies, this would indicate
that the linear approach misstates the effects, sometimes overestimating and other times
underestimating the “true” effects of war. Thus, it would be difficult to determine the direction of
bias.
Table 7 shows the pure GE effects of the Levant war, reflecting both the impact of direct conflict
and trade disintegration. The results in the table suggest that the value added of using the CGE
model grows with the size of the direct shock. The pure GE effects are small in the case of
Turkey because it is least affected by the Levant turmoil and the shock is small relative to the
18 As mentioned earlier, the linear solution is a first-order approximation of the solution with data coefficients kept constant at initial levels.
26
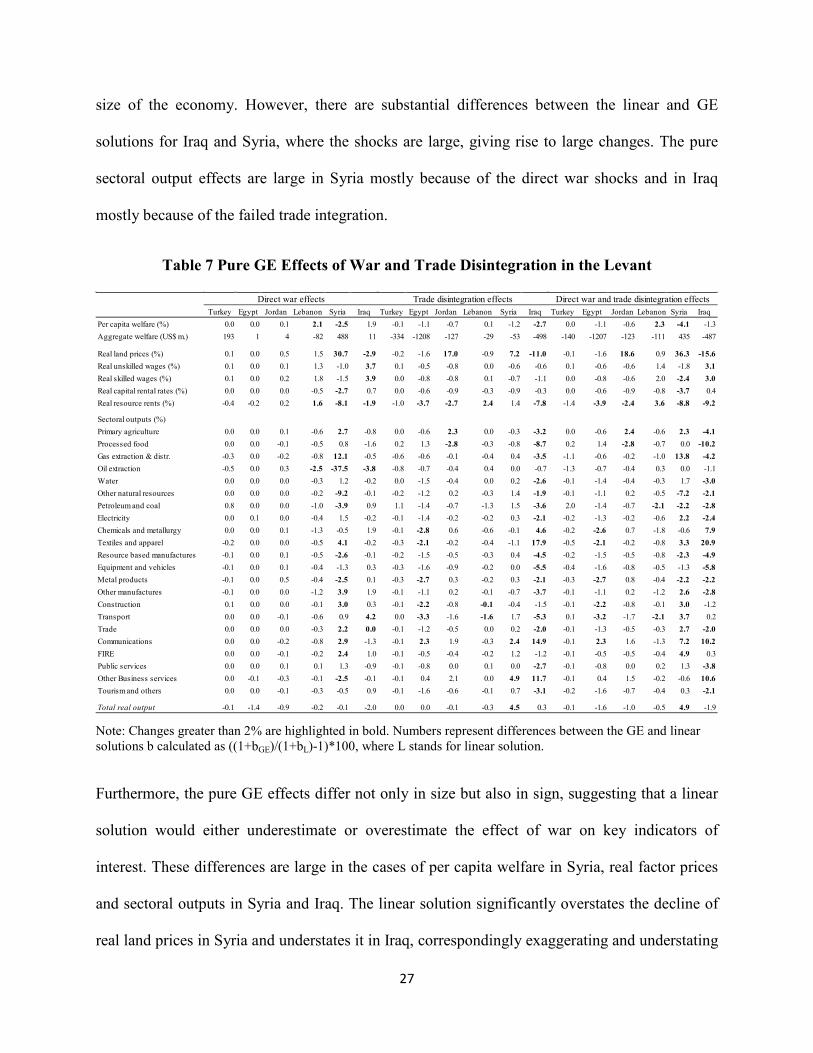
size of the economy. However, there are substantial differences between the linear and GE
solutions for Iraq and Syria, where the shocks are large, giving rise to large changes. The pure
sectoral output effects are large in Syria mostly because of the direct war shocks and in Iraq
mostly because of the failed trade integration.
Table 7 Pure GE Effects of War and Trade Disintegration in the Levant
Note: Changes greater than 2% are highlighted in bold. Numbers represent differences between the GE and linear solutions b calculated as ((1+bGE)/(1+bL)-1)*100, where L stands for linear solution.
Furthermore, the pure GE effects differ not only in size but also in sign, suggesting that a linear
solution would either underestimate or overestimate the effect of war on key indicators of
interest. These differences are large in the cases of per capita welfare in Syria, real factor prices
and sectoral outputs in Syria and Iraq. The linear solution significantly overstates the decline of
real land prices in Syria and understates it in Iraq, correspondingly exaggerating and understating
Turkey Egypt Jordan Lebanon Syria Iraq Turkey Egypt Jordan Lebanon Syria Iraq Turkey Egypt Jordan Lebanon Syria IraqPer capita welfare (%) 0.0 0.0 0.1 2.1 -2.5 1.9 -0.1 -1.1 -0.7 0.1 -1.2 -2.7 0.0 -1.1 -0.6 2.3 -4.1 -1.3Aggregate welfare (US$ m.) 193 1 4 -82 488 11 -334 -1208 -127 -29 -53 -498 -140 -1207 -123 -111 435 -487
Real land prices (%) 0.1 0.0 0.5 1.5 30.7 -2.9 -0.2 -1.6 17.0 -0.9 7.2 -11.0 -0.1 -1.6 18.6 0.9 36.3 -15.6Real unskilled wages (%) 0.1 0.0 0.1 1.3 -1.0 3.7 0.1 -0.5 -0.8 0.0 -0.6 -0.6 0.1 -0.6 -0.6 1.4 -1.8 3.1Real skilled wages (%) 0.1 0.0 0.2 1.8 -1.5 3.9 0.0 -0.8 -0.8 0.1 -0.7 -1.1 0.0 -0.8 -0.6 2.0 -2.4 3.0Real capital rental rates (%) 0.0 0.0 0.0 -0.5 -2.7 0.7 0.0 -0.6 -0.9 -0.3 -0.9 -0.3 0.0 -0.6 -0.9 -0.8 -3.7 0.4Real resource rents (%) -0.4 -0.2 0.2 1.6 -8.1 -1.9 -1.0 -3.7 -2.7 2.4 1.4 -7.8 -1.4 -3.9 -2.4 3.6 -8.8 -9.2
Sectoral outputs (%)Primary agriculture 0.0 0.0 0.1 -0.6 2.7 -0.8 0.0 -0.6 2.3 0.0 -0.3 -3.2 0.0 -0.6 2.4 -0.6 2.3 -4.1Processed food 0.0 0.0 -0.1 -0.5 0.8 -1.6 0.2 1.3 -2.8 -0.3 -0.8 -8.7 0.2 1.4 -2.8 -0.7 0.0 -10.2Gas extraction & distr. -0.3 0.0 -0.2 -0.8 12.1 -0.5 -0.6 -0.6 -0.1 -0.4 0.4 -3.5 -1.1 -0.6 -0.2 -1.0 13.8 -4.2Oil extraction -0.5 0.0 0.3 -2.5 -37.5 -3.8 -0.8 -0.7 -0.4 0.4 0.0 -0.7 -1.3 -0.7 -0.4 0.3 0.0 -1.1Water 0.0 0.0 0.0 -0.3 1.2 -0.2 0.0 -1.5 -0.4 0.0 0.2 -2.6 -0.1 -1.4 -0.4 -0.3 1.7 -3.0Other natural resources 0.0 0.0 0.0 -0.2 -9.2 -0.1 -0.2 -1.2 0.2 -0.3 1.4 -1.9 -0.1 -1.1 0.2 -0.5 -7.2 -2.1Petroleum and coal 0.8 0.0 0.0 -1.0 -3.9 0.9 1.1 -1.4 -0.7 -1.3 1.5 -3.6 2.0 -1.4 -0.7 -2.1 -2.2 -2.8Electricity 0.0 0.1 0.0 -0.4 1.5 -0.2 -0.1 -1.4 -0.2 -0.2 0.3 -2.1 -0.2 -1.3 -0.2 -0.6 2.2 -2.4Chemicals and metallurgy 0.0 0.0 0.1 -1.3 -0.5 1.9 -0.1 -2.8 0.6 -0.6 -0.1 4.6 -0.2 -2.6 0.7 -1.8 -0.6 7.9Textiles and apparel -0.2 0.0 0.0 -0.5 4.1 -0.2 -0.3 -2.1 -0.2 -0.4 -1.1 17.9 -0.5 -2.1 -0.2 -0.8 3.3 20.9Resource based manufactures -0.1 0.0 0.1 -0.5 -2.6 -0.1 -0.2 -1.5 -0.5 -0.3 0.4 -4.5 -0.2 -1.5 -0.5 -0.8 -2.3 -4.9Equipment and vehicles -0.1 0.0 0.1 -0.4 -1.3 0.3 -0.3 -1.6 -0.9 -0.2 0.0 -5.5 -0.4 -1.6 -0.8 -0.5 -1.3 -5.8Metal products -0.1 0.0 0.5 -0.4 -2.5 0.1 -0.3 -2.7 0.3 -0.2 0.3 -2.1 -0.3 -2.7 0.8 -0.4 -2.2 -2.2Other manufactures -0.1 0.0 0.0 -1.2 3.9 1.9 -0.1 -1.1 0.2 -0.1 -0.7 -3.7 -0.1 -1.1 0.2 -1.2 2.6 -2.8Construction 0.1 0.0 0.0 -0.1 3.0 0.3 -0.1 -2.2 -0.8 -0.1 -0.4 -1.5 -0.1 -2.2 -0.8 -0.1 3.0 -1.2Transport 0.0 0.0 -0.1 -0.6 0.9 4.2 0.0 -3.3 -1.6 -1.6 1.7 -5.3 0.1 -3.2 -1.7 -2.1 3.7 0.2Trade 0.0 0.0 0.0 -0.3 2.2 0.0 -0.1 -1.2 -0.5 0.0 0.2 -2.0 -0.1 -1.3 -0.5 -0.3 2.7 -2.0Communications 0.0 0.0 -0.2 -0.8 2.9 -1.3 -0.1 2.3 1.9 -0.3 2.4 14.9 -0.1 2.3 1.6 -1.3 7.2 10.2FIRE 0.0 0.0 -0.1 -0.2 2.4 1.0 -0.1 -0.5 -0.4 -0.2 1.2 -1.2 -0.1 -0.5 -0.5 -0.4 4.9 0.3Public services 0.0 0.0 0.1 0.1 1.3 -0.9 -0.1 -0.8 0.0 0.1 0.0 -2.7 -0.1 -0.8 0.0 0.2 1.3 -3.8Other Business services 0.0 -0.1 -0.3 -0.1 -2.5 -0.1 -0.1 0.4 2.1 0.0 4.9 11.7 -0.1 0.4 1.5 -0.2 -0.6 10.6Tourism and others 0.0 0.0 -0.1 -0.3 -0.5 0.9 -0.1 -1.6 -0.6 -0.1 0.7 -3.1 -0.2 -1.6 -0.7 -0.4 0.3 -2.1
Total real output -0.1 -1.4 -0.9 -0.2 -0.1 -2.0 0.0 0.0 -0.1 -0.3 4.5 0.3 -0.1 -1.6 -1.0 -0.5 4.9 -1.9
Direct war effects Trade disintegration effects Direct war and trade disintegration effects
27
the expansion of sectors intensive in land use. In the case of Iraq, the linear solution overstates
the decline in wages and therefore understates the decline in labor intensive sectors. In the cases
of Jordan, Lebanon, and Egypt, the deviations between the results from the linear and GE
solutions are mostly small (below 2%).
5. Summary and conclusions
The paper quantifies the economic effects of the Levant conflict using a global computable
general equilibrium model with new details on the Levant economies. The analysis factors in
both the direct economic effects of the Syrian war and the advance of ISIS and its opportunity
costs due to foregone deep trade integration initiatives in the region. Unlike less formal
approaches, the CGE framework ensures consistency, includes important sectoral detail, and
captures second-order feedback effects, which are most significant for Syria and Iraq. In
addition, the paper develops a modified version of the GTAP database with economic and trade
detail pertinent to the Levant economies and accurately reflecting trade preferences on the eve of
the Syria war.
The analysis suggests that Syria and Iraq bear the brunt of the direct war costs, losing 14% and
16% in per capita welfare, respectively. All other Levant economies lose in per capita terms, but
not in aggregate terms because the inflows of refugees boost population numbers, and therefore
consumption, investment, and labor supply. Lebanon’s per capita welfare losses reach close to
11%, while those of Turkey, Egypt, and Jordan do not surpass 1.5%. The difference between
aggregate and per capita welfare effects have been most pronounced in Lebanon, where the
28
increase in the refugee-to-citizen ratio is greatest, and minimal for Turkey and Egypt, where
refugees have remained a small share of the population.
The direct effects of the Levant war are an understatement of the real economic costs of
disintegration in the Levant. If the costs of foregone regional trade integration are included then
the total costs of war for Syria and Iraq almost double, reaching 23% and 28%, respectively, and
escalate to 10% for Egypt and 9% for Jordan. The failed services liberalization is a major source
of trade-related losses. Furthermore, the average welfare effects are not indicative of the
incidence within countries. In Syria, all economic agents are hurt but landowners lose the most
as derived demand for land declines dramatically reflecting the outflow of refugees. By contrast,
in Lebanon and Turkey land and capital owners benefit while workers lose because the inflows
of refugees put pressure on demand for goods and services and depress wages by augmenting
labor supply. Finally, the pure GE effects of war and foregone liberalization differ in sign and
size and are large for Syria and Iraq, which experience the largest shocks. The results validate the
value added of using a CGE framework as part of this assessment and suggest that conventional,
linear approaches would misstate the “true” effects of war, making it difficult to determine the
direction of bias, especially for those most affected by the shock.
Some caveats are important. The simulation results are indicative of the qualitative changes
likely to occur as a result of conflict and the absence of deep trade integration in the region. The
magnitude of the shocks reflects events as of mid-2014 and the magnitude of the effects will
change depending on the course of the war. In this assessment, we assume that ISIS has not
captured the main oil extractive facilities in Southern Iraq. If this were to happen, Iraq’s welfare,
output, and export losses would be much larger in magnitude than those portrayed here. It is
important to note that the analysis does not factor in several types of costs. We have not assessed
29
the fiscal costs of delivering basic services to refugees in receiving countries; these costs could
be substantial for Jordan, Lebanon, and Turkey. The costs of replenishing depleted human and
physical capital in Syria would also be sizable. We ignore important investment-growth links
that may amplify the effects discussed here.
30
References
Al-Atrash, H. and Yousef, T. (2000) “Intra-Arab Trade: Is it Too Little?” IMF Working Paper No. 00/10, Washington DC.
Augier, P., Cadot, O., Gourdon, J. and Malouche, M. (2012) “Non-tariff Measures in the MNA Region: Improving Governance for Competitiveness,” MENA Region World Paper No. 56, World Bank, Middle East and North Africa, Washington DC, (http://siteresources.worldbank.org/ INTMENA/ Resources/WP56.pdf)
Anderson, K., Martin, W., and van der Mensbrugghe, D. (2006) “Would Multilateral Trade Reform Benefit Sub-Saharan Africans?” Journal of African Economies 15(4): 626-70.
Balistreri, E., Tarr, D., and Yonezawa, H. (2014) “Reducing Trade Costs in East Africa: Deep Regional Integration and Multilateral Action,” paper presented at the 17th Annual Conference on Global Economic Analysis, Dakar, Senegal.
Bchir, M. Hammouda, H., Oulmane, N., and Jallab, M. (2006) “The Cost of non-Maghreb: Achieving the Gains from Economic Integration.” Africa Trade Policy Center, Work in Progress No. 44, Economic Commission for Africa.
Burger, M., Ianchovichina, E. and Rijkers, B. (2013) “Risky Business: Political Instability and Greenfield Foreign Direct Investment in the Arab World,” World Bank Policy Research Working Paper No. 6716, Washington DC.
Collier, P. (1999) “On the Economic Consequences of Civil War,” Oxford Economic Papers 51: 168-83.
De Melo, J. and Winters, A. (1993) “Do Exporters Gain from VERs?” European Economic Review 37(7): 289-308.
Doytch, N. and Uctum, M. (2011) “Does the Worldwide Shift of FDI from Manufacturing to Services Accelerate Economic Growth? A GMM Estimation Study,” Journal of International Money and Finance 30: 410-27.
Freund, C. and Portugal-Perez, A. (2012) “Assessing MENA’s Trade Agreements,” MENA Region World Paper No. 55, World Bank, Middle East and North Africa, Washington DC, (http://siteresources.worldbank.org/INTMENA/Resources/WP56WEB.pdf).
Grobar, L. and Gnanselvam, S. (1993) “The Economic Effects of the Sri Lankan Civil War,” Economic Development and Cultural Change 41(2): 395-405.
Hertel, T. ed. (1997) Global Trade Analysis: Modeling and Applications. Cambridge, UK: Cambridge University Press.
31
Haskel, J., Pereira, S., and Slaughter, M. (2007) “Does Inward Foreign Direct Investment Boost the Productivity of Domestic Firms?” The Review of Economics and Statistics 89(3): 482-496.
Hoekman, B. and Sekkat, K. (2010) “Arab Economic Integration: Missing Links” CEPR Discussiong Paper No. 7807, Centre for Economic Policy Research, London. (www.cepr.org/pubs/dps/DP7807.asp)
Hoekman, B. and Messerlin, P. (2001) Harnessing Trade for Development in the Middle East and North Africa, New York: Council on Foreign Relations.
Hoekman, B. and Zarrouk, J. (2000) Catching Up with the Competition: Trade Opportunities and Challenges for Arab Countries, Ann Arbor: University of Michigan Press.
Ianchovichina, E. and Martin, W. (2004) “Impacts of China’s Accession to the World Trade Organization,” World Bank Economic Review 18(1): 3-27.
Konan, D. (2003) “Alternative Paths to Prosperity: Economic Integration among Arab Countries,” in Galal and Hoekman (eds.) Arab Economic Integration between Hope and Reality. Washington DC: Brookings Institution.
Markusen, J., Rutherford, T., and Tarr, D. (2005) “Trade and Direct Investment in Producer Services and the Domestic Market for Expertise,” Canadian Journal of Economics 38(3): 758-777.
Meon, P. and Sekkat, K. (2012) “FDI Waves, Waves of Neglect of Political Risk,” World Development 40: 2194-205.
Okuyama, Y. (2007) “Economic Modeling for Disaster Impact Analysis: Past, Present, and Future.” Economic Systems Research 19(2): 115-24.
Rose, A. (2004) “Economic Principles, Issues, and Research Priorities in Hazard Loss Estimation,” in: Okuyama, Y. and Chang, S. (Eds.) Modeling Spatial and Economic Impacts of Disasters, New York: Springer.
Rose, A. and Liao, S.Y. (2005) “Modeling Regional Economic Resilience to Disasters: A Computable General Equilibrium Analysis of Water Service Disruptions,” Journal of Regional Science 45: 75-112.
Rose, A., Benavides, J., Chang, S.E., Szczesniak, P., and Lim, D. (1997) “The Regional Economic Impact of an Earthquake: Direct and Indirect Effects of Electricity Lifeline Disruptions,” Journal of Regional Science 37: 437-458.
Rosotto, C., Sekkat, K., and Varoudakis, A. (2005) “Opening Up Telecommunications to Competition and MENA Integration in the World Economy,” Journal of International Development 17.
32
Tarr, D. and Rutherford, T. (2010) “Modeling Services Liberalization: The Case of Tanzania,” Journal of Economic Integration 25: 644-675
Testas, A. (1998) “The Significance of Trade Integration among Developing Countries: A Comparison between ASEAN and AMU,” Journal of Economic Development 23(1): 117-30.
Testas, A. (2002) “The Advantage of an Intra-Maghreb Free Trade Area: Quantitative Estimates of the Static and Dynamic Output and Welfare Effects,” Journal of North African Studies 7(1): 99-108.
Trela, I. and Whalley, J. (1990) “Global Effects of Developed Country Trade Restrictions on Textiles and Apparel,” Economic Journal 100(403): 1190-205.
Walmsley, T., Hertel, T. and Ianchovichina, E. (2006) “Assessing the Impact of China’s WTO Accession on Investment,” Pacific Economic Review 11(3): 315-39.
World Bank (2013) Over the Horizon: A New Levant, World Bank, Washington DC.
Yang, Y., Martin, W. and Yanagishima, K. (1997) “Evaluating the Benefits of Abolishing the MFA in the Uruguay Round Package” in Hertel (Ed.) Global Trade Analysis: Modeling and Applications. New York: Cambridge University Press.
Zarrouk, J. (2003) “A Survey of Barriers to Trade and Investment in Arab Countries,” in Galal and Hoekman (eds) Arab Economic Integration between Hope and Reality. Washington DC: Brookings Institution.
33
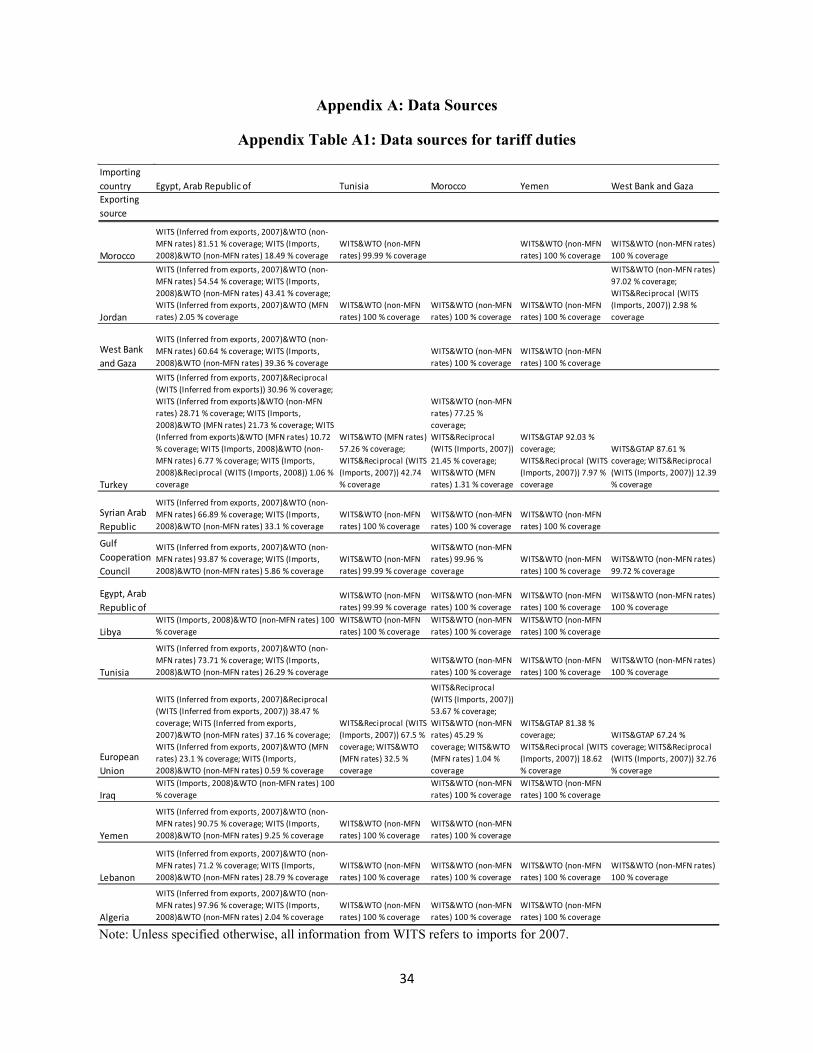
Appendix A: Data Sources
Appendix Table A1: Data sources for tariff duties
Note: Unless specified otherwise, all information from WITS refers to imports for 2007.
Importing country Egypt, Arab Republic of Tunisia Morocco Yemen West Bank and GazaExporting source
Morocco
WITS (Inferred from exports, 2007)&WTO (non-MFN rates) 81.51 % coverage; WITS (Imports, 2008)&WTO (non-MFN rates) 18.49 % coverage
WITS&WTO (non-MFN rates) 99.99 % coverage
WITS&WTO (non-MFN rates) 100 % coverage
WITS&WTO (non-MFN rates) 100 % coverage
Jordan
WITS (Inferred from exports, 2007)&WTO (non-MFN rates) 54.54 % coverage; WITS (Imports, 2008)&WTO (non-MFN rates) 43.41 % coverage; WITS (Inferred from exports, 2007)&WTO (MFN rates) 2.05 % coverage
WITS&WTO (non-MFN rates) 100 % coverage
WITS&WTO (non-MFN rates) 100 % coverage
WITS&WTO (non-MFN rates) 100 % coverage
WITS&WTO (non-MFN rates) 97.02 % coverage; WITS&Reciprocal (WITS (Imports, 2007)) 2.98 % coverage
West Bank and Gaza
WITS (Inferred from exports, 2007)&WTO (non-MFN rates) 60.64 % coverage; WITS (Imports, 2008)&WTO (non-MFN rates) 39.36 % coverage
WITS&WTO (non-MFN rates) 100 % coverage
WITS&WTO (non-MFN rates) 100 % coverage
Turkey
WITS (Inferred from exports, 2007)&Reciprocal (WITS (Inferred from exports)) 30.96 % coverage; WITS (Inferred from exports)&WTO (non-MFN rates) 28.71 % coverage; WITS (Imports, 2008)&WTO (MFN rates) 21.73 % coverage; WITS (Inferred from exports)&WTO (MFN rates) 10.72 % coverage; WITS (Imports, 2008)&WTO (non-MFN rates) 6.77 % coverage; WITS (Imports, 2008)&Reciprocal (WITS (Imports, 2008)) 1.06 % coverage
WITS&WTO (MFN rates) 57.26 % coverage; WITS&Reciprocal (WITS (Imports, 2007)) 42.74 % coverage
WITS&WTO (non-MFN rates) 77.25 % coverage; WITS&Reciprocal (WITS (Imports, 2007)) 21.45 % coverage; WITS&WTO (MFN rates) 1.31 % coverage
WITS>AP 92.03 % coverage; WITS&Reciprocal (WITS (Imports, 2007)) 7.97 % coverage
WITS>AP 87.61 % coverage; WITS&Reciprocal (WITS (Imports, 2007)) 12.39 % coverage
Syrian Arab Republic
WITS (Inferred from exports, 2007)&WTO (non-MFN rates) 66.89 % coverage; WITS (Imports, 2008)&WTO (non-MFN rates) 33.1 % coverage
WITS&WTO (non-MFN rates) 100 % coverage
WITS&WTO (non-MFN rates) 100 % coverage
WITS&WTO (non-MFN rates) 100 % coverage
Gulf Cooperation Council
WITS (Inferred from exports, 2007)&WTO (non-MFN rates) 93.87 % coverage; WITS (Imports, 2008)&WTO (non-MFN rates) 5.86 % coverage
WITS&WTO (non-MFN rates) 99.99 % coverage
WITS&WTO (non-MFN rates) 99.96 % coverage
WITS&WTO (non-MFN rates) 100 % coverage
WITS&WTO (non-MFN rates) 99.72 % coverage
Egypt, Arab Republic of
WITS&WTO (non-MFN rates) 99.99 % coverage
WITS&WTO (non-MFN rates) 100 % coverage
WITS&WTO (non-MFN rates) 100 % coverage
WITS&WTO (non-MFN rates) 100 % coverage
LibyaWITS (Imports, 2008)&WTO (non-MFN rates) 100 % coverage
WITS&WTO (non-MFN rates) 100 % coverage
WITS&WTO (non-MFN rates) 100 % coverage
WITS&WTO (non-MFN rates) 100 % coverage
Tunisia
WITS (Inferred from exports, 2007)&WTO (non-MFN rates) 73.71 % coverage; WITS (Imports, 2008)&WTO (non-MFN rates) 26.29 % coverage
WITS&WTO (non-MFN rates) 100 % coverage
WITS&WTO (non-MFN rates) 100 % coverage
WITS&WTO (non-MFN rates) 100 % coverage
European Union
WITS (Inferred from exports, 2007)&Reciprocal (WITS (Inferred from exports, 2007)) 38.47 % coverage; WITS (Inferred from exports, 2007)&WTO (non-MFN rates) 37.16 % coverage; WITS (Inferred from exports, 2007)&WTO (MFN rates) 23.1 % coverage; WITS (Imports, 2008)&WTO (non-MFN rates) 0.59 % coverage
WITS&Reciprocal (WITS (Imports, 2007)) 67.5 % coverage; WITS&WTO (MFN rates) 32.5 % coverage
WITS&Reciprocal (WITS (Imports, 2007)) 53.67 % coverage; WITS&WTO (non-MFN rates) 45.29 % coverage; WITS&WTO (MFN rates) 1.04 % coverage
WITS>AP 81.38 % coverage; WITS&Reciprocal (WITS (Imports, 2007)) 18.62 % coverage
WITS>AP 67.24 % coverage; WITS&Reciprocal (WITS (Imports, 2007)) 32.76 % coverage
IraqWITS (Imports, 2008)&WTO (non-MFN rates) 100 % coverage
WITS&WTO (non-MFN rates) 100 % coverage
WITS&WTO (non-MFN rates) 100 % coverage
Yemen
WITS (Inferred from exports, 2007)&WTO (non-MFN rates) 90.75 % coverage; WITS (Imports, 2008)&WTO (non-MFN rates) 9.25 % coverage
WITS&WTO (non-MFN rates) 100 % coverage
WITS&WTO (non-MFN rates) 100 % coverage
Lebanon
WITS (Inferred from exports, 2007)&WTO (non-MFN rates) 71.2 % coverage; WITS (Imports, 2008)&WTO (non-MFN rates) 28.79 % coverage
WITS&WTO (non-MFN rates) 100 % coverage
WITS&WTO (non-MFN rates) 100 % coverage
WITS&WTO (non-MFN rates) 100 % coverage
WITS&WTO (non-MFN rates) 100 % coverage
Algeria
WITS (Inferred from exports, 2007)&WTO (non-MFN rates) 97.96 % coverage; WITS (Imports, 2008)&WTO (non-MFN rates) 2.04 % coverage
WITS&WTO (non-MFN rates) 100 % coverage
WITS&WTO (non-MFN rates) 100 % coverage
WITS&WTO (non-MFN rates) 100 % coverage
34
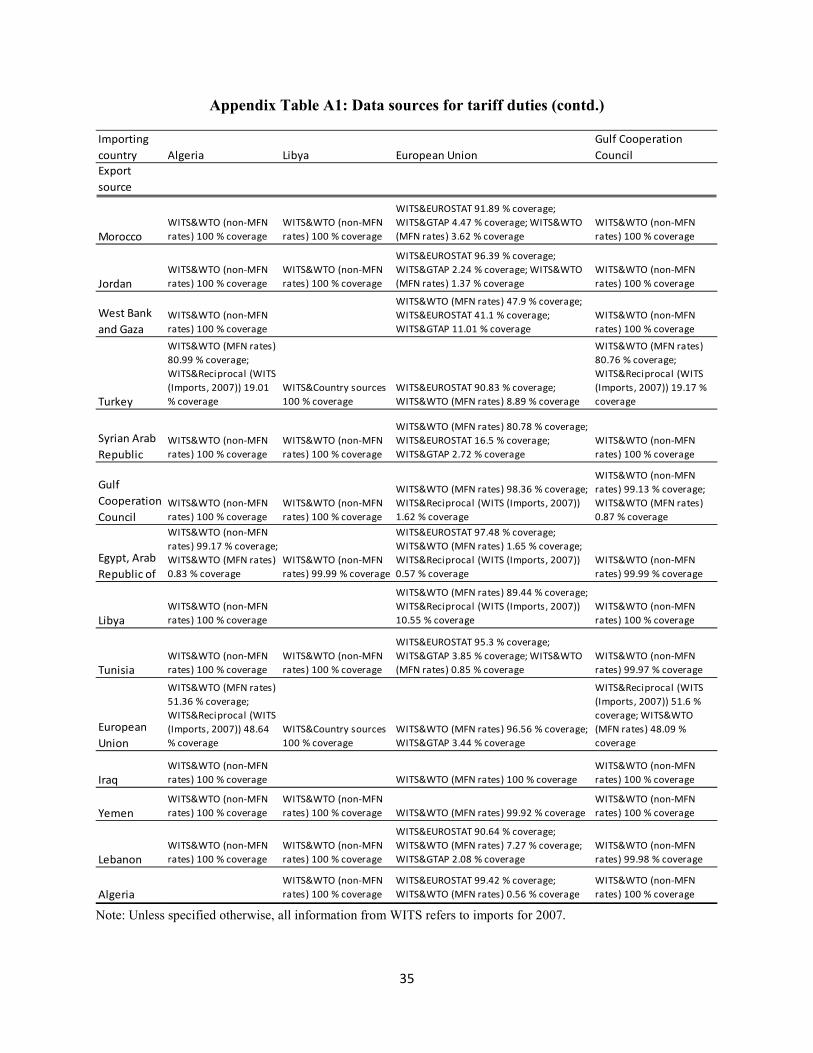
Appendix Table A1: Data sources for tariff duties (contd.)
Note: Unless specified otherwise, all information from WITS refers to imports for 2007.
Importing country Algeria Libya European Union
Gulf Cooperation Council
Export source
MoroccoWITS&WTO (non-MFN rates) 100 % coverage
WITS&WTO (non-MFN rates) 100 % coverage
WITS&EUROSTAT 91.89 % coverage; WITS>AP 4.47 % coverage; WITS&WTO (MFN rates) 3.62 % coverage
WITS&WTO (non-MFN rates) 100 % coverage
JordanWITS&WTO (non-MFN rates) 100 % coverage
WITS&WTO (non-MFN rates) 100 % coverage
WITS&EUROSTAT 96.39 % coverage; WITS>AP 2.24 % coverage; WITS&WTO (MFN rates) 1.37 % coverage
WITS&WTO (non-MFN rates) 100 % coverage
West Bank and Gaza
WITS&WTO (non-MFN rates) 100 % coverage
WITS&WTO (MFN rates) 47.9 % coverage; WITS&EUROSTAT 41.1 % coverage; WITS>AP 11.01 % coverage
WITS&WTO (non-MFN rates) 100 % coverage
Turkey
WITS&WTO (MFN rates) 80.99 % coverage; WITS&Reciprocal (WITS (Imports, 2007)) 19.01 % coverage
WITS&Country sources 100 % coverage
WITS&EUROSTAT 90.83 % coverage; WITS&WTO (MFN rates) 8.89 % coverage
WITS&WTO (MFN rates) 80.76 % coverage; WITS&Reciprocal (WITS (Imports, 2007)) 19.17 % coverage
Syrian Arab Republic
WITS&WTO (non-MFN rates) 100 % coverage
WITS&WTO (non-MFN rates) 100 % coverage
WITS&WTO (MFN rates) 80.78 % coverage; WITS&EUROSTAT 16.5 % coverage; WITS>AP 2.72 % coverage
WITS&WTO (non-MFN rates) 100 % coverage
Gulf Cooperation Council
WITS&WTO (non-MFN rates) 100 % coverage
WITS&WTO (non-MFN rates) 100 % coverage
WITS&WTO (MFN rates) 98.36 % coverage; WITS&Reciprocal (WITS (Imports, 2007)) 1.62 % coverage
WITS&WTO (non-MFN rates) 99.13 % coverage; WITS&WTO (MFN rates) 0.87 % coverage
Egypt, Arab Republic of
WITS&WTO (non-MFN rates) 99.17 % coverage; WITS&WTO (MFN rates) 0.83 % coverage
WITS&WTO (non-MFN rates) 99.99 % coverage
WITS&EUROSTAT 97.48 % coverage; WITS&WTO (MFN rates) 1.65 % coverage; WITS&Reciprocal (WITS (Imports, 2007)) 0.57 % coverage
WITS&WTO (non-MFN rates) 99.99 % coverage
LibyaWITS&WTO (non-MFN rates) 100 % coverage
WITS&WTO (MFN rates) 89.44 % coverage; WITS&Reciprocal (WITS (Imports, 2007)) 10.55 % coverage
WITS&WTO (non-MFN rates) 100 % coverage
TunisiaWITS&WTO (non-MFN rates) 100 % coverage
WITS&WTO (non-MFN rates) 100 % coverage
WITS&EUROSTAT 95.3 % coverage; WITS>AP 3.85 % coverage; WITS&WTO (MFN rates) 0.85 % coverage
WITS&WTO (non-MFN rates) 99.97 % coverage
European Union
WITS&WTO (MFN rates) 51.36 % coverage; WITS&Reciprocal (WITS (Imports, 2007)) 48.64 % coverage
WITS&Country sources 100 % coverage
WITS&WTO (MFN rates) 96.56 % coverage; WITS>AP 3.44 % coverage
WITS&Reciprocal (WITS (Imports, 2007)) 51.6 % coverage; WITS&WTO (MFN rates) 48.09 % coverage
IraqWITS&WTO (non-MFN rates) 100 % coverage WITS&WTO (MFN rates) 100 % coverage
WITS&WTO (non-MFN rates) 100 % coverage
YemenWITS&WTO (non-MFN rates) 100 % coverage
WITS&WTO (non-MFN rates) 100 % coverage WITS&WTO (MFN rates) 99.92 % coverage
WITS&WTO (non-MFN rates) 100 % coverage
LebanonWITS&WTO (non-MFN rates) 100 % coverage
WITS&WTO (non-MFN rates) 100 % coverage
WITS&EUROSTAT 90.64 % coverage; WITS&WTO (MFN rates) 7.27 % coverage; WITS>AP 2.08 % coverage
WITS&WTO (non-MFN rates) 99.98 % coverage
AlgeriaWITS&WTO (non-MFN rates) 100 % coverage
WITS&EUROSTAT 99.42 % coverage; WITS&WTO (MFN rates) 0.56 % coverage
WITS&WTO (non-MFN rates) 100 % coverage
35
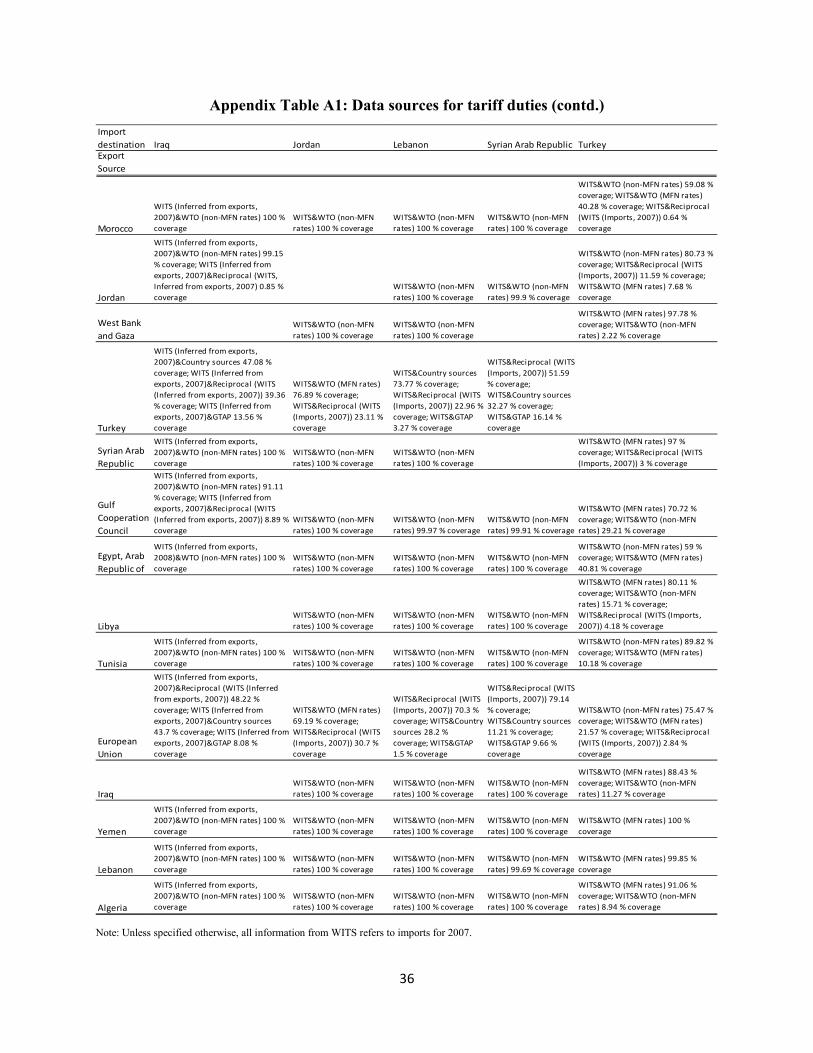
Appendix Table A1: Data sources for tariff duties (contd.)
Note: Unless specified otherwise, all information from WITS refers to imports for 2007.
Import destination Iraq Jordan Lebanon Syrian Arab Republic TurkeyExport Source
Morocco
WITS (Inferred from exports, 2007)&WTO (non-MFN rates) 100 % coverage
WITS&WTO (non-MFN rates) 100 % coverage
WITS&WTO (non-MFN rates) 100 % coverage
WITS&WTO (non-MFN rates) 100 % coverage
WITS&WTO (non-MFN rates) 59.08 % coverage; WITS&WTO (MFN rates) 40.28 % coverage; WITS&Reciprocal (WITS (Imports, 2007)) 0.64 % coverage
Jordan
WITS (Inferred from exports, 2007)&WTO (non-MFN rates) 99.15 % coverage; WITS (Inferred from exports, 2007)&Reciprocal (WITS, Inferred from exports, 2007) 0.85 % coverage
WITS&WTO (non-MFN rates) 100 % coverage
WITS&WTO (non-MFN rates) 99.9 % coverage
WITS&WTO (non-MFN rates) 80.73 % coverage; WITS&Reciprocal (WITS (Imports, 2007)) 11.59 % coverage; WITS&WTO (MFN rates) 7.68 % coverage
West Bank and Gaza
WITS&WTO (non-MFN rates) 100 % coverage
WITS&WTO (non-MFN rates) 100 % coverage
WITS&WTO (MFN rates) 97.78 % coverage; WITS&WTO (non-MFN rates) 2.22 % coverage
Turkey
WITS (Inferred from exports, 2007)&Country sources 47.08 % coverage; WITS (Inferred from exports, 2007)&Reciprocal (WITS (Inferred from exports, 2007)) 39.36 % coverage; WITS (Inferred from exports, 2007)>AP 13.56 % coverage
WITS&WTO (MFN rates) 76.89 % coverage; WITS&Reciprocal (WITS (Imports, 2007)) 23.11 % coverage
WITS&Country sources 73.77 % coverage; WITS&Reciprocal (WITS (Imports, 2007)) 22.96 % coverage; WITS>AP 3.27 % coverage
WITS&Reciprocal (WITS (Imports, 2007)) 51.59 % coverage; WITS&Country sources 32.27 % coverage; WITS>AP 16.14 % coverage
Syrian Arab Republic
WITS (Inferred from exports, 2007)&WTO (non-MFN rates) 100 % coverage
WITS&WTO (non-MFN rates) 100 % coverage
WITS&WTO (non-MFN rates) 100 % coverage
WITS&WTO (MFN rates) 97 % coverage; WITS&Reciprocal (WITS (Imports, 2007)) 3 % coverage
Gulf Cooperation Council
WITS (Inferred from exports, 2007)&WTO (non-MFN rates) 91.11 % coverage; WITS (Inferred from exports, 2007)&Reciprocal (WITS (Inferred from exports, 2007)) 8.89 % coverage
WITS&WTO (non-MFN rates) 100 % coverage
WITS&WTO (non-MFN rates) 99.97 % coverage
WITS&WTO (non-MFN rates) 99.91 % coverage
WITS&WTO (MFN rates) 70.72 % coverage; WITS&WTO (non-MFN rates) 29.21 % coverage
Egypt, Arab Republic of
WITS (Inferred from exports, 2008)&WTO (non-MFN rates) 100 % coverage
WITS&WTO (non-MFN rates) 100 % coverage
WITS&WTO (non-MFN rates) 100 % coverage
WITS&WTO (non-MFN rates) 100 % coverage
WITS&WTO (non-MFN rates) 59 % coverage; WITS&WTO (MFN rates) 40.81 % coverage
LibyaWITS&WTO (non-MFN rates) 100 % coverage
WITS&WTO (non-MFN rates) 100 % coverage
WITS&WTO (non-MFN rates) 100 % coverage
WITS&WTO (MFN rates) 80.11 % coverage; WITS&WTO (non-MFN rates) 15.71 % coverage; WITS&Reciprocal (WITS (Imports, 2007)) 4.18 % coverage
Tunisia
WITS (Inferred from exports, 2007)&WTO (non-MFN rates) 100 % coverage
WITS&WTO (non-MFN rates) 100 % coverage
WITS&WTO (non-MFN rates) 100 % coverage
WITS&WTO (non-MFN rates) 100 % coverage
WITS&WTO (non-MFN rates) 89.82 % coverage; WITS&WTO (MFN rates) 10.18 % coverage
European Union
WITS (Inferred from exports, 2007)&Reciprocal (WITS (Inferred from exports, 2007)) 48.22 % coverage; WITS (Inferred from exports, 2007)&Country sources 43.7 % coverage; WITS (Inferred from exports, 2007)>AP 8.08 % coverage
WITS&WTO (MFN rates) 69.19 % coverage; WITS&Reciprocal (WITS (Imports, 2007)) 30.7 % coverage
WITS&Reciprocal (WITS (Imports, 2007)) 70.3 % coverage; WITS&Country sources 28.2 % coverage; WITS>AP 1.5 % coverage
WITS&Reciprocal (WITS (Imports, 2007)) 79.14 % coverage; WITS&Country sources 11.21 % coverage; WITS>AP 9.66 % coverage
WITS&WTO (non-MFN rates) 75.47 % coverage; WITS&WTO (MFN rates) 21.57 % coverage; WITS&Reciprocal (WITS (Imports, 2007)) 2.84 % coverage
IraqWITS&WTO (non-MFN rates) 100 % coverage
WITS&WTO (non-MFN rates) 100 % coverage
WITS&WTO (non-MFN rates) 100 % coverage
WITS&WTO (MFN rates) 88.43 % coverage; WITS&WTO (non-MFN rates) 11.27 % coverage
Yemen
WITS (Inferred from exports, 2007)&WTO (non-MFN rates) 100 % coverage
WITS&WTO (non-MFN rates) 100 % coverage
WITS&WTO (non-MFN rates) 100 % coverage
WITS&WTO (non-MFN rates) 100 % coverage
WITS&WTO (MFN rates) 100 % coverage
Lebanon
WITS (Inferred from exports, 2007)&WTO (non-MFN rates) 100 % coverage
WITS&WTO (non-MFN rates) 100 % coverage
WITS&WTO (non-MFN rates) 100 % coverage
WITS&WTO (non-MFN rates) 99.69 % coverage
WITS&WTO (MFN rates) 99.85 % coverage
Algeria
WITS (Inferred from exports, 2007)&WTO (non-MFN rates) 100 % coverage
WITS&WTO (non-MFN rates) 100 % coverage
WITS&WTO (non-MFN rates) 100 % coverage
WITS&WTO (non-MFN rates) 100 % coverage
WITS&WTO (MFN rates) 91.06 % coverage; WITS&WTO (non-MFN rates) 8.94 % coverage
36
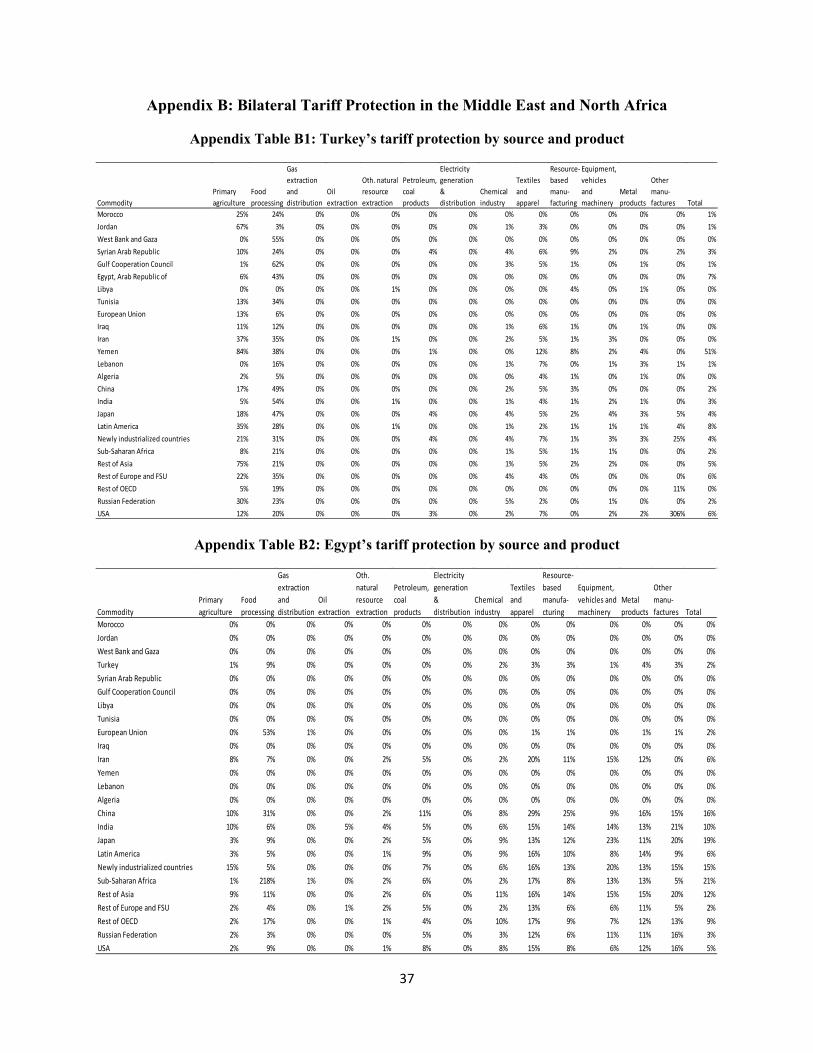
Appendix B: Bilateral Tariff Protection in the Middle East and North Africa
Appendix Table B1: Turkey’s tariff protection by source and product
Appendix Table B2: Egypt’s tariff protection by source and product
CommodityPrimary agriculture
Food processing
Gas extraction and distribution
Oil extraction
Oth. natural resource extraction
Petroleum, coal products
Electricity generation & distribution
Chemical industry
Textiles and apparel
Resource-based manu-facturing
Equipment, vehicles and machinery
Metal products
Other manu-factures Total
Morocco 25% 24% 0% 0% 0% 0% 0% 0% 0% 0% 0% 0% 0% 1%Jordan 67% 3% 0% 0% 0% 0% 0% 1% 3% 0% 0% 0% 0% 1%West Bank and Gaza 0% 55% 0% 0% 0% 0% 0% 0% 0% 0% 0% 0% 0% 0%Syrian Arab Republic 10% 24% 0% 0% 0% 4% 0% 4% 6% 9% 2% 0% 2% 3%Gulf Cooperation Council 1% 62% 0% 0% 0% 0% 0% 3% 5% 1% 0% 1% 0% 1%Egypt, Arab Republic of 6% 43% 0% 0% 0% 0% 0% 0% 0% 0% 0% 0% 0% 7%Libya 0% 0% 0% 0% 1% 0% 0% 0% 0% 4% 0% 1% 0% 0%Tunisia 13% 34% 0% 0% 0% 0% 0% 0% 0% 0% 0% 0% 0% 0%European Union 13% 6% 0% 0% 0% 0% 0% 0% 0% 0% 0% 0% 0% 0%Iraq 11% 12% 0% 0% 0% 0% 0% 1% 6% 1% 0% 1% 0% 0%Iran 37% 35% 0% 0% 1% 0% 0% 2% 5% 1% 3% 0% 0% 0%Yemen 84% 38% 0% 0% 0% 1% 0% 0% 12% 8% 2% 4% 0% 51%Lebanon 0% 16% 0% 0% 0% 0% 0% 1% 7% 0% 1% 3% 1% 1%Algeria 2% 5% 0% 0% 0% 0% 0% 0% 4% 1% 0% 1% 0% 0%China 17% 49% 0% 0% 0% 0% 0% 2% 5% 3% 0% 0% 0% 2%India 5% 54% 0% 0% 1% 0% 0% 1% 4% 1% 2% 1% 0% 3%Japan 18% 47% 0% 0% 0% 4% 0% 4% 5% 2% 4% 3% 5% 4%Latin America 35% 28% 0% 0% 1% 0% 0% 1% 2% 1% 1% 1% 4% 8%Newly industrialized countries 21% 31% 0% 0% 0% 4% 0% 4% 7% 1% 3% 3% 25% 4%Sub-Saharan Africa 8% 21% 0% 0% 0% 0% 0% 1% 5% 1% 1% 0% 0% 2%Rest of Asia 75% 21% 0% 0% 0% 0% 0% 1% 5% 2% 2% 0% 0% 5%Rest of Europe and FSU 22% 35% 0% 0% 0% 0% 0% 4% 4% 0% 0% 0% 0% 6%Rest of OECD 5% 19% 0% 0% 0% 0% 0% 0% 0% 0% 0% 0% 11% 0%Russian Federation 30% 23% 0% 0% 0% 0% 0% 5% 2% 0% 1% 0% 0% 2%USA 12% 20% 0% 0% 0% 3% 0% 2% 7% 0% 2% 2% 306% 6%
CommodityPrimary agriculture
Food processing
Gas extraction and distribution
Oil extraction
Oth. natural resource extraction
Petroleum, coal products
Electricity generation & distribution
Chemical industry
Textiles and apparel
Resource-based manufa-cturing
Equipment, vehicles and machinery
Metal products
Other manu-factures Total
Morocco 0% 0% 0% 0% 0% 0% 0% 0% 0% 0% 0% 0% 0% 0%Jordan 0% 0% 0% 0% 0% 0% 0% 0% 0% 0% 0% 0% 0% 0%West Bank and Gaza 0% 0% 0% 0% 0% 0% 0% 0% 0% 0% 0% 0% 0% 0%Turkey 1% 9% 0% 0% 0% 0% 0% 2% 3% 3% 1% 4% 3% 2%Syrian Arab Republic 0% 0% 0% 0% 0% 0% 0% 0% 0% 0% 0% 0% 0% 0%Gulf Cooperation Council 0% 0% 0% 0% 0% 0% 0% 0% 0% 0% 0% 0% 0% 0%Libya 0% 0% 0% 0% 0% 0% 0% 0% 0% 0% 0% 0% 0% 0%Tunisia 0% 0% 0% 0% 0% 0% 0% 0% 0% 0% 0% 0% 0% 0%European Union 0% 53% 1% 0% 0% 0% 0% 0% 1% 1% 0% 1% 1% 2%Iraq 0% 0% 0% 0% 0% 0% 0% 0% 0% 0% 0% 0% 0% 0%Iran 8% 7% 0% 0% 2% 5% 0% 2% 20% 11% 15% 12% 0% 6%Yemen 0% 0% 0% 0% 0% 0% 0% 0% 0% 0% 0% 0% 0% 0%Lebanon 0% 0% 0% 0% 0% 0% 0% 0% 0% 0% 0% 0% 0% 0%Algeria 0% 0% 0% 0% 0% 0% 0% 0% 0% 0% 0% 0% 0% 0%China 10% 31% 0% 0% 2% 11% 0% 8% 29% 25% 9% 16% 15% 16%India 10% 6% 0% 5% 4% 5% 0% 6% 15% 14% 14% 13% 21% 10%Japan 3% 9% 0% 0% 2% 5% 0% 9% 13% 12% 23% 11% 20% 19%Latin America 3% 5% 0% 0% 1% 9% 0% 9% 16% 10% 8% 14% 9% 6%Newly industrialized countries 15% 5% 0% 0% 0% 7% 0% 6% 16% 13% 20% 13% 15% 15%Sub-Saharan Africa 1% 218% 1% 0% 2% 6% 0% 2% 17% 8% 13% 13% 5% 21%Rest of Asia 9% 11% 0% 0% 2% 6% 0% 11% 16% 14% 15% 15% 20% 12%Rest of Europe and FSU 2% 4% 0% 1% 2% 5% 0% 2% 13% 6% 6% 11% 5% 2%Rest of OECD 2% 17% 0% 0% 1% 4% 0% 10% 17% 9% 7% 12% 13% 9%Russian Federation 2% 3% 0% 0% 0% 5% 0% 3% 12% 6% 11% 11% 16% 3%USA 2% 9% 0% 0% 1% 8% 0% 8% 15% 8% 6% 12% 16% 5%
37
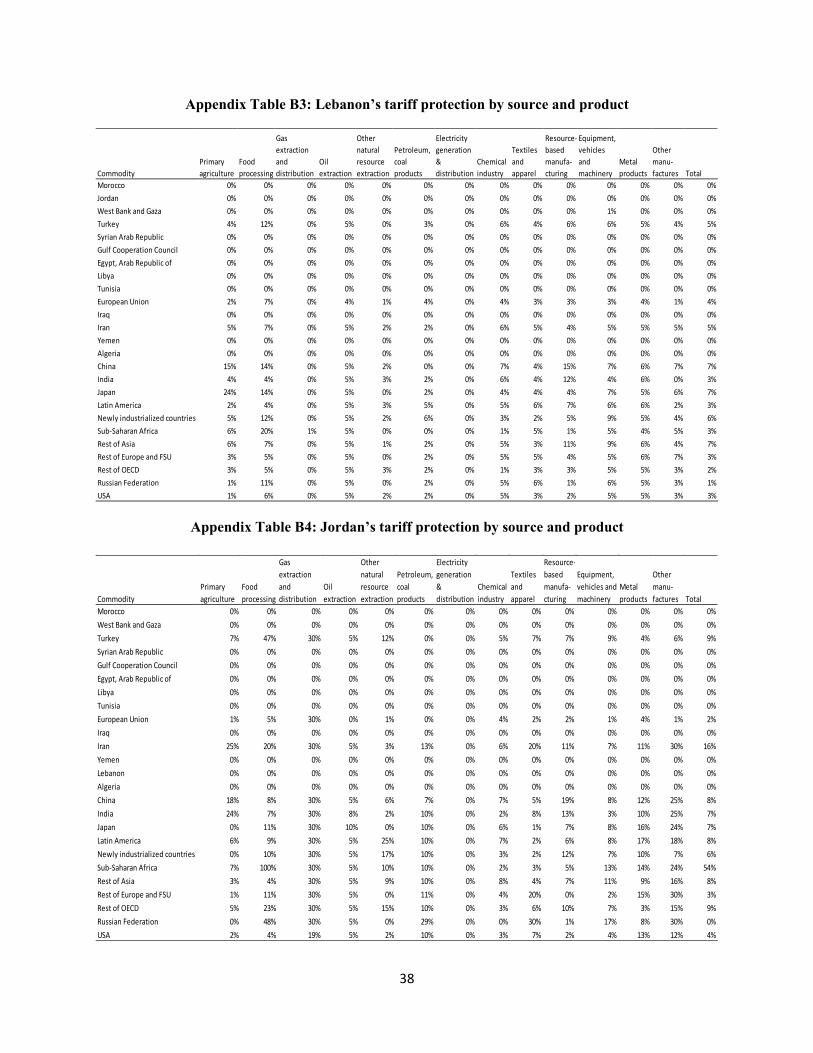
Appendix Table B3: Lebanon’s tariff protection by source and product
Appendix Table B4: Jordan’s tariff protection by source and product
CommodityPrimary agriculture
Food processing
Gas extraction and distribution
Oil extraction
Other natural resource extraction
Petroleum, coal products
Electricity generation & distribution
Chemical industry
Textiles and apparel
Resource-based manufa-cturing
Equipment, vehicles and machinery
Metal products
Other manu-factures Total
Morocco 0% 0% 0% 0% 0% 0% 0% 0% 0% 0% 0% 0% 0% 0%Jordan 0% 0% 0% 0% 0% 0% 0% 0% 0% 0% 0% 0% 0% 0%West Bank and Gaza 0% 0% 0% 0% 0% 0% 0% 0% 0% 0% 1% 0% 0% 0%Turkey 4% 12% 0% 5% 0% 3% 0% 6% 4% 6% 6% 5% 4% 5%Syrian Arab Republic 0% 0% 0% 0% 0% 0% 0% 0% 0% 0% 0% 0% 0% 0%Gulf Cooperation Council 0% 0% 0% 0% 0% 0% 0% 0% 0% 0% 0% 0% 0% 0%Egypt, Arab Republic of 0% 0% 0% 0% 0% 0% 0% 0% 0% 0% 0% 0% 0% 0%Libya 0% 0% 0% 0% 0% 0% 0% 0% 0% 0% 0% 0% 0% 0%Tunisia 0% 0% 0% 0% 0% 0% 0% 0% 0% 0% 0% 0% 0% 0%European Union 2% 7% 0% 4% 1% 4% 0% 4% 3% 3% 3% 4% 1% 4%Iraq 0% 0% 0% 0% 0% 0% 0% 0% 0% 0% 0% 0% 0% 0%Iran 5% 7% 0% 5% 2% 2% 0% 6% 5% 4% 5% 5% 5% 5%Yemen 0% 0% 0% 0% 0% 0% 0% 0% 0% 0% 0% 0% 0% 0%Algeria 0% 0% 0% 0% 0% 0% 0% 0% 0% 0% 0% 0% 0% 0%China 15% 14% 0% 5% 2% 0% 0% 7% 4% 15% 7% 6% 7% 7%India 4% 4% 0% 5% 3% 2% 0% 6% 4% 12% 4% 6% 0% 3%Japan 24% 14% 0% 5% 0% 2% 0% 4% 4% 4% 7% 5% 6% 7%Latin America 2% 4% 0% 5% 3% 5% 0% 5% 6% 7% 6% 6% 2% 3%Newly industrialized countries 5% 12% 0% 5% 2% 6% 0% 3% 2% 5% 9% 5% 4% 6%Sub-Saharan Africa 6% 20% 1% 5% 0% 0% 0% 1% 5% 1% 5% 4% 5% 3%Rest of Asia 6% 7% 0% 5% 1% 2% 0% 5% 3% 11% 9% 6% 4% 7%Rest of Europe and FSU 3% 5% 0% 5% 0% 2% 0% 5% 5% 4% 5% 6% 7% 3%Rest of OECD 3% 5% 0% 5% 3% 2% 0% 1% 3% 3% 5% 5% 3% 2%Russian Federation 1% 11% 0% 5% 0% 2% 0% 5% 6% 1% 6% 5% 3% 1%USA 1% 6% 0% 5% 2% 2% 0% 5% 3% 2% 5% 5% 3% 3%
CommodityPrimary agriculture
Food processing
Gas extraction and distribution
Oil extraction
Other natural resource extraction
Petroleum, coal products
Electricity generation & distribution
Chemical industry
Textiles and apparel
Resource-based manufa-cturing
Equipment, vehicles and machinery
Metal products
Other manu-factures Total
Morocco 0% 0% 0% 0% 0% 0% 0% 0% 0% 0% 0% 0% 0% 0%West Bank and Gaza 0% 0% 0% 0% 0% 0% 0% 0% 0% 0% 0% 0% 0% 0%Turkey 7% 47% 30% 5% 12% 0% 0% 5% 7% 7% 9% 4% 6% 9%Syrian Arab Republic 0% 0% 0% 0% 0% 0% 0% 0% 0% 0% 0% 0% 0% 0%Gulf Cooperation Council 0% 0% 0% 0% 0% 0% 0% 0% 0% 0% 0% 0% 0% 0%Egypt, Arab Republic of 0% 0% 0% 0% 0% 0% 0% 0% 0% 0% 0% 0% 0% 0%Libya 0% 0% 0% 0% 0% 0% 0% 0% 0% 0% 0% 0% 0% 0%Tunisia 0% 0% 0% 0% 0% 0% 0% 0% 0% 0% 0% 0% 0% 0%European Union 1% 5% 30% 0% 1% 0% 0% 4% 2% 2% 1% 4% 1% 2%Iraq 0% 0% 0% 0% 0% 0% 0% 0% 0% 0% 0% 0% 0% 0%Iran 25% 20% 30% 5% 3% 13% 0% 6% 20% 11% 7% 11% 30% 16%Yemen 0% 0% 0% 0% 0% 0% 0% 0% 0% 0% 0% 0% 0% 0%Lebanon 0% 0% 0% 0% 0% 0% 0% 0% 0% 0% 0% 0% 0% 0%Algeria 0% 0% 0% 0% 0% 0% 0% 0% 0% 0% 0% 0% 0% 0%China 18% 8% 30% 5% 6% 7% 0% 7% 5% 19% 8% 12% 25% 8%India 24% 7% 30% 8% 2% 10% 0% 2% 8% 13% 3% 10% 25% 7%Japan 0% 11% 30% 10% 0% 10% 0% 6% 1% 7% 8% 16% 24% 7%Latin America 6% 9% 30% 5% 25% 10% 0% 7% 2% 6% 8% 17% 18% 8%Newly industrialized countries 0% 10% 30% 5% 17% 10% 0% 3% 2% 12% 7% 10% 7% 6%Sub-Saharan Africa 7% 100% 30% 5% 10% 10% 0% 2% 3% 5% 13% 14% 24% 54%Rest of Asia 3% 4% 30% 5% 9% 10% 0% 8% 4% 7% 11% 9% 16% 8%Rest of Europe and FSU 1% 11% 30% 5% 0% 11% 0% 4% 20% 0% 2% 15% 30% 3%Rest of OECD 5% 23% 30% 5% 15% 10% 0% 3% 6% 10% 7% 3% 15% 9%Russian Federation 0% 48% 30% 5% 0% 29% 0% 0% 30% 1% 17% 8% 30% 0%USA 2% 4% 19% 5% 2% 10% 0% 3% 7% 2% 4% 13% 12% 4%
38
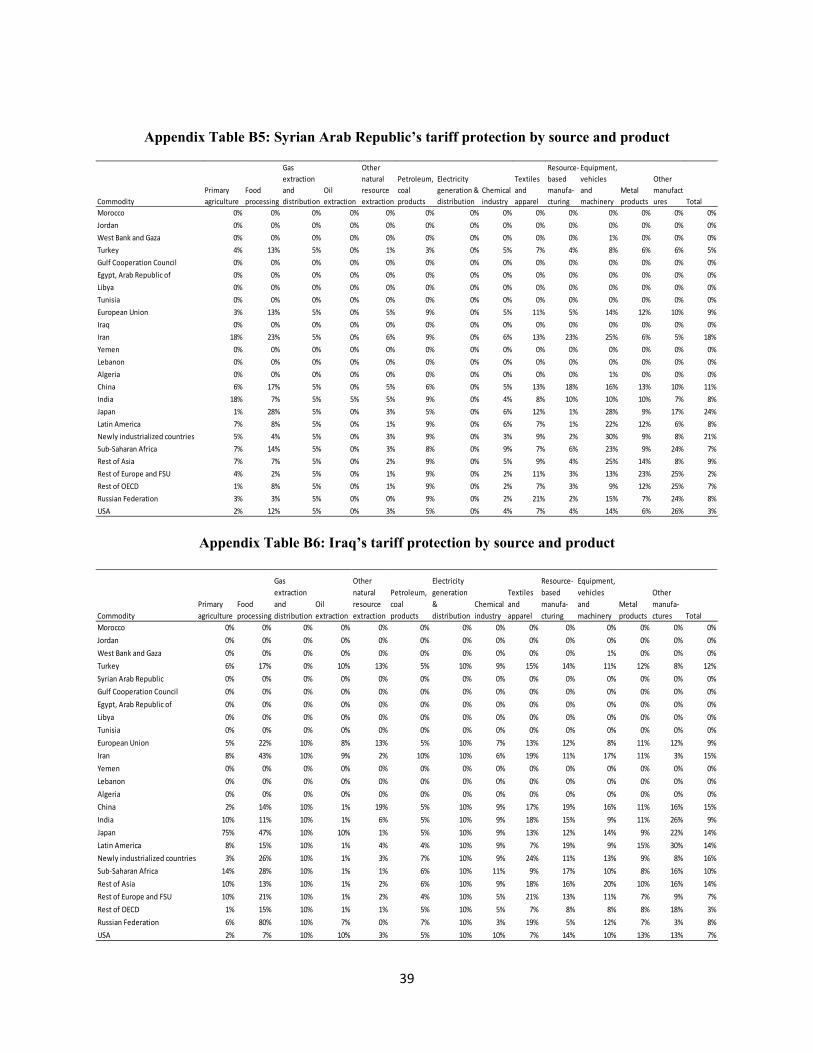
Appendix Table B5: Syrian Arab Republic’s tariff protection by source and product
Appendix Table B6: Iraq’s tariff protection by source and product
CommodityPrimary agriculture
Food processing
Gas extraction and distribution
Oil extraction
Other natural resource extraction
Petroleum, coal products
Electricity generation & distribution
Chemical industry
Textiles and apparel
Resource-based manufa-cturing
Equipment, vehicles and machinery
Metal products
Other manufactures Total
Morocco 0% 0% 0% 0% 0% 0% 0% 0% 0% 0% 0% 0% 0% 0%Jordan 0% 0% 0% 0% 0% 0% 0% 0% 0% 0% 0% 0% 0% 0%West Bank and Gaza 0% 0% 0% 0% 0% 0% 0% 0% 0% 0% 1% 0% 0% 0%Turkey 4% 13% 5% 0% 1% 3% 0% 5% 7% 4% 8% 6% 6% 5%Gulf Cooperation Council 0% 0% 0% 0% 0% 0% 0% 0% 0% 0% 0% 0% 0% 0%Egypt, Arab Republic of 0% 0% 0% 0% 0% 0% 0% 0% 0% 0% 0% 0% 0% 0%Libya 0% 0% 0% 0% 0% 0% 0% 0% 0% 0% 0% 0% 0% 0%Tunisia 0% 0% 0% 0% 0% 0% 0% 0% 0% 0% 0% 0% 0% 0%European Union 3% 13% 5% 0% 5% 9% 0% 5% 11% 5% 14% 12% 10% 9%Iraq 0% 0% 0% 0% 0% 0% 0% 0% 0% 0% 0% 0% 0% 0%Iran 18% 23% 5% 0% 6% 9% 0% 6% 13% 23% 25% 6% 5% 18%Yemen 0% 0% 0% 0% 0% 0% 0% 0% 0% 0% 0% 0% 0% 0%Lebanon 0% 0% 0% 0% 0% 0% 0% 0% 0% 0% 0% 0% 0% 0%Algeria 0% 0% 0% 0% 0% 0% 0% 0% 0% 0% 1% 0% 0% 0%China 6% 17% 5% 0% 5% 6% 0% 5% 13% 18% 16% 13% 10% 11%India 18% 7% 5% 5% 5% 9% 0% 4% 8% 10% 10% 10% 7% 8%Japan 1% 28% 5% 0% 3% 5% 0% 6% 12% 1% 28% 9% 17% 24%Latin America 7% 8% 5% 0% 1% 9% 0% 6% 7% 1% 22% 12% 6% 8%Newly industrialized countries 5% 4% 5% 0% 3% 9% 0% 3% 9% 2% 30% 9% 8% 21%Sub-Saharan Africa 7% 14% 5% 0% 3% 8% 0% 9% 7% 6% 23% 9% 24% 7%Rest of Asia 7% 7% 5% 0% 2% 9% 0% 5% 9% 4% 25% 14% 8% 9%Rest of Europe and FSU 4% 2% 5% 0% 1% 9% 0% 2% 11% 3% 13% 23% 25% 2%Rest of OECD 1% 8% 5% 0% 1% 9% 0% 2% 7% 3% 9% 12% 25% 7%Russian Federation 3% 3% 5% 0% 0% 9% 0% 2% 21% 2% 15% 7% 24% 8%USA 2% 12% 5% 0% 3% 5% 0% 4% 7% 4% 14% 6% 26% 3%
CommodityPrimary agriculture
Food processing
Gas extraction and distribution
Oil extraction
Other natural resource extraction
Petroleum, coal products
Electricity generation & distribution
Chemical industry
Textiles and apparel
Resource-based manufa-cturing
Equipment, vehicles and machinery
Metal products
Other manufa-ctures Total
Morocco 0% 0% 0% 0% 0% 0% 0% 0% 0% 0% 0% 0% 0% 0%Jordan 0% 0% 0% 0% 0% 0% 0% 0% 0% 0% 0% 0% 0% 0%West Bank and Gaza 0% 0% 0% 0% 0% 0% 0% 0% 0% 0% 1% 0% 0% 0%Turkey 6% 17% 0% 10% 13% 5% 10% 9% 15% 14% 11% 12% 8% 12%Syrian Arab Republic 0% 0% 0% 0% 0% 0% 0% 0% 0% 0% 0% 0% 0% 0%Gulf Cooperation Council 0% 0% 0% 0% 0% 0% 0% 0% 0% 0% 0% 0% 0% 0%Egypt, Arab Republic of 0% 0% 0% 0% 0% 0% 0% 0% 0% 0% 0% 0% 0% 0%Libya 0% 0% 0% 0% 0% 0% 0% 0% 0% 0% 0% 0% 0% 0%Tunisia 0% 0% 0% 0% 0% 0% 0% 0% 0% 0% 0% 0% 0% 0%European Union 5% 22% 10% 8% 13% 5% 10% 7% 13% 12% 8% 11% 12% 9%Iran 8% 43% 10% 9% 2% 10% 10% 6% 19% 11% 17% 11% 3% 15%Yemen 0% 0% 0% 0% 0% 0% 0% 0% 0% 0% 0% 0% 0% 0%Lebanon 0% 0% 0% 0% 0% 0% 0% 0% 0% 0% 0% 0% 0% 0%Algeria 0% 0% 0% 0% 0% 0% 0% 0% 0% 0% 0% 0% 0% 0%China 2% 14% 10% 1% 19% 5% 10% 9% 17% 19% 16% 11% 16% 15%India 10% 11% 10% 1% 6% 5% 10% 9% 18% 15% 9% 11% 26% 9%Japan 75% 47% 10% 10% 1% 5% 10% 9% 13% 12% 14% 9% 22% 14%Latin America 8% 15% 10% 1% 4% 4% 10% 9% 7% 19% 9% 15% 30% 14%Newly industrialized countries 3% 26% 10% 1% 3% 7% 10% 9% 24% 11% 13% 9% 8% 16%Sub-Saharan Africa 14% 28% 10% 1% 1% 6% 10% 11% 9% 17% 10% 8% 16% 10%Rest of Asia 10% 13% 10% 1% 2% 6% 10% 9% 18% 16% 20% 10% 16% 14%Rest of Europe and FSU 10% 21% 10% 1% 2% 4% 10% 5% 21% 13% 11% 7% 9% 7%Rest of OECD 1% 15% 10% 1% 1% 5% 10% 5% 7% 8% 8% 8% 18% 3%Russian Federation 6% 80% 10% 7% 0% 7% 10% 3% 19% 5% 12% 7% 3% 8%USA 2% 7% 10% 10% 3% 5% 10% 10% 7% 14% 10% 13% 13% 7%
39

![The Syrian Civil War : regional ramifications, global ...usir.salford.ac.uk/38098/3/Singapore%20ME%20papers%20AAM%20MPieper[1].pdf1 The Syrian Civil War: Regional Ramifications, Global](https://img.pdfslide.us/doc/110x75/5e8418074552014a727a6ff1/the-syrian-civil-war-regional-ramifications-global-usir-20me20papers20aam20mpieper1pdf.jpg)