Embed Size (px)
Citation preview

Delivered: March 1, 2021
March 1 , 2021
Economic Development
Market Feasibility Study:
Analysis and Results City of North Port
March 2021
i | P a g e
City of North Port, FL
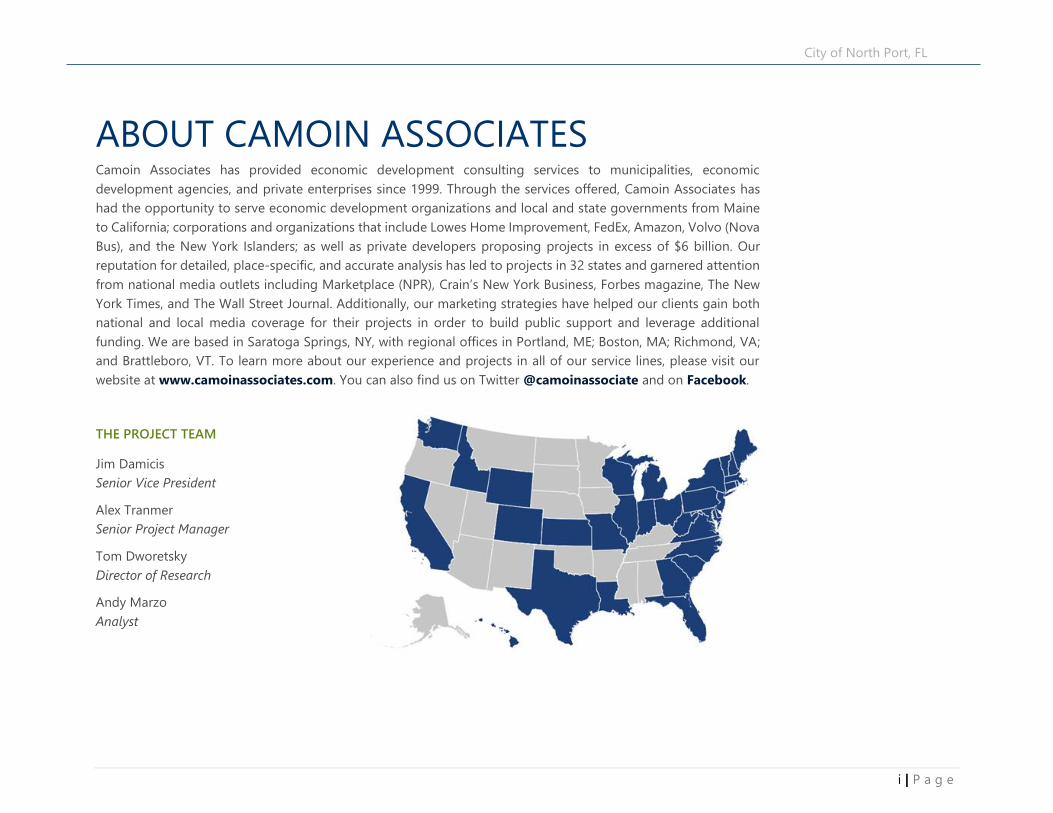
ABOUT CAMOIN ASSOCIATES Camoin Associates has provided economic development consulting services to municipalities, economic
development agencies, and private enterprises since 1999. Through the services offered, Camoin Associates has
had the opportunity to serve economic development organizations and local and state governments from Maine
to California; corporations and organizations that include Lowes Home Improvement, FedEx, Amazon, Volvo (Nova
Bus), and the New York Islanders; as well as private developers proposing projects in excess of $6 billion. Our
reputation for detailed, place-specific, and accurate analysis has led to projects in 32 states and garnered attention
from national media outlets including Marketplace (NPR), Crain’s New York Business, Forbes magazine, The New
York Times, and The Wall Street Journal. Additionally, our marketing strategies have helped our clients gain both
national and local media coverage for their projects in order to build public support and leverage additional
funding. We are based in Saratoga Springs, NY, with regional offices in Portland, ME; Boston, MA; Richmond, VA;
and Brattleboro, VT. To learn more about our experience and projects in all of our service lines, please visit our
website at www.camoinassociates.com. You can also find us on Twitter @camoinassociate and on Facebook.
THE PROJECT TEAM
Jim Damicis
Senior Vice President
Alex Tranmer
Senior Project Manager
Tom Dworetsky
Director of Research
Andy Marzo
Analyst

ii | P a g e
City of North Port, FL
Market Analysis Conclusions ................................................................ 1
Action Plan Matrix .................................................................................... 4
Development Scenarios and Fiscal Benefit Analysis ..................... 6
Approach to Financing Utility and Infrastructure Projects ....... 15
APPENDIX Appendix I: Workforce Alignment with Target Industries
Appendix II: Economic Inventory
Appendix III: Real Estate Inventory Report
Appendix IV: Interview Themes
Appendix V: Infrastructure Funding Approaches
Appendix VI: Acknowledgements
CONTENTS
CONTENTS

1 | P a g e
City of North Port, FL
MARKET ANALYSIS CONCLUSIONS
Introduction The City of North Port commissioned Camoin 310 to conduct an
Economic Development Market Feasibility Study. The study
encompassed demographic data analysis, real estate market analysis,
1-on-1 interviews, focus groups, and consensus-building among city
staff to determine appropriate strategies that will help the city reach
its economic development goals and reflect values important to the
City of North Port. This portion of the report contains market
findings, an Action Plan Matrix, and the results of the fiscal benefit
potential analysis. The recommendations in this section are
supported by Appendices I-V.
Key Findings Over the last ten years, North Port accounted for over 20% of
Sarasota County’s population growth and 2.5% of job growth. In
the early 2000s, the population center of the county began to shift
south towards North Port, but jobs did not expand proportionately
with the population. Over the last decade, North Port has been able
to grow its job base relative to its population growth, which is a
positive trend.
North Port is a net exporter of jobs. Nearly 90% of the city’s
workforce commutes to other locations in the region for work.
This ratio is not conducive to creating a dynamic community. The
proportion of out commuters is extremely high compared to other
communities. The workers leaving North Port every morning
represent business potential and unique talent and skillsets that
could be fostered within the city if the commercial or industrial
density existed to support these jobs.
Industry data, stakeholder interviews and market research point
to opportunities for North Port to grow and diversify its industry
base. While the market indicates opportunity for North Port, the
city's ability to prepare itself for these economic and market shifts
will require targeted efforts on site readiness and workforce
development efforts.
The pipeline of shovel ready sites is limited, especially for the
light industrial manufacturing sector. While North Port contains
vast swaths of land, much of this is not connected into the city’s
water and waste systems, a barrier to attracting development.
Although there is market demand for uses that fit within the city’s
profile, market factors alone are not likely to catalyze the private
sector to take on utility build out. Success will require public private
partnership models.
Examining the value that public utilities could bring to the city’s
tax rolls demonstrates that the Panacea development area
generates the most “bang” for the City’s investment. For every $1
spent on infrastructure, the City would add between $58 and $290 of
taxable assessed value to its tax rolls that would generate annual
property tax revenue and pay one-time impact fees. The Gateway
development area would add $11-$57 of taxable value per $1 of
infrastructure investment. The Springs would likely be the least
lucrative from a fiscal perspective, generating $4-$43 of taxable value
per $1 of investment. More on this analysis can be found on pg. 13.
Beyond direct municipal return on investment, the City should
consider the “opportunity cost” of not acting to prepare for the
type of development desired. Recent development trends in the
city and immediate region indicate that single-family residential is
the most financially feasible type of development in today’s market.
Therefore, without infrastructure investments and/or policy changes

2 | P a g e
City of North Port, FL
that facilitate and preserve land for desired commercial and industrial
development, the City’s remaining developable land supply will
continue to be consumed by single-family homes. Some types of
higher-value development, such as a mixed-use downtown or Class A
office space, may not yet be viable in the market as private ventures.
However, as North Port becomes increasingly attractive as a place to
invest, the City should take steps to ensure that well-situated plots of
land remain available to accommodate such investment when the
market is ready.
The City’s Comprehensive Plan acknowledges the need to plan
and fund infrastructure that supports existing and future
business. Goal 4 states that the city will “inventory and develop
infrastructure to meet existing and future needs of businesses and
the public.” The policies within the goal go on to prioritize growth in
Activity Centers and note that the city will “identify and implement
capital improvement projects to address infrastructure deficiencies.”
Market research and recent events demonstrate that if the city
provides a product that is shovel ready, there is active interest in
the Sarasota County region for development that will create jobs
and generate tax revenue for the city. This in turn provides funds
for quality-of-life elements that make the city an enjoyable place to
reside.
Using data and visualizations to showcase the region’s workforce
in key occupations and skill sets are critical for attracting
businesses in target sectors. North Port's existing workforce and
growing population is a positive economic sign. North Port’s resident
workers hold positions in Office and Administrative Support, Sales,
Healthcare, and a variety of others. Currently, these residents most
often leave the city and support the regional economy in other
employment bases. Leveraging the skillsets of these workers and
targeting the subsectors that will thrive are attractive value
propositions when coupled with data on real estate opportunities.
The business and development climate in North Port is not
viewed favorably but does show signs of improvement. Municipal
staff turnover and an unclear vision for the future of impact fees
contribute to a negative experience working with the city. There are
collaborations and ongoing conversations to ameliorate this
perception and can be celebrated and promoted.
A centralized downtown at an appropriate scale of development
would transform perceptions of the city, provide opportunities
for residents and visitors to spend money locally, and generate
economic activity and job opportunities in industries thriving in
the aftermath of COVID-19. While there is an imperative to support
business activity through coordination of planning, land use, public
works, utilities, and economic development, there is further
opportunity for North Port to generate economic activity by
attracting the development of a live/work/play environment or a
centralized downtown. A public-private partnership is a common way
to enable this type of development.

3 | P a g e
City of North Port, FL
Economic Development Imperatives for North Port While economic development activities include capacity building, marketing, business development and many other specialized tactics, there are
three imperatives for the city moving forward in its economic development endeavors.

4 | P a g e
City of North Port, FL
ACTION PLAN MATRIX The following strategies will help the city advance action items related to the priority areas that are well-suited to expand North Port’s commercial
base. The action items also support the work of the Economic Development Division and its collaboration with other city departments as well as
regional organizations.
Themes Action Items Priority Level
Planning/Land Use/Infrastructure
Codify sites/areas for commercial or industrial development in the
Comprehensive Plan and other relevant planning documents. High
Continue advocating and working with city departments to advance shovel-
ready sites. High
Continue broadband advocacy and expansion to ensure that broadband is
available to priority sites. High
Develop strategies for financing infrastructure to meet future business needs
based on traditional and alternative methods. High
Pursue land assembly in targeted areas. Medium
Monitor open space/conserved land in relation to expected development. Medium
Business Development
Continue to collaborate with regional partners to target attraction efforts to
traded sectors that align with regional targets -- -manufacturing, cleantech, life
sciences.
High
Identify and develop pipeline of projects that support environmental resiliency. High
Prioritize three factors for business development --- shovel ready sites,
infrastructure build out and workforce alignment --- with key sectors. High
Work with Sarasota EDC to expand available labor market data for the city and
region - -- specifically skills and current openings. Medium
Continue advancing goals for formalizing Business Retention and Expansion. Medium
Approach resiliency and sustainable development as part of North Port's
competitiveness. Medium

5 | P a g e
City of North Port, FL
Role of Economic Development
in the City
Pursue formal adoption of the Economic Development Market Feasibility Study by the City Commission.
High
Maintain regular communication with department heads on economic
development goals as it pertains to their departments. Establish a standard
recording mechanism for these conversations.
High
Marketing North Port
Develop "opportunity profiles" for priority sites/areas for targeted marketing
purposes. High
Ensure priority sites (and others, as relevant) are submitted and updated on
Sarasota EDC's website. Medium
Post opportunity profiles under Economic Development on the city's website
and promote through Sarasota EDC network. Medium
Use current marketing channels to highlight existing businesses in the target
industries. Low
Market Opportunity Zones to Opportunity Exchange and beyond. Low
Use data to "tell the story" that North Port is a growing, young community with
a bustling economy in Southwest Florida. Medium
Placemaking
Prioritize catalyzing a "live/work/play" mixed use development through a public
private partnership. Medium
Market the Braves and Warm Mineral Springs, other cultural and recreational
options, and outdoor quality of life assets to support young workers/families,
and businesses.
Medium

6 | P a g e
City of North Port, FL
DEVELOPMENT SCENARIOS AND FISCAL BENEFIT ANALYSIS In addition to a market feasibility analysis, Camoin 310 conducted a fiscal benefit potential analysis on five study areas in the city. The areas that
were studied as part of this analysis were derived from a series of conversations with department leaders at the City and Camoin’s own real estate
market analysis. These sites are particularly important to unlocking potential commercial/industrial growth in the city. The characteristics of the
sites, the size of the parcels, and the proximity to other businesses and transportation assets qualify these areas as optimal locations for
commercial/industrial development. Yet, to unlock this potential, a degree of site readiness is needed to entice the developer community. The
highest potential sites are those that will have the most impact on tax revenue generation and employment generation for North Port. In general,
these will be large sites, served by infrastructure, on major roads, with industrial or commercial zoning, that can accommodate target industry(ies)
and that have motivated owners. Sites were also checked with the city’s database of Scrub Jays to ensure no ecologically sensitive areas would be
compromised. The following table demonstrates the land use types and industry sectors that show the greatest potential for success in North Port,
along with how the target sectors fit within North Port’s economy.
TARGET SECTORS /
DESIRED USES
SITE CONSIDERATIONS CONTRIBUTIONS TO THE CITY
FLEX SPACE / GENERAL
INDUSTRIAL/
MANUFACTURING
Medium to large site, proximity to I-75,
electric, water (potential high capacity),
sewer, gas, telecommunications
This sector captures regional target industries that are innovative
and high contributors to gross regional product. Building off
existing supply chains and capitalizing on market demand will
help these industries expand.
DISTRIBUTION & LOGISTICS Large site, proximity to I-75, electric,
water, sewer, gas, telecommunications
With access to I-75, North Port is well situated geographically to
support these industries.
HOTEL / TOURISM
AMENITIES
Medium site, proximity to attractions,
proximity to Route 41 & I-75, electric,
water, sewer, gas, telecommunications
With Warm Mineral Springs and CoolToday Park, North Port’s
regional destinations will continue to flourish and contribute to
the economy as related uses are built up to support those
entities. This could include hotels, retail, restaurants, related
attractions and more. The businesses that support the tourism
economy are also elements that can contribute to quality of life
for residents.
CENTRALIZED DOWNTOWN
COMMERCIAL DISTRICT
Proximity to customer base, proximity to
Route 41 & I-75, electric, water, sewer,
gas, telecommunications
Developing a mixed use, centralized downtown would be
transformative for the city. This type of development would not
only contribute to the diversity of the economy but also foster an
environment that supports creative, tech-related, and
professional service jobs. A vibrant downtown would also serve to
attract workforce.

7 | P a g e
City of North Port, FL
Maps of Study Areas
Activity Center 3 - Gateway “North” (Parcels E and D)
& Gateway “South” (Parcels A,B,C)
Activity Center 4 - Panacea “Northeast” (Parcels I and J) & Panacea
“Northwest” (Parcel A)

8 | P a g e
City of North Port, FL
Activity Center 7 - The Springs (Parcels A,B,C,E,F) Activity Center 2 - Heron Creek (Parcel A)
Activity Center 5 - Midway (Parcels A,B,C,D,E,F,G)

9 | P a g e
City of North Port, FL
Methodology A fiscal benefit potential analysis was conducted on each of the priority development areas1 to estimate the amount of revenue that could be
generated for the City upon full buildout of each site. The analysis considers both one-time revenue from impact fees and recurring annual
property tax revenue. It is meant to provide an order-of-magnitude estimate of fiscal benefits to be generated for North Port that can be
considered against the cost of infrastructure improvements and other expenses that would be incurred to unlock the development potential of
these sites. While only City-specific revenues are considered here, it is acknowledged that new development in North Port would also generate
fiscal benefits for Sarasota County, the Sarasota County School District, and other taxing jurisdictions.
The methodology for the fiscal benefit potential analysis is outlined as follows:
1. Estimate Buildout Potential. Each priority development area was defined as a group of
contiguous or nearly contiguous parcels. The combined area of these parcels composing
each development area represents the total land area available for development. A range of
floor area ratios (FARs) were applied to total land area to estimate the amount of building
area that could be supported in each development area.
For development areas within the Gateway and Panacea activity centers, a “low” FAR
of 0.1 was applied and a “high” FAR of 0.5 was applied. This range of FARs would be
typical for suburban-style, low to moderate density commercial and industrial
development.
The Heron Creek and Midway development areas have been identified for potential
downtown-style development with a mix of uses at a medium level of density.
Accordingly, we assumed a “low” FAR of 0.5 and a “high” FAR of 1.0.
The Springs development area could potentially accommodate a wide range of
development densities, ranging from low density that is consistent with surrounding
residential uses to medium density that allow enough development to establish the
area as a destination tourism node within the City. Therefore, the FARs modeled for
The Springs ranged from 0.1 to 1.0.
1 This includes one or multiple sites, dependent on the area.
Visual examples of Floor Area Ratios

10 | P a g e
City of North Port, FL
Note that a detailed site analysis was not conducted as part of this exercise. In some cases, development areas may have considerable wetlands or
undevelopable areas requiring mitigation. However, the range of FARs used is conservative (low) to account for the possible presence of these
physical impediments to development. Across the development areas, we estimate total buildout potential of approximately 12 million to 30
million square feet of new development.
2. Assign use types. For each development area, we allocated total buildout potential to various use types based on market demand, site location,
surrounding uses, and the use types permitted in each activity center per the City’s Unified Land Development Code (ULDC). Commercial and
industrial uses were prioritized over residential uses as appropriate. Heron Creek, Midway, and The Springs all were allocated significant residential
components, since housing would complement commercial uses and increase the financial feasibility of each development overall.
Development
Area
Land Area
(Acres)
Land Area
(SF)FAR - Low
FAR -
High
Buildout (SF) -
Low
Buildout (SF) -
High
Gateway 128 5,568,664 0.1 0.5 556,866 2,784,332
South 61 2,655,237 0.1 0.5 265,524 1,327,619
North 67 2,913,427 0.1 0.5 291,343 1,456,714
Panacea 507 22,075,367 0.5 1 11,037,684 22,075,367
NE 493 21,457,167 0.5 1 10,728,584 21,457,167
NW 14 618,200 0.5 1 309,100 618,200
Heron Creek 62 2,684,907 0.1 0.5 268,491 1,342,454
Midway 113 4,927,215 0.1 0.5 492,722 2,463,608
The Springs 13 579,232 0.1 1.0 57,923 579,232
Total 823 35,835,385 12,413,685 29,244,992
Buildout Potential by Development Area
Development
Area
Low Density
Residential
Medium
Density
Residential
High Density
Residential
General
Office
Retail /
Services Restaurant
Medical
Office Hotel
Manufacturing
/ General
Industrial
Warehouse /
Distribution
Gateway - South 0% 0% 0% 25% 25% 20% 20% 10% 0% 0%
Gateway - North 0% 0% 0% 25% 25% 20% 20% 10% 0% 0%
Panacea - NE 0% 0% 0% 20% 0% 0% 0% 0% 30% 50%
Panacea - NW 0% 0% 0% 20% 20% 20% 20% 0% 20% 0%
Heron Creek 0% 25% 25% 10% 15% 15% 0% 10% 0% 0%
Midway 0% 35% 35% 10% 10% 10% 0% 0% 0% 0%
The Springs 0% 30% 0% 0% 25% 25% 0% 20% 0% 0%
Use Breakdown by Development Area (Allocation of Building Area Square Footage)
Note: This allocation of uses is based on square footage of buildout (and not land area) and is consistent with market demand and site compatibility for each
development area. It was developed in consultation with the City and is generally consistent with current City development regulations and/or adjustments that are
anticipated as part of the City's forthcoming Comprehensive Plan. This breakdown is intended to be illustrative; actual allowable buildout may vary.

11 | P a g e
City of North Port, FL
3. Estimate Assessed Value and Annual Property Tax Revenue. Based on a review of construction costs for the
North Port region from RS Means and assessed values for existing structures in the City, we developed an average
assessed value per square foot for each use type. This considers only real property value and excludes any personal
property value. These factors were applied to estimated square footage of buildout (low and high) by use type for
each development area. This resulted in a range of estimated total taxable assessed values by development area.
North Port’s City current (2021) millage rate of 3.7667 was applied to these assessed values to estimate annual
property tax revenues at full buildout for the city. Property tax revenues would phase in overtime as each area is built
out, and the applicable millage rate would vary from year to year.
Across development areas, new taxable assessed value at full buildout could range from approximately $700 million to
$2.3 billion. This would represent an increase of 14% to 44% in the City’s total taxable assessed value.
Annual real property tax revenues to the City of North Port resulting from this new value could range from $2.7 million
per year to $8.6 million per year. This does not include new tax revenue generated for other taxing jurisdictions.
Low High Low High
Gateway 65,710,235$ 328,551,176$ 247,511$ 1,237,554$
South 34,378,439$ 171,892,193$ 129,493$ 647,466$
North 31,331,797$ 156,658,983$ 118,017$ 590,087$
Panacea 195,932,370$ 979,661,848$ 738,018$ 3,690,092$
NE 188,823,070$ 944,115,348$ 711,240$ 3,556,199$
NW 7,109,300$ 35,546,500$ 26,779$ 133,893$
Heron Creek 155,053,379$ 310,106,759$ 584,040$ 1,168,079$
Midway 294,401,108$ 588,802,216$ 1,108,921$ 2,217,841$
The Springs 6,081,936$ 60,819,360$ 22,909$ 229,088$
Total 717,179,028$ 2,267,941,359$ 2,701,398$ 8,542,655$
Estimated Taxable Assessed ValueDevelopment
Area
Estimated Annual Property Tax
Revenue
Estimated Taxable Assessed Value and Property Tax Revenue at Full Buildout
Use Type
Assessed
Value per SF
Medium Density
Residential100$
High Density
Residential150$
General Office 100$
Retail/Services 100$
Restaurant 120$
Medical Office 170$
Hotel 100$
Manufacturing /
General Industrial85$
Warehouse /
Distribution85$
Estimated Assessed Value
per SF of Real Property by
Use Type

12 | P a g e
City of North Port, FL
4. Estimate One-Time Impact Fee Revenue. Estimated impact fee revenue was calculated based on full buildout by use type in each development
area. Impact fees for each use type were generalized by averaging the more specific use types listed in the City’s schedule of impact fees (fee
schedule effective as of February 10, 2021).2 The impact fee revenues calculated for this analysis should be considered approximate and only used
for planning purposes. These revenues reflect City specific fees; additional County impact fees would also apply.
Total one-time impact fees paid to the City could range from $49 million to $147 million over the course of buildout for each development area.
5. Estimate New Job Creation. Applying average square-feet-per-job multipliers for each use type, we calculated an estimated number of on-site
jobs that would be created in each development area based on use assumptions. New jobs located in these development areas could range from
approximately 4,800 under the lower buildout scenario to 18,200 under the higher buildout scenario. This would represent an increase of about
47% to 178% over North Port’s current jobs base of approximately 10,200 jobs.
2 Note that this Fee Schedule does not include Water and Wastewater Capacity Fees. Those fees would be collected in addition to what is calculated in Step 4.
Use TypeTotal Impact Fees per
1,000 SF (North Port)
Medium Density Residential $ 5,417
High Density Residential $ 5,437
General Office $ 6,117
Retail / Services $ 10,125
Restaurant $ 30,961
Medical Office $ 15,722
Hotel $ 2,710
Manufacturing / General
Industrial $ 2,021
Warehouse / Distribution $ 1,867
Estimated Impact Fees by Use Type
Source: Generalized from City of North Port Impact Fee
Schedule
Development
AreaLow High
Gateway 7,611,163$ 38,055,815$
South 3,982,027$ 19,910,133$
North 3,629,136$ 18,145,682$
Panacea 6,731,853$ 33,659,267$
NE 5,928,875$ 29,644,374$
NW 802,978$ 4,014,892$
Heron Creek 13,101,009$ 26,202,018$
Midway 20,987,774$ 41,975,548$
The Springs 720,475$ 7,204,748$
Total 49,152,274$ 147,097,396$
Estimated One-Time Impact Fee Revenues to
City

13 | P a g e
City of North Port, FL
Findings In assessing which infrastructure projects to proceed with, the City can consider the cost of each project
relative to the amount of new developable land that would be unlocked and new buildout that could be
supported because of having public sewer and water access. Three of the five priority development
areas would require some level of sewer and water investment to realize their full development
potential and optimize fiscal benefits and new job creation within the City. Water and sewer
construction costs are intended to be conceptual estimates that may vary based on characteristics of
individual sites. The estimates include the cost to run water and sewer lines to the site but do not
include onsite work.
Gateway – Extension of sewer and water along Sumter Boulevard to serve Gateway South parcels
would cost an estimated $3.9 million. Further extending utilities northward across I-75 to serve
Gateway North parcels would cost an additional $1.9 million, for a total cost of $5.8 million.
(Estimates derived from conversations with Utilities)
Panacea – Extension of sewer and water along Toledo Blade Boulevard to serve parcels north of
I-75 would cost an estimated $3.38 million. (Estimates derived from conversations with Utilities)
The Springs – Extension of utilities to serve The Springs would cost an estimated $1.4 million.
(Estimates derived from Preliminary Order of Magnitude Costs from April 2019, adjusted for
inflation.)
Examining the ratio of potential new assessed value at full buildout to the cost to extend utilities to each
development area is one way to analyze costs and benefits of undertaking an infrastructure project. As
shown in the table, extending utilities to the Panacea development area generates the most “bang” for
the City’s investment given the relatively short distance over which utilities would need to be extended
and the large amount of land that would be unlocked for development. For every $1 spent on
infrastructure, the City would add between $58 and $290 of taxable assessed value to its tax rolls that
would generate annual property tax revenue and pay one-time impact fees. Utility extensions to
Gateway South would add $9-$44 of taxable assessed value per $1 of infrastructure investment.
Considered as a single project, Gateway South and North would add $11-$57 of taxable value per $1 of
infrastructure investment. The Springs would likely be the least lucrative from a fiscal perspective,
generating $4-$43 of taxable value per $1 of investment.
Use TypeEst. Square
Feet per Job
General Office 600
Retail / Services 920
Restaurant 560
Medical Office 550
Hotel 2,500
Manufacturing / General
Industrial 1,500
Warehouse / Distribution 1,500
Source: US Energy Information
Administration
Estimated Job Creation by Use
Type
Development Area Low High
Gateway 807 4,035
South 422 2,111
North 385 1,924
Panacea 1,946 9,732
NE 1,860 9,298
NW 87 434
Heron Creek 856 1,712
Midway 1,118 2,237
The Springs 46 462
Total 4,774 18,178
Estimated Job Creation

14 | P a g e
City of North Port, FL
Next Steps Working to advance the build out of these study areas in a way that is fiscally responsible and contributes to North Port’s economic vibrancy is a
lofty goal that will take coordination across City Commissioners, City departments, and regional entities. In addition to strategies presented in the
Action Plan Matrix, next steps include:
• Continue to develop relationships with property owners. As market opportunities arise, it is critical that the city has a point of contact
for study areas that have development potential.
• Advance plans for utility build out. While complete build out of utilities is unrealistic based on the other many priorities of the city,
continuing to seek partnerships and innovative funding strategies will ensure the city can capitalize on market opportunities for residents
and businesses.
• Consider purchasing parcels in study areas to retain site control. This option would be best suited for the study areas in Heron Creek
or Midway where the city could retain control of the land and develop marketing materials to demonstrate the potential for each of these
sites.
Site Specific Considerations
• Heron Creek/Midway: The effort to develop a mixed-use downtown is not likely to solely be driven by the private sector and will require
the city to work with a developer to envision the opportunity. Communicating with available data, visuals and other success stories in the
city will help to advance this concept.
• The Springs: Developing a tourism node on the west side of the city will capture the visitors of CoolToday Park and Warm Mineral
Springs. Continuing to focus on elements that will foster this node will support the city’s destination development and support the
individual businesses that thrive on visitation. While the cost to build out utilities to the parcels in The Springs is relatively high due to the
limited total buildout potential on the small parcels, the overall contributions to the city’s economy are valuable. With the overlap of the
federal Opportunity Zone, marketing these opportunities to relevant investor audiences could support development on the parcels
indicated on pg. 8 and potentially enhance offerings onsite at Warm Mineral Springs. See the Action Plan Matrix for more.
Low High Low High
Gateway South 3,900,000$ 34,378,439$ 171,892,193$ 9$ 44$
Gateway South and North 5,800,000$ 65,710,235$ 328,551,176$ 11$ 57$
Panacea (North of 75) 3,380,000$ 195,932,370$ 979,661,848$ 58$ 290$
The Springs 1,410,785$ 6,081,936$ 60,819,360$ 4$ 43$
Estimated New Taxable Assessed
Value (Potential at Full Buildout)
New Taxable Assessed Value per
$1 of New Water/Sewer InvestmentEstimated Cost to
Extend Water/SewerDevelopment Area

15 | P a g e
City of North Port, FL
APPROACH TO FINANCING UTILITY AND
INFRASTRUCTURE PROJECTS The City maintains a 5-year Capital Improvement Plan (CIP) that lays out the anticipated expenditures for capital projects across the city in that time
frame. The most current plan is 2021-2025. This plan must align with the Comprehensive Plan and future planning needs. Projects may be added or
taken off the CIP by the City Commission over the life span of the plan. To finance large scale infrastructure projects, the city relies on a combination
of taxes, fees, grants, and debt financing. Financing packages are highly dependent on the project at hand and will be formulated by the parties
involved in the development project. Unlocking the potential in the study areas will greatly depend on the ability of the City to explore and advance
financing packages.
Capital projects will likely still rely on the components that the city has used before, and there is potential to explore alternative financing methods.
Each source offers a strength and a weakness, and the appropriate outcome will be based on the political, community, and fiscal climate. More detail
on each of these methods can be found in Appendix V.
Traditional Methods of Local Infrastructure Financing
Strengths Challenges
Taxation • General taxes employ large tax bases and
generally predictable tax revenues.
• Special tax revenues protect local infrastructure
projects from competition from other uses of
funds during the annual appropriation process.
• Some consider general taxes (such as local sales tax) to be
regressive, citing that they may impose a larger cost burden
on low-income populations.
• These may face considerable public resistance and take
longer to get funding approved.
• Some special revenue fund sources may be volatile and
unpredictable, leaving municipalities to find other funds if
sources do not meet expectations.
• Earmarking special funds may restrict future flexibility in the
annual appropriation process.
User Charges • Recovers partial or full costs of the consumed
government services through end-users.
• Can be used to influence consumers’ choices to
align with broader strategic planning and goals.
• Some consider that user charges to be regressive, citing they
may impose a larger cost burden on low income
populations.
Capital Reserves and
Fund Balances
• Preserves flexibility in future operating and
capital budgets by avoiding debt financing.
• Raising adequate reserves for large projects can take time
and dedicated resources across multiple administrations.
16 | P a g e
City of North Port, FL
Federal/State/County
Grants
• Allow for access to additional capital and
enable local governments to fund needed
capital projects.
• Can sometimes be less stable and predictable, making it
harder for municipalities to do long-term capital planning.
• Can have their own policy goals and priorities in designing
grant programs.
• Often restrict what recipients can use funding for.
• Don’t provide funding for long term maintenance,
potentially leading to a larger burden on local governments
to set up appropriate funds to maintain infrastructure.
Loan Financing • Can be used if a municipality has limited access
to the municipal bond market or can’t afford
the costs of a municipal bond issuance.
• Higher cost of capital than municipal bond financings due to
higher interest rates and less favorable terms for
municipalities.
GO Bond Financing • Exempt from federal income taxes,
municipalities can obtain lower interest rates
compared to loan financings significantly
reducing the debt costs of issuing bonds.
• Can be subject to constitutional debt limits.
• Require voter approval.
• Impose a debt obligation on future taxpayers and limit
budget flexibility in future years.
Revenue Bond
Financing
• Most revenue bonds are not subject to
constitutional debt limits. They do require a
public vote.
• Higher risk than GO Bonds due to the uncertainty of
generated revenues, which makes the cost of capital higher
for municipalities.
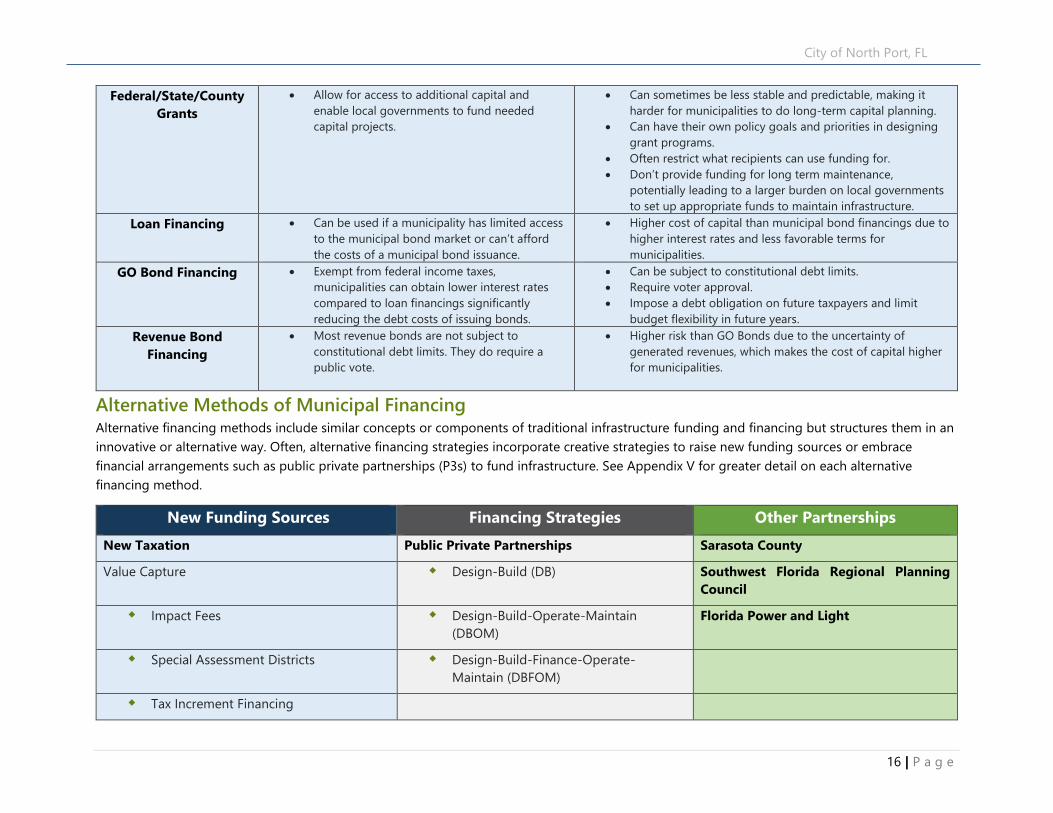
Alternative Methods of Municipal Financing Alternative financing methods include similar concepts or components of traditional infrastructure funding and financing but structures them in an
innovative or alternative way. Often, alternative financing strategies incorporate creative strategies to raise new funding sources or embrace
financial arrangements such as public private partnerships (P3s) to fund infrastructure. See Appendix V for greater detail on each alternative
financing method.
New Funding Sources Financing Strategies Other Partnerships
New Taxation Public Private Partnerships Sarasota County
Value Capture Design-Build (DB) Southwest Florida Regional Planning
Council
Impact Fees Design-Build-Operate-Maintain
(DBOM)
Florida Power and Light
Special Assessment Districts Design-Build-Finance-Operate-
Maintain (DBFOM)
Tax Increment Financing

17 | P a g e
City of North Port, FL
APPENDIX I – V
Appendix I: Workforce Alignment with Target Industries
Appendix II: Economic Inventory
Appendix III: Real Estate Inventory Report
Appendix IV: Interview Themes
Appendix V: Infrastructure Funding Approaches
Appendix VI: Acknowledgements

1 | P a g e
City of North Port, FL
APPENDIX I – WORKFORCE ALIGNMENT WITH
TARGET INDUSTRIES Background To identify common occupations and workforce feasibility trends in North Port and the surrounding region, the top ten occupations by total jobs
within three industry clusters were identified and analyzed. These industry clusters include:
Hospitality and Tourism
Distribution and Logistics
Light Industrial, Manufacturing, and Construction
Each industry cluster is made up of multiple industries within each
focus area. For example, the hospitality and tourism industry cluster
is made up of occupations in industries such as spectator sports,
scenic sightseeing and transportation, traveler accommodation, and
personal care services, etc.
The distribution and logistics industry cluster is made up of
occupations in industries such as general freight trucking, freight
transportation arrangement, warehousing, and storage, etc.
The light industrial, manufacturing, and construction industry cluster
is made up of occupations within industries such as food and
beverage manufacturing, pharmaceutical and medicine
manufacturing, residential and non-residential construction, medical
equipment manufacturing, etc.
In addition to looking at industry trends in North Port, the city’s
laborshed (a region within a 60-minute drive time) was also analyzed
to get a regional perspective on workforce and industry alignment.
NORTH PORT, FL LABORSHED (60MIN DRIVE-TIME)
Source:

2 | P a g e
City of North Port, FL
Hospitality and Tourism Industry Cluster
JOBS, RESIDENT WORKERS, & NET COMMUTERS
The following tables includes job, resident worker, and commuter data related to the top ten occupations within the hospitality and tourism
industry cluster in North Port and North Port’s laborshed. In the table above, “concentration” refers to how prevalent the top 10 occupations in this
industry are in North Port compared to other regions across the country. A value over 1 indicates above average concentration of occupations.
Educational completions refers to the number of degrees conferred in programs relevant to the industry.
Resident worker data are presented in terms of where workers live rather than where they work. For example, though North Port has 58 exercise
trainers and group fitness instructors living in the city, there are only 26 exercise trainers and group fitness instructors working within the city, with
the remaining 32 commuting outside the city for work. These data are helpful in demonstrating workforce availability and helping companies and
communities locate the talent they need.
Office clerks were the most common occupation in North Port, corresponding with the occupation’s presence across a variety of tourism
and hospitality industries. Secretaries and administrative assistants (except legal/medical/and executive), hairdressers, hairstylists, and
cosmetologists; chief executives; and exercise trainers and group fitness instructors are other examples of top occupations in the industry
cluster in North Port.
The top ten occupations in the hospitality and tourism industry cluster in North Port represent 3% of jobs within these occupations in North
Port’s laborshed.
Approximately 60% of North Port’s resident workers were commuting outside of the city for work.
At $16.22/hr the cost of labor in North Port is below the national median of $17.14/hr.
2020 Jobs Concentration Median Earnings Educational Completions
North Port, FL 530 1.09 $16.22/hr 0
North Port, FL Laborshed 34,421 1.33 $14.77/hr 488
Summary of Top 10 Occupations - Hospitality & Tourism

3 | P a g e
City of North Port, FL
Occupation Description2020
Jobs
2020 Resident
Workers
2020 Net
Commuters
Waiters and Waitresses 7,752 9,452 (1,700)
Landscaping and Groundskeeping Workers 5,652 5,633 19
General and Operations Managers 5,609 6,038 (430)
Maintenance and Repair Workers, General 4,208 4,631 (423)
Maids and Housekeeping Cleaners 3,283 4,319 (1,037)
Receptionists and Information Clerks 2,983 3,520 (536)
Hairdressers, Hairstylists, and Cosmetologists 2,231 2,315 (84)
Amusement and Recreation Attendants 1,253 1,340 (87)
Exercise Trainers and Group Fitness Instructors 937 1,049 (112)
Massage Therapists 513 592 (79)
Total 34,421 38,889 (4,468)
North Port, FL Laborshed Top 10 Occupations - Hospitality & Tourism
Source: EMSI
Occupation Description2020
Jobs
Percent of 2020
Laborshed Jobs
2020 Resident
Workers
2020 Net
Commuters
Office Clerks 226 3% 630 (404)
Secretaries and Administrative
Assistants, Except Legal, Medical, and
Executive
143 3% 420 (277)
Hairdressers, Hairstylists, and
Cosmetologists71 3% 132 (61)
Chief Executives 27 3% 63 (36)
Exercise Trainers and Group Fitness
Instructors26 3% 58 (32)
Massage Therapists 16 3% 35 (18)
Manicurists and Pedicurists 12 4% 17 (5)
Writers and Authors <10 <1% <10 N/A
Sound Engineering Technicians <10 <1% 0 N/A
Photographers <10 <1% 11 N/A
Total 530 3% 1,371 (841)
North Port, FL Top 10 Occupations - Hospitality & Tourism
Source: EMSI

4 | P a g e
City of North Port, FL
EDUCATION AND EXPERIENCE
The following figures include job, education, and experience data related to the top ten occupations within the hospitality and tourism industry
cluster in North Port and North Port’s laborshed.
The most common occupations in North Port and North Port’s laborshed require minimal formal education or work experience.
Only one occupation in North Port (chief executives) and one occupation in North Port’s laborshed (general and operations managers)
require a degree from a postsecondary educational institution.
2020 Jobs Education Experience
Office Clerks 226 High school diploma or equivalent None
Secretaries and Administrative
Assistants, Except Legal, Medical, and
Executive
143 High school diploma or equivalent None
Hairdressers, Hairstylists, and
Cosmetologists71 Postsecondary nondegree award None
Chief Executives 27 Bachelor's degree 5 years or more
Exercise Trainers and Group Fitness
Instructors26 High school diploma or equivalent None
Massage Therapists 16 Postsecondary nondegree award None
Manicurists and Pedicurists 12 Postsecondary nondegree award None
Writers and Authors <10 Bachelor's degree None
Sound Engineering Technicians <10 Postsecondary nondegree award None
Photographers <10 High school diploma or equivalent None
Source: EMSI
North Port, FL Top 10 Occupations - Hospitality & Tourism

5 | P a g e
City of North Port, FL
2020 Jobs Education Experience
Waiters and Waitresses 7,752 No formal educational credential None
Landscaping and Groundskeeping Workers 5,652 No formal educational credential None
General and Operations Managers 5,609 Bachelor's degree 5+ years
Maintenance and Repair Workers, General 4,208 High school diploma or equivalent None
Maids and Housekeeping Cleaners 3,283 No formal educational credential None
Receptionists and Information Clerks 2,983 High school diploma or equivalent None
Hairdressers, Hairstylists, and Cosmetologists 2,231 Postsecondary nondegree award None
Amusement and Recreation Attendants 1,253 No formal educational credential None
Exercise Trainers and Group Fitness Instructors 937 High school diploma or equivalent None
Massage Therapists 513 Postsecondary nondegree award None
Source: EMSI
North Port, FL Laborshed Top 10 Occupations - Hospitality & Tourism

6 | P a g e
City of North Port, FL
Distribution and Logistics
JOBS, RESIDENT WORKERS, & NET COMMUTERS
The following tables includes job, resident worker, and commuter data related to the top ten occupations within the distribution and logistics
industry cluster in North Port and North Port’s laborshed. In the table above, “concentration” refers to how prevalent the top ten occupations in
this industry are in North Port compared to other regions across the country. A value over 1 indicates above average concentration of occupations.
Educational completions refers to the number of degrees conferred in programs relevant to the industry.
Laborers and freight, stock, and material movers were the most common occupation in the industry cluster in North Port. First-line supervisors
of office and administrative support workers; heavy and tractor-trailer truck drivers; sales representatives, wholesale and manufacturing,
except technical and scientific products; and sales representatives of services, except advertising, insurance, financial services are other
examples of top occupations in North Port’s distribution and logistics industry cluster.
The top ten occupations in the distribution and logistics industry cluster in North Port represent 2% of jobs within these occupations in North
Port’s laborshed.
Approximately 65% of North Port’s resident workers were commuting outside of the city for work.
At $20.44/hr the cost of labor in North Port is below the national median of $22.68/hr.
2020 Jobs Concentration Median Earnings Educational Completions
North Port, FL 568 0.75 $20.56/hr 0
North Port, FL Laborshed 31,868 0.99 $14.63/hr 0
Summary of Top 10 Occupations - Distribution and Logistics

7 | P a g e
City of North Port, FL
Occupation Description2020
Jobs
Percent of 2020
Laborshed Jobs
2020 Resident
Workers
2020 Net
Commuters
Laborers and Freight, Stock, and
Material Movers, Hand112 2% 346 (234)
First-Line Supervisors of Office and
Administrative Support Workers104 3% 282 (178)
Heavy and Tractor-Trailer Truck
Drivers91 3% 220 (129)
Sales Representatives, Wholesale and
Manufacturing, Except Technical and
Scientific Products
69 2% 226 (157)
Sales Representatives of Services,
Except Advertising, Insurance, Financial
Services, and Travel
66 3% 189 (124)
Accountants and Auditors 52 2% 154 (102)
Chief Executives 27 3% 63 (36)
First-Line Supervisors of
Transportation and Material Moving
Workers, Except Aircraft Cargo
Handling Supervisors
23 2% 61 (37)
Billing and Posting Clerks 20 2% 84 (64)
Sales Representatives, Wholesale and
Manufacturing, Technical and Scientific
Products
<10 <1% 32 N/A
Total 568 2% 1,657 (1,089)
North Port, FL Top 10 Occupations - Distribution & Logistics
Source: EMSI

8 | P a g e
City of North Port, FL
Occupation Description2020
Jobs
2020 Resident
Workers
2020 Net
Commuters
Customer Service Representatives 6,006 7,702 (1,696)
Laborers and Freight, Stock, and Material
Movers, Hand5,807 5,376 432
Stockers and Order Fillers 5,693 5,970 (276)
Sales Representatives, Wholesale and
Manufacturing, Except Technical and Scientific
Products
3,810 3,438 372
Heavy and Tractor-Trailer Truck Drivers 3,279 3,278 1
Light Truck Drivers 2,722 2,354 368
Packers and Packagers, Hand 1,669 1,566 103
Shipping, Receiving, and Inventory Clerks 1,157 1,154 3
First-Line Supervisors of Transportation and
Material Moving Workers, Except Aircraft Cargo
Handling Supervisors
963 882 82
Industrial Truck and Tractor Operators 761 703 58
Total 31,868 32,422 (554)
North Port, FL Laborshed Top 10 Occupations - Distribution & Logistics
Source: EMSI

9 | P a g e
City of North Port, FL
EDUCATION AND EXPERIENCE
The following includes job, education, and experience data related to the top ten occupations within the distribution and logistics industry cluster
in North Port and North Port’s laborshed.
The most common occupations in North Port and North Port’s laborshed in the distribution and logistics industry cluster require minimal
formal education or work experience.
2020 Jobs Education Experience
Laborers and Freight, Stock, and
Material Movers, Hand112 No formal educational credential None
First-Line Supervisors of Office and
Administrative Support Workers104 High school diploma or equivalent Less than 5 years
Heavy and Tractor-Trailer Truck Drivers 91 Postsecondary nondegree award None
Sales Representatives, Wholesale and
Manufacturing, Except Technical and
Scientific Products
69 High school diploma or equivalent None
Sales Representatives of Services,
Except Advertising, Insurance, Financial
Services, and Travel
66 High school diploma or equivalent None
Accountants and Auditors 52 Bachelor's degree None
Chief Executives 27 Bachelor's degree 5+ years
First-Line Supervisors of Transportation
and Material Moving Workers, Except
Aircraft Cargo Handling Supervisors
23 High school diploma or equivalent Less than 5 years
Billing and Posting Clerks 20 High school diploma or equivalent None
Sales Representatives, Wholesale and
Manufacturing, Technical and Scientific
Products
<10 Bachelor's degree None
Source: EMSI
North Port, FL Top 10 Occupations - Distribution & Logistics

10 | P a g e
City of North Port, FL
2020
Jobs Education Experience
Customer Service Representatives 6,006 High school diploma or equivalent None
Laborers and Freight, Stock, and Material
Movers, Hand5,807 No formal educational credential None
Stockers and Order Fillers 5,693 High school diploma or equivalent None
Sales Representatives, Wholesale and
Manufacturing, Except Technical and Scientific
Products
3,810 High school diploma or equivalent None
Heavy and Tractor-Trailer Truck Drivers 3,279 Postsecondary nondegree award None
Light Truck Drivers 2,722 High school diploma or equivalent None
Packers and Packagers, Hand 1,669 No formal educational credential None
Shipping, Receiving, and Inventory Clerks 1,157 High school diploma or equivalent None
First-Line Supervisors of Transportation and
Material Moving Workers, Except Aircraft Cargo
Handling Supervisors
963 High school diploma or equivalent 5+ years
Industrial Truck and Tractor Operators 761 No formal educational credential None
Source: EMSI
North Port, FL Laborshed Top 10 Occupations - Distribution and Logistics
11 | P a g e
City of North Port, FL
Light Industrial, Manufacturing, and Construction
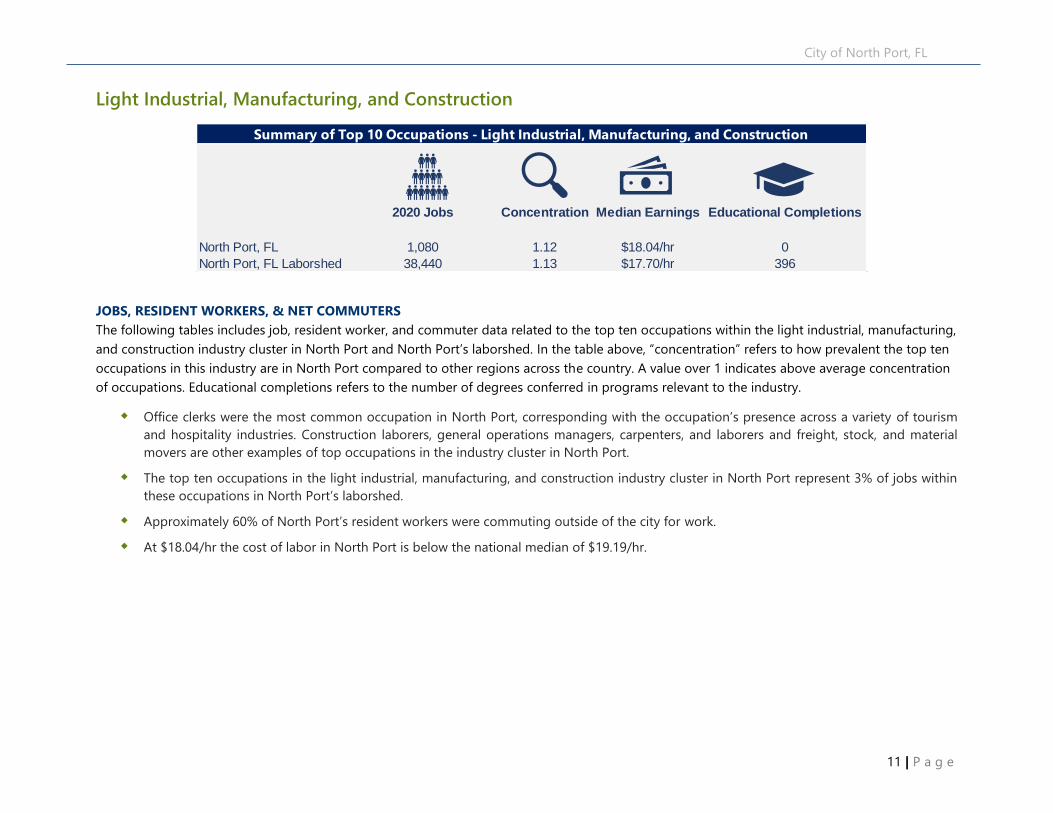
JOBS, RESIDENT WORKERS, & NET COMMUTERS
The following tables includes job, resident worker, and commuter data related to the top ten occupations within the light industrial, manufacturing,
and construction industry cluster in North Port and North Port’s laborshed. In the table above, “concentration” refers to how prevalent the top ten
occupations in this industry are in North Port compared to other regions across the country. A value over 1 indicates above average concentration
of occupations. Educational completions refers to the number of degrees conferred in programs relevant to the industry.
Office clerks were the most common occupation in North Port, corresponding with the occupation’s presence across a variety of tourism
and hospitality industries. Construction laborers, general operations managers, carpenters, and laborers and freight, stock, and material
movers are other examples of top occupations in the industry cluster in North Port.
The top ten occupations in the light industrial, manufacturing, and construction industry cluster in North Port represent 3% of jobs within
these occupations in North Port’s laborshed.
Approximately 60% of North Port’s resident workers were commuting outside of the city for work.
At $18.04/hr the cost of labor in North Port is below the national median of $19.19/hr.
2020 Jobs Concentration Median Earnings Educational Completions
North Port, FL 1,080 1.12 $18.04/hr 0
North Port, FL Laborshed 38,440 1.13 $17.70/hr 396
Summary of Top 10 Occupations - Light Industrial, Manufacturing, and Construction

12 | P a g e
City of North Port, FL
Occupation Description2020
Jobs
Percent of 2020
Laborshed Jobs
2020 Resident
Workers
2020 Net
Commuters
Office Clerks 226 3% 630 (404)
Construction Laborers 165 3% 347 (183)
General and Operations Managers 155 3% 410 (255)
Carpenters 144 4% 261 (117)
Laborers and Freight, Stock, and
Material Movers, Hand112 2% 346 (234)
First-Line Supervisors of Construction
Trades and Extraction Workers90 4% 187 (97)
Sales Representatives, Wholesale and
Manufacturing, Except Technical and
Scientific Products
69 2% 226 (157)
Construction Managers 49 4% 92 (42)
Miscellaneous Assemblers and
Fabricators39 1% 203 (163)
Molding, Coremaking, and Casting
Machine Setters, Operators, and
Tenders, Metal and Plastic
30 10% 36 (6)
Total 1,080 3% 2,737 (1,658)
North Port, FL Top 10 Occupations - Light Industrial, Manufacturing, & Construction
Source: EMSI

13 | P a g e
City of North Port, FL
Occupation Description 2020 Jobs2020 Resident
Workers
2020 Net
Commuters
Office Clerks 7,997 8,562 (565)
Laborers and Freight, Stock, and Material
Movers, Hand5,807 5,376 432
General and Operations Managers 5,609 6,038 (430)
Construction Laborers 4,860 4,959 (99)
Sales Representatives, Wholesale and
Manufacturing, Except Technical and Scientific
Products
3,810 3,438 372
Carpenters 3,507 3,564 (57)
Miscellaneous Assemblers and Fabricators 2,682 2,335 348
First-Line Supervisors of Construction Trades and
Extraction Workers2,455 2,541 (86)
First-Line Supervisors of Production and
Operating Workers1,017 990 27
Welders, Cutters, Solderers, and Brazers 696 679 18
Total 38,440 38,480 (41)
North Port, FL Laborshed Top 10 Occupations - Light Industrial, Manufacturing, &
Construction
Source: EMSI

14 | P a g e
City of North Port, FL
EDUCATION AND EXPERIENCE
The following includes job, education, and experience data related to the top ten occupations within the light industrial, manufacturing, and
construction industry cluster in North Port and North Port’s laborshed.
The most common occupations in North Port and North Port’s laborshed in the distribution and logistics industry cluster require minimal
formal education or work experience.
2020 Jobs Education Experience
Office Clerks 226 High school diploma or equivalent None
Construction Laborers 165 No formal educational credential None
General and Operations Managers 155 Bachelor's degree 5+ years
Carpenters 144 High school diploma or equivalent None
Laborers and Freight, Stock, and
Material Movers, Hand 112 No formal educational credential None
First-Line Supervisors of Construction
Trades and Extraction Workers 90 High school diploma or equivalent 5+ years
Sales Representatives, Wholesale and
Manufacturing, Except Technical and
Scientific Products 69 High school diploma or equivalent None
Construction Managers 49 Bachelor's degree None
Miscellaneous Assemblers and
Fabricators 39 High school diploma or equivalent None
Molding, Coremaking, and Casting
Machine Setters, Operators, and
Tenders, Metal and Plastic 30 High school diploma or equivalent None
Source: EMSI
North Port, FL Top 10 Occupations - Light Industrial, Manufacturing, & Construction

15 | P a g e
City of North Port, FL
2020 Jobs Education Experience
Office Clerks 7,997 High school diploma or equivalent None
Laborers and Freight, Stock, and Material Movers,
Hand5,807
No formal educational credential None
General and Operations Managers 5,609 Bachelor's degree 5+ years
Construction Laborers 4,860 No formal educational credential None
Sales Representatives, Wholesale and Manufacturing,
Except Technical and Scientific Products
3,810
High school diploma or equivalent None
Carpenters 3,507 High school diploma or equivalent None
Miscellaneous Assemblers and Fabricators 2,682 High school diploma or equivalent None
First-Line Supervisors of Construction Trades and
Extraction Workers2,455
High school diploma or equivalent 5+ years
First-Line Supervisors of Production and Operating
Workers1,017
High school diploma or equivalent Less than 5 years
Welders, Cutters, Solderers, and Brazers 696 High school diploma or equivalent None
Source: EMSI
North Port, FL Laborshed Top 10 Occupations - General Light Industrial, Manufacturing, & Construction

i | P a g e
Into the
Economic
Inventory
PREPARED BY:
Submitted to:
City of North Port, FL

City of North Port, FL – Economic Inventory
i | P a g e
CONTENTS Key Takeaways ..................................................................................................................................................................................................... 2
Areas of Study...................................................................................................................................................................................................... 9
Demographic & Socioeconomic profile .................................................................................................................................................. 10
Industry and Occupation Profile ................................................................................................................................................................. 31
Land Use & Regulatory Considerations .................................................................................................................................................. 55
Attachment A: Data Sources ........................................................................................................................................................................ 57

City of North Port, FL – Economic Inventory
1 | P a g e
This page is intentionally blank.
TOC Photo:
1) Change photo to represent RFP/Q geography or
subject matter.
2) Change color: Picture tools ->color -> recolor,
choose dark blue.
3) Size approximately 2.3” x 5”
4) Keep page after TOC blank.

City of North Port, FL – Economic Inventory
2 | P a g e
KEY TAKEAWAYS Industry data, stakeholder interviews, and market research point to the opportunities for North Port to grow and diversify its industry
base. While the market indicates opportunity for North Port, the city's ability to prepare itself for these economic and market shifts will require
targeted efforts on site readiness, which includes build out of utilities.
Over the last 10 years, North Port accounted for over 20% of Sarasota County’s population growth and 2.5% of job growth. In the early
2000s, the population center of the county began to shift south towards North Port, but jobs did not expand in line with the population. Over the
last decade, North Port has been able to grow its job base more in line with its population growth, which is a positive trend. Continuing to nurture
job creating industries will help the city reach a population to jobs ratio that is in line with the county.
Showcasing the city’s sizeable workforce as an opportunity for growing or attracting new companies will be a key message for business
development. North Port's workforce and growing population are a positive economic sign. North Port’s resident workers include positions in
Office and Administrative Support, Sales, Healthcare, and a variety of other positions. Currently, these residents most often leave the city and
support the regional economy in other employment bases. Leveraging the skillsets of these workers and targeting which subsectors will thrive
could be an attractive value proposition for the city.
Supporting business growth will require a holistic view of economic development that includes workforce, housing, and building a sense
of place. North Port’s housing boom geographical location between the employment centers of Sarasota and Bradenton and along the I-75
corridor make it an ideal “bedroom community” location. While the city has a claim to many new housing opportunities, its case for growing as an
employment center will need to include solutions to transportation, workforce training, business resources and generally building a definable sense
of place that will stand out among the region’s competitors.
While the city offers a range of more traditional economic development assets - efforts to develop and support a dynamic downtown will
be essential to attracting workforce as remote-work becomes ubiquitous. North Port does not offer a distinct “sense of place” like the City of
Venice or the City of Sarasota, which will make it a challenge to attract professionals or tech entrepreneurs who want to build their business
ventures around a certain lifestyle.
The Wellen Park development, as well as other smaller redevelopments, is an opportunity to reframe the perceptions of North Port and
what it can offer in terms of a “live/work/play” environment. Recent developments have capitalized on market trends that support health and
wellness, walkability, and community meeting spots. These notable developments are an opportunity to show that North Port has a range of
modern housing options that can attract business owners or employees who want North Port’s quality of life with dynamic communities.
North Port generally has adequate space for development; however, sites are not shovel ready. Without the appropriate space and
infrastructure to expand, relocate, or start-up, business development will be slow to occur in North Port. Activity Centers 1, 2, 5, 7 are generally well
served by utilities. There are ongoing conversations at the City about the build-out of utilities to accommodate residential growth and to support

City of North Port, FL – Economic Inventory
3 | P a g e
business development in key locations in the Activity Centers. Additional analysis and input through this planning process will help Camoin identify
which Activity Centers show the greatest potential, based on anticipated industry growth. The subsequent real estate analysis will determine the
characteristics of regional sites that North Port is competing with and what market factors the city can leverage to boost its standing in the
regional market.
North Port’s largest industries like government, retail trade, and construction, are “non-tradable sectors,” meaning they do not introduce
new spending into the economy. Rather those industries circulate money within the community. North Port’s substantial population growth
has fueled a construction industry cluster that includes everything from interior design to cement to lumber and furniture production. There may
be opportunities to expand other manufacturing subsectors based on this strength in construction, especially with the availability of land in the
Activity Centers. Other industry opportunities that will be further investigated in additional research and follow up include warehousing and
logistics or medical equipment manufacturing. Additionally, support for sectors that will help grow the city’s sense of place and vibrancy will also
contribute to the North Port’s attractiveness to workforce and businesses, including arts, entertainment, and recreation.
The market shifts around COVID-19 and working from home will have lasting impacts on how and where businesses decide to do
operate. An October Gallup poll found that a third of the American workforce was “always” working remotely, and another quarter said they were
working remotely “sometimes.”[1] Adjusting expectations for office workers and the growth of home-based businesses will be critical to include in
the Unified Land Development Code review process to ensure that code regulations are in line with shifting workforce dynamics.
[1] https://www.areadevelopment.com/workplace-trends/Q4-2020/expanded-incentives-support-growth-in-remote-work.shtml

City of North Port, FL – Economic Inventory
4 | P a g e
DATA TRENDS & ECONOMIC IMPLICATIONS: SOCIOECONOMIC TRENDS
DATA TRENDS
North Port’s population grew by 46,200 residents (a 213%
change) from 2000 to 2020 while North Port added 2,000
jobs over that same time (a 25% change).
Population growth has significantly outpaced job growth in
North Port over the last two decades. In 2000, North Port
had about 3 residents to every 1 job, while in 2020 that
number increased to 7 residents to every 1 job. That’s over
twice the rate of Sarasota County and the Regional Study
Area.
Existing jobs in North Port are primarily concentrated in the
Government, Retail Trade, and Construction industries.
These industries are key contributors to North Port’s gross
regional product and economy.
North Port has seen job growth of approximately 8% over
the last five years.
With a median age of 45yrs, North Port has a younger
population than Sarasota County (57ys).
North Port is a net exporter of jobs and has over 10 times
as many workers commuting in-or-out of the City,
compared to those that both live and work in North Port.
ECONOMIC IMPLICATIONS
High levels of local and regional population growth in
recent decades coupled with a young existing
workforce indicate a strong existing and future
workforce for industries to draw from.
There are limited job opportunities for high skill
regional workers in North Port.
There is competition from the regional workforce that
holds higher educational attainment levels.
There is opportunity to leverage regional assets and
workforce within the Healthcare and Social Assistance
industry.
The growth in the construction industry coupled with
population projections may present increased
opportunities for industry growth.

City of North Port, FL – Economic Inventory
5 | P a g e
DATA TRENDS & ECONOMIC IMPLICATIONS: HOUSEHOLD INCOMES AND HOUSING STOCK
DATA TRENDS
Median household income in North Port
($60,850) is slightly lower than Sarasota County,
but slightly higher than the region.
North Port’s housing stock is relatively new, with
most units being built between 2000 and 2010.
The median sale price of a single-family
residence in North Port in 2020 is $248,000,
which is 18% lower than the median sale price in
Sarasota County.
The median sale price of a single-family
residence in North Port increased from
$170,000 in 2015 to $248,000 in 2020, a 46%
change. The median sale price increased by
36% in Sarasota County from 2015 to 2020.
ECONOMIC IMPLICATIONS
Lower housing prices compared to the region
make North Port attractive, but if job
opportunities are not present then there is risk of
losing the associated workforce to the region.
Lower housing prices and regionally competitive
median household incomes give North Port
residents higher purchasing power.
Increased future growth in home prices at
existing rates may make surrounding
communities equally attractive for workforce
attraction.

City of North Port, FL – Economic Inventory
6 | P a g e
CITY OF NORTH PORT ACTIVITY CENTER OVERVIEW
NAME Current Uses Site Readiness /
Utility Availability
Vision/Development Opportunities
ACTIVITY
CENTER #1
MEDITERRANEA
Older commercial areas, housing,
lodging
Utilities generally available Back office space, waterfront restaurant, 60 acres
undeveloped
ACTIVITY
CENTER #2
HERON CREEK
Residential, government, recreation,
within proximity to a community park
and school campus area, near
Performing arts center
Utilities available in all four
corners
Commercial and residential build-out
ACTIVITY
CENTER #3
GATEWAY
No development No water, no sewer – Coming
soon to south side
Utilities needed on north side
to make development
desirable
Property owners open to development on
northern portion; utilities may spur development
SE quadrant is owned by hospital but no recent
development activity, no potential for future
buildout
ACTIVITY
CENTER #4
PANACEA
Industrial complex at south end, north
side contains technical college
Sites are not shovel ready 800,000 SF of industrial entitlement, good fit for
manufacturing, light industrial, warehousing,
distribution
ACTIVITY
CENTER #5
MIDWAY
King Plastic, retail, relatively
undeveloped
Served by utilities; current
owner and city staff
supportive of realignment of
road and keeping main
access points.
260 residential market rate apartments, future
Wawa development
ACTIVITY
CENTER #6
THE SHIRE
Master Plan for this area currently
underway; one primary property
owner; goal to provide direct I-75
access with a new highway interchange
No sewer, electric on NE of I-
75, interchange, and utility
extension.
Potential to fill gaps in what city can currently
offer elsewhere
City of North Port, FL – Economic Inventory
7 | P a g e
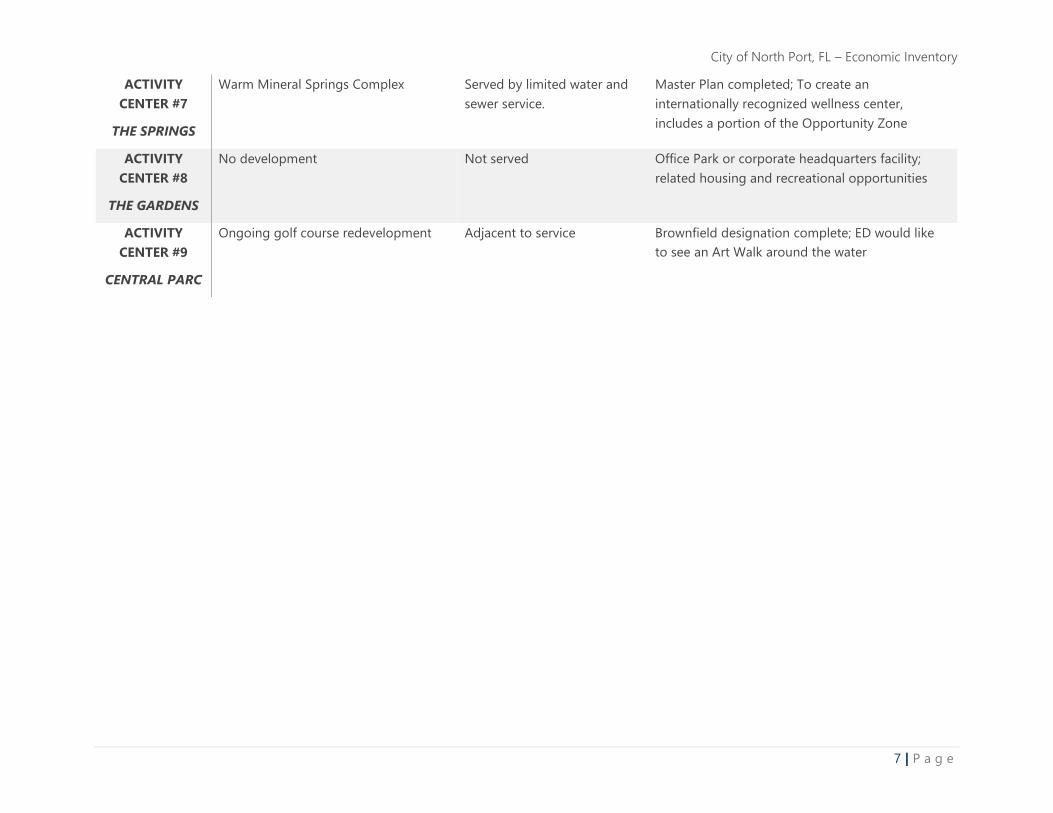
ACTIVITY
CENTER #7
THE SPRINGS
Warm Mineral Springs Complex Served by limited water and
sewer service.
Master Plan completed; To create an
internationally recognized wellness center,
includes a portion of the Opportunity Zone
ACTIVITY
CENTER #8
THE GARDENS
No development Not served Office Park or corporate headquarters facility;
related housing and recreational opportunities
ACTIVITY
CENTER #9
CENTRAL PARC
Ongoing golf course redevelopment Adjacent to service Brownfield designation complete; ED would like
to see an Art Walk around the water

City of North Port, FL – Economic Inventory
8 | P a g e

City of North Port, FL – Economic Inventory
9 | P a g e
AREAS OF STUDY The following analyses were conducted to identify demographic, socioeconomic, business, and industry trends in North Port. In addition to data
specific to North Port, data were also collected and analyzed for Sarasota County; a ‘Regional Study Area’ that includes Sarasota, Manatee, DeSoto,
and Charlotte Counties; the State of Florida, and the United States.
REGIONAL STUDY AREA (SARASOTA COUNTY, MANATEE COUNTY, CHARLOTTE COUNTY, & DESOTO COUNTY)

City of North Port, FL – Economic Inventory
10 | P a g e
DEMOGRAPHIC & SOCIOECONOMIC PROFILE

City of North Port, FL – Economic Inventory
11 | P a g e
DEMOGRAPHIC AND SOCIOECONOMIC PROFILE: METHODOLOGY
SUMMARY
As part of the initial research for the City of North Port, Camoin 310 gathered and analyzed demographic and socioeconomic data to assess the
historic and existing conditions in the region. This information will be used to inform the subsequent steps of the planning process. While the City
of North Port was the primary focus of this analysis, other statistics were also included for Sarasota County, the Regional Study Area, the State of
Florida, and the United States.
DATA SOURCES
Esri Business Analyst Online (Esri)
Esri is the leading provider of location-driven market insights. It combines demographic, lifestyle, and spending data with map-based analytics to
provide market intelligence for strategic decision-making. ESRI uses proprietary statistical models and data from the U.S. Census Bureau, the U.S.
Postal Service, and various other sources to present current conditions and project future trends. Esri data are used by developers to maximize
their portfolio, retailers to understand growth opportunities, and by economic developers to attract business that fits their community. For more
information, visit www.esri.com.
OnTheMap, U.S Census
OnTheMap is a tool developed through the U.S. Census Longitudinal Employer-Household Dynamics (LEHD) program that helps to visualize Local
Employment Dynamics (LED) data about where workers are employed and where they live. There are also visual mapping capabilities for data on
age, earnings, industry distributions, race, ethnicity, educational attainment, and sex. The OnTheMap tool can be found here, along with links to the
documentation: http://onthemap.ces.census.gov/.
Florida Office of Economic & Demographic Research (EDR)
The Office of Economic and Demographic Research (EDR) is a research arm of the Florida Legislature principally concerned with forecasting
economic and social trends that affect policy making, revenues, and appropriations. More information about EDR can be found here:
http://www.edr.state.fl.us/Content/index.cfm.
United States Census Bureau Database
The United States Census Bureau is the federal government’s largest statistical agency dedicated to providing current facts and figures about
America’s people, places, and economy. The Census Bureau's mission is to serve as the nation’s leading provider of quality data about its people
and economy. More information can be found here: https://data.census.gov/cedsci/

City of North Port, FL – Economic Inventory
12 | P a g e
DEMOGRAPHIC & SOCIOECONOMIC PROFILE: KEY FINDINGS
POPULATION GROWTH
North Port’s population grew by 213% or approximately 48,600 people from 2000 to 2020, with a majority (75%) of growth
occurring between 2000 and 2010.
North Port’s population grew almost 10x more than the populations of Sarasota and Venice from 2000 to 2020.
Population growth rates in Sarasota County and the Regional Study Area were 10-15 percentage points higher than growth in
the United States from 2000 to 2020 and are forecasted to outpace national population growth by 5 percentage points or
more from 2020 to 2040.
North Port accounted for 16% of Sarasota County’s population in 2020, but 42% of its population growth since 2000.
The average annual population percent change in North Port from 2000 to 2020 was 6%, which is 4x larger than the average
annual rates in Sarasota County, Regional Study Area, and Florida.
POPULATION CHARACTERISTICS
North Port is a younger city compared to the surrounding region, with a median age of 45 years old, but older than the State
of Florida and United States.
Twenty-five percent of North Port’s population is in the retirement age group, as opposed to 40% in Sarasota County. North
Port has a larger share of its population in the Working Age (20-54yrs) and Nearing Retirement (55-64yrs) age groups
compared to the region.
Educational attainment levels in North Port generally align with trends at the regional and state level.

City of North Port, FL – Economic Inventory
13 | P a g e
DEMOGRAPHIC & SOCIOECONOMIC PROFILE: KEY FINDINGS
POPULATION CHARACTERISTICS (CONTINUED)
The population in North Port is less diverse than the region and state but is similar to the county and region with a
majority of the population identifying as white, followed by Hispanic and Black/African American.
COMMUTER CHARACTERISTICS
Almost 90% of North Port residents commuted outside of North Port for work, and North Port imported about a
third of its workforce from outside communities.
HOUSEHOLD INCOME
In 2020, the median household income in North Port is $60,844, which is slightly below the median income in
Sarasota County at $62,322, and slightly higher than the Regional Study Area at $58,495.
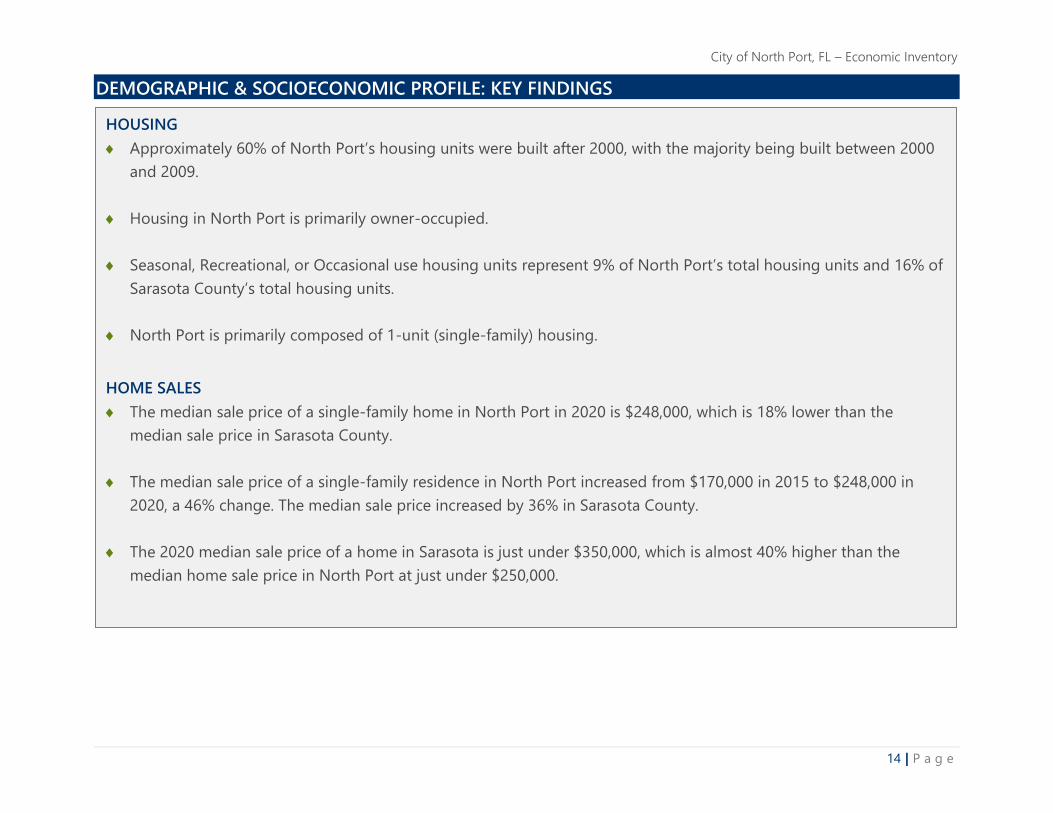
City of North Port, FL – Economic Inventory
14 | P a g e
DEMOGRAPHIC & SOCIOECONOMIC PROFILE: KEY FINDINGS
HOUSING
Approximately 60% of North Port’s housing units were built after 2000, with the majority being built between 2000
and 2009.
Housing in North Port is primarily owner-occupied.
Seasonal, Recreational, or Occasional use housing units represent 9% of North Port’s total housing units and 16% of
Sarasota County’s total housing units.
North Port is primarily composed of 1-unit (single-family) housing.
HOME SALES
The median sale price of a single-family home in North Port in 2020 is $248,000, which is 18% lower than the
median sale price in Sarasota County.
The median sale price of a single-family residence in North Port increased from $170,000 in 2015 to $248,000 in
2020, a 46% change. The median sale price increased by 36% in Sarasota County.
The 2020 median sale price of a home in Sarasota is just under $350,000, which is almost 40% higher than the
median home sale price in North Port at just under $250,000.

City of North Port, FL – Economic Inventory
15 | P a g e
POPULATION GROWTH: NORTH PORT
The figure below outlines population growth in North Port from 2000 to 2020, in addition to Sarasota and Venice for
comparison purposes.
North Port’s population grew by 213%, or approximately 48,600 people from 2000 to 2020, with a majority (75%) of
growth occurring between 2000 and 2010.
Source: The Florida Office of Economic & Demographic Research

City of North Port, FL – Economic Inventory
16 | P a g e
POPULATION GROWTH (ANNUAL PERCENT POPULATION CHANGE): REGIONAL COMPARISON
The average annual population percent change in North Port from 2000 to 2020 was 6%, which is 4x larger than the
average annual rates in Sarasota County, Regional Study Area, and Florida.
North Port accounted for 16% of Sarasota County’s population in 2020, but 42% of its population growth since 2000.
Source: The Florida Office of Economic & Demographic Research

City of North Port, FL – Economic Inventory
17 | P a g e
POPULATION GROWTH: REGIONAL COMPARISON
The figure below outlines historic and forecasted regional population growth trends from 2000 to 2040*.
Percent population growth rates in Sarasota County and the Regional Study Area were 10-15 percentage points
higher than growth in the United States from 2000 to 2020 and are forecasted to outpace national population
growth by 5 percentage points or more from 2020 to 2040. *Note: The Florida Office of Economic & Demographic Research only provides population forecasts on a State and County by County basis.
Source: The Florida Office of Economic & Demographic Research

City of North Port, FL – Economic Inventory
18 | P a g e
POPULATION CHARACTERISTICS (MEDIAN AGE): REGIONAL COMPARISON
The following heat map outlines median age ranges by census tract within the Regional Study Area.
North Port is younger than the surrounding region with a median age of 45, while the median age in Sarasota
County and Regional Study Area were 57yrs and 54yrs, respectively.
North Port is generally older than the State of Florida and U.S, who have median ages of 43 and 39, respectively.
Source: Esri
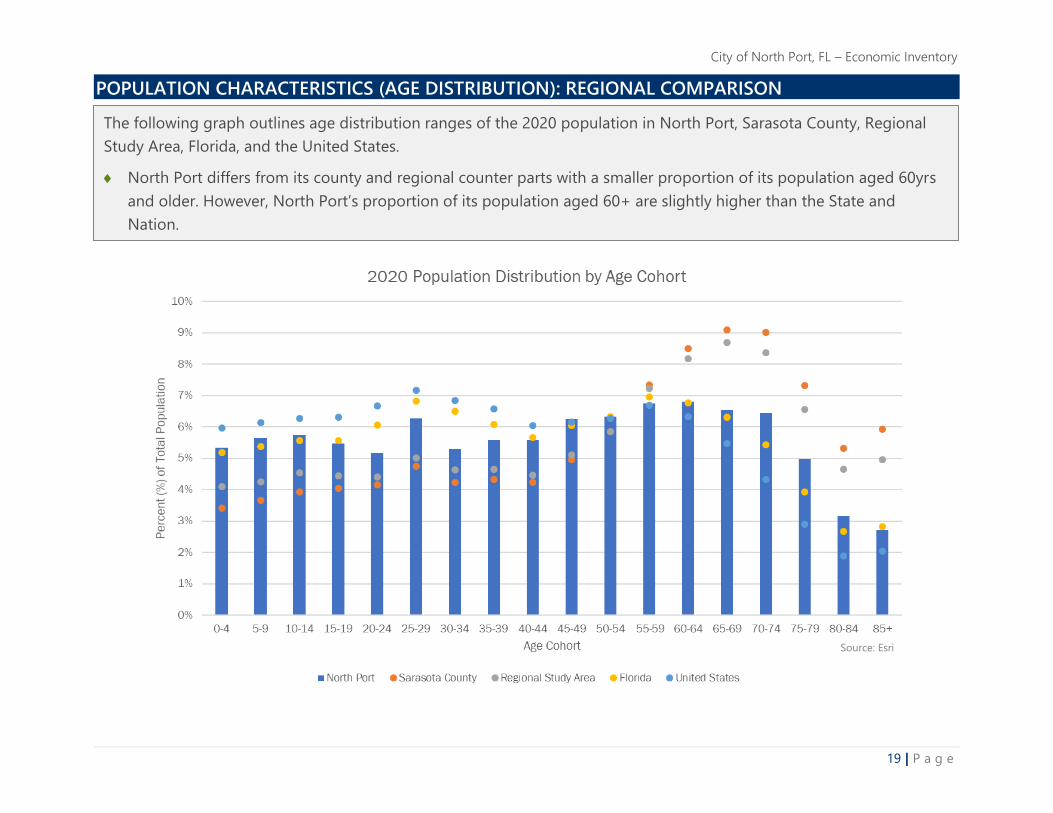
City of North Port, FL – Economic Inventory
19 | P a g e
POPULATION CHARACTERISTICS (AGE DISTRIBUTION): REGIONAL COMPARISON
The following graph outlines age distribution ranges of the 2020 population in North Port, Sarasota County, Regional
Study Area, Florida, and the United States.
North Port differs from its county and regional counter parts with a smaller proportion of its population aged 60yrs
and older. However, North Port’s proportion of its population aged 60+ are slightly higher than the State and
Nation.
Source: Esri

City of North Port, FL – Economic Inventory
20 | P a g e
POPULATION CHARACTERISTICS (AGE DISTRIBUTION): REGIONAL COMPARISON
Approximately 55% of North Port’s population is in either the working age group (20-54yrs.) or the nearing
retirement age group (55-64yrs.).
In North Port, about a quarter of the population is in the retirement age group, as opposed to 40% in Sarasota
County
Source: Esri

City of North Port, FL – Economic Inventory
21 | P a g e
POPULATION CHARACTERISTICS (EDUCATIONAL ATTAINMENT): REGIONAL COMPARISON
The following figure outlines the 2020 population by highest level of educational attainment level for those aged 25
and over.
Educational attainment levels in North Port generally align with trends at the regional and state level, with a slightly
lower percent of the population who have achieved a bachelor’s degree or an advanced degree like a PhD or MD .
Source: Esri

City of North Port, FL – Economic Inventory
22 | P a g e
POPULATION CHARACTERISTICS (RACE DISTRIBUTION): REGIONAL COMPARISON
The population in North Port is less diverse than the region and state but is similar to the county and region with a
majority of the population identifying as white, followed by Hispanic and Black/African American.
Note:
*The U.S Census defines "Hispanic or Latino" as a person of Cuban, Mexican, Puerto Rican, South or Central American, or other Spanish culture or origin regardless of race.
*Other includes those who identify as Pacific Islander, American Indian/Alaska Native, or as other race.
Source: Esri

City of North Port, FL – Economic Inventory
23 | P a g e
COMMUTER TRENDS: NORTH PORT
Almost 90% of North Port residents commuted outside of North Port as of 2017.
North Port imported about a third of its workforce from outside communities.
Other than North Port, Port Charlotte was the top place where North Port workers live and where North Port
residents are employed.
Source: US Census Bureau - On The Map 2017
County Subdivision Percent (%) County Subdivision Percent (%)
North Port 33.8% Sarasota 18.3%
Port Charlotte 15.8% Port Charlotte 11.9%
Venice 5.2% North Port 10.3%
Grove City 3.7% Venice 9.6%
Sarasota 2.7% Interior 6.1%
Punta Gorda 2.6% Punta Gorda 4.8%
Bradenton 2.6% Bradenton 3.9%
Interior Sarasota County 2.1% Tampa 3.1%
Cape Coral 1.7% Grove City 2.1%
Tampa 1.4% St. Petersburg 1.7%
Top Home and Employment Destinations (2017)
Where North Port Workers
Live
Where North Port Residents are
Employed

City of North Port, FL – Economic Inventory
24 | P a g e
POPULATION MIGRATION TRENDS: REGIONAL COMPARISON
Looking at geographic mobility trends of those who moved in the last year, a more significant portion of North Port
residents (12%) moved from within the county. North Port in general had a smaller draw of new residents from
outside of the region compared to the county and region.
Source: US Census
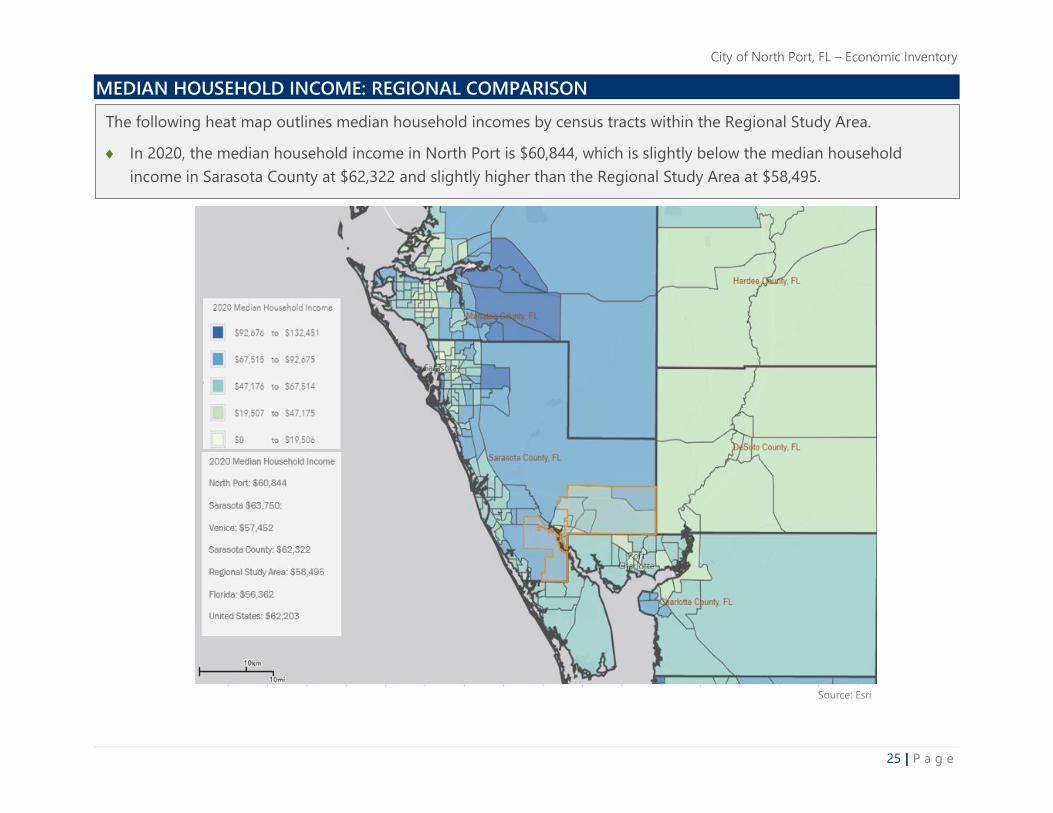
City of North Port, FL – Economic Inventory
25 | P a g e
MEDIAN HOUSEHOLD INCOME: REGIONAL COMPARISON
The following heat map outlines median household incomes by census tracts within the Regional Study Area.
In 2020, the median household income in North Port is $60,844, which is slightly below the median household
income in Sarasota County at $62,322 and slightly higher than the Regional Study Area at $58,495.
Source: Esri

City of North Port, FL – Economic Inventory
26 | P a g e
HOUSING UNITS BY YEAR BUILT: NORTH PORT
The following graph outlines existing 2020 housing units by the year they were built.
Approximately 60% of North Port’s housing units were built after 2000, with the majority built between 2000 and
2009.
Source: Esri

City of North Port, FL – Economic Inventory
27 | P a g e
HOUSING UNITS BY TYPE: NORTH PORT
The following graph outlines 2020 housing units by type in North Port*.
Housing in North Port is primarily owner-occupied at 65%.
Seasonal, Recreational, or Occasional use housing units represent 9% of North Port’s total housing units, and 16% of
Sarasota County’s housing stock.
*Other Vacant housing units include units for sale, units rented but not occupied, units sold but not occupied, and units for rent but not occupied.
Source: Esri
Source: Esri
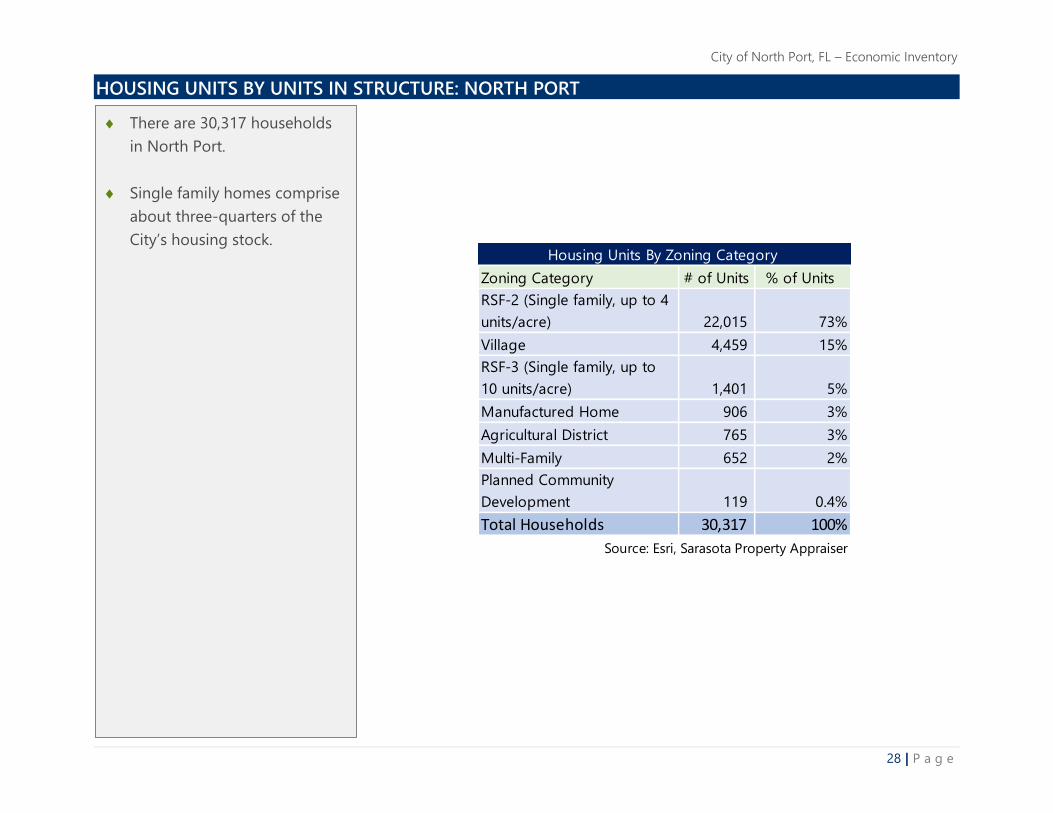
City of North Port, FL – Economic Inventory
28 | P a g e
HOUSING UNITS BY UNITS IN STRUCTURE: NORTH PORT
Zoning Category # of Units % of Units
RSF-2 (Single family, up to 4
units/acre) 22,015 73%
Village 4,459 15%
RSF-3 (Single family, up to
10 units/acre) 1,401 5%
Manufactured Home 906 3%
Agricultural District 765 3%
Multi-Family 652 2%
Planned Community
Development 119 0.4%
Total Households 30,317 100%
Source: Esri, Sarasota Property Appraiser
Housing Units By Zoning Category
There are 30,317 households
in North Port.
Single family homes comprise
about three-quarters of the
City’s housing stock.

City of North Port, FL – Economic Inventory
29 | P a g e
MEDIAN SALE PRICE OF SINGLE-FAMILY HOMES: REGIONAL COMPARISON
The following figure and
table outline the median sale
price of single-family
residences in North Port,
Sarasota County, Charlotte
County, DeSoto County, and
Manatee County from 2015
to 2020.
The median sale price of
a single-family residence
in North Port in 2020 is
$248,000, which is 18%
lower than the median
sale price in Sarasota
County.
The median sale price of
a single-family residence
in North Port increased
from $170,000 in 2015 to
$248,000 in 2020, a 46%
change. The median sale
price increased by 36% in
Sarasota County.
2015 Median
Sale Price
2020 Median
Sale Price*
2015-2020
Change
2015-2020
% Change
Desoto County $ 98,000 $ 178,000 $ 80,000 82%
Charlotte County $ 160,000 $ 250,000 $ 90,000 56%
North Port $ 170,000 $ 248,000 $ 78,000 46%
Sarasota County $ 222,000 $ 301,000 $ 79,000 36%
Manatee County $ 260,000 $ 340,000 $ 80,000 31%
Median Home Sale Price (2015-2020)
*2020 Median Sale Price as of September 2020. Source: REDFIN

City of North Port, FL – Economic Inventory
30 | P a g e
HOUSING BY MEDIAN SALE PRICE: REGIONAL COMPARISON
The following figure outlines the median sale price of a single-family home in North Port and other sizable
communities in the region. Median sale prices in 2020 are as of September.
North Port had the third lowest median home sale price of any of the towns/cities analyzed in the region.
Sarasota had the highest median home sale price of any of the towns/cities analyzed in the region at just under
$350,000 which is almost 40% higher than the median home sale price in North Port.
Source: REDFIN
Arcadia, FL

City of North Port, FL – Economic Inventory
31 | P a g e
INDUSTRY AND OCCUPATION PROFILE

City of North Port, FL – Economic Inventory
32 | P a g e
INDUSTRY AND OCCUPATION PROFILE: METHODOLOGY
SUMMARY
As part of the initial research for the City of North Port, Camoin 310 gathered and analyzed industry and economic data to assess the historic and
existing conditions in the region. This information will be used to inform the subsequent steps of the planning process. While the City of North Port1
was the primary focus of this analysis, other statistics were also included for Sarasota County, the Regional Study Area, the State of Florida, and the
United States.
This analysis looks at economic activity by industry cluster, as classified in the North American Industry Classification System (NAICS). NAICS are
divided into different levels, from 2-digit to 6-digit. 2-digit codes are the broadest industry sector classifications, such as Manufacturing or Health
Care and Social Assistance, while 6-digit codes are more detailed sub-industries like Fossil Fuel Electric Power Generation (within Utilities), or Home
Health Care Services (within Health Care and Social Assistance). Analyzing various levels of industry data provides a more complete picture of
North Port’s economy and helps provide additional insight into economic opportunities.
This analysis also looks at economic activity by occupation, as classified in the Standard Occupation Classification (SOC). SOCs are divided into
different levels, from 2-digit to 6-digit. 2-digit codes are the broadest occupation classifications, such as Management Occupations and
Architecture and Engineering Occupations, while 6-digit codes are more detailed sub-occupations.
DATA SOURCES
Economic Modeling Specialists International (Emsi)
To analyze the industrial makeup of a study area, industry data organized by the North American Industrial Classification System (NAICS) is
assessed. EMSI is a proprietary data provider that aggregates economic data from approximately 90 sources. For more information reference:
www.economicmodeling.com.
COVID-19
The 2020 industry and occupation data sourced from Emsi in the following sections represent job and occupation data as of Q1 2020, and
therefore do not reflect many of the job impacts due to the COVID-19 pandemic in 2020.
1 Much of the industry analysis utilizes data from EMSI. In this analysis, since data at the City level was unavailable North Port was analyzed by combining the
following ZIP-Codes: 34286,34287,34288,34289,34290, and 34291. Note that it does not include ZIP 34293, which is partially in the boundaries of the City of North
Port. This portion in North Port is primarily residential but will include future development at Wellen Park as well as the future Braves training facility. State of
College of Florida is a key employer that is currently located in the portion in North Port, and therefore are not captured in this data.
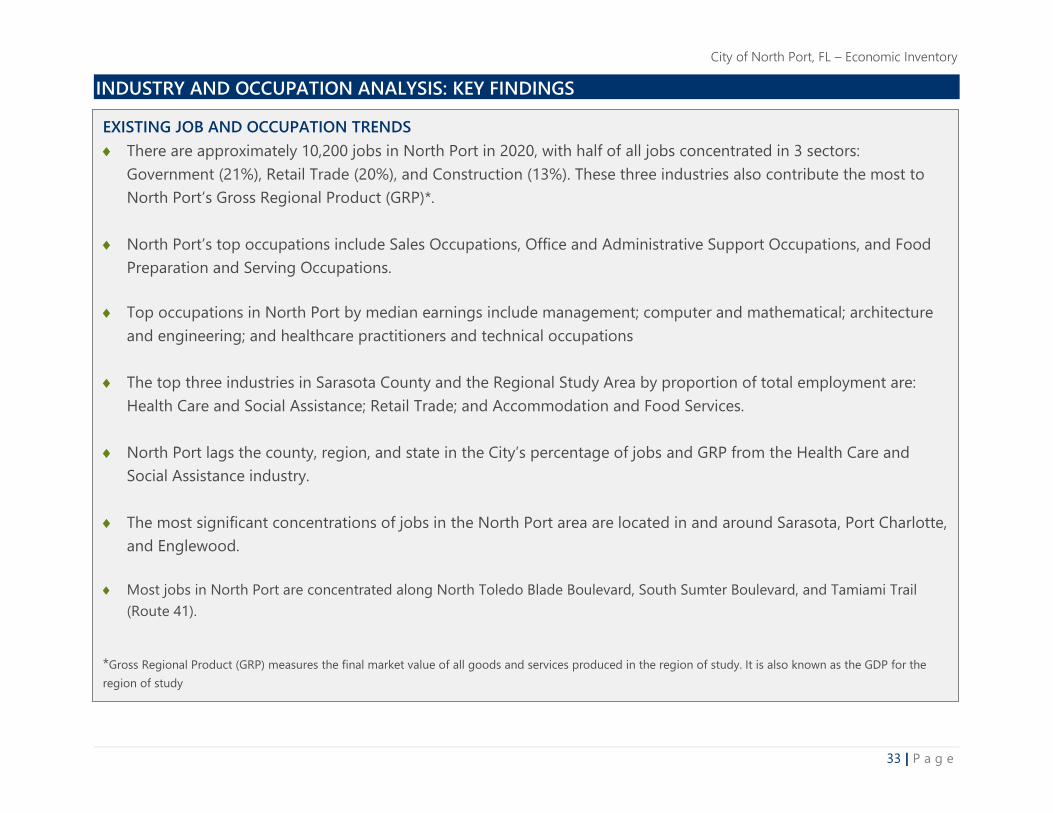
City of North Port, FL – Economic Inventory
33 | P a g e
INDUSTRY AND OCCUPATION ANALYSIS: KEY FINDINGS
EXISTING JOB AND OCCUPATION TRENDS
There are approximately 10,200 jobs in North Port in 2020, with half of all jobs concentrated in 3 sectors:
Government (21%), Retail Trade (20%), and Construction (13%). These three industries also contribute the most to
North Port’s Gross Regional Product (GRP)*.
North Port’s top occupations include Sales Occupations, Office and Administrative Support Occupations, and Food
Preparation and Serving Occupations.
Top occupations in North Port by median earnings include management; computer and mathematical; architecture
and engineering; and healthcare practitioners and technical occupations
The top three industries in Sarasota County and the Regional Study Area by proportion of total employment are:
Health Care and Social Assistance; Retail Trade; and Accommodation and Food Services.
North Port lags the county, region, and state in the City’s percentage of jobs and GRP from the Health Care and
Social Assistance industry.
The most significant concentrations of jobs in the North Port area are located in and around Sarasota, Port Charlotte,
and Englewood.
Most jobs in North Port are concentrated along North Toledo Blade Boulevard, South Sumter Boulevard, and Tamiami Trail
(Route 41).
*Gross Regional Product (GRP) measures the final market value of all goods and services produced in the region of study. It is also known as the GDP for the
region of study

City of North Port, FL – Economic Inventory
34 | P a g e
INDUSTRY AND OCCUPATION ANALYSIS: KEY FINDINGS
HISTORIC JOB TRENDS
Total jobs in North Port increased by 721 jobs, an 8% increase from 2015 to 2020. This compares to a 7% job increase in
Sarasota County, 10% increase in the Regional Study Area, and 11% increase in the State of Florida from 2015 to 2020.
North Port’s population grew by 46,200 residents (a 213% change) from 2000 to 2020, while North Port added 2,000 jobs over
that same time (a 25% change).
In 2000, North Port had about 3 residents to every 1 job, while in 2020 that number increased to 7 residents to every 1 job.
That’s over twice the rate of Sarasota County and the Regional Study Area.
Industries with the largest job growth from 2015 to 2020 in North Port included the Construction; Retail Trade; and
Accommodation and Food Services industries.
The Local Government (excluding Education and Hospitals) industry has a large job presence and has grown significantly in
North Port over the last five years. North Port is home to multiple local, county, and federal government employers. Some of
the largest offices include: the Sarasota County Health Department, Sarasota County Tax Collections Office, Florida Department
of Health, and the Florida Department of Agriculture and Consumer Services.
After four years of job decline from 2007 to 2010, North Port, Sarasota County, and the Regional Study Area saw percent job
increases that outpaced national growth from 2010 to 2017. North Port, Sarasota County, and the Regional Study Area have
since realized less than approximately 2% job growth annually.

City of North Port, FL – Economic Inventory
35 | P a g e
INDUSTRY AND OCCUPATION ANALYSIS: KEY FINDINGS
RESIDENT WORKERS AND COMMUTERS
North Port had 50% more (16,800 total) resident workers* than total jobs (10,200 total) in 2020, indicating that
many of North Port’s resident workers commute outside of the City for work.
Occupations with the highest number of resident workers compared to total jobs in North Port include: Office and
Administrative Support Occupations; Sales and Related Occupations; Food Preparation and Serving Occupations;
Healthcare Support Occupations; and Construction and Extraction. Industries that employ these occupation types
likely would have a local workforce to draw employees from in North Port.
*Resident workers include those who live in North Port and work in or outside of the city boundaries, while total jobs refer to the total jobs
located within North Port.

City of North Port, FL – Economic Inventory
36 | P a g e
EXISTING JOB TRENDS (2-DIGIT NAICS): NORTH PORT
Historic Industry Job Trends: North Port
The figure outline 2020 jobs by industry in North Port.
There are approximately 10,200 jobs in North Port in 2020, with a little over 50% of total jobs in the Government
(21%), Retail Trade (20%), and Construction (13%) industries.
Source: EMSI Source: EMSI

City of North Port, FL – Economic Inventory
37 | P a g e
TOTAL JOB & POPULATION GROWTH: NORTH PORT
The figure below combines population and total job growth in North Port from 2001 to 2020.
North Port’s population grew by 46,200 residents (a 213% change) from 2000 to 2020 while North Port added 2,000
jobs over that same time (a 25% change).
In 2000, North Port had about 3 residents for every job, while in 2020 that number has increased to 7 residents for
every job. That’s over twice the rate of Sarasota County and the Regional Study Area.
Source: EMSI & Florida Office of Economic & Demographic Research
2020 Total Population to Jobs Ratio
North Port: 7:1
Sarasota County: 2:1
Regional Study Area: 3:1

City of North Port, FL – Economic Inventory
38 | P a g e
HISTORIC JOB TRENDS: REGIONAL COMPARISON
Source: EMSI
The following figure outlines the annual percent change in total jobs since 2001 by year for North Port, Sarasota County,
Regional Study Area, Florida, and United States.
North Port experienced less job loss during the Great Recession than their regional counterparts, likely related to their smaller
employment base. Since 2010, North Port, Sarasota County, and the Regional Study area generally all began adding jobs at a
similar rate, which outpaced in the nation.

City of North Port, FL – Economic Inventory
39 | P a g e
HISTORIC JOB TRENDS: REGIONAL COMPARISON
The following figure outlines North Port’s share of Sarasota County’s job and population growth/decline by decade from 2000 to
2020.
From 2000 to 2010, both North Port and the County saw overall population growth. North Port accounted for just over 65% of
total population growth in the County during this time. From 2010 to 2020, both North Port and the County saw overall
population growth as well. North Port accounted for just over 20% of total job growth in the County during this time.
From 2000 to 2010, both North Port and the County incurred an overall loss of jobs. North Port accounted for less than 1% of
total job declines in the County during this time. From 2010 to 2020, both North Port and the County saw overall job growth.
North Port accounted for 2.5% of total job growth in the County during this time.
Source: EMSI & Florida Office of Economic & Demographic Research

City of North Port, FL – Economic Inventory
40 | P a g e
EXISTING JOB TRENDS (4-DIGIT NAICS): NORTH PORT
The following figure outlines the Top 10 jobs by industry (4-NAICS) in North Port in 2020.
The industries below represent just over 50% of total jobs in North Port in 2020.
Local Government, Excluding Education and Hospitals industry jobs are connected to the presence of multiple local,
county, and federal government employers in North Port.
Source: EMSI

City of North Port, FL – Economic Inventory
41 | P a g e
JOB CONCENTRATION (2-DIGIT NAICS): NORTH PORT
Location Quotient (LQ) is a way of quantifying how concentrated a particular industry, occupation, or demographic
group is in a region as compared to the nation. It can reveal what makes a region “unique.” An LQ of above 1.0
indicates a unique concentration in the region. The following table outlines LQ by industry (2-NAICS) in North Port.
North Port’s Construction, Utilities, and Retail Trade industries had the highest location quotients, respectively.
Source: EMSI

City of North Port, FL – Economic Inventory
42 | P a g e
JOB CONCENTRATION (4-DIGIT NAICS): NORTH PORT
The table to the right outlines the
Top 20 industries (4-NAICS) in
North Port by Location Quotient.
The top industries by location
quotient include the following:
o Used Merchandise
Stores;
o Building Finishing
Contractors; and
o Building Material and
Supplies Dealers.
Industries that had the highest
amount of job growth from
2010 to 2020 include the
following:
o Local Government,
Excluding Education and
Hospitals;
o Grocery Stores; and
o General Merchandise
Stores, including
warehouse Clubs and
Supercenters.
Source: EMSI
NAICS DesriptionLocation
Quotient
2020
Jobs
2010-2020
Change
4533 Used Merchandise Stores 5.5 76 39
2383 Building Finishing Contractors 4.8 387 118
4441 Building Material and Supplies Dealers 4.4 318 83
7111 Performing Arts Companies 4.2 52 31
9039 Local Government, Excluding Education and Hospitals 3.9 1,398 155
4452 Specialty Food Stores 3.7 55 42
2361 Residential Building Construction 3.4 280 94
4451 Grocery Stores 3.3 558 132
4523General Merchandise Stores, including Warehouse Clubs and
Supercenters 3.3 401 130
4511 Sporting Goods, Hobby, and Musical Instrument Stores 3.3 102 37
9012 Federal Government, Military 3.2 380 20
6233Continuing Care Retirement Communities and Assisted Living
Facilities for the Elderly 3.2 189 34
6111 Elementary and Secondary Schools 2.9 214 93
3262 Rubber Product Manufacturing 2.6 22 11
4461 Health and Personal Care Stores 2.5 166 10
1151 Support Activities for Crop Production 2.4 74 29
2381 Foundation, Structure, and Building Exterior Contractors 2.2 158 51
6244 Child Day Care Services 2.2 173 33
4539 Other Miscellaneous Store Retailers 2.1 54 20
2382 Building Equipment Contractors 2.1 324 116
Top Industries by Location Quotient, 4-NAICS (2020)

City of North Port, FL – Economic Inventory
43 | P a g e
TOP EXISTING OCCUPATIONS (2-DIGIT SOC): NORTH PORT
The figure on the right
outlines the Top 10
occupations (2-SOC) in North
Port by total jobs in 2020,
along with their median
annual earnings. These 10
occupations are representative
of approximately 75% of total
jobs in North Port in 2020.
North Port’s top
occupations include Sales
Occupations; Office and
Administrative Support
Occupations; and Food
Preparation and Serving
Occupations.
Top occupations by
median earnings in this
group include
Management Occupations
and Protective Service
Occupations.
Source: EMSI

City of North Port, FL – Economic Inventory
44 | P a g e
TOP EXISTING OCCUPATIONS (4-DIGIT SOC): NORTH PORT
The top 25 occupations in North Port by 2020 jobs represent 43% of all jobs in North Port in 2020.
North Port’s top occupations by concentration (LQ) include: Painters, Construction, and Maintenance; Firefighters; and Police
and Sheriff Patrol Officers.
80% of the occupations below do not require higher than a high school diploma upon entry.
SOC Description2020
Jobs
% of 2020
Jobs
2020 Location
QuotientTypical Entry Level Education
41-2031 Retail Salespersons 468 5% 1.72 No formal educational credential
41-2011 Cashiers 408 4% 1.85 No formal educational credential
35-3023 Fast Food and Counter Workers 371 4% 1.48 No formal educational credential
53-7065 Stockers and Order Fillers 237 2% 1.79 High school diploma or equivalent
43-9061 Office Clerks, General 226 2% 1.09 High school diploma or equivalent
55-9999 Military-only occupations 187 2% 3.23 N/A
35-3031 Waiters and Waitresses 185 2% 1.17 No formal educational credential
33-3051 Police and Sheriffs Patrol Officers 168 2% 3.69 High school diploma or equivalent
47-2141 Painters, Construction and Maintenance 168 2% 6.37 No formal educational credential
47-2061 Construction Laborers 165 2% 1.78 No formal educational credential
31-1128 Home Health and Personal Care Aides 160 2% 0.74 High school diploma or equivalent
43-4051 Customer Service Representatives 157 2% 0.86 High school diploma or equivalent
11-1021 General and Operations Managers 155 2% 1.01 Bachelor's degree
41-1011 First-Line Supervisors of Retail Sales Workers 147 1% 1.71 High school diploma or equivalent
47-2031 Carpenters 144 1% 2.11 High school diploma or equivalent
43-6014Secretaries and Administrative Assistants, Except Legal, Medical, and
Executive143 1% 0.95 High school diploma or equivalent
37-2011 Janitors and Cleaners, Except Maids and Housekeeping Cleaners 131 1% 0.82 No formal educational credential
49-9071 Maintenance and Repair Workers, General 126 1% 1.28 High school diploma or equivalent
35-2014 Cooks, Restaurant 113 1% 1.26 No formal educational credential
53-7062 Laborers and Freight, Stock, and Material Movers, Hand 112 1% 0.59 No formal educational credential
37-2012 Maids and Housekeeping Cleaners 111 1% 1.21 No formal educational credential
43-3031 Bookkeeping, Accounting, and Auditing Clerks 108 1% 1.04 Some college, no degree
33-2011 Firefighters 106 1% 5.19 Postsecondary nondegree award
35-2021 Food Preparation Workers 105 1% 1.93 No formal educational credential
Total 4,401 43%
Top 25 Occupations by Total Jobs, 4-SOC (2020)
Source: EMSI

City of North Port, FL – Economic Inventory
45 | P a g e
RESIDENT WORKERS (2-DIGIT SOC): NORTH PORT
The following figure compares the number of resident workers vs. jobs by occupation. Resident workers are individuals who live in North Port
and hold the occupation but may work outside the city. A high number of resident workers compared to jobs indicates that an area has the
workforce needed to support additional industry activity. In all, North Port had 50% more (16,800 total) resident workers than total jobs (10,200
total) in 2020.
Occupations with the highest number of resident workers compared to total jobs in North Port include: Office and Administrate Support
Occupations; Sales and Related Occupations; Food Preparation and Serving Occupations; Healthcare Support Occupations; and
Construction and Extraction Occupations.
Source: EMSI
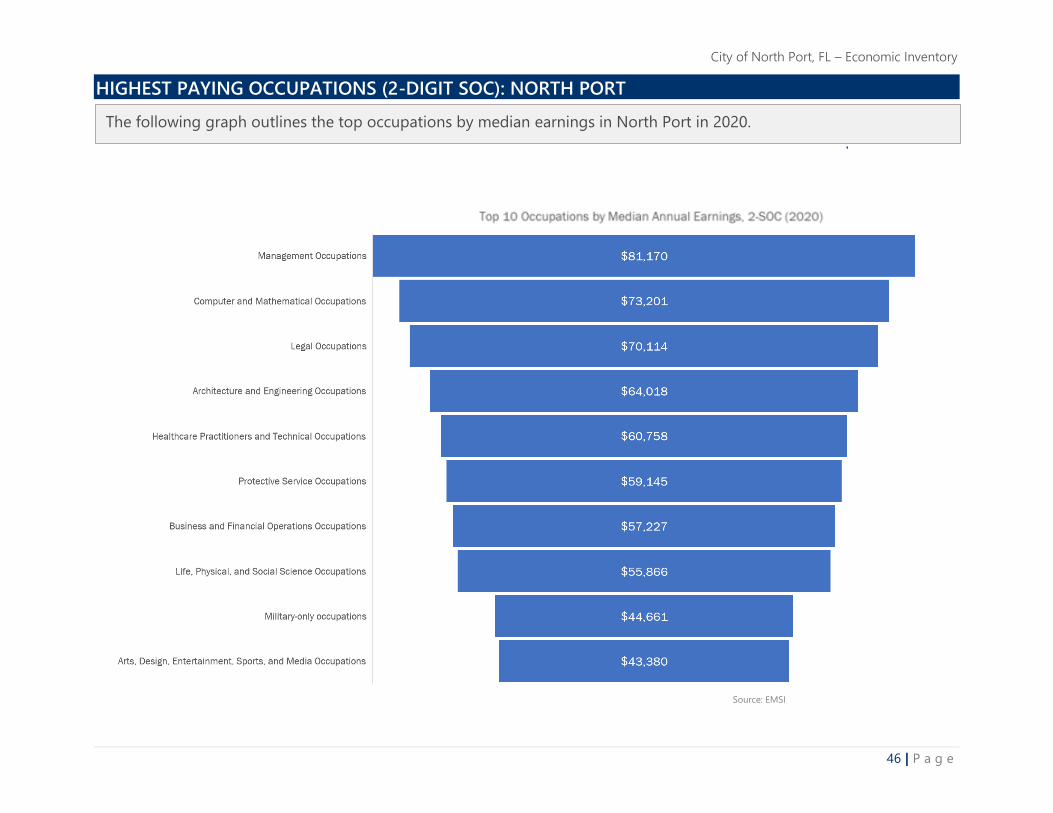
City of North Port, FL – Economic Inventory
46 | P a g e
HIGHEST PAYING OCCUPATIONS (2-DIGIT SOC): NORTH PORT
The following graph outlines the top occupations by median earnings in North Port in 2020.
Source: EMSI

City of North Port, FL – Economic Inventory
47 | P a g e
EXISTING JOB TRENDS (2-DIGIT NAICS): REGIONAL COMPARISON
The following figure looks at the
percent of total jobs by industry (2-
NAICS) in North Port, Sarasota
County, Regional Study Area, Florida,
and the United States.
The top industry by percent of
total jobs in Sarasota County and
the Regional Study Area are
Health Care and Social Assistance
followed by the Retail Trade; and
Accommodation and Food
Services industries.
North Port has a higher
percentage of total jobs than any
other study geographies in the
following industries: Retail Trade;
Government; and Construction.
North Port trails the county,
region, and state in its percentage
of jobs that reside in the Health
Care and Social Assistance
industry.
The Manufacturing industry has a
relatively small footprint in the
region.
Source: EMSI

City of North Port, FL – Economic Inventory
48 | P a g e
JOB CONCENTRATION: NORTH PORT
The following map outlines job concentration in North Port.
Most jobs in North Port are concentrated along North Toledo Blade Boulevard, South Sumter Boulevard, and
Tamiami Trail (Route 41).
The job clusters align with the following activity centers (right to left): Panacea and Midway; Heron Creek; and
Mediterranea.
Source: US Census Bureau - OnTheMap

City of North Port, FL – Economic Inventory
49 | P a g e
JOB CONCENTRATION:
The following heat map outlines job concentration clusters in and around North Port.
The most significant concentrations of jobs in the North Port area are located in and around Sarasota, Port Charlotte,
and Englewood.
Source: US Census Bureau - OnTheMap

City of North Port, FL – Economic Inventory
50 | P a g e
HISTORIC JOB TRENDS (2-DIGIT NAICS): NORTH PORT
The following table outlines total job growth by industry (2-NAICS) in North Port from 2015 to 2020.
Total jobs in North Port increased by 721 jobs, an 8% change from 2015 to 2020.
Industries with the largest job growth from 2015 to 2020 included the Construction; Retail Trade; and
Accommodation and Food Services industries.
Source: EMSI
NAICS Description2015
Jobs
2020
Jobs
2015 - 2020
Change
2015 - 2020
% Change
11 Agriculture, Forestry, Fishing and Hunting 77 125 48 62%
21 Mining, Quarrying, and Oil and Gas Extraction 0 0 0 0%
22 Utilities 82 76 (6) (7%)
23 Construction 1,146 1,338 192 17%
31 Manufacturing 261 265 4 2%
42 Wholesale Trade 138 124 (14) (10%)
44 Retail Trade 1,884 1,997 113 6%
48 Transportation and Warehousing 100 136 36 36%
51 Information 130 102 (28) (22%)
52 Finance and Insurance 219 223 4 2%
53 Real Estate and Rental and Leasing 149 171 22 15%
54 Professional, Scientific, and Technical Services 292 333 41 14%
55 Management of Companies and Enterprises 19 29 10 53%
56Administrative and Support and Waste Management and
Remediation Services359 322 (37) (10%)
61 Educational Services 214 247 33 15%
62 Health Care and Social Assistance 841 914 73 9%
71 Arts, Entertainment, and Recreation 71 106 35 49%
72 Accommodation and Food Services 916 996 80 9%
81 Other Services (except Public Administration) 556 588 32 6%
90 Government 2,043 2,118 75 4%
Total 9,500 10,221 721 8%
Total Jobs by Industry, 2-NAICS (2015-2020)

City of North Port, FL – Economic Inventory
51 | P a g e
HISTORIC JOB TRENDS (4-DIGIT NAICS): NORTH PORT
The following graph outlines the Top 10 industries (4-NAICS) by total job growth in North Port from 2015 to 2020.
• Local Government, Excluding Education and Hospitals industry are connected to the presence of multiple local,
county, and federal government employers in North Port including but not limited to: the Sarasota County
Health Department, Sarasota County Tax Collections Office, Florida Department of Health, and the Florida
Department of Agriculture and Consumer Services.
•
Source: EMSI

City of North Port, FL – Economic Inventory
52 | P a g e
HISTORIC JOB TRENDS: REGIONAL COMPARISON
North Port’s total percent job growth was 8%
from 2015 to 2020. This is slightly higher than the
county but lower than the region and state.
Total percent job growth in North Port, the
county, region, and state have outpaced national
job growth since 2015.
Source: EMSI
2015 Jobs 2020 Jobs # Change % Change
North Port 9,500 10,221 721 8%
Sarasota County 176,029 189,028 12,999 7%
Regional Study Area 364,117 400,394 36,277 10%
Florida 9,009,019 9,969,803 960,784 11%
United States 156,535,343 166,243,585 9,708,242 6%
Total Job Growth (2015-2020)

City of North Port, FL – Economic Inventory
53 | P a g e
HISTORIC JOB TRENDS: REGIONAL COMPARISON
Although the following industries only represent 13% of total job growth from 2015 to 2020, North Port saw the largest percent job growth
in the following industries: Agriculture, Forestry, Fishing and Hunting (62%); Management of Companies and Enterprises (53%) and; Arts,
Entertainment, and Recreation (49%).
The Wholesale Trade and Administrative and Support and Waste Management and Remediation Services industries saw job declines of 10%
in North Port from 2015 to 2020, compared to the county, region, and state who saw job increases from 2015 to 2020.
The Management of Companies and Enterprises industry saw job growth of over 50% in both North Port and Sarasota County from 2015 to
2020. *Note: The combined increase in jobs for these three industries from 2015 to 2020 was 93 jobs, which represents only 13% of total job growth in North Port during that time.
Source: EMSI
NAICS DescriptionNorth
Port
Sarasota
County
Regional
Study AreaFlorida
United
States
11 Agriculture, Forestry, Fishing and Hunting 62% 49% (10%) (3%) (0%)
21 Mining, Quarrying, and Oil and Gas Extraction - (39%) (25%) (1%) (12%)
22 Utilities (7%) (1%) (4%) 2% -
23 Construction 17% 18% 26% 28% 14%
31 Manufacturing 2% - 4% 12% 4%
42 Wholesale Trade (10%) 4% 6% 5% -
44 Retail Trade 6% 1% 7% 3% -
48 Transportation and Warehousing 36% 11% 31% 35% 21%
51 Information (22%) (5%) (2%) 2% 4%
52 Finance and Insurance 2% (1%) 2% 13% 6%
53 Real Estate and Rental and Leasing 15% 10% 11% 12% 10%
54 Professional, Scientific, and Technical Services 14% 4% 10% 18% 11%
55 Management of Companies and Enterprises 53% 53% 26% 19% 10%
56 Administrative and Support and Waste Management and Remediation Services (10%) 10% 12% 10% 6%
61 Educational Services 15% 8% 18% 12% 7%
62 Health Care and Social Assistance 9% 12% 11% 12% 10%
71 Arts, Entertainment, and Recreation 49% 7% 6% 12% 12%
72 Accommodation and Food Services 9% 9% 11% 11% 8%
81 Other Services (except Public Administration) 6% 9% 10% 8% 5%
90 Government 4% - 6% 2% 3%
Total 8% 7% 10% 11% 6%
Total Percent Job Change by Industry, 2-NAICS (2015-2020)

City of North Port, FL – Economic Inventory
54 | P a g e
REGIONAL COMPARISON: TARGET INDUSTRIES
Industry Florida Sarasota
County
Southwest FL
EDATampa
North
Port
Manufacturing/Light Manufacturing x x x x x
Life Science x x x x
Cleantech x x x
HQs x x x x
Aviation & Aerospace x x
Defense & Homeland Security x x x
IT x x x
Financial and Professional Services x x x
Logistics and Distribution x x x
Hospitality x
Retail Trade x
Education x
Health Care x
Comparison Target Industry Matrix
North Port’s current target industries focus on supporting sectors that are related to the city’s growing population,
like retail, education, and health care.
Manufacturing is the one industry that overlaps with the priorities of regional and state economic development
organizations.

City of North Port, FL – Economic Inventory
55 | P a g e
LAND USE & REGULATORY CONSIDERATIONS
ACTIVITY CENTERS
Activity Centers are North Port’s primary land use policy for directing commercial development.
North Port is one of the last places in Sarasota County with potential for land assembly and significant interstate access to
accommodate land-intensive industries like warehousing, distribution, or a range of manufacturing.
While there is potential for land assembly and opportunities for build out, North Port sites are generally not shovel ready and therefore
less desirable to the development community.
Activity Centers have pre-determined development proportions (office, residential, commercial). There is potential for this to change
simply to residential and non-residential proportions to allow for greater flexibility in development opportunities. There are also
discussions to update Activity Centers’ zoning to include a form-based code overlay, which would also allow for flexibility in
development while still ensuring that the physical and visual aspects of build out or infill will match the surrounding area’s character
and design aesthetics.
ECONOMIC DEVELOPMENT IN THE COMPREHENSIVE PLAN
The City’s Comprehensive Plan was updated in June 2017. Notable goals that will be coordinated through this market study include:
Focusing on attracting “businesses that will be owned by and/or that will employ City residents”
Allowing industrial and commercial uses in appropriate locations
Supporting housing options that support the workforce by planning for development near employment and transportation centers
Diversifying the city’s tax base
UNIFIED LAND DEVELOPMENT CODE
The City is in the process of updating the Unified Land Development Code (ULDC). The project has been pushed back due to
challenges with the COVID-19 pandemic. The ULDC covers the city’s zoning, site development, stormwater management, parking,
streetscapes, and many more aspects related to the physical characteristics and build out of the city.
The updates to the ULDC come as an important complement to the City’s Comprehensive Plan, which was updated in 2016. It is
important that the policies within the ULDC enable the vision of the Comprehensive Plan.
The goals of the ULDC update broadly include:
o Streamlining land use regulations
o Enabling high quality infill and redevelopment projects
o Eliminating outdated terminology to reflect today’s modern land use standards
o Supporting economic development, multimodal transportation, and a sustainable balance between the built and natural
environment.

City of North Port, FL – Economic Inventory
56 | P a g e
TRANSPORTATION AND MOBILITY
With expansive population growth comes the need for
additional ways to efficiently move individuals and
workforce around the community. This includes interstates
and commuter routes in addition to recreational trails like
greenways, parks, bike lanes and other multi-modal forms of
transportation that support the quality of life of residents.
A mobility study is currently underway to determine where
there is potential to expand multimodal transportation
opportunities across the city. Other notable transportation
opportunities include:
o The Comprehensive Plan notes the 84 miles of
canals across the city, which currently act as physical
barriers between communities. However, there is
potential to leverage these blueways to connect
neighborhoods.
o A trolley easement on portion of U.S. 41 could be
leveraged as a commuter route.
IMPACT FEE STUDY
Impact fees help to fund the City’s parks, fire and rescue, law
enforcement, and solid waste programs.
The City is currently in the process of raising its Impact Fees
by 25%. For a single family detached/attached unit
translates to $1,866.80. This increase be applied to other
residential, recreational, institutional office, retail, and
industrial uses.
Impact fees are currently being reviewed internally by the
Planning Division, which could lead to further changes in the
future.

City of North Port, FL – Economic Inventory
57 | P a g e
DEVELOPMENT PROCESS COMPARISON
The City of North Port competes with several surrounding locations for development opportunities. While developers or site selectors can have
specific criteria that narrow down their options for where to build, a community’s attitude or regulations surrounding the development process can
be an invitation or a hinderance for investment. The matrix below compares aspects of North Port’s development process with the cities of
Sarasota, Venice, and Sarasota County. The development process will be probed further in interviews with stakeholders and developers.

58 | P a g e
CITY OF NORTH PORT CITY OF SARASOTA CITY OF VENICE SARASOTA COUNTY
LONG RANGE PLAN
2017 Comprehensive Plan Sarasota City Plan - 2008;
Future Land Use map updated
August 2020
Yes, 2018
Comprehensive Plan;
Future Land Use Map
2017-2027
Yes, 2016 Comprehensive
Plan
POTENTIAL FOR GROWTH & BUILDOUT
OR REDEVELOPMENT
Yes, to varying degrees
within Activity Centers.
City will pursue the annexation
of enclaves where properties
are generally encircled by the
municipal boundary and/or
contiguous to municipal
boundaries.
Yes, 9 potential
annexation areas as
part of a Joint
Planning Agreement
with Sarasota County.
In designated Major
Employment Centers
(MEC).
ONLINE PERMITTING / APPLICATIONS Yes Permits - Yes, Applications -
No
Yes Yes, no paper copies
accepted.
SPECIAL DISTRICTS / AREAS
Activity Centers Downtown Improvement
District; Community
Redevelopment Agency; Parks
& Recreation District; Golden
Gate Point Streetscape District,
St. Armands Special Business
Neighborhood Improvement
District
N/A Critical Area Plans, Special
Planning Areas, Incentive
Base Optional Overlay
Programs
ONLINE SUBMISSION CHECKLIST
Yes, for various application
packages
Yes Yes Yes
DEVELOPMENT REVIEW TIMELINE* *NOTE THAT LONGER TURNAROUND TIMES ARE EXPECTED
DUE TO COVID-19.
10 business days (planning) About 4 months with DRC,
Planning Board and
Commission review
Minor plan reviews -
1,2 days
Single family
residence - 10-15
days
Commercial plans -
30 days
No timeline found.
DEVELOPMENT IMPACT FEES
Yes - in the process of 25%
increase
Yes Yes Yes
POINT OF CONTACT FOR QUESTIONS
Important contact info for
NDS staff provided, no
single point of contact
Development Services Staff
listed on website, no single
point of contact.
Staff numbers
provided.
General email provided

59 | P a g e
ATTACHMENT A: DATA SOURCES ECONOMIC MODELING SPECIALISTS INTERNATIONAL (EMSI)
To analyze the industrial makeup of a study area, industry data organized by the North American Industrial Classification System (NAICS) is assessed. Camoin 310
subscribes to Economic Modeling Specialists Intl. (Emsi), a proprietary data provider that aggregates economic data from approximately 90 sources. Emsi industry data, in
our experience, are more complete than most or perhaps all local data sources (for more information on Emsi, please see www.economicmodeling.com). This is because
local data sources typically miss significant employment counts by industry because data on sole proprietorships and contractual employment (i.e. 1099 contractor
positions) are not included and because certain employment counts are suppressed from BLS/BEA figures for confidentiality reasons when too few establishments exist
within a single NAICS code.
ESRI BUSINESS ANALYST ONLINE (BAO)
Esri is the leading provider of location-driven market insights. It combines demographic, lifestyle, and spending data with map-based analytics to provide market
intelligence for strategic decision-making. Esri uses proprietary statistical models and data from the U.S. Census Bureau, the U.S. Postal Service, and various other sources
to present current conditions and project future trends. Esri data are used by developers to maximize their portfolio, retailers to understand growth opportunities, and by
economic developers to attract business that fit their community. For more information, visit www.esri.com.
COSTAR
CoStar is the leading source of commercial real estate intelligence in the U.S. It provides a full market inventory of properties and spaces—available as well as fully
leased—by market and submarket. Details on vacancy, absorption, lease rates, inventory, and other real estate market data are provided, as well as property-specific
information including photos and floor plans. CoStar covers office, retail, industrial, and multifamily markets. CoStar data is researched and verified by the industry’s
largest professional research team. With 1,200 researchers and 130 field research vehicles, CoStar’s team makes calls to property managers; reviews court filings, tax
assessor records and deeds; visits construction sites; and scans the web to uncover nearly real-time market changes. More at www.costar.com.

1 | P a g e
REAL ESTATE
INVENTORY
PREPARED BY:
Submitted to:
City of North Port, FL

City of North Port, FL – Real Estate Inventory
1 | P a g e
KEY FINDINGS
MULTI-FAMILY
• From 2015 to 2020, rent for multi-family properties in North Port increased by 23%, the second highest increase in the Sarasota
Region, following Palmetto/Ellenton’s growth of 26%. Rent in North Port has been growing at a faster rate than almost any other real
estate submarket in the region over the last five years. If price increases continue on their current trajectory, it could erode the city’s
attractiveness in regard to affordable housing, diminishing its appeal to the community’s workforce.
• North Port’s relatively low multi-family rental rates make it an affordable place to live, but they also present a challenge to
developing new rental housing stock. Achievable market rents for multi-family units are not high enough for certain new-build construction
projects to yield a sufficient return for a developer unless there are additional subsidies or concessions made in the development process.
• Recent multi-family development activity in North Port signals a shift to more confidence in this sector of the housing market. After
seeing no new inventory built over the past decade, a substantial amount of new multi-family inventory has been delivered to the North Port
submarket in 2020, and more units are in the pipeline for the coming 18-months. Many of these units are designated as affordable housing
units. Identifying how this housing aligns with employee housing needs will be key to building a community where residents have the option
to live and work.
• Based on units that are now under construction, North Port’s multi-family market is expected to grow by over a third, totaling 324
units. However, North Port remains a relatively small portion of multi-family stock in the Sarasota County region. The city’s submarket
represents about 3%, or 912 units, of inventory in the Sarasota market as of Q4 2020. The 224 units that came online in North Port in the last
five years represent about 8% of total units delivered in the Sarasota market.
INDUSTRIAL
• Low industrial vacancy rates combined with ongoing regional market activity signal that North Port could capture demand for
additional industrial space. A majority of regional industrial inventory is concentrated in Manatee County around the Bradenton area. This
area is more built out than North Port, which could present opportunities for more industrial development farther south on I-75. A significant
amount of new construction in and around North Port is focused on logistics properties, which could also be good fit for the city’s land,
industry, and real estate assets.
• North Port has the benefit of having space to grow. As of Q4 2020, there were almost 340 land properties containing approximately 15,860
acres of total land in North Port. Much of this land is classified by CoStar as commercial land, with large concentrations well-situated along
Toledo Blade Blvd and Route 41. Yet, this vacant land generally does not come ready with infrastructure or utility connections, or is distributed
across several property owners, rendering the sites undesirable for development. Land assembly and utility build out will be increasingly vital
for the city to make the case why businesses should choose North Port over well-established industry centers.

City of North Port, FL – Real Estate Inventory
2 | P a g e
• While there is ample vacant land to grow into in the long term, short-term business development is stifled by a tight existing
industrial real estate market. Industrial vacancy rates show that there are few to no buildings where businesses could readily expand. The
industrial vacancy rate as of Q4 2020 in North Port was close to 0% and has been below 5% since Q4 2016.
• North Port can offer more competitive lease rates than the Bradenton area, but the city will still need to distinguish itself from
Bradenton and other areas to be competitive from a business attraction standpoint. Industrial lease rates are lower in North Port
($9.18/sf) than the Sarasota County market average ($9.81/sf) and Manatee County market average ($9.95).
• Market shifts because of COVID-19 indicate that the city’s industrial market is suited to capture additional activity. North Port’s current
market is primarily made up of logistics buildings, which along with other industrial spaces have been generally insulated from impacts of the
pandemic and may be even more in demand due to the upward trajectory of e-commerce trends.
OFFICE
• Office lease rates in North Port are lower than much of the surrounding region. At $19.11/SF, office market rent was aligned closely with
rates seen in the Punta Gorda Market (Charlotte County) and are approximately 14% lower than rates for the office submarket covering the
cities of Sarasota and Venice.
• While pricing is affordable, the quality of office space in North Port is not competitive with the surrounding region. A small proportion
of Class A Office space is available, limiting the type of office-user that could be attracted to or grow in North Port.
• Low vacancy rates also indicate a tight office market with little room for companies to grow or offering minimal room to attract
companies in. The city’s office vacancy rate is 4.5%, which is lower than rates seen in the Sarasota region or Punta Gorda. The office market’s
future remains in flux as COVID-19 shifts where workers and business conduct their day-to-day affairs. While there may be some room to
capture pent up demand, committing to vast amounts of office space could leave a glut in the market. To mitigate risk and leverage the city’s
assets, there may be opportunities for flex space, accommodating both office and space for light industrial users. There is a low supply of flex
inventory in the market, which the city could also take advantage of.
RETAIL
• Most retail in North Port can be defined as general retail, with no single central destination for retail and commercial activity that
could be designated as a downtown. Shifting consumer preferences and habits adapted during the COVID-19 pandemic have left the bricks
and mortar retail sector hard hit. Much of North Port’s retail serves the everyday needs of the local community but does not function as a
destination for the regional consumers or tourists. A centralized, retail center with entertainment, restaurants and other recreation options
would serve to create a sense of place for North Port and draw in regional spending dollars. This multi-purpose retail development would not
just attract spending dollars but could also serve as a business attraction channel, especially in the community of entrepreneurs, freelancers, or
creative technology individuals who seek dynamic environments to build their networks in. It would also serve to support the notable visitation
assets in the city including CoolToday Park and Warm Mineral Springs.

City of North Port, FL – Real Estate Inventory
3 | P a g e
MULTIFAMILY
REAL ESTATE PROFILE: METHODOLOGY
DATA SOURCES
All of the data utilized in the following analyses were sourced from CoStar as of Q4 2020. CoStar is the leading source of commercial real estate
intelligence in the U.S. It provides a full market inventory of properties and spaces—available as well as fully leased—by market and submarket.
Details on vacancy, absorption, lease rates, inventory, and other real estate market data are provided by CoStar, as well as property-specific
information including photos and floor plans. CoStar primarily covers trends in office, retail, industrial, and multifamily markets. With 1,200
researchers and 130 field research vehicles, CoStar’s team makes calls to property managers; reviews court filings, tax assessor records and deeds;
visits construction sites; and scans the web to uncover nearly real-time market changes. More information at www.costar.com.
REAL ESTATE ANALYSIS METHODOLOGY
Camoin 310 gathered and analyzed real estate data sourced from CoStar to assess historic and existing market conditions in North Port and the
surrounding region. Trends related to each real estate property type were primarily analyzed at the market and submarket level, which are defined
by CoStar. CoStar market boundaries are based off Core-Based Statistical Areas defined by the U.S. Census Bureau. Markets are broken up into
various submarkets which are based on CoStar’s extensive market expertise and have been refined over time in conjunction with advisory boards
and clients. Where applicable and when data were available, real estate trends were also identified within the municipal boundaries of the City of
North Port.
Primary real estate property types profiled in this analysis include:
• Multifamily Residential
• Industrial
• Office
• Retail
• Land

City of North Port, FL – Real Estate Inventory
4 | P a g e

City of North Port, FL – Real Estate Inventory
5 | P a g e
MULTIFAMILY MARKET PROFILE
METHODOLOGY
In order to identify key multifamily residential real estate trends in the North Port region, two multifamily markets were analyzed, including the
Sarasota and Punta Gorda multifamily markets. In addition to analyzing overall trends in these two regional markets, individual submarkets within
each market were also analyzed to gain a more in-depth understanding of localized real estate activity in the region. Total inventory and other
multifamily market and submarket trend data in this section include data for market and market/affordable properties with five or more units. The
map below outlines the Sarasota and Punta Gorda multifamily markets and submarkets in more detail:
Sarasota and Punta Gorda Multifamily Markets and Submarkets
# Market Submarket
1 Sarasota Palmetto/Ellenton
2 Sarasota Bradenton
3 Sarasota Whitfield
4 Sarasota North Sarasota
5 Sarasota Downtown Sarasota
6 Sarasota South Sarasota
7 SarasotaLakewood Ranch
Development
8 Sarasota Venice/Englewood
9 Sarasota North Port
10 Punta Gorda Port Charlotte
11 Punta Gorda Outlying Charlotte County
12 Punta Gorda Punta Gorda
Market and SubMarket Legend
City of North Port, FL – Real Estate Inventory
6 | P a g e
MULTIFAMILY MARKET PROFILE
MULTIFAMILY MARKET OVERVIEW
The North Port submarket represents a small proportion of the region’s multifamily inventory, with existing units only representing about 3%, or
912 units, of inventory in the Sarasota market as of Q4 2020. While the Sarasota market saw an inventory supply wave over the last five years, the
North Port submarket saw stagnant activity, with no new units delivered to the market until recently. In 2020, the North Port submarket made
significant progress and made up some ground in the market with a total of 224 units being delivered to the submarket. These new units account
for 8% of all units delivered to both the Sarasota and Punta Gorda markets over the past five years. In addition to recently delivered units, the
supply wave will continue in the North Port submarket over the coming years, with 324 units currently under construction in the North Port
submarket. These units account for approximately 35% of existing inventory in the submarket.
New supply waves in the Sarasota market and North Port submarket will keep vacancy rates high and will likely slow new construction starts until
occupancy rates increase in the submarket and market. At 20% in Q4 2020, the current vacancy rate in the North Port submarket is almost three
times higher than the submarket’s five year average. This rate is expected to continue rising for the next 12-18 months.
In addition to having a significant new supply of multifamily housing units, at $1,257 per month, the North Port submarket has the fourth lowest
market rent per unit in the Sarasota and Punta Gorda markets. While the North Port submarket’s current market rent is low for the Sarasota
market, the Punta Gorda market, which includes communities like Port Charlotte, have substantially lower market rents than those in the Sarasota
market. Additionally, rents in the Punta Gorda market have increased at a lower cumulative rate over the last five years compared to the North Port
market, which has increased by 23% over the last five years. At 23%, the North Port submarket had the second highest increase of any submarket
within the Sarasota and Punta Gorda markets.
The leisure, retail, and hospitality sectors are some of the largest employment bases in the North Port submarket and Sarasota region, and were
some of the highest growth sectors over recent years. These jobs tend to be lower-paying and contribute a significant portion to the prime renting
cohort of 20-34-year-olds. This sector has been one of the hardest hit by the coronavirus, and impacts may ripple into the regional housing market
through 2021, or until some level of containment is achieved.

City of North Port, FL – Real Estate Inventory
7 | P a g e
MULTIFAMILY MARKET PROFILE – INVENTORY
The North Port submarket represents a small proportion of the region’s multifamily unit inventory, with existing units making up about 3%, or 912
units, of the Sarasota market’s total inventory.
Total Multifamily Units and Buildings by Submarket (Q4 2020)

City of North Port, FL – Real Estate Inventory
8 | P a g e
MULTIFAMILY MARKET PROFILE – INVENTORY (CONTINUED)
The following map displays multifamily properties within both the Sarasota and Puna Gorda Markets:
Multifamily Properties by Submarket (Q4 2020)

City of North Port, FL – Real Estate Inventory
9 | P a g e
MULTIFAMILY MARKET PROFILE – ABSORPTION, NET DELIVERIES, VACANCY
Although the multifamily supply wave has increased vacancies over the past two years due to unit absorption not keeping up with the number of
new unit deliveries, the Sarasota market’s multifamily demand held up relatively well when factoring in the sheer volume of deliveries in recent
years. Additionally, the pipeline appears to be showing signs of slowing with decreasing construction starts in the second and third quarters of
2020. Even though there are still roughly 2,600 units underway, based on recent lease-up patterns during higher supply periods, the current level
appears more manageable from an occupancy standpoint.
The Sarasota market’s strong demand in the years prior to the coronavirus crisis stemmed from healthy job and population growth, both of which
were outpacing national averages. In fact, over the last five years, the Sarasota market has ranked among the leading national metros per capita for
household formation. The retail, tourism, and hospitality sectors are some of the largest employment bases in the Sarasota market and are some of
the highest growth sectors over recent years. These jobs tend to be lower-paying and contribute a significant portion to the prime renting cohort
of 20-34-year-olds. These sectors have been one of the hardest hit by the coronavirus, and Sarasota's previous strength may become a temporary
weakness.
Sarasota Market Vacancy, Absorption, and Delivery Trends (2010 – 2025)

City of North Port, FL – Real Estate Inventory
10 | P a g e
MULTIFAMILY MARKET PROFILE – ABSORPTION, NET DELIVERIES, VACANCY
After a period of inactivity earlier in the decade, the North Port submarket saw a substantial relative number of new units delivered to the
submarket in 2020. With net absorption currently trailing net deliveries, the submarket’s vacancy rate has increased substantially in 2020 and is
forecasted to remain high until these new units, in addition to those that are currently under construction and forecasted to be delivered to the
market over the next 18-months, can be adequately absorbed into the submarket in the coming years.
North Port Submarket Vacancy, Absorption, and Delivery Trends (2010 – 2025)

City of North Port, FL – Real Estate Inventory
11 | P a g e
MULTIFAMILY MARKET PROFILE – INVENTORY GROWTH
A total of 224 units were delivered to the North Port submarket over the past five years, all of which came in 2020. These units represented 8% of
total units delivered to both the Sarasota and Punta Gorda markets over the past five years.
Multifamily Cumulative Inventory Growth by Submarket (2015 – Q4 2020)

City of North Port, FL – Real Estate Inventory
12 | P a g e
MULTIFAMILY MARKET PROFILE – INVENTORY UNDER CONSTRUCTION
The following map outlines the amount of new multifamily inventory under construction as a percentage of total inventory in each submarket. As
of Q4 2020, an additional 324 units are currently under construction in the North Port submarket, representing approximately 35% of existing
inventory in the submarket. These units are located on E Price Blvd (224 units) and Kenvil Dr (100 units).
Under Construction Multifamily Inventory as a Percentage of Total Submarket Inventory (Q4 2020)

City of North Port, FL – Real Estate Inventory
13 | P a g e
MULTIFAMILY MARKET PROFILE – VACANCY RATE
At 20% in Q4 2020, the current vacancy rate in the North Port submarket is almost three times higher than the submarket’s five year average. This
has primarily been due to the amount of new inventory that was delivered to the submarket in 2020.
Multifamily Vacancy Rate by Submarket (2015 – Q4 2020)

City of North Port, FL – Real Estate Inventory
14 | P a g e
MULTIFAMILY MARKET PROFILE – VACANCY RATE
The following map outlines multifamily vacancy rates as of Q4 2020 by submarket. At 20%, the North Port submarket has the second highest
vacancy rate of any submarket, trailing only the Lakewood Ranch Development submarket at 24%.
Multifamily Vacancy Rate by Submarket (Q4 2020)

City of North Port, FL – Real Estate Inventory
15 | P a g e
MULTIFAMILY MARKET PROFILE – MARKET RENT
At $1,257 per month, the North Port submarket has the fourth lowest market rent per unit in the Sarasota and Punta Gorda Markets. The
Bradenton, Outlying Charlotte County, Palmetto/Ellenton, and Punta Gorda submarkets all had lower market rents per unit than the North Port
submarket. In general, the Punta Gorda market average and submarkets have substantially lower market rents than those in the Sarasota market.
Multifamily Market Rent by Market and Submarket (Q4 2020)

City of North Port, FL – Real Estate Inventory
16 | P a g e
MULTIFAMILY MARKET PROFILE – MARKET RENT
From 2015 to 2019, rents in the North Port submarket grew between 4-5% annually before decreasing slightly in Q2 2020 due to the pandemic.
Rebounding from the pandemic quickly, forecasts point to rents continuing to climb over the next five years, but at a slower rate than the previous
five years.
North Port Submarket Rent Trends (2010 – 2025)

City of North Port, FL – Real Estate Inventory
17 | P a g e
MULTIFAMILY MARKET PROFILE – CUMULATIVE MAREKT RENT GROWTH
From 2015 to Q4 2020, market rent in the North Port submarket grew by a total of 23%, the highest increase of any submarket within the Sarasota
and Punta Gorda markets, except for the Palmetto/Ellenton submarket, at approximately 26%.
Cumulative Multifamily Rent Growth by Submarket (2015 – Q4 2020)

City of North Port, FL – Real Estate Inventory
18 | P a g e
Image Provided by CoStar

City of North Port, FL – Real Estate Inventory
19 | P a g e
INDUSTRIAL MARKET PROFILE
METHODOLOGY
To identify key industrial real estate trends in the North Port region, two industrial markets were analyzed, including the Sarasota and Punta Gorda
Industrial Markets. In addition to analyzing these two regional markets, individual submarkets within each market were also analyzed to gain a
more in-depth understanding of localized real estate activity in the region. The map below outlines the Sarasota and Punta Gorda industrial
markets and submarkets in more detail:
Sarasota and Punta Gorda Industrial Markets and Submarkets
# Market Submarket
1 Sarasota Manatee
2 Sarasota Manatee Outlying
3 Sarasota Sarasota
4 Sarasota Sarasota Outlying
5 Punta Gorda Charlotte County
Market and SubMarket Legend

City of North Port, FL – Real Estate Inventory
20 | P a g e
INDUSTRIAL MARKET OVERVIEW
INDUSTRIAL MARKET OVERVIEW
As of Q4 2020, there were approximately 53 million SF of industrial space1 in the Sarasota and Punta Gorda markets, with almost 75% of industrial
space located within industrial logistics properties. At 820,000 SF of total industrial inventory, North Port is home to 1.5% of all industrial inventory
in the Sarasota and Punta Gorda markets. Most of the North Port’s industrial inventory is classified as warehouse space, which currently makes up
88% of total industrial space in North Port.
While the Sarasota Outlying submarket (where North Port resides) has seen limited inventory growth over the last five years, the Manatee
submarket, at close to 1.0 million SF continued to grow at over 7-times the amount of total inventory added to the Sarasota Outlying submarket.
As of Q4 2020, the Sarasota Outlying submarket had 425,000 SF of industrial inventory under construction, representing approximately 5.5% of
total inventory in the submarket, and 95% of all industrial inventory under construction in the Sarasota market. Two properties under construction
currently reside in North Port. The first property includes 285,000 SF of distribution space on I-75 and Toledo Blade Blvd. that has been leased by
Guardian Pharmacy of Southwest Florida. The second property includes 20,000 SF of industrial space on Innovation Ave2. The final project under
construction in the Sarasota market includes a 120,000 SF property in Venice, which will be used as distribution space for an Amazon Fulfilment
Center.
Vacancy rates for all major industrial property types within the Sarasota market have decreased by 50% or more over the past five years, with rates
generally below the national average. However, the Sarasota market’s industrial vacancies have consistently risen over the past two years to 3.6%
as of Q4 2020. With a vacancy rate of 1.7%, the Sarasota Outlying submarket had the lowest vacancy rate of any submarket in the Sarasota and
Punta Gorda markets.
From 2015 to 2020, specialized Industrial space (consisting primarily of manufacturing space) had a lower vacancy rate than any other industrial
property type.
At $9.81/SF in Q4 2020, the Sarasota Outlying submarket had the second highest market rent/SF, trailing only the Manatee Outlying submarket at
$9.95. At $9.18/SF, market rent per SF for industrial properties located within the City of North Port were lower than both the Sarasota Outlying
submarket and the Sarasota Market average.
1Inventory is reflective of rentable building area (RBA). Rental Building Area (RBA) expressed in square feet (SF) includes the usable area and its associated share of the common areas
within a building. It is the space the tenant will occupy in addition to the associated common areas of the building such as the lobby, hallways, bathrooms, equipment rooms, etc.
2 Tenant and Lease data were not available for this property in CoStar.

City of North Port, FL – Real Estate Inventory
21 | P a g e
The Sarasota market’s annual industrial rent growth has continued a two-year slowing pattern in 2020 and has fallen roughly 1% since March.
However, rent growth rates are still high from a historical standpoint and are forecasted to continue to stay slightly above the national average
through 2021. Rent growth over the past three years has been primarily driven by the logistics sector, though all property types have performed
above average.
The industrial sector appears somewhat insulated from the pandemic both nationally and regionally which should help temper downward pressure
on rents from the crisis. Investment activity in the Sarasota market had slowed over the six quarters leading into the pandemic and came to an
abrupt halt during the second and third quarters of 2020. However, industrial sales volume surged in the third quarter with the largest individual
quarterly total in the past 15 years, with the bulk coming from the $60.5 million sale of Gatewood Corporate Center in Bradenton. Nationally, other
large transactions have also occurred because of various industries trying to take advantage of lower relative prices of industrial space, and a
continued potential surge in e-commerce which would drive up demand for industrial, and more specifically logistics properties in the future.

City of North Port, FL – Real Estate Inventory
22 | P a g e
INDUSTRIAL MARKET PROFILE – INVENTORY
As of Q4 2020, there was approximately 53 million SF of industrial inventory in the Sarasota and Punta Gorda markets, with almost half of total
inventory residing in the Manatee submarket3. In all, 73% of industrial inventory in the Sarasota and Punta Gorda markets are within industrial
logistics properties, followed by specialized industrial properties at 20% of total inventory.4
3Inventory is reflective of rentable building area (RBA). Rental Building Area (RBA), expressed in square feet (SF) includes the usable area and its associated share of the common areas
within a building. It is the space the tenant will occupy in addition to the associated common areas of the building such as the lobby, hallways, bathrooms, equipment rooms, etc.
4 Logistics properties are primarily comprised of properties classified by CoStar as warehouses. Specialized Industrial space is primarily comprised of properties classified by CoStar as
general or specialized manufacturing properties. Flex properties are those that contain a combination of office space (typically 50% of RBA) and other space that is used for industrial,
warehouse, distribution, research and development, and/or manufacturing activities.
Total Industrial Inventory (SF) by Submarket (Q4 2020)
Percent of Total Industrial Inventory (SF) by
Industrial Property Type

City of North Port, FL – Real Estate Inventory
23 | P a g e
INDUSTRIAL MARKET PROFILE – INVENTORY (CONTINUED)
The following map displays industrial properties within both the Sarasota and Puna Gorda Markets:
Industrial Properties by Submarket

City of North Port, FL – Real Estate Inventory
24 | P a g e
INDUSTRIAL MARKET PROFILE – VACANCY, ABSORPTION, AND DELIVERIES
The Sarasota industrial market has seen vacancies consistently rise over the past two years, although the overall market remains tight with rates
below 5%. Even with the rising vacancies, the market's average vacancy rate is still just 3.6%, well below the national average of 5.7%. After spiking
in late 2018 and early 2019, new inventory deliveries have stabilized over the last 18 months. The market’s industrial construction pipeline has
increased in 2020, though most of it has been preleased and is unlikely to greatly impact absorption trends.
Sarasota Industrial Market Vacancy, Absorption, and Delivery Trends (2015 – 2025)

City of North Port, FL – Real Estate Inventory
25 | P a g e
INDUSTRIAL MARKET PROFILE – NORTH PORT INDUSTRIAL INVENTORY
As of Q4 2020, there were approximately 44 industrial properties in North Port containing a total inventory of just over 820,000 SF,
representing1.5% of all industrial inventory in the Sarasota and Punta Gorda markets. A majority of North Port’s industrial inventory is warehouse
space, which currently makes up 88% of total industrial space in North Port. North Port has seen low levels of new inventory deliveries over the
past decade but are forecasted to spike as current inventory under construction is completed in 2021. Net absorption has remained close to zero
over the past five years indicating a general equilibrium in the market, and the industrial vacancy rate as of Q4 2020 in North Port was 0% and have
been below 5% since Q4 2016.
North Port Industrial Inventory Summary (Q4 2020)
Industrial Property Type /
RBA Range
# of
Properties
Total RBA
(SF)
% of Total
RBA
Logistics
10,001 to 15,000 SF 1 14,160 2%
0 to 5,000 SF 5 15,601 2%
5,001 to 10,000 SF 13 100,683 12%
10,001 to 15,000 SF 5 64,097 8%
15,001 to 20,000 SF 5 82,202 10%
20,001 to 25,000 SF 2 47,966 6%
25,001 to 30,000 SF 3 82,131 10%
30,001 to 40,000 SF 4 143,057 17%
40,001 to 50,000 SF 4 185,992 23%
Total Warehouse 41 721,729 88%
Total Logistics 42 735,889 90%
40,001 to 50,000 SF 1 50,000 6%
30,001 to 40,000 SF 1 35,600 4%
Grand Total 44 821,489 100%
Distribution
Specialized Industrial
Warehouse
Manufacturing
Flex
North Port Industrial Vacancy, Absorption, and Deliveries (2010 - 2025)

City of North Port, FL – Real Estate Inventory
26 | P a g e
INDUSTRIAL MARKET PROFILE – TOTAL INVENTORY GROWTH
The Sarasota Outlying submarket (where North Port resides) saw 132,000 SF of new inventory added to the submarket over the last five years. This
growth represented 6% of all new inventory added to the Sarasota and Punta Gorda markets during this time. The Manatee submarket saw the
largest amount of total inventory growth adding 943,000 SF of new inventory to the submarket. This growth equated to over seven-times the
amount of total inventory added to the Sarasota Outlying submarket.
Cumulative Industrial Inventory Growth by Submarket (2015 – Q4 2020)

City of North Port, FL – Real Estate Inventory
27 | P a g e
Under Construction Industrial Inventory as a Percentage of Total Submarket Inventory (Q4 2020)
INDUSTRIAL MARKET PROFILE – INVENTORY UNDER CONSTRUCTION
The following map outlines the amount of new industrial inventory under construction as a percentage of total inventory in the submarket. As of
Q4 2020, the Sarasota Outlying submarket had 425,000 SF of industrial inventory under construction, representing approximately 5.5% of total
inventory in the submarket, and 95% of all industrial inventory under construction in the Sarasota market.
Two properties under construction currently reside in North Port. These projects consist of two properties in North Port. The first property includes
285,000 SF of distribution space on I-75 and Toledo Blade Blvd. that has been leased by Guardian Pharmacy of Southwest Florida. The second
property includes 20,000 SF of industrial space on Innovation Ave5. The final project includes a 120,000 SF property in Venice, which will be used as
distribution space for an Amazon Fulfillment Center.
5 Tenant and Lease data was not available for this property in CoStar.

City of North Port, FL – Real Estate Inventory
28 | P a g e
INDUSTRIAL MARKET PROFILE – VACANCY RATE
As of Q4 2020, the vacancy rate of all industrial properties in the Sarasota and Punta Gorda markets is 3.6% and 2.4%. With a vacancy rate of 1.7%,
the Sarasota Outlying submarket had the lowest vacancy rate of any submarket in the Sarasota and Punta Gorda markets.
Industrial Inventory Vacancy Rate by Submarket (Q4 2020)

City of North Port, FL – Real Estate Inventory
29 | P a g e
INDUSTRIAL MARKET PROFILE – VACANCY RATE
Vacancy rates for all major industrial property types within the Sarasota market have decreased by 20% or more over the past five years, with rates
generally below the national average. From 2015 to 2020, specialized Industrial space (consisting primarily of manufacturing space) had a lower
vacancy rate than any other industrial property type.
Sarasota Market Vacancy Rates by Industrial Property Type (2015 – 2025)

City of North Port, FL – Real Estate Inventory
30 | P a g e
INDUSTRIAL MARKET PROFILE – MARKET RENT
At $9.81/SF in Q4 2020, the Sarasota Outlying submarket (including North Port) had the second highest market rent/SF trailing only the Manatee
Outlying submarket at $9.95. At $9.18/SF, market rent per SF for industrial properties located within the City of North Port was lower than both the
Sarasota Outlying submarket and the Sarasota Market average.
Industrial Market Rent Per SF (Q4 2020)

City of North Port, FL – Real Estate Inventory
31 | P a g e
INDUSTRIAL MARKET PROFILE – MARKET RENT GROWTH
The Sarasota market’s annual industrial rent growth has continued a two-year slowing pattern in 2020 and has fallen roughly 1% since March. Rent
growth over the past three years has been primarily driven by the logistics sector, though all property types have performed above average. Rent
growth rates are still high from a historical standpoint, and are forecasted to continue to stay slightly above the national average through 2021
(increasing dramatically after impacts from the pandemic are anticipated to subside before returning close to historic rates).
Year-Over-Year Industrial Market Rent Growth (2015 – 2025)

City of North Port, FL – Real Estate Inventory
32 | P a g e
Image Provided by CoStar

City of North Port, FL – Real Estate Inventory
33 | P a g e
OFFICE MARKET PROFILE
METHODOLOGY
In order to identify key office real estate trends in the North Port region, two commercial office markets were analyzed, including the Sarasota and
Punta Gorda Office markets. In addition to analyzing these two regional markets, individual submarkets within each market were also analyzed to
gain a more in-depth understanding of localized real estate activity in the region. The map below outlines the Sarasota and Punta Gorda markets
and submarkets in more detail:
# Market Submarket
1 Sarasota Manatee
2 Sarasota Manatee Outlying
3 Sarasota Sarasota
4 Sarasota Sarasota Outlying
5 Punta Gorda Charlotte County
Market and SubMarket Legend

City of North Port, FL – Real Estate Inventory
34 | P a g e
OFFICE MARKET OVERVIEW
OFFICE MARKET OVERVIEW
As of Q4 2020, there was approximately 31 million SF of office inventory in the Sarasota and Punta Gorda markets, with approximately 50% of total
inventory residing in the Sarasota submarket. Together, one- and two-star office space (46%), and three-star office space (44%) make up 90% of
total inventory in the Sarasota and Punta Gorda markets6.
As of Q4 2020, there were approximately 74 office properties in North Port containing a total inventory of just over 550,000 SF. North Port is home
to just under 2% of all office inventory in the Sarasota and Punta Gorda markets. At 48% of total inventory, a majority of North Port’s office
inventory is 3-star office space, followed by 1-and-2-star office space at 43%. Only 52,600 SF of space in North Port is considered 4-or-5 star.
Prior to the coronavirus, the Sarasota market was still largely in equilibrium and though supply has ramped up of late with 150,000 SF of new
inventory being delivered in early 2020, and another 120,000 SF forecasted to be delivered in early 2021. The Sarasota Outlying submarket saw
approximately 25,000 SF of new inventory added to the submarket over the last five years. A little over 10,000 SF of growth in the Sarasota
Outlying market took place in the City of North Port, representing a little less than 50% of new inventory delivered to the submarket over the last
five years. Overall growth in the Sarasota Outlying submarket represented 4% of all new inventory added to the Sarasota and Punta Gorda markets
from 2015 to 2020, with a majority of growth taking place in the Manatee Outlying and Sarasota markets.
Office construction has been slowly increasing over the past year in the Sarasota market, and the roughly 200,000 SF currently underway is the
largest amount in over a decade. Prior to this increase, the Sarasota market’s office construction had been significantly down over the past ten
years. Most supply over recent years has been build-to-suit medical office, such as Mercedes Medical's new roughly 55,000 SF headquarters in
Lakewood Ranch.
At $19.11/SF, market rent per SF for office properties located within the City of North Port were aligned closely with rates seen in the Punta Gorda
Market (Charlotte County) and are approximately 14% lower than rates for the Sarasota Outlying submarket as a whole (where North Port resides
and which also includes South Venice and Englewood). Annual rent growth started to pick up in the Sarasota market in the latter half of 2019 prior
to the coronavirus pandemic, and had further accelerated in early 2020. However, alongside weakening market trends and a more challenging
environment due to the pandemic, annual rent growth has slipped since March of 2020. While the pandemic presents additional downside risk,
rents are still growing at a historically high rate at roughly twice the long-term average and are exceeding the national average, and rent growth
has recently been driven by 3-Star office inventory.
The Sarasota office market had already experienced mild negative net absorption over the year leading into the pandemic, and that downward
trend has accelerated during the second and third quarters of 2020. However, office vacancy in the Sarasota market remains extremely tight by
6 The office building class designation is a way of differentiating buildings of the same building type into different categories of quality. These classes represent a
combination of a subjective and objective quality rating of buildings that indicates the competitive ability of each building to attract similar types of tenants. Each
star rating in this system represents a particular level of quality with five stars indicating the nation's highest quality assets.

City of North Port, FL – Real Estate Inventory
35 | P a g e
historical standards. As of Q4 2020, the vacancy rate of all office properties in the Sarasota and Punta Gorda markets was 6.3% and 5.5% which
were well below national averages. With a vacancy rate of 7.5%, the Sarasota Outlying submarket had the highest vacancy rate of any submarket in
the Sarasota and Punta Gorda markets. However, at 4.5% the City of North Port’s office vacancy rate is lower than rates seen in the Sarasota market
and Sarasota Outlying submarket. While the full impact of the pandemic remains to be seen on Sarasota office trends, signs of shifting occupier
preferences are emerging with some office tenants signaling that work-from-home options may become permanent, leading them to vacate or
downsize their existing office presence which would further impact market vacancy rates.

City of North Port, FL – Real Estate Inventory
36 | P a g e
OFFICE MARKET PROFILE – INVENTORY
As of Q4 2020, there was approximately 31million SF of office inventory7 in the Sarasota and Punta Gorda markets, with approximately 50% of total
inventory residing in the Sarasota submarket. Together, one- and two-star office space (46%), and three-star office space (44%) make up 90% of
total inventory in both markets8.
7 Inventory is reflective of rentable building area (RBA). Rental Building Area (RBA), expressed in square feet (SF) includes the usable area and its associated share of the common areas
within a building. It is the space the tenant will occupy in addition to the associated common areas of the building such as the lobby, hallways, bathrooms, equipment rooms, etc. 8 The office building class designation is a way of differentiating buildings of the same building type into different categories of quality. These classes represent a
combination of a subjective and objective quality rating of buildings that indicates the competitive ability of each building to attract similar types of tenants. Each
star rating in this system represents a particular level of quality with five stars indicating the nation's highest quality assets.
Total Office Inventory by Submarket (SF)
1000s)
Percent of Total Industrial Inventory (SF) by Office
Property Type

City of North Port, FL – Real Estate Inventory
37 | P a g e
OFFICE MARKET PROFILE – TOTAL INVENTORY (CONTINUED)
The following map displays office properties within both the Sarasota and Punta Gorda markets. A majority of inventory is located within the
Sarasota and Manatee submarkets.
Office Properties by Submarket

City of North Port, FL – Real Estate Inventory
38 | P a g e
OFFICE MARKET PROFILE – VACANCY, ABSORPTION, AND DELIVERIES
The Sarasota office market had already experienced mild negative net absorption over the year leading into the pandemic, and that downward
trend accelerated during the second and third quarters of 2020. However, office vacancy in the Sarasota market remains extremely tight by
historical standards at just under 6% as of Q4 2020.
Prior to the coronavirus, the Sarasota market was still largely in equilibrium, though supply has ramped up of late with just over 150,000 SF of new
inventory delivered in early 2020, and another 120,000 SF forecasted to be delivered in early 2021. While the full impact of the pandemic remains
to be seen on Sarasota office trends, signs of shifting occupier preferences are emerging with some office tenants signaling that work-from-home
options may become permanent, which may lead them to vacate or downsize their existing office presence. The medical office sector is a key
component of the Sarasota office market, primarily due to a large percentage of the market’s population aged 65 and above. The robust education
and health services sector is further enhanced by the presence of Sarasota Memorial Hospital and Doctors Hospital of Sarasota.

City of North Port, FL – Real Estate Inventory
39 | P a g e
OFFICE MARKET PROFILE – NORTH PORT INDUSTRIAL INVENTORY
As of Q4 2020, there were approximately 74 office properties in North Port containing a total inventory of just over 550,000 SF. North Port is home
to 1.7% of all office inventory in the Sarasota and Punta Gorda markets. At 48% of total inventory, a majority of North Port’s office inventory is 3-
star office space, followed closely by 1-and-2-star office space at 43%. A small amount of new inventory has been delivered to North Port over the
last decade, with the largest amount coming in 2020 when just over 10,000 SF of new inventory was delivered to the market. Since spiking in 2011
to 30% during the recession, office vacancy rates have dropped to 4.5% in North Port as of Q4 2020.
North Port Office Inventory Summary
Office Property Type
/ RBA Range
# of
Properties
Total RBA
(SF)
% of Total
RBA
1 & 2 Star
2,001 to 4,000 18 52,597 10%
4,001 to 6,000 10 53,462 10%
8,001 to 10,000 4 37,679 7%
1,000 to 2,000 4 7,650 1%
6,001 to 8,000 3 20,697 4%
30,001 to 40,000 1 31,776 6%
10,001 to 15,000 1 11,440 2%
20,001 to 25,000 1 20,380 4%
Total 1 & 2 Star 42 235,681 43%
3 Star
2,001 to 4,000 10 30,370 6%
4,001 to 6,000 7 36,014 7%
6,001 to 8,000 4 28,204 5%
8,001 to 10,000 5 44,088 8%
15,001 to 20,000 1 16,320 3%
20,001 to 25,000 3 65,061 12%
40,001 to 50,000 1 43,839 8%
Total 3 Star 31 263,896 48%
50,001 to 60,000 1 52,600 10%
Grand Total 74 552,177 100%
4 & 5 Star
Percent of Industrial Inventory (SF) by Office
Property Type (North Port)
North Port Office Vacancy, Absorption, and Deliveries (2010 – 2025)

City of North Port, FL – Real Estate Inventory
40 | P a g e
OFFICE MARKET PROFILE – TOTAL INVENTORY GROWTH
The Sarasota Outlying submarket saw approximately 25,000 SF of new inventory added to the submarket over the last five years. A little over
10,000 SF of growth in the Sarasota Outlying market took place in the City of North Port, representing a little less than 50% of new inventory
delivered to the submarket over the last 5 years. Overall growth in the Sarasota Outlying submarket represented 4% of all new inventory added to
the Sarasota and Punta Gorda markets from 2015 to 2020. The Manatee Outlying submarket saw the largest amount of total inventory growth
adding 243,000 SF of new inventory to the submarket. This growth equated to almost 10-times the amount of total inventory added to the
Sarasota Outlying submarket.
Cumulative Office Inventory Growth (SF) by Submarket (2015 – Q4 2020)

City of North Port, FL – Real Estate Inventory
41 | P a g e
OFFICE MARKET PROFILE – INVENTORY UNDER CONSTRUCTION
The following map outlines trends in office inventory under construction as a percentage of total inventory in each submarket. As of Q4 2020,
there was approximately 214,000 SF of office space under construction in both the Sarasota and Punta Gorda markets, which is the largest amount
of new inventory under construction in over a decade. A majority of inventory under construction is located in the Sarasota and Bradenton area,
and approximately 65% of inventory is pre-leased. Much of the new office inventory in the market in recent years has been build-to-suit medical
office, such as Mercedes Medical's new 55,000 SF headquarters in Lakewood Ranch.
Under Construction Office Inventory as a Percentage of Total Submarket Inventory (Q4 2020)

City of North Port, FL – Real Estate Inventory
42 | P a g e
OFFICE MARKET PROFILE – VACANCY RATE
As of Q4 2020, office vacancy rates in the Sarasota and Punta Gorda markets were 6.3% and 5.5%, respectively. With a vacancy rate of 7.5%, the
Sarasota Outlying submarket had the highest vacancy rate of any submarket in the Sarasota and Punta Gorda markets. However, at 4.5% the City
of North Port’s office vacancy rate is lower than rates seen in the Sarasota market and Sarasota Outlying submarket.
Industrial Inventory Vacancy Rate by Submarket (Q4 2020)

City of North Port, FL – Real Estate Inventory
43 | P a g e
OFFICE MARKET PROFILE – VACANCY RATE
In recent years, vacancy rates for all major office property types within the Sarasota market have and are forecasted to remain steady around 5%-
6%. Vacancy rates remain and are forecasted to remain below the national average for office property over the next 5 years.
Sarasota Market Vacancy Rates by Office Property Type (2015 – 2025)

City of North Port, FL – Real Estate Inventory
44 | P a g e
OFFICE MARKET PROFILE – MARKET RENT
At $19.11/SF, market rent per SF for office properties located within the City of North Port were aligned closely with rates seen in the Punta Gorda
market (Charlotte County) and are approximately 14% lower than rates for the Sarasota Outlying submarket (where North Port resides).
Office Market Rent Per SF by Submarket (Q4 2020)

City of North Port, FL – Real Estate Inventory
45 | P a g e
OFFICE MARKET PROFILE – MARKET RENT GROWTH
Annual rent growth started to pick up in the Sarasota market in the latter half of 2019 prior to the coronavirus pandemic and had further
accelerated in early 2020. However, alongside weakening market trends and a more challenging environment due to the pandemic, annual rent
growth has slipped since March of 2020. While the pandemic presents additional downside risk, rents are still growing at a historically high rate at
roughly twice the long-term average and are exceeding the national average and rent growth has recently been driven by 3-Star office inventory.
With historically low vacancy rates and limited construction, the likelihood of supply-side pressure on rents is low; however, office demand has
shown signs of weakening, along with softening office using employment, which could continue to have a lagged impact on rent growth. Despite
largely increasing rent gains for the majority of the past five years, average rents remain below the prior recession's peak. The Sarasota market was
one of the few Florida office markets to not have office market rents fully recover from the past recession, and even before the expected impact
from coronavirus, Sarasota was still more than $2 below market rent historic highs.
Year-Over-Year Sarasota Office Market Rent Growth (2015 – 2025)

City of North Port, FL – Real Estate Inventory
46 | P a g e
Image Provided by CoStar

City of North Port, FL – Real Estate Inventory
47 | P a g e
RETAIL MARKET PROFILE
METHODOLOGY
In order to identify key retail real estate trends in the North Port region two retail markets were analyzed, including the Sarasota and the Punta
Gorda retail markets. In addition to analyzing these two regional markets, individual submarkets within each market were also analyzed to gain a
more in-depth understanding of localized real estate activity in the region. The map below outlines the Sarasota and Punta Gorda multifamily
markets and submarkets in more detail:
Sarasota and Punta Gorda Retail Markets and Submarkets
# Market Submarket
1 Sarasota Manatee
2 Sarasota Manatee Outlying
3 Sarasota Sarasota
4 Sarasota Sarasota Outlying
5 Punta Gorda Charlotte County
Market and SubMarket Legend

City of North Port, FL – Real Estate Inventory
48 | P a g e
RETAIL MARKET OVERVIEW
RETAIL MARKET OVERVIEW
As of Q4 2020, there was approximately 62 million SF of retail inventory in the Sarasota and Punta Gorda markets, with approximately 40% of
inventory residing in the Sarasota submarket and 30% in the Manatee submarket. In North Port specifically, there are approximately 155 retail
properties containing a total inventory of just over 2.5 million SF. Overall, North Port’s existing retail inventory accounts for approximately 4% of all
retail inventory in the Sarasota and Punta Gorda markets.
The coronavirus outbreak has already caused significant economic disruption in the Sarasota retail market, including numerous closures since the
pandemic began. Although the bulk of rent losses have been felt in malls, nearly all retail property types have seen slowing rent growth. Despite
this, the average vacancy rate in the Sarasota market remains low from a historical standpoint. This trend is also true in North Port where the
current retail vacancy rate stands at 3.5% as of Q4 2020. While developer activity appeared to be on the rise with numerous retail properties under
construction and an increasing proposed pipeline in the Sarasota market, construction levels at the onset of the pandemic were still manageable
and roughly in-line with long-term delivery averages in the Sarasota market. In North Port, developer activity last spiked in 2018 when almost
100,000 SF of new inventory was delivered to the market, which equates to 20% of all new inventory added to the Sarasota Outlying submarket in
the last five years. North Port has seen very little new construction or delivery activity underway since.
Retail demand in the Sarasota market receives significant growth from tourism, thanks to world-class beaches and a variety of nightlife and cultural
attractions, most notably located along the western coast of the Sarasota market. Even with drops in tourism due to the pandemic, the Sarasota
market has been a rare exception in 2020, as retail sales volume not only saw minimal drop off in the second quarter but also gained momentum
during the third quarter. The majority of peer markets have seen a significant decline in activity during this time. As a further reflection of the prior
strong retail demand, the Sarasota market and North Port’s retail industry had been one of the fastest job growth sectors in recent years. With the
retail sector appearing to be more exposed to the effects of the pandemic compared to other property types (i.e., office, industrial, etc.) the
market's higher relative exposure to retail trade could represent an elevated pandemic risk compared to the nation.

City of North Port, FL – Real Estate Inventory
49 | P a g e
RETAIL MARKET PROFILE – TOTAL INVENTORY
As of Q4 2020, there was approximately 62million SF of retail inventory9 in the Sarasota and Punta Gorda markets, with approximately 40% of
inventory residing in the Sarasota submarket and 30% in the Manatee submarket.
9 Inventory is reflective of rentable building area (RBA). Rental Building Area (RBA) expressed in square feet (SF) includes the usable area and its associated share of the common areas
within a building. It is the space the tenant will occupy in addition to the associated common areas of the building such as the lobby, hallways, bathrooms, equipment rooms, etc.
Total Retail Inventory by Submarket (SF)

City of North Port, FL – Real Estate Inventory
50 | P a g e
RETAIL MARKET PROFILE – TOTAL INVENTORY (CONTINUED)
A retail property's primary intended use is to promote, distribute or sell products and services to the general public. Retail buildings can be used
for various sales opportunities related to both products and services. CoStar classifies retail properties into a number of different categories,
including general retail, strip center retail, neighborhood center retail, power center retail, malls, and other retail properties
As of Q4 2020, a majority (51%) of inventory in the Sarasota and Punta Gorda retail markets were within general retail10 properties, followed by
neighborhood center properties at 30%
10General Retail: A single or multiple stand-alone unattached retail properties with no major anchor.
Neighborhood Center: Provides for the sales of convenience goods (food, drugs, etc.) and personal services (laundry, dry cleaning, etc.) for day-to-day living needs
of the immediate neighborhood with a supermarket being the principal tenant.
Strip Center: A strip center is an attached row of stores or service outlets managed as a coherent retail entity, with on-site parking usually located in front of the
stores. Open canopies may connect the storefronts, but a strip center does not have enclosed walkways linking the stores.
Power Center: The center typically consists of several freestanding (unconnected) anchors and only a minimum amount of small specialty tenants. A Power Center
is dominated by several large anchors, including discount department stores, off-price stores, warehouse clubs, or stores that offer tremendous selection in a
particular merchandise category at low prices.
Mall: A mall is a center for various storefronts that are concentrated in one or more buildings that are connected to one another through shared corridors and
walkways.
Percent of Total Retail Inventory (SF) by Retail Property Type

City of North Port, FL – Real Estate Inventory
51 | P a g e
RETAIL MARKET PROFILE – TOTAL INVENTORY (CONTINUED)
The following map displays retail properties within both the Sarasota and Punta Gorda Markets:
Retail Properties by Submarket

City of North Port, FL – Real Estate Inventory
52 | P a g e
RETAIL MARKET PROFILE – VACANCY, ABSORPTION, AND DELIVERIES
Retail vacancies have slipped over the past year primarily due to the coronavirus outbreak. Despite the looser conditions, the average vacancy rate
in the Sarasota market remains tight from a historical standpoint. While developer activity appeared to be on the rise with numerous retail
properties under construction and an increasing proposed pipeline, construction levels at the onset of the crisis were still manageable and roughly
in-line with long-term delivery averages. As a further reflection of the prior strong retail demand, Sarasota's retail industry had been one of the
fastest job growth sectors in recent years. With the retail sector appearing to be more exposed to the effects of the pandemic compared to other
property types (i.e., office, industrial, etc.) the market's higher relative exposure to retail trade could represent an elevated pandemic risk compared
to the nation.
Sarasota Retail Market Vacancy, Absorption, and Delivery Trends (2015 – 2025)

City of North Port, FL – Real Estate Inventory
53 | P a g e
RETAIL MARKET PROFILE – NORTH PORT RETAIL INVENTORY
As of Q4 2020, there were approximately 154 retail properties in North Port containing a total inventory of just over 2.5 million SF. North Port’s
existing retail inventory accounts for approximately 4% of all retail inventory in the Sarasota and Punta Gorda markets. At 88 properties containing
approximately 41% of total retail inventory, a majority of North Port’s retail inventory is classified as general retail space with the large amount of
that inventory existing in 100,000+ SF buildings.
Over the past decade, vacancy rates in North Port have been volatile, with retail vacancies dropping by approximately 50% in the early part of the
decade before increasing from Q3 2015 to Q4 2017, and eventually dropping and stabilizing at around 3.5% leading up to Q4 2020. Developer
activity last spiked in 2018 when almost 100,000 SF of new inventory was delivered to the market, but the market has seen very little new
construction or activity underway since. Net absorption has been close to zero since the end of 2018, and is forecasted to remain the same in the
coming years as the market remains tight and little inventory is expected to come online.
North Port Retail Vacancy, Absorption, and Deliveries (2010 – 2025)
North Port Retail Inventory Summary (Q4 2020)
# of
Properties
Total
Inventory
(SF)
% of Total
Inventory
General Retail 88 1,030,255 41%
Retail Neighborhood Center 25 564,639 22%
Retail Power Center 10 494,563 19%
Retail Strip Center 31 449,658 18%
Grand Total 154 2,539,115 100%

City of North Port, FL – Real Estate Inventory
54 | P a g e
RETAIL MARKET PROFILE – TOTAL INVENTORY GROWTH
The Sarasota Outlying submarket saw approximately 542,000 SF of new inventory added to the submarket over the last 5 years. A little over
100,000 SF of growth in the Sarasota Outlying market took place in the City of North Port, representing close to 20% of new inventory delivered to
the submarket over the last five years. Overall growth in the Sarasota Outlying submarket represented 13% of all new inventory added to the
Sarasota and Punta Gorda markets from 2015 to 2020. The Sarasota submarket saw the largest amount of total inventory growth adding 1.7
million SF of new inventory to the submarket. This growth equated to 3-times the amount of total inventory added to the Sarasota Outlying
submarket.
Cumulative Retail Inventory Growth by Submarket (2015 – Q4 2020)

City of North Port, FL – Real Estate Inventory
55 | P a g e
RETAIL MARKET PROFILE – INVENTORY UNDER CONSTRUCTION
The following map outlines trends in retail inventory under construction as a percentage of total inventory in each submarket. As of Q4 2020, there
was a little over 500,000 SF of retail space under construction in both the Sarasota and Punta Gorda markets. A little over 50% of inventory under
construction is located in the Sarasota submarket.
Under Construction Retail Inventory as a Percentage of Total Submarket Inventory (Q4 2020)

City of North Port, FL – Real Estate Inventory
56 | P a g e
RETAIL MARKET PROFILE – VACANCY RATE
As of Q4 2020, retail vacancy rates in the Sarasota and Punta Gorda markets were 4.9% and 3.6%. With a vacancy rate of 8.2%, the Sarasota
Outlying submarket had the highest vacancy rate of any submarket in the Sarasota and Punta Gorda markets. However, at 3.3% the City of North
Port’s office vacancy rate is lower than rates seen in the Sarasota market and Sarasota Outlying submarket.
Retail Inventory Vacancy Rate by Submarket (Q4 2020)

City of North Port, FL – Real Estate Inventory
57 | P a g e
RETAIL MARKET PROFILE – VACANCY RATE
In recent years, vacancy rates for all major retail property types have aligned with historical trends, except for malls which have seen vacancy rates
increase from 3.5% to 14% over the last two years. Along with retail mall property, strip and neighborhood center vacancy rates remain above
averages both for the Sarasota market and nationally.
Sarasota Market Vacancy Rates by Retail Property Type (2015 – 2025)

City of North Port, FL – Real Estate Inventory
58 | P a g e
RETAIL MARKET PROFILE – MARKET RENT
At $19.11/SF, market rent per SF for office properties located within the City of North Port were aligned closely with rates seen in the Punta Gorda
market (Charlotte County) and are approximately 14% lower than rates for the Sarasota Outlying submarket (where North Port resides).
Retail Market Rent Per SF by Submarket (Q4 2020)

City of North Port, FL – Real Estate Inventory
59 | P a g e
RETAIL MARKET PROFILE – MARKET RENT GROWTH
Sarasota's retail rent growth has declined over the past year, primarily weighed down by sagging mall rents. Although there have been a few
standout sectors such as neighborhood centers, the majority of retail properties have seen slowing growth. Given the combined effects of
upcoming deliveries and the ongoing pandemic, asking rents could experience significant downward pressure over the near term. Rents in the
Sarasota market are some of the highest in Southwest Florida, trailing only Naples. Additionally, the Sarasota market commands a premium of just
under 10% over nearby Tampa, though this is largely due to having a higher percentage of overall retail located in highly trafficked, tourist-driven
areas. These areas are exposed to a higher amount of risk for coronavirus impact, so these premiums could be in jeopardy.
Year-Over-Year Sarasota Retail Market Rent Growth (2015 – 2025)

City of North Port, FL – Real Estate Inventory
60 | P a g e
North Port Land Inventory

City of North Port, FL – Real Estate Inventory
61 | P a g e
NORTH PORT LAND INVENTORY
The following section summarizes vacant land inventory within the city of North Port. Land is presented as residential, commercial, and industrial
properties, and individual properties may be comprised of multiple land parcels. Land classifications are based on data provided by CoStar and are
based on the properties’ potential for development.
NORTH PORT LAND INVENTORY OVERVIEW
As of Q4 2020, there were almost 340 properties in North Port classified as ‘land’ in Costar. These properties contain approximately 15,860 acres of
total land in North Port. 8,720 acres or 55% of total available land listed in CoStar is classified as commercial, followed closely by residential land at
7,115 acres or 45% of all land listed in CoStar. Industrial land represents the smallest proportion of available land in North Port at 23 acres, which
equates to less than 1% of total land inventory in North Port. See map on the following page for a geographical representation of where land listed
in Costar is situated.
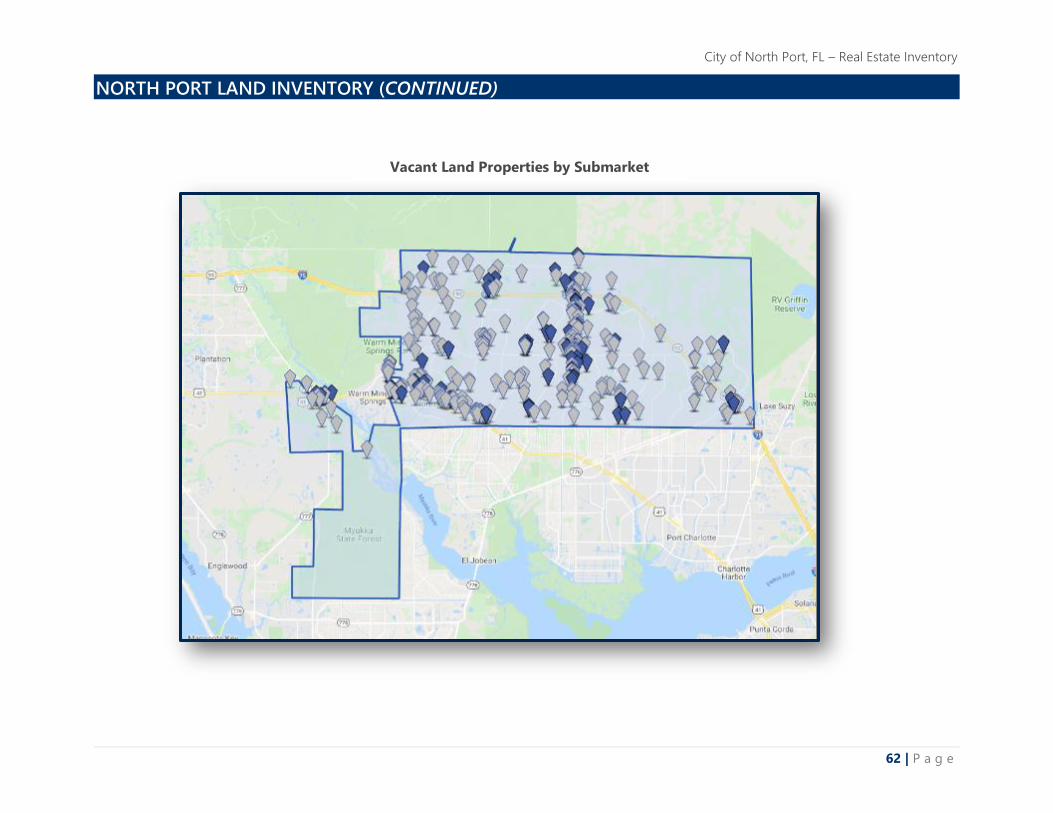
City of North Port, FL – Real Estate Inventory
62 | P a g e
NORTH PORT LAND INVENTORY (CONTINUED)
Vacant Land Properties by Submarket

City of North Port, FL – Real Estate Inventory
63 | P a g e
INDUSTRIAL LAND
A majority of industrial land in North Port is located on Toledo Blade Blvd. between I-75 and East Price Blvd. A majority of industrial land inventory
is within properties that are between greater than five but less than ten acres in size. At 23 acres, industrial land represented the smallest
proportion of land in North Port as of Q4 2020.
COMMERCIAL LAND
Commercial land is present throughout North Port, with larger concentrations of land located along Toledo Blade Blvd and Rt. 41. A majority of
commercial land in North Port is located within properties that are 500 acres or greater, with a large amount residing in one property that is
located along Panacea Blvd. and contains just over 5,100 acres. At 8,720 acres, commercial land represented the largest proportion of land in North
Port as of Q4 2020.
Land Area Range
(Acres)
# of
Properties
Total Land
Area (Acres)
% of Total Industrial
Inventory
% of Total Land
Inventory
< 1 2 1 5% <1%
>1 & <5 6 8 37% <1%
>10 & <20 1 13 58% <1%
Total Industrial 9 23 100% <1%
Industrial Land Summary (Q4 2020)
Land Area Range
(Acres)
# of
Properties
Total Land
Area (Acres)
% of Total Industrial
Land Inventory
% of Total Land
Inventory
< 1 44 25 <1% <1%
>1 & <5 132 287 3% 2%
>5 & <10 21 152 2% 1%
>10 & <20 26 392 4% 2%
>20 & <30 7 167 2% 1%
>30 & <40 4 140 2% 1%
>40 & <50 2 89 1% 1%
>50 & <100 7 462 5% 3%
>100 & <150 2 225 3% 1%
>150 & <200 1 207 2% 1%
>300 & <400 1 390 4% 2%
>500 & <1,000 2 1,028 12% 6%
>5,000 1 5,156 59% 33%
Total Commercial 250 8,720 100% 55%
Commercial Land Summary (Q4 2020)

City of North Port, FL – Real Estate Inventory
64 | P a g e
RESIDENTIAL LAND
Residential land is broadly distributed across North Port. A majority of residential land in North Port is located within properties that are 200 acres
or greater, with a large amount residing in one property that is located along north of the I-75 and Toledo Blade Blvd interchange. At 7,115 acres,
residential land represented the second largest proportion of land in North Port as of Q4 2020.
Land Area Range
(Acres)
# of
Properties
Total Land
Area (Acres)
% of Total
Residential Land
Inventory
% of Total Land
Inventory
< 1 48 16 <1% <1%
>1 & <5 9 21 <1% <1%
>5 & <10 5 32 <1% <1%
>10 & <20 5 80 1% 1%
>20 & <30 3 65 1% <1%
>30 & <40 2 72 1% <1%
>40 & <50 1 40 1% <1%
>50 & <100 3 194 3% 1%
>100 & <150 1 133 2% 1%
>200 & <300 1 296 4% 2%
>300 & <400 1 390 5% 2%
>5,000 1 5,774 81% 36%
Total Residential 80 7,115 100% 45%
Residential Land Summary (Q4 2020)

City of North Port, FL – Real Estate Inventory
65 | P a g e
Opportunity Zone Inventory

City of North Port, FL – Real Estate Inventory
66 | P a g e
The following section provides an inventory of multifamily, office, industrial, retail, and/or land that is located within the opportunity zone, as well
as within the City of North Port’s municipal boundaries.
In the map below, the purple shaded area represents the full opportunity zone area, with the portion outlined in blue representing the area of the
opportunity zone that is within the City of North Port’s municipal boundaries (referred to in this section as the ‘Study Area’). The properties
included in this inventory are also mapped below.

City of North Port, FL – Real Estate Inventory
67 | P a g e
OPPORTUNITY ZONE INVENTORY SUMMARY
LAND
As of Q4 2020, there were a total of 12 land properties within the Study Area containing approximately 100 acres of land. A majority of these
properties are located on San Servando Ave, Ortiz Blvd, and Tamiami Trail.
Two properties are classified as residential land and contain a combined 10 acres of land. These two properties represent 10% of total land in the
study area. The remaining properties are classified as commercial land and contain a combined 88 acres or 90% of total land inventory in the Study
Area.
Property Type Secondary Type Land (Acres)
% of
Total
Land
Land Residential 0.9 1%
Land Residential 9.7 10%
Total 10.6 11%
Land Commercial 19.0 19%
Land Commercial 17.1 17%
Land Commercial 1.9 2%
Land Commercial 6.0 6%
Land Commercial 19.1 19%
Land Commercial 2.7 3%
Land Commercial 4.7 5%
Land Commercial 17.1 17%
Land Commercial 0.2 <1%
Land Commercial 0.2 <1%
Total 88.0 89%
Grand Total 98.5 100%
Opportunity Zone Land Summary (Q4 2020)

City of North Port, FL – Real Estate Inventory
68 | P a g e
OFFICE
There is one property in the Study Area classified as an office property that is located along S. Tamiami Trail. This property has a rental building
area11 (RBA) of just under 10,000 SF.
RETAIL
There are twelve properties in the Study Area classified as retail properties. A majority of these properties are located along S. Tamiami Trail. These
properties have a combined RBA of approximately 86,000 SF.
11 Inventory is reflective of rentable building area (RBA). Rental Building Area (RBA), expressed in square feet (SF) includes the usable area and its associated share of the common areas
within a building. It is the space the tenant will occupy in addition to the associated common areas of the building such as the lobby, hallways, bathrooms, equipment rooms, etc.
Property
Type
Rental Building
Area (SF)
Office 9,669
Total 9,669
Opportunity Zone Office
Summary (Q4 2020)
Property
Type
Rental Building
Area (SF)
% of
Total
RBA
Retail 10,197 12%
Retail 6,750 8%
Retail 4,418 5%
Retail 5,000 6%
Retail 2,640 3%
Retail 3,886 5%
Retail 3,960 5%
Retail 14,781 17%
Retail 2,112 2%
Retail 9,102 11%
Retail 13,806 16%
Retail 9,499 11%
Total 86,151 100%
Opportunity Zone Retail
Summary (Q4 2020)

1
APPENDIX IV
NORTH PORT INTERVIEW/FOCUS GROUP THEMES January 15, 2021
This document reflects interview and focus group findings from conversations conducted as part of
the City of North Port’s Economic Development Feasibility Study. Focus groups spanned the topics
of Business, Manufacturing, Tourism, Workforce, Building/Construction, and
Environment/EcoTourism. The perspectives of interviewees help to solidify initial data findings,
begin to uncover economic opportunities, and assess partnerships among economic development
stakeholders. Statements from interviewees have been paraphrased to keep identities and roles
anonymous. The following is a summary of the findings grouped into major themes.
1-1 interviews occurred with the following individuals:
Larry Fineberg, Benderson Development
Ashley Bloom, SVN
Rick Severance, Mattamy
Homes Mayor Jill Luke, Mayor
of North Port Ron Starner, Site
Selection Magazine
Rep. James Buchanan, Florida House of
Representatives Jason Yarborough, Interim City
Manager of North Port Scott Sensenbrenner,
Enzymedica
Destin Wells, Sarasota EDC
Bill Gunnin, North Port Area Chamber of Commerce
Mike Dunn, Atlanta Braves
ASSETS TO BUILD ON
City-Related
• Currently, the City seems to be at the “right” place to take on challenges involving
sites and economic development.
• Building permits are up 15% since last year at this time.
Tourism
• Wellen Park is starting to build a “sense of place” for the city.
• The regional trail systems and recreation are all a draw to the city.
• Warm Mineral Springs could be a bigger tourism draw.
• The City has gained notoriety since the Braves have come to town.
• North Port has ideal proximity to Sarasota and beaches, which are big tourist draws.
• COVID-19 and the red tide has displaced hospitality and retail workers. This workforce
population could be utilized for job-retraining programs focused on
manufacturing/logistics/light industrial/etc.

2
Development
• Developer confidence in the city is growing– there are new multifamily housing units being
built, and a majority of existing industrial construction activity in the region is happening in
North Port (285,000 SF of distribution space on I-75 and Toledo Blade Blvd. that has been
leased by Guardian Pharmacy of Southwest Florida.)
• The City has affordable housing for the region, and a relatively large amount of new
multifamily inventory is expected to be delivered in the next 18-monts.
• Industrial and office rents are relatively low compared to the region.
Manufacturing
• The manufacturing workforce is near North Port because it is much less expensive for
them to live, but the area is also attractive to executive level individuals because of the
amenities in the area and proximity to Sarasota.
• There is currently a cluster of industrial properties near the I-75 interchange (Toledo Blade
Blvd) with additional land available for buildout.
• The City is well positioned between Tampa and Naples, has proximity to major airports
(Punta Gorda, Tampa, Fort Myers) and proximity to major Ports (Manatee and Tampa).
Manatee is 30 miles from North Port and is one of Florida's largest and fastest growing
deep-water seaports. It is also the closest US deep water port to the Panama Canal.
• The technical college in North Port focuses on workforce readiness for immediate
jobs and placing students into 2-and-4-year colleges.
CHALLENGES FACING THE CITY
City-Related
• The City does not have a comprehensive incentive package to offer businesses/developers.
• Infrastructure is a significant weakness for the city.
• City staff could be more active in land assembly/land banking.
• The City currently has no centralized downtown or significant nightlife.
• The City does not have extensive relationships with many property owners.
• The marketing around the City’s assets could be improved.
• Part of the city’s work will be to differentiate itself from Bradenton which has a significant
office and industrial footprint, in addition to affordable housing.
• Some businesses view the City as difficult to work with based on internal turnover.
• There are perceptions that the City focuses on how to prevent adverse outcomes and not
how to make the business climate more successful.
• ULDC currently prohibiting growth in desired industries.
Workforce
• The unskilled labor force is the hardest to find and keep. This group tends to be very
transient. There are currently 100s of open positions in manufacturing businesses in the
area.
• Hard time recruiting for positions from executives to laborers.

3
• Sarasota Memorial Hospital opened up a new facility along I-75 in Venice that will have
1,000s of
openings.
Site Inventory
• There is a lack of existing facilities and buildings available for someone to move today.
Site and facility readiness will be key.
• Rents and housing prices in North Port were growing at a much faster rate than other cities
in the region the 5-years leading up to the pandemic.
Environment
• Water quality is a significant concern as development continues.
• The canals do offer opportunity for more transportation/recreation if the
surrounding environment is kept up.
• The language to maintain and upkeep natural areas is in the ULDC but does not
seem to be enforced.
• Staffing at the City lacks the specialty knowledge for cultural, historical reviews.
• Protection of the Myakkahatchee Greenway Corridor is well done.
• There is a call for a turn to sustainable development that can allow growth and protect or
integrate natural elements into the design. There are existing resources that speak to this
model.
• It was acknowledged that land assembly is a challenging task but that it can be done, the
School Board was used as an example of an entity that has done this successfully in the
past.
• Financial resources are needed to show dedication to conservation and sustainability.
What if there was a sustainability fee that could be banked to by ecologically sensitive
lands?
COVID-19 RELATED:
• The retail and hospitality sectors are some of the largest employment bases in Sarasota
County and North Port and are some of the highest growth sectors over recent years.
This sector has been one of the hardest hit by the coronavirus and Sarasota's previous
strength may become a temporary weakness.
• While the full impact of the pandemic remains to be seen on Sarasota office trends, signs
of shifting occupier preferences are emerging with some office tenants signaling that
work-from- home options may become permanent, leading them to vacate or downsize
their existing office presence which would further impact market vacancy rates.

1
City of North Port, FL
APPENDIX V - APPROACH TO
INFRASTRUCTURE FINANCING
In general, municipalities rely on either leveraging
existing cash or issuing debt to finance capital
infrastructure projects. Commonly, leveraging cash or
other assets is used in a municipality’s annual budget
and capital improvement process where capital
projects may be smaller in size and can also include
capital maintenance. Additionally, this is used if a
municipality has limited access to debt, if a
municipality is approaching their debt limits, or if
there are exclusions on use of debt in existing
legislation. Debt issuances on the other hand are
often used to fund large infrastructure projects that
benefit both current taxpayers and future
infrastructure users; spreading out the costs of public
infrastructure investments throughout life of an asset.
In either example of financing, sources for funding
local infrastructure generally come from local general
taxes, special funds such as dedicated user fees and
earmarked taxes, intergovernmental grants, bond
proceeds, or some combination of these sources. For
example, local sources for funding for transportation
projects may include state highway aid, general or
capital improvement fund appropriations, user fees
(tolls), and/or bond proceeds. Municipal wastewater
and drinking water infrastructure projects are another
example and are commonly funded by local
wastewater and water supply user fee charges and
debt financings, with some funding from federal and
state grants.
The City of North Port’s Capital
Improvement Program (CIP)
CIP Revenue Sources:
• One Cent Sales Tax Proceeds
• Developer Contributions
• Impact Fees
• Bond Proceeds
• Special Assessment and
District Funds
Funds that support North Port’s CIP
portfolio primarily include:
• Capital Funds
• District Funds
• Enterprise Funds
• General Funds
• Impact Fee Funds
• Special Revenue Funds
Summary of North Port Debt Financing
2010-2020:
• Sales Tax Revenue Bonds
• Capital Leases
• Transportation Improvement
Assessment Bonds
• State Infrastructure Bank
Loans
• Water and Sewer Bonds

2
City of North Port, FL
TAXATION
Tax revenue is commonly used in local infrastructure financing. General taxes refer to broad-based taxes
on residents and businesses. They consist of things like sales tax, property tax, and local income or wage
taxes. These revenue sources are often used to finance local infrastructure projects that create
communitywide benefits such as local streets, transit, and parks and recreation. In addition to general
taxes, many local governments use more narrowly focused taxes either in their general fund or in special
revenue funds and dedicate these revenues to fund local infrastructure projects. Local utility taxes,
telecommunication taxes, and occupancy taxes are examples of revenues that can be deposited into a
special revenue fund, reserving the funds for that specific project.
USER CHARGES
User charges play a big role in local infrastructure finance, particularly for drinking water, wastewater, and
solid waste disposal. Fees are also imposed on local residents and businesses for their use of utilities and
other public enterprises, including tolls, motor vehicle license and registration fees, sewer charges, etc.
User charges are typically collected into an enterprise fund that can fund local infrastructure projects such
as those related to water, airport, wastewater, and parking facilities. Significant user charges such as water
utility fees can be used as the dedicated revenue source to secure revenue bonds.
CAPITAL RESERVES AND FUND BALANCES
Local governments regularly save and accumulate money in capital reserve and/or improvement funds,
and then designate the funds to pay for capital projects. The use of capital reserves is often focused on
smaller less expensive capital projects and/or infrastructure maintenance that are addressed in a
municipality’s annual capital improvement plan. Under certain circumstances, general fund balances can
also become a source for infrastructure financing. Funds can be transferred into a municipality’s capital
improvement fund, or can be used to purchase major equipment to help support infrastructure projects.
GRANT FUNDING
Federal, state, and county grants represent a major funding source of local infrastructure financing. A
variety of federal and state grant programs are available for helping fund local infrastructure projects.
State and/or county funded grants and aid programs are available in many states to help fund streets,
bridges, water utilities, parks, public safety facilities, and many other infrastructure needs.
Cash and Other Fund Financing Debt Financing
Taxation (general and/or dedicated taxes) Loan Financing (Private Bank Loans)
• General Taxes Bond Financing
• Dedicated Taxes • General Obligation Bonds
User Charges • Revenue Bonds
Capital Funds/Reserves and Fund Balance • Private Activity Bonds
Federal, State, and/or County Grants and Aid

3
City of North Port, FL
LOAN FINANCING
Municipalities can secure direct loans from private commercial banks, industrial loan companies, or
industrial banks to fund infrastructure projects.
BOND FINANCING
Municipalities use two general types of bond financing: general obligation bonds (GO) and revenue
bonds. GO bonds are the long-term debt obligations of local governments backed by the issuer’s full faith
and credit, meaning the issuing governments are obligated to repay bonds from their general tax
revenues. GO bonds are traditionally issued to finance projects that have no revenue sources such as fire
stations, public schools, libraries, recreation centers, etc. Revenue bonds are typically issued to finance
public facilities that have definable users with specific revenue streams, such as utilities, toll roads and
bridges, and hospitals. Revenue bonds are secured by the pledge of defined revenue sources generated
from the bond funded projects (user fees, tolls, etc.).
Alternative Methods of Municipal Financing Alternative financing methods include similar concepts or components of traditional infrastructure
funding and financing but structure them in an innovative or alternative way. Often, alternative financing
strategies incorporate creative strategies to raise new funding sources or embrace financial arrangements
such as public private partnerships (P3s) in order to fund infrastructure.
New Funding Sources Financing Strategies Partnerships
New Taxation Public Private Partnerships Sarasota County
Value Capture • Design-Build (DB) Southwest Florida Planning
Council
• Impact Fees • Design-Build-Operate-Maintain
(DBOM)
Florida Power and Light
• Special Assessment
Districts
• Design-Build-Finance-Operate-
Maintain (DBFOM)
• Tax Increment
Financing
NEW TAXATION
New taxes can be authorized by a municipality or by voters for infrastructure-related purposes. Examples
can include new sales tax, fuel tax, or local vehicle taxes. Revenues from these new taxes can be
earmarked or deposited into special revenue or other funds dedicated to local infrastructure projects.
IMPACT FEES
An impact fee is a one-time charge imposed on new businesses or property owners to pay for a share of
the costs of new development activities. Impact fees are commonly used by municipalities to fund public
infrastructure during the development process. In a majority of cases, impact fees must be spent for
improvements that benefit those who pay the fees. Impact fees are commonly used to fund the costs
associated with roads, sewer, storm water, and parks.

4
City of North Port, FL
SPECIAL ASSESSMENT DISTRICTS
Special assessment districts are formed to include an area in which property owners or businesses agree
to pay a special property tax assessment to fund a proposed improvement or service from which they
expect to benefit directly. Business improvement, general improvement, and transportation improvement
districts are all common types of special assessment districts that can be used to fund various types of
infrastructure.
TAX INCREMENT FINANCING
Tax increment financing is a value-capture mechanism dedicated to capturing new or incremental taxes
that are created when underutilized and vacant properties are redeveloped. As property values increase
due to private sector activity spurred by the new infrastructure investment, the tax increment is diverted
to pay the debt incurred for the redevelopment activities. Once the debt is paid off, revenues then return
to the municipality.
PUBLIC PRIVATE PARTNERSHIPS (P3)
P3s are contractual arrangements in which municipalities or other government entities form partnerships
with the private sector to design, finance, build, operate, and/or maintain infrastructure. They’re most
commonly used in the development of transportation infrastructure but can also be used to fund other
infrastructure ranging from parking garages to broadband infrastructure. Different types of P3s exist
because each element of infrastructure development can be combined in a number of ways.
In the design-build (DB) arrangement, a government agency establishes a contract with a private entity
that assumes the design and construction phases of an infrastructure projects.
In the design-build-operate-maintain (DBOM) arrangement, contracted private entities are responsible for
project design and construction, and also take the responsibility of the operation and maintenance of
transportation projects. The municipality is in charge of financing the project and in theory passes risks
related to operating costs and project revenues to the private partner.
In the design-build-finance-operate-maintain (DBFOM) arrangement, private entities also take the
responsibility of fully or partially funding infrastructure projects. Revenue generated from infrastructure
projects is used to pay for the project costs. Public agencies still retain the ownership of privately built
transportation projects.
OTHER PARTNERSHIPS
Additional partner relationships through economic development organizations or private companies
could also support North Port’s ability to develop infrastructure. The Southwest Florida Regional Planning
Council is the region’s Economic Development District (EDD), which means that it sets regional priorities
in relation to federal funding that is typically available through the Economic Development Administration
(EDA). Utility companies like Florida Power and Light also may explore unique funding models based on
the size and scale of the project.

5
City of North Port, FL
Alternative Methods of Local Infrastructure Financing
Strengths Challenges
New Taxation Dedicated to specific projects with
local priorities.
Relatively stable and predictable
revenue sources.
Are commonly voter approved.
Can be subject to rate limitations and
spending restrictions.
Impact Fees Creates nexus to payments and
benefits of new infrastructure.
Often no requirement for voter
approval.
Administration and assessment burden.
Some believe impact fees restrict
economic growth.
Special
Assessment
Districts
Creates nexus to payments and
benefits of new infrastructure.
Often no requirement for voter
approval.
Administration and assessment burden.
Tax Increment
Financing
Provides an incentive to develop
identified areas.
Attracts private sector investment
that may not have been possible
otherwise.
Risk if the gains in property values are
below forecast levels.
Restricted to redevelopment-related
infrastructure activities.
Public Private
Partnerships (P3)
Can shift project finance risks and
long-term operations and
maintenance responsibilities to the
private sector.
Leverages private capital and
expertise.
Can preserve bonding capacity for
future projects.
Complicated contracts and complex
negotiations.
Can create a loss of public control and
flexibility.
Often require an internal expert or
substantial outside consulting throughout
the life of the P3.
Other
Partnerships
Can reduce burden on any one
entity.
Opens up a wider pool of
resources that any one entity
typically has access to.
Supports collaboration.
Relies on buy-in from multiple parties.
Requires managing priorities of multiple
entities.
Could result in comprising on some
portions of the agreement.

1
City of North Port, FL
APPENDIX VI - ACKNOWLEDGEMENTSThank you to many members of the North Port City Staff that participated in and contributed to this report. Contributions received from:
• Economic Development Division
• Planning & Zoning Division
• City Manager’s Office
• Police & Fire
• Public Works
• Utilities
Valuable feedback and contributions were also received from
members of the community, including through the following focus
groups and 1-1 interviews:
Business
David Roth, Chair, North Port Chamber
Nicholas Worden, Community and Economic Development Advisory
Board Chair
Peter Bartolotta, Resident
Sarah Laroque, EarthBalance
Manufacturing
Jeff King, King Plastics
Bayne Beecher, PGT Industries
Workforce
Brett Kemker, Ph.D. University of South Florida
Jenna Thiel, North Port High School
Mireya Eavey, CareerEdge
Mike Endee, Suncoast Technical Center – North Port
Ryan Hale, Ph.D. State College of Florida
Environment
Alice White, People for Trees
Barbara Lockhart, Environmental Conservancy of North Port
Chuck English, People for Trees
Edie Driest, North Port Friends of Wildlife
Lee Hayes Byron, Sarasota UF/IFAS Extension and Sustainability
Steve Koski, Sarasota County Archaeologist

2
City of North Port, FL
Builders
Ivory Matthews, Neal Communities
Jon Mast, Manatee-Sarasota Building Industry Association
Caryn Huff, Wharton Smith Construction Group
Kim French, Willis Smith
Interviews
Ashley Bloom, SVN
Bill Gunnin, North Port Area Chamber of Commerce
Destin Wells, Sarasota EDC
Jason Yarborough, Interim City Manager of North Port
Larry Fineberg, Benderson Development
Mayor Jill Luke, Mayor of North Port
Mike Dunn, Atlanta Braves
Rick Severance, Mattamy Homes
Ron Starner, Site Selection Magazine
Scott Sensenbrenner, Enzymedica
Rep. James Buchanan, Florida House of Representatives