Embed Size (px)
Citation preview

ECONOMIC DEVELOPMENT IN FRAGILE CONTEXTS Learning from success and failure
Alastair McKechnie, Andrew Lightner and Dirk Willem te Velde
May 2018

ECONOMIC TRANSFORMATION IN FRAGILE CONTEXTS: LEARNING FROM SUCCESS AND FAILURE
ii
© SUPPORTING ECONOMIC TRANSFORMATION. The views presented in this publication are those of the author(s) and do not necessarily represent the views of DFID or ODI.
Acknowledgements This paper has been prepared by Alastair McKechnie, Dirk Willem te Velde and Andrew Lightner. We thank Ben Lucy for guidance and comments. Andrew Lightner designed an online interactive data portal that contains much of the data behind this report: https://set.odi.org/interactive-data-portal/ Any errors are the responsibilities of the authors and not of ODI or DFID.

ECONOMIC DEVELOPMENT IN FRAGILE CONTEXTS: LOOKING FOR SUCCESS
iii
CONTENTS Acronyms ____________________________________________________________ iv Executive summary ____________________________________________________ v 1. Introduction _______________________________________________________ 1 2. Why is progress so difficult in fragile contexts? _________________________ 3
2.1 What is a ‘fragile state’ or ‘fragile context’? _______________________________ 3 2.2 Characteristics in the economic structure of fragile states ___________________ 7 2.3 Why is economic development so difficult in fragile contexts and how can private business grow in difficult environments? __________________________________ 11
2.3.1 Security and conflict __________________________________________________ 12 2.3.2 Economic governance ________________________________________________ 13 2.3.3 Economic fundamentals: finance and infrastructure __________________________ 15 2.3.4 Meso-level issues ____________________________________________________ 18 2.3.5 Micro-level characteristics of firms in fragile contexts _________________________ 20
2.4 Conclusions: analysing success in fragile contexts _______________________ 23 3. Successful economic development in fragile contexts ___________________ 23
3.1 What constitutes success and how can it be measured? ___________________ 24 3.2 Which fragile countries have experienced economic success? ______________ 25 3.3 Visualising success ________________________________________________ 28
4. Case study evidence on economic successes in fragile contexts __________ 33 4.1 Overview of the case studies ________________________________________ 33 4.2 What issues emerge from the case studies _____________________________ 33 4.3 Why ultimately has success happened? ________________________________ 35
5. Conclusions and implications _______________________________________ 36 References __________________________________________________________ 38 Appendix A: Fragility typologies and data ________________________________ 41 Appendix B: Case studies of successful investments in fragile contexts _______ 68 B1: Mobile phones in Afghanistan _________________________________________ 69 B2: Construction industry in Liberia – public–private partnerships that induce foreign investment ___________________________________________________________ 75 B3: Public accounting in Liberia – inter-firm partnerships that promote a high quality local profession ____________________________________________________________ 80 B4: From hawala to mobile money – the evolution of the Somali money transfer infrastructure as it responds to domestic and foreign market incentives ____________ 82 B5: Sierra Leone cocoa farming ___________________________________________ 86 B6: Breweries in fragile contexts __________________________________________ 88 B7: Sugar industry in Mozambique ________________________________________ 92

ECONOMIC DEVELOPMENT IN FRAGILE CONTEXTS: LOOKING FOR SUCCESS
iv
ACRONYMS BoP Balance of payments CAR Central African Republic CCEM Caisse Coopérative d'Épargne et de Crédit Mutuel (Rwanda) CEO Chief Executive Officer Cospec Coopérative Solidarité avec les Paysans pour l’Epargne et le Crédit à Cibitoke
(Rwanda) CPIA Country Policy and Institutional Assessment DAC Development Assistance Committee DFID UK Department for International Development DNA Distribuidora Nacional do Açúcar (Mozambique) DPAE Direction Provinciale de l’Agriculture et de l’Élevage (Burundi) DRC Democratic Republic of Congo EUCORD European Cooperative for Rural Development FDI Foreign direct investment GDP Gross domestic product HLPFS High-Level Panel on Fragile States ICT Information and communication technology IFAC International Federation of Accountants IFC International Finance Corporation IFDC International Fertilizer Development Centre IMF International Monetary Fund MDB Multilateral development bank MTO Money Transfer Operator NGO Non-governmental organisation OECD Organisation for Economic Co-operation and Development OPRC Output and Performance Based Road Contract Renamo Mozambican National Resistance SMEs Small and medium enterprises UK United Kingdom UN United Nations US United States WDI World Development Indicators WEF World Economic Forum WLAN Wireless Local Area Network

ECONOMIC DEVELOPMENT IN FRAGILE CONTEXTS: LOOKING FOR SUCCESS
v
EXECUTIVE SUMMARY Transformative economic progress is very challenging in conflict-affected states, but it is not impossible. By identifying and examining a number of rare successful cases, this paper argues there are deep-seated, context specific factors behind why progress may have happened in such cases. This can be summarised as the importance of enabling technically-robust innovations that respond to market conditions and that are implemented in a politically smart way through quality, targeted local leadership. In short, identifying the links between economic analysis and politically smart action is crucial. Categories of fragility We begin this paper by distinguishing among countries that are affected differently by fragility. We divide countries into those countries:
1. Where there is active conflict 2. In transition from conflict to resilience 3. With subnational conflict 4. That are at risk of conflict
Not surprisingly, growth and economic transformation are weak in fragile countries. The agriculture sector dominates, but at the conclusion of a conflict it is the construction sector that tends to grow fastest for the first few years, followed by transport and telecommunications and mining. Exports of fragile states are more concentrated and volatile. GDP per capita growth and labour productivity is lower in more fragile affected states and transport logistics indicators are much weaker. Reasons behind poor performance of fragile countries We identify five general reasons for poor performance in fragile states, which guide the analysis in case studies:
1. Pervasive insecurity or a legacy of or actual armed conflict 2. Governance that falls short of the minimum needed to support a modern market
economy 3. Inadequate infrastructure, primarily physical infrastructure, but also soft infrastructure
such as a basic financial sector and the institutions that support trade 4. Meso-level or sectoral deficiencies that constrain inter-sectoral and inter-firm activity,
which sets back productivity and growth 5. Micro-level characteristics of firms in fragile contexts that constrain their productivity
and contribution to economic transformation Examining success Based on these factors we ask the following questions in order to examine the reasons for success and failure in case studies:
1. What has happened? 2. What is the type of political connection between economic activities and state/state–
business relations? 3. What is the role of the public sector (islands of excellence/experimentation) and
leadership? 4. What is the role of private sector leadership (undergoing transition, capability,
partnerships with foreign entities)?

ECONOMIC DEVELOPMENT IN FRAGILE CONTEXTS: LOOKING FOR SUCCESS
vi
5. How is the private sector coping with risk (security, regulatory, volatility, reputational, clustering)?
6. What is the role of external actors? Identifying cases of success Notwithstanding considerable challenges, the main contribution of this paper is that positive change is possible. To make the point we examine available data. We examine the data based on a new portal designed specifically for this paper (see SET, 2018). Using this data, we statistically identify a range of country-variable pairs that have had success in each of the fragile state categories. These countries include, for example, Afghanistan, Burundi, Liberia, Mozambique, Sierra Leone and Somalia, among others. Quantitative data analysis motivates further analysis of these cases. We then identify instances of progress in these countries, and describe these qualitatively, including:
• Remarkable growth in the number of mobile phone users in Afghanistan: information and communication technology will have economy-wide transformative impacts.
• The development of a local construction industry in Liberia: infrastructure is often a key binding constraint to economic growth, and high-capability local and foreign firms have begun to address this.
• Public accounting in Liberia: services are increasingly important for economic development.
• Telecommunications and money transfer in Somalia: mobile money unlocks many transformative opportunities.
• Investment in cocoa in Sierra Leone: agro-business is a key step in economic transformation.
• Breweries in Burundi and Kenya: jobs in manufacturing are crucial for economic transformation.
• Sugar in Mozambique: from sluggish in 1992 towards the most successful industry in post-conflict Mozambique, sugar is providing a significant number of jobs and livelihoods.
What lies behind success A review of these experiences suggests a number of factors important behind successes.
• Politically smart and productive relationships between investors and the state are nearly always important. For example, the state in Afghanistan allowed a temporary monopoly before competition kicked in. The firms Dahabshil and Hormud in Somalia, working in telecommunications and money transfer, are politically active and influential, lobbying for their own interests and building constituencies that enable them to manage risk. And large firms with large sunk costs, such as breweries (Burundi, Kenya), have close relationships with government.
• Large firms are better able to manage risks than small firms. Large firms may have better access to policy-makers, raising the stakes of failure if governments interfere in their operations, and may be better placed to mobilise external support against political interference. Large firms with political access can also engage in ‘crony capitalism’, though – for example, suppressing competition or entrenching political incumbents. A policy challenge is to ensure that first-mover firms do not become permanent rent-seeking monopolies.
• Firms have coped with risk in other ways as well, including by producing products in high demand such as beer and mobile phone services that are consumed by elites

ECONOMIC DEVELOPMENT IN FRAGILE CONTEXTS: LOOKING FOR SUCCESS
vii
and society more widely; a government that meddles, with effects on the supply of beer or the ability to make phone calls, does so at its peril. Companies have also managed risk through being good corporate citizens, such as the money transfer firms in Somalia, which aligned themselves with religious principles and local values to provide widely used services.
• While the role of the public sector is often minimal in fragile contexts, owing to a lack of capacity, all investors eventually look for a credible commitment from government. Fiscal incentives for breweries (Kenya) and longer-term output- and performance-based contracting in the construction industry (Liberia) are good examples. Public support for the sugar industry (loans, training, access) was helpful in Mozambique.
• In some case, private sector leadership can be a positive force to help develop a sector. For example, Liberia’s professional accountancy organisation responded to competition and developed the industry, building local and international linkages. Foreign direct investment from Mauritius and South Africa was responsible for rehabilitation and upgrading in Mozambique.
• Private sector firms engage in a wide variety of coping strategies to reduce risk. Chinese investors in Liberian construction looked for local capacity; Dahabshil and Hormud issued local shares and engaged in appropriate staff recruitment; and cocoa investors in Sierra Leone took over the role of government in building infrastructure.
• Foreign aid agencies do not always play a major role but can in many cases be helpful. They can become investors in manufacturing companies (e.g. via the International Finance Corporation), provide grants to business associations or help improve the procedures around contracting for construction or promote local sourcing and development of farmer cooperatives.
The drivers of success What really explains the success in these cases, we argue, is a proper understanding of the link between promoting technically sound innovations that respond to markets, are politically smart and are governed well, in a targeted way. Sector characteristics have played a role in the success of the telecommunication sector in Afghanistan, but specific local factors were probably decisive. These include the relationship between government and the first-mover firm in Afghanistan, which had a short-term monopoly before new entrants provided competition that lowered prices and stimulated value-added services. The government’s international partners provided technical support to forward-thinking ministers to develop a competitive telecommunications regime. Building on the hypothesis that politically aware and well-governed local factors are crucial, the Liberia case study shows that a technical fix such as performance-based road construction and maintenance could be introduced successfully in part because of the presence of a willing government intent on change, alongside technical support from an international partner. We also find that working with business-led approaches can effectively achieve results. Outward-looking business associations were responsible for introducing international standards in the accountancy profession in Liberia, while successful expansion of the money transfer system by locally aware private sector actors in Somalia made it possible to circumvent the shortcomings of the state. Further, the synergetic relationship between state and business can be used for scaled-up impacts. For example, in the beer sector in Burundi, there is mutual dependence between state and business in terms of consumption, tax revenues and job creation. Such a relationship can lead to broader economic transformation, such as in moving towards more local sourcing.

ECONOMIC DEVELOPMENT IN FRAGILE CONTEXTS: LOOKING FOR SUCCESS
viii
We conclude that contextual knowledge is crucial. Once the economic, market and political context is well understood, it is much easier to define interventions that work with capable officials or willing businesses. Thus, our findings are consistent with the Fragility Commission (2018) report and other thinking on fragility, that a different approach towards fragile states is needed (see also Manuel, 2018). The approach needs to be targeted, technically sound and politically smart and to work with country counterparts to support their efforts at solving the problems that constrain transformational private investment. Such an approach is nearly always a labour-intensive way of facilitating development outcomes, involving managing the inevitable risks, but it is ultimately more likely than the approaches of the past to achieve substantial results.

ECONOMIC DEVELOPMENT IN FRAGILE CONTEXTS: LEARNING FROM SUCCESS AND FAILURE
1
1. INTRODUCTION While it is common knowledge that countries affected by fragility have faced major challenges in transforming their economies, it is perhaps less well-known that there have been successes in some fragile contexts when political opportunities open, such as at the conclusion of armed conflict and in specific sectors and thematic areas. This paper seeks to understand not only the reasons why progress in economic transformation is so difficult in fragile settings but also whether periods of success can be identified from which we can derive lessons, with the aim of indicating areas for priority action and practical steps that can be taken. The recent Fragility Commission (2018) report rightly argues that a new approach to fragile states is needed, but we need to understand what that could be. As with low-income countries generally, some countries affected by fragility have experienced rapid economic growth, particularly at the end of a conflict, but this growth is typically low quality and not sustained (McMillan et al., 2017). Production tends to concentrate in a few low value-added or resource-based activities which can be subject to significant, adverse shocks. Governments of the g7+ group of fragile states have been critical of the lack of attention by their partners to their priorities of job creation and infrastructure investment. Economic transformation has not been given much attention in fragile settings, even though it may contribute to reducing the risk of future conflict and increase resilience to shocks. The goal that this study seeks – economic transformation in fragile contexts – involves sustained economic growth underpinned by economic transformation – as labour and other resources move from low- to high-productivity sectors, and within-sector productivity growth – plus within-sector productivity growth owing to factors such as better technology, management and behavioural changes. Growth cannot be sustainable without the modern, formal (i.e. registered for tax-paying) private sector taking a leading role in economic development, even though this is unlikely in fragile contexts without government leadership, coordination and focused support. Consequently, case studies on how private firms have successfully navigated the risks inherent in fragile settings provide evidence that supports more general conclusions. The structure of the paper consists of three main sections (Sections 2 through 4), followed by conclusions (Section 5). Section 2 reviews the definitions and challenges of fragility. It first discusses the range of definitions that the World Bank and the Organisation for Economic Co-operation and Development (OECD) use and then presents our own groupings (of which there are four). Subsequently, the section discusses a number of aspects of economic development in fragile states. It argues that fragile states on average have not made significant progress towards economic transformation, and finally, the section reviews why economic development is so difficult in fragile contexts, dividing reasons into five groups which form the basis for analysis of the case studies presented later. Section 3 uses the categories of fragility in Section 2 for empirical analysis, recognising the challenges related to data quality. Using statistical analysis on the data available (SET, 2018), IT identifies a number of fragile countries that have experienced success in one or more economic variables, within these groupings. The statistical identification of success is an essential part of the methodology of this paper, because it shows that despite major known challenges in conceptual terms, progress in specific variables over specific time periods is possible. This crucial observation motivates the examination of what lies behind those cases of positive progress. It is not the case that progress is not possible, but failures are much more pervasive than failure.

ECONOMIC DEVELOPMENT IN FRAGILE CONTEXTS: LEARNING FROM SUCCESS AND FAILURE
2
Section 4 considers a selection of the countries and variables identified in Section 3. It describes seven cases and examines factors behind success in specific contexts in these cases. It asks a set of questions on factors of progress based on the general analysis undertaken in Section 2, concentrating on the how and why of success. The analysis of case studies, motivated by quantitative analysis, focuses on the core drivers of success. The main findings of the case studies are presented in Section 4, with detailed qualitative analyses of progress in each case, including explanations of why progress has happened, laid out in Appendix B. Section 5 concludes.

ECONOMIC DEVELOPMENT IN FRAGILE CONTEXTS: LEARNING FROM SUCCESS AND FAILURE
3
2. WHY IS PROGRESS SO DIFFICULT IN FRAGILE CONTEXTS?
The definition of fragility differs markedly by analysis. Therefore, we first discuss the definition of a fragile state as used in this report (Section 2.1). Subsequently, we discuss the state of transformation in fragile states using some general empirical data (Section 2.2). Finally, we provide a background review of why economic development is so difficult in fragile contexts (Section 2.3). This background provides the conceptual basis for the questions posed in the case studies in Section 4.
2.1 What is a ‘fragile state’ or ‘fragile context’? There is no generally accepted definition of a ‘fragile state’. A definition of fragility depends on how one understands the causes of violence and on the purpose the categorisation serves. Many countries designated as ‘fragile’ object to the term, not least because the designation is perceived as a barrier to investment. Most international partners are now using different terms, such as ‘fragile contexts’ – a term that allows for subnational fragility in otherwise well-functioning states – and ‘resilient states’, which successfully cope with potential drivers of conflict. However, there does seem to be consensus that fragility is related to the risk a country will suffer from organised armed violence. Although this is generally taken to be violence that is politically motivated, there are similarities and often linkages between armed groups with political objectives and those engaged in organised crime. Understanding fragility depends on an understanding of the causes of violence. Collier and others challenged the view that civil war was determined by grievances, arguing that economic factors mattered as much, if not more, than ethnic and religious factors. This provoked a debate that led to a more nuanced understanding of conflict, which recognises that a combination of factors (economic, political, ethnic, tribal, religious, cultural, etc.) are at play in determining the political settlement and its challengers in a particular situation. The search for a better measurement of fragility has also been boosted by Sustainable Development Goal 16, which covers peaceful and inclusive societies, justice and effective, accountable and inclusive institutions – objectives that are not easy to measure. The OECD Development Assistance Committee (DAC) has maintained a list of fragile states, which it uses for its statistical reporting and for its analytical and policy work on conflict. OECD thinking on what constitutes fragility has evolved. It currently sees fragility as a spectrum with political, societal, economic, environmental and security dimensions of the risk of conflict. Fragility of countries is assessed by a combination of measurable indicators (OECD, 2016). Almost any country can be scored against the indicators underlying these dimensions, although there are expert judgements as to which combination of indicators constitutes a high risk of conflict, and some of the indicators depend on data that itself depends on expert judgement that may be coloured by the values of the assessors. The Fund for Peace also generates a Fragility Index for statistical analysis based on an aggregation of variables which are assumed to influence the likelihood of conflict. Similar to the OECD Index, this index is criticised for potential bias in the analysis and selection of indicators. The World Economic Forum (WEF) publishes an annual report on the competitiveness of 137 countries assessed against 12 pillars of development that cover the set of institutions, policies and factors that determine the level of productivity of an economy (see WEF, 2017). WEF competitiveness rankings are correlated with fragility rankings but it is notable that a few countries on fragile states lists also rank in the top half of the WEF rankings – for example Rwanda, owing to the quality of its institutions and efficient markets, and Jordan, because of its good all-round scoring of the indicators.

ECONOMIC DEVELOPMENT IN FRAGILE CONTEXTS: LEARNING FROM SUCCESS AND FAILURE
4
To allocate resources, the World Bank and the regional development banks have retained a list of fragile states that is largely determined by economic factors measured by means of its Country Policy and Institutional Assessment (CPIA), with political factors covered by additional criteria of whether there is a UN or regional peace-keeping or political mission in the country.1 This approach has been criticised because it presents fragility as an economic issue and neglects political grievances, as well as the fundamental problem with all lists of ‘fragile states’ that consider fragility to be binary – that is, a country is fragile or not – whereas most countries exhibit some features of fragility to a greater or lesser extent. The Bank’s analytical work on fragility is leading to convergence with other concepts of fragility and recognition of the growing significance of subnational fragility in countries with adequate aggregate economic growth (World Bank, 2018). Conflict prevention, including in middle-income countries, has taken the attention of the international community, and is a priority of the UN Secretary General. This is the result not least of human suffering, forced displacement and destruction in Syria, Libya and Yemen, which illustrate the tremendous cost of conflict to the respective country, to the wider region and globally, and the difficulties of ending conflict once it has started. Inclusive economic development that involves increasing formal sector employment and private sector development may be crucial for increasing resilience to conflict, but may require departures from traditional approaches in fragile settings. We define a categorisation of states by the pervasiveness or risk of violent-conflict for the purpose of policy research on economic transformation. We focus on one element of fragility for which a consensus seems to exist: the prevalence or likelihood of conflict. We have prepared a list of fragile situations that can describe 51 countries, under the following headings:
1. Countries where there is active conflict (7 countries): Afghanistan, Iraq, Libya, Somalia, South Sudan, Syria, Yemen
2. Countries in transition from conflict to resilience (16): Burkina Faso, Central African Republic (CAR), Chad, Comoros, Côte d’Ivoire, Democratic Republic of Congo (DRC), The Gambia, Guinea Bissau, Haiti, Kosovo, Lebanon, Liberia, Madagascar, Papua New Guinea, Sierra Leone, Timor Leste
3. Countries with subnational conflict (7): Cameroon, Colombia, Mali, Nigeria, Pakistan, Philippines, Sri Lanka, Ukraine
4. Countries at risk of conflict (21): see list of countries in Appendix A Appendix A discusses the definitions of these criteria and the selection of countries in more depth. Table 1 below summarises the list of countries and fragility flags and compares our definitions with those of the OECD and the World Bank.
1 The World Bank is prohibited under its articles from taking lending decisions on political factors. The criterion of peace-keeping or political missions is an objective proxy for political or security tensions that are not captured in the CPIA. The World Bank’s Board has not allowed the public release of the CPIAs of middle-income countries that do not borrow from the Bank’s concessional window. Several middle-income countries have had CPIAs below the fragility cut-off of 3.2 but these cannot be included in the list unless they have UN or regional specialised missions. The World Bank list of fragile states is available at http://pubdocs.worldbank.org/en/154851467143896227/FY17HLFS-Final-6272016.pdf

ECONOMIC DEVELOPMENT IN FRAGILE CONTEXTS: LEARNING FROM SUCCESS AND FAILURE
5
Table 1: Which countries are defined as fragile? Perspectives compared
Country SET Violent Conflict Index
Within OECD Index Within World Bank Index
Afghanistan Active conflict Within OECD Index Within WB Index
Yemen Active conflict Within OECD Index Within WB Index
Iraq Active conflict Within OECD Index Within WB Index
Somalia Active conflict Within OECD Index Within WB Index
Syria Active conflict Within OECD Index Within WB Index
Libya Active conflict Within OECD Index Within WB Index
South Sudan Active conflict Within OECD Index Within WB Index
Lesotho At risk of conflict Within OECD Index Outside WB Index
Korea PDR At risk of conflict Outside OECD Index Outside WB Index
Jordan At risk of conflict Outside OECD Index Outside WB Index
Iran At risk of conflict Outside OECD Index Outside WB Index
Guatemala At risk of conflict Within OECD Index Outside WB Index
Georgia At risk of conflict Outside OECD Index Outside WB Index
Ethiopia At risk of conflict Within OECD Index Outside WB Index
Eritrea At risk of conflict Within OECD Index Within WB Index
Guinea At risk of conflict Within OECD Index Outside WB Index
Malawi At risk of conflict Within OECD Index Outside WB Index
Moldova At risk of conflict Outside OECD Index Outside WB Index
Mauritania At risk of conflict Within OECD Index Outside WB Index
El Salvador At risk of conflict Outside OECD Index Outside WB Index
Mozambique At risk of conflict Within OECD Index Outside WB Index
Nepal At risk of conflict Outside OECD Index Outside WB Index
Niger At risk of conflict Within OECD Index Outside WB Index
Peru At risk of conflict Outside OECD Index Outside WB Index
Swaziland At risk of conflict Within OECD Index Outside WB Index
Tajikistan At risk of conflict Within OECD Index Outside WB Index
Turkey At risk of conflict Outside OECD Index Outside WB Index
Uganda At risk of conflict Within OECD Index Outside WB Index
Uzbekistan At risk of conflict Outside OECD Index Outside WB Index
Venezuela At risk of conflict Within OECD Index Outside WB Index
Malaysia At risk of conflict Outside OECD Index Outside WB Index
Egypt At risk of conflict Within OECD Index Outside WB Index

ECONOMIC DEVELOPMENT IN FRAGILE CONTEXTS: LEARNING FROM SUCCESS AND FAILURE
6
Country SET Violent Conflict Index
Within OECD Index Within World Bank Index
Zimbabwe At risk of conflict Within OECD Index Within WB Index
Bangladesh At risk of conflict Within OECD Index Outside WB Index
Burundi At risk of conflict Within OECD Index Within WB Index
Azerbaijan At risk of conflict Outside OECD Index Outside WB Index
Congo At risk of conflict Within OECD Index Outside WB Index
Algeria At risk of conflict Outside OECD Index Outside WB Index
Philippines Subnational conflict Outside OECD Index Outside WB Index
Sri Lanka Subnational conflict Outside OECD Index Outside WB Index
Cameroon Subnational conflict Within OECD Index Outside WB Index
Pakistan Subnational conflict Within OECD Index Outside WB Index
Nigeria Subnational conflict Within OECD Index Outside WB Index
Ukraine Subnational conflict Outside OECD Index Outside WB Index
Colombia Subnational conflict Outside OECD Index Outside WB Index
Mali Subnational conflict Within OECD Index Within WB Index
DRC Transition from conflict Within OECD Index Within WB Index
Solomon Islands Transition from conflict Within OECD Index Within WB Index
Sierra Leone Transition from conflict Within OECD Index Within WB Index
Papua New Guinea Transition from conflict Within OECD Index Within WB Index
Madagascar Transition from conflict Within OECD Index Within WB Index
Lebanon Transition from conflict Within OECD Index Within WB Index
Kosovo Transition from conflict Outside OECD Index Within WB Index
Burkina Faso Transition from conflict Within OECD Index Outside WB Index
Haiti Transition from conflict Within OECD Index Within WB Index
Guinea Bissau Transition from conflict Within OECD Index Within WB Index
CAR Transition from conflict Within OECD Index Within WB Index
Chad Transition from conflict Within OECD Index Within WB Index
Gambia Transition from conflict Within OECD Index Within WB Index
Comoros Transition from conflict Within OECD Index Within WB Index
Côte d'Ivoire Transition from conflict Within OECD Index Within WB Index
Timor Leste Transition from conflict Within OECD Index Outside WB Index
Liberia Transition from conflict Within OECD Index Within WB Index
West Bank and Gaza Transition from conflict Within OECD Index Within WB Index

ECONOMIC DEVELOPMENT IN FRAGILE CONTEXTS: LEARNING FROM SUCCESS AND FAILURE
7
2.2 Characteristics of the economic structure of fragile states The economies of fragile states are dominated by the agriculture sector. The process of moving labour out of lower-productivity agriculture and into high-productivity activities is crucial for structural change. However, fragile states on average have a higher proportion of employment within the agriculture sector and lower rates of change out of agriculture production and into higher-value manufacturing and services. For example, from 1991 to 2016, states in transition from violent conflict to a more stable political settlement reduced the employment share in agriculture by 16 percent whereas those with limited conflict recorded reductions of over 28 percent. In 2016, countries transitioning from conflict had twice the proportion of employment in agriculture as those with limited conflict. Figure 1 displays the relationship between employment shares by sector and their respective Fund for Peace Fragility Index score. The relationship between employment in agriculture and the fragility index is strong - even if a causal relationship between the measures is not well identified.
Figure 1: Economic structure (employment in sector as % of total) in fragility-affected countries
Note: Employment data originates from the UN Statistics Division and the ILOStat database. Each circle represents a country-year observation between 2004 and 2016. Orange refers to states examined within the OECD Spectrum whereas purple refers to those outside the OECD analysis. These plots can be recreated at odi-dataportal.nanoapp.io, where the underlying data is also accessible. Source: Own analysis. Vertical axes are based on gross value-added for sector obtained from UN Statistical Division databases. World Bank classification of fragile states (see appendix). The Fund for Peace Fragility index was used as a measure of fragility.

ECONOMIC DEVELOPMENT IN FRAGILE CONTEXTS: LEARNING FROM SUCCESS AND FAILURE
8
Large variation in the relationship between fragility and the remaining sectors suggests that the size of these sectors is driven significantly by context-specific conditions rather than broad trends related to conflict. For example, some fragile states record significant reallocation to the construction sector in a post-war context (Iraq and Lebanon).2 However, other states such as Liberia witnessed only modest movement into construction. The manufacturing sector also records considerable variation in employment within fragile states. In the post-war era from 2004 to 2016, the DRC averaged over 11 percent of employment in manufacturing while Afghanistan over the same recovery period recorded only 3 percent in manufacturing. Employment in transportation also differs substantially in conflict-affected states. For example, although manufacturing employment in Cote d’Ivoire is exceptionally low - averaging less than three percent from 2010 to 2016, the transportation sector commands more than 22 percent of the workforce. Conflict can significantly affect the distribution of production across sectors and vice versa. At the conclusion of a conflict, it is the construction sector that tends to grow fastest for the first few years, followed by transport and telecommunications and mining. Manufacturing tends to grow more slowly, and takes on average five years to catch up with the others (see Figure 2). Apart from mobile telecommunications, which we discuss in more depth later, early recovery and growth are heavily influenced by the public sector and foreign aid, which tends to increase rapidly and substantially at the conclusion of a conflict before returning to close to normal levels a few years later.
Figure 2: Changes in sectoral GDP after a conflict (median change in shares of GDP per sector 1–12 years after a conflict)
Note: Group averages comprise of equal-weight means. All observations greater than 3.5 standard deviations away from the group mean are omitted prior to calculation. Group observations are kept only when more than 65 percent of countries within the category record data. Source: IFC (2017).
2 In both Lebanon and Iraq, the construction sector maintains over 11% of employment.

ECONOMIC DEVELOPMENT IN FRAGILE CONTEXTS: LEARNING FROM SUCCESS AND FAILURE
9
Labour productivity growth, particularly within manufacturing, is a critical factor in economic transformation (Rodrik, 2013). However, labour productivity growth within manufacturing in fragile states has been low on average, but it also differs across fragility categories. For example, countries transitioning from conflict have been unable to produce within-sector growth in manufacturing while recording productivity growth from employment shifting to the sector. The inverse is true for states outside the SET Violent Conflict categories of conflict. Figure 3 compares within and between manufacturing labour productivity growth among OECD and SET categories. Countries within the OECD Spectrum record lower average within manufacturing growth in each of the five-year period from 2002 to 2016.
Figure 3: Manufacturing productivity growth in fragile states
Notes: Data originates from the ILOSTAT database on employment and the UN Statistics Division data on gross value added. Within productivity measures represent annualised change measures. For details on the calculation of between and within labour productivity, see McMillan et al. (2017; 6) or the documentation in SET (2018). When recorded data is not available for these measures, models are used to fill missing data. Thus, data reliability may be of concern. However, McMillan et al. (2017) argue that these measures do have a strong relationship with more detailed firm-level productivity measures. Group averages comprise of equal-weight means. All observations greater than 3.5 standard deviations away from the group mean are omitted prior to calculation. Group observations are kept only when more than 65 percent of countries within the category record data. Source: UN Statistics Division.

ECONOMIC DEVELOPMENT IN FRAGILE CONTEXTS: LEARNING FROM SUCCESS AND FAILURE
10
Economic transformation is generally associated with export diversification, increased domestic value addition in exports and upgrading in value chains. We proxy these characteristics of economic change through the analysis of export value (World Development Indicators) and the diversification of exports (International Monetary Fund/Department for International Development). Figure 3 summarises export diversification across the SET conflict categories in the order of average export concentration. Countries with limited conflict have the lowest index scores suggesting more diverse export composition whereas states transitioning from or currently experiencing severe violent conflict have the highest export concentration scores. However, the long whiskers on the box-and-whisker plot demonstrate that several countries with limited violence have strong export concentration, and some fragile states export diverse products.
Figure 4: Export diversification and export-value growth in fragile states
Note: Export concentration data originates from the IMF/DFID Toolkit on export diversification: www.imf.org/external/np/res/dfidimf/diversification.html Group averages comprise of equal-weight means. All observations greater than 3.5 standard deviations away from the group mean are omitted prior to calculation. Group observations are kept only when more than 65 percent of countries within the category record data. Source: WDI. Fragile are less productive on average than non-fragile states. GDP per capita (constant 2010 US$) in states with limited conflict is almost five times greater than states transitioning from conflict. Despite a low base, states in transition have also recorded lower growth rates.

ECONOMIC DEVELOPMENT IN FRAGILE CONTEXTS: LEARNING FROM SUCCESS AND FAILURE
11
Figure 5: GDP per capita (left) and GDP growth (right) by category of fragility
Note: Group averages comprise of equal-weight means. All observations greater than 3.5 standard deviations away from the group mean are omitted prior to calculation. Group observations are kept only when more than 65 percent of countries within the category record data. Source: WDI. Fragile states on average have not made significant progress towards economic transformation based on the indicators displayed here. The following section outlines several key factors which explain why these states struggle to transform their economies.
2.3 Why is economic development so difficult in fragile contexts and how can private business grow in difficult environments? Constraints to economic transformation in fragile settings are well-known. We divide them into five broad headings and consider each in more detail:
1. Pervasive insecurity or a legacy of or actual armed conflict 2. Governance that falls short of the minimum that allows a modern market economy to
flourish 3. Inadequate infrastructure, primarily physical infrastructure but also soft infrastructure,
such as a basic financial sector and the institutions that support trade 4. Meso-level or sectoral deficiencies that constrain inter-sectoral and inter-firm activity,
which sets back productivity and growth 5. Micro-level characteristics of firms in fragile contexts that constrain their productivity
and contribution to economic transformation Economic transformation in fragile contexts that is not aid-dependent depends on the development of the private sector, for its contributions not only to growth, employment and trade but also to public revenues that finance critical business inputs such as educated and healthy workers, infrastructure, justice and security. While the government and its partners can play an important role in facilitating and financing private sector development, success depends on a number of factors falling into place – the business climate, factor markets, ability of firms to meet customer demand, finance, internal management and organisation of the firm, and the nature of partnerships between local firms and other firms and networks (Figure 6).

ECONOMIC DEVELOPMENT IN FRAGILE CONTEXTS: LEARNING FROM SUCCESS AND FAILURE
12
Figure 6: Conceptual framework for private sector development in fragile contexts
Source: Adapted from Bewley et al. (2010). 2.3.1 Security and conflict With the exception of a few micro states, nearly all of the countries on the World Bank’s list of fragile states have experienced conflict involving organised armed groups since 1990. Of these 25 countries, 18 have experienced battle deaths during the past 15 years. Although some investors consider countries affected by fragility unsafe, crime is not necessarily worse there. For example, in 2014, intentional homicides in fragile states were seven per 100,000 people – the same as in all low- and upper-middle-income countries. By region, the homicide rate was a little higher in Sub-Saharan Africa (10 per 100,000), and the highest rates were in Latin America and the Caribbean (23 per 100,000) (WDI). In 2015, the homicide rate in the US, considered a good location for international investors, was nearly 5 per 100,000, higher than the regional averages for Asia and the Middle East and North Africa and most other OECD countries. The use of violence hampers short-term prospects for economic transformation through private sector development in many apparent forms - the destruction of physical infrastructure, human capital, and social capital such as trust between members of society (Blattman and Miguel, 2010). Beyond the immediate effects of violence, large-scale conflict can have a lasting impact on foreign investment long after the conclusion of a war (Tyson, 2017). Perceptions of country security risks matter to investors, particularly risks of kidnapping, violent crime and terrorism, especially when they can be avoided profitably by investing in more benign security environments, even when avoided security risks are actually low. A survey of risk managers in 210 international firms showed that the preferred approach to managing

ECONOMIC DEVELOPMENT IN FRAGILE CONTEXTS: LEARNING FROM SUCCESS AND FAILURE
13
geopolitical risk – amounting to 50% of respondents – was simply to avoid investments in risky countries. Other approaches to managing risk, such as decreasing the size of investments in risky countries (36% of firms) and diversifying investments across more countries (40% of firms surveyed), also indicate that countries affected by fragility and conflict are likely to suffer less investment, at least by foreign firms. Even if a country is affected by insurgency, it may be possible to create enclaves of security where business can flourish, either in industrial parks or by constraining violence to peripheral areas of the country. Countries with subnational conflicts that have experienced economic growth with significant foreign direct investment (FDI), such as Colombia, Nigeria, Philippines and Sri Lanka, show that security policies that largely confine conflict can support economic growth. On the other hand, insurgents have an incentive to target violence against foreigners in reasonably secure areas, which can frighten off investors for several years. Such has been the case in Afghanistan, Egypt and Sri Lanka. Security policy needs to understand and mitigate such risks.
Table 2: How firms deal with risks in fragile and conflict-affected contexts
Use of various methods to deal with geopolitical risk (as % of all respondents
All firms n = 210
Avoid investments in certain countries 50%
Increase research before new investment 44%
Diversify investments across more countries 40%
Decrease size of investments in risky countries 36%
Increase use of partners or consortia 36%
Lower company profile in risky region 26%
Increase hurdle rate on projects in risky regions 26%
Increased use of currency/commodity hedging 19%
Increased use of political risk analysts 18%
Increased use of security personnel 16%
Alter supply chain management 16%
Diversify investments over more industries 16%
Political risk insurance 15%
Enhance public relations in risk region 15% Source: Bodnar et al. (2011). 2.3.2 Economic governance Institutional weakness lies at the heart of fragility. Fragile states, not surprisingly, rank low on global indices of governance quality, although there is considerable variation among them, and not all countries with low governance ratings are on the usual lists of countries affected by fragility and violence. One aspect of this institutional weakness, the quality of the business environment in fragile states is lower than in all other country groups. For example, the average ranking of the 18 countries in the g7+ group of fragile states in the World Bank’s Doing Business survey in 2013 was 160 out of 185 countries. This was lower than the average ranking for Africa of 140, South Asia of 121 and the Middle East and North Africa of 98 (World

ECONOMIC DEVELOPMENT IN FRAGILE CONTEXTS: LEARNING FROM SUCCESS AND FAILURE
14
Bank, 2013). The g7+ countries were at the bottom on every Doing Business indicator except starting a new business (see Figure 8). Grouping these indicators into two critical dimensions of the business environment – the strength of legal institutions and regulatory complexity – the g7+ countries also ranked bottom on these indicators (see Figure 9). It is worth noting the limitations of these indicators, which do not cover other areas such as the country’s proximity to large markets; quality of infrastructure other than cross-border trade and electricity; security of property from theft and looting; transparency of government procurement; macroeconomic conditions; and general strength of institutions (World Bank, 2016). Research indicates that, in some circumstances, a good business environment that ranks high on the Doing Business indicators is associated with high productivity and growth. The World Bank’s Enterprise Surveys (World Bank, 2012) contain an extensive database of 120,000 firms in 125 countries, mainly but not entirely in the manufacturing sector, which researchers have used to assess the impact of the business climate on firm productivity. The prevailing wisdom is that a good business climate promotes economic growth through investment and higher productivity, but that heterogeneity of the local business climate can explain much of the difference in firm performance. There is a small number of very heterogeneous small and medium enterprises (SMEs) in Africa and that only a small number of these participate in SME projects, so it is risky to draw sweeping conclusions from this evidence to design business climate policies. Taking into account the capacity of countries to absorb reforms and the time needed to implement them, it would seem that there is a need to prioritise reforms to the business climate based on their potential impact and the political economy of their implementation (McMillan et al, 2017).
Figure 7: Doing Business indicators for g7+ and other fragile states, 2013 – average ranking by topic
Source: World Bank (2013). The business environment is one dimension of broader economic governance issues in fragile contexts that involve rule of law; the degree to which government actions are constrained by clear, predictable rules; and the way in which economic rents are created, distributed and perpetuated. Opaque rules, inconsistently applied, create uncertainty for investors and opportunities for officials to extract rents through corruption. Yet corruption is not necessarily inconsistent with growth and economic transformation, under the so-called ‘Bangladesh paradox’, and East Asian economies have been able to transform with modest

ECONOMIC DEVELOPMENT IN FRAGILE CONTEXTS: LEARNING FROM SUCCESS AND FAILURE
15
levels of corruption. The work by Mushtaq Khan distinguishes between economic rents that encourage growth (e.g. rents to innovation and to ‘first movers’, small bribes to facilitate public services) and those that inhibit growth (e.g. inefficient monopolies, large-scale rent extraction by senior politicians, e.g. related to the oil industry in Nigeria). Eliminating corruption in fragile settings will take generations or at least decades. An effective anti-corruption policy needs to target low-hanging fruit – and the rents that are most growth-inhibiting – and create private sector policies that curtail the perpetuation of rents that have served their purpose, for example strengthening competition and the ability of new entrants to penetrate existing markets.
Figure 8: Institutional strength and efficiency of regulatory processes
Notes: Strength of legal institutions refers to the average ranking on getting credit, protecting investors, enforcing contracts and resolving insolvency. Complexity and cost of regulatory processes refers to the average ranking on starting a business, dealing with construction permits, getting electricity, registering property, paying taxes and trading across borders. FCS = fragile and conflict-affected states. Source: World Bank (2013). 2.3.3 Economic fundamentals: finance and infrastructure Financial access often emerges as one crucial constraint. Sometimes, a focus on microfinance institutions and mobile banking could enable the provision of financial access in such challenging economic environments, where the population often concentrates in rural areas and the agriculture sector (Roe and Siegle, 2011). In some states, remittances can provide an alternative source of financing,3 and policies can incentivise these flows for private sector development. Such strategies include diaspora bonds or equity funds. Such policies have already led to some successes. In Somalia, telecommunications development has been financed mainly through remittances (Leo et al., 2012). We examine this example through a case study of micro-lending and micro-money programmes in Somalia in Section 4.
3 However, the importance of remittances differs across FCAS. For example, in Liberia remittances are 32.2% of 2015 GDP. However, for other FCAS they are small. For example, they are below 1% of 2015 GDP for Sudan, South Sudan, Chad and DRC.

ECONOMIC DEVELOPMENT IN FRAGILE CONTEXTS: LEARNING FROM SUCCESS AND FAILURE
16
There is a widespread perception that infrastructure deficiencies are a major constraint to economic activity in fragile settings. Speeches of g7+ ministers at international meetings frequently complain of lack of investment and partner support for infrastructure. There is some evidence to support these claims of poor infrastructure in fragile states, such as the World Bank Enterprise Surveys, which highlight infrastructure deficiencies as a business constraint. Improved infrastructure can increase the resilience of a country in addition to paving the way for business investment. Road connectivity can increase resilience through improving social cohesion, increasing the effectiveness of state institutions across districts, spreading economic development across the country and reducing horizontal inequalities, and addressing cross-border challenges such as security, environment, social marginalisation and stimulating economic development through access to larger markets (Kaplan and Teufel, 2016). The High-Level Panel on Fragile States in Africa drew attention to the economic isolation of countries and regions in Africa, where countries may be small and landlocked with poor access to larger markets owing to inadequate infrastructure. Countries may potentially have large internal markets, such as in DRC, but remain undeveloped because of poor infrastructure and insecurity. African countries have very high shipping costs – one example cited is that it costs more to ship a ton of grain from Mombasa to Uganda than from Chicago to Mombasa (HLPFS, 2014). Not surprisingly, fragile states dominate the bottom of global rankings of trade logistics performance. The lowest-ranked countries score consistently badly across all dimensions of logistics performance. However, there are some surprises. Togo ranks higher than Colombia and Côte d’Ivoire above Iran and Bosnia Herzegovina, and both countries rank higher than Russia, Paraguay, Nicaragua and Macedonia, which are on neither the World Bank nor the OECD lists of fragile states. The figure below compares infrastructure in different types of fragility categories.
Figure 9: Infrastructure scores by fragility category (left) and score (right)
Note: Group averages comprise of equal-weight means. All observations greater than 3.5 standard deviations away from the group mean are omitted prior to calculation. Group observations are kept only when more than 65 percent of countries within the category record data. Source: WDI. Enterprise Surveys conducted in fragile contexts often put inadequate electricity near the top of their concerns. Since most low-income fragile states are located in Africa, an overview of the likely situation in fragile settings can be obtained from a World Bank study of infrastructure in Africa (Foster and Briceno-Garmendia, 2010). This shows that electricity deficiencies are by far the greatest infrastructure challenge in Sub-Saharan Africa, and anecdotal evidence indicates that this is most likely also true for fragility-affected countries in the region. The report shows that damage to power networks has disrupted supply in countries

ECONOMIC DEVELOPMENT IN FRAGILE CONTEXTS: LEARNING FROM SUCCESS AND FAILURE
17
affected by conflict, often by looting material for sale as scrap, as happened in Liberia. Total investment in power generation in Africa is low compared with in countries in other regions in the same income bracket, and as much as a quarter of this is unavailable as a result of aging plants and poor maintenance. Because of a reliance on oil-based generation, the cost of public power in Africa is high, at around $0.18/kWh, with an average tariff of $0.14/kWh. Compare this with tariffs of $0.04/kWh in South Asia (where electricity is often subsidised) and $0.07/kWh in East Asia. In post-conflict countries, the costs of public power are likely to be higher since such countries tend to invest in expensive diesel generation that can cost as much as $0.40/kWh. Even if the consumer has a connection, businesses often need a standby generator since public supplies are also unreliable and produce power at a similar cost, which then has to be distributed through inefficient networks. This backup capacity has amounted to 50% of public capacity in countries such as DRC, Equatorial Guinea and Mauritania. Emergency or self-generation of electricity using traditional diesel technologies imposes a considerable cost on business. It is also a drag on the economy – the cost of an emergency power supply can amount to more than 1% of GDP and as much as 4.25% in a fragile state such as Sierra Leone. Distribution losses in Africa overall are around 23%, twice the norm of 10% in countries with well-performing sectors, and a large part of this represents theft as well as underinvestment and poor maintenance of networks. Only 88% of revenues billed are collected, compared with best practice of 100%. Without a transformation in costs, traditional public power may be uneconomic for countries affected by fragility and may need a fundamentally different approach to the models of international partners. This could involve expanding both decentralised (e.g. solar photovoltaic) and centralised (e.g. hydro, wind) renewable generation together with expansion of domestic and regional power grids. This opens opportunities for local and foreign private investment that could transform the power sector and lower costs to electricity-consuming businesses. Increased private participation in electricity supply has a mixed record in Africa (and elsewhere, e.g. in South Asia). While only 6% of independent generation projects have been cancelled, 24% of utility management contracts and 31% of concession contracts have been.4 Success will require openness to new ideas and prolonged engagement by multilateral banks, which will have to negotiate political economy issues such as the incentives for governments to subsidise electricity to gain political support. Additionally, they can promote within-sector upgrading – particularly in firms which have low competition either in the domestic or foreign contracting market. Information and communication technology (ICT) is an infrastructure area of comparable success, and we examine in the case studies some possible reasons for this. On average, countries on the fragile states list have 70 mobile phone subscriptions per 100 people, but this is not influenced just by middle-income countries such as Iraq, Lebanon and Libya, which have high rates of mobile phone use: low-income countries such as Côte d’Ivoire, The Gambia and Mali have subscription rates greater than 100. The Gambia and Mali exceed even the OECD rate, and the 22 out of the 34 countries for which data is available that have subscription rates greater than 50% of the population. It is worth nothing that the subscription rates for countries with active conflicts are also high (Afghanistan 62 and Somalia 52). Internet access is relatively much lower in fragile states generally. Fixed line telephone subscriptions are even lower, for reasons similar to those for electricity – such as war-damaged networks and public utility institutional issues. However, some fragile countries have made tremendous improvements to internet access and speeds. Cote d’Ivoire has emerged as a leader in internet access, and speeds - with 3G coverage in most parts of the country and internet speeds only surpassed in sub-Saharan Africa by South Africa.
4 Information on electricity in Africa is from Foster and Briceno-Garmendia (2010).

ECONOMIC DEVELOPMENT IN FRAGILE CONTEXTS: LEARNING FROM SUCCESS AND FAILURE
18
Table 3: Information and communications infrastructure, 2015
Mobile cellular subscriptions (per 100 people)
Individuals using the internet (% of population)
Fixed telephone subscriptions (per 100 people)
Fragile states 70 15 2
Of which
Highest 157 (Libya) 74 (Lebanon) 20 (Lebanon, Tuvalu)
Lowest 7 (Eritrea) 1 (Eritrea) 0 (12 countries)
All sub-Saharan Africa
76 22 1
All low-income 60 9 1
Lower-middle-income
90 29 4
Low- and middle-income
93 37 9
OECD 115 77 39 Source: World Bank database. 2.3.4 Meso-level (or sectoral) issues Inter-sectoral coordination by government has been a reason for the rapid economic transformation of Asian countries. The new structural economics, which is informed by the successful development experience of East Asian countries, shows the role of government in identifying opportunities where the country has a comparative advantage, ensuring that complementary hard and soft infrastructure needed by the industry is available and facilitating other complementarities among firms engaged at various levels with the new industry, and providing temporary protection to the rents of firms that took the risks of being first movers (Lin, 2012). This framework has been applied to fragile contexts only to a limited extent – for example in Nigeria. It requires institutional capacity to implement structural policies and to fulfil the state’s coordination function. This is not usual in most fragile settings – unlike in East Asia, where there is a long tradition of merit-selected, rules-based, Confucian-inspired bureaucracy. Many countries affected by fragility have set up investment promotion agencies – ‘one-stop-shops’ to resolve coordination issues and to streamline state–investor relations – but these so far have been used to promote FDI rather than local businesses seeking to invest and expand. Industrial parks have been used as a solution to the problems created by lack of security, inadequate infrastructure and land availability in post-conflict countries where land records are unreliable. Fragility-affected countries such as Afghanistan, Ghana and West Bank and Gaza have attempted this approach with apparently mixed results. In the cases of Afghanistan and Gaza, changes to security conditions and the political context (Gaza) deterred international investors. The Afghanistan project was conceived on too large a scale, was inadequately prepared and had major issues with regard to electricity supply (see World Bank, 2012). The Ghana Gateway project included an industrial free zone and institutional development of customs, immigration, ports and free zones authorities. The World Bank (2013) assessed the project as ‘moderately satisfactory’ and recommended that an industrial park that targeted all industries rather than just exporter industries would have been more suitable in a country where fiscal incentives were nationwide. The review also claimed that

ECONOMIC DEVELOPMENT IN FRAGILE CONTEXTS: LEARNING FROM SUCCESS AND FAILURE
19
such projects required high-quality market research and flexibility built into their design, and stressed the value of institutional reforms and improved trade logistics through electronic processing of trade documentation. Finding a first mover willing to accept high risks without perpetuating economic rents is difficult in fragile settings, despite potentially high profits to be made by adventurers and risk-takers. Established firms may find it easier and less reputationally damaging to invest in more stable environments that follow international business practices and where risks from corruption or human rights violations are much lower. For first mover investors, sustained profits at extraordinarily high levels invite public opposition and renegotiations of contracts or expropriation that damage not only the investor but also the reputation of the country for other investors. The Pakistan private power programme, which led to court-imposed reductions in power tariffs and corruption charges against investors, is an example of what can go wrong. The post-Bonn Agreement Afghanistan government inherited a monopolistic mobile phone concession that had been signed during the post-Taliban interregnum that it was able to renegotiate and incorporate into the new competitive sector framework, which allowed the investors to collect economic rents until new competitors entered the market. All this suggests that the firms willing to invest in fragile settings may not always be large western multinationals subject to formal and informal constraints and customer pressures in their home markets, but also often specialists in niche markets that can connect with local social networks and take a long view (e.g. the Aga Khan Fund for Economic Development or the MOBY Group founded by an Afghan–Australian entrepreneur), or insurgents from regional or emerging markets willing to take high risks for high short-term rewards. Allowing economic rents may be necessary to attract first movers. The challenge for governments is to limit these rents and allow new entrants to the market once it has become established, as opposed to enshrining crony firms protected by the modern equivalent of the 17th century royal charter. The Afghan telecommunications case study is an example of how this was achieved fairly smoothly. Pakistan private power is an example of a contentious and messy elimination of rents that retarded new private investment for more than a decade. Inter-firm relations in fragile situations may be economic or political. Network relations between domestic firms and other local and foreign firms are a strategic asset through accessing complementary resources and activities of other firms, enhancing the ability of the firm to influence interdependency with other firms in the production network and to create value through privileged relationships with customers or to appropriate value from other firms (Sousa 2004). Such inter-firm relations may be limited in countries emerging from conflict, but could grow as economic transformation deepens. Acquaah and Eshun (2010) concluded from an analysis of more than 100 organisations in Ghana that managerial social network relations with managers of other firms, government officials and community leaders enhanced organisational performance. However, they cautioned that network relations with political leadership might not provide benefits, owing to the reciprocity of favours that this involves, and that the benefits of networking are greater when the firm is small, young, domestically owned and doing business in a competitive market. Voluntary associations of firms can not only support the growth of inter-firm business relations but also strengthen the voice of the small and medium business sector in engaging with the state. Strengthening the environment for business that operates in competitive markets requires agreements that reduce economic rents that are not conducive to growth – for example rent extraction by customs and ports officials, local monopolies, etc. Business organisations can multiply the voice of their members to negotiate more effectively with government and others. This can be particularly effective for small businesses that become vulnerable to rent extraction as they grow. The Liberian public accountants’ association is a good example of a voluntary association that banded together to increase its share of the audit market, maintained professional standards, worked with the state to ensure

ECONOMIC DEVELOPMENT IN FRAGILE CONTEXTS: LEARNING FROM SUCCESS AND FAILURE
20
a supply of high-quality public inputs (i.e. graduates in accountancy) and formed foreign partnerships to support quality and independence. External partners can provide seeding assistance to establish business associations that deepen rather than distort markets and facilitate linkages with similar organisations in other countries. Local firms in fragile settings are typically elite-owned and may have informal and informal relations with government. When there is armed conflict or a risk of criminal violence or expropriation of property, firms may seek protection from armed groups, which may extract rents for the service.5 Or, putting it another way, armed groups themselves can have business ventures that may contribute to stability. In very fragile settings, the government may seek to manage a market for loyalty that depends on an invisible political budget to grant favours to potential spoilers (de Waal, 2015). The private sector is a source of these funds, and under these conditions it may be unrealistic to expect the government to be a pro-growth coordinator and facilitator of business activity. The political economy of state–business is complex and can be destabilising. Under the right conditions, a social compact can be established that creates a virtuous circle of business agreeing to pay tax in return for government delivery of public services. Such a compact was negotiated between government and elites in Somaliland (Eubank, 2010). Past history in OECD countries involved warlords, usually referred to as just ‘lords’, and buccaneers acquiring property through force and establishing businesses that later became legitimate. It is not unlikely that similar patterns will emerge as countries move from fragility to resilience. The role for governments and their partners is to encourage the emergence of business that plays by rules and pays taxes and to minimise rent extraction. The Somaliland example shows how negotiations between the private sector and government profoundly affect the development of the political settlement that underpins the state. This is not dissimilar to the way in which the modern European state was forged by war. Agreements on the economic and financial settlements are a major component of the political settlement in a country and require international partners to integrate private sector development expertise with diplomatic and other policy communities to facilitate negotiations to promote stability, inclusive political voice, human rights and economic transformation. 2.3.5 Micro-level characteristics of firms in fragile contexts External considerations such as availability of skilled labour; access to finance at terms acceptable to the firm; markets for other factors of production like materials, land and energy; quality of infrastructure; and the business climate determine only part of overall firm productivity. As Saliola and Seker (2011) show, there are considerable differences in total factor productivity among countries and industries, which Bloom and van Reenen (2012) argues can be explained in part by internal factors such as quality of management. Virtually no information is available on these internal factors of firms in fragile contexts, but these are likely to affect firm performance. Evidence from studies conducted in other markets suggest these determinants of firm productivity are likely very significant. The implication is that economic transformation will depend on how firms themselves modernise, not just changes to the environment in which they operate. Although there is not yet enough supporting evidence, it is likely that actions by governments and partners that affect firms’ incentives and support in-firm capacity-building – for example management skills, accounting systems, corporate governance – could have significant payback in terms of productivity and growth if taken to scale.
5 This may account for security not being reported as a major constraint to business in Enterprise Surveys in countries like Afghanistan.
ECONOMIC DEVELOPMENT IN FRAGILE CONTEXTS: LEARNING FROM SUCCESS AND FAILURE
21
Some of the key internal factors of firms that have been shown to affect firm productivity in non-fragile settings are described below:
Management Bloom and van Reenen (2006) and Bloom et al. (2012) present the results of surveys of managers in both industrialised and developing countries that assess 18 dimensions of management performance, including target-setting, monitoring and staff incentives. While most of their analysis is for the manufacturing sector, the surveys also cover other sectors such as healthcare and schools (see World Management Survey, 2012). They show that management practice scores vary substantially among countries and are strongly linked to level of development. In manufacturing, the top scoring country, the US, had few badly managed firms, whereas Brazil, India and China had a tail of badly managed firms, which the authors link to the incentives managers and firms in these countries face. In addition, they found that incentives management (hiring, firing, pay and promotions) generally was worse in countries with a high Doing Business rigidity of employment index score. Management scores also tended to be higher in firms where a high proportion of both managers and non-managers had college degrees.
Ownership Bloom et al. (2011) found that government ownership was associated with worse management practices in every industry they studied, and this was most pronounced in incentives (human resources) management. They also found that multinational companies (in manufacturing and retail) achieved management scores in whichever country they were located in that were consistently higher than for domestic firms. Indeed, management of multinationals located in low-income countries such as India exceeded the performance of domestic firms located in many high-income countries. In the manufacturing and retail sectors for which data was available, family-owned firms with a family CEO and founder-owned and -managed firms had the lowest management scores, even when compared with government-owned enterprises. On the other hand, Randøy and Goel (2003) found from a sample of Norwegian SMEs that founding family-owned firms had much lower agency costs than foreign or other domestic firms, since the demands for monitoring management performance were lower, and that family-owned firms could use their informal networks to secure financing for new ventures without the drag of agency costs on firm value and profitability. These mechanisms may be relevant in low-income countries, where many firms are family-owned and access to finance is difficult. Figure 10 shows that access to finance is a large and mounting challenge in fragile and conflict-affected states.

ECONOMIC DEVELOPMENT IN FRAGILE CONTEXTS: LEARNING FROM SUCCESS AND FAILURE
22
Figure 10: Domestic credit to private sector by fragility grouping
Note: Group averages comprise of equal-weight means. All observations greater than 3.5 standard deviations away from the group mean are omitted prior to calculation. Group observations are kept only when more than 65 percent of countries within the category record data. Source: WDI.
Technology Adoption of new or advanced technology is associated with increased productivity. Khan (2010) shows that technical innovation, particularly when implemented through the private sector, is an engine of growth, even in low-income countries. Khan argues that this owes to managerial and organisational characteristics of US firms that encourage efficient use of new technologies. In a survey of private sector development programmes, Naudé (2011) argues that foreign aid has neglected innovation, a driver of economic development, and that programmes should go beyond entrepreneurship and become a major avenue to promote the adoption of foreign technology by the localised private sector.
Firm size Large firms tend to be better managed than small firms, since their product market has allocated a greater share to them, and they are more able to employ professionals in management and operations and to implement modern management systems (Bloom et al., 2011). World Bank Enterprise Surveys show that firms in low-income countries tend to be small. This is likely to be especially true for fragile states, apart from for foreign firms engaged in extraction of natural resources. Size alone is not necessarily beneficial to productivity if it leads to overconcentration of ownership, lack of competition and rent extraction through political connections.
Markets and competition There is evidence that firm engagement in competitive markets leads to higher productivity. Based on analysis of Chinese firms, Sun and Pan (2009) show that firms engaged in export markets have higher productivity owing to the effects of market orientation on organisational structure and the intrapreneurial behaviour of employees. As part of an international comparative study using survey data, van Reenen (2010) also shows that tougher competition raises productivity through the incentives it creates to raise managerial quality. Crespi et al. (2006) examine how exporting has affected the performance of UK firms. They find that firms that export learn from their buyers relative to learning from other sources and that this learning is associated with productivity gains. Competition can also improve the productivity of public

ECONOMIC DEVELOPMENT IN FRAGILE CONTEXTS: LEARNING FROM SUCCESS AND FAILURE
23
enterprises, as a comparative study of British hospitals shows (Bloom et al., 2011). In low-income and fragile states, domestic markets may be competitive if border management is not strong and rules that inhibit trade are difficult to enforce. On the other hand, there may be strong pressures from incumbent firms and their political patrons to restrict new entrants and to monopolise trade using the powers of government officials and informal power-holders and militias. However, an export-oriented strategy can create opportunities for firms to seek profits rather than to maximise rents and move business away from a zero-sum game (Piffaretti, 2010). Lack of transport infrastructure can retard the development of a national market and substantially increase the prices of imports and raw materials, thus constraining both competition for the domestic market and the viability of exports.6
2.4 Conclusions: analysing success in fragile contexts We first defined country categories of fragility. There are countries 1) where there is active conflict; 2) in transition from conflict to resilience; 3) with subnational conflict; and 4) that are at risk of conflict. We then discussed the economic structure in fragile states. We discussed reasons for poor performance in fragile states: 1) pervasive insecurity or a legacy of or actual armed conflict; 2) ineffective governance to support a modern market economy; 3) inadequate infrastructure, primarily physical infrastructure, but also soft infrastructure such as a basic financial sector and the institutions that support trade; 4) meso-level or sectoral deficiencies that constrain inter-sectoral and inter-firm activity, which sets back productivity and growth; and 5) micro-level characteristics of firms in fragile contexts that constrain their productivity and their contribution to economic transformation. This discussion of constraints forms the basis of the methodological approach of case studies later on in this paper. We turn factors behind poor performance into a number of questions which can be asked for each case study of success or failure and which relate to actionable policy issues, including for external actions.
1. Governance questions. What is the type of political connection between economic activities and state/state–business relations?
2. Meso- or sectoral-level questions. What is the role of the public sector (islands of excellence/experimentation) and leadership?
3. Micro-level questions. What is the role of private sector leadership (undergoing transition, capability, partnerships with foreign entities)? How is the private sector coping with risk (security, regulatory, volatility, reputational, clustering)?
4. Other. What is the role of external actors? This section could be interpreted as arguing that economic progress in fragile contexts is not possible in practice. The section that follows, however, will show where cases of success have emerged, and how.
6 South Sudan, which achieved independence without any all-weather paved roads, is a good example of how lack of infrastructure severely constrains the national market and raises prices in urban centres.

ECONOMIC DEVELOPMENT IN FRAGILE CONTEXTS: LEARNING FROM SUCCESS AND FAILURE
24
3. SUCCESSFUL ECONOMIC DEVELOPMENT IN FRAGILE CONTEXTS
Whilst poor economic performance in general terms is a key characteristic of fragile contexts, in this section we argue that this does not mean progress has not been possible in selected cases. Crucially, this section uses economic data analysis to positively identify instances of success in specific countries, variables and time periods. This means that despite negative development in most variables, there are also positive exceptions, which we examine later. This section is a crucial step in our methodology, as it motivates further analysis of the specific, positive cases. If performance was uniformly poor, we could not exploit any variability, but since there is significant variability in performance, it is worth an examination of what might lie behind the positive cases. It is not only cases of failure that support learning, but cases of success, too. Section 3.1 explores what is meant by success and how it can be measured in the data. Section 3.2 uses statistical procedure to identify cases of success (see Table 4 – and the appendices (full data available online at SET (2018)). Section 3.3 shows that our process identifies a number of successful cases, by clearly visualising success. Country examples, including Liberia, Afghanistan and Somalia, are further explored in the next section.
3.1 What constitutes success and how can it be measured? Almost by definition, fragile states have not succeeded in economic growth and transformation. However, success in the context of fragile states refers either to setting the foundations for future growth and transformation through constructing stable political settlements or to beginning the transformation process through high-growth rates of key sectors or factors to productivity such as infrastructure and education. This latter component of success can be approximated by examining growth rates of available country-level data or other variables that measure temporary economic progress. We examine five types of indicators. Productivity and investment: Economic transformation implies growth in productivity and the underlying investments necessary to produce growth in production. Because these factors are considered fundamental to the improvement of lives in developing and fragile states, several indicators are available to measure income and investment in almost all states in the time period of interest (1990–2017). We examine annualised changes in GDP per capita (constant 2010 US$), FDI both as a percentage of GDP and in current US$ and domestic credit provided to the private sector (% of GDP). Economic fundamentals and infrastructure: Economic transformation requires a level of infrastructure, skills and broad institutional capacity – although the required type, level and combination of improvement to economic fundamentals for transformation are heavily debated and likely context-specific. We measure these factors in terms of access to basic infrastructure for production and indicators of the business environment. International markets: Interacting with international markets allows poor and fragile countries to find demand for production at scale and can improve productivity if technologies are adopted. Moreover, trade diversification shields countries from the macroeconomic effects of negative shocks. We measure success in the quantity and quality of exports through a range of measures: export value index; exports of goods and services (balance of payments, BoP, current USD); the proportion of merchandise exports from manufactured goods; and the DFID/IMF export diversification index.

ECONOMIC DEVELOPMENT IN FRAGILE CONTEXTS: LEARNING FROM SUCCESS AND FAILURE
25
Employment structures: Economic transformation occurs through the reallocation of labour and capital from low-productivity activities to higher-productivity activities and is typically associated with greater employment shares in sectors other than agriculture. Thus, we measure the years of consecutive growth in the manufacturing, construction, transportation and other sectors (public services, health, finance, etc.). Labour productivity: Increases in labour productivity underpin the transformation of economies. However, growth driven by minerals and oil generates few jobs and is subject to large external shocks. Thus, we measure labour productivity in sectors other than mining. In particular, productivity in manufacturing exhibits unconditional productivity convergence between developed and developing economies (Rodrik, 2013). Owing to the sector’s transformative capacity, we measure both within and between manufacturing productivity growth. Section 2.1 demonstrates that employment and productivity within the ‘other’ sector highly correlates with indicators of transformation. Accordingly, we examine both within and between productivity growth in the other sectors. Finally, agriculture supports a significant proportion of households in fragile states. As such, within-agriculture productivity growth is a key priority for the reduction of fragility.
3.2 Which fragile countries have experienced economic success? We examine available country-level data to identify sustained growth periods in the indicators highlighted in Section 3.1. This analysis helps us understand what type of case studies we should examine in greater detail. In order to identify successful cases, we set thresholds for both the level of change and the number of consecutive years necessary to signify a successful growth period. We place the initial threshold at the 75th percentile7 of change over the period studied from 1990 to 2016 in a particular fragility category. We set the number of consecutive years for success at four.8 Table 4 provides a selection of successful cases that satisfy the criteria for identification. The Tables in Appendix A2 provide the full list of country/indicator/time-period observations that meet the criteria. The results motivate the case studies in Appendix B. For example, from 2003 to 2008, Afghanistan recorded consistent and high growth in telecommunication provision. The results highlight Liberia for strong overall recovery in GDP per capita. Burundi emerges as one of the rare fragile states recording a growth period in manufacturing exports as a percentage of merchandise exports. Sierra Leone records significant growth in within-sector agriculture productivity. Mozambique attracted significant foreign investment in the post-war period. These findings motivate further qualitative analysis to examine if these periods of growth in aggregate indicators relate to the promotion of transformation and, if so, why success existed in the industry.
7 The threshold is set at the 75th percentile for all groups other than Production and Investment, where the threshold is set at the 65th percentile to ensure enough fragile states are represented. The lowering of the threshold is largely a response to the high variation in annual changes in FDI, which make consistent performance in the top percentiles of the indicator exceedingly challenging. 8 These thresholds are somewhat arbitrary. It is for this reason that we generated an interactive ‘Finding Success’ heat map in the interactive data portal (SET, 2018). Users can adjust both the threshold and the number of consecutive years. The heat map also provides a quick and attractive way to examine results.

ECONOMIC DEVELOPMENT IN FRAGILE CONTEXTS: LEARNING FROM SUCCESS AND FAILURE
26
Table 4: Identifying countries, variables and periods of success
Productivity and investment
GDP per capita (constant 2010 US$) – threshold: 3.5% growth
Ethiopia At risk (2004–2016)
Mozambique At risk (2001–2002), (1996–1999), (2010–2015), (2004–2008)
Côte d'Ivoire Transition (1995–1996), (2012–2016)
Liberia Transition (2006–2007), (1996–2000), (2011–2013)
FDI (BoP; current US$) – threshold: 31.2% growth
Madagascar Transition (1999–2000), (2004–2008)
Mozambique At risk (2001–2002), (2006–2012), (1998–1999)
FDI (% of GDP) – threshold: 21.5% growth
Mozambique At risk (2001–2002), (2006–2012), (1998–1999)
Economic foundations
Access to electricity (% of population) – threshold: 3.4% growth
Somalia Active (1993–2014)
South Sudan Active (2003–2009), (2011–2014)
Mali Subnational (2007–2012), (1992–2005)
Comoros Transition (1992–2012)
DRC Transition (2006–2007), (2009–2012), (1992–2004)
Chad Transition (2005–2014), (1999–2003), (1992–1997)
Mobile cellular subscriptions (per 100 people) – threshold: 64.4% growth
Afghanistan Active (2003–2008)
Madagascar Transition (1995–2001), (2006–2008)
Liberia Transition (2002–2007)
Doing Business score – threshold: 2.4% growth
Uzbekistan At risk (2011–2016)
Domestic credit to private sector – threshold: 11.0% growth
Congo Republic At risk (2008–2016), (1998–1999)
Ethiopia At risk (1994–1999)

ECONOMIC DEVELOPMENT IN FRAGILE CONTEXTS: LEARNING FROM SUCCESS AND FAILURE
27
Peru At risk (1992–1998), (2007–2008)
Swaziland At risk (2002–2007)
Kosovo Transition (2002–2008)
Employment structures
Increases in manufacturing employment – threshold: 2.4% growth
Yemen Active (1997–1998), (2015–2016), (2006–2008), (2000–2004)
Algeria At risk (2012–2013), (2004–2009)
Bangladesh At risk (2001–2005), (2007–2013)
Ethiopia At risk (1999–2005), (2014–2015), (1995–1997)
Lesotho At risk (2000–2004)
Burkina Faso Transition (2003–2004), (1994–1995), (2006–2014)
Papua New Guinea Transition (2001–2009)
Nepal At risk (1992–2001)
Construction employment – threshold: 5.4% growth
Afghanistan Active (2002–2006)
Yemen Active (2000–2004)
Algeria At risk (2005–2009)
Ethiopia At risk (2013–2016), (1995–2005)
Burkina Faso Transition (1996–1997), (2002–2014), (1999–2000)
West Bank & Gaza Transition (1997–1998), (2009–2013)
Increases in employment within public, health, education, finance, etc.
Afghanistan Active (2006–2011), (2002–2004)
Ethiopia At risk (1995–2002), (2006–2010), (2012–2016)
Lesotho At risk (2000–2005)
Burkina Faso Transition (2000–2001), (2003–2004), (2006–2013)
Papua New Guinea Transition (1992–1993), (2001–2013)
Timor-Leste Transition (2011–2016), (2007–2009)
Labour productivity
Total – excluding mining – threshold: 4.1% growth
Yemen Active (2000–2006), (1995–1996)
Azerbaijan At risk (2002–2004), (2010–2014), (1999–2000), (2006–2008)

ECONOMIC DEVELOPMENT IN FRAGILE CONTEXTS: LEARNING FROM SUCCESS AND FAILURE
28
Ethiopia At risk (2004–2016)
Mozambique At risk (2001–2002), (2004–2012), (1996–1998)
Côte d'Ivoire Transition (2012–2016)
Manufacturing – between – threshold: 0.2% growth
Ethiopia At risk (1999–2005), (1995–1997)
Lesotho At risk (2000–2004)
Nepal At risk (1992–2001)
Agriculture – within-sector growth – threshold: 0.8% growth
Liberia Transition (2010–2015), (1995–2002), (2006–2008)
Sierra Leone Transition (2001–2003), (2005–2013)
Burkina Faso Transition (2010–2014), (1998–1999), (1995–1996)
Nigeria Subnational (2002–2010)
Trade
Merchandise exports (current US$) – threshold: 21% growth
Lesotho At risk (1992–1993), (2000–2004)
Sierra Leone Transition (2012–2013), (2000–2004)
Manufactures exports (% of merchandise exports) – threshold: 9% growth
Burundi At risk (2013–2014), (1999–2003)
3.3 Visualising success This section provides a number of graphical examples of successes that were identified in Table 4. These charts show:
• The rise of mobile phone use in Afghanistan compared with other groupings. This grew rapidly over the period just after 2005 up to 2010.
• Rapid GDP growth in Liberia compared with country groupings (five-year rolling average), but volatile.
• A high manufacturing value addition share in GDP in Lesotho compared with country groupings. This growth in output was driven primarily by structural change.
• Uzbekistan recording significant growth on its Doing Business score. • Congo Republic recording strong growth in domestic credit provided to the private
sector (% of GDP). • A sustained increase of the employment share in construction in Burkina Faso. • Consistently high labour productivity growth within the agriculture sector in Sierra
Leone.
We discuss most of these examples in Section 4. For now, we note that there are many positive stories of change, even if they are experienced for a short period of time. This data can be downloaded from SET (2018).

ECONOMIC DEVELOPMENT IN FRAGILE CONTEXTS: LEARNING FROM SUCCESS AND FAILURE
29
Figure 11: High growth of mobile phone use in Afghanistan from 2004 to 2009 compared with other fragile states
Note: Group averages comprise of equal-weight means. All observations greater than 3.5 standard deviations away from the group mean are omitted prior to calculation. Group observations are kept only when more than 65 percent of countries within the category record data. Source: WDI.
Figure 12: Rapid GDP growth in Liberia compared with country grouping (five-year rolling average)
Note: Group averages comprise of equal-weight means. All observations greater than 3.5 standard deviations away from the group mean are omitted prior to calculation. Group observations are kept only when more than 65 percent of countries within the category record data. Source: WDI.

ECONOMIC DEVELOPMENT IN FRAGILE CONTEXTS: LEARNING FROM SUCCESS AND FAILURE
30
Figure 13: High manufacturing value addition share in GDP Lesotho compared with country groupings
Note: Group averages comprise of equal-weight means. All observations greater than 3.5 standard deviations away from the group mean are omitted prior to calculation. Group observations are kept only when more than 65 percent of countries within the category record data. Source: UN Statistics Division.
Figure 14: Aggregate productivity change in Lesotho driven primarily by structural change into the manufacturing sector
Source: SET (2018).

ECONOMIC DEVELOPMENT IN FRAGILE CONTEXTS: LEARNING FROM SUCCESS AND FAILURE
31
Figure 15: Uzbekistan records significant growth in Doing Business Score
Note: Group averages comprise of equal-weight means. All observations greater than 3.5 standard deviations away from the group mean are omitted prior to calculation. Group observations are kept only when more than 65 percent of countries within the category record data. Source: WDI.
Figure 16: Congo Republic records strong growth in domestic credit provided to private sector (% of GDP)
Note: Group averages comprise of equal-weight means. All observations greater than 3.5 standard deviations away from the group mean are omitted prior to calculation. Group observations are kept only when more than 65 percent of countries within the category record data. Source: WDI.

ECONOMIC DEVELOPMENT IN FRAGILE CONTEXTS: LEARNING FROM SUCCESS AND FAILURE
32
Figure 17: Sustained growth of employment share in construction in Burkina Faso
Notes: Although the state witnessed growth in employment within the sector, relative labour productivity within the sector fell by 50% from over 2.2 less than 1.0 from 2008 to 2016. Group averages comprise of equal-weight means. All observations greater than 3.5 standard deviations away from the group mean are omitted prior to calculation. Group observations are kept only when more than 65 percent of countries within the category record data. Source: ILOStat database.
Figure 18: Consistently high labour productivity growth within the agriculture sector in Sierra Leone
Note: Group averages comprise of equal-weight means. All observations greater than 3.5 standard deviations away from the group mean are omitted prior to calculation. Group observations are kept only when more than 65 percent of countries within the category record data. Source: ILOStat and UN Statistics Division.

ECONOMIC DEVELOPMENT IN FRAGILE CONTEXTS: LEARNING FROM SUCCESS AND FAILURE
33
4. CASE STUDY EVIDENCE ON ECONOMIC SUCCESSES IN FRAGILE CONTEXTS
The data-intensive methodology used in the previous section identifies a handful of cases of success in amongst numerous failures. This analysis motivates a deeper examination of case study evidence. Below, we briefly describe seven case studies of successful economic development that has occurred despite the fragile environment in which it has taken place (further detail on each of the seven cases can be found as Appendix B). Section 4.1 provides an overview of which case studies have been selected on the basis of data analysis in Section 3. Section 4.2 discusses the emerging findings from the case studies using the factors behind success identified in the literature review in Section 2 and summarised in Section 2.4. Section 4.3 examines more deeply why specific case studies have been successful.
4.1 Overview of the case studies The examples, identified on the basis of our statistical analysis in Section 3, relate to three risk categories: Countries in active conflict
• Remarkable growth in the number of mobile phone users in Afghanistan: ICT will
have economy-wide transformative impacts. • Telecommunications and money transfer in Somalia: mobile money unlocks many
transformative opportunities. Countries that transition from conflict
• The development of a local construction industry in Liberia: infrastructure is often a key binding constraint to economic growth, and high-capability local and foreign firms have begun to address this under performance-based contracts.
• Public accounting in Liberia: services are increasingly important for economic development and governance.
• Investment in cocoa in Sierra Leone: agro-business is a key step in economic transformation.
Countries at risk of conflict
• Breweries in Burundi and Kenya: jobs in high-productivity manufacturing, distribution and the supply chain are crucial for economic transformation.
• Sugar in Mozambique: from sluggish in 1992 towards the most successful industry in post-conflict Mozambique, sugar provides a significant number of jobs and livelihoods.
Table B1 (at the end of Appendix B and the paper) summarises the case studies in seven areas (rows). After describing the particular issue, it discusses five possible success factors. Not all factors can be discussed in detail in brief case studies: often, the situation is complex, and not all factors will have equal importance. It also discusses the overall reasons for success.
4.2 What issues emerge from the case studies These are the six questions for analysis that are derived from the conceptual overview in Section 2. The main points relating to each of these questions are summarised in Table B1:

ECONOMIC DEVELOPMENT IN FRAGILE CONTEXTS: LEARNING FROM SUCCESS AND FAILURE
34
1. What has happened? 2. What is the type of political connection between economic activities and state/state–
business relations? 3. What is the role of the public sector (islands of excellence/experimentation) and
leadership? 4. What is the role of private sector leadership (undergoing transition, capability,
partnerships with foreign entities)? 5. How is the private sector coping with risk (security, regulatory, volatility, reputational,
clustering)? 6. What is the role of external actors?
The key issues emerging from the case studies are as follows: Politically smart and productive relations between investors and the state are nearly always important. For example, the state in Afghanistan allowed a temporary monopoly before competition kicked in. The firms Dahabshil and Hormud in Somalia, working in telecommunications and money transfer, are politically active and influential, and have built broad constituencies that enable them to manage risk. And large firms with large sunk costs, such as breweries (Burundi, Kenya), have close interactions with government. Large firms can better manage risks than small firms. Large firms may have better access to policy-makers, raising the stakes of failure if governments interfere in their operations, and may be better placed to mobilise external support against political interference. Large firms with political access can also engage in ‘crony capitalism’, though, for example suppressing competition or entrenching political incumbents. A policy challenge is to ensure first-mover firms do not become permanent rent-seeking monopolies. Firms have coped with risk in other ways as well, including by producing products in high demand such as beer and mobile phone services that are consumed by elites and society more widely; a government that meddles, with effects on the supply of beer or the ability to make phone calls, does so at its peril. Companies have also managed risk through being good corporate citizens, such as the money transfer firms in Somalia, which aligned themselves with religious principles and local values to provide widely used services. While the role of the public sector is often minimal, owing to a lack of capacity, all investors eventually look for a credible commitment from government. Fiscal incentives for breweries (Kenya) and longer-term output- and performance-based contracting in the construction industry (Liberia) are good examples. Public support for the sugar industry (loans, training, access) was helpful in Mozambique. In some case, private sector leadership can be a positive force to help develop a sector. For example, Liberia’s professional accountancy organisation developed the industry, building local and international linkages. FDI from Mauritius and South Africa was responsible for rehabilitation and upgrading in Mozambique. Private sector firms engage in a wide variety of coping strategies to reduce risk. Chinese investors in Liberian construction looked for local capacity; Dahabshil and Hormud issued local shares and engaged in appropriate staff recruitment; and cocoa investors in Sierra Leone took over the role of government in building infrastructure. External actors (here: foreign aid agencies) do not always play a major role but can in many cases be helpful. They can become investors in manufacturing companies (e.g. via the International Finance Corporation, IFC), provide grants to business associations or help improve the procedures around contracting for construction or promote local sourcing and

ECONOMIC DEVELOPMENT IN FRAGILE CONTEXTS: LEARNING FROM SUCCESS AND FAILURE
35
development of farmer cooperatives. They can also support government efforts to strengthen the business environment and facilitate resolution of differences that arise between investors and government without recourse to expensive and lengthy formal processes under their contracts.
4.3 Why ultimately has success happened? Each case study includes a section on why ultimately success has happened, taking into account all of the above factors. In conclusion, we find there are deep-seated factors for why progress has happened. These factors can be summarised as the importance of enabling innovation that is technically sound and that is implemented in a politically smart way through quality, targeted governance. In short, it is crucial to identify and target specific connections between economics and political economy. This frequently is an elaborate, time-consuming process. Let us indicate how the case studies point to this conclusion. From the example of Afghanistan, it is clear that sector characteristics in the telecommunication sector can be conducive to progress even in a fragile context, but specific, local factors were probably decisive, such as the quality relationship between government and the single incumbent in Afghanistan. In Liberia, a technical fix such as performance-based contracting was introduced successfully in part because of a willing government intent on change. Thus, an understanding of the political context before introducing targeted governance solutions seems a prerequisite. Business can be in the lead of such progress. For example, outward-looking, entrepreneurial business associations were responsible for introducing international standards in the accountancy profession in Liberia. And, in the absence of a functioning government, as in Somalia, interventions need to circumvent the state and work directly with the local private sector. The money transfer system was made to work by using locally aware private sector actors. Thus, local entrepreneurs and associations frequently have important knowledge that can unlock success. In other cases, the synergetic relationship between state and business is crucial. For example, in the beer sector, there is mutual dependence between state and business in terms of consumption, tax revenues and job creation. This ensures progress is made, such as in moving towards more local sourcing. Studying the pros and cons of such synergetic relationships again is crucial as some connections do work.

ECONOMIC DEVELOPMENT IN FRAGILE CONTEXTS: LEARNING FROM SUCCESS AND FAILURE
36
5. CONCLUSIONS AND IMPLICATIONS Economic progress is very challenging in conflict-affected states, but it is not impossible. This paper examines reasons for failure but also identifies cases of success. It first defines fragility, and distinguishes among countries that are affected differently by fragility, dividing countries into those 1) where there is active conflict; 2) in transition from conflict to resilience; 3) with subnational conflict; and 4) that are at risk of conflict. Not surprisingly, in general terms, growth and economic transformation performance is weak in fragile countries. Typically, the agriculture sector dominates, but in the first few years following a conflict it is the construction sector that tends to grow fastest, followed by transport, telecommunications and mining. Exports of fragile states are more concentrated and volatile. Section 2 identifies five reasons for poor performance in fragile states: 1) pervasive insecurity or a legacy of actual armed conflict; 2) ineffective governance to support a modern market economy; 3) inadequate infrastructure, primarily physical infrastructure, but also soft infrastructure such as a basic financial sector and institutions that support trade; 4) meso-level or sectoral deficiencies that constrain inter-sectoral and inter-firm activity and set back productivity and growth; and 5) micro-level characteristics of firms in fragile contexts that constrain their productivity and contribution to economic transformation. Crucially, however, despite general failings, careful statistical analysis in Section 3 (see SET, 2018) identifies cases of success in specific countries, variables and time periods. This motivates us to examine success cases in more detail. We identify a range of countries in each of the fragile state categories that have had some success, including Afghanistan, Burundi, Liberia, Mozambique, Sierra Leone and Somalia. Section 4 looks at the following identified cases of success (with further information available in Appendix B):
• Mobile phone usage in Afghanistan • Local construction in Liberia • Public accounting in Liberia • Telecommunications and money transfer in Somalia • Investment in cocoa in Sierra Leone • Breweries in Burundi and Kenya • Sugar in Mozambique
Building on the conceptual analysis in Section 2, we provide insights and identify a number of factors that are important for success. First, political connections between economic activities and the state are nearly always crucial. While the role of the public sector is often minimal, owing to a lack of capacity, all investors eventually look for a credible commitment from the government. In some cases, private sector leadership can be a positive force to help develop a sector. Private sector firms engage in a wide variety of coping strategies to reduce risk. Foreign aid agencies do not always play a major role but can in many cases be helpful. They can become investors in manufacturing companies (e.g. via the IFC), provide grants to business associations or help improve the procedures around contracting for construction or promote local sourcing and development of farmer cooperatives. Ultimately, though, it is the importance of enabling innovation that is technically sound and that is implemented in a politically smart way through quality, targeted governance. In short, this means identifying and targeting specific connections between economics and political economy.

ECONOMIC DEVELOPMENT IN FRAGILE CONTEXTS: LEARNING FROM SUCCESS AND FAILURE
37
Finally, we examine implications for policymakers. Substantial challenges in fragile context problems derive from the structure of economies. Fragile states have very little manufacturing, low productivity, concentrated and volatile exports, etc. This makes the task of development very difficult and maintains the status quo. Instead, we need transformative change. We have argued that significant change is not impossible. Instead, we have identified many examples of positive change, from marked GDP increases in Libya to significant increases in telecommunications subscriptions in Afghanistan. But many of these good examples are followed by relapses (Pritchett et al., 2018). This leads to three questions:
1. What has caused these changes? 2. What can be done to support economic development in fragile contexts? 3. Knowing that variability of outcomes and falling back into conflict is a real challenge,
what can be done to sustain these changes and transform economies for the longer term, thereby reducing the chance of conflict?
We know that a range of common factors underpin weak performance in fragile states. But when it comes to next steps, we are more uncertain than ever, and try make use of case study material. The Fragility Commission (2018) report recently argued for a new approach to fragile states. We agree that a change is needed (see also Manuel, 2018). All of the answers emanating from case study material depend on understanding the economic and political context well. Political connections between economic activities and the state are nearly always important if not essential for change. Effective interventions require us to do more to understand these connections, when are they beneficial and when not. Once we understand, working with capable officials in government that can offer a credible commitment to reciprocity and joint action is a useful starting point, but in other cases working solely with locally aware private sector actors can also be helpful. Foreign agents can provide a catalyst for change in specific context, but this depends on implementing targeted action rather than on fostering general investment climate interventions that lack political smartness. Understanding what can help sustain good outcomes to become transformational requires further analysis.

ECONOMIC DEVELOPMENT IN FRAGILE CONTEXTS: LEARNING FROM SUCCESS AND FAILURE
38
REFERENCES Acquaah, M. and Eshun, J. P. (2010) ‘A longitudinal analysis of the moderated effects of networking relationships on organizational performance in a sub-Saharan African economy’ Human Relations 63(5): 667–700. Andrews, M., Pritchett, L. and Woolcock, M. (2012) Escaping capability traps through problem-driven interactive adaptation. Working Paper 299. Washington, DC: Center for Global Development. Bewley, H., Forth, J. and Robinson, C. (2010) Evaluation methodology: measurement of drivers of business success and failure. London: UK Department for Business Innovation and Skills. Bloom, N., Genakos, C., Sadun, R. and van Reenen, J. (2012) ‘Management practices across firms and countries’ The Academy of Management Perspectives 26(1): 12–33. Bloom, N. and van Reenen, J. (2010) ‘Why do management practices differ across firms and countries?’ Journal of Economic Perspectives 24(1): 203–224. Bodnar, G. M., Giambona, E., Graham, J. R., Harvey, C. R. and Marston, R. C. (2011) ‘Managing risk management’. Scholarly Paper. Rochester, NY: Social Science Research Network. Crespi, G., Criscuolo, C. and Haskel, J. (2008) ‘Productivity, exporting, and the learning by exporting hypothesis: direct evidence from UK firms’ Canadian Journal of Economics/Revue canadienne d'économique 41(2): 619–638. De Sola, I. and Kaspersen, A. (2015) Is the businesss world ready for today's security challenges? Geneva: WEF. Eubank, N. (2010) Peace-building without external assistance: lessons from Somaliland. Working Paper 198. Washington, DC: Center for Global Development. Fragility Commission (2018) ‘Escaping the fragility trap’. Commission on State Fragility, Growth and Development Final Report, April (https://www.theigc.org/wp-content/uploads/2018/04/Escaping-the-fragility-trap.pdf) HLPFS (High Level Panel on Fragile States) (2014) Ending conflict & building peace in Africa: a call to action. Abidjan: AfDB. IFC (International Finance Corporation) (2017) Private enterprises in conflict-related situations. Washington, DC: IFC. Foster, V. and Briceno-Garmendia, C. (2010) ‘Africa’s infrastructure: a time for transformation’. Africa Development Forum (https://openknowledge.worldbank.org/handle/10986/2692) Kaplan, S. and Teufe, F. (2016) ‘The role of road networks in addressing fragility and building resilience’. Africa Economic Brief 7(5). Abidjan: AfDB. Khan, M. (2010) Political settlements and the governance of growth-enhancing institutions. London: SOAS. Kreutz, J. (2010) ‘How and when armed conflicts end: introducing the UCDP Conflict Termination Dataset’ Journal of Peace Research 47(2): 243–250. Lin, J.Y. (2012) New structural economics – a framework for rethinking development and policy. Washington, DC: World Bank. Manuel, M. (2018) ‘Fragility Commission report is spot on: engagement in fragile states needs real and radical change’. ODI blog (https://www.odi.org/comment/10638-fragility-commission-report-spot-engagement-fragile-states-needs-real-and-radical-change)

ECONOMIC DEVELOPMENT IN FRAGILE CONTEXTS: LEARNING FROM SUCCESS AND FAILURE
39
McMillan, M., Page, J., Booth, D. and te Velde, D.W. (2017) Supporting economic transformation: An approach paper. Supporting Economic Transformation Report. London: ODI. OECD (Organisation for Economic Co-operation and Development) (2007) Principles for good international engagement in fragile states. Paris: OECD. OECD (2008) ‘Concepts and dilemmas of state building in fragile situations’. Discussion Paper. Paris: OECD. OECD (2010) The state's legitimacy in fragile situations: unpacking complexity. Paris: OECD. OECD (2011) ‘Supporting statebuilding in situations of conflict and fragility: policy guidance’. DAC Guidelines and Reference Series. Paris: OECD. OECD (2015) States of fragility 2015: meeting post-2015 ambitions. Paris: OECD. OECD (2016) States of fragility 2016: understanding violence. Paris: OECD. Piffaretti, N.F. (2010) From Rent-seeking to Profit-creation: Private Sector Development and Economic Turnaround in Fragile States. Pritchett, L., Sen, K. and Werker, E. (2018) Deal and development: the political dynamics of growth episodes. Oxford: Oxford University Press. Randøy, T. and Goel, S., (2003) ‘Ownership structure, founder leadership, and performance in Norwegian SMEs: implications for financing entrepreneurial opportunities’ Journal of Business Venturing 18(5): 619–637. Rodrik, D. (2013) ‘Unconditional convergence in manufacturing’, Quarterly Journal of Economics 121(1): 165-204. Saliola, F. and Seker, M. (2011) ‘Total factor productivity across the developing world’. Research Note. Washington, DC: World Bank. SET (Supporting Economic Transformation) (2018) ‘SET interactive data portal’ (https://set.odi.org/interactive-data-portal/) Sousa, F.J. (2004) ‘The strategic relevance of business relationships: a preliminary assessment’ (http://wps.fep.up.pt/wps/wp163.pdf) Tyson, J. (2017) Private sector development in Liberia: financing economic transformation in a fragile context. Supporting Economic Transformation Working Paper. London: ODI. UN (2015) The Millennium Development Goals report. New York: UN. Waal, A. de (2015) The real politics of the horn of Africa: money, war and the business of power. Cambridge: Polity Press. World Bank (2003) World Development Report 2003: sustainable development in a dynamic world – transforming institutions, growth, and quality of life. Washington, DC: World Bank. World Bank (2011) Conflict, security and development. World Development Report 2011. Washington, DC: World Bank. World Bank (2012) ‘Private Sector Development Support Project, Islamic Republic of Afghanistan’. Implementation Completion and Results Report. Report No. ICR2136. Washington, DC: World Bank. World Bank (2013) Doing business in the g7+ 2013. Washington, DC: World Bank. World Bank (2013a) ‘Ghana Trade and Investment Gateway Project’. Project Performance Assessment Report. Report No. 82728. Washington, DC: Independent Evaluation Group, World Bank. World Bank (2016) Doing business 2016. Washington, DC: World Bank.

ECONOMIC DEVELOPMENT IN FRAGILE CONTEXTS: LEARNING FROM SUCCESS AND FAILURE
40
World Bank (2018) ‘World Development Indicators’ (http://data.worldbank.org/data-catalog/world-development-indicators) WEF (World Economic Forum) (2016a) Global competitiveness report 2016-2017. Geneva: WEF. WEF (2016b) The global risks report 2016. Geneva: WEF.

ECONOMIC DEVELOPMENT IN FRAGILE CONTEXTS: LEARNING FROM SUCCESS AND FAILURE
41
APPENDIX A: FRAGILITY TYPOLOGIES AND DATA
Appendix A1: Fragility typologies The World Bank and the regional development banks have retained a list of fragile states that is largely determined by economic factors measured by its Country Performance and Institutional Assessment (CPIA) that governs its allocation of resources based on criteria associated with development, as well as whether there is a UN or regional peace-keeping or political mission in the country.9 This approach has been criticised because it presents fragility as an economic issue and neglects political grievances, as well as the fundamental problem with all lists of ‘fragile states’ that consider fragility to be binary – that is, a country is fragile or not – whereas most countries exhibit some features of fragility to a greater or lesser extent. This current list of 35 countries is shown in Table 1. While this list is used for operational decisions by the multilateral development banks, such as access to special concessional resources for addressing fragility, the Bank’s analytical work on fragility is leading to convergence with concepts of fragility that are more difficult to measure. For example, its flagship World Development Report considered fragility a characteristic of weak institutions in which the population lacked confidence to resolve stresses in society along security, economic and justice fault lines. Such a situation is vulnerable to an internal or external shock that leads to violence (World Bank, 2011). Establishing indicators of fragility has been boosted by Sustainable Development Goal 16, which covers peaceful and inclusive societies, justice and effective, accountable and inclusive institutions – objectives that are not easy to measure. The Development Assistance Committee of the Organisation for Economic Co-operation and Development (OECD-DAC) has also maintained a list of fragile states that it uses for its statistical reporting and for its analytical and policy work on conflict (see Table 1). OECD thinking on what constitutes fragility has evolved from a lack of political will or capacity to provide for poverty reduction, development and safeguarding security and human rights (OECD, 2007) to a fragile state being one that is unable to meet the population’s changing expectations and manage the changes in capacity to meet them (OECD, 2008). Public expectations are influenced by questions of the state’s legitimacy, and the OECD developed a Weberian concept of legitimacy with four components: 1) performance legitimacy, or the state’s ability to deliver services; 2) process legitimacy, or the ability of the state to promulgate and enforce accepted rules; 3) the degree to which the state embodies shared beliefs shaped by religion, traditions and charismatic leaders; and 4) the extent to which the state is recognised by the international community (OECD, 2010). The legitimacy of the state depends on all four components to varying extents. Public service delivery or economic growth alone is unlikely to lead to a legitimate state over the long run. The OECD-DAC policy guidance on state-building (OECD, 2011) defines a fragile state as having weak capacity to govern such that trust and mutual obligations between the state and citizens have become weak. The political settlement is narrowly based and exclusive and the state is unable to resolve differences among social groups without repression. Such a polity is vulnerable to internal or external crises that can lead to conflict. Current OECD thinking sees fragility as a spectrum, with political, societal, economic, environmental and security dimensions of the risk of conflict. Fragility of countries is assessed 9 The World Bank is prohibited under its articles from taking lending decisions on political factors. The criterion of peace-keeping or political missions is an objective proxy for political or security tensions that are not captured in the CPIA. The World Bank’s Board has not allowed the public release of the CPIAs of middle-income countries that do not borrow from the Bank’s concessional window. Several middle-income countries have had CPIAs below the fragility cut-off of 3.2 but these cannot be included in the list unless they have UN or regional Specialised Missions. The World Bank list of fragile states is available at http://pubdocs.worldbank.org/en/154851467143896227/FY17HLFS-Final-6272016.pdf

ECONOMIC DEVELOPMENT IN FRAGILE CONTEXTS: LEARNING FROM SUCCESS AND FAILURE
42
by a combination of measurable indicators (OECD 2016). Almost any country can be scored against the indicators underlying these dimensions, although there are expert judgements as to which combination of indicators constitute a high risk of conflict, and some of the indicators themselves depend on data that itself depends on expert judgement that may be coloured by the values of the assessors. The OECD fragility spectrum is shown in Figure A1.1.
Figure A1.1: OECD spectrum of fragility (2016)
Source: OECD (2016). Typologies of conflict-affected countries The prospects for attracting business investment are obviously lower in countries at war than in countries with a long past legacy of conflict or where violence is contained to peripheral areas. For the purposes of our analysis we have considered four groups of countries:
1. Countries in active conflict or crisis, such as South Sudan, Somalia and Afghanistan, and Middle East countries like Syria, Iraq, Libya and Yemen
2. Countries with subnational conflicts that are typically confined to particular regions so that economic and social activities in the rest of the country are normal. These kinds of conflict often take place in a country with strong state institutions and sometimes are a consequence of a troubled border region in large countries that expanded geographically in the past or artificially drawn borders
3. Countries undergoing a conflict to peace transition, for example Liberia and Sierra Leone
4. Countries at risk of violent conflict. These might be countries with a legacy of conflict, or countries on the World Bank or OECD lists of fragile states that do not fall into the other categories

ECONOMIC DEVELOPMENT IN FRAGILE CONTEXTS: LEARNING FROM SUCCESS AND FAILURE
43
5. Countries with legacy conflicts that appear to have low risk of conflict. These have had no deaths from violent conflict for 10 years or more, the population appears to have confidence in public institutions to act fairly and a new political settlement has been sustained since the conflict. These countries are of interest to better understand how they have been successful in developing without violence after a past conflict. Since conflict has a habit or recurring, one cannot go so far to say there will not be future conflict, so in that sense they are a subset of the countries at risk of conflict. Examples might be in the Balkans and Indochina as well as Morocco, Mexico, Bangladesh, Mozambique, Angola and Peru.
Table A1.1: Countries at risk of violent conflict
Egypt Algeria El Salvador Haiti Niger Uzbekistan
Ethiopia Azerbaijan Guatemala Iran Peru Venezuela
Guinea Bangladesh Eritrea Lebanon Sri Lanka Zimbabwe
Jordan Burundi Georgia Malaysia Tajikistan Malawi
Nepal Comoros Guatemala Mauritania Turkey Pacific Microstates
Niger Congo Guinea Mozambique Uganda Korea, DPR Moldova Lesotho, Swaziland
Countries at risk of conflict are those on the World Bank or OECD fragile states lists that are not otherwise included in the other criteria, countries with more than 25 battle deaths in the 1990–2010 period where there has not been a new political settlement and no recent political violence, e.g. Indochina, Balkans. Note that the risk in some of the countries in the table might be of subnational violence. Note also that there are countries on the fragility tables with no history of battle deaths, like Malawi. Active conflict or crisis Afghanistan, Iraq, Libya, Somalia, South Sudan, Syria, Yemen. Conflict to peace transition Burkina Faso, CAR, Chad, Comoros, Côte d’Ivoire, DRC, The Gambia, Guinea Bissau, Haiti, Kosovo, Lebanon, Liberia, Madagascar, Papua New Guinea, Sierra Leone, Timor Leste. Subnational fragility and conflict Cameroon, Colombia, Mali, Nigeria, Pakistan, Philippines, Sri Lanka, Ukraine.

ECONOMIC DEVELOPMENT IN FRAGILE CONTEXTS: LEARNING FROM SUCCESS AND FAILURE
44
Table A1.2: Countries with legacy of conflict in past decades
Country 1950s 1960s 1970s 1980s 1990s 2000s 2010s
0 Afghanistan 0 0 1 1 1 1 1 1 Algeria 1 1 0 0 1 1 1 2 Angola 0 1 1 1 1 1 0 3 Argentina 1 1 1 0 0 0 0 4 Azerbaijan 0 0 0 0 1 1 1 5 Bangladesh 0 0 1 1 1 1 0 6 Bolivia 1 1 0 0 0 0 0 7 Bosnia and Herzegovina 0 0 0 0 1 0 0 8 Brunei Darussalam 0 1 0 0 0 0 0 9 Burkina Faso 0 0 0 1 0 0 0 10 Burundi 0 1 0 0 1 1 0 11 Cambodia 1 1 1 1 1 0 0 12 Cameroon 1 1 0 1 0 0 0 13 Central African Republic 0 0 0 0 0 1 1 14 Chad 0 1 1 1 1 1 1 15 Chile 0 0 1 0 0 0 0 16 China 1 0 0 0 0 1 0 17 Colombia 0 1 1 1 1 1 1 18 Comoros 0 0 0 1 1 0 0 19 Congo Republic 0 0 0 0 1 1 0 20 Costa Rica 0 0 0 0 0 0 0 21 Cote d'Ivoire 0 0 0 0 0 1 1 22 Croatia 0 0 0 0 1 0 0 23 Cuba 1 1 0 0 0 0 0 24 Cyprus 1 0 0 0 0 0 0 25 Djibouti 0 0 0 0 1 0 0 26 Dominican Republic 0 1 0 0 0 0 0 27 DR Congo 0 1 1 0 1 1 1 28 Egypt 0 0 0 0 1 0 1 29 El Salvador 0 0 1 1 1 0 0 30 Eritrea 0 0 0 0 1 1 0 31 Ethiopia 0 1 1 1 1 1 1 32 France 0 1 0 0 0 0 0 33 Gabon 0 1 0 0 0 0 0 34 Gambia 0 0 0 1 0 0 0 35 Georgia 0 0 0 0 1 1 0 36 Ghana 0 1 0 1 0 0 0 37 Greece 0 0 0 0 0 0 0 38 Guatemala 1 1 1 1 1 0 0 39 Guinea 0 0 0 0 0 1 0 40 Guinea-Bissau 0 1 1 0 1 0 0 41 Haiti 0 0 0 1 1 1 0 42 India 1 1 1 1 1 1 1 43 Indonesia 1 1 1 1 1 1 0 44 Iran 0 1 1 1 1 1 1 45 Iraq 1 1 1 1 1 1 1 46 Israel 1 1 1 1 1 1 1 47 Kenya 1 0 0 1 0 0 0

ECONOMIC DEVELOPMENT IN FRAGILE CONTEXTS: LEARNING FROM SUCCESS AND FAILURE
45
Country 1950s 1960s 1970s 1980s 1990s 2000s 2010s
48 Laos 1 1 1 1 1 0 0 49 Lebanon 1 0 1 1 1 0 1 50 Lesotho 0 0 0 0 1 0 0 51 Liberia 0 0 0 1 1 1 0 52 Libya 0 0 0 0 0 0 1 53 Macedonia 0 0 0 0 0 1 0 54 Madagascar 0 0 1 0 0 0 0 55 Malaysia 1 1 1 1 0 0 1 56 Mali 0 0 0 0 1 1 1 57 Mauritania 1 0 1 0 0 0 1 58 Mexico 0 0 0 0 1 0 0 59 Moldova 0 0 0 0 1 0 0 60 Morocco 1 0 1 1 0 0 0 61 Mozambique 0 1 1 1 1 0 1 62 Myanmar 1 1 1 1 1 1 1 63 Nepal 0 1 0 0 1 1 0 64 Nicaragua 0 0 1 1 1 0 0 65 Niger 0 0 0 0 1 1 0 66 Nigeria 0 1 1 0 0 1 1 67 North Korea 1 0 0 0 0 0 0 68 Oman 1 1 1 0 0 0 0 69 Pakistan 0 0 1 0 1 1 1 70 Panama 0 0 0 1 0 0 0 71 Papua New Guinea 0 0 0 0 1 0 0 72 Paraguay 1 0 0 1 0 0 0 73 Peru 0 1 0 1 1 1 1 74 Philippines 1 1 1 1 1 1 1 75 Romania 0 0 0 1 0 0 0 76 Russia 1 0 0 0 1 1 1 77 Rwanda 0 0 0 0 1 1 1 78 Saudi Arabia 0 0 1 0 0 0 0 79 Senegal 0 0 0 0 1 1 1 80 Serbia 0 0 0 0 1 0 0 81 Sierra Leone 0 0 0 0 1 1 0 82 Somalia 0 0 0 1 1 1 1 83 South Africa 0 1 1 1 0 0 0 84 South Sudan 0 0 0 0 0 0 1 85 Spain 0 0 1 1 1 0 0 86 Sri Lanka 0 0 1 1 1 1 0 87 Sudan 0 1 1 1 1 1 1 88 Suriname 0 0 0 1 0 0 0 89 Syria 0 1 1 1 0 0 1 90 Tajikistan 0 0 0 0 1 1 1 91 Thailand 1 0 1 1 0 1 1 92 Togo 0 0 0 1 0 0 0 93 Trinidad and Tobago 0 0 0 0 1 0 0 94 Tunisia 1 0 0 1 0 0 0 95 Turkey 0 0 0 1 1 1 1 96 Uganda 0 0 1 1 1 1 1 97 Ukraine 0 0 0 0 0 0 1

ECONOMIC DEVELOPMENT IN FRAGILE CONTEXTS: LEARNING FROM SUCCESS AND FAILURE
46
Country 1950s 1960s 1970s 1980s 1990s 2000s 2010s
98 United Kingdom 0 0 1 1 1 0 0 99 United States 1 0 0 0 0 1 1 100 Uruguay 0 0 1 0 0 0 0 101 Uzbekistan 0 0 0 0 1 1 0 102 Venezuela 0 1 0 1 1 0 0 103 Vietnam 1 1 1 0 0 0 0 104 Yemen 0 1 1 1 1 1 1 105 Zimbabwe 0 1 1 0 0 0 0
Notes: Data covers the period 1950–2015. Data on inter-state wars is excluded. Countries in italics are not included on the OECD list of fragile states. Source: Kreutz (2010).
Figure A1.2: Countries within OECD fragility spectrum
Note: Only states examined within ODI Economic Transformation Databases are considered. Shading follows the severity of state fragility as shown below. Source: OECD (2016).
Appendix A2: Numerical methods to assess progress in economic variables We use an algorithm that finds a country’s relative growth in a particular variable relative to the distribution of growth of that variable in a given year. The algorithm first categorises growth in a year by its location within the distribution of that year (5, 10, 25, 50, 75, 90, 95th percentiles). Missing values are counted and presented within the tables of the algorithm. These values count as zero. Then, each bin is allocated a point system:
• 0 to 5: -3 points • 5 to 10: -2 points • 10 to 25: -1 point • 25 to 50: 0 points
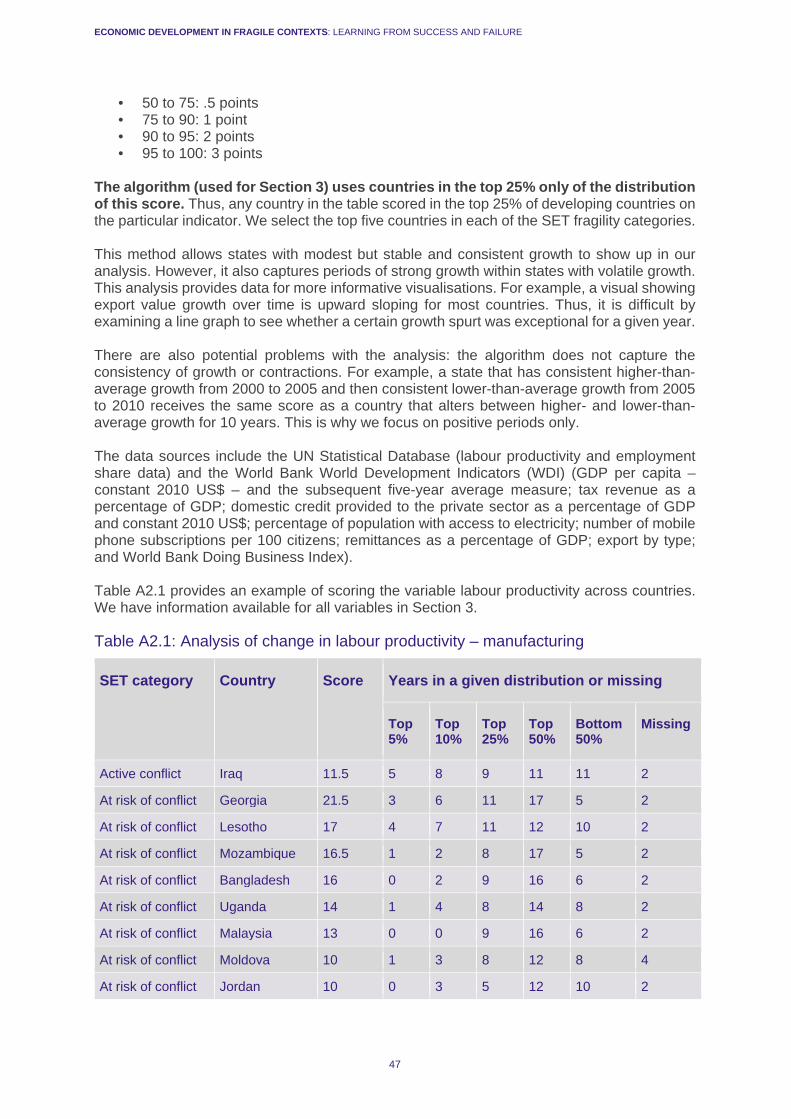
ECONOMIC DEVELOPMENT IN FRAGILE CONTEXTS: LEARNING FROM SUCCESS AND FAILURE
47
• 50 to 75: .5 points • 75 to 90: 1 point • 90 to 95: 2 points • 95 to 100: 3 points
The algorithm (used for Section 3) uses countries in the top 25% only of the distribution of this score. Thus, any country in the table scored in the top 25% of developing countries on the particular indicator. We select the top five countries in each of the SET fragility categories. This method allows states with modest but stable and consistent growth to show up in our analysis. However, it also captures periods of strong growth within states with volatile growth. This analysis provides data for more informative visualisations. For example, a visual showing export value growth over time is upward sloping for most countries. Thus, it is difficult by examining a line graph to see whether a certain growth spurt was exceptional for a given year.
There are also potential problems with the analysis: the algorithm does not capture the consistency of growth or contractions. For example, a state that has consistent higher-than-average growth from 2000 to 2005 and then consistent lower-than-average growth from 2005 to 2010 receives the same score as a country that alters between higher- and lower-than-average growth for 10 years. This is why we focus on positive periods only. The data sources include the UN Statistical Database (labour productivity and employment share data) and the World Bank World Development Indicators (WDI) (GDP per capita – constant 2010 US$ – and the subsequent five-year average measure; tax revenue as a percentage of GDP; domestic credit provided to the private sector as a percentage of GDP and constant 2010 US$; percentage of population with access to electricity; number of mobile phone subscriptions per 100 citizens; remittances as a percentage of GDP; export by type; and World Bank Doing Business Index). Table A2.1 provides an example of scoring the variable labour productivity across countries. We have information available for all variables in Section 3.
Table A2.1: Analysis of change in labour productivity – manufacturing
SET category Country Score Years in a given distribution or missing
Top 5%
Top 10%
Top 25%
Top 50%
Bottom 50%
Missing
Active conflict Iraq 11.5 5 8 9 11 11 2
At risk of conflict Georgia 21.5 3 6 11 17 5 2
At risk of conflict Lesotho 17 4 7 11 12 10 2
At risk of conflict Mozambique 16.5 1 2 8 17 5 2
At risk of conflict Bangladesh 16 0 2 9 16 6 2
At risk of conflict Uganda 14 1 4 8 14 8 2
At risk of conflict Malaysia 13 0 0 9 16 6 2
At risk of conflict Moldova 10 1 3 8 12 8 4
At risk of conflict Jordan 10 0 3 5 12 10 2

ECONOMIC DEVELOPMENT IN FRAGILE CONTEXTS: LEARNING FROM SUCCESS AND FAILURE
48
SET category Country Score Years in a given distribution or missing
Top 5%
Top 10%
Top 25%
Top 50%
Bottom 50%
Missing
At risk of conflict Iran 10 0 0 5 16 6 2
Limited conflict Myanmar 30.5 2 8 15 17 5 2
Limited conflict Equatorial Guinea
26.5 2 8 14 17 5 2
Limited conflict Bosnia & Herzegovina
26 4 5 8 18 4 2
Limited conflict Albania 23.5 3 8 12 13 9 2
Limited conflict Belarus 23 0 3 15 16 6 2
Limited conflict Trinidad & Tobago
21 3 3 10 14 8 2
Limited conflict Korea DPR 20.5 0 1 9 21 1 2
Limited conflict Lao PDR 18.5 1 1 9 19 3 2
Limited conflict Turkmenistan 16 4 6 12 12 10 2
Limited conflict Dominican Rep.
16 1 2 7 14 8 2
Limited conflict Vietnam 15 1 1 6 16 6 2
Limited conflict Mongolia 14.5 4 6 9 11 11 2
Limited conflict China 14 0 2 8 8 0 16
Limited conflict Maldives 14 1 5 9 12 10 2
Limited conflict Argentina 14 0 2 6 16 6 2
Limited conflict Cambodia 13.5 1 2 7 17 5 2
Limited conflict India 12.5 0 0 7 15 7 2
Limited conflict Bahamas 10.5 4 5 8 11 11 2
Limited conflict Angola 10.5 2 2 4 15 7 2
Limited conflict Mauritius 10.5 0 0 3 15 7 2
Limited conflict Botswana 10 2 2 7 12 10 2
Limited conflict Kuwait 10 5 7 10 12 10 2
Limited conflict Costa Rica 10 0 1 5 14 8 2
Subnational conflict Nigeria
19.5 3 5 10 13 9 2
Subnational conflict Ukraine
16 3 5 12 14 8 2
Subnational conflict Sri Lanka
10 1 1 5 12 10 2

ECONOMIC DEVELOPMENT IN FRAGILE CONTEXTS: LEARNING FROM SUCCESS AND FAILURE
49
SET category Country Score Years in a given distribution or missing
Top 5%
Top 10%
Top 25%
Top 50%
Bottom 50%
Missing
Transition Liberia 10.5 5 8 12 13 9 2
Table A2.2: Identifying countries and periods of success – economic fundamentals
Country Category Variable Threshold for success
Years above threshold
Growth periods
Longest period
Afghanistan Active conflict
Mobile cellular subscriptions (per 100 people)
64.4% 6 (2003–2008) 6
Afghanistan Active conflict
Access to electricity (% of population)
3.4% 14 (2000–2009), (2011–2014)
10
Somalia Active conflict
Access to electricity (% of population)
3.4% 22 (1993–2014) 22
South Sudan Active conflict
Access to electricity (% of population)
3.4% 11 (2003–2009), (2011–2014)
7
Syria Active conflict
Mobile cellular subscriptions (per 100 people)
64.4% 5 (2000–2004) 5
Bangladesh At risk of conflict
Mobile cellular subscriptions (per 100 people)
64.4% 13 (2004–2007), (1993–1995), (1997–2002)
6
Bangladesh At risk of conflict
Access to electricity (% of population)
3.4% 17 (2008–2011), (1998–2005), (1992–1996)
8
Burundi At risk of conflict
Access to electricity (% of population)
3.4% 19 (1992–1998), (2011–2012), (2000–2007)
8
Congo Republic
At risk of conflict
Domestic credit to private sector (% of GDP)
11.0% 12 (2008–2016), (1998–1999)
9
Congo Republic
At risk of conflict
Access to electricity (% of population)
3.4% 13 (1992–2001) 10
El Salvador At risk of conflict
Mobile cellular subscriptions
64.4% 6 (1994–1999) 6

ECONOMIC DEVELOPMENT IN FRAGILE CONTEXTS: LEARNING FROM SUCCESS AND FAILURE
50
Country Category Variable Threshold for success
Years above threshold
Growth periods
Longest period
(per 100 people)
Eritrea At risk of conflict
Access to electricity (% of population)
3.4% 12 (1992–2002) 11
Ethiopia At risk of conflict
Domestic credit to private sector (% of GDP)
11.0% 7 (1994–1999) 6
Ethiopia At risk of conflict
Access to electricity (% of population)
3.4% 21 (1992–2000), (2002–2004), (2006–2014)
9
Georgia At risk of conflict
Domestic credit to private sector (% of GDP)
11.0% 13 (1997–2000), (2013–2016), (2004–2008)
5
Guinea At risk of conflict
Access to electricity (% of population)
3.4% 16 (1992–1999), (2006–2008), (2001–2004)
8
Lesotho At risk of conflict
Access to electricity (% of population)
3.4% 16 (1999–2014) 16
Malawi At risk of conflict
Access to electricity (% of population)
3.4% 18 (2013–2014), (2006–2010), (1994–1999), (2001–2004)
6
Mauritania At risk of conflict
Access to electricity (% of population)
3.4% 20 (1992–2001), (2010–2014), (2003–2004), (2006–2008)
10
Moldova At risk of conflict
Mobile cellular subscriptions (per 100 people)
64.4% 7 (1996–2001) 6
Mozambique At risk of conflict
Access to electricity (% of population)
3.4% 18 (1992–1997), (2010–2011), (2004–2008), (2013–2014), (1999–2000)
6
Nepal At risk of conflict
Access to electricity (% of population)
3.4% 19 (1992–1996), (2002–2003), (1998–2000), (2005–2011), (2013–2014)
7

ECONOMIC DEVELOPMENT IN FRAGILE CONTEXTS: LEARNING FROM SUCCESS AND FAILURE
51
Country Category Variable Threshold for success
Years above threshold
Growth periods
Longest period
Niger At risk of conflict
Access to electricity (% of population)
3.4% 17 (1999–2004), (1994–1996), (2006–2011)
6
North Korea At risk of conflict
Access to electricity (% of population)
3.4% 22 (1992–2008), (2010–2014)
17
Peru At risk of conflict
Domestic credit to private sector (% of GDP)
11.0% 10 (1992–1998), (2007–2008)
7
Swaziland At risk of conflict
Domestic credit to private sector (% of GDP)
11.0% 7 (2002–2007) 6
Swaziland At risk of conflict
Access to electricity (% of population)
3.4% 21 (1992–2001), (2007–2014), (2003–2005)
10
Tajikistan At risk of conflict
Mobile cellular subscriptions (per 100 people)
64.4% 8 (2002–2006) 5
Turkey At risk of conflict
Domestic credit to private sector (% of GDP)
11.0% 11 (2004–2010), (1995–1997)
7
Turkey At risk of conflict
Mobile cellular subscriptions (per 100 people)
64.4% 7 (1994–2000) 7
Uzbekistan At risk of conflict
Doing Business Index Score
2.4% 6 (2011–2016) 6
Mali Subnational conflict
Access to electricity (% of population)
3.4% 21 (2007–2012), (1992–2005)
14
Nigeria Subnational conflict
Mobile cellular subscriptions (per 100 people)
64.4% 6 (2001–2006) 6
Ukraine Subnational conflict
Mobile cellular subscriptions (per 100 people)
64.4% 12 (1994–2005) 12
Burkina Faso Transition from conflict
Access to electricity (% of population)
3.4% 19 (1992–1993), (2005–2009), (2011–2014),
5

ECONOMIC DEVELOPMENT IN FRAGILE CONTEXTS: LEARNING FROM SUCCESS AND FAILURE
52
Country Category Variable Threshold for success
Years above threshold
Growth periods
Longest period
(1995–1998), (2000–2003)
Burkina Faso Transition from conflict
Mobile cellular subscriptions (per 100 people)
64.4% 7 (1997–2001) 5
CAR Transition from conflict
Access to electricity (% of population)
3.4% 21 (2002–2009), (1992–2000), (2011–2014)
9
Chad Transition from conflict
Mobile cellular subscriptions (per 100 people)
64.4% 7 (2003–2008) 6
Chad Transition from conflict
Access to electricity (% of population)
3.4% 21 (2005–2014), (1999–2003), (1992–1997)
10
Comoros Transition from conflict
Access to electricity (% of population)
3.4% 22 (1992–2012) 21
DRC Transition from conflict
Access to electricity (% of population)
3.4% 19 (2006–2007), (2009–2012), (1992–2004)
13
Gambia Transition from conflict
Access to electricity (% of population)
3.4% 14 (1994–2000), (2002–2006)
7
Guinea-Bissau Transition from conflict
Domestic credit to private sector (% of GDP)
11.0% 12 (1993–1994), (2010–2012), (2004–2008)
5
Guinea-Bissau Transition from conflict
Access to electricity (% of population)
3.4% 10 (2005–2014) 10
Kosovo Transition from conflict
Domestic credit to private sector (% of GDP)
11.0% 7 (2002–2008) 7
Liberia Transition from conflict
Mobile cellular subscriptions (per 100 people)
64.4% 6 (2002–2007) 6
Madagascar Transition from conflict
Mobile cellular subscriptions (per 100 people)
64.4% 11 (1995–2001), (2006–2008)
7

ECONOMIC DEVELOPMENT IN FRAGILE CONTEXTS: LEARNING FROM SUCCESS AND FAILURE
53
Country Category Variable Threshold for success
Years above threshold
Growth periods
Longest period
Papua New Guinea
Transition from conflict
Access to electricity (% of population)
3.4% 17 (1998–2005), (2007–2010), (1992–1996)
8
Solomon Islands
Transition from conflict
Access to electricity (% of population)
3.4% 17 (2001–2005), (2010–2013), (1993–1999)
7
Timor-Leste Transition from conflict
Access to electricity (% of population)
3.4% 20 (2004–2007), (1992–2002), (2011–2014)
11
Table A2.3: Identifying countries and periods of success – employment structures
Country Category Sector (change in employment share)
Threshold for success
Years above threshold
Growth periods
Longest period
Afghanistan Active conflict
Construction 5.4% 8 (2002–2006) 5
Afghanistan Active conflict
Manufacturing 2.4% 10 (1996–2001) 6
Afghanistan Active conflict
Other activities 2.7% 10 (2006–2011), (2002–2004)
6
Yemen Active conflict
Construction 5.4% 8 (2000–2004) 5
Yemen Active conflict
Manufacturing 2.4% 13 (1997–1998), (2015–2016), (2006–2008), (2000–2004)
5
Algeria At risk of conflict
Construction 5.4% 7 (2005–2009) 5
Algeria At risk of conflict
Manufacturing 2.4% 10 (2012–2013), (2004–2009)
6
Bangladesh At risk of conflict
Construction 5.4% 14 (2001–2003), (2014–2015), (2007–2010), (1992–1996)
5
Bangladesh At risk of conflict
Other activities 2.7% 12 (2012–2013), (2001–2003), (2015–2016), (1992–1996)
5
Bangladesh At risk of conflict
Manufacturing 2.4% 13 (2001–2005), (2007–2013)
7

ECONOMIC DEVELOPMENT IN FRAGILE CONTEXTS: LEARNING FROM SUCCESS AND FAILURE
54
Country Category Sector (change in employment share)
Threshold for success
Years above threshold
Growth periods
Longest period
Ethiopia At risk of conflict
Manufacturing 2.4% 13 (1999–2005), (2014–2015), (1995–1997)
7
Ethiopia At risk of conflict
Other activities 2.7% 20 (1995–2002), (2006–2010), (2012–2016)
8
Ethiopia At risk of conflict
Construction 5.4% 17 (2013–2016), (1995–2005)
11
Lesotho At risk of conflict
Manufacturing 2.4% 11 (2000–2004) 5
Lesotho At risk of conflict
Construction 5.4% 13 (2000–2001), (2003–2008), (1992–1994)
6
Lesotho At risk of conflict
Other activities 2.7% 12 (2000–2005) 6
Nepal At risk of conflict
Construction 5.4% 11 (2013–2014), (1992–1999)
8
Nepal At risk of conflict
Manufacturing 2.4% 10 (1992–2001) 10
Turkey At risk of conflict
Other activities 2.7% 11 (2002–2006), (2015–2016)
5
Nigeria Subnational conflict
Construction 5.4% 9 (2003–2004), (2008–2013)
6
Burkina Faso Transition from conflict
Other activities 2.7% 15 (2000–2001), (2003–2004), (2006–2013)
8
Burkina Faso Transition from conflict
Manufacturing 2.4% 16 (2003–2004), (1994–1995), (2006–2014)
9
Burkina Faso Transition from conflict
Construction 5.4% 18 (1996–1997), (2002–2014), (1999–2000)
13
Madagascar Transition from conflict
Manufacturing 2.4% 13 (1996–1997), (2011–2015), (2006–2009)
5
Madagascar Transition from conflict
Construction 5.4% 8 (2006–2012) 7
Papua New Guinea
Transition from conflict
Manufacturing 2.4% 11 (2001–2009) 9
Papua New Guinea
Transition from conflict
Other activities 2.7% 17 (1992–1993), (2001–2013)
13

ECONOMIC DEVELOPMENT IN FRAGILE CONTEXTS: LEARNING FROM SUCCESS AND FAILURE
55
Country Category Sector (change in employment share)
Threshold for success
Years above threshold
Growth periods
Longest period
Timor-Leste Transition from conflict
Other activities 2.7% 10 (2011–2016), (2007–2009)
6
West Bank and Gaza
Transition from conflict
Construction 5.4% 9 (1997–1998), (2009–2013)
5
Table A2.4: Identifying countries and periods of success – GDP and investment
Country Category Variable Threshold for success
Years above threshold
Growth periods
Longest period
Syria Active conflict
Annualised change in FDI; net inflows (BoP; current US$)
31.2% 9 (1993–1994), (2003–2007)
5
Azerbaijan At risk of conflict
Annualised change in GDP per capita (constant 2010 US$)
3.5% 15 (1997–2010) 14
Bangladesh At risk of conflict
Annualised change in GDP per capita (constant 2010 US$)
3.5% 13 (2004–2016) 13
Ethiopia At risk of conflict
Annualised change in GDP per capita (constant 2010 US$)
3.5% 16 (2004–2016) 13
Georgia At risk of conflict
Annualised change in GDP per capita (constant 2010 US$)
3.5% 18 (1995–1999), (2001–2008), (2010–2014)
8
Malaysia At risk of conflict
Annualised change in GDP per capita (constant 2010 US$)
3.5% 15 (1999–2000), (2003–2004), (1992–1997), (2006–2007)
6
Moldova At risk of conflict
Annualised change in GDP per
3.5% 12 (2013–2014), (2010–2011), (2001–2006)
6

ECONOMIC DEVELOPMENT IN FRAGILE CONTEXTS: LEARNING FROM SUCCESS AND FAILURE
56
Country Category Variable Threshold for success
Years above threshold
Growth periods
Longest period
capita (constant 2010 US$)
Mozambique At risk of conflict
Annualised change in GDP per capita (constant 2010 US$)
3.5% 18 (2001–2002), (1996–1999), (2010–2015), (2004–2008)
6
Mozambique At risk of conflict
Annualised change in FDI; net inflows (% of GDP)
21.5% 13 (2001–2002), (2006–2012), (1998–1999)
7
Mozambique At risk of conflict
Annualised change in FDI; net inflows (BoP; current US$)
31.2% 12 (2001–2002), (2006–2012), (1998–1999)
7
Peru At risk of conflict
Annualised change in GDP per capita (constant 2010 US$)
3.5% 13 (2010–2013), (1994–1995), (2004–2008)
5
Tajikistan At risk of conflict
Annualised change in GDP per capita (constant 2010 US$)
3.5% 17 (2010–2016), (2000–2008)
9
Turkey At risk of conflict
Annualised change in GDP per capita (constant 2010 US$)
3.5% 15 (2002–2007), (2010–2011), (1995–1997)
6
Uzbekistan At risk of conflict
Annualised change in GDP per capita (constant 2010 US$)
3.5% 13 (2004–2016) 13
Venezuela At risk of conflict
Annualised change in GDP per capita (constant 2010 US$)
3.5% 8 (2004–2008) 5

ECONOMIC DEVELOPMENT IN FRAGILE CONTEXTS: LEARNING FROM SUCCESS AND FAILURE
57
Country Category Variable Threshold for success
Years above threshold
Growth periods
Longest period
Philippines Subnational conflict
Annualised change in GDP per capita (constant 2010 US$)
3.5% 8 (2012–2016) 5
Sri Lanka Subnational conflict
Annualised change in GDP per capita (constant 2010 US$)
3.5% 19 (2003–2008), (1993–1995), (2014–2016), (2010–2012), (1997–2000)
6
Ukraine Subnational conflict
Annualised change in GDP per capita (constant 2010 US$)
3.5% 9 (2010–2011), (2006–2007), (2000–2004)
5
Chad Transition from conflict
Annualised change in GDP per capita (constant 2010 US$)
3.5% 9 (2001–2005) 5
Côte d'Ivoire Transition from conflict
Annualised Change in GDP per capita (constant 2010 US$)
3.5% 7 (1995–1996), (2012–2016)
5
Liberia Transition from conflict
Annualised change in GDP per capita (constant 2010 US$)
3.5% 10 (2006–2007), (1996–2000), (2011–2013)
5
Madagascar Transition from conflict
Annualised change in FDI; net inflows (BoP; current US$)
31.2% 11 (1999–2000), (2004–2008)
5
Timor-Leste Transition from conflict
Annualised change in GDP per capita (constant 2010 US$)
3.5% 7 (2000–2001), (2007–2011)
5
Note: *** Unlike other selection algorithms, the Income and Investment algorithm sets the threshold at the 65th percentile of the variable distribution.

ECONOMIC DEVELOPMENT IN FRAGILE CONTEXTS: LEARNING FROM SUCCESS AND FAILURE
58
Table A2.5: Identifying countries and periods of success – labour productivity
Country Category Variable Threshold for success
Years above threshold
Growth periods
Longest period
Afghanistan Active conflict
Between change in labour productivity (%): Manufacturing (ISIC D)
0.2% 11 (2007–2008), (1996–2001)
6
Syria Active conflict
Within change in labour productivity (%): Agriculture
0.8% 13 (2008–2009), (2001–2006)
6
Yemen Active conflict
Between change in labour productivity (%): Manufacturing (ISIC D)
0.2% 11 (1997–1998), (2006–2007), (2015–2016), (2000–2004)
5
Yemen Active conflict
Within change in labour productivity (%): Agriculture
0.8% 10 (2006–2007), (2000–2004)
5
Yemen Active conflict
Annualised change in labour productivity: Total (Non-Mining)
4.1% 10 (2000–2006), (1995–1996)
7
Algeria At risk of conflict
Between change in labour productivity (%): Manufacturing (ISIC D)
0.2% 7 (2004–2009) 6
Algeria At risk of conflict
Within change in labour productivity (%): Other
0.9% 10 (2004–2012) 9
Azerbaijan At risk of conflict
Annualised change in labour productivity: Total (Non-Mining)
4.1% 14 (2002–2004), (2010–2014), (1999–2000), (2006–2008)
5

ECONOMIC DEVELOPMENT IN FRAGILE CONTEXTS: LEARNING FROM SUCCESS AND FAILURE
59
Country Category Variable Threshold for success
Years above threshold
Growth periods
Longest period
Bangladesh At risk of conflict
Between Change in Labour Productivity (%): Other
0.6% 13 (2012–2013), (2001–2003), (2015–2016), (1992–1996)
5
Bangladesh At risk of conflict
Within change in labour productivity (%): Manufacturing
0.7% 10 (2006–2007), (2014–2016), (1992–1996)
5
Bangladesh At risk of conflict
Annualised change in labour productivity: Total (Non-Mining)
4.1% 10 (2011–2016), (2006–2009)
6
Bangladesh At risk of conflict
Between change in labour productivity (%): Manufacturing (ISIC D)
0.2% 13 (2001–2005), (2007–2013)
7
Eritrea At risk of conflict
Within change in labour productivity (%): Other
0.9% 12 (1999–2000), (2011–2012), (1992–1996)
5
Ethiopia At risk of conflict
Between change in labour productivity (%): Other
0.6% 15 (1999–2000), (2012–2015), (2006–2010), (1995–1996)
5
Ethiopia At risk of conflict
Between change in labour productivity (%): Manufacturing (ISIC D)
0.2% 11 (1999–2005), (1995–1997)
7
Ethiopia At risk of conflict
Within change in labour productivity (%): Agriculture
0.8% 16 (2004–2015) 12
Ethiopia At risk of conflict
Annualised change in labour productivity: Total (Non-Mining)
4.1% 15 (2004–2016) 13

ECONOMIC DEVELOPMENT IN FRAGILE CONTEXTS: LEARNING FROM SUCCESS AND FAILURE
60
Country Category Variable Threshold for success
Years above threshold
Growth periods
Longest period
Georgia At risk of conflict
Within change in labour productivity (%): Other
0.9% 14 (2002–2007), (1995–1996), (2010–2011), (1998–2000)
6
Georgia At risk of conflict
Annualised change in labour productivity: Total (Non-Mining)
4.1% 16 (2002–2008), (2010–2013), (1995–1998)
7
Guatemala At risk of conflict
Between change in labour productivity (%): Other
0.6% 8 (2013–2014), (2004–2008)
5
Guatemala At risk of conflict
Within change in labour productivity (%): Other
0.9% 8 (1992–1998) 7
Lesotho At risk of conflict
Between change in labour productivity (%): Manufacturing (ISIC D)
0.2% 11 (2000–2004) 5
Lesotho At risk of conflict
Between change in labour productivity (%): Other
0.6% 12 (2000–2005) 6
Malaysia At risk of conflict
Within change in labour productivity (%): Manufacturing
0.7% 14 (1993–1997), (2002–2005), (1999–2000)
5
Malaysia At risk of conflict
Annualised change in labour productivity: Total (Non-Mining)
4.1% 10 (1992–1997), (2006–2007)
6
Moldova At risk of conflict
Annualised change in labour productivity: Total (Non-Mining)
4.1% 11 (2013–2014), (2002–2006), (2010–2011)
5

ECONOMIC DEVELOPMENT IN FRAGILE CONTEXTS: LEARNING FROM SUCCESS AND FAILURE
61
Country Category Variable Threshold for success
Years above threshold
Growth periods
Longest period
Mozambique At risk of conflict
Within change in labour productivity (%): Manufacturing
0.7% 12 (1996–1997), (2000–2005)
6
Mozambique At risk of conflict
Within change in labour productivity (%): Agriculture
0.8% 17 (2001–2002), (1995–1999), (2004–2011)
8
Mozambique At risk of conflict
Annualised change in labour productivity: Total (Non-Mining)
4.1% 16 (2001–2002), (2004–2012), (1996–1998)
9
Nepal At risk of conflict
Within change in labour productivity (%): Manufacturing
0.7% 7 (2002–2008) 7
Nepal At risk of conflict
Within change in labour productivity (%): Other
0.9% 15 (2004–2010), (1992–1999)
8
Nepal At risk of conflict
Between change in labour productivity (%): Manufacturing (ISIC D)
0.2% 10 (1992–2001) 10
Tajikistan At risk of conflict
Within change in labour productivity (%): Agriculture
0.8% 14 (2000–2004), (2007–2009), (2012–2016)
5
Turkey At risk of conflict
Annualised change in labour productivity: Total (Non-Mining)
4.1% 11 (1992–1993), (2002–2006)
5
Turkey At risk of conflict
Between change in labour productivity (%): Other
0.6% 13 (2002–2007), (1992–1993), (2015–2016)
6

ECONOMIC DEVELOPMENT IN FRAGILE CONTEXTS: LEARNING FROM SUCCESS AND FAILURE
62
Country Category Variable Threshold for success
Years above threshold
Growth periods
Longest period
Uganda At risk of conflict
Within change in labour productivity (%): Manufacturing
0.7% 9 (2004–2005), (1993–1997)
5
Uzbekistan At risk of conflict
Annualised change in labour productivity: Total (Non-Mining)
4.1% 10 (2007–2016) 10
Uzbekistan At risk of conflict
Within change in labour productivity (%): Agriculture
0.8% 14 (2003–2016) 14
Zimbabwe At risk of conflict
Within change in labour productivity (%): Other
0.9% 11 (2009–2014), (2001–2004)
6
Mali Subnational conflict
Annualised change in labour productivity: Total (Non-Mining)
4.1% 12 (1994–1999), (2001–2003)
6
Mali Subnational conflict
Within change in labour productivity (%): Agriculture
0.8% 15 (2014–2016), (1993–1999)
7
Nigeria Subnational conflict
Annualised change in labour productivity: Total (Non-Mining)
4.1% 10 (2013–2014), (2004–2010)
7
Nigeria Subnational conflict
Within change in labour productivity (%): Agriculture
0.8% 11 (2002–2010) 9
Philippines Subnational conflict
Within change in labour productivity (%): Manufacturing
0.7% 11 (2012–2016) 5

ECONOMIC DEVELOPMENT IN FRAGILE CONTEXTS: LEARNING FROM SUCCESS AND FAILURE
63
Country Category Variable Threshold for success
Years above threshold
Growth periods
Longest period
Sri Lanka Subnational conflict
Annualised change in labour productivity: Total (Non-Mining)
4.1% 14 (2004–2005), (1992–1993), (2007–2012), (2014–2015)
6
Ukraine Subnational conflict
Within change in labour productivity (%): Manufacturing
0.7% 10 (1996–1997), (2000–2005)
6
Burkina Faso Transition from conflict
Within change in labour productivity (%): Agriculture
0.8% 14 (2010–2014), (1998–1999), (1995–1996)
5
Burkina Faso Transition from conflict
Between change in labour productivity (%): Other
0.6% 15 (2000–2001), (2003–2004), (2006–2013)
8
Burkina Faso Transition from conflict
Between change in labour productivity (%): Manufacturing (ISIC D)
0.2% 16 (2003–2004), (1994–1995), (2006–2014)
9
Côte d'Ivoire Transition from conflict
Annualised change in labour productivity: Total (Non-Mining)
4.1% 7 (2012–2016) 5
Côte d'Ivoire Transition from conflict
Within change in labour productivity (%): Other
0.9% 14 (1992–1993), (1998–2000), (2012–2016)
5
Guinea-Bissau Transition from conflict
Within change in labour productivity (%): Agriculture
0.8% 9 (1993–1997) 5
Liberia Transition from conflict
Annualised change in labour productivity: Total (Non-Mining)
4.1% 9 (1997–2001), (2006–2007)
5

ECONOMIC DEVELOPMENT IN FRAGILE CONTEXTS: LEARNING FROM SUCCESS AND FAILURE
64
Country Category Variable Threshold for success
Years above threshold
Growth periods
Longest period
Liberia Transition from conflict
Within change in labour productivity (%): Other
0.9% 8 (1997–2001) 5
Liberia Transition from conflict
Within change in labour productivity (%): Agriculture
0.8% 17 (2010–2015), (1995–2002), (2006–2008)
8
Madagascar Transition from conflict
Between change in labour productivity (%): Manufacturing (ISIC D)
0.2% 14 (2011–2015), (2006–2009), (1996–1998)
5
Papua New Guinea
Transition from conflict
Within change in labour productivity (%): Agriculture
0.8% 16 (1992–1993), (2003–2013)
11
Papua New Guinea
Transition from conflict
Between change in labour productivity (%): Other
0.6% 17 (1992–1993), (2001–2013)
13
Sierra Leone Transition from conflict
Within change in labour productivity (%): Agriculture
0.8% 13 (2001–2003), (2005–2013)
9
Timor-Leste Transition from conflict
Within change in labour productivity (%): Other
0.9% 13 (2002–2005), (1992–1996)
5
Timor-Leste Transition from conflict
Annualised change in labour productivity: Total (Non-Mining)
4.1% 18 (2000–2001), (1992–1998), (2007–2012)
7
Figure A2.1 examines how changes in employment share relate to relative productivity from 1992 to 2016. Ideally, employment moves from less to more productive sectors. If this occurs, the regression line will have a positive slope. The inverse is true when the slope is negative – suggesting employment has moved on average to less productive sectors. The size of the circles represents the proportion of employment within the sector during 2016. Figure A2.2 examines particular time periods to show that states with active conflict have recorded significant negative structural change.

ECONOMIC DEVELOPMENT IN FRAGILE CONTEXTS: LEARNING FROM SUCCESS AND FAILURE
65
Figure A2.1: Countries at risk of conflict record low levels of structural change from 1992 to 2016 compared to countries in transition
At risk of conflict (1992-2016)
Transition from conflict (1992-2016)
Source: UN Statistics Division.

ECONOMIC DEVELOPMENT IN FRAGILE CONTEXTS: LEARNING FROM SUCCESS AND FAILURE
66
Figure A2.2: Countries currently in conflict show negative structural change on average since 2008
Source: UN Statistics Division. We can also examine structural economic transformation by focusing primarily on within and between labour productivity. The following chart visualise changes in labour productivity from 1993 to 2016 for states with active conflict, in transition, and at risk of conflict. As apparent in the visual, states currently witnessing conflict have recorded a free-fall in labour productivity. Moreover, it appears that states in transition have benefited more from structural change while states at risk of conflict attain productivity enhances primarily from within-sector upgrading.
Figure A2.3: Within and between labour productivity growth

ECONOMIC DEVELOPMENT IN FRAGILE CONTEXTS: LEARNING FROM SUCCESS AND FAILURE
67
Figures A2.1 through A2.3 suggest that countries transitioning from conflict and those at risk of conflict may differ in their relationship to labour productivity. Countries in transition appear to succeed in economic transformation, but find difficulty upgrading within sectors. In contrast, countries at risk of conflict succeed at upgrading within sectors, but record much lower levels of structural change. This may be due to conflict and political economy differences between the states – on average. During conflict, rural populations tend to leave war-torn rural regions for the major urban centres. While the war harms within-firm productivity by ravishing infrastructure and shying away investment, the relocation of populations can offer opportunities to move away from subsistence agriculture towards high productivity activities. In contrast, states at risk of conflict may maintain enough stability to promote within-sector upgrading. However, if governments cannot solve key collective action problems or sustain credible commitments, large scale transformation may not occur.

ECONOMIC DEVELOPMENT IN FRAGILE CONTEXTS: LEARNING FROM SUCCESS AND FAILURE
68
APPENDIX B: CASE STUDIES OF SUCCESSFUL INVESTMENTS IN FRAGILE CONTEXTS B1: Mobile phones in Afghanistan 69 B2: Construction industry in Liberia – public–private partnerships that induce foreign investment 75 B3: Public accounting in Liberia -- inter-firm partnerships that promote a high quality local profession 80 B4: From hawala to mobile money – the evolution of the Somali money transfer infrastructure as it responds to domestic and foreign market incentives 82 B5: Sierra Leone cocoa farming 86 B6: Breweries in fragile contexts 88 B7: Sugar industry in Mozambique 92

ECONOMIC DEVELOPMENT IN FRAGILE CONTEXTS: LEARNING FROM SUCCESS AND FAILURE
69
B1: MOBILE PHONES IN AFGHANISTAN Alastair McKechnie
Introduction: the role of mobile phones in fragile contexts There is ample evidence that mobile phones and their associated information technologies have had a transformative impact at both the micro and the macro level in low-income countries, including in the most fragile and conflict-affected states. Mobile phones are an example of how technological innovation, private investment, ideally but not necessarily supported by public policies, and focused public investment can overcome some of the constraints to development in fragile contexts and spur other productivity gains and private investment. The World Bank’s World Development Report 2016 sets out a framework to explain the impact of information technologies in terms of inclusion of firms in national and global economies, improving efficiency through better use of resources, such as through better management of inventories and innovations such as mobile money and banking. Firms that utilise digital technologies have higher productivity than those that do not. However, there are risks that a divide in productivity between countries and firms that adopt these technologies may exacerbate inequalities. There is also a risk that poor policies will lead to digital services monopolies, ending in high prices that block the potential to increase productivity. A cross-sectional study of 69 mainly middle-income and industrialised countries has shown the significant impact of mobile phone access on gross domestic product (GDP)/capital and value-added in the agriculture, manufacturing and financial services sectors (Sethi and Tafti, 2013). A study of the economic impact of mobile phones in Bangladesh, where 90% of the population are mobile phone customers, showed that each additional 10% in mobile penetration led to a 0.6% increase in the GDP growth rate (Lane et al., 2006). Job creation as a result of the mobile phone industry can be significant. While mobile phone operators employ only a small number of people, most of whom are highly skilled, many more are employed in selling and maintaining phones, SIM cards and airtime. A World Bank report cites studies showing that the mobile phone industry has created 3.6 million jobs in India and 244,000 equivalent full-time jobs in Pakistan (Bhavnani et al., 2008). Micro-level studies validate these macro benefits. A study of mobile phone use by fishers in the Indian state of Kerala shows how this has improved the efficiency of the market by removing information asymmetries, enabling fishers to respond quickly to market demands and bring down fish wastage, reducing time spent by owners and agents waiting for boats, lowering market risks and improving safety at sea (Abraham, 2007). A survey of the mobile phone industry in Africa shows how the poor have adopted mobile phones and how innovative services such as mobile money – M-Pesa in Kenya – have enhanced phones’ value beyond the basic, but significant, benefits of improving the efficiency of markets. This has been through lowering search costs, improving inter-firm coordination, disseminating information on farmer decisions through social networks and enabling a better response to potential market shocks. However, the same paper is critical of the econometric issues that underlie many of the macro studies of the impact of mobile technology on economic growth and calls for more rigorous evaluation of these claims (Aker and Mbiti, 2010). Meanwhile, mobile phones can have substantial economic impacts even in very poor countries. A study in Niger showed the introduction of mobile phones was associated with a 20% reduction in grain price differences across markets, with a larger impact on markets that were far apart and those with poor-quality roads (Aker, 2008).

ECONOMIC DEVELOPMENT IN FRAGILE CONTEXTS: LEARNING FROM SUCCESS AND FAILURE
70
The private sector has been able to provide mobile phone services in conflict-affected countries. Claims have been made that improved information and communication technology (ICT) services following conflict have contributed to stabilisation, reconciliation and development (see Kelly and Souter, 2014), although it is difficult to see how ICT services contribute differently than other resumed economic activities, except through improved connectivity – which would also apply to other sectors such as roads. Somalia is an interesting example of how private investors have established a mobile phone sector despite low government capacity and without a well-developed legal and regulatory environment: 7 operators provide around 2 million mobile subscriptions for a population of about 10 million (ibid.). Not surprisingly, access is greater in Somaliland and Puntland, where conflict is less, and in urban areas. Somalia presents one of the most challenging environments for private investment in the world, yet mobile phone coverage is surprisingly high.
Mobile phones in Afghanistan10 When anti-Taliban Northern Alliance forces took Kabul in November 2001, Afghanistan had one of the lowest teledensities in the world, at around two telephones per 1,000 people (neighbouring Pakistan, e.g., had 24 and Tajikistan 35). The public-sector landline system had only around 27,000 active lines, about half the number before the US-led bombing campaign. An Afghan–US entrepreneur was awarded a monopoly agreement with the Taliban in 1999 to establish a mobile phone company, allegedly supported by the US government electronic intelligence-gathering agency, but this was not implemented, as a result of stronger sanctions being applied to Afghanistan (Rose, 2011). The Northern Alliance leadership recognised the company’s rights to provide mobile phone services during the interregnum before President Karzai was sworn in on 22 December 2001 at the conclusion of the Bonn Conference on Afghanistan. As the international community returned to Afghanistan in numbers in January 2002, the UN established its own mobile phone network using Swedish technology. Afghanistan received early assistance in the ICT sector from the Asian Development Bank, the International Telecommunication Union, Iran, the UN Development Programme, the US and the World Bank, with the last three cooperating on providing assistance in policy, legal and regulatory matters. In early 2002, a group of ministers took strategic decisions on the future direction of the ICT sector. These included decisions to give priority to establishing wireless telephony (mobile phones and also wireless local loop networks); encourage the private sector to provide services wherever this was possible; create a competitive market in wireless services; promote universal access to telecommunications services throughout the country; and provide the minimum policy, legal and regulatory environment to support this approach. The government entered into negotiations with the company with the legacy contract to provide mobile services, to void the monopoly provision. The government also asked the UN to close down its parallel mobile system, which serviced the UN itself, aid agencies and the government, since the private company was then establishing services. The private company thus enjoyed a period where it could charge high prices until competitors became established. A World Bank grant to the government filled gaps not addressed by the private sector, targeting in particular areas necessary to enable the establishment of a competitive private sector. These included strengthening the policy and regulatory capacity of government; radio frequency spectrum management (there was a proliferation of aid industry, diplomatic and foreign security communication systems, all threatening to interfere with each other); providing for the government’s own internal communications, especially with its provincial offices; and
10 This section draws on World Bank (2003, 2011 and 2013) and the author’s recollections of meetings with Afghan government ministers during the period 2002–2008.

ECONOMIC DEVELOPMENT IN FRAGILE CONTEXTS: LEARNING FROM SUCCESS AND FAILURE
71
restructuring the then-Ministry of Communications’ existing fixed line public system as a publicly owned corporation that could later be privatised (World Bank, 2003). The results of this have been substantial. By 2010, Afghanistan had five national and three regional mobile service licensees operating in a competitive market. In 2002, the price per minute was $1; by 2010, this had fallen to $0.22 per minute. Access to telephone services increased from less than 0.2% of the population in 2002 to 80% in 2010. The number of mobile phone subscribers in 2012 was about 18 million out of a total population of around 30 million. Private sector investment in the sector has amounted to about $1.6 billion, with 60,000 direct and indirect jobs created. The sector has contributed about $100 million annually to the government budget. To place this in context, revenues from the telecoms sector would cover a significant part of the cost of providing basic health services to the poor in Afghanistan.11 Government policies and the Afghanistan Telecommunications Regulatory Authority have ensured seamless interconnection between different service providers, allowed for new entrants, ensured access to international gateways and encouraged value-added services such as mobile money. Afghan Telecom, which owns and operates the landline system, a national fibre optic trunk network and connections to neighbouring countries, was divested from its parent ministry in 2005 and has become a profitable company. The government planned to privatise it in 2010 but this has not been achieved. Not much information is available on the social and economic impact of mobile phones in Afghanistan. According to a US Agency for International Development blog in 2013, one company is offering the Kenyan M-Pesa mobile wallet scheme, and merchants use this system to pay electricity bills (100,000 customers in Kabul) and to pay police in remote areas (electricity payments and police salaries are a frequent source of corruption in many countries). Mobile phone communications have been reasonably resilient to insurgency in Afghanistan. The Taliban at one time ordered operating companies to switch off communications at night because of the potential for the authorities to track their movements, but this was later rescinded. While mobile facilities have been attacked, the modular nature of the technology makes it possible to repair them or relocate them in more secure locations, and attacks on a phone system with such widespread use do not win hearts and minds.
What explains the success of mobile phones globally? There are several factors unique to the technology and business model of mobile phones that explain the success of this sector. Aker (2010) sets out seven reasons why the industry has been successful in developing countries:
1. The multiple uses and purposes of mobile phones (voice, SMS, internet) produce diverse economic and social benefits.
2. Benefits are tangible, immediate and quickly evident to potential consumers. 3. Mobile voice operations are easy to use and do not require literacy. 4. Multiple people can use one phone and share the cost. There are additional benefits
as information acquired by one person can be shared with others. 5. Adaptability to local contexts: mobile phone applications do not require individuals to
change their farming, business, social or cultural practices.
11 Newbrander et al. (2014) put the cost per capita of Afghanistan’s basic package of health services as around $4.60, which would amount to a total annual cost of $138 million.

ECONOMIC DEVELOPMENT IN FRAGILE CONTEXTS: LEARNING FROM SUCCESS AND FAILURE
72
6. Mobile-related services, such as sale of handsets, SIM cards and top-up cards and phone-charging, are available widely and extend through private channels into rural areas.
7. The pre-payment system allows credit-constrained consumers to buy phone credit in small amounts when they need and can afford it.
Kenney (2013) sets out reasons why mobile phone investment is less affected than other forms of investment by issues related to infrastructure and access to finance, political instability, corruption and high taxes in fragile contexts. He argues that the infrastructure for mobile telephony is self-contained – for example power requirements are small and can be self-generated. Requirements for institutional infrastructure are also small initially, as has been seen in Afghanistan and Somalia, although better regulatory arrangements allow the sector to fulfil its potential, as demonstrated in Afghanistan. Financial requirements are scalable compared with for other infrastructure, so self-financing is feasible. Kenney describes how the initial service rollout in a city may cost as little as $125 per subscriber and can allow for earnings before interest, taxes, depreciation and amortisation that are as high as 40% on monthly revenues of $8 per subscriber. Meanwhile, limited competition among operators has enabled falling prices while allowing prices to stay significantly above, perhaps at 2.6 to 7.9 times, marginal and average costs. This profitability allows for rent extraction by governments, formally through licence fees and informally through corruption, without destroying the profitability of the industry. In addition, both elites and the population more broadly have a substantial interest in the continuation of a service with high value to both the rich and the poor. The economics of the industry are complex and technically challenging to regulate, so governments tend to take a hands-off approach and rely on market competition to reduce rents to operators and make the service affordable. Governments have provided guidance and coordination to allow service coverage to penetrate rural areas with potentially low subscriber density. A base of urban subscribers allows companies to cross-subsidise rural services without much government intervention. Most mobile phone costs are fixed in the short term and marginal costs are close to zero until the network becomes congested and new capacity is needed, which leads to a spike in marginal costs, after which they again approach zero. In a rapidly growing mobile phone industry, marginal costs approach the costs of continually increasing capacity; in a slow growth sector, marginal costs tend towards low short-term marginal costs, which deter new entrants and enable incumbents to charge prices that recover their costs and collect rents. In addition, the industry has network externalities whereby the total value of new subscribers joining the network is the value they place on joining, plus the additional value to existing consumers from those joining (e.g. additional people they can call).12 Operators can also provide value-added services like messaging services, internet access and mobile money that increase the challenge of any cost-based regulation. Governments in fragile (and most other) countries have difficulty understanding the inner workings of the industry and prefer competition with regulation limited to making the market work – for example being able to make calls between competitor networks and perhaps keeping the market open to new entrants.
12 For a brief explanation of network economies and some of the regulatory issues in telecommunications, see Frontier Economics (2005).

ECONOMIC DEVELOPMENT IN FRAGILE CONTEXTS: LEARNING FROM SUCCESS AND FAILURE
73
Why were mobile phone telecommunications particularly successful in Afghanistan? The nature of mobile phone technology, the generic global business model and the technical difficulties of regulating what is essentially a multi-product industry explain part of the success in Afghanistan. However, the scale of the success also depends on local factors related to strategic decisions taken by the government. First, the new government played a critical role in taking fundamental decisions about the telecoms sector, covering private ownership, competition, interconnection among operators, light regulation, focusing public investment in areas where the private sector was not interested, for example repairs of international gateways, and not rehabilitating the public landline system. It accepted the non-transparent pre-existing mobile phone contract but renegotiated it without duress to allow new entrants and introduced transparent taxes to capture some of the rents in the sector. Forcing the UN to close its mobile system created a short-term advantage for the incumbent company before competitors arrived in Afghanistan. A policy and regulatory system that promoted competition led to substantial declines in the cost of telephone calls and encouraged companies to offer value-added services such as internet and mobile money. As in other countries, mobile phone communications would have been established in Afghanistan without such pro-growth, pro-consumer policies, but benefits would likely have been much fewer. Second, Afghanistan had strong initial demand for a basic mobile phone service, especially in cities, from government, the large foreign community and the population generally, in a country where internal transport and communications were very difficult and where most Afghans had connections to the diaspora, which provided transfers that supported their daily lives. Third, the landline system had collapsed almost entirely during decades of conflict, so there were no incumbent interests that needed to be placated. The government skilfully navigated potential obstacles posed by the non-transparent mobile phone contract with previous administrations and the UN's mobile phone system.
How transferable is the mobile phone model to other industries? Mobile ICT services are somewhat unique, owing to the modular nature of the technology, the high monetary value of the service, high subscriber willingness to pay, the ability to pre-pay for the service in small amounts that consumers can adjust if their incomes vary and high profitability based on large volumes of small transactions that allow companies and the state to extract rents. Alongside this, elites, the poor and challengers to authority all use such services, which insulates the sector from a fragile political economy. Transfers of elements of the mobile phone model have been attempted in other sectors. Electricity pre-payment meters have been used in African countries, most notably in South Africa, with some success in reducing corruption in the billing process and non-payment of electric utility bills. Decentralised solar electricity supply is growing in both low- and high-income countries and has the benefit of bypassing inefficient electricity utilities or avoiding the building of central distribution networks in fragile settings. Solar home systems can be marketed, sold or leased by the private sector. Their major constraint is that they do not produce power during the evening peak period when most electricity is demanded. This means there is a need either for a utility connection – for example hydro energy can be stored during the day and thermal power avoided when solar energy is available – or for batteries to store solar energy. Batteries

ECONOMIC DEVELOPMENT IN FRAGILE CONTEXTS: LEARNING FROM SUCCESS AND FAILURE
74
tend to raise costs and require maintenance, but local sharing of communal batteries and solar generation managed by private entrepreneurs is at least theoretically possible. Wireless local area networks (WLAN) can provide internet access as an alternative to mobile phone-based internet and this may be cheaper for larger users, for example businesses, especially in countries where wired or fibre optic connections to a network may be prohibitively expensive. The economics of WLAN are similar to those for mobile telephony, and this technology has been used in low-income countries such as Sri Lanka. There are also potential parallels with the mobile phone economic model in the transport sector, such as in highway tolls and urban transport. However, highways are even more capital-intensive than mobile phones, and the high initial sunk cost and low marginal cost afterwards can lead to pricing that recovers cost too quickly, deterring traffic, or to expropriation by the government. Building a highway may also involve complicated land and resettlement issues that are difficult to resolve without the involvement of a competent public administration. Meanwhile, urban transport is often run by small private bus and taxi companies, and there is potential for productivity increases by linking this with mobile phone technology similar to Uber. However, safety and environmental issues remain that require government regulatory capacity.
References Abraham, R. (2007) ‘Mobile phones and economic development: evidence from the fishing industry in India’ Journal of Information Technologies and International Development 4(1): 5–17. Aker, J. (2008) Does digital divide or provide? The impact of cell phones on grain markets in Niger. Working Paper 154. Washington, DC: Center for Global Development. Aker, J. (2010) ‘Why have mobile phones succeeded while other technologies have not?’ Center for Global Development blog, 3 November (www.cgdev.org/blog/why-have-mobile-phones-succeeded-where-other-technologies-have-not)
Aker, J. and Mbiti, I. (2010) ‘Mobile phones and economic development in Africa’ Journal of Economic Perspectives 24(3): 207–232. Frontier Economics (2005) ‘Network externalities in telecommunications: theory and applications’. Mimeo (https://www.itu.int/ITU-D/finance/work-cost-tariffs/events/tariff-seminars/south-africa-05/presentation-mark_william-en.pdf) Bhavnani, A., Chiu, R. W-W., Janakiram, S. and Silarszky, P. (2008) The role of mobile phones in sustainable rural poverty reduction. Washington, DC: World Bank. Kelly, T. and Souter, D. (2014) The role of information and communication technologies in postconflict reconstruction. Washington, DC: World Bank. Kenney, C. (2013) ‘Moving beyond mines and mobiles: how can IFC add value in fragile states?’ Policy Paper 030. Washington, DC: Center for Global Development. Lane, B., Sweet, S., Lewin, D. Sephton, J. and Petini, I. (2006) ‘The economic and social benefits of mobile services in Bangladesh’. Report by Ovum for GSM Association. Newbrander, W., Ickx, P., Feroz, F. and Stanekzai, H. (2014) ‘Afghanistan’s basic package of health services: its development and effects on rebuilding the health system’ Global Public Health 9 (Supl 1): S6–S28. Rose, D. (2011) ‘9/11: the tapping point’ Vanity Fair, 11 August.

ECONOMIC DEVELOPMENT IN FRAGILE CONTEXTS: LEARNING FROM SUCCESS AND FAILURE
75
Sethi, R. and Tafti, A. (2013) ‘The effect of mobile phone adoption on economic output’ Proceedings of the 19th Americas Conference on Information Systems, Chicago, Il, 15-17 August. US Agency for International Development (2013) ‘From the field in Afghanistan: Mobile phones changing lives’, blog, 20 August (https://blog.usaid.gov/2013/08/afghanistan-mobile-phones-changing-lives/) World Bank (2003) ‘Emergency communications development project. Technical Annex for a proposed credit to Afghanistan’. Report No. T7602. Kabul: World Bank. World Bank (2011) ‘ICT sector development project. Emergency project paper for a proposed grant to Afghanistan’. Report No. 59662-AF. Kabul: World Bank. World Bank (2013) ‘Afghanistan: country program evaluation 2001-11’. Washington, DC: World Bank, Independent Evaluation Group. World Bank (2016) Digital dividends: World Development Report 2016. Washington, DC: World Bank.
B2: CONSTRUCTION INDUSTRY IN LIBERIA – PUBLIC–PRIVATE PARTNERSHIPS THAT INDUCE FOREIGN INVESTMENT13 Alastair McKechnie
Introduction: the role of the construction industry in Liberia As in other countries in the same situation, in Liberia the construction industry was small, with little capacity to contribute to reconstruction and development, after two decades of conflict. In 2012, the Ministry of Public Works set up a database of construction firms, intended to pre-qualify firms for road construction or general building contracting. About 970 firms were in the database, but most were shell companies set up for contract farming and subcontracting and incapable of executing public works. The business environment was and remains a constraint to private investment in Liberia – in 2016, the country ranked 279 out of 289 on the Doing Business indicators (World Bank, 2016). In 2012, two Chinese-owned and two Lebanese firms were winning most of the mid-sized to large construction contracts. There was little interest from other international or regional firms because of the cost of moving equipment to Liberia and the small size of the contracts by international standards. Yet even these contracts were too large and complex for indigenous construction firms to bid for successfully. The underdevelopment of the local construction industry was related to the business environment, the operation of the bidding process and management capacity in construction firms, and included factors such as:
• Lack of equipment, particularly the absence of a leasing industry. It took as long as six months to bring equipment to Liberia, owing to port and shipping logistical constraints;
• Lack of finance from a financial sector that had major issues, including a large stock of non-performing loans. Credit was available at most for 36 months at high interest rates, and banks lent only to existing, preferred clients;
13 This case study is based on fieldwork in Liberia in November 2012.

ECONOMIC DEVELOPMENT IN FRAGILE CONTEXTS: LEARNING FROM SUCCESS AND FAILURE
76
• The low level of management and engineering capacity of local firms; • Contracts that were packaged too large for local contractors to execute and too small
to attract more competition from regional or international firms; • The short construction season, given heavy rainfall in most other months, which meant
a premium was commanded for efficient construction management; and • Weak sector associations for contractors, professional engineers and architects. While
these associations had linkages with the university, they did not have the same quality assurance, certification and lobbying capacity as the public accountancy profession (see Appendix B3).
Roads are critical for the development of internal markets and regional trade in any country. In a fragile setting, roads also provide some of the connectivity needed to restore human interaction, trust and a national identity. After the conflict ended in Liberia, there was a huge backlog in investment, and many road projects had very high economic rates of return. A study carried out of the roads sector in 2010 established that a five-year programme of 76 road projects would cost $100 million, with very high economic benefits: 13% of projects had economic rates of return in excess of 800% and two thirds above 100% (GTZ and GOPA, 2010). Despite these high returns, private investment in highways was not possible, not least because of the lack of a revenue stream and investor perceptions of high risks in the post-conflict country. Toll roads have been implemented successfully in higher-income fragile situations such as Pakistan. In Liberia, risks related to traffic volumes and diversion of traffic to other roads; limited ability to enforce revenue collection; difficulties attracting contractors; and construction completion risks and issues related to public acceptance ruled out toll roads as a near-term solution.
Foreign investment in the construction industry To tackle the twin problems of the need for improved highways and low construction industry capacity, the government decided to engage the foreign private sector in highway construction and maintenance through Output and Performance Based Road Contracts (OPRC). Under these arrangements, a contractor was awarded a 10-year contract to produce a detailed design and rehabilitate a highway and then maintain it for the duration of the contract, including major periodic maintenance towards the end of the contract – for example road resealing. The contractor was to be paid for the reconstruction work when construction targets were met, and the road remained the property of the government. During the maintenance period, the contractor was to be paid a fixed, periodic amount, provided road performance standards were met. Determining compliance with performance standards is assigned to an independent consultant engaged by the government, which certifies payments. This approach contrasts with conventional projects, whereby a contractor is engaged to build the road, with maintenance carried out either by a government department or by a contractor paid according to work done. The conventional approach requires a high level of government supervision, part of which in principle could be contracted to a consultant, but with a high risk of disputes over quantities and costs, and an attendant risk of corruption. Because of the long-term obligations under an OPRC, there is also less risk that funds will not be provided to maintain the road. While the contract has a fixed duration of 10 years, other countries using OPRC usually have them as the basis for most road maintenance and rebid them towards the end of their contract period. The original financing plan for the OPRC was included in a project with a $108.9 million grant from the World Bank-administered Liberia Reconstruction Trust Fund, a $67.7 million concessional load from the World Bank’s International Development Association window and $72.8 million in government counterpart funds. This plan included assistance to strengthen government planning and oversight of the roads sector and the consultant to oversee the

ECONOMIC DEVELOPMENT IN FRAGILE CONTEXTS: LEARNING FROM SUCCESS AND FAILURE
77
contractors’ performance obligations.14 The World Bank extended two additional credits to the project, for $50 million and $40 million, to scale up the project by including an additional road; to finance road safety improvements after the accident rate increased as a result of higher vehicle speeds; to address additional resettlement costs after encroachment on the road alignment; and to replace the government contribution after economic problems that were faced as a result of declining commodity prices and the Ebola pandemic. When Liberia put in place the first OPRC, two Chinese contractors were successful. Both contracts are now in the maintenance phase, despite problems arising from the Ebola pandemic (World Bank, 2017a). The 10-year duration of the OPRC meant the road rehabilitation had the unintended consequence of establishing Chinese-owned international construction companies in Liberia. During the construction phase, one company employed 900 Liberians and 54 Chinese, partly because the construction season is highly seasonal, with the wet season acting as a disincentive to importing foreign labour. This company trained Liberians to be equipment operators, while foreign staff were mainly in supervisory, engineering and specialist positions, such as fixed plant operation. Company managers were young and highly qualified, while construction supervisors were older, with more hands-on construction experience. On the construction site, mobile plant operators, surveyors and general workers were Liberian, with a much smaller number of Chinese nationals supervising or in field engineering positions. This company was training Liberians for office positions and had arranged for one promising Liberian engineer to obtain a scholarship for an engineering master’s programme in China. One motivation for training Liberian staff was language, as English-speaking Chinese supervisors had difficulties communicating in the workers’ dialect. These foreign construction companies employed Liberian firms as subcontractors to a limited extent, particularly in areas such as planning involuntary resettlement of project-affected people, land acquisition and small civil works. Such work exposed Liberian firms to international standards of quality set by the main contractor and the multilateral development banks (MDBs) financing the project.
Why was private participation in roads successful in Liberia? Proactive government leadership, supported by an MDB was critical in bringing private participation into the highways sector. The Sirleaf-Johnson government had a deep frustration with the lack of infrastructure in Liberia and the inadequate support it had received from its partners for such a priority sector. Consequently, it was prepared to consider innovative approaches that would result in high-quality infrastructure services despite its limited capacity to deliver then through traditional approaches. The government established a unit within the sector ministry to set priorities based on analysis and to manage the process for performance-based road contracts. This unit was intended to be the basis of a highways authority funded through road user charges that would be responsible for managing the sector. The World Bank, as knowledge partner and financier, was able to provide information on the OPRC model, its experience in other African countries and sufficient finance for the project. The OPRC’s build-turnover-operate model provided incentives for long-term engagement to the successful bidder, unlike in a conventional construction contract. The establishment of Chinese construction firms was partly a matter of luck for Liberia, as these firms had their own incentives to form Liberian companies and the OPRC contracts were sufficiently large and interesting to the companies to assign high-quality managers that increased the likelihood of success of performance-based contracting. It is unclear whether successful bidders from other countries would have engaged as deeply or managed the local context as well.
14 For more on the Liberia OPRC contracts, see World Bank (2010). On OPRC generally, see Gericke et al. (2014).

ECONOMIC DEVELOPMENT IN FRAGILE CONTEXTS: LEARNING FROM SUCCESS AND FAILURE
78
Lessons learned and their applicability Even though attracting private investment into the roads sector is extraordinarily difficult in a post-conflict environment in a low-income country with high investor perceptions of country risk, it is still possible, through performance-based contracting, to create a modern local construction industry and achieve private sector efficiencies. Performance-based contracting has a lower risk of corruption than the traditional approach of road construction and maintenance through ministries of public works.15 The construction contract is essentially turn-key, and the contractor has an incentive to build the road to specification, as s/he has responsibility for maintaining road quality during the maintenance period under the fixed-fee component of the contract.16 The economic benefits of well-maintained highways can be considerable, and there was a substantial decrease in journey times, as the increasing accident rate owing to higher speeds indicated. As well as connecting the northern and southern regions of Liberia, the highway had additional benefits from connecting a mineral-rich area of Guinea to Liberian ports. The performance-based maintenance contract also increased the confidence of investors and authorities in Guinea that the road link would continue to provide a high-quality service. A 10-year contract also provides an incentive for the contractors to establish subsidiaries as Liberian companies and to invest in local staff, who tend to be cheaper than expatriates. Such a localised company can present itself as Liberian and an employer of Liberians and this helps manage the risk of creeping expropriation. The long-term presence of the World Bank also mitigates risks to the contractor, who knows funding is in place for the duration of the contract and that the Bank can use its influence if there is political interference. This contrasts with bilateral funding, which is shorter in term and fickler, and may have less leverage to prevent rent-seeking and political interference. The long-term presence of the contractor adds to the overall contracting capacity in the country. If it is difficult to bring construction equipment into the country, it is presumably difficult to take it out. Once the construction phase is completed, the contractor thus has an incentive to seek other work in Liberia or neighbouring countries, especially given the presence of a high-quality road to a developing mining region in Guinea. Since it has equipment in place, it can mobilise faster and bid at lower prices than companies not resident in the country. Meanwhile, as the company is already localised and has invested in Liberian staff, it is essentially a foreign-owned Liberian company. Because the construction season is short in Liberia, foreign companies have an incentive to subcontract to other, smaller, local construction firms. These firms will be under pressure to complete their contracts during the season and to maintain acceptable quality. Although the evidence is not yet available, there would seem to be significant potential for productivity-enhancing partnerships between foreign and locally owned construction firms. The OPRC model for performance-based road construction and maintenance has been well proven, including in low-income African countries. It is essentially a form of public–private partnership where foreign assistance plays a key role in ensuring a transparent process for awarding contracts and providing assurance to companies that finance is in place for at least the construction phase. OPRC contracts have not been proposed as a modality for bringing private investment in construction into low-income, fragile environments, but this is essentially
15 For more discussion on performance-based contracting and corruption, see Kenny (2017). 16 Investigations by the World Bank’s anti-corruption department have shown several instances of contractors skimping on materials, e.g. related to asphalt concrete thickness, to maintain profits while paying bribes. There is also scope for fraud and corruption in traditional maintenance contracts, which require government agency approval of many small decisions involving quantities and qualities of materials that are typically made at low levels in the agency, for example by a regional engineer.

ECONOMIC DEVELOPMENT IN FRAGILE CONTEXTS: LEARNING FROM SUCCESS AND FAILURE
79
what happened in Liberia. Performance-based contracting can allow foreign construction companies to establish a long-term presence in a country that gives them an initial first mover competitive advantage. If well managed, construction costs can fall later as more companies see the opportunities and become established. However, such a strategy requires that new entrants are not discouraged and that the country gets a share of the value-added beyond lower construction costs, such as through corporate, trade and personal taxes and business partnerships between foreign and local companies (e.g. through subcontracting or the supply of materials such as cement). One way to improve competition in the sector would be to improve port logistics, which act as a barrier to non-incumbent foreign construction firms as well as to trade generally, and to reduce the value of highway connections to neighbouring countries. Financial sustainability is another issue in maintenance contracting. While the initial contract is secure for 10 years, the sustainability of OPRC roads requires that maintenance be financed after the end of the contract. Technical assistance supported by Liberia’s international partners is examining these issues, possibly working towards a quasi-independent highways agency and financing at least maintenance through user charges such as a fuel surcharge. However, these are political as well as technical issues. There will be resistance to user charges unless a compact can be made with road users, such as by giving them a voice in the highways authority. Other firms may seek to manipulate the contracting process in order to extract and share rents, and it may be politically difficult to maintain user charges at a level sufficient for adequate maintenance.17 Performance-based contracting through a build-turnover-operate model has been proven to work in fragile settings in Africa, and the concept could be extended beyond roads to facilitate private sector engagement in other infrastructure. Road economics are dominated by very high investment costs in inherently immovable capital, with a stream of significant but low maintenance costs of almost indefinite duration – roads may be reconstructed, widened or straightened, or have extra lanes added, but essentially last forever, as Roman road-building has demonstrated. Other infrastructure, such as water supply, sanitation, ports, airports and public buildings, has similar cost profiles and similar or lesser difficulties in mobilising user charges. The principles of OPRC road contracting could be applied to these sectors with a view to creating greater private sector participation and affordable, high-quality services.
References Gericke, B., Henning, T. and Greenwood, I. (2014) ‘Review of performance based contracting in the road sector – phase 1’. Transport Paper TP-42A. Washington, DC: World Bank. GTZ and GOPA (2010) ‘Preliminary draft of the Transport Master Plan of Liberia’, November. Kenny, C. (2017) ‘Results not receipts: counting the right things in aid and corruption’. Washington, DC: Center for Global Development. World Bank (2010) ‘Republic of Liberia. Road Asset Management Project’. Project Appraisal Document Report 58304. Washington, DC: World Bank. World Bank (2016) Doing Business indicators 2016. Washington, DC: World Bank. World Bank (2017a) ‘Republic of Liberia. Second additional financing for the Road Asset Management Project’. Project Paper. Report AD2279. Washington, DC: World Bank. World Bank (2017b) ‘Liberian Road Asset Management Project’. Implementation Status & Results Report P125574 Seq. No. 12. Washington, DC: World Bank.
17 Maintaining the level of road user charges has been an issue in the US, where the federal gasoline surcharge of $0.184/gallon ($0.049/litre) has barely changed since 1990. The previous increase from $0.09 to $0.141/gallon has been credited widely as being a factor in the election defeat of President George H.W. Bush in 1992.

ECONOMIC DEVELOPMENT IN FRAGILE CONTEXTS: LEARNING FROM SUCCESS AND FAILURE
80
B3: PUBLIC ACCOUNTING IN LIBERIA – INTER-FIRM PARTNERSHIPS THAT PROMOTE A HIGH QUALITY LOCAL PROFESSION Alastair McKechnie
Introduction: the role of the accounting profession in fragile contexts Governments need to raise revenues from shares of gross domestic product (GDP) that may be less than 10% towards a tax to GDP ratio of 15% to 20%. Business owners need reliable information on the financial condition of the business when business activity expands beyond family and kinship groups and as management becomes more professional and separate from ownership. Financial sector deepening also requires good information on which lenders can assess risk. Accurate financial information and accounting standards and practice that support financial integrity are a key element of the transformation of the modern fragile state to prosperous resilience, similar to the economic transformation in Europe and north-east Asia. It is difficult to control corruption without good financial information, controls and audits and an accountancy profession with the expertise and professional integrity to do this.
Development of the modern public accountancy profession in Liberia Development of the public accounting profession in Liberia was catalysed by foreign aid donors that required audits for the projects they financed. The local accountancy profession found it could not compete with international firms capable of ensuring high standards of professionalism and integrity, even though these firms carried out audits using staff from their affiliates in neighbouring countries. The Liberian accountancy association argued that using international firms to undertake audits for more than 50 years had achieved little in terms of building local capacity. Foreign auditors, usually from regional countries, made short visits to review the accounts before returning to their home country and sending the audit report. Liberian audit firms recognised they needed to meet international audit standards so they could compete with international accounting firms. To do this, they established a complex system to assure quality and to ensure local accountants were accredited with the regional and global organisations that set international accounting standards. This was done by the profession itself with very limited foreign aid,18 through lobbying government and partnerships with the local university, international and regional accountancy associations and, to a limited extent, global accountancy firms. There is a strong Liberian professional association of chartered accountants with dedicated headquarters and staff that regulates the profession. By law, public accountants need to be licensed by the association through an exam-based accreditation system implemented through the West African association of charted accountants. Regional accounting standards are linked in turn to an international network of accountancy bodies, such as the International Federation of Accountants (IFAC).19 To meet these international standards, the Liberian association has forged linkages with local universities to ensure graduates are sufficiently prepared for accreditation. The association 18 The World Bank approved a grant of $463,000 from its Institutional Development Fund to the Liberian Institute of Certified Public Accountants in 2010. 19 IFAC provides information on the Liberian Institute of Certified Public Accountants on its website, https://www.ifac.org/about-ifac/membership/country/liberia, including on the adoption of international accounting standards in Liberia.

ECONOMIC DEVELOPMENT IN FRAGILE CONTEXTS: LEARNING FROM SUCCESS AND FAILURE
81
has developed its own training facility and materials to prepare accountancy graduates for regional accreditation. All the Liberian accounting firms invest in staff development and training. Liberian accountancy firms have productive linkages with international accounting firms that provide specialist advice, protection against Liberian firms being pressured to compromise audit standards for political reasons and surge capacity. While international accountancy firms are essentially a loose federation of sovereign local firms, international firms do bear some reputational risk for the quality and behaviour of their affiliates, which provides additional quality assurance and protection for local firms carrying out politically contentious audits, such as state-owned enterprises.
Why did accounting firms in Liberia succeed in transforming their profession? The Liberian accountancy profession demonstrates how incentives from foreign competition and foreign aid can initiate innovation and development of private sector professional capacity, even if the private firms are not the direct recipients of this aid. It also shows the value of professional associations in establishing and enforcing professional standards and representing the profession in its relations with government, universities and donors. The Liberian experience demonstrates the value of private–private partnerships in supporting capacity development and professional standards and integrity. Accreditation by professional institutions as a requirement to practise a profession increases the value of individual learning, and acts as an incentive to develop skills and firm capacity. Partnerships with the regional and international professional associations and international accounting firms strengthened the voice of the local profession and provided some protection against political interference in the independence of audits. Competition among local firms and with regional firms provides an incentive to managers of professional services firms to maintain quality standards and to invest in training their staff.
Applicability to other professions This approach is capable of being extended to other professions, such as engineering and medicine, where accreditation standards may be less rigorously enforced in fragile contexts, and management and financial services, as well as to technicians such as electricians, information technology professionals, machinists and aircraft mechanics. There is also the possibility of extending the approach to the public sector, such as teaching and public administration. However, without certification that is at least overseen by an independent body free from political interference, most likely located outside the country, the approach is unlikely to work. In addition, certification through accreditation needs to provide public value like safety, integrity of accounts, etc., which is difficult for non-experts to ascertain, to avoid it becoming an artificial barrier to new entrants to a trade or business.
References Alexander, J.R. (2002) History of accounting. Association of Chartered Accountants in the United States. Ambashe, M. and Alrawi, H. (2013) ‘The development of accounting through history’ International Journal of Advances in Management and Economics 2(2): 95–100. Hicks, J. (1969) A theory of economic history. Oxford: Clarendon. Tilly, C. (1992) Coercion, capital and European states AD 990-1992. Oxford: Blackwell.

ECONOMIC DEVELOPMENT IN FRAGILE CONTEXTS: LEARNING FROM SUCCESS AND FAILURE
82
B4: FROM HAWALA TO MOBILE MONEY – THE EVOLUTION OF THE SOMALI MONEY TRANSFER INFRASTRUCTURE AS IT RESPONDS TO DOMESTIC AND FOREIGN MARKET INCENTIVES Nisar Majid
Introduction The Somali money transfer infrastructure has adapted and evolved over the past 20–30 years in almost complete absence of a state or any regulatory authority, and in the face of both domestic and international threats and restrictions. In this period, transferring money has changed from money transfer operators (MTOs, or hawala) carrying large amounts of cash around by vehicle and the use of high frequency radio and fixed telephone lines, to an increasingly cashless economy, whereby the use of mobile phones and mobile money has expanded dramatically. In the absence of a formal banking sector and in a highly volatile context, Somalia’s remittance and trading sectors have driven this evolution. The development of this sector illustrates how economic incentives have been used to tackle political fragmentation and conflict. International humanitarian and development agencies have utilised the services of the telecommunications and money transfer sectors to increase the efficiency of their own work. The development of this infrastructure and technology has clearly had many positive benefits in terms of efficiencies, but has also taken place as inequality has deepened and humanitarian disasters have continued across the Somali regions.
Political and economic background Following the civil war and the collapse of the state in the early 1990s, Somalia can be understood in relation to three broad and distinct regions, portraying the different governance systems that have since evolved: Somaliland, Puntland and South-Central Somali. 20 Somaliland is a self-declared independent republic with an internationally contested legal status. It functions as a multi-party, clan-based democracy with regular, internationally observed elections. Somaliland has been largely stable and peaceful for about the past 20 years, and has some, but very limited, state taxation and service delivery. Puntland is a self-declared ‘autonomous region’, within the Somali Federal State. It has some representative institutions but limited processes of democratisation. While more stable than South-Central Somalia, it has nevertheless been relatively volatile in political and security terms since its formation in the late 1990s, and certainly much less stable than Somaliland. It has very limited state taxation and service delivery. South-Central Somalia has remained highly volatile in political and security terms since the early 1990s, with a large variety of localised and larger-scale authorities and governance processes, which have varied over time and space and have involved a range of actors, from local warlords and clan elders to Islamic courts and the Islamic militant group, Al Shabaab.
20 There are significant further local variations in authority and governance processes as well as an evolving process of federalisation, but these three units remain broadly valid.

ECONOMIC DEVELOPMENT IN FRAGILE CONTEXTS: LEARNING FROM SUCCESS AND FAILURE
83
Since 2007, regional and international forces have been present in the country and large-scale fighting has continued between government and foreign forces and Al Shabaab. The Somali private sector has evolved and developed in this environment, and in relation to wider processes of globalisation in which it is embedded.21 The two main drivers for this development have been the country’s trading economy and its remittance-sending diaspora population. Somalia is a significant trading hub, with four major seaports (and porous borders with its major neighbours, Ethiopia and Kenya) that link the country with its immediate neighbours as well as other markets in East and Central Africa. Somali traders have long had strong links to the Middle East, given its geographic proximity and religious and cultural links. Dubai’s recent development as a trading hub has benefited Somali traders, as has Nairobi (Eastleigh) and Djibouti. Somali traders have continued to forge new links to Asia (China, Hong Kong and India) in recent years (see Carrier, 2017). Imports of foodstuffs, household commodities, clothes, construction materials and fuel, as well as ‘illegal’ commodities such as arms and drugs/narcotics, pass into and through Somalia. Somalia’s most important export is livestock, which also functions through trade networks that link the Somali hinterland with the seaports and export markets in the Middle East and Kenya (e.g. Little, 2003). Somalia has been described as an ‘entrepot’ economy, supplying tax-free goods to neighbouring countries and regions (UNDP, 2001). The Somali population living abroad (the Somali diaspora) is particularly large in relation to the domestic population, with an estimated one in six of the overall population living outside the country, equivalent to over a million people. The country has an estimated gross domestic product (GDP) of $6 billion and an income per capita of $435. This is the fifth lowest in the world. Imports account for more than two thirds of GDP, with the majority paid for by remittance transfers from the Somali diaspora. Remittances are estimated at over $1.3 billion. Approximately 40% of the population receive remittances at some point in the year. In comparison, development aid was estimated at $642 million and humanitarian assistance at $253 million in 2015 (ibid.). These two factors – trade and remittances – have driven the growth of telecommunications and money transfer infrastructure, as both business actors and separated families require efficient means of communication as well as the means to move money.
Telecommunications and money transfer Prior to the collapse of the state, Somalia had a large migrant population in the Middle East. It also had significant differences between official and unofficial exchange rates. These factors led to the development of an informal system of money transfer, known as the franco valuta system. This operated through migrants giving some of their income to traders, who were often from the same clan, and who in turn used these funds to buy and export goods to Somalia, then paying migrants’ families from the proceeds of their sales. Following the collapse of the state and the civil war of the early 1990s, a new system developed, known as xawilaad in Somali (hawala in Arabic), meaning ‘transfer of debt’. This is an ancient system, still operational in the Middle East and Asia, in which a customer provides money to an agent who then makes contact with a second agent, in the destination location, instructing a recipient to be paid. The incurred debt or value, rather than actual money, is transferred. The debt is settled later, through one of several means, including reverse transfers or the consolidation of debts among a group of agents.
21 See UNDP (2001) for an insightful explanation of political and economic processes of globalisation and localisation, which remain relevant today.

ECONOMIC DEVELOPMENT IN FRAGILE CONTEXTS: LEARNING FROM SUCCESS AND FAILURE
84
Over the 1990s, individual hawala operators were incorporated into franchises comprising networks of agents. Many of these were run by large international livestock or commodity traders. The same debt-based settlement system was used, but through a central clearing house, usually based in Dubai. This sector benefited from the development of new technologies of communication, from radios to fax, to mobile and satellite phones, to email and, more recently, to mobile network coverage, in order to connect sender and receiver and allowing agents at either end to verify identities and send and receive money. Somali remittance companies and telecommunications businesses have evolved alongside each other as both benefit from the other. This system is described in more detail in the following section and through a focus on two of the largest companies in Somalia, Dahabshil and Hormud.
Dahabshil and the hawala/MTO phenomenon There are many international MTOs sending money back to Somalia. The sector both is competitive at the margins but also has one dominant player, Dahabshil. While all MTOs transfer money internationally and domestically, the domestic market is being taken over by mobile money transfers, while the international market is still dominated by MTOs such as Dahabshil. Dahabshil is considered one of the most successful companies in Africa (Manson, 2011) and is relatively unusual in the Somali context, in that it is owned by a sole proprietor, who was an import-export trader and who entered the money transfer business in 1988. This followed the mass displacement of Somaliland’s population to Ethiopia as a result of the government crackdown. Its website currently claims it has over 24,000 outlets around the country and over 2,000 permanent employees worldwide. Dahabshil has diversified into other areas of the economy, including into banking, and is currently aiming to launch a 4G telephone network in Somalia. It is in partnership with Safaricom of Kenya22 in order to develop a mobile money facility and challenge Hormud’s dominance of this sector (see below) (Iazzolino, 2016). As well as being a highly profitable MTO, Dahabshil has a charitable foundation and claims to invest 5% of its profits in social projects such as schools, hospitals, agriculture and sanitation. It is also an important actor in its own right in times of crisis, where it mobilises its own resources to fund activities such as water-trucking and food assistance (Maxwell and Majid, 2016). In addition to enabling and profiting from the transfer of remittances from the large Somali diaspora, Dahabshil has been an important partner and service provider for humanitarian and development actors over the past 20 years. Somalia has also been an important example of development of cash transfers in humanitarian action, where organisations such as Dahabshil (as well as other MTOs) have been important partners. Dahabshil is also used for transferring funds for operational purposes, by international agencies, and has been involved in other initiatives such as, through the UN Development Programme, organising the regular payment of civil servants.
Reasons for the success of Dahabshil MTOs such as Dahabshil have a reputation among Somalis and international clients for being reliable, trustworthy and efficient. The critical business model of the MTOs, especially in terms of their adaptation to the often volatile local context, is their franchise system and, in particular, 22 Safaricom, a Kenyan company, developed the M-Pesa mobile money transfer system, the first such system in the world.

ECONOMIC DEVELOPMENT IN FRAGILE CONTEXTS: LEARNING FROM SUCCESS AND FAILURE
85
their successful management of risk – financial, security and reputational – primarily achieved through appropriate staff recruitment. Local senior staff are typically respected local figures, trusted, disciplined and hardworking. They are often known to be religiously observant and, for example, will not chew qat.23 Clan identity and support must be appropriate to the local area, as this provides an important guarantee of security, for example when the transportation of large amounts of money is required.
Hormud and the rise of mobile money transfers While Dahabshil represents the growth of the hawala or MTOs, which continue to dominate international flows of money, the domestic movement of money has increasingly turned to mobile money systems, with Hormud the dominant actor. One of the ongoing threats to Somali MTOs is that of counter-terrorism legislation. In 2002, the US government banned the largest MTO at the time, Al Barakat, following the attacks of 11 September 2001.24 This closure and the loss of funds at the time benefited Dahabshil, which became the dominant actor. However, the closure of Al Barakat led to the creation of three new sister companies, Telesom (in Somaliland), Golis (in Puntland) and Hormud (in South-Central Somalia). This group then focused on developing the telecommunications infrastructure and systems across the country. Telesom was the first organisation to create a mobile money platform, known as Zaad, which was launched in 2009. Hormud soon followed, in 2011, with its platform, EVCplus.25 As of 2015, Telesom accounted for 85% of mobile connections across Somaliland, of which 40% reportedly included active Zaad users (Iazzolino, 2016). When launched, Zaad developed a successful outreach strategy to attract business and personal customers and developed due diligence and anti-money laundering processes. The impact of this platform has been such that it is viewed as an example of best practice in financial exclusion and of the transformative potential of mobile money (ibid.).
Reasons for the success of Hormud The success of the mobile money system has been enabled by the collaborative approach of the Hormud-Telesom-Golis amalgamated company, which offers an integrated means of transferring money throughout the Somali regions. One of the most important strategies in the group’s success has been to offer shares in the different areas and regions that it works in, providing a means of building a sense of local ownership, and therefore security. According to a recent survey, 90% of Somalis over the age of 16 now own a mobile phone, and approximately a third of phones are smart phones, with approximately three quarters of mobile phone owners using mobile money (Altai Consulting and World Bank, 2017). Increasingly, humanitarian cash transfer programmes are utilising this new technology where previously they were using the MTOs to provide cash in physical form. The World Bank is advising government institutions on setting up an appropriate regulatory framework and enabling environment for mobile money.
Why was the development of the money transfer system in Somalia successful? Unlike in the other case studies, the transformation of the financial transfers system in Somalia took place without guidance or policy direction from the government. This demonstrates that 23 Qat is a local, plant-based stimulant. 24 No evidence was provided and no legal processes were undertaken to prove any associations with proscribed groups. 25 Hormud owns 49% of the shares of Telesom (Iazzolino, 2016).

ECONOMIC DEVELOPMENT IN FRAGILE CONTEXTS: LEARNING FROM SUCCESS AND FAILURE
86
at least some positive economic activities are possible in the absence of state institutional capacity. In some respects, the lack of state capacity may be an advantage – state institutions that were a little stronger could have created obstacles and interfered in the development of the sector. The development and evolution of the wider telecommunications sector, which created opportunities for money transfer systems, was critical to the growth of this part of the financial sector. Entrepreneurial Somali businesspeople responded to the needs of the economy, the needs of a dispersed population and local security dynamics, as well as to the opportunities and developments of new technologies as they arose. Strong market demand for international transfers of remittances and foreign aid and the difficulty of monetary transactions in an insecure environment stimulated the development of leading money transfer and mobile money companies. Crucially, these companies fitted well into the local context as they were able to establish a reputation among the local population and international customers through establishing social connections among clans, by demonstrating high moral standards and through their sensitivity to international concerns about money laundering and financing of terrorism. Their reputations and sensitivity to clan identity, along with high standards of service, enabled them to manage the risks of operating in a very fragile environment. However, these two super-companies of Somalia also exhibit duopolistic characteristics and are politically active and influential, lobbying for their own interests. This could lead to challenges as it becomes necessary to broaden and deepen the financial sector in Somalia.
References Altai Consulting and World Bank (2017) ‘Mobile money in Somalia’. Presentation of Results of the Household Survey for Somali Public–Private Dialogue. ICT Working Group Meeting, Nairobi. Carrier, N. (2017) Little Mogadishu: Eastleigh, Nairobi’s global Somali hub. London: Hurst. Iazzolino, G. (2016) ‘Following mobile money in Somaliland’. Research Paper 4. Eldoret: Rift Valley Institute. Little, P. (2003) Somalia: economy without state. Bloomington, IN: Indiana University Press. Manson, K. (2011) ‘Money man serves the Somali diaspora’ Financial Times, 24 May. Maxwell, D. and Majid, N. (2016) Famine in Somalia: competing imperatives, collective failures. Oxford: Oxford University Press. UNDP (2001) Making new technologies work for human development: Human Development Report 2001. New York: UNDP.
B5: SIERRA LEONE COCOA FARMING Judith Tyson
Introduction Following the end of a prolonged civil war in Sierra Leone that ended in 2003, economic activity restarted and there was reasonable economic growth, which peaked at 20.7% per annum in 2013. However, the Ebola crisis of 2014 and 2015 caused a sharp contraction in the economy from which the country is only just beginning to recover.

ECONOMIC DEVELOPMENT IN FRAGILE CONTEXTS: LEARNING FROM SUCCESS AND FAILURE
87
Sierra Leone’s agriculture sector is typical of low-income post-conflict countries. The economy is dominated by agriculture – 80% of the population are employed in agriculture and it represents 50% of gross domestic product and 22% of exports – but it has low levels of productivity and is concentrated in subsistence farming of staples such as rice and maize. Because of this, improving productivity is also key to poverty reduction and employment creation. Despite these features, 16% of agricultural production comprises cash crops, and one of the most important of these is cocoa, which has the potential to be developed into a significant element of the private sector economy. This is because Sierra Leone has an ideal climate and agricultural environment for cocoa production. In addition, cocoa prices on the global market have increased recently because of production problems in the dominant producers in Ghana and Côte d’Ivoire, making it potentially a commercially attractive sector for private investors.
Investing in cocoa in Sierra Leone Approximately 15 private investors were active in the sector in 2013, particularly in high-value organic and fair-trade products. Following the end of the Ebola crisis, there is appetite for further commercial development (World Bank, 2016). However, the sector suffers from a number of significant problems that deter private investment: poor value chain integration, limited market access, financial constraints and numerous institutional and capacity problems, including in farming know-how, research and infrastructure (Alliance for Food Sovereignty in Africa, 2015; Knowledge4food, 2016; World Bank, 2016). There have been a number of approaches to overcoming these issues. Private investors have developed the types of investment models seen in more advanced markets. For example, this has included acquiring plantations, investing in site-specific facilities and infrastructure and engaging in international trade. In order to overcome specific barriers, firms have adopted an integrated and holistic business model to investment broadly beyond cocoa farming. They have invested in diverse hard infrastructure, including the construction of communal warehouse, storage and processing facilities, and built infrastructure that would normally be provided by the public sector, such as power, access roads and port facilities. Firms have also invested in soft infrastructure and human capital in a broader way than would be expected in a more advanced market. This has included setting up and helping organise and manage farmer cooperatives, including providing them with training, finance and agronomist advice, and offering detailed trade support to government bodies. This model of business is, however, cost-intensive and time-consuming. Investors have struggled to be profitable in the Sierra Leone market. In addition, the disruption in production caused by the Ebola crisis was a significant disincentive to private investment, as it both represented disruption in business and also highlighted the types of risks of operating in a fragile setting with limited government capacity to respond to such shocks. Many firms repatriated foreign staff, curtailed operations and scaled back or stopped expansion plans (World Bank, 2016; Financial Times, 2017). This led to private investors withdrawing from Sierra Leone in 2016 and 2017. For example, Agriterra, a London-listed agricultural processor with businesses across Africa in a number of sectors, divested its Sierra Leone cocoa businesses in 2017 (Financial Times, 2017).

ECONOMIC DEVELOPMENT IN FRAGILE CONTEXTS: LEARNING FROM SUCCESS AND FAILURE
88
The Sierra Leone government’s economic plan has focused on commercialisation of smallholder farming, including seeking to establish farm cooperatives, but these have been underperforming (World Bank, 2016). The World Bank has a large ($40 million) programme to support private sector expansion in the cocoa sector that started in 2016, but the effectiveness of a project of this size and complexity remains to be established. World Bank support includes providing credit to smallholders, organising cooperatives for farmers and acting as a go-between for small farmers and large-scale private investors. It has also included specialist financing, such as matched financing for private sector investments, microfinance for farmers and financing of infrastructure specifically for the sector, such as roads, storage and information technology (ibid.).
Lessons and conclusions Agricultural processing has the potential to create employment and enable improvements in livelihoods, but this requires close partnership between governments, donor institutions and private sector investors in order to induce both the investment and the intensive business models that are needed to be commercially successful in fragile and conflict-affected states. Cocoa production in Sierra Leone has several lessons for scaling up agribusiness in fragile settings:
1. Government clarity as to its plan for commercialising smallholder farming to increase cocoa production helped with its coordination role in bringing together investors, farmers and international public finance and ensuring potential barriers to scaled-up production were overcome.
2. Market incentives – high cocoa prices and production problems in major producing countries – stimulated private investor interest and created the potential profits that could finance complementary investments outside the traditional areas of cocoa production.
3. There is a need for partnerships between government and business and international partners in high-risk, fragile settings to overcome business and operational risks.
4. Some risks, such as the outbreak of Ebola, are beyond the capability of government, partners and business to prevent, but nevertheless happen, and flexibility, patience and use of partnership relations are required to manage them. One positive approach has been the collaboration between CDC and Standard Chartered providing access to trade finance in times of shock.
References Alliance for Food Sovereignty in Africa (2015) ‘Organic cocoa in Sierra Leone’. (http://www.afsafrica.org) Financial Times (2017) ‘Disposal of Sierra Leone cocoa assets’. (https://markets.ft.com/data/announce/full?dockey=1323-13247357-6TGO1R4MVB6AR9QHICD31LLOPS&mhq5j=e2) Knowledge4food (2016) ‘Opportunities for the Sierra Leone cocoa sector. (http://knowledge4food.net/wp-content/uploads/2016/12/2016_BL_PolicyBrief.pdf) World Bank (2016) ‘Sierra Leone: Smallholder Commercialization and Agribusiness Development Project’. Washington, DC: World Bank.
B6: BREWERIES IN FRAGILE CONTEXTS Dirk Willem te Velde and Johan te Velde
ECONOMIC DEVELOPMENT IN FRAGILE CONTEXTS: LEARNING FROM SUCCESS AND FAILURE
89
Introduction: the importance of food and beverages in low-income countries… The food and beverages industry is often the best-performing manufacturing industry in African countries. National statistics point to a mixed pattern across manufacturing sub-sectors (Balchin et al., 2016). In countries with easily accessible data (Ethiopia, Kenya, Nigeria, Rwanda), food and beverages – usually a domestically oriented industry – is the dominant manufacturing sector (40–70% of the total), followed by textiles and clothing, which is more likely to be export-oriented. There are also some other important industries – for example 6% for cement in Nigeria, 12% for machinery and transport equipment in Kenya and 5% for non-metallic mineral products in Rwanda. In Uganda, total manufacturing real output growth was 5% over 2010–2014, but food processing, drinks and tobacco increased by 8%, chemicals fell by 3% and textiles, clothing and footwear dropped by 11%. Zambian manufacturing grew by 3% annually over 2006–2010, but the paper industry increased by 14% and the textiles and leather industry fell by 32%. The food and beverages sector increased above average partly because of the importance of growing domestic demand, whereas textiles and clothing could not withstand the competition from Asian imports. The food and beverages sector may not be the most transformational unless firms are engaged in exporting.
… and breweries in particular, for example in Burundi or Kenya Within the food and beverage sector, breweries are major players. For example, Brarudi (Brasserie du Rwanda-Urundi) is a subsidiary of Heineken (which owns 59%), co-owned by the government of Burundi (41%), and in 2006 its turnover was €87 million and its value addition €51 million, or 8% of gross domestic product (GDP). Taxes were around €37 million, or 30% of total tax revenues, and it created 14,000 jobs in the value chain (Triple Value Consulting, 2008). More recent data suggest Brarudi is responsible for some 10% of GDP, 50,000 jobs directly and indirectly and 30% of government revenues. EABL (East African Breweries) is one of the major manufacturers, owned by Diageo Africa. It recently announced a new investment in Kisumu, which is likely to create some 110,000 jobs, which we can compare with the total amount of 300,000 manufacturing jobs in Kenya (Were, 2017). It is common for smaller African countries to be dominated by one brand, for example Diageo in Kenya, Heineken in Burundi or Carlsberg in Malawi. Meanwhile, the bigger countries, such as Nigeria, now have multiple brands.
What is behind the success of breweries? Investment in the beer market and success by breweries in such adverse environments are influenced by several factors (availability of good-quality local suppliers, the market, government commitments). One major factor is the quality of links between the brewery and government. One of the key factors entails the use of fiscal incentives, often justified on the grounds of significant employment creation and links to local sourcing opportunities by farmers. A further initiative has been the development of a low-cost beer, helped by lower duties, which could replace illicit drinks. Despite tax incentives, EABL is the second largest tax-payer in Kenya, but this new investment was made possible through a credible commitment from government. EABL has a near monopoly position in the beer market and has had links with the government for more than 100 years.

ECONOMIC DEVELOPMENT IN FRAGILE CONTEXTS: LEARNING FROM SUCCESS AND FAILURE
90
Good links between government and brewery are also crucial in the running of Brarudi in Burundi. Brarudi has been operational since 1955 and has traditionally played a major role in the country. As it is the single largest employer after the government of Burundi, and contributes some 30% of total government tax collection, there is a two-way relationship between the stability of the country (in terms of employment and tax revenues) and the success of the company. The industrial beer market in Burundi is almost completely in the hands of Brarudi. Thus, Brarudi activities implicitly support the stability of the government through money transfers (and sometimes even on a credit basis); vice versa, several company leaders have links to government. For example, a person close to the regime was appointed chair of the Supervisory Board of Brarudi. Heineken argued that appointing a person to this position was a prerogative of the government of Burundi, but added that the chair did not have executive powers (NRC, 2016). As Heineken is a company of strategic importance to the government, questions arise about its contributions to the legitimacy of the current government, at a time of food insecurity, rapid emigration and increasing fragility in Burundi. An example of how a foreign-owned business can stimulate local supply chains is the extent to which Brarudi has increased its sourcing of white sorghum locally, from 65 tons in 2009/10 to 2,553 tons in 2014/15. At first there was little interest among local farmers in producing white sorghum but foreign currency constraints made it necessary to source more locally. Local production then increased significantly from 2013. The rise of production can further be attributed to (te Velde, 2017):
• Increased demand and higher prices offered by Brarudi – making white sorghum more profitable than other comparable agricultural crops – through introduction of the 100% white sorghum beer Nyongera (a popular local beer)26 and of white sorghum as an ingredient for other beers (Dietz, 2015);
• Sustained training efforts, support and equipment offered by European Cooperative for Rural Development (EUCORD)27 and the agronomists of the Direction Provinciale de l’Agriculture et de l’Élevage (DPAE) 28 and training and equipment from the International Fertilizer Development Centre (IFDC);29 and
• Engagement of non-governmental organisations (NGOs) such as Spark, which have provided training to the cooperatives, facilitated farmers’ access to credit and initiated multi-stakeholder processes since mid-2013.
There are also political economy issues. The cooperatives around white sorghum are often linked to the ruling party. The management committees of the cooperative overlap with local government and the selection processes within the cooperative are neither based on clear criteria nor transparent. There are no clear criteria for determining how much white sorghum an individual producer is allowed to produce. It is important to emphasise that donors are supporting the development of local suppliers around Brarudi. The Dutch NGO Spark engaged in the process after 2013 through (i) enabling microfinance institutions Cospec (Coopérative Solidarité avec les Paysans pour l’Epargne et le Crédit à Cibitoke) and CECM (Caisse Coopérative d'Épargne et de Crédit Mutuel) to provide small-scale loans at reduced interest rates level to white sorghum producers to cover
26 Brarudi itself thinks the popularity of the Nyongera beer owes also to the fact that the white sorghum is sourced in the area where the beer is sold, so the costumers regard it as indigenous. 27 EUCORD, formally registered as Cooperative EUCORD U.A., is a Brussels-based non-profit (Dutch Cooperative Law). It was created in 2003 and operates autonomously in affiliation with Winrock International. 28 DPAE is a de-concentrated government agency at provincial level. It provides inputs (seeds, fertilisers) and offers extension services. 29 IFDC, established in October 1974, has focused on increasing and sustaining food security and agricultural productivity in over 100 developing countries through the development and transfer of effective and environmentally sound crop nutrient technology and agribusiness expertise: https://ifdc.org/our-work/

ECONOMIC DEVELOPMENT IN FRAGILE CONTEXTS: LEARNING FROM SUCCESS AND FAILURE
91
investment costs, together with Terafina-microfinance; (ii) organising capacity-building for white sorghum producers and training on cooperative management with Spark and EUCORD; and (iii) organising multi-stakeholder meetings. The International Finance Corporation is considering whether to invest more in Brarudi. While many breweries now source locally (e.g. use of rice or sorghum, with several donor support programmes in existence), this is harder in the most fragile contexts. In the Central African Republic, for example, the most important firm in Bagui is a brewery. When Islamist militias took over the capital, they stole the stock of local beer but did not destroy the plant. However, this plant now imports everything, as there is no rice or maize available. Beer sales tend to rise in adversity, though, and, despite the conflict, the company has now received the money for modern equipment.30
Conclusions There are several lessons from the example of breweries in East Africa. Clearly, it is possible for one firm – a strategic industry – to have substantial transformative impacts on employment, public revenues and economic growth. There will be important mutual dependencies between state and business in this particular sector. Tax revenues, job creation and a popular consumer product such as beer, which is consumed by both elites and the rest of the population, together produce a strong constituency in favour of continued production. Strong brand loyalty, linked to quality assurance, affordability and some product differentiation to cheap traditional brews, strengthens this constituency. Despite being capital-intensive and dependent on imported ingredients, this constituency limits the ability of governments to expropriate and interfere with management, not unlike the situation in the mobile telephone industry. Firms have developed close relations with governments that have enabled them to manage the risks of operating in fragile environments, and the participation of foreign transnational corporations provides access to the highest levels of government and countervailing power in any negotiations. Such relationships can help secure tax incentives or tariffs. Of course, given the nature of governance in these countries, there is a risk of informal financial flows to politicians and political parties, even though consumers, government and company shareholders appear to be realising significant benefits. Nevertheless, any informal transfer represents funds that could have gone to the government budget, consumers or company shareholders, with potential economic multiplier effects. A future policy-maker might consider how any such informal flows could be regularised – that is, made transparent in the accounts – when the time is right, such as gifts of free beer, ‘promotions’, donations to political parties, etc., or how incentives might be created to avoid the perils of ‘crony businesses’ emerging in the future, such as by promoting trade in beer throughout the East African Community, lowering barriers to new entrants such as micro-breweries and increasing excise duties on alcohol to capture more of the economic rents for the state. Breweries are successful examples of large-scale investment in East Africa for several reasons. First, they produce a branded, quality-assured product for which there was strong demand at all levels of society, such that any interference with their operations would lead to an intense reaction from customers. Second, significant tax revenues and job creation mean these firms can ask for tax advantages. This mutual dependence worked at the early stages; however, the closeness of a few large firms to government may also create competition policy and rent-seeking issues that future governments may need to manage
30 On Baruda, see van Beemen (2016) and Vermeulen (2016).

ECONOMIC DEVELOPMENT IN FRAGILE CONTEXTS: LEARNING FROM SUCCESS AND FAILURE
92
References
Balchin, N., Gelb, S., Kennan, J., Martin, H., te Velde, D.W. and Williams, C. (2016) ‘Developing export-based manufacturing in sub-Saharan Africa’. Report, Supporting Economic Transformation Programme. London: ODI. Dietz, T. (2015) ‘Heineken in Afrika’, het nieuwe boek van Olivier van Beemen’, blog, 16 November. (https://tondietz.wordpress.com/2015/11/16/heineken-in-afrika-het-nieuwe-boek-van-olivier-van-beemen/) Te Velde, J. (2017), ‘About white sorghum value chain cooperatives in Burundi. A collaboration of SPARK with Heineken’, Double Loop, October. The Economist (2016) ‘Helping the Central African Republic avoid another catastrophe’, 17 March. Triple Value Consulting (2008) ‘Serving the consumer, serving Burundi. The economic impact of Brarudi in Burundi’. The Hague: Triple Value Consulting. Van Beemen, O. (2016) ‘Heineken blijkt in Burundi nog nauwer verbonden met autoriteiten dan ik eerder schreef’, 18 November (https://decorrespondent.nl/5702/heineken-blijkt-in-burundi-nog-nauwer-verbonden-met-autoriteiten-dan-ik-eerder-schreef/1472266355692-2c29aab3) Vermeulen, M. (2016) ‘Hoe Heineken een dictatuur in stand houdt in het een na armste land ter wereld’, 6 July (https://decorrespondent.nl/4864/hoe-heineken-een-dictatuur-in-stand-houdt-in-het-een-na-armste-land-ter-wereld/1255893292544-b17cdb8e) Were, A. (2017) ‘Kenya needs more of EABL’s Sh15bn Kisumu beer plant investment’ Business Daily, 16 July (http://www.businessdailyafrica.com/analysis/539548-4017870-89v2qx/index.html)
B7: SUGAR INDUSTRY IN MOZAMBIQUE Andrew Lightner
Introduction
Creating employment opportunities and re-establishing state–society relations in post-conflict states is important. In general, Mozambique has done little to support economic transformation or sufficient job creation since the conclusion of the civil war (Balchin et al., 2017). However, in the years following the conflict, which formally concluded in 1992, coordination and commitment between the government and foreign private investors successfully rehabilitated the sugar industry by 1996. This industry provided much-needed employment and foreign reserves for post-conflict stabilisation. Success with regard to rehabilitation can be attributed primarily to two factors. First, in the immediate post-war period, mutual interest arose between domestic political actors, international firms, local firms and internal bureaucrats. Second, Mozambique benefited from preferential trade agreements allowing access to broader markets. This case study may inform future post-conflict rehabilitation projects for stabilisation, particularly in states where the previous ruling coalition had substantial state involvement. However, the current state of the Mozambique economy should highlight the need to transition private sector development programmes from stabilisation to structural transformation as quickly as possible in a post-conflict setting.

ECONOMIC DEVELOPMENT IN FRAGILE CONTEXTS: LEARNING FROM SUCCESS AND FAILURE
93
The sugar industry, employment and stability in a post-conflict setting The sugar industry can reshape a predominantly subsistence-based economy towards a labour-based, monetised economy, in part because of the size of the formal labour force it produces. Beyond formal employment, the industry has a consistent record in producing ‘urban-like’ infrastructure in areas surrounding the large, rural plantations. Currently, the African Development Bank is focusing heavily on supporting such ‘urban-like’ development in crop-producing regions in fragile and conflict-affected countries. Such initiatives aim to limit urban migration and rural unemployment (Adesina, 2016). These attributes of the sugar industry have clear benefits in a post-conflict setting where rural unemployment is typically high and a contributing factor to conflict. However, the export of raw sugar commodities suffers from high competition and captures only a small portion of the value in global sugar value chains. These characteristics are increasingly prevalent owing to the emergence of Brazil in the global sugar supply chain since the mid-2000s (OEC, 2017). However, the demand for processed sugars that can be used as bio-fuels, such as molasses, remains high – even withstanding the low current prices for fuels (SpendEdge, 2017). The demand for bio-fuels suggests that upgrading within the supply chain of sugarcane may produce stable and high-value exports if productivity-enhancing investments occur within the state (Schut et al., 2010).
Meso-level private sector support in an unproductive political settlement Sugar production in Mozambique originates from the colonial period. In the mid-1960s, it employed the greatest number of formal workers and recorded the third largest export value in the country. However, from the early 1970s to 1999, the sugar production workforce fell from around 45,000 workers to only 17,000 workers. This reduction in production began with the flight of skilled labour preceding and following independence and was also the result of poor management during the state-led era and large-scale disruption during the 16-year civil war. By 1997, average output was reduced to less than 10% of potential production (Buur et al., 2012). Before the end of the civil war, the Chissano-led government identified sugar production as a pivotal industry to generate income opportunities and critical export revenue. Moreover, the expansion of formal, rural employment would lower the burden on urban centres, which were overcrowded as a result of the flight from conflict in sparsely populated regions. Luisa Diago, Minister of Finance during the initial meetings on post-war planning and eventually Prime Minister during the rehabilitation process, stated that the ‘cities could not absorb more people, so we have to get the rural areas developed. We analysed many sectors for their potential for creating job opportunities and providing services. Sugar was one of them due to its proven track record’ (in Buur et al., 2012). While peace-building appears to have been implicit in the government’s plans to revitalise the sugar industry, there have been allegations of land expropriation, low wages and poor health and safety in the sugar industry. Others question whether sugar companies have met social obligations given significant public support for the industry (Richardson, 2010).
Foreign investment and management knowledge The protracted conflict in Mozambique eroded the country’s financial and human capital. The National Sugar Institute, the agency tasked with implementing the sugar rehabilitation strategy, argued that foreign direct investment (FDI) was critical to returning the industry to peak production levels. According to policy-makers within the institute, FDI not only brought capital into a country ravaged by war but also addressed the country’s significant firm-level

ECONOMIC DEVELOPMENT IN FRAGILE CONTEXTS: LEARNING FROM SUCCESS AND FAILURE
94
deficiencies related to human capital, product and human resource management and marketing. Country risk perceptions and infrastructure availability are important in determining investment destinations. The destruction of private assets during the conflict made country risk perceptions exceptionally high. Moreover, the war had ravaged domestic logistics infrastructure, and the country had almost no local capacity to rebuild this. The state had a tiny and unproductive construction industry. Mozambique recorded less than 2% of its labour force in construction from 1995 to 2000. Relative productivity of the sector hovered around 0.6%, suggesting the industry was less productive than average labour productivity. Thus, Mozambique had to rely heavily on foreign construction firms – whose motivations for accepting contracts were affected by both poor perceptions of country risk and inadequate infrastructure to transport materials. Additionally, intermediate goods such as roads, electricity and port infrastructure are heavily complementary, such that the marginal benefit of investment depends on the presence of other intermediate products.31 At the end of the conflict, the government had limited financial and human capital to address all, or even most, bottlenecks to the critical production of intermediate goods for sugar production. Subsequently, less than ideal non-market incentives were likely necessary to entice investment in the initial stages. The government coordinated and supported several initiatives to attract foreign investors. State-subsidised loans were available for sugar companies. These were secured from development banks and other multilateral organisations. The strategy for rehabilitating the sugar industry also protected internal markets for future investors by introducing a tariff on imported refined sugar. Moreover, the National Sugar Institute assisted investing firms in gaining preferential markets for their surplus production. Access to the European market was further facilitated by the Everything but Arms agreement. Other elements of the strategy for attracting FDI included the provision of various types of infrastructure such as electricity and rail and ports upgrading.
Mutual interest in a weak political settlement Mutual interests emerged between state bureaucrats and foreign firms during the post-war period. Foreign management of sugar plantations kept the proceeds of the sugar industry from the Mozambican National Resistance’s (Renamo’s) leadership. It also allowed the Mozambique Liberation Front to build political support through the large-scale creation of jobs, including in Renamo strongholds. Prior to the civil war, the state had operated the industry, albeit poorly. After the war, state–industry leaders became its regulators. Subsequently, these bureaucrats were given significant autonomy by high-level leadership since their initial placement as industry leaders during the state-led era was the result of their strong ties to the party. While they may have run the firms poorly, the experience they had gained in sugar production, resource management and marketing at the firm level produced a well-informed bureaucracy. Industry leaders in neighbouring countries demonstrated an interest in expanding production, given their own domestic land constraints and price competition – primarily from Brazil. The two largest South African sugar companies at the time, Tingaat-Hulett and Illovo Sugar, and a Mauritian consortium of four groups, FUEL Group (ENL/Savannah, Compagnie d’Investissement et de Développement Ltee, Kalua Properties Ltd and Stam Investment Ltd) were the first to respond to the privatisation calls of the Mozambican government.
31 See Jones (2011) for theoretical and empirical evidence of the complementary nature of intermediate goods and the subsequent significant impact of effective intermediate good production.

ECONOMIC DEVELOPMENT IN FRAGILE CONTEXTS: LEARNING FROM SUCCESS AND FAILURE
95
A tacit agreement between the state and the foreign firms led to the deliberate use of mass employment instead of automation in cane-cutting and weeding (Whitfield et al., 2017). Thus, foreign firms engaged in the establishment of a distribution network in rural areas and the large-scale creation of jobs in remote areas. By the end of the 2000s, the sugar industry had become the most significant formal employer outside of the state, with an average of 30,000 full-time jobs supporting up to 150,000 household members.
Summary: reasons for success in private sector development for stabilisation Multiple factors account for the success of the sugar industry in Mozambique for the purposes of short-term stabilisation.
1. Commitment and coordination by government actors: Government commitment to promote the rehabilitation of the sugar industry and coordination to attract foreign investment and address urgent infrastructure imperatives explain a large proportion of the success. Government bureaucrats actively searched for private firms willing to invest, generated support packages that were mostly implemented and bargained for labour-heavy production processes.
2. The emergence of effective state–business relations in the post-conflict period: An essential factor in the success of the sugar industry in Mozambique is the mediating role played by the bureaucracy. Several bureaucrats working within the National Sugar Institute had previously worked in the sugar industry in both state and private capacities. This allowed them to understand the requirements of the industry and to play a productive mediating role, creating a pocket of efficiency (Buur et al., 2012).
3. Managerial knowledge brought in by FDI: In a context of scarce capital and significant industrial weaknesses, foreign investment proved an essential source of financing, managerial expertise and technological upgrading. This allowed for a rapid increase in production and export outflows.
4. Trade and preferential trade agreements: Mozambique benefited in 2001 from the EU’s Everything but Arms trade deal. This gave Mozambican sugar access to EU markets. Mozambican sugar exports have also benefited from the US African Growth and Opportunities Act preferential trade agreement.
Transitioning from a stabilisation initiative to transformation This case study views the rehabilitation of the sugar industry as a success in the post-war context. However, Mozambique moved from the ‘transitioning from conflict’ stage to an ‘at risk of conflict’ categorisation when the political settlement reached at the conclusion of the war addressed the problem of widespread use of violence but did not consistently generate high levels of economic or political benefits or distribute these in a way that thoroughly appeased groups within or outside the ruling party. The sugar industry has performed less well with regard to economic transformation because policies towards the sector have not changed in accordance with changes in economic needs. First, policies within the sugar industry have not shifted to adequately promote within-sector upgrading. The dominance of the sugar industry by several vertically integrated firms has raised questions of them operating as a price-fixing cartel through their membership of the national sugar distributor organisation (Distribuidora Nacional do Açúcar, DNA), which with government approval determines the price of sugar. The vertically integrated nature of the industry deters new entrants at both wholesale and distribution levels (Millberg et al, 2014. Part of the reason for the high reference price relates to inefficiencies and high costs caused

ECONOMIC DEVELOPMENT IN FRAGILE CONTEXTS: LEARNING FROM SUCCESS AND FAILURE
96
by the high costs of internal transport and logistics, high energy costs, low workforce skills and a constraining business environment. Second, the state has not promoted structural transformation away from raw material production. Economic growth without transformation from low-value-added output to higher-productivity manufacturing or formal, high-value-added services leads to unstable economic conditions. Mozambique maintains an unsustainable debt burden, with undisclosed external debt guarantees of roughly $1.4 billion (11% of gross domestic product). The subsequent suspension of International Monetary Fund’s financing in April 2016 led to an exodus of foreign investment – beginning an inflation shock that stood at over 20% in 2017 (Balchin et al., 2017). Economic instability can place stress on weak political settlements and erode stability. Thus, international actors such as the UK Department for International Development should approach private sector development for stabilisation as a temporary programme for states in transition and as quickly as possible switch to policy recommendations and programmes consistent with the recent SET report on economic transformation and job creation in Mozambique.
Lessons learned The sugar industry in Mozambique illustrates both opportunities and problems in terms of encouraging agro-business in low-income fragile settings. First is the importance of government vision, planning and policies to identify a sector of comparative advantage and provide a strategic focus to encourage productivity-enhancing investment that substantially affects exports and employment. Such government action can be particularly useful in a post-conflict setting. Second, unlike in the other case studies, the government appears to have specifically included peace-building objectives through the focus on employment in areas affected by the conflict. However, it could have been more explicit about this and ensured better consultations with people living in the project areas, including on land where they had at least customary rights. Third, if the government had played a stronger coordinating role, it could have facilitated greater investments in areas such as transport and logistics and energy that could have lowered costs and the need for protection. Fourth, while at the end of the civil war the effective cartelisation of the industry might have been necessary to provide economic rents for foreign investors in a fragile setting, potential benefits from pro-competition reforms and more market-determined sugar production likely exist to promote within-sector upgrading. However, reforms could be coupled with other policy changes to support structural transformation as recommended in the recent SET report on structural transformation in Mozambique.
References
Adesina, A. (2016) ‘Feeding Africa towards agro-allied industrialisation for inclusive growth’. Africa Economic Conference, Abuja, 5 December. Balchin, N., Coughlin, P., Papadavid, P., te Velde, D.W. and Vrolijk, K. (2017) Economic transformation and job creation in Mozambique: a synthesis paper. Supporting Economic Transformation Paper. London: ODI. Buur, L., Mondlane Tembe, C. and Baloi, O. (2012a) ‘The white gold: the role of government and state in rehabilitating the sugar industry in Mozambique’ Journal of Development Studies 48(3): 349–362.

ECONOMIC DEVELOPMENT IN FRAGILE CONTEXTS: LEARNING FROM SUCCESS AND FAILURE
97
Buur, L., Baloi, O. and Mondlane Tembe, C. (2012b) Mozambique synthesis analysis: between pockets of efficiency and elite capture. Working Paper 2012: 01. Copenhagen: DIIS. Jones, C. I. (2011) ‘Intermediate goods and weak links in the theory of economic development’ American Economic Journal: Macroeconomics 3(2): 1–28. Kegode, P. (2015) Sugar in Mozambique: balancing competitiveness with protection. SPEED for a Better Business Environment: Washington, DC. Milberg, W., Jiang, X. and Gereffi, G. (2014) ‘Industrial policy in the era of vertically specialized industrialization’, in R. Kozul-Wright and J. M. Salazar-Xirinachs (eds) Transforming economies: making industrial policy work for growth, jobs and development. Geneva: ILO. Schut, M., Slingerland, M. and Locke, A. (2010) ‘Biofuel developments in Mozambique. Update and analysis of policy, potential and reality’ Energy Policy 38(9): 5151–5165. Whitfield, L., Therkildsen, O., Buur, L. and Kjær, A.M. (2015) The politics of African industrial policy: a comparative perspective. Cambridge: Cambridge University Press.

ECONOMIC DEVELOPMENT IN FRAGILE CONTEXTS: LEARNING FROM SUCCESS AND FAILURE
98
Table B1: Summary of case studies
Mobile phones in Afghanistan
Construction in Liberia
Accountancy in Liberia
Money transfer in Somalia
Cocoa in Sierra Leone
Breweries in fragile contexts
Sugar in Mozambique
What has happened?
Significant increase in mobile phone use, significant foreign direct investment, job creation and tax revenues
Development of construction industry, including investment by Chinese companies that employ significant numbers of Liberians
Strong development of local accountancy profession
Successful companies, Dahabshil (international transactions) and Hormud (local transactions), around telecommunications and money transfer
Despite a very weak investment climate, there are 15 cocoa investors
Breweries are able to survive in the most fragile contexts and significant local white sorghum supply chains developed
A sluggish sugar industry in 1992 developed into the most successful industry in post-conflict Mozambique
Type of political connections between economic activities and state/state–business relations
Specific relationship with one private provider; hands-off regulation of sector
The two major companies have monopolistic characteristics and are politically active and influential, lobbying for their own interests
Close relationships between government and firms
Rehabilitation of sugar industry relied primarily on privatising the sugar estates and bringing in foreign investors (with the state retaining 51%) with cutting-edge expertise in sugar production and marketing
Role of public sector (islands of excellence/ experimentation) and leadership
Building targeted relationship with private providers
Engage in output- and performance based-contracting
Minimal Weak support Incentives Government (and National Sugar Institute) helped make the sugar industry an island of excellence by providing cheap loans for sugar companies, assistance in gaining preferential market access, help with a rehabilitation period and a tariff on imported refined sugar
Role of private sector leadership (undergoing transition, capability, partnerships with foreign entities)
Monopoly telecoms provider for a temporary period
Despite weak conditions, Chinese invested in Liberia
Leadership of professional accountancy profession, including links with foreign associations
Spotting opportunity changing hawala (transfer of debt) system through use of mobile phone technology
Identifying and supporting local sourcing opportunities
Success of sugar industry attributable to FDI (South African and Mauritian) and relationship between state’s bureaucracy and foreign firms; local economic elite resisted the sharp increase in sugar prices resulting from the tariffs
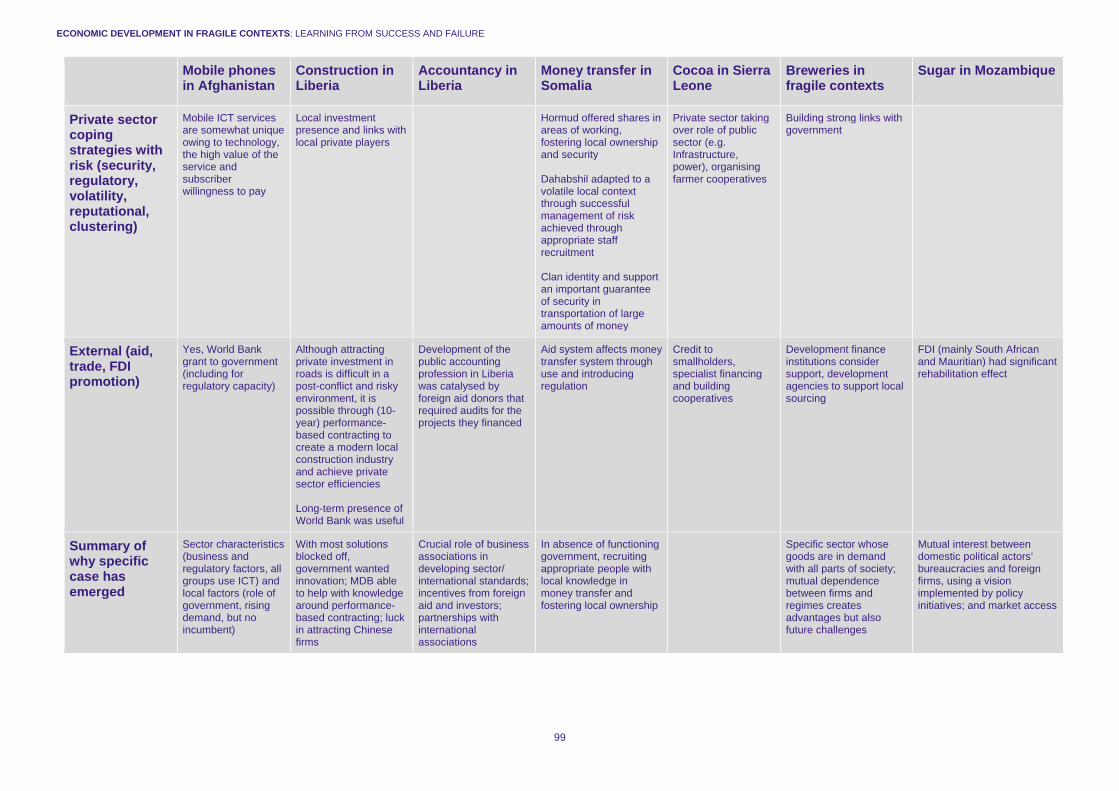
ECONOMIC DEVELOPMENT IN FRAGILE CONTEXTS: LEARNING FROM SUCCESS AND FAILURE
99
Mobile phones in Afghanistan
Construction in Liberia
Accountancy in Liberia
Money transfer in Somalia
Cocoa in Sierra Leone
Breweries in fragile contexts
Sugar in Mozambique
Private sector coping strategies with risk (security, regulatory, volatility, reputational, clustering)
Mobile ICT services are somewhat unique owing to technology, the high value of the service and subscriber willingness to pay
Local investment presence and links with local private players
Hormud offered shares in areas of working, fostering local ownership and security Dahabshil adapted to a volatile local context through successful management of risk achieved through appropriate staff recruitment Clan identity and support an important guarantee of security in transportation of large amounts of money
Private sector taking over role of public sector (e.g. Infrastructure, power), organising farmer cooperatives
Building strong links with government
External (aid, trade, FDI promotion)
Yes, World Bank grant to government (including for regulatory capacity)
Although attracting private investment in roads is difficult in a post-conflict and risky environment, it is possible through (10-year) performance-based contracting to create a modern local construction industry and achieve private sector efficiencies Long-term presence of World Bank was useful
Development of the public accounting profession in Liberia was catalysed by foreign aid donors that required audits for the projects they financed
Aid system affects money transfer system through use and introducing regulation
Credit to smallholders, specialist financing and building cooperatives
Development finance institutions consider support, development agencies to support local sourcing
FDI (mainly South African and Mauritian) had significant rehabilitation effect
Summary of why specific case has emerged
Sector characteristics (business and regulatory factors, all groups use ICT) and local factors (role of government, rising demand, but no incumbent)
With most solutions blocked off, government wanted innovation; MDB able to help with knowledge around performance-based contracting; luck in attracting Chinese firms
Crucial role of business associations in developing sector/ international standards; incentives from foreign aid and investors; partnerships with international associations
In absence of functioning government, recruiting appropriate people with local knowledge in money transfer and fostering local ownership
Specific sector whose goods are in demand with all parts of society; mutual dependence between firms and regimes creates advantages but also future challenges
Mutual interest between domestic political actors’ bureaucracies and foreign firms, using a vision implemented by policy initiatives; and market access