Embed Size (px)
Citation preview

The Cost to Governments
Economic Cost of Acute Coronary Syndrome in Australia:
This study was funded by a Sanofi Community Support Research Grant

Economic Cost of Acute Coronary Syndrome in Australia: The Cost to Governments 3
TABLE OF CONTENTS Acronyms
Executive summary
Call to Action
Introduction Refining the scope Approach Structure of the report
ACS separations in Australia Forecasting ACS separations
Patient outcomes Heart failure Heart failure and mortality risk Recurrent AMI Death Good recovery Pathway to outcomes
Health costs of an ACS event Admitted hospital expenditure Non-admitted health expenditure Unit cost of health expenditure per separation Health costs of patient outcomes
Results
Recommendations
Appendix: Data tables
04
05
07
08
10
17
26
32
35
38
Economic Cost of Acute Coronary Syndrome in Australia: The Cost to Governments 4
ACRONYMS
In the preparation of this study, the author, Clare Saunders, would like to acknowledge the advice and guidance from:• Professor Garry Jennings AO, Executive Director Sydney Health Partners, Chief Medical Adviser
Heart Foundation• Bill Stavreski, General Manager Heart Health and Research, Heart Foundation• Rohan Greenland, General Manager Advocacy, Heart Foundation
ABS Australian Bureau of Statistics
ACS Acute coronary syndrome
AMI / MI Acute/myocardial infarction
AIHW Australian Institute of Health and Welfare
CHD Coronary heart disease
HF Heart failure
ICD International Statistical Classification for Diseases
NSTEMI Non-ST elevation myocardial infarction
STEMI ST elevation myocardial infarction
UA Unstable angina
ACKNOWLEDGEMENTS

EXECUTIVE SUMMARYHeart disease is the leading cause of death in Australia. Whilst improvements in treatment and care now mean more people are surviving an acute heart event, this also means an increasing number of people are living with the burden of heart disease.
It follows then that heart disease places a large economic burden on individuals experiencing heart disease, their families and carers, and governments that fund the health system.
This is the first in the Economic Cost of Acute Coronary Syndrome in Australia series which places a figure on the full economic cost of heart disease to all stakeholders within the economy. The focus of this report is on the financial burden placed on the health system, primarily borne by governments.
Heart disease is a broad term, capturing both chronic disease and acute events. While there is a preference to scope heart disease at its broadest, and include all conditions therein, costing of chronic disease is difficult due to the nonlinear progression of the disease. Consequently, the focus of this paper is on acute events, specifically, acute coronary syndrome (ACS), which includes acute myocardial infarction (AMI/heart attack) and unstable angina (UA).
Previous studies have been undertaken to estimate the economic cost of ACS. This study seeks to update these analyses with the latest data available, but also the approach taken to estimate the economic cost.
Previous studies have estimated the health expenditure based on the number of ACS hospital separations, multiplied by the cost per separation. Although a good starting point, this approach does not capture the range of outcomes people experience after the initial ACS event, nor the additional costs associated with these outcomes, and therefore understate the full cost of heart disease.
In this paper, a literature review has been undertaken to identify the mortality and morbidity of patients that experience an ACS event. From the literature review, it emerged that the key outcomes for patients in the first year post an ACS event are:
• a (comparatively) good recovery,• a subsequent heart attack, • heart failure, or• death.
The literature review has also shaped the understanding of the pathway to these outcomes. For example, post their ACS event, not all people will develop heart failure either immediately or within the first 12 months. Some are discharged from hospital after their ACS event, but then go on to experience another myocardial infarction (heart attack) or develop heart failure.
Pathways and outcomes have been constructed probabilistically using a tree diagram framework, and costed at two time points: on discharge from hospital, and 1 year post the initial ACS event. The benefit of this approach is that it provides a more holistic picture of the health expenditure burden borne by governments from ACS events.
The total cost of ACS events for 2017-18 is calculated by multiplying the number of ACS events, by the probability of the different outcomes, and the cost associated with each outcome.
It is estimated that ACS events in Australia will cost governments alone $1,930.2 million in 2017-18, with the majority of the cost attributable to NSTEMI events, driven by the large number of NSTEMI separations.

Economic Cost of Acute Coronary Syndrome in Australia: The Cost to Governments 6
Economic Cost of Acute Coronary Syndrome in Australia: The Cost to Governments 7
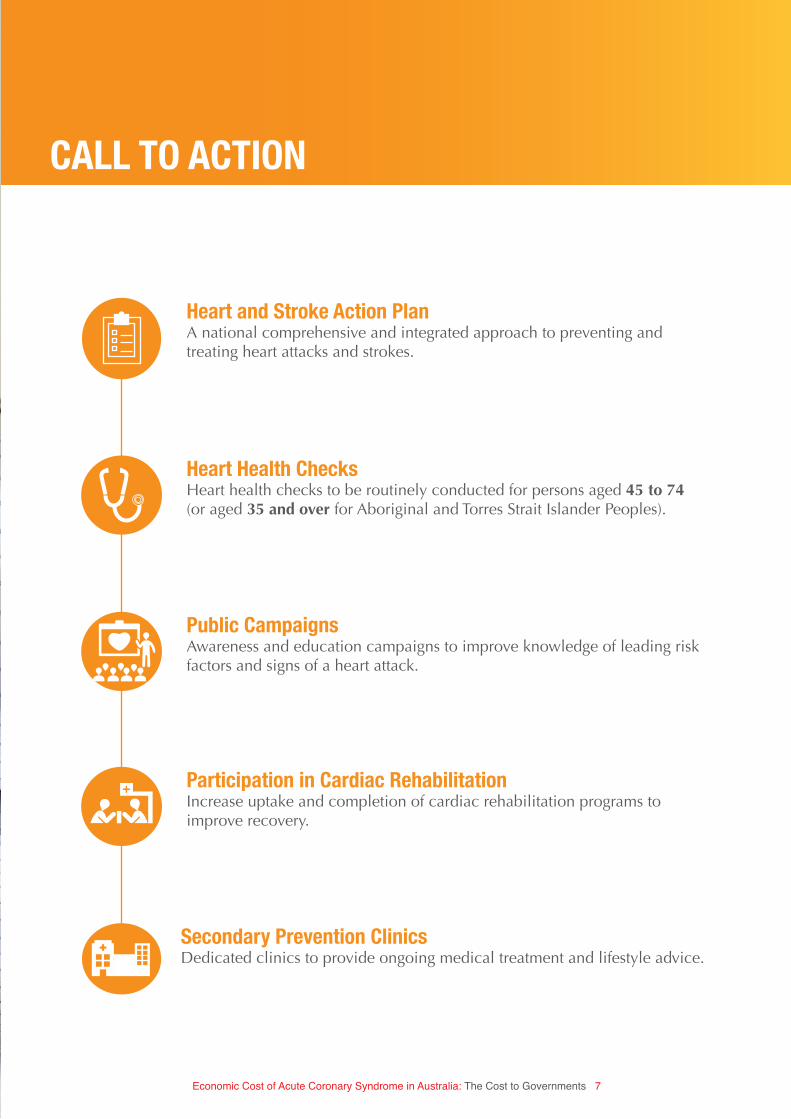
Heart and Stroke Action PlanA national comprehensive and integrated approach to preventing and treating heart attacks and strokes.
Heart Health ChecksHeart health checks to be routinely conducted for persons aged 45 to 74(or aged 35 and over for Aboriginal and Torres Strait Islander Peoples).
Public CampaignsAwareness and education campaigns to improve knowledge of leading risk factors and signs of a heart attack.
Participation in Cardiac RehabilitationIncrease uptake and completion of cardiac rehabilitation programs to improve recovery.
Secondary Prevention ClinicsDedicated clinics to provide ongoing medical treatment and lifestyle advice.
CALL TO ACTION
Economic Cost of Acute Coronary Syndrome in Australia: The Cost to Governments 8
INTRODUCTION
Heart disease affects three percent of the adult Australian population, based on 2014-15 self-reported data.1 While death rates have fallen substantially since the peak of the late 1960s and early 1970s2, heart disease continues to be the single leading cause of death in Australia.3
It follows then that heart disease places a large economic burden on individuals experiencing heart disease, their families and carers, and governments that fund the health system.
This paper is the first in a series to place a figure on the full economic cost of heart disease to all stakeholders within the economy.
The focus of this first paper is on the burden placed on the health system, thereby focusing on the health expenditure borne by governments. Subsequent papers will focus on the economic cost to individuals experiencing heart disease, their family and carers.
The purpose of this paper is to detail the methodological approach taken in estimating the economic cost of heart disease to governments, and the results.
REFINING THE SCOPE
Heart disease, as defined by the International Statistical Classification for Diseases (ICD), includes angina, acute myocardial infarctions (AMI), and acute and chronic ischaemic heart disease.4 While there is a preference to scope heart disease at its broadest, and include all conditions, costing of chronic disease is difficult because on the nonlinear progression of the disease. Consequently, the focus of this paper is on acute events, specifically, acute coronary syndrome (ACS).
ACS at its simplest, consists of episodes of unstable angina (UA),5 and AMI – more commonly referred to as a heart attack. For the purposes of this study, further granularity is required, disaggregating AMI events into ST elevation myocardial infarction (STEMI) and non-STEMI (NSTEMI) events.6 STEMI is full blockage of the artery, leading to necrosis of the heart tissue, making it a more serious diagnosis than NSTEMI.
Literature relating to ACS is rich, and enables a detailed full analysis of the different outcomes that people experience post an ACS event.
Furthermore, ACS accounts for over half of all heart disease admissions (53 percent),7 and close to nine in every ten dollars of health expenditure (87 percent).8 Therefore, the focus on ACS provides a good proxy for the economic cost of heart disease.
1 Australian Institute of Health and Welfare 2017, How many Australians have cardiovascular disease?, available: www.aihw.gov.au/cardiovascular-disease/prevalence/ 2 Australian Institute of Health and Welfare 2010, Cardiovascular disease mortality: trends at different ages, Cardiovascular series no. 31, cat. no. 47.3 Australian Bureau of Statistics 2017, Causes of death, 2016, ABS cat. No. 3303.0, September.4 Heart disease is defined as Ischaemic heart disease, ICD-10-AM codes I20-I25.5 Unstable angina is defined as ICD-10-AM code I20.06 STEMI is defined as the sum of ICD-10-AM codes I21.0, I21.1, I21.2, I21.3 and I22. NSTEMI is defined as the sum of ICD-10-AM codes I21.4 and I21.9.7 Heart Foundation calculation based on Australian Institute of Health and Welfare National Hospital Morbidity Database.8 Heart Foundation calculation based on health care expenditure for ACS from Access Economics (2009), divided by health care expenditure for CHD from AIHW 2014.

Economic Cost of Acute Coronary Syndrome in Australia: The Cost to Governments 9
APPROACH
Previous studies have been undertaken to estimate the cost to governments of health expenditure. Depending on the scope of heart disease, estimates range from $1,767 million9 (2009 prices) for ACS, to $2,028 million10 (2008-09) for coronary heart disease (CHD).
This study seeks to update these analyses with the latest data available, but also to introduce a new approach to estimate the economic cost.
Previous studies have estimated the health costs based on the number of ACS hospital separations, multiplied by the cost per separation. Although a good starting point, this approach does not capture the range of outcomes people experience after the initial ACS event, nor the additional costs associated with these outcomes.
Improvements in treatment and care are helping more people survive an acute heart event. For example, between 1998-99 and 2007-08 the number of AMIs ending in death has almost halved.11 Although survival rates have continued rise, approximately one in ten survivors go on to have subsequent heart attacks and/or develop heart failure.12,13 This places an additional burden on the health system, which to date, has not been captured in the studies, understating the true cost of heart disease.
In this paper, epidemiological evidence has been gathered to demonstrate the different outcomes for patients post an initial ACS event. For example, some patients may be able resume work or daily life quickly, some may need a longer recovery period, and for others, the ACS event may result in death.
As the cost associated with each pathway and outcome varies, it is necessary to understand each pathway and costs to develop a more holistic picture of the health expenditure burden placed on governments from an ACS event.
9 Access Economics 2009, The economic cost of heart attack and chest pain (Acute Coronary Syndrome), prepared for Eli Lilly.10 Australian Institute for Health and Welfare 2014, Health-care expenditure on cardiovascular diseases 2008-09, cat. no. CVD 65.11 Australian Institute for Health and Welfare 2011, Monitoring acute coronary syndrome using national hospital data: an information paper on trends and issues, cat. no. CVD 57.12 Kaul, P. et al 2013, ‘Incidence of heart failure and mortality after acute coronary syndromes’, American Heart Journal, vol. 165, issue 3, pp. 379-385.13 Smolina, K. 2012, ‘Long-Term Survival and Recurrent After Acute Myocardial Infarction in England, 2004 to 2010’, Circulation: Cardiovascular Quality and Outcome, vol.5, issue 4, pp. 532-40.
STRUCTURE OF THE REPORT
As the purpose of this report is to detail the calculation of the economic cost of ACS to governments, the following sections outline the data used, the steps taken, and the assumptions made in the calculation of the economic cost of ACS.
• ACS separations in Australia – this chapter outlines the current number of ACS separations, trends and break down by age and gender. It also includes the methodology for forecasting ACS separations in 2017-18.
• Patient outcomes – this chapter summarises the literature on different patient outcomes by type of ACS. It also includes the pathways to outcomes, which brings together the literature to illustrate, probabilistically, the different patient pathways in hospital, and 12 months post separation.
• Health costs of an ACS event – this chapter provides a summary of the health expenditure data, and the cost associated with the different patient outcomes.
• Results – this chapter brings together the ACS separations data, literature on patient outcomes, and health costs to estimate the economic cost to governments from ACS events in Australia, in 2017-18.
• Appendix – this chapter includes detailed data tables.
Economic Cost of Acute Coronary Syndrome in Australia: The Cost to Governments 10
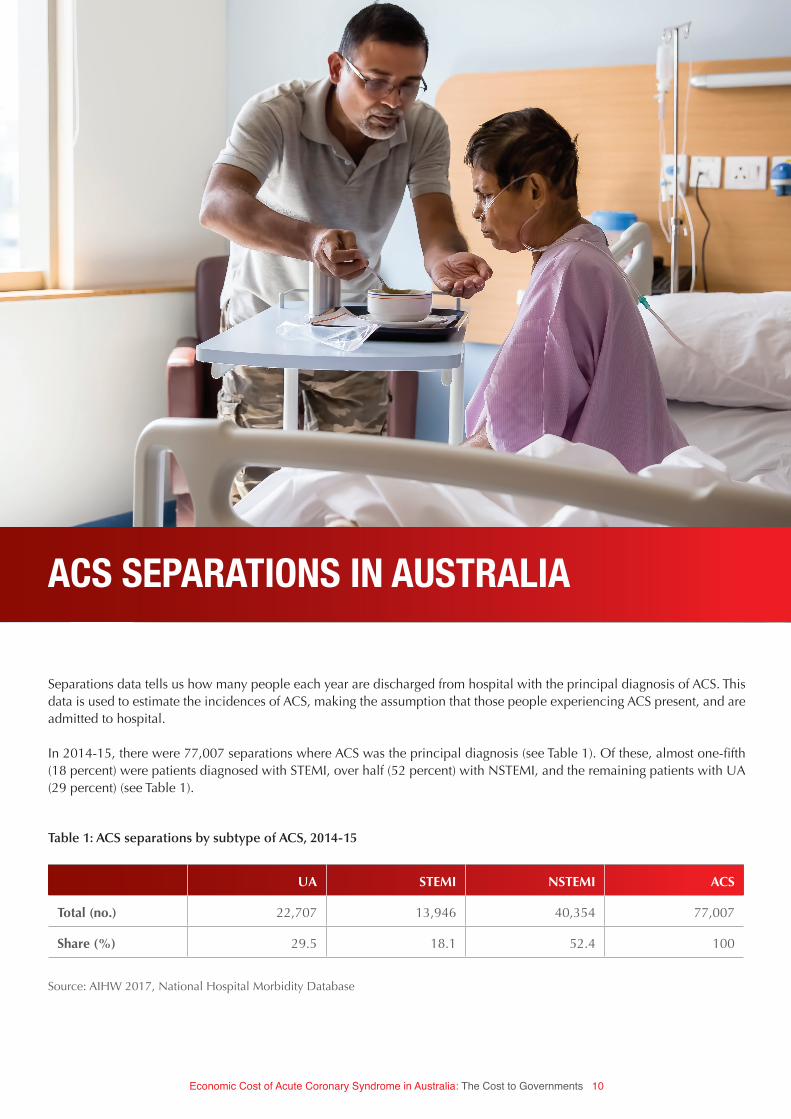
Separations data tells us how many people each year are discharged from hospital with the principal diagnosis of ACS. This data is used to estimate the incidences of ACS, making the assumption that those people experiencing ACS present, and are admitted to hospital.
In 2014-15, there were 77,007 separations where ACS was the principal diagnosis (see Table 1). Of these, almost one-fifth (18 percent) were patients diagnosed with STEMI, over half (52 percent) with NSTEMI, and the remaining patients with UA (29 percent) (see Table 1).
UA STEMI NSTEMI ACS
Total (no.) 22,707 13,946 40,354 77,007
Share (%) 29.5 18.1 52.4 100
Table 1: ACS separations by subtype of ACS, 2014-15
ACS SEPARATIONS IN AUSTRALIA
Source: AIHW 2017, National Hospital Morbidity Database
Economic Cost of Acute Coronary Syndrome in Australia: The Cost to Governments 11
14 Jennings SM et al. 2012, ‘Trends in hospitalisation for acute myocardial infarction in Ireland, 1997-2008’, Heart, vol. 98, issue 17, pp. 1285-1289; McManus D et al. 2011, ‘Recent trends in the incidence, treatment, outcomes of patients with ST and Non-ST-segment acute myocardial infarction’, American Journal of Medicine, vol. 124, issue 1, pp. 40-47; Sugiyama T et al 2015, ‘Differential time trends of outcomes and cost of care for acute myocardial infarction hospitalizations by ST elevation and type of intervention in the United states, 2001-2011’, Journal of American Heart Association, vol. 4, issue 3; Freisinger E et al 2014, ‘German nationwide data on current trends and management of acute myocardial infarction: discrepancies between trials and real life’, European Heart Journal, vol. 35, issue 15, pp. 979-988; Zhang, Q et al. 2016, ‘Recent trends in hospitalization for acute myocardial infarction in Beijing: Increasing overall burden and transition from ST-segment elevation to non-ST-elevation myocardial infarction in a population-based study’, Medicine, volume 95, issue 5.
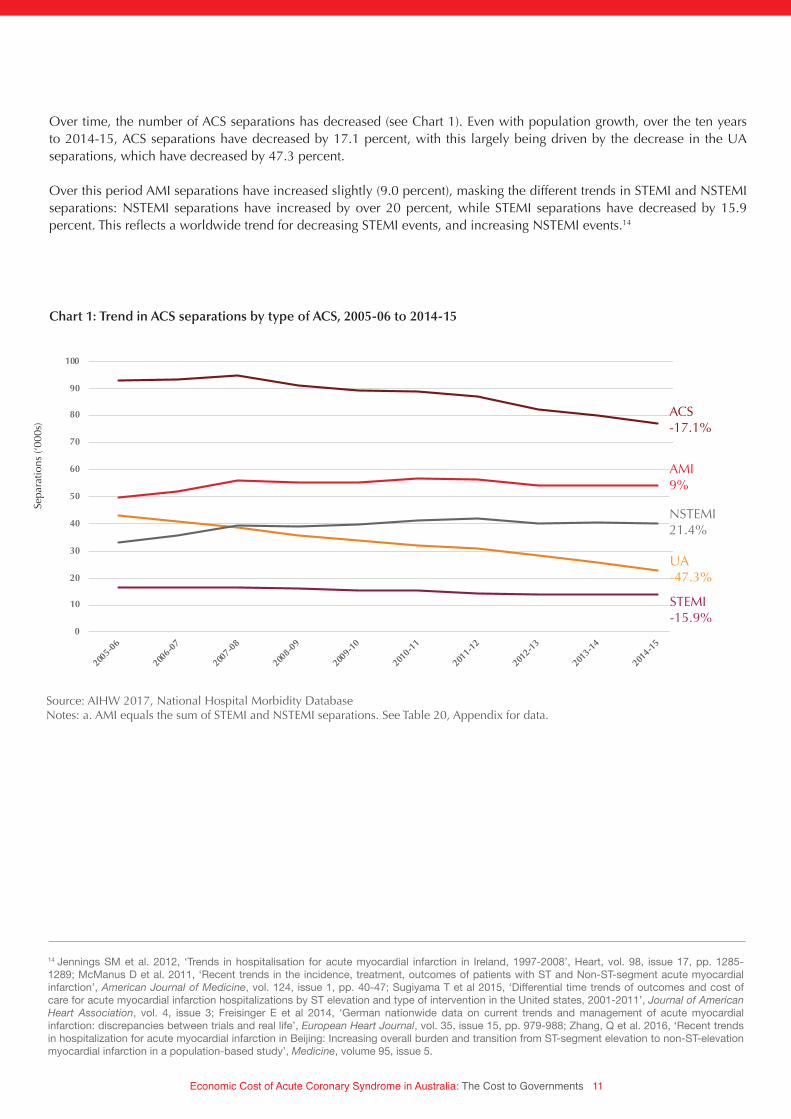
Chart 1: Trend in ACS separations by type of ACS, 2005-06 to 2014-15
Source: AIHW 2017, National Hospital Morbidity DatabaseNotes: a. AMI equals the sum of STEMI and NSTEMI separations. See Table 20, Appendix for data.
Over time, the number of ACS separations has decreased (see Chart 1). Even with population growth, over the ten years to 2014-15, ACS separations have decreased by 17.1 percent, with this largely being driven by the decrease in the UA separations, which have decreased by 47.3 percent.
Over this period AMI separations have increased slightly (9.0 percent), masking the different trends in STEMI and NSTEMI separations: NSTEMI separations have increased by over 20 percent, while STEMI separations have decreased by 15.9 percent. This reflects a worldwide trend for decreasing STEMI events, and increasing NSTEMI events.14
Sepa
ratio
ns (‘
000s
)
0
10
20
30
40
50
60
70
80
90
100
2005-0
6
2006-0
7
2007-0
8
2008-0
9
2009-1
0
2010-1
1
2011-1
2
2012-1
3
2013-1
4
2014-1
5
Sep
arat
ions
('00
0s)
UA STEMI NSTEMI AMI ACS
-17.1%
9.0%
21.4%
-15.9%
-47.3%
ACS -17.1%
AMI9%
NSTEMI21.4%
UA-47.3%
STEMI-15.9%

Economic Cost of Acute Coronary Syndrome in Australia: The Cost to Governments 12
Chart 2 summarises the distribution of separations by age group, which shows that the number of separations increases with age, up until the mid to late 70s, after which the number of separations declines slightly. The exception to this is NSTEMI separations which peaks for people aged over 85 years.
Despite this, the positive relationship between age and separations is strong, with a Spearman Rank correlation of 0.95.15 This shows that age is an important factor to consider when estimating the number of ACS events.
15 A coefficient of 1 reflects perfect positive correlation.
-
1,000
2,000
3,000
4,000
5,000
6,000
7,000
8,000
15-19
20-24
25-29
30-34
35-39
40-44
45-49
50-54
55-59
60-64
65-69
70-74
75-79
80-84
85+
Sep
arat
ions
(no
.)
UA STEMI NSTEMI
Chart 2: ACS separations by type and age group, 2014-15
Sepa
ratio
ns
6,728
2,256
1,294
Source: Heart Foundation calculations.Notes: See Table 21, Appendix for data.

Economic Cost of Acute Coronary Syndrome in Australia: The Cost to Governments 13
FORECASTING ACS SEPARATIONS
To estimate the number of ACS events in 2017-18, it is necessary to take into account the historical trend in hospital separation and changes in Australia’s demographics.
The first step required is to calculate the age-standardised rate of separations for ACS in 2014-15. The purpose of standardising separations for age and gender is to compare changes in the number of separations over time, independent of changes in the age and gender profile of the population. This is particularly important for this report, as men and older people are more likely to be admitted to hospital for ACS.
Source: Australian Institute of Health and Welfare 2017, National Hospital Morbidity Database; Australian Bureau of Statistics 2013, Population Projections, Australia, ABS Cat. no. 3222.0, series C; Heart Foundation calculations.Notes: See Table 22, Appendix for data.
Chart 3: Age standardised ACS separations, 2014-15
-
500
1,000
1,500
2,000
2,500
3,000
3,500
15-19 20-24 25-29 30-34 35-39 40-44 45-49 50-54 55-59 60-64 65-69 70-74 75-79 80-84 85+
Chart Title
Male Female
-
500
1,000
1,500
2,000
2,500
3,000
3,500
15-19 20-24 25-29 30-34 35-39 40-44 45-49 50-54 55-59 60-64 65-69 70-74 75-79 80-84 85+
Chart Title
Male Female
male female
Economic Cost of Acute Coronary Syndrome in Australia: The Cost to Governments 14
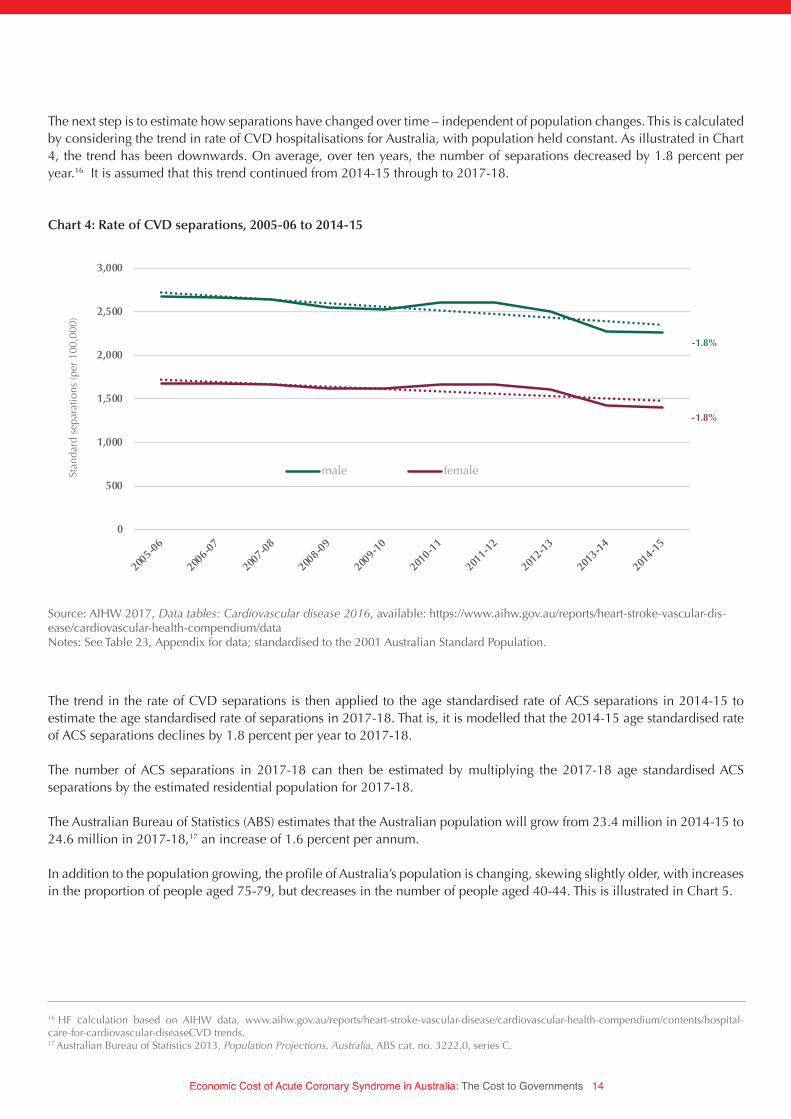
The next step is to estimate how separations have changed over time – independent of population changes. This is calculated by considering the trend in rate of CVD hospitalisations for Australia, with population held constant. As illustrated in Chart 4, the trend has been downwards. On average, over ten years, the number of separations decreased by 1.8 percent per year.16 It is assumed that this trend continued from 2014-15 through to 2017-18.
16 HF calculation based on AIHW data, www.aihw.gov.au/reports/heart-stroke-vascular-disease/cardiovascular-health-compendium/contents/hospital-care-for-cardiovascular-diseaseCVD trends. 17 Australian Bureau of Statistics 2013, Population Projections, Australia, ABS cat. no. 3222.0, series C.
Source: AIHW 2017, Data tables: Cardiovascular disease 2016, available: https://www.aihw.gov.au/reports/heart-stroke-vascular-dis-ease/cardiovascular-health-compendium/dataNotes: See Table 23, Appendix for data; standardised to the 2001 Australian Standard Population.
The trend in the rate of CVD separations is then applied to the age standardised rate of ACS separations in 2014-15 to estimate the age standardised rate of separations in 2017-18. That is, it is modelled that the 2014-15 age standardised rate of ACS separations declines by 1.8 percent per year to 2017-18.
The number of ACS separations in 2017-18 can then be estimated by multiplying the 2017-18 age standardised ACS separations by the estimated residential population for 2017-18.
The Australian Bureau of Statistics (ABS) estimates that the Australian population will grow from 23.4 million in 2014-15 to 24.6 million in 2017-18,17 an increase of 1.6 percent per annum.
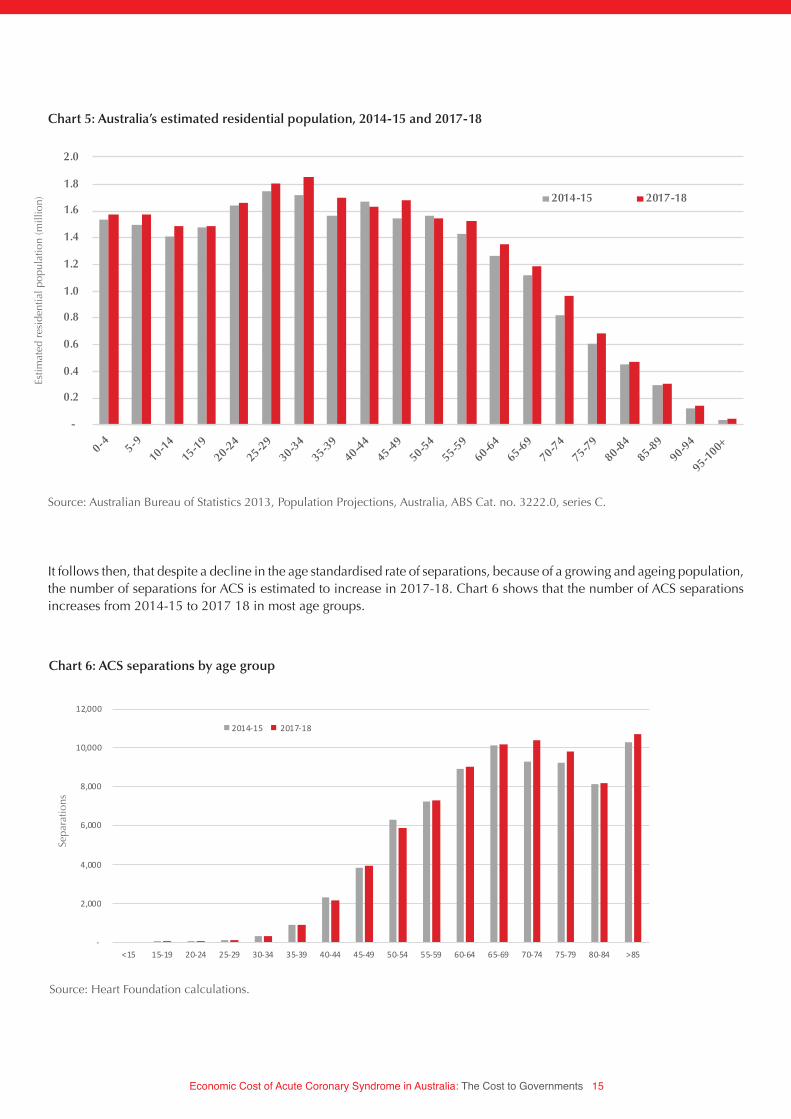
In addition to the population growing, the profile of Australia’s population is changing, skewing slightly older, with increases in the proportion of people aged 75-79, but decreases in the number of people aged 40-44. This is illustrated in Chart 5.
Chart 4: Rate of CVD separations, 2005-06 to 2014-15
Stan
dard
sep
arat
ions
(per
100
,000
)
0
500
1,000
1,500
2,000
2,500
3,000
2005-0
6
2006-0
7
2007-0
8
2008-0
9
2009-1
0
2010-1
1
2011-1
2
2012-1
3
2013-1
4
2014-1
5
Stan
dar
dis
ed s
epar
atio
ns (p
er 1
00,0
00)
Male Female
-1.8%
-1.8%
male female
Economic Cost of Acute Coronary Syndrome in Australia: The Cost to Governments 15
-
0.2
0.4
0.6
0.8
1.0
1.2
1.4
1.6
1.8
2.0
0-4 5-9
10-14
15-19
20-24
25-29
30-34
35-39
40-44
45-49
50-54
55-59
60-64
65-69
70-74
75-79
80-84
85-89
90-94
95-100+
Esti
mat
ed R
esid
neti
al p
op
ulat
ion
(mill
ion)
2014-15 2017-18
Chart 5: Australia’s estimated residential population, 2014-15 and 2017-18
Source: Australian Bureau of Statistics 2013, Population Projections, Australia, ABS Cat. no. 3222.0, series C.
It follows then, that despite a decline in the age standardised rate of separations, because of a growing and ageing population, the number of separations for ACS is estimated to increase in 2017-18. Chart 6 shows that the number of ACS separations increases from 2014-15 to 2017 18 in most age groups.
-
2,000
4,000
6,000
8,000
10,000
12,000
<15 15-19 20-24 25-29 30-34 35-39 40-44 45-49 50-54 55-59 60-64 65-69 70-74 75-79 80-84 >85
Chart Title
2014-15 2017-18
Chart 6: ACS separations by age group
Source: Heart Foundation calculations.
Estim
ated
res
iden
tial p
opul
atio
n (m
illio
n)
Sepa
ratio
ns
Economic Cost of Acute Coronary Syndrome in Australia: The Cost to Governments 16
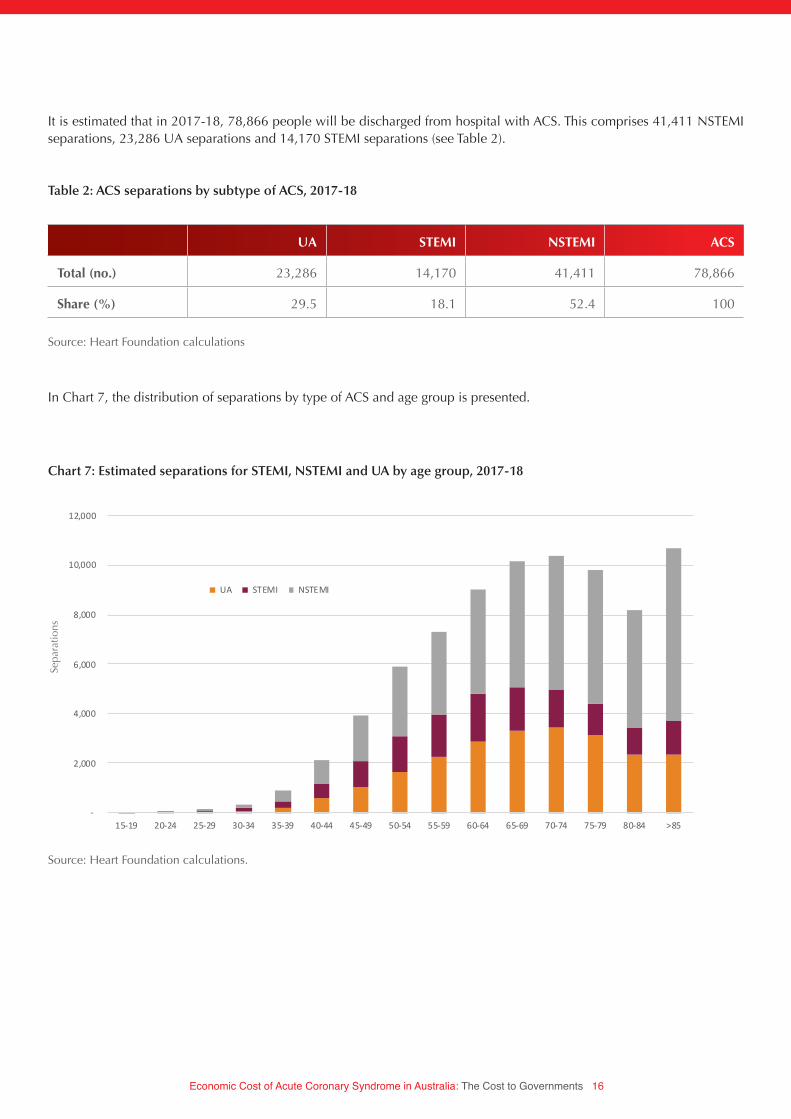
It is estimated that in 2017-18, 78,866 people will be discharged from hospital with ACS. This comprises 41,411 NSTEMI separations, 23,286 UA separations and 14,170 STEMI separations (see Table 2).
UA STEMI NSTEMI ACS
Total (no.) 23,286 14,170 41,411 78,866
Share (%) 29.5 18.1 52.4 100
Table 2: ACS separations by subtype of ACS, 2017-18
Source: Heart Foundation calculations
In Chart 7, the distribution of separations by type of ACS and age group is presented.
-
2,000
4,000
6,000
8,000
10,000
12,000
15-19 20-24 25-29 30-34 35-39 40-44 45-49 50-54 55-59 60-64 65-69 70-74 75-79 80-84 >85
Chart Title
UA STEMI NSTEMI
Chart 7: Estimated separations for STEMI, NSTEMI and UA by age group, 2017-18
Source: Heart Foundation calculations.
Sepa
ratio
ns

Economic Cost of Acute Coronary Syndrome in Australia: The Cost to Governments 17
PATIENT OUTCOMES
To identify the key outcomes for patients, post an ACS event, a literature review was undertaken. From the literature review, it emerged that the key outcomes for patients in the first year post an ACS event are:
• a (comparatively) good recovery,• a subsequent AMI, • heart failure, or• death.
The literature review has also been used to understand the pathway to these outcomes. For example, not all people that develop heart failure after an ACS event, do so immediately. Some are discharged from hospital after their ACS event, but then go on to experience a subsequent myocardial infarction, or develop heart failure.
The literature has been used to understand, probabilistically, the pathway to these outcomes during their initial hospital stay, and then at 12 months post the ACS event. The benefit of this approach, is that it enables the analysis to capture the cost of subsequent events that can be attributed to the initial ACS event.
In developing the probabilistic model of patient outcomes, outcomes were disaggregated by the type of ACS (i.e. UA, STEMI, NSTEMI), because the type of ACS is an important predictor of the outcomes.
The following sections provide an overview of the literature for the outcomes.
Economic Cost of Acute Coronary Syndrome in Australia: The Cost to Governments 18
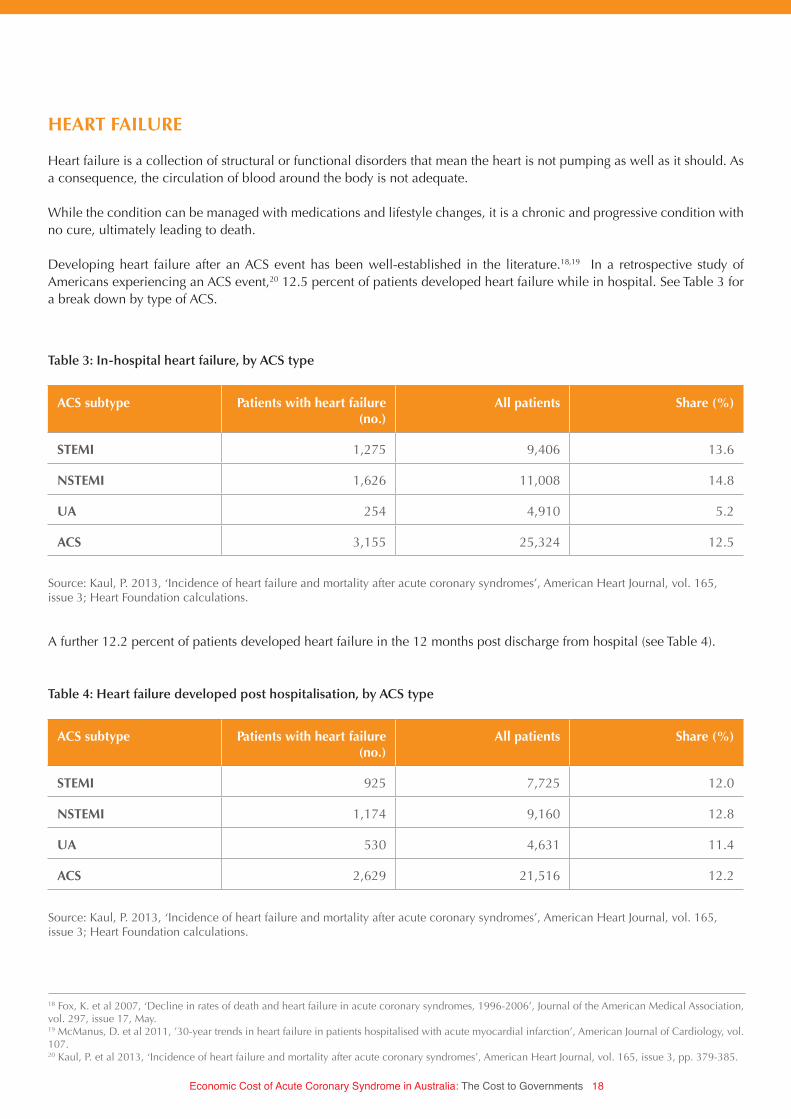
HEART FAILURE
Heart failure is a collection of structural or functional disorders that mean the heart is not pumping as well as it should. As a consequence, the circulation of blood around the body is not adequate.
While the condition can be managed with medications and lifestyle changes, it is a chronic and progressive condition with no cure, ultimately leading to death.
Developing heart failure after an ACS event has been well-established in the literature.18,19 In a retrospective study of Americans experiencing an ACS event,20 12.5 percent of patients developed heart failure while in hospital. See Table 3 for a break down by type of ACS.
ACS subtype Patients with heart failure (no.)
All patients Share (%)
STEMI 1,275 9,406 13.6
NSTEMI 1,626 11,008 14.8
UA 254 4,910 5.2
ACS 3,155 25,324 12.5
ACS subtype Patients with heart failure (no.)
All patients Share (%)
STEMI 925 7,725 12.0
NSTEMI 1,174 9,160 12.8
UA 530 4,631 11.4
ACS 2,629 21,516 12.2
Table 3: In-hospital heart failure, by ACS type
Table 4: Heart failure developed post hospitalisation, by ACS type
Source: Kaul, P. 2013, ‘Incidence of heart failure and mortality after acute coronary syndromes’, American Heart Journal, vol. 165, issue 3; Heart Foundation calculations.
Source: Kaul, P. 2013, ‘Incidence of heart failure and mortality after acute coronary syndromes’, American Heart Journal, vol. 165, issue 3; Heart Foundation calculations.
A further 12.2 percent of patients developed heart failure in the 12 months post discharge from hospital (see Table 4).
18 Fox, K. et al 2007, ‘Decline in rates of death and heart failure in acute coronary syndromes, 1996-2006’, Journal of the American Medical Association, vol. 297, issue 17, May. 19 McManus, D. et al 2011, ’30-year trends in heart failure in patients hospitalised with acute myocardial infarction’, American Journal of Cardiology, vol. 107.20 Kaul, P. et al 2013, ‘Incidence of heart failure and mortality after acute coronary syndromes’, American Heart Journal, vol. 165, issue 3, pp. 379-385.

Economic Cost of Acute Coronary Syndrome in Australia: The Cost to Governments 19
ACS subtype Deaths (no.) Total patients Death rate (%)
Heart failure
STEMI 429 2,200 19.5
NSTEMI 608 2,800 21.7
UA 74 784 9.4
ACS 1,111 5,784 19.2
No heart failure
STEMI 501 7,206 6.9
NSTEMI 461 8,208 5.6
UA 141 4,126 3.4
ACS 1,103 19,540 5.6
Table 6: Mortality rates for patients with and without heart failure by type of ACS
Combined, the cumulative risk of developing heart failure within the first year post an ACS event is 22.8 percent. This is highest for those patients that have experienced an AMI (i.e. STEMI or NSTEMI), as opposed to UA (see Table 5).
ACS subtype Patients with heart failure (no.)
All patients Share (%)
STEMI 2,200 9,406 23.4
NSTEMI 2,800 11,008 25.4
UA 784 4,910 16.0
ACS 5,784 25,324 22.8
Table 5: Cumulative risk of developing heart failure within 1 year of ACS event, by ACS type
Source: Kaul, P. 2013, ‘Incidence of heart failure and mortality after acute coronary syndromes’, American Heart Journal, vol. 165, issue 3; Heart Foundation calculations.
Source: Kaul, P. 2013, ‘Incidence of heart failure and mortality after acute coronary syndromes’, American Heart Journal, vol. 165, issue 3; Heart Foundation calculations.
HEART FAILURE AND MORTALITY RISK
Given the nature of heart failure, those that develop heart failure have a greater risk of death than those that do not develop heart failure. For those people who develop heart failure, an estimated 19.2 percent die within the first year. This compares to 5.6 percent for those people that do not develop heart failure (see Table 6).
The risk of dying is also highest for those patients with a diagnosis of AMI (see Table 6).
Economic Cost of Acute Coronary Syndrome in Australia: The Cost to Governments 20
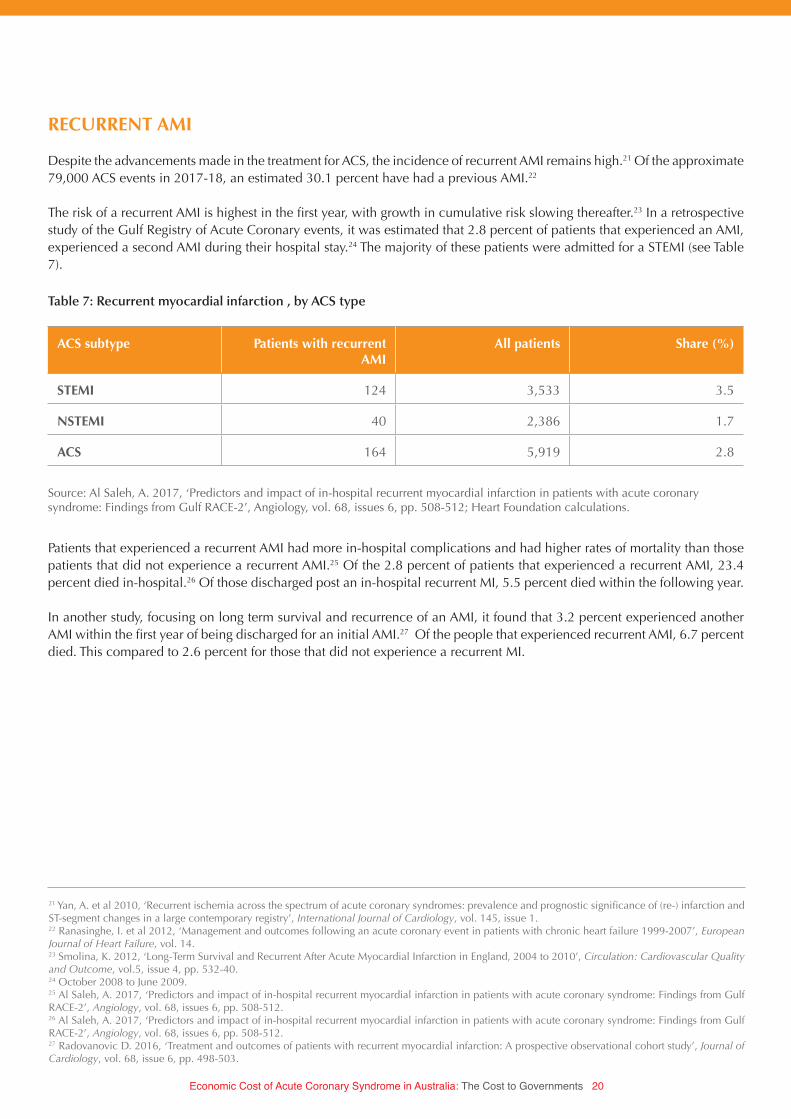
RECURRENT AMI
Despite the advancements made in the treatment for ACS, the incidence of recurrent AMI remains high.21 Of the approximate 79,000 ACS events in 2017-18, an estimated 30.1 percent have had a previous AMI.22
The risk of a recurrent AMI is highest in the first year, with growth in cumulative risk slowing thereafter.23 In a retrospective study of the Gulf Registry of Acute Coronary events, it was estimated that 2.8 percent of patients that experienced an AMI, experienced a second AMI during their hospital stay.24 The majority of these patients were admitted for a STEMI (see Table 7).
ACS subtype Patients with recurrent AMI
All patients Share (%)
STEMI 124 3,533 3.5
NSTEMI 40 2,386 1.7
ACS 164 5,919 2.8
Table 7: Recurrent myocardial infarction , by ACS type
Source: Al Saleh, A. 2017, ‘Predictors and impact of in-hospital recurrent myocardial infarction in patients with acute coronary syndrome: Findings from Gulf RACE-2’, Angiology, vol. 68, issues 6, pp. 508-512; Heart Foundation calculations.
Patients that experienced a recurrent AMI had more in-hospital complications and had higher rates of mortality than those patients that did not experience a recurrent AMI.25 Of the 2.8 percent of patients that experienced a recurrent AMI, 23.4 percent died in-hospital.26 Of those discharged post an in-hospital recurrent MI, 5.5 percent died within the following year.
In another study, focusing on long term survival and recurrence of an AMI, it found that 3.2 percent experienced another AMI within the first year of being discharged for an initial AMI.27 Of the people that experienced recurrent AMI, 6.7 percent died. This compared to 2.6 percent for those that did not experience a recurrent MI.
21 Yan, A. et al 2010, ‘Recurrent ischemia across the spectrum of acute coronary syndromes: prevalence and prognostic significance of (re-) infarction and ST-segment changes in a large contemporary registry’, International Journal of Cardiology, vol. 145, issue 1.22 Ranasinghe, I. et al 2012, ‘Management and outcomes following an acute coronary event in patients with chronic heart failure 1999-2007’, European Journal of Heart Failure, vol. 14. 23 Smolina, K. 2012, ‘Long-Term Survival and Recurrent After Acute Myocardial Infarction in England, 2004 to 2010’, Circulation: Cardiovascular Quality and Outcome, vol.5, issue 4, pp. 532-40.24 October 2008 to June 2009.25 Al Saleh, A. 2017, ‘Predictors and impact of in-hospital recurrent myocardial infarction in patients with acute coronary syndrome: Findings from Gulf RACE-2’, Angiology, vol. 68, issues 6, pp. 508-512.26 Al Saleh, A. 2017, ‘Predictors and impact of in-hospital recurrent myocardial infarction in patients with acute coronary syndrome: Findings from Gulf RACE-2’, Angiology, vol. 68, issues 6, pp. 508-512.27 Radovanovic D. 2016, ‘Treatment and outcomes of patients with recurrent myocardial infarction: A prospective observational cohort study’, Journal of Cardiology, vol. 68, issue 6, pp. 498-503.
Economic Cost of Acute Coronary Syndrome in Australia: The Cost to Governments 21
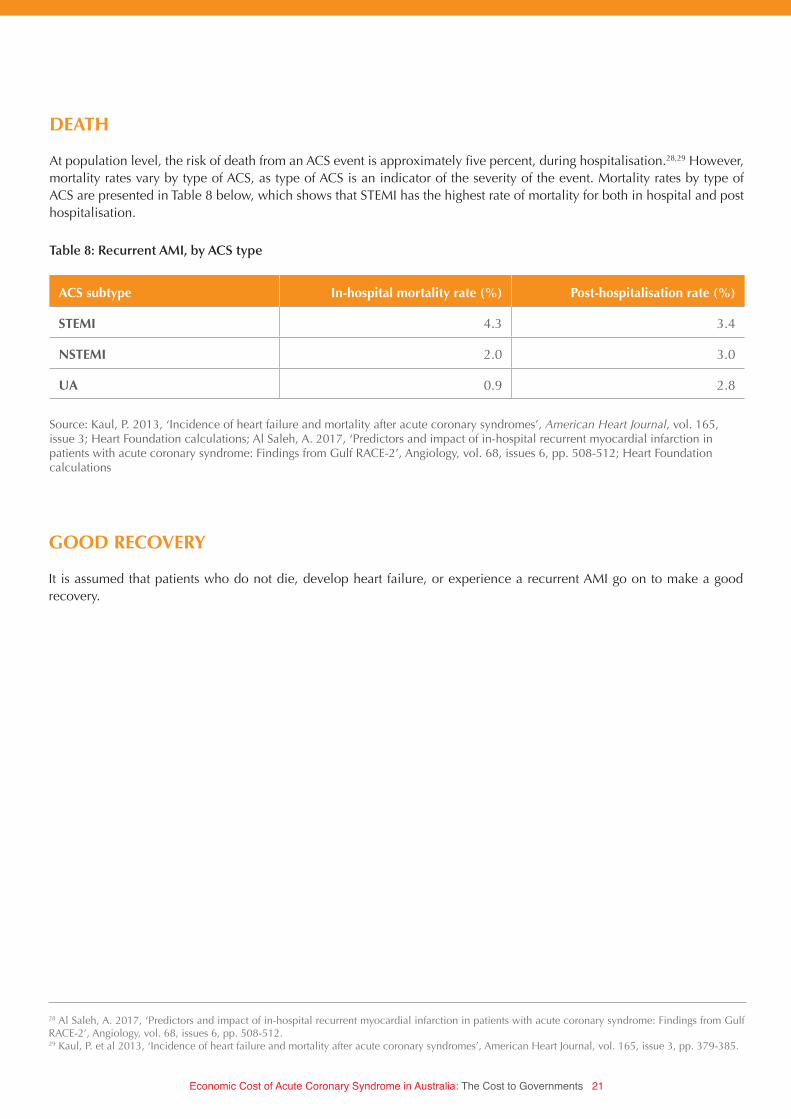
DEATH
At population level, the risk of death from an ACS event is approximately five percent, during hospitalisation.28,29 However, mortality rates vary by type of ACS, as type of ACS is an indicator of the severity of the event. Mortality rates by type of ACS are presented in Table 8 below, which shows that STEMI has the highest rate of mortality for both in hospital and post hospitalisation.
GOOD RECOVERY
It is assumed that patients who do not die, develop heart failure, or experience a recurrent AMI go on to make a good recovery.
ACS subtype In-hospital mortality rate (%) Post-hospitalisation rate (%)
STEMI 4.3 3.4
NSTEMI 2.0 3.0
UA 0.9 2.8
Table 8: Recurrent AMI, by ACS type
28 Al Saleh, A. 2017, ‘Predictors and impact of in-hospital recurrent myocardial infarction in patients with acute coronary syndrome: Findings from Gulf RACE-2’, Angiology, vol. 68, issues 6, pp. 508-512.29 Kaul, P. et al 2013, ‘Incidence of heart failure and mortality after acute coronary syndromes’, American Heart Journal, vol. 165, issue 3, pp. 379-385.
Source: Kaul, P. 2013, ‘Incidence of heart failure and mortality after acute coronary syndromes’, American Heart Journal, vol. 165, issue 3; Heart Foundation calculations; Al Saleh, A. 2017, ‘Predictors and impact of in-hospital recurrent myocardial infarction in patients with acute coronary syndrome: Findings from Gulf RACE-2’, Angiology, vol. 68, issues 6, pp. 508-512; Heart Foundation calculations
Economic Cost of Acute Coronary Syndrome in Australia: The Cost to Governments 22
PATHWAY TO OUTCOMES
As outlined by the literature, there are a range of different outcomes that patients experience. In addition, patients may take a different pathway to reach a given outcome, incurring different costs along that pathway. For example, a patient may develop heart failure in hospital, or may be discharged from hospital and develop it later.
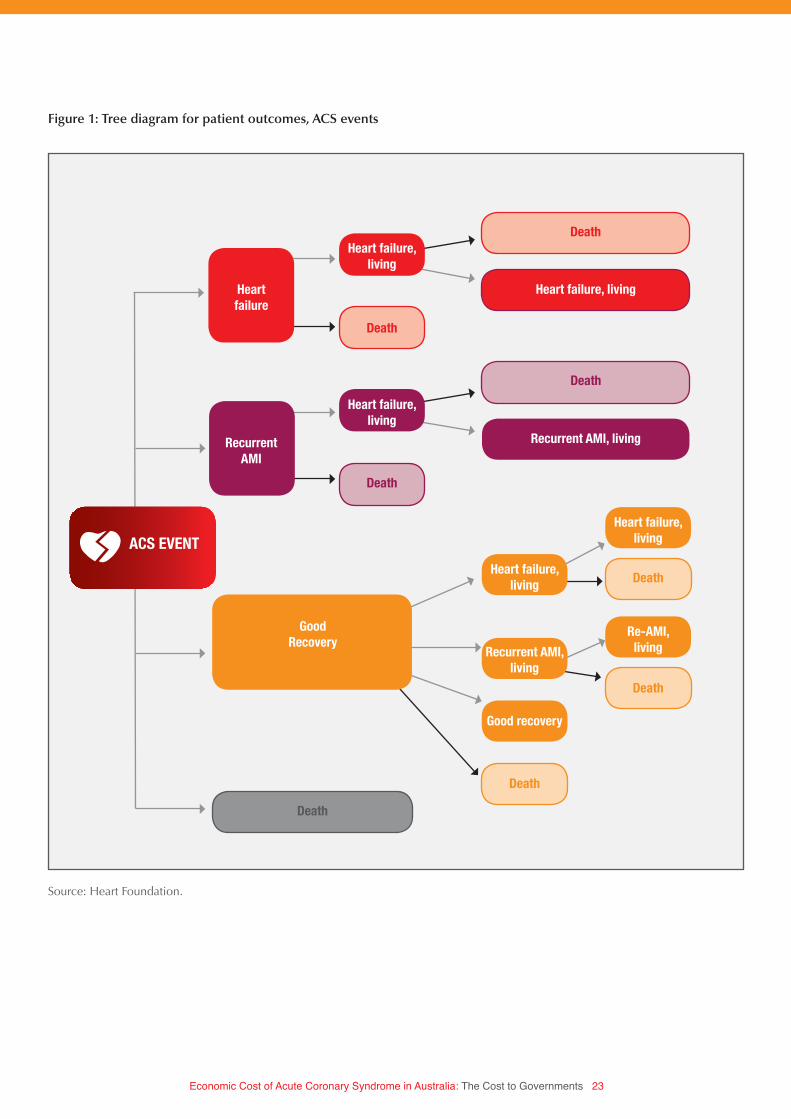
To capture the different pathway patients will take, a tree diagram has been constructed (see Figure 1). The root node of the tree diagram is an ACS event. From the root node, the lines reaching out reflect the branches of the root node. The branches connect to a node, which in Figure 1 reflects the possible patient outcomes at the end of their hospital stay.
From these internal nodes, new branches reach out to leaves, marking the end point of the branch, and reflecting the possible outcomes, one year post discharge from hospital.
The tree diagram shows that for each person that experiences an ACS event, they will have a possible outcome of death, heart failure, recurrent AMI, or a good recovery, measured at the end of their hospital stay, and 1-year post discharge.
A proportion of patients with heart failure and recurrent AMI will die during their hospital stay. This complicates the tree diagram, because there are different pathways patients can take to their death during their hospital stay. To capture this pathway, an additional node leads from the heart failure and recurrent AMI nodes to ‘living’ and ‘death’ nodes.
Economic Cost of Acute Coronary Syndrome in Australia: The Cost to Governments 23
Heart failure
Heart failure,living
Death
Death
Good Recovery
Heart failure, living
Recurrent AMI, living
Death
Heart failure,living
Death
Death
Heart failure,living
Heart failure,living
Re-AMI,living
Death
Death
Recurrent AMI,living
Good recovery
Death
Recurrent AMI
ACS EVENT
Figure 1: Tree diagram for patient outcomes, ACS events
Source: Heart Foundation.
Economic Cost of Acute Coronary Syndrome in Australia: The Cost to Governments 24
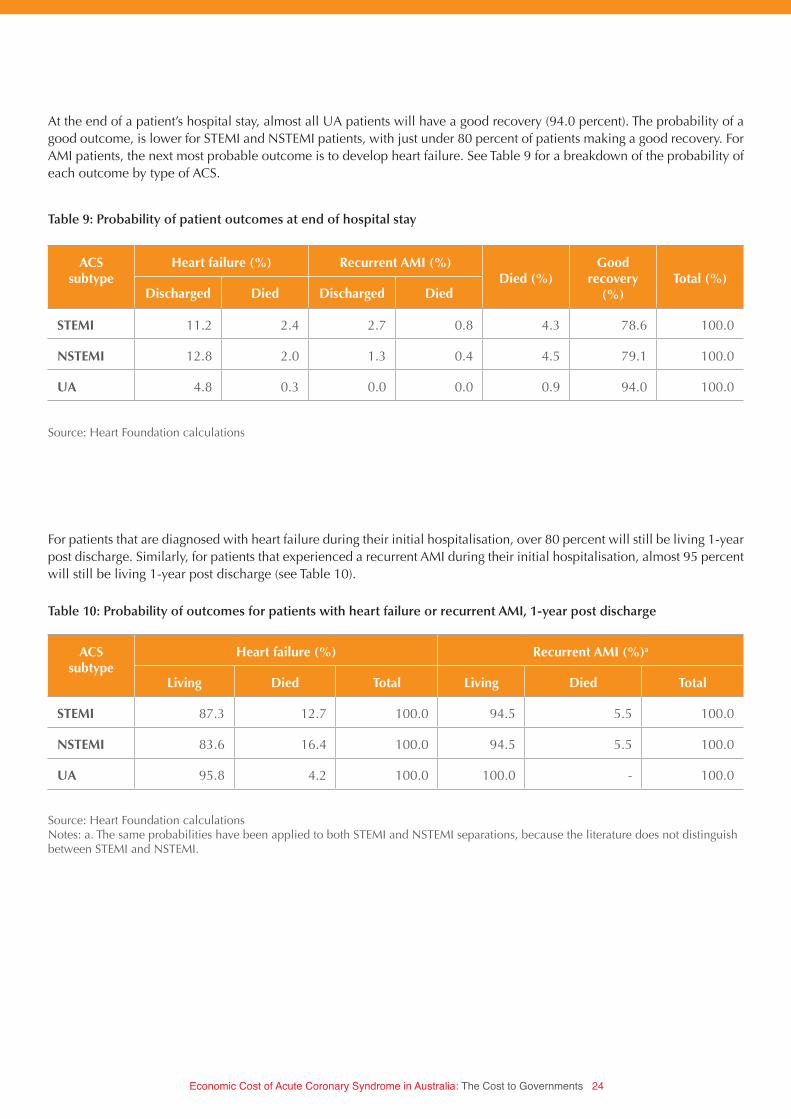
At the end of a patient’s hospital stay, almost all UA patients will have a good recovery (94.0 percent). The probability of a good outcome, is lower for STEMI and NSTEMI patients, with just under 80 percent of patients making a good recovery. For AMI patients, the next most probable outcome is to develop heart failure. See Table 9 for a breakdown of the probability of each outcome by type of ACS.
ACS subtype
Heart failure (%) Recurrent AMI (%)Died (%)
Good recovery
(%)Total (%)
Discharged Died Discharged Died
STEMI 11.2 2.4 2.7 0.8 4.3 78.6 100.0
NSTEMI 12.8 2.0 1.3 0.4 4.5 79.1 100.0
UA 4.8 0.3 0.0 0.0 0.9 94.0 100.0
ACS subtype
Heart failure (%) Recurrent AMI (%)a
Living Died Total Living Died Total
STEMI 87.3 12.7 100.0 94.5 5.5 100.0
NSTEMI 83.6 16.4 100.0 94.5 5.5 100.0
UA 95.8 4.2 100.0 100.0 - 100.0
Table 9: Probability of patient outcomes at end of hospital stay
Table 10: Probability of outcomes for patients with heart failure or recurrent AMI, 1-year post discharge
Source: Heart Foundation calculations
For patients that are diagnosed with heart failure during their initial hospitalisation, over 80 percent will still be living 1-year post discharge. Similarly, for patients that experienced a recurrent AMI during their initial hospitalisation, almost 95 percent will still be living 1-year post discharge (see Table 10).
Source: Heart Foundation calculationsNotes: a. The same probabilities have been applied to both STEMI and NSTEMI separations, because the literature does not distinguish between STEMI and NSTEMI.

Economic Cost of Acute Coronary Syndrome in Australia: The Cost to Governments 25
For patients that had a good recovery from the initial ACS event, they continue to be at risk of developing heart failure, experiencing another MI, or death. The probability of each outcome is presented in Table 11.
ACS subtype
Heart failure (%) Recurrent AMI (%)Died (%)
Good recovery
(%)Total (%)
Discharged Died Discharged Died
STEMI 11.0 1.0 3.0 0.2 3.4 81.5 100.0
NSTEMI 11.1 1.7 3.0 0.2 3.0 81.0 100.0
UA 10.4 1.0 0.0 0.0 2.8 85.7 100.0
Table 11: Probability of outcomes for patients with good initial recovery, 1-year post discharge
Source: Heart Foundation calculations
The probabilities presented in Table 9, Table 10, and Table 11, are applied to the number of ACS events to calculate how many people experience each outcome.
Economic Cost of Acute Coronary Syndrome in Australia: The Cost to Governments 26
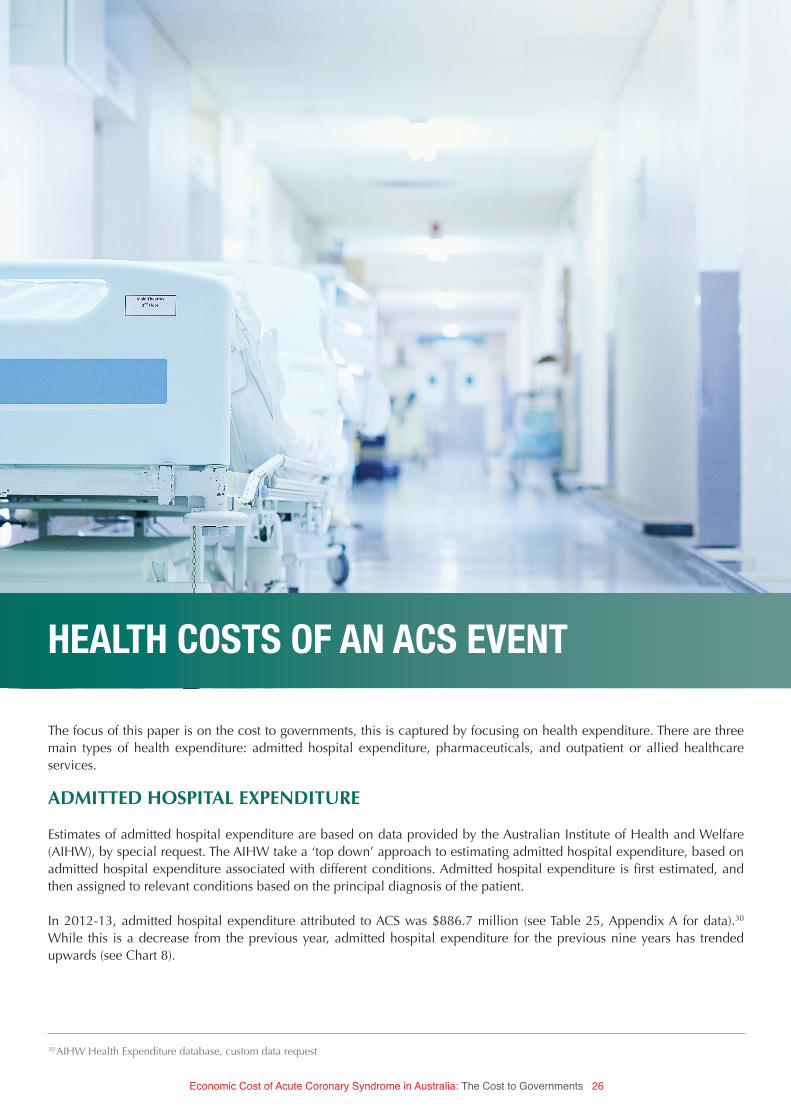
HEALTH COSTS OF AN ACS EVENT
The focus of this paper is on the cost to governments, this is captured by focusing on health expenditure. There are three main types of health expenditure: admitted hospital expenditure, pharmaceuticals, and outpatient or allied healthcare services.
ADMITTED HOSPITAL EXPENDITURE
Estimates of admitted hospital expenditure are based on data provided by the Australian Institute of Health and Welfare (AIHW), by special request. The AIHW take a ‘top down’ approach to estimating admitted hospital expenditure, based on admitted hospital expenditure associated with different conditions. Admitted hospital expenditure is first estimated, and then assigned to relevant conditions based on the principal diagnosis of the patient.
In 2012-13, admitted hospital expenditure attributed to ACS was $886.7 million (see Table 25, Appendix A for data).30 While this is a decrease from the previous year, admitted hospital expenditure for the previous nine years has trended upwards (see Chart 8).
30 AIHW Health Expenditure database, custom data request
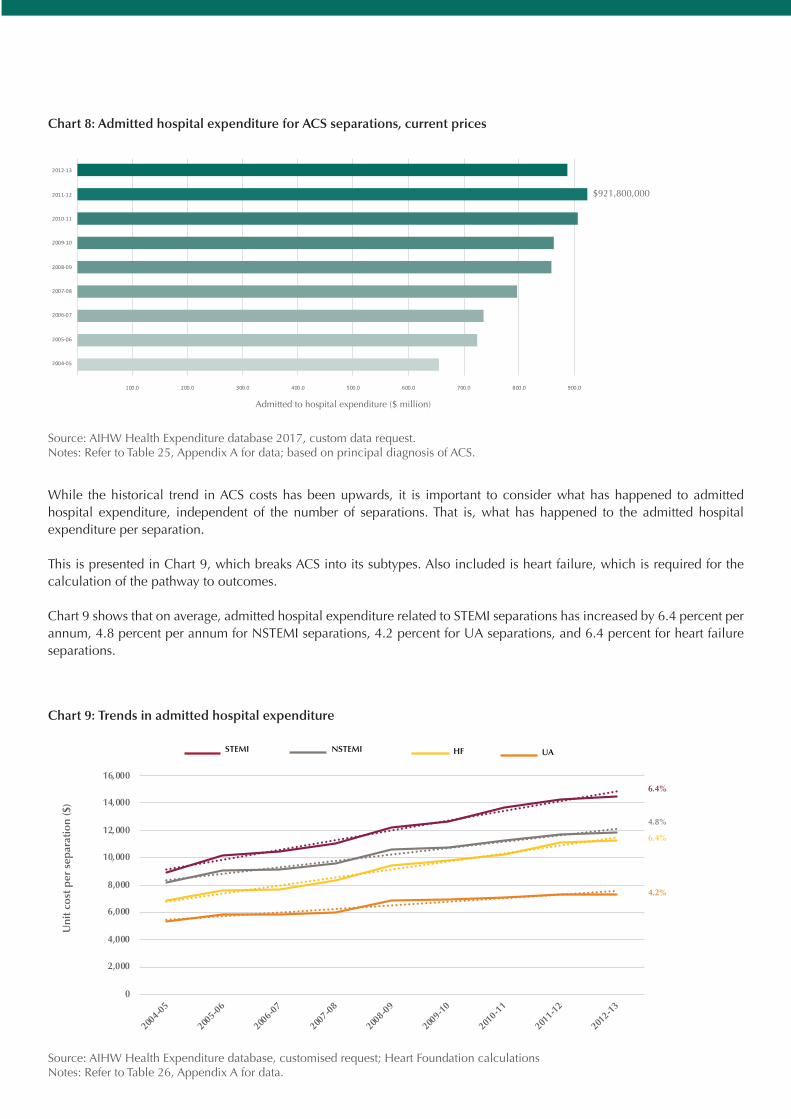
Source: AIHW Health Expenditure database 2017, custom data request.Notes: Refer to Table 25, Appendix A for data; based on principal diagnosis of ACS.
Admitted to hospital expenditure ($ million)
$921,800,000
Chart 8: Admitted hospital expenditure for ACS separations, current prices
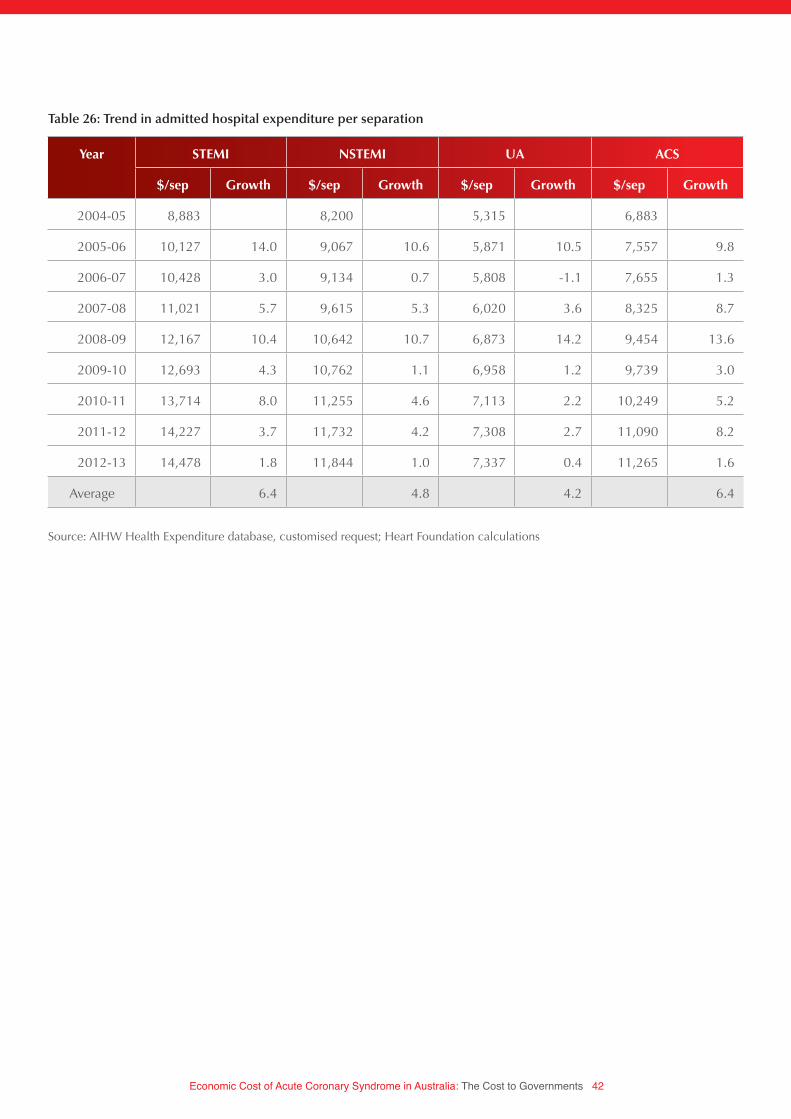
While the historical trend in ACS costs has been upwards, it is important to consider what has happened to admitted hospital expenditure, independent of the number of separations. That is, what has happened to the admitted hospital expenditure per separation.
This is presented in Chart 9, which breaks ACS into its subtypes. Also included is heart failure, which is required for the calculation of the pathway to outcomes.
Chart 9 shows that on average, admitted hospital expenditure related to STEMI separations has increased by 6.4 percent per annum, 4.8 percent per annum for NSTEMI separations, 4.2 percent for UA separations, and 6.4 percent for heart failure separations.
0
2,000
4,000
6,000
8,000
10,000
12,000
14,000
16,000
2004-0
5
2005-0
6
2006-0
7
2007-0
8
2008-0
9
2009-1
0
2010-1
1
2011-1
2
2012-1
3
Uni
t co
st p
er s
epar
atio
n ($
)
HF UANSTEMISTEMI
6.4%
6.4%
4.8%
4.2%
Chart 9: Trends in admitted hospital expenditure
Source: AIHW Health Expenditure database, customised request; Heart Foundation calculationsNotes: Refer to Table 26, Appendix A for data.
- 100.0 200.0 300.0 400.0 500.0 600.0 700.0 800.0 900.0 1,000.0
2004-05
2005-06
2006-07
2007-08
2008-09
2009-10
2010-11
2011-12
2012-13
Chart Title
- 100.0 200.0 300.0 400.0 500.0 600.0 700.0 800.0 900.0 1,000.0
2004-05
2005-06
2006-07
2007-08
2008-09
2009-10
2010-11
2011-12
2012-13
Chart Title

Economic Cost of Acute Coronary Syndrome in Australia: The Cost to Governments 28
These growth rates have been applied to the unit cost per separation to estimate the admitted hospital expenditure per separation for 2017-18 (see Table 12). This shows that the STEMI is the most expensive type of ACS event, followed by NSTEMI and UA. This is to be expected, as the most serious event, typically requires more intensive and expensive interventions.
STEMI NSTEMI UA Heart failure
15-44 18,480 12,448 7,025 28,038
45-64 19,925 14,823 8,511 20,697
65+ 19,736 15,176 9,479 14,069
Average 19,717 14,952 9,024 15,298
Table 12: Admitted hospital expenditure per separation by principal diagnosis and age group, 2017-18
Source: AIHW Health Expenditure database, custom data request; Heart Foundation calculations
NON-ADMITTED HEALTH EXPENDITURE
As outlined earlier, there are three components of health expenditure: admitted hospital, out of hospital, and prescription pharmaceuticals.
Data on the non-admitted components of health expenditure is taken from a 2008-09 study of the health expenditure on cardiovascular diseases.31 This study shows that the largest component of health expenditure is admitted hospital care, with 74.8 percent, followed by prescription pharmaceuticals and out of hospital care (see Table 13).
Type of health expenditure Expenditure ($ million) Share of expenditure (%)
Hospital admitted 1,517 74.8
Out of hospital 201 9.9
Prescription pharmaceuticals 311 15.3
Total 2,029 100.0
Table 13: Health expenditure by type, coronary heart disease, 2008-09
Source: AIHW 2014, ‘Heath-care expenditure on cardiovascular diseases, 2008-09’, cat. No. CVD 65; Heart Foundation calculations
31 AIHW 2014, ‘Heath-care expenditure on cardiovascular diseases, 2008-09’, cat. No. CVD 65.
Economic Cost of Acute Coronary Syndrome in Australia: The Cost to Governments 29
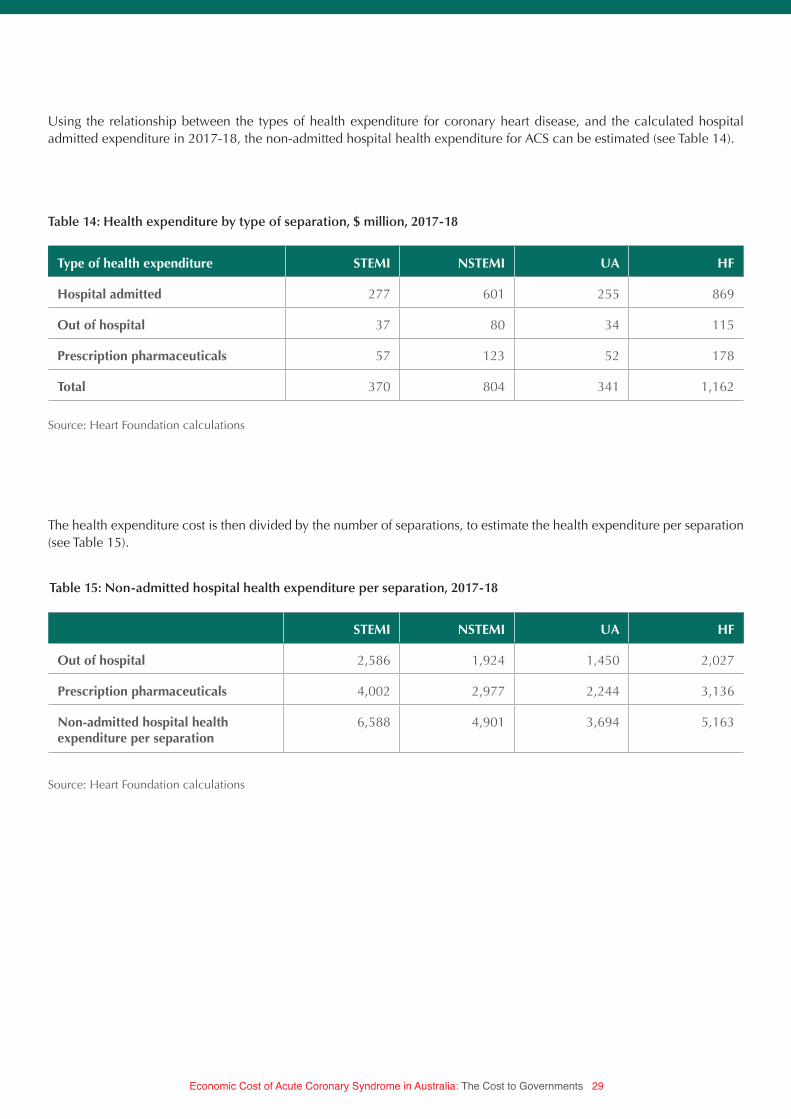
The health expenditure cost is then divided by the number of separations, to estimate the health expenditure per separation (see Table 15).
Using the relationship between the types of health expenditure for coronary heart disease, and the calculated hospital admitted expenditure in 2017-18, the non-admitted hospital health expenditure for ACS can be estimated (see Table 14).
Type of health expenditure STEMI NSTEMI UA HF
Hospital admitted 277 601 255 869
Out of hospital 37 80 34 115
Prescription pharmaceuticals 57 123 52 178
Total 370 804 341 1,162
STEMI NSTEMI UA HF
Out of hospital 2,586 1,924 1,450 2,027
Prescription pharmaceuticals 4,002 2,977 2,244 3,136
Non-admitted hospital health expenditure per separation
6,588 4,901 3,694 5,163
Table 14: Health expenditure by type of separation, $ million, 2017-18
Table 15: Non-admitted hospital health expenditure per separation, 2017-18
Source: Heart Foundation calculations
Source: Heart Foundation calculations

Economic Cost of Acute Coronary Syndrome in Australia: The Cost to Governments 30
UNIT COST OF HEALTH EXPENDITURE PER SEPARATION
The unit cost of health expenditure per separation is calculated by summing the admitted hospital and non admitted components of health expenditure (see Table 16).
STEMI NSTEMI UA HF
15-44 25,068 17,349 10,718 33,202
45-64 26,513 19,724 12,205 25,860
65+ 26,324 20,077 13,172 19,232
Average 26,305 19,853 12,718 20,461
Table 16: Health expenditure by type of separation, 2017-18
Source: Heart Foundation calculations.
Economic Cost of Acute Coronary Syndrome in Australia: The Cost to Governments 31
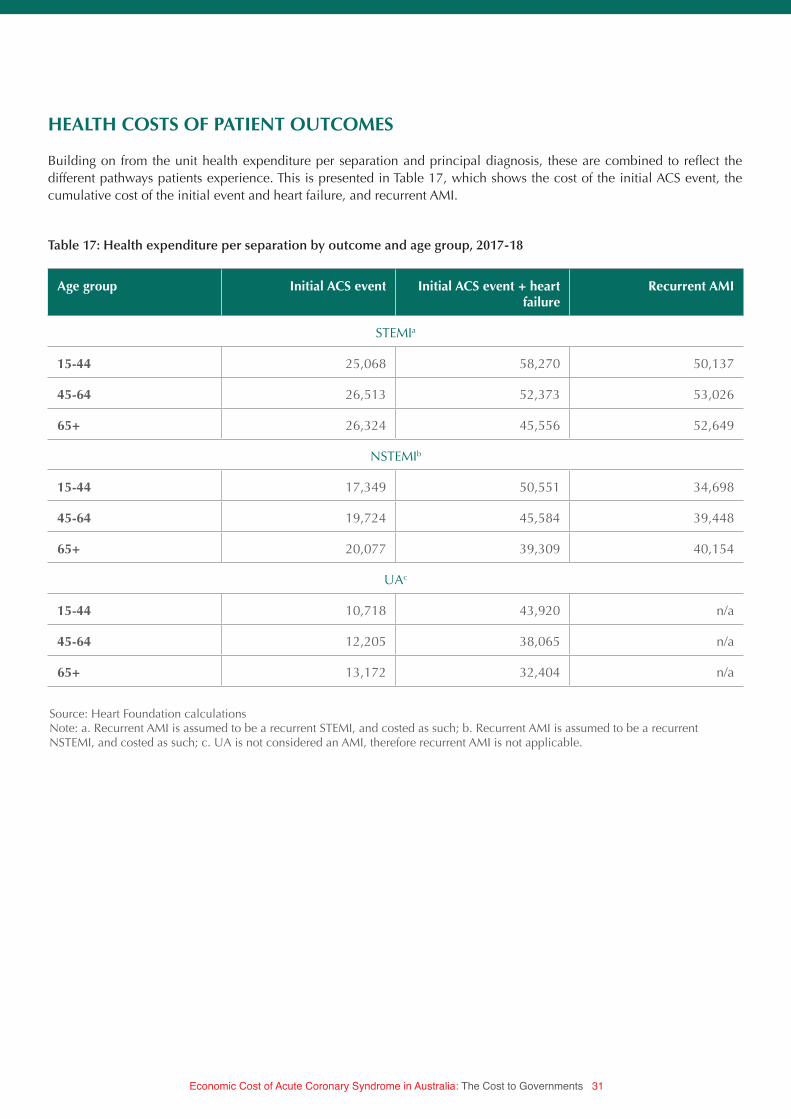
Source: Heart Foundation calculationsNote: a. Recurrent AMI is assumed to be a recurrent STEMI, and costed as such; b. Recurrent AMI is assumed to be a recurrent NSTEMI, and costed as such; c. UA is not considered an AMI, therefore recurrent AMI is not applicable.
HEALTH COSTS OF PATIENT OUTCOMES
Building on from the unit health expenditure per separation and principal diagnosis, these are combined to reflect the different pathways patients experience. This is presented in Table 17, which shows the cost of the initial ACS event, the cumulative cost of the initial event and heart failure, and recurrent AMI.
Age group Initial ACS event Initial ACS event + heart failure
Recurrent AMI
STEMIa
15-44 25,068 58,270 50,137
45-64 26,513 52,373 53,026
65+ 26,324 45,556 52,649
NSTEMIb
15-44 17,349 50,551 34,698
45-64 19,724 45,584 39,448
65+ 20,077 39,309 40,154
UAc
15-44 10,718 43,920 n/a
45-64 12,205 38,065 n/a
65+ 13,172 32,404 n/a
Table 17: Health expenditure per separation by outcome and age group, 2017-18
Economic Cost of Acute Coronary Syndrome in Australia: The Cost to Governments 32
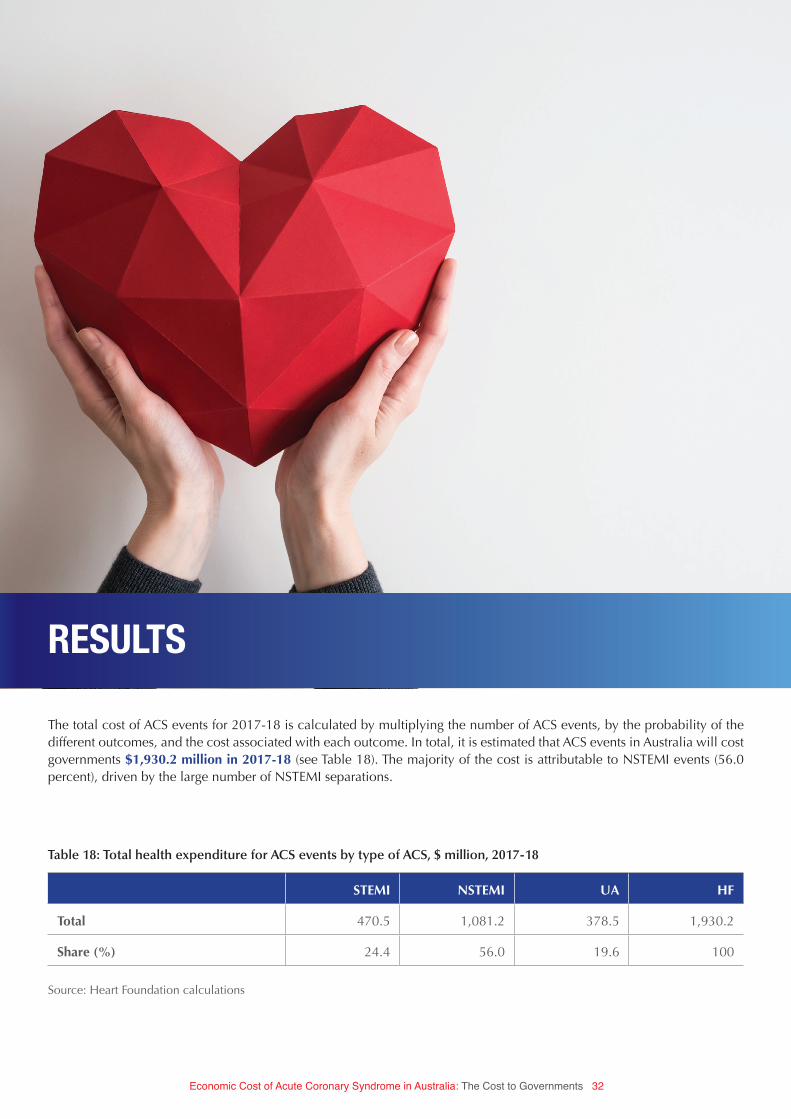
RESULTS
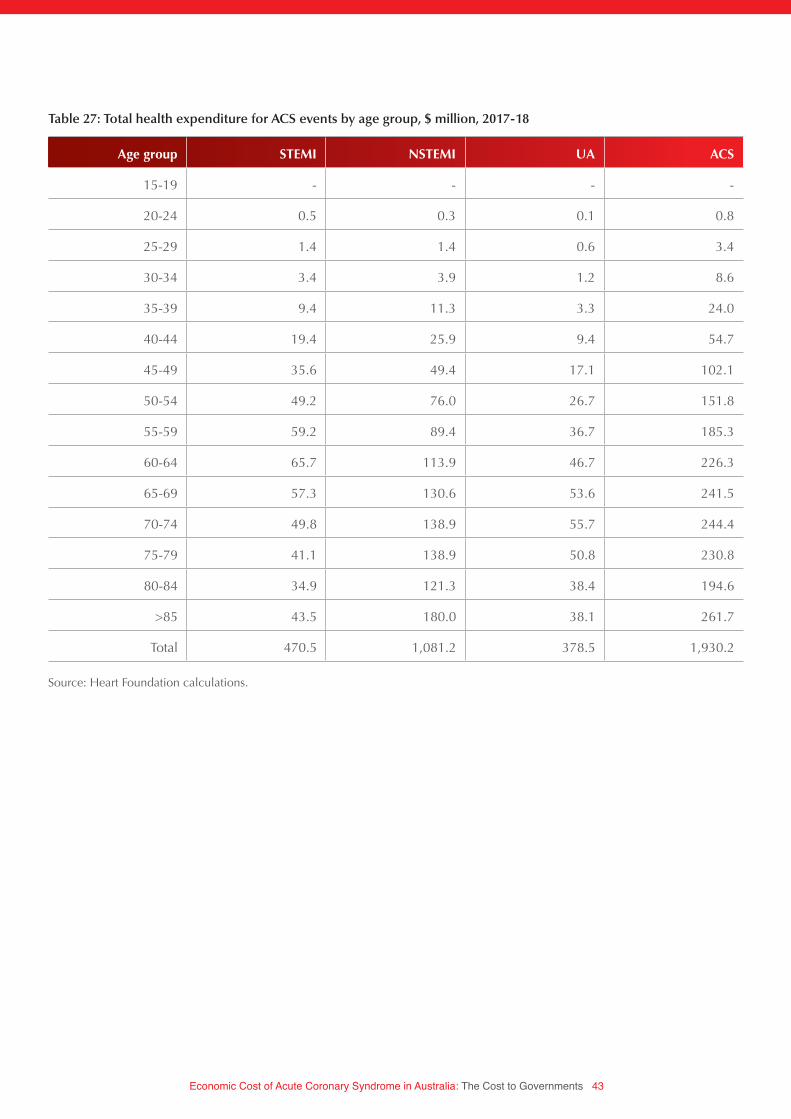
The total cost of ACS events for 2017-18 is calculated by multiplying the number of ACS events, by the probability of the different outcomes, and the cost associated with each outcome. In total, it is estimated that ACS events in Australia will cost governments $1,930.2 million in 2017-18 (see Table 18). The majority of the cost is attributable to NSTEMI events (56.0 percent), driven by the large number of NSTEMI separations.
STEMI NSTEMI UA HF
Total 470.5 1,081.2 378.5 1,930.2
Share (%) 24.4 56.0 19.6 100
Table 18: Total health expenditure for ACS events by type of ACS, $ million, 2017-18
Source: Heart Foundation calculations
Economic Cost of Acute Coronary Syndrome in Australia: The Cost to Governments 33
STEMI NSTEMI UA ACS
Initial event ($ million) 372.9 822.7 296.9 1,492.5
Subsequent event ($ million)
97.5 258.5 81.6 437.6
Total ($ million) 470.5 1,081.2 378.5 1,930.2
Initial event (%) 79.3 76.1 78.4 77.3
Subsequent event (%) 20.7 23.9 21.6 22.7
Total (%) 100.0 100.0 100.0 100.0
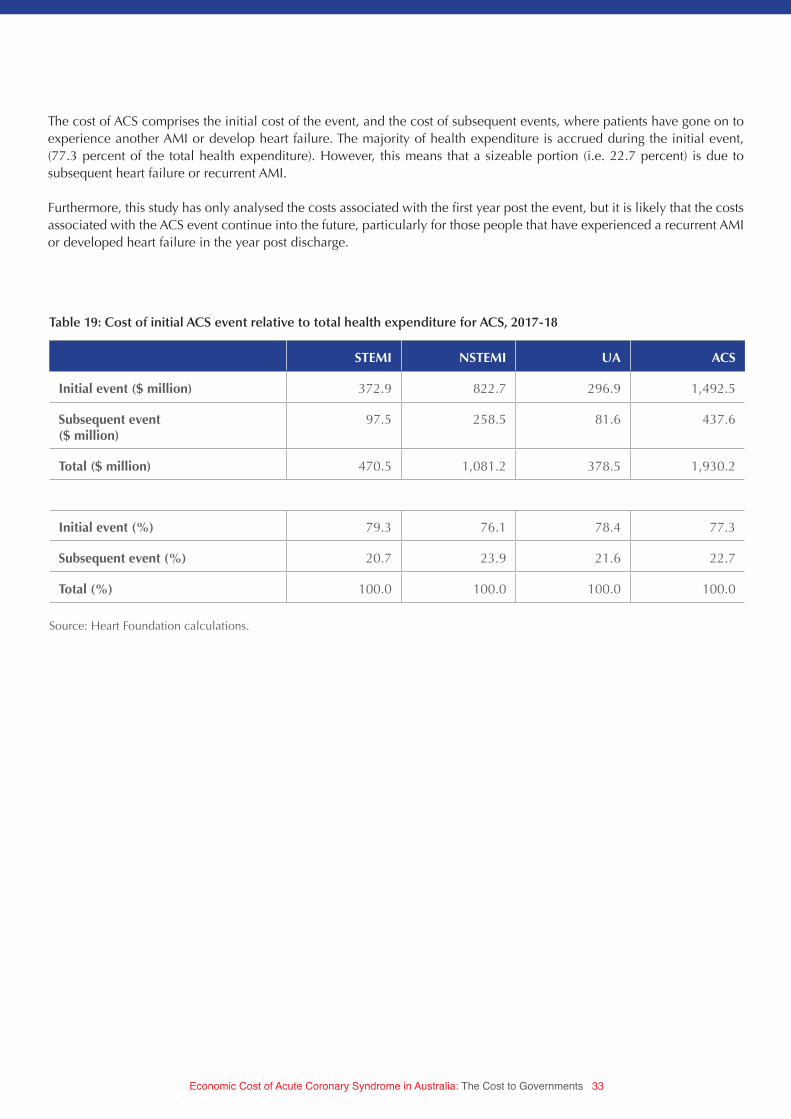
Table 19: Cost of initial ACS event relative to total health expenditure for ACS, 2017-18
The cost of ACS comprises the initial cost of the event, and the cost of subsequent events, where patients have gone on to experience another AMI or develop heart failure. The majority of health expenditure is accrued during the initial event, (77.3 percent of the total health expenditure). However, this means that a sizeable portion (i.e. 22.7 percent) is due to subsequent heart failure or recurrent AMI.
Furthermore, this study has only analysed the costs associated with the first year post the event, but it is likely that the costs associated with the ACS event continue into the future, particularly for those people that have experienced a recurrent AMI or developed heart failure in the year post discharge.
Source: Heart Foundation calculations.

Economic Cost of Acute Coronary Syndrome in Australia: The Cost to Governments 34
As expected, the total health expenditure increases in age, in part driven by the correlation between age and separations, and in part by the higher cost per separation for older age groups (with the exception of STEMI separations). This is illustrated in Chart 10, which shows that those older than 85 years have the largest health expenditure for ACS events.
0
50
100
150
200
250
15-19
20-24
25-29
30-34
35-39
40-44
45-49
50-54
55-59
60-64
65-69
70-74
75-79
80-84
>85
Hea
lth
exp
end
itur
e, $
mill
ion
STEMI NSTEMI UA
Chart 10: Total health expenditure for ACS events, by age group, $ million, 2017-18
Source: Heart Foundation calculations.Notes: Refer to Table 27, Appendix A for data.

Economic Cost of Acute Coronary Syndrome in Australia: The Cost to Governments 35
RECOMMENDATIONS
To reduce the economic and social impact of the burden from ACS, the following interventions are critical in reducing the number of heart attacks and strokes, as well as improving recovery and ongoing management.
HEART AND STROKE ACTION PLAN
While prevention, treatment and ongoing management of people with cardiovascular disease in Australia is generally good, and sometimes very good, there are still some alarming gaps. There are gaps in our approach to prevention, early detection, treatment, ongoing management and research.
There are, for example, 1.4m Australians at high risk of having a heart attack or stroke within the next five years, yet nearly one million of these are not getting the required medication. These gaps cost lives and money.
The recent development of the National Strategic Framework for Chronic Conditions provides an opportunity for the Government to ensure it has a comprehensive and integrated approach to the major chronic disease groups.
Economic Cost of Acute Coronary Syndrome in Australia: The Cost to Governments 36
While there are strategies and action plans to address a number of chronic diseases, such as diabetes and asthma, and key risk factors, such as tobacco and alcohol control, there remains no national action plan for heart attacks and stroke. This is a conspicuous gap in Australia’s overall approach to chronic disease. From a government perspective, a well-targeted heart and stroke action plan has the potential to curb future costs as evidenced in this report.
A heart and stroke action plan should focus on:• preventing premature death• improving quality of life• cutting avoidable hospital admissions, and • reducing the immense economic and social burden cardiovascular disease imposes on the health system and the
community.
DETECT AND MANAGE THOSE AT RISK
More than 100,000 Australians have a heart attack or stroke each year, taking an immense social and economic toll on the community. And yet, much of this toll is avoidable if Australians at high risk are detected early and are then well-managed.
Disturbingly, over 1.4 million Australians aged 45 to 74 have a high risk of a heart attack or stroke within the next five years, with most not receiving the recommended treatment.
Thousands of heart attacks and strokes could be averted if people aged 45–74 had an absolute cardiovascular risk assessment (heart health check) and those at high risk were well managed according to existing guidelines.
Undertaking heart health checks and ensuring ongoing management of patients at high risk should be incorporated into the proposed Quality Improvement Incentive payment. A full heart health check allows therapy to be targeted to those who would most benefit. Not only is this god clinical practice, it makes sound economic sense.
SUPPORT A RISK AND WARNING SIGNS CAMPAIGN
With heart disease being the leading cause of death in Australia, it is disturbing that very few Australians are aware of the risk factors for heart attacks, notably high blood pressure and high cholesterol. Whilst awareness of lifestyle risk factors such as poor diet, being physically inactive or smoking is high, fewer than 10% of Australians are aware that having high and unmanaged blood pressure and/or high cholesterol increases the risk of having a heart event.
The lack of awareness means emphasis placed on effectively managing high blood pressure and/or high cholesterol takes a back seat behind focusing on dietary changes and exercise. A public campaign focused not only on increasing awareness but knowledge levels of how to reduce the impact of risk factors would ensure Australians devoted their time and attention to the leading risk factors.
Comparable to the lack of knowledge of risk factors, few Australians are aware of the variety of signs and symptoms of a heart attack. Whilst most Australians can connect chest pain and shortness of breath with a heart attack, few are aware that other signs such as neck pain, nausea, vomiting and jaw pain are also warning signs of a heart attack.
The lack of awareness leads to delayed action in responding to a heart attack, placing most at risk of poor recovery, unnecessary damage to heart muscle and even premature death. The Heart Foundation’s Warning Signs campaign between 2009 and 2012 demonstrated that a public awareness campaign aimed at increasing knowledge of signs of a heart attack can and does leads to an increase in people taking action earlier, resulting in the reduction of significant heart muscle damage and enhancing recovery and quality of life.
Economic Cost of Acute Coronary Syndrome in Australia: The Cost to Governments 37
INCREASED PARTICIPATION IN CARDIAC REHABILITATION PROGRAM
Cardiac rehabilitation can reduce mortality, improve cardiac risk factor profile and reduce readmissions; yet uptake remains low. For heart attack survivors, cardiac rehabilitation is an important step in their journey of care. While there is strong evidence that attending a program of cardiac rehabilitation can dramatically reduce the chance of a further cardiac event, attendance rates for cardiac rehabilitation programs are as low as 30%.
A Victorian study reported a 25% increase in five-year survival rates among patients who attended cardiac rehabilitation. Other recent research also indicated that $227m worth of economic and social benefits could be made from increased cardiac rehabilitation participation over a 10-year period in Victoria alone.32
Getting more eligible patients to participate in cardiac rehabilitation should, therefore, be a high priority for all Australian governments. Given that more than one-third of hospital admissions for heart attacks are repeat events, this is particularly true.
Greater uptake of cardiac rehabilitation can reduce the burden of disease, directly translating to benefits for society and the economy.
SECONDARY PREVENTION CLINICS
Cardiac rehabilitation is crucial in the initial recovery post heart attack or stroke, however, the ongoing management to prevent secondary events is just as critical.
With one in three heart attacks and strokes being repeat events, the establishment of multidisciplinary clinics and/or programs provide the capacity for patients to receive ongoing medical and lifestyle advice, treatment and care.
Studies have shown having secondary prevention clinics/programs lead to significant reduction in hospital readmissions within the first twelve months, a period of critical importance as survivors from heart attacks and strokes are at considerable risk of having a repeat event within this period.
32 De Gruyter E, Ford G, Stavreski B 2015, ‘Economic and Social Impact of Increasing Uptake of Cardiac Rehabilitation Services – A Cost Benefit Analysis’; Heart, Lung and Circulation; vol.26, issue 2, p. 175-183

Economic Cost of Acute Coronary Syndrome in Australia: The Cost to Governments 38
APPENDIX: DATA TABLES
UA STEMI NSTEMI AMIa ACS
2005-06 43,087 16,582 33,246 49,828 92,915
2006-07 41,135 16,552 35,425 51,977 93,112
2007-08 38,795 16,393 39,604 55,997 94,792
2008-09 35,428 16,292 39,138 55,430 90,858
2009-10 34,047 15,438 39,781 55,219 89,266
2010-11 32,176 15,309 41,425 56,734 88,910
2011-12 30,708 14,429 41,945 56,374 87,082
2012-13 28,238 14,030 40,220 54,250 82,488
2013-14 25,878 13,690 40,616 54,306 80,184
2014-15 22,707 13,946 40,354 54,300 77,007
Change (%) from 05-06 to 14-15
-47 -16 21 9 -17
Table 20: ACS separations by type of ACS, 2005-06 to 2014-15
Source: AIHW 2017, National Hospital Morbidity DatabaseNotes: a. AMI equals the sum of STEMI and NSTEMI separations
Economic Cost of Acute Coronary Syndrome in Australia: The Cost to Governments 39
Age group UA STEMI NSTEMI ACS
15-19 1 - 1 2
20-24 4 14 13 31
25-29 41 41 55 137
30-34 76 98 145 319
35-39 203 268 417 888
40-44 636 612 1,065 2,313
45-49 1,022 1,019 1,781 3,822
50-54 1,743 1,542 3,003 6,288
55-59 2,231 1,726 3,285 7,242
60-64 2,836 1,914 4,184 8,934
65-69 3,293 1,770 5,072 10,135
70-74 3,067 1,377 4,827 9,271
75-79 2,946 1,199 5,089 9,234
80-84 2,352 1,072 4,689 8,113
>85 2,256 1,294 6,728 10,278
Total 22,707 13,946 40,354 77,007
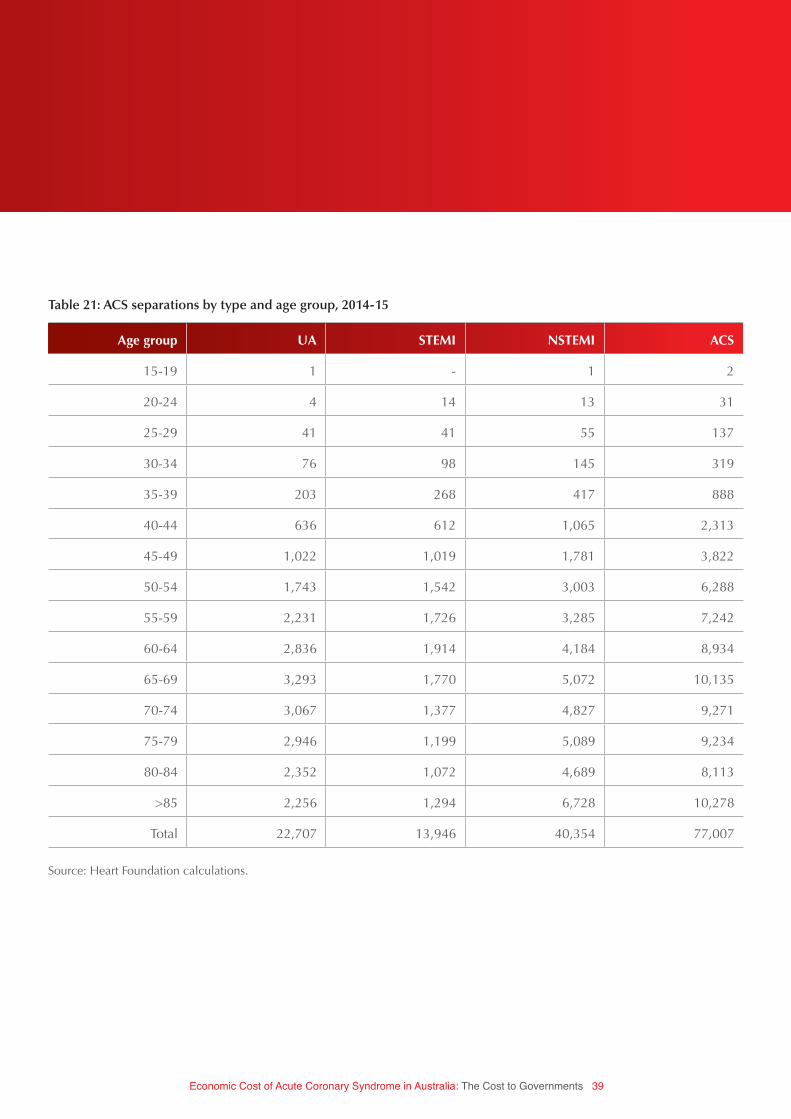
Table 21: ACS separations by type and age group, 2014-15
Source: Heart Foundation calculations.

Economic Cost of Acute Coronary Syndrome in Australia: The Cost to Governments 40
Male separations per 100,000 Female separations per 100,000
15-19 - -
20-24 3 1
25-29 11 5
30-34 29 8
35-39 86 28
40-44 202 75
45-49 367 129
50-54 613 197
55-59 770 251
60-64 1,054 369
65-69 1,311 508
70-74 1,547 737
75-79 2,015 1,061
80-84 2,366 1,378
>85 2,879 1,907
Male separations per 100,000 Female separations per 100,000
2005-06 2,679 1,686
2006-07 2,672 1,686
2007-08 2,634 1,663
2008-09 2,551 1,631
2009-10 2,524 1,620
2010-11 2,609 1,669
2011-12 2,611 1,668
2012-13 2,514 1,615
2013-14 2,287 1,421
2014-15 2,272 1,415
Table 22: Age standardised ACS separations, 2014-15
Table 23: Age standardised CVD separations, 2005-06 to 2014-15
Source: Heart Foundation calculations.
Source: AIHW 2017, Data tables: Cardiovascular disease 2016, available: https://www.aihw.gov.au/reports/heart-stroke-vascular-dis-ease/cardiovascular-health-compendium/data

Economic Cost of Acute Coronary Syndrome in Australia: The Cost to Governments 41
Year ACS ($ million)
2004-05 652.9
2005-06 722.4
2006-07 735.1
2007-08 795.0
2008-09 858.2
2009-10 861.0
2010-11 905.1
2011-12 921.8
2012-13 886.7
Table 25: Health expenditure for ACS, current year prices
Age group UA STEMI NSTEMI ACS
15-19 1 - 1 2
20-24 4 13 12 30
25-29 40 40 54 134
30-34 78 100 148 326
35-39 209 275 428 912
40-44 588 566 985 2,139
45-49 1,050 1,046 1,829 3,925
50-54 1,634 1,445 2,814 5,893
55-59 2,249 1,740 3,312 7,301
60-64 2,860 1,930 4,219 9,009
65-69 3,299 1,773 5,081 10,152
70-74 3,433 1,541 5,403 10,377
75-79 3,127 1,273 5,403 9,803
80-84 2,367 1,079 4,718 8,163
>85 2,348 1,347 7,003 10,698
Total 23,286 14,170 41,411 78,866
Table 24: ACS separations by type and age group, 2017-18
Source: Heart Foundation calculations.
Source: AIHW Health Expenditure database, custom data request
Economic Cost of Acute Coronary Syndrome in Australia: The Cost to Governments 42
Year STEMI NSTEMI UA ACS
$/sep Growth $/sep Growth $/sep Growth $/sep Growth
2004-05 8,883 8,200 5,315 6,883
2005-06 10,127 14.0 9,067 10.6 5,871 10.5 7,557 9.8
2006-07 10,428 3.0 9,134 0.7 5,808 -1.1 7,655 1.3
2007-08 11,021 5.7 9,615 5.3 6,020 3.6 8,325 8.7
2008-09 12,167 10.4 10,642 10.7 6,873 14.2 9,454 13.6
2009-10 12,693 4.3 10,762 1.1 6,958 1.2 9,739 3.0
2010-11 13,714 8.0 11,255 4.6 7,113 2.2 10,249 5.2
2011-12 14,227 3.7 11,732 4.2 7,308 2.7 11,090 8.2
2012-13 14,478 1.8 11,844 1.0 7,337 0.4 11,265 1.6
Average 6.4 4.8 4.2 6.4
Table 26: Trend in admitted hospital expenditure per separation
Source: AIHW Health Expenditure database, customised request; Heart Foundation calculations
Economic Cost of Acute Coronary Syndrome in Australia: The Cost to Governments 43
Age group STEMI NSTEMI UA ACS
15-19 - - - -
20-24 0.5 0.3 0.1 0.8
25-29 1.4 1.4 0.6 3.4
30-34 3.4 3.9 1.2 8.6
35-39 9.4 11.3 3.3 24.0
40-44 19.4 25.9 9.4 54.7
45-49 35.6 49.4 17.1 102.1
50-54 49.2 76.0 26.7 151.8
55-59 59.2 89.4 36.7 185.3
60-64 65.7 113.9 46.7 226.3
65-69 57.3 130.6 53.6 241.5
70-74 49.8 138.9 55.7 244.4
75-79 41.1 138.9 50.8 230.8
80-84 34.9 121.3 38.4 194.6
>85 43.5 180.0 38.1 261.7
Total 470.5 1,081.2 378.5 1,930.2
Table 27: Total health expenditure for ACS events by age group, $ million, 2017-18
Source: Heart Foundation calculations.
Economic Cost of Acute Coronary Syndrome in Australia: The Cost to Governments 44
© 2018 National Heart Foundation of Australia, ABN 98 008 419 761
National Heart Foundation of Australia. Economic Cost of Acute Coronary Syndrome in Australia: The Cost to Governments. Melbourne: National Heart Foundation of Australia, 2018.
Disclaimer: This material has been developed by the Heart Foundation for general information. The statements and recommendations it contains are, unless labelled as ‘expert opinion’, based on independent review of the available evidence at the time of writing. While care has been taken in preparing the content of this material, the Heart Foundation and its employees do not accept any liability, including for any loss or damage, resulting from the reliance on the content, or for its accuracy, currency and completeness. The information is obtained and developed from a variety of sources including, but not limited to, collaborations with third parties and information provided by third parties under licence. It is not an endorsement of any organisation, product or service.
This material may be found in third parties’ programs or materials (including, but not limited to, show bags or advertising kits). This does not imply an endorsement or recommendation by the National Heart Foundation of Australia for such third parties’ organisations, products or services, including their materials or information. Any use of National Heart Foundation of Australia materials or information by another person or organisation is at the user’s own risk.
The entire contents of this material are subject to copyright protection. Enquiries concerning copyright and permissions to use the material should be directed to [email protected].
COR-217.v2-0818