Embed Size (px)
Citation preview

Economic Contribution of Tourism to NSW 2014-15
Tourism is a significant part of the NSW economy. In
2014-15, tourism contributed $37.1 billion (Tourism
Consumption) to the NSW economy and employed
269,600 people.
This document provides a summary of tourism’s contribution to the economy of NSW based on the following reports from Tourism Research Australia:
State Tourism Satellite Accounts – details the
economic contribution of tourism in terms of
Employment, Consumption, Gross Value Added
(GVA) and Gross State Product (GSP). These
indicators are measured in terms of direct and
indirect contribution to the economy, with direct
contribution being the key measure.
Tourism Businesses in Australia June 2011 to June
2015 – focusses on tourism business count by
employment size, industry type, location and
financial performance.
NOTES
Tourism Consumption is the total value of tourism goods and services
consumed by residents and visitors from overseas in Australia.
Gross Value Added (GVA) is total labour income and capital revenue by
industry plus net taxes that government receives from production.
Gross State Product (GSP) is the Tourism GVA plus net taxes on products
attributable to the tourism industry.
More definitions are contained within and at the end this document.
KEY RESULTS
In 2014-15, tourism made the following contributions
to the economy of NSW:
Employment
Tourism generated 269,600 jobs, or 1 in every
14 jobs in the state. Tourism directly employed
171,900 people with a further 97,700 people
employed indirectly.
Consumption
Tourism consumption reached $37.1 billion.
Domestic tourism accounted for $26.8 billion
with international tourism contributing a
further $10.3 billion.
Gross Value Added (GVA)
Tourism’s GVA was $27.6 billion. Direct GVA
accounted for $13.9 billion with indirect GVA
accounting for a further $13.6 billion.
Gross State Product (GSP)
Tourism’s GSP contribution was $31.0 billion.
The direct GSP contribution was $15.2 billion
with an indirect contribution of $15.8 billion.
Tourism Businesses
There are 93,630 businesses involved in
tourism in NSW. 63.9 per cent of tourism
businesses are in Sydney and 36.1 per cent are
in Regional NSW.

NSW contributed the most to the Australian economy
– 29.6 per cent of direct national tourism employment, 30.6 per cent of national tourism consumption, 32.0 per cent of national direct tourism GVA, 32.0 per cent of direct tourism contribution to the national Gross Domestic Product (GDP) and 34.3 per cent of all tourism businesses in Australia.
EMPLOYMENT
In 2014-15, the tourism industry in NSW directly
employed 171,900 people. This equates to 29.6 per
cent of the total direct tourism employment in
Australia and 4.7 per cent of all jobs in NSW.
In the year 2014-15, direct tourism employment in
NSW grew by 5.5 per cent. Since 2006-07, direct
tourism employment in NSW has increased by 10.3 per
cent, equal to a compound average growth rate of 1.2
per cent per annum.
NSW’s share of direct tourism employment has slightly
grown from 29.4 per cent in 2006-07 to 29.6 per cent
in 2014-15.
In 2014-15, tourism’s direct contribution to state
employment of 171,900 jobs accounted for 63.8 per
cent of total tourism employment in NSW, and 1 in 21
jobs in NSW.
The remaining 97,700 jobs, equal to 36.2 per cent,
represent tourism’s indirect contribution to
employment. Indirect tourism accounts for 1 in 37 jobs
in NSW.
NSW Tourism Employment and Job Ratio 2014-15
JOB TYPEJOBS (000’s)
SHARE NSW JOB RATIO
Direct 171.9 63.8% 1 in 21 Jobs
Indirect 97.7 36.2% 1 in 37 Jobs
Total 269.6 100% 1 in 14 Jobs
Total tourism employment (both direct and indirect) in
NSW is equal to 269,600 jobs, or 29.2 per cent of the
total tourism jobs in Australia. Tourism is responsible
for 7.4 per cent of total employment in NSW, equal to
1 in 14 jobs.
Direct Tourism Employment by Industry 2014-15
INDUSTRY SEGMENT JOBS (000’s)SHARE OF
NSW TOTAL
Cafes, restaurants and takeaway food services
44.9 26.1%
Retail trade 31.8 18.5%
Accommodation 25.6 14.9%
Education and training 13.9 8.1%
Travel agency and tour operator services
12.6 7.3%
All Other 43.2 25.1%
Total - Tourism 171.9 100%
The largest share of direct tourism employment in
NSW comes from the café / restaurant / takeaway food
sector. The total number of direct tourism jobs in this
industry equates to 44,900 or 26.1 per cent of total
state direct tourism employment. Other major
contributors to NSW direct tourism employment
include the retail trade, accommodation, education
and training, and travel agency and tour operator
services.
Employed Person – A person aged 15 years or over who during the reference week worked for one hour or
more for pay, profit, commission or payment in kind in a job or business or on a farm, or worked for one hour
or more without pay in a family business or on a farm.

CONSUMPTION
In 2014-15, tourism consumption in NSW was equal to
$37.1 billion, the highest level since 2006-07. This
equates to 30.6 per cent of total tourism consumption
in Australia.
In the year 2014-15, tourism consumption in NSW
grew by 3.9 per cent. Since 2006-07, tourism
consumption in NSW has increased by 35.5 per cent,
equal to a compound average growth rate of 3.9 per
cent per annum.
NSW’s share of tourism consumption has slightly
increased from 30.2 per cent in 2006-07 to 30.6 per
cent in 2014-15.
In 2014-15, domestic tourism consumption was $26.8
billion, accounting for 72.2 per cent of total tourism
consumption in NSW. The largest share of domestic
consumption comes from intrastate travel, which
accounts for 33.8 per cent of total consumption.
International tourism consumption of $10.3 billion is
equal to 27.8 per cent of the total.
While overall tourism consumption has grown since
2006-07, the domestic vs. international percentage
share of total NSW tourism consumption has remained
relatively steady. In the last year, domestic and
international tourism consumption both grew by
2.3 per cent and 8.5 per cent, respectively.
Tourism Consumption by Product 2014-15
PRODUCTCONSUMPTION
($ billion)SHARE OF
NSW TOTAL
Takeaway and restaurant meals
6.0 16.1%
Long distance passenger transportation
4.8 12.9%
Shopping (including gifts and souvenirs)
4.7 12.8%
Accommodation services
4.5 12.2%
Fuel (petrol, diesel) 3.2 8.8%
All Other 13.8 37.2%
Total - Tourism 37.1 100%
The largest share of tourism consumption in NSW
comes from takeaway and restaurant meals.
Consumption of this product equates to $6.0 billion or
16.1 per cent of the total State tourism consumption.
Other major contributors to NSW tourism consumption
include long distance passenger transport, shopping,
accommodation services and petrol.
Tourism Consumption – The total value of tourism goods and services consumed by residents and visitors
from overseas in Australia. It includes household, business and government tourism consumption. It
represents the price paid by the visitor (which therefore includes taxes and subsidies) and is measured in
purchasers’ prices.

GROSS VALUE ADDED (GVA)
In 2014-15, direct tourism GVA in NSW was equal to
$13.9 billion, the highest level since 2006-07. This
equates to 32.0 per cent of the national direct tourism
GVA and 2.9 per cent of the total NSW GVA.
In the year to 2014-15, direct tourism GVA in NSW
grew by 4.8 per cent. Since 2006-07, direct tourism
GVA in NSW has increased by 45.9 per cent, equal to a
compound average rate of 5.7 per cent per annum.
NSW’s share of national direct tourism GVA has
slightly grown from 31.8 per cent in 2006-07 to 32.0
per cent in 2014-15.
In 2014-15, direct tourism GVA of $13.9 billion
accounted for 50.5 per cent of total tourism GVA for
NSW. The remaining $13.6 billion or 49.5 per cent was
indirect tourism GVA.
Total tourism GVA (both direct and indirect) in NSW
was equal to $27.6 billion. This equates to 31.8 per
cent of the national tourism GVA and 5.8 per cent of
the total NSW GVA.
Domestic visitation accounts for 67.8 per cent of direct
tourism GVA compared to international tourism which
accounts for 32.2 per cent. Intrastate tourism accounts
for the largest share of the domestic market with 33.5
per cent of NSW direct tourism GVA.
INDUSTRY SEGMENT GVA ($ billion)SHARE OF
NSW TOTAL
Accommodation 2.3 16.4%
Other retail trade 1.9 13.4%
Air, water and other transport
1.8 13.1%
Cafes, restaurants and takeaway food services
1.8 12.6%
Ownership of dwellings
1.3 9.2%
All Other 4.9 35.3%
Total - Tourism 13.9 100%
The largest share of direct tourism GVA in NSW comes
from the accommodation sector. The direct GVA
contribution of this industry equates to $2.3 billion or
16.4 per cent of the state direct tourism GVA. Other
major contributors to NSW direct tourism GVA include
other retail trade, air/water and other transport, cafes
/ restaurants / takeaway food and ownership of
dwellings.
Gross Value Added (GVA) –GVA includes the total labour income and capital revenue received by the industry
and the net taxes that government receives from the production, and is measured in basic prices.
Direct Tourism GVA by Industry 2014-15

GROSS STATE PRODUCT (GSP)
In 2014-15, tourism’s direct contribution to the NSW
GSP was equal to $15.2 billion, the highest level since
2006-07. This equates to 32.0 per cent of tourism’s
direct contribution to Australia’s Gross Domestic
Product (GDP) and 3.0 per cent of the total NSW GSP.
In the year to 2014-15, direct tourism GSP in NSW grew
by 4.8 per cent. Since 2006-07, direct tourism GSP in
NSW has increased by 44.9 per cent, equal to a
compound average rate of 4.7 per cent per annum.
NSW’s share of direct tourism GSP has slightly
increased from 31.7 per cent in 2006-07 to 32.0 per
cent in 2014-15.
In 2014-15, direct contributions to GSP of $15.2 billion,
accounted for 49.0 per cent of total tourism GSP for
NSW. The remaining $15.8 billion, equal to 51.0 per
cent, were from indirect contributions to tourism GSP.
The tourism contribution to GSP (both direct and
indirect) in NSW was equal to $31.0 billion. This
equates to 31.7 per cent of the national tourism
contribution to GSP. Tourism’s direct and indirect
contribution to GSP accounts for 6.0 per cent of the
total NSW GSP.
Gross State Product (GSP) – Tourism GVA plus net taxes on products that are attributable to the tourism
industry. As such it generally has a higher value than tourism GVA. It is the equivalent of a Gross Domestic
Product (GDP) but at a state level.
DEFINITIONS
Tourism Satellite Account (TSA) – A set of financial accounts that measure the economic impact of tourism.
The TSA calculates the impact of tourism by using data on the purchase and consumption of different goods
and services across the economy.
Direct Contribution of Tourism – The contribution generated by transactions between the visitor and
producer for a good or service that involves a direct physical or economic relationship. For example, a visitor
purchasing a meal in a restaurant.
Indirect Contribution of Tourism – The subsequent or flow-on effects created by the requirement for inputs
from those industries supplying goods and services to tourists. For example, a restaurant purchasing
ingredients in order to make a meal for a paying visitor.
NOTES
For more detailed information including a more extensive range of definitions and information on how the
Tourism Satellite Account is modelled, please see State Tourism Satellite Accounts 2014-15 report at the
Tourism Research Australia website at www.tra.gov.au
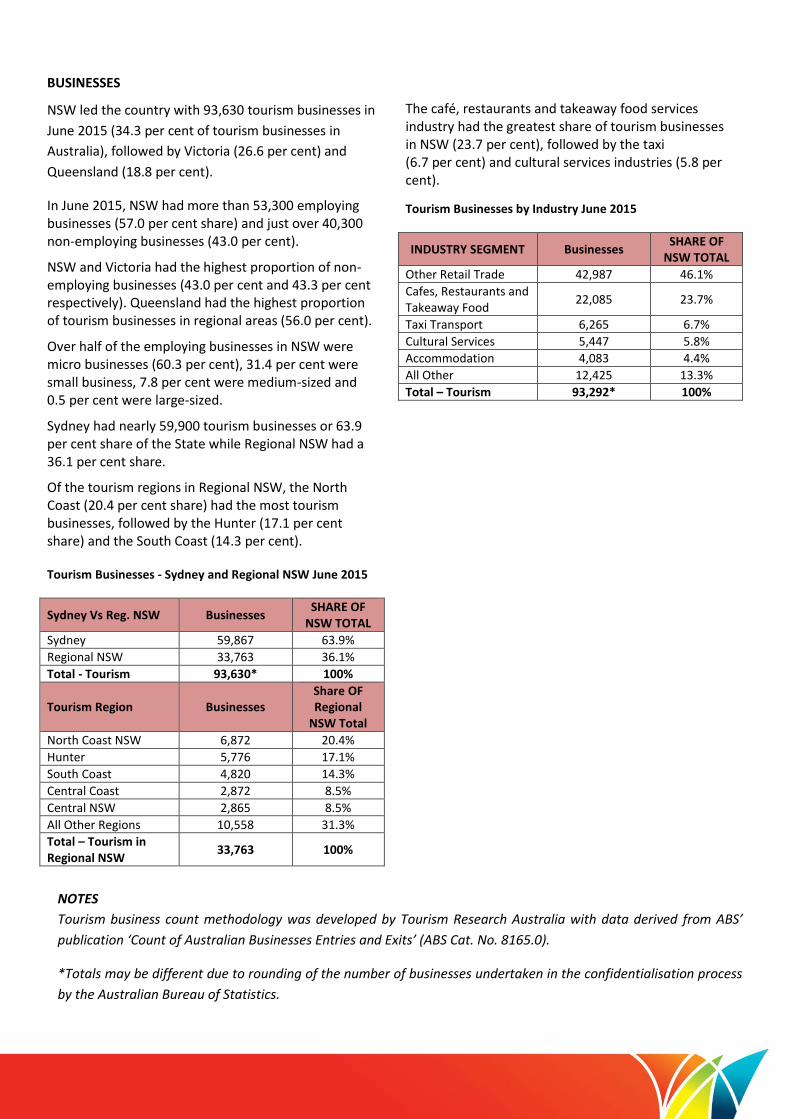
BUSINESSES
NSW led the country with 93,630 tourism businesses in
June 2015 (34.3 per cent of tourism businesses in
Australia), followed by Victoria (26.6 per cent) and
Queensland (18.8 per cent).
In June 2015, NSW had more than 53,300 employing businesses (57.0 per cent share) and just over 40,300 non-employing businesses (43.0 per cent).
NSW and Victoria had the highest proportion of non-employing businesses (43.0 per cent and 43.3 per cent respectively). Queensland had the highest proportion of tourism businesses in regional areas (56.0 per cent).
Over half of the employing businesses in NSW were micro businesses (60.3 per cent), 31.4 per cent were small business, 7.8 per cent were medium-sized and 0.5 per cent were large-sized.
Sydney had nearly 59,900 tourism businesses or 63.9 per cent share of the State while Regional NSW had a 36.1 per cent share.
Of the tourism regions in Regional NSW, the North Coast (20.4 per cent share) had the most tourism businesses, followed by the Hunter (17.1 per cent share) and the South Coast (14.3 per cent).
Tourism Businesses - Sydney and Regional NSW June 2015
Sydney Vs Reg. NSW Businesses SHARE OF
NSW TOTAL
Sydney 59,867 63.9%
Regional NSW 33,763 36.1%
Total - Tourism 93,630* 100%
Share OF Regional
NSW Total Tourism Region Businesses
North Coast NSW 6,872 20.4%
Hunter 5,776 17.1%
South Coast 4,820 14.3%
Central Coast 2,872 8.5%
Central NSW 2,865 8.5%
All Other Regions 10,558 31.3%
Total – Tourism in Regional NSW
33,763 100%
The café, restaurants and takeaway food services industry had the greatest share of tourism businesses in NSW (23.7 per cent), followed by the taxi (6.7 per cent) and cultural services industries (5.8 per cent).
Tourism Businesses by Industry June 2015
INDUSTRY SEGMENT Businesses SHARE OF
NSW TOTAL
Other Retail Trade 42,987 46.1%
Cafes, Restaurants and Takeaway Food
22,085 23.7%
Taxi Transport 6,265 6.7%
Cultural Services 5,447 5.8%
Accommodation 4,083 4.4%
All Other 12,425 13.3%
Total – Tourism 93,292* 100%
NOTES
Tourism business count methodology was developed by Tourism Research Australia with data derived from ABS’
publication ‘Count of Australian Businesses Entries and Exits’ (ABS Cat. No. 8165.0).
*Totals may be different due to rounding of the number of businesses undertaken in the confidentialisation process
by the Australian Bureau of Statistics.