Embed Size (px)
Citation preview
Linking the Economy and Environment of Florida Keys/Florida Bay
Monroe County Tourist Development Council
ECONOMIC CONTRIBUTION OFRECREATING VISITORS TO
THE FLORIDA KEYS/KEY WEST
November 1996
Donald B. K. EnglishOutdoor Recreation and Wilderness Assessment Group
Southern Forest Research StationUSDA-Forest Service
Athens, GA
Warren KrieselDepartment of Agricultural and Applied Economics
University of GeorgiaAthens, GA
Vernon R. Leeworthy and Peter C. WileyStrategic Environmental Assessments Division
Office of Ocean Resources Conservation and AssessmentNational Ocean Service
National Oceanic and Atmospheric AdministrationU. S. Department of Commerce
N A
T I O
N A
L O
C E A
N I C A N D A T M O S P H E R I C A D M
I N I S
T R A
T I O
N
U . S . D E P A R T M E N T O F C O M M
E R C
E
Linking the Economy and Environment of Florida Keys/Florida Bay
ECONOMIC CONTRIBUTION OFRECREATING VISITORS TO
THE FLORIDA KEYS/KEY WEST
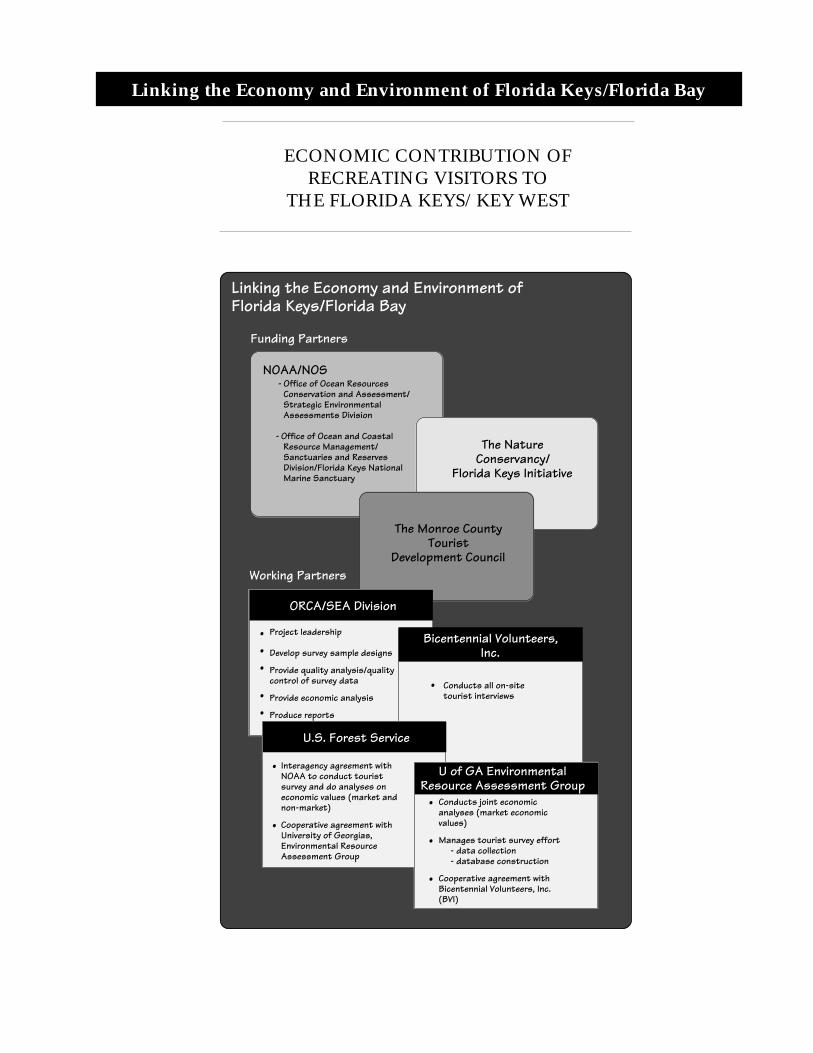
NOAA/NOS - Office of Ocean Resources
Conservation and Assessment/ Strategic Environmental Assessments Division
- Office of Ocean and Coastal Resource Management/ Sanctuaries and Reserves Division/Florida Keys National Marine Sanctuary
The Nature Conservancy/
Florida Keys Initiative
The Monroe County Tourist
Development Council
Funding Partners
Working Partners
Linking the Economy and Environment of Florida Keys/Florida Bay
•
•
•
•
•
ORCA/SEA Division
•
Bicentennial Volunteers, Inc.
•
•
U.S. Forest Service
Interagency agreement with NOAA to conduct tourist survey and do analyses on economic values (market and non-market)
Cooperative agreement with University of Georgias, Environmental Resource Assessment Group
•
•
•
U of GA Environmental Resource Assessment Group
Conducts joint economic analyses (market economic values)
Manages tourist survey effort- data collection- database construction
Cooperative agreement with Bicentennial Volunteers, Inc. (BVI)
Conducts all on-sitetourist interviews
Project leadership
Develop survey sample designs
Provide quality analysis/qualitycontrol of survey data
Provide economic analysis
Produce reports
i
Table of Contents
List of Tables . . . . . . . . . . . . . . . . . . . . . . . . . . . . . . . . . . . . . . . . . . . . . . . . . . . . . . . . . . . . . . . . . . . i
List of Figures . . . . . . . . . . . . . . . . . . . . . . . . . . . . . . . . . . . . . . . . . . . . . . . . . . . . . . . . . . . . . . . . . . . i
List of Appendix Tables . . . . . . . . . . . . . . . . . . . . . . . . . . . . . . . . . . . . . . . . . . . . . . . . . . . . . . . . . . . i
Introduction . . . . . . . . . . . . . . . . . . . . . . . . . . . . . . . . . . . . . . . . . . . . . . . . . . . . . . . . . . . . . . . . . . . . . 1
Baseline Economy . . . . . . . . . . . . . . . . . . . . . . . . . . . . . . . . . . . . . . . . . . . . . . . . . . . . . . . . . . . . . . . 2
Special Features . . . . . . . . . . . . . . . . . . . . . . . . . . . . . . . . . . . . . . . . . . . . . . . . . . . . . . . .2Historical Perspective . . . . . . . . . . . . . . . . . . . . . . . . . . . . . . . . . . . . . . . . . . . . . . . . . . . .4
Definitions . . . . . . . . . . . . . . . . . . . . . . . . . . . . . . . . . . . . . . . . . . . . . . . . . . . . . . . . . . . . . . . . . . . . .5
Summary of Results . . . . . . . . . . . . . . . . . . . . . . . . . . . . . . . . . . . . . . . . . . . . . . . . . . . . . . . . . . . . . . 6
Monroe County . . . . . . . . . . . . . . . . . . . . . . . . . . . . . . . . . . . . . . . . . . . . . . . . . . . . . . . . .6South Florida . . . . . . . . . . . . . . . . . . . . . . . . . . . . . . . . . . . . . . . . . . . . . . . . . . . . . . . . . . .7
Methods . . . . . . . . . . . . . . . . . . . . . . . . . . . . . . . . . . . . . . . . . . . . . . . . . . . . . . . . . . . . . . . . . . . . .9
Background Concepts . . . . . . . . . . . . . . . . . . . . . . . . . . . . . . . . . . . . . . . . . . . . . . . . . . . .9Survey Design . . . . . . . . . . . . . . . . . . . . . . . . . . . . . . . . . . . . . . . . . . . . . . . . . . . . . . . . .10Expenditures . . . . . . . . . . . . . . . . . . . . . . . . . . . . . . . . . . . . . . . . . . . . . . . . . . . . . . . . . .10
References . . . . . . . . . . . . . . . . . . . . . . . . . . . . . . . . . . . . . . . . . . . . . . . . . . . . . . . . . . . . . . . . . . . .14
i
Table Page
1 Income by Place of Work as a Percentage of Income by Place of Residence for the U.S.,Florida and Monroe County ............................................................................................................... 2
2 Inter-county Commuting Patterns ..................................................................................................... 23 Proprietors' Employment as a Percentage of Total Employment for the U.S.,
Florida and Monroe County ............................................................................................................... 34 Historical Data for Sales, Income and Employment for Monroe County ........................................... 45 Estimated Economic Contribution of Tourist/Recreational Activities ................................................. 66 Summary of Average Trip Expenditures Per Person ....................................................................... 117 Summary of Selected Annual Expenditures Per Person Per Trip ................................................... 128 Summary of Total Trip Expenditures Per Person ............................................................................ 13
List of Tables
List of Figures
Figure Page
1 Monthly Non-proprietor Employment in Monroe County: 1989 - 1992 ............................................. 42 Impact Process Due to Visitor Spending in Monroe County ............................................................ 63 Impact Process Due to Visitor Spending in South Florida ................................................................ 7
List of Appendix Tables
Appendix Tables . . . . . . . . . . . . . . . . . . . . . . . . . . . . . . . . . . . . . . . . . . . . . . . . . . . . . . . . . . . . . . . . 16
Table A.1.a Detailed Direct Expenditure Impact (millions of $): June - November, 1995 . . . .17Table A.1.b Detailed Direct Expenditure Impact (millions of $):
December 1995 - May 1996 . . . . . . . . . . . . . . . . . . . . . . . . . . . . . . . . . . . . . . . .19Table A.1.c Deatiled Direct Expenditure Impact, Selected Annual Expenditures . . . . . . . . . . .21Table A.2 Wages-to-Sales and Wages-to-Employment Ratios by SIC . . . . . . . . . . . . . . . . .21Table A.3 Estimate of the Economic Effects Resulting from Visitor Expenditures to
South Florida . . . . . . . . . . . . . . . . . . . . . . . . . . . . . . . . . . . . . . . . . . . . . . . . . . .22Table A.4 Economic Impact Multipliers . . . . . . . . . . . . . . . . . . . . . . . . . . . . . . . . . . . . . . . . .22Table A.5 Total Economic Impacts from Visitor Spending in the 3-County Region,
Industrial Groups Aggregated to the 1-digit SIC Level. . . . . . . . . . . . . . . . . . . .23
1
Introduction
This research is part of a projectexamining economic issuesrelated to recreation visitation inthe Florida Keys. The project isthe result of a community meetingheld in Key Largo in September1993. Many members of the Keyscommunity attended, includingrepresentatives of local govern-ment, Chambers of Commerce,private businesses, local nonprofitorganizations, and state andfederal officials. The meeting wasorganized by Duncan Mathewsonof the Center for ShipwreckResearch and Ken Vrana and EdMahoney from Michigan StateUniversity’s Center for Maritimeand Underwater ResourcesManagement (CMURM) at therequest of Spencer Slate, Chair-man of the Keys Association ofDive Operators (KADO). Variousinformation needs and objectiveswere discussed and each of theattendees was asked to submithow they thought the organiza-tions they represent could supporta research effort. In October 1994,The National Oceanic and Atmo-spheric Administration (NOAA),The Nature Conservancy (TNC)and The Monroe County TouristDevelopment Council (TDC) jointlysubmitted a proposal for fundingto NOAA's National OceanService (NOS) PartnershipProject. This project was one ofsix funded by NOS in 1994.
The project has five overall goals,which are to: 1. estimate of thenumber of residents and visitors tothe Florida Keys and Florida Bayby type of use, along with anestimate of the extent of use bygeographic areas (Upper Keys,Middle Keys, Lower Keys and KeyWest); 2. develope from surveydata profiles of residents andvisitors including information onage, race, sex, income, education,place of residence, activity partici-pation, spending in the local and
regional economy, and satisfactionratings with respect to facilitiesand the quality of the naturalenvironment; 3. estimate theeconomic contribution (sales,employment and income) of bothresident and visitor recreationaluses of the Florida Keys andFlorida Bay to the Monroe Countyeconomy and the South Floridaregional economy; 4. estimate thenet economic user value of marineresources in the Florida Keys andFlorida Bay; and 5. assess theimportance of water quality andabundance and diversity of sea lifeas attractions for visitors engagedin water-based activities in theFlorida Keys and Florida Bay.
This report, an economic impactanalysis, addresses the third ofthese five goals. It is submitted inpartial fulfillment of an interagencyagreement between the Universityof Georgia, the Southern ForestResearch Station, and NOAA.
Economic impact analyses ofrecreation sites are designed toanswer the question: How muchdoes an activity contribute to thelocal economy? Impacts aredetermined by three differentfactors: the structure of the localeconomy, the amount and type ofspending visitors do while on tripsto the recreation site, and the totallevel of visitation. Depending onthe assumptions about the siteand its visitation, spending byresidents of the local economymay be excluded from the analy-sis. Although visitation to theFlorida Keys/Florida Bay maycontribute to the economies ofmany nearby counties, our analy-sis is limited to two small impactareas: one includes MonroeCounty only; the second includesMonroe, Dade and Browardcounties. For flexibility in examin-ing results of possible policychanges, we do separate analysesfor summer (June - November1995) and winter (December 1995- May 1996) visitors. An overview
of the baseline economy isdiscussed in the next section,followed by definitions of thevarious concepts used in theanalysis, a summary of results,and an explanation of the method-ology used in the analysis.
2222p2
Baseline Economy
Special Features
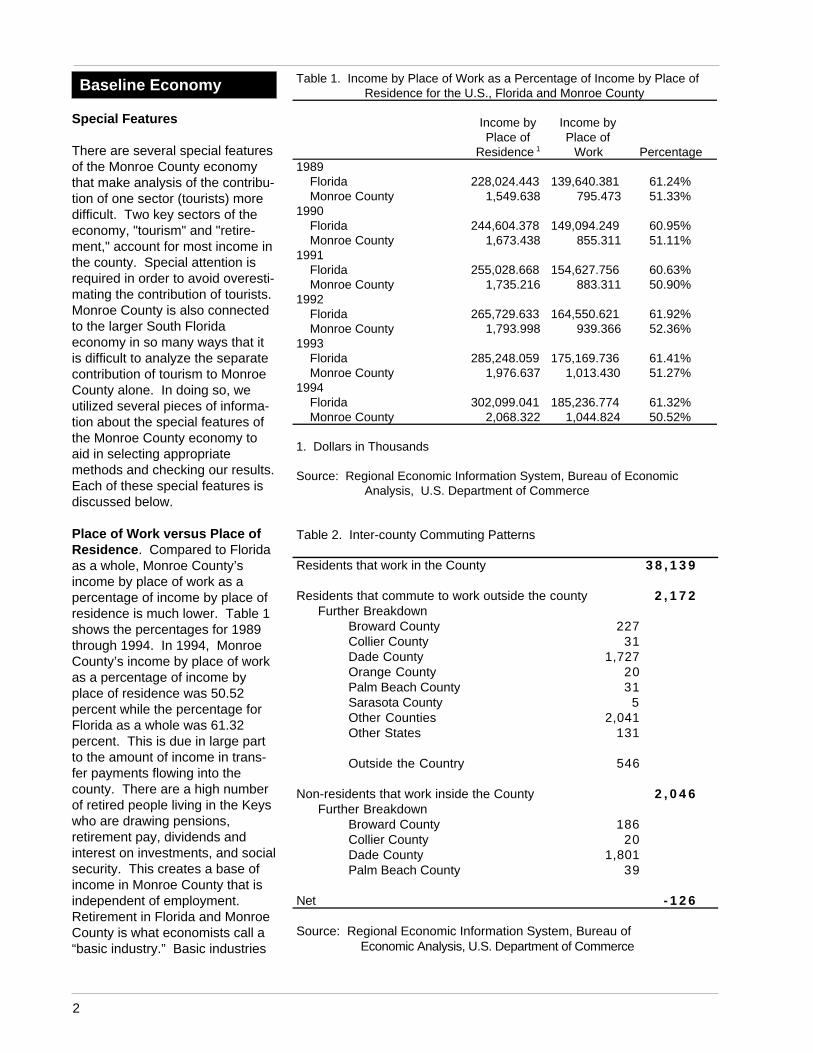
There are several special featuresof the Monroe County economythat make analysis of the contribu-tion of one sector (tourists) moredifficult. Two key sectors of theeconomy, "tourism" and "retire-ment," account for most income inthe county. Special attention isrequired in order to avoid overesti-mating the contribution of tourists.Monroe County is also connectedto the larger South Floridaeconomy in so many ways that itis difficult to analyze the separatecontribution of tourism to MonroeCounty alone. In doing so, weutilized several pieces of informa-tion about the special features ofthe Monroe County economy toaid in selecting appropriatemethods and checking our results.Each of these special features isdiscussed below.
Place of Work versus Place ofResidence . Compared to Floridaas a whole, Monroe County’sincome by place of work as apercentage of income by place ofresidence is much lower. Table 1shows the percentages for 1989through 1994. In 1994, MonroeCounty’s income by place of workas a percentage of income byplace of residence was 50.52percent while the percentage forFlorida as a whole was 61.32percent. This is due in large partto the amount of income in trans-fer payments flowing into thecounty. There are a high numberof retired people living in the Keyswho are drawing pensions,retirement pay, dividends andinterest on investments, and socialsecurity. This creates a base ofincome in Monroe County that isindependent of employment.Retirement in Florida and MonroeCounty is what economists call a“basic industry.” Basic industries
Table 2. Inter-county Commuting Patterns
Residents that work in the County 3 8 , 1 3 9
Residents that commute to work outside the county 2 , 1 7 2Further Breakdown
Broward County 227Collier County 31Dade County 1,727Orange County 20Palm Beach County 31Sarasota County 5Other Counties 2,041Other States 131
Outside the Country 546
Non-residents that work inside the County 2 , 0 4 6Further Breakdown
Broward County 186Collier County 20Dade County 1,801Palm Beach County 39
Net - 1 2 6
Source: Regional Economic Information System, Bureau of Economic Analysis, U.S. Department of Commerce
Table 1. Income by Place of Work as a Percentage of Income by Place of Residence for the U.S., Florida and Monroe County
Income by Income byPlace of Place of
Residence 1 Work Percentage1989 Florida 228,024.443 139,640.381 61.24% Monroe County 1,549.638 795.473 51.33%1990 Florida 244,604.378 149,094.249 60.95% Monroe County 1,673.438 855.311 51.11%1991 Florida 255,028.668 154,627.756 60.63% Monroe County 1,735.216 883.311 50.90%1992 Florida 265,729.633 164,550.621 61.92% Monroe County 1,793.998 939.366 52.36%1993 Florida 285,248.059 175,169.736 61.41% Monroe County 1,976.637 1,013.430 51.27%1994 Florida 302,099.041 185,236.774 61.32% Monroe County 2,068.322 1,044.824 50.52%
1. Dollars in Thousands
Source: Regional Economic Information System, Bureau of Economic Analysis, U.S. Department of Commerce
3
derive their demand from outsidethe area of location. Sometimesthey are referred to as “exportindustries” because they exportgoods and services to other areas(this term wouldn’t apply toretirement). However, retirementis basic in that the income thatflows into the local economyresults in demand for local goodsand services. It is “new money”arriving in the economy thatbecomes a driving force in theeconomy, creating income andemployment. The same is true ofthe tourist industry.
Another explanation for thesignificant difference betweenincome by place of work andincome by place of residence isintercounty commuters. There area significant number of residentsof Monroe County working outsidethe county and non-residentsworking inside the county. Table 2shows the number of commuterscoming into (going out of) thecounty and where they are comingfrom (going to). The net transferof commuters is -126. In otherwords, there are 126 more com-muters leaving Monroe Countythan there are coming in. In 1994,net income to Monroe County wasabout $67 million. Residents ofMonroe County that work outsidethe county brought in $116.5million, and non-residents ofMonroe County that work inMonroe County took out $49.5million. The Keys as a “bedroomcommunity” for other counties inSouth Florida is also a basicindustry.
Proprietors’ Employment as aPercentage of Total Employ-ment. Another important issue toconsider is the proportion ofproprietors' income in relation tothe total. The percentage forMonroe County is considerablyhigher than for both Florida andthe country as a whole. Table 3shows proprietors' employment as
a percentage of total employmentfor the U.S., Florida and MonroeCounty. In 1994, proprietors’employment as a percentage oftotal employment in MonroeCounty was 21.72 percent, whilein Florida it was 14.95 percent andin the U.S. as a whole it was 15.47percent. The high proportion ofproprietors' to wage employmentreflects the dominance of themany small businesses in thetourist industry.
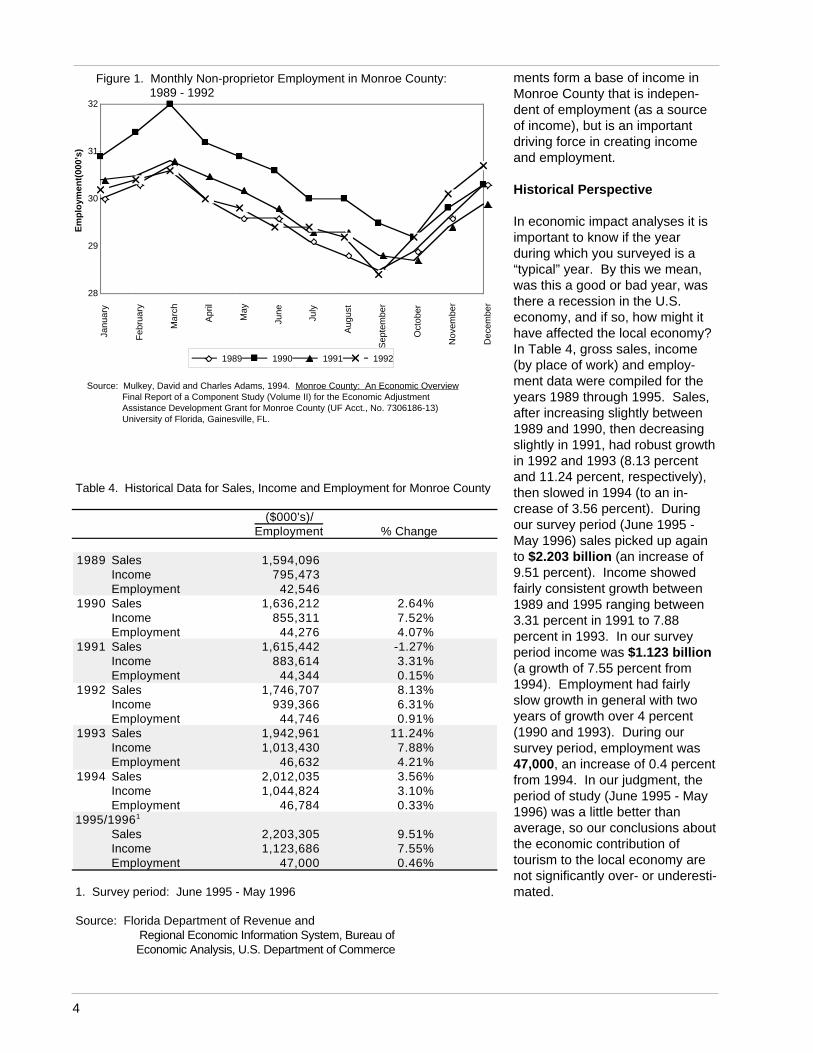
Seasonality . In a region like theFlorida Keys where tourismdominates the economic activity,an important aspect is the ups anddowns of the economy during theyear, i.e., seasonality. Figure 1shows monthly non-proprietor
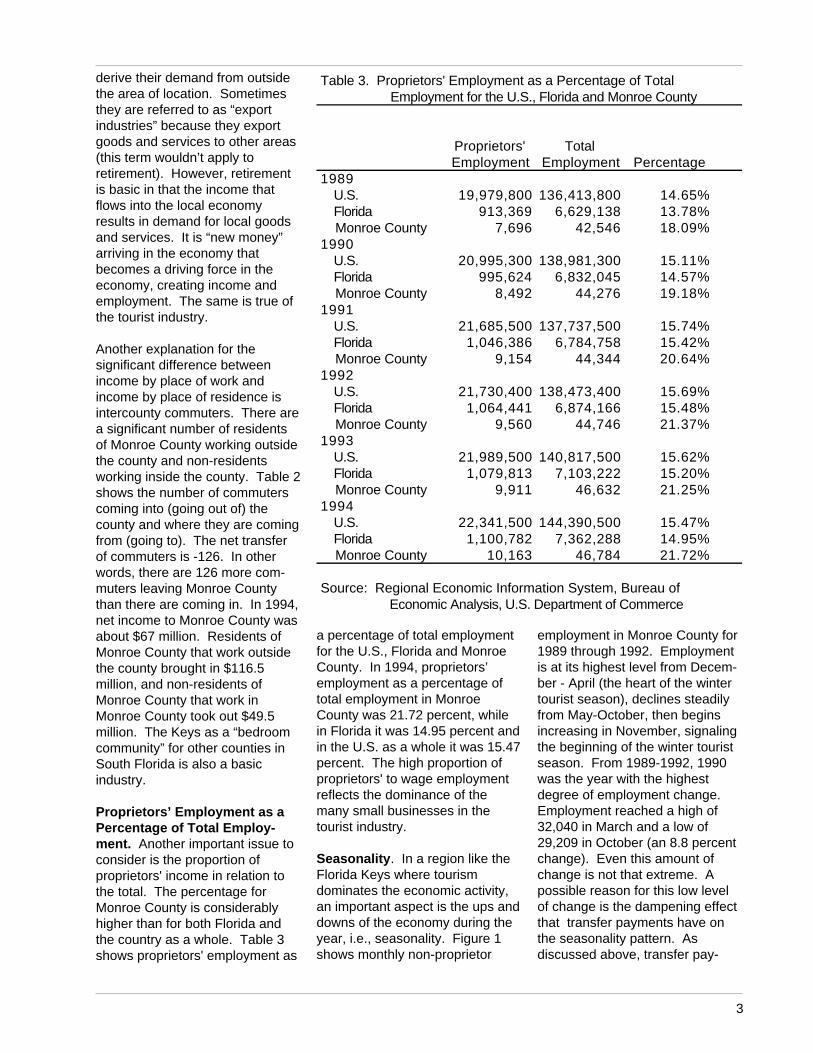
Table 3. Proprietors' Employment as a Percentage of Total Employment for the U.S., Florida and Monroe County
Proprietors' TotalEmployment Employment Percentage
1989 U.S. 19,979,800 136,413,800 14.65% Florida 913,369 6,629,138 13.78% Monroe County 7,696 42,546 18.09%1990 U.S. 20,995,300 138,981,300 15.11% Florida 995,624 6,832,045 14.57% Monroe County 8,492 44,276 19.18%1991 U.S. 21,685,500 137,737,500 15.74% Florida 1,046,386 6,784,758 15.42% Monroe County 9,154 44,344 20.64%1992 U.S. 21,730,400 138,473,400 15.69% Florida 1,064,441 6,874,166 15.48% Monroe County 9,560 44,746 21.37%1993 U.S. 21,989,500 140,817,500 15.62% Florida 1,079,813 7,103,222 15.20% Monroe County 9,911 46,632 21.25%1994 U.S. 22,341,500 144,390,500 15.47% Florida 1,100,782 7,362,288 14.95% Monroe County 10,163 46,784 21.72%
Source: Regional Economic Information System, Bureau of Economic Analysis, U.S. Department of Commerce
employment in Monroe County for1989 through 1992. Employmentis at its highest level from Decem-ber - April (the heart of the wintertourist season), declines steadilyfrom May-October, then beginsincreasing in November, signalingthe beginning of the winter touristseason. From 1989-1992, 1990was the year with the highestdegree of employment change.Employment reached a high of32,040 in March and a low of29,209 in October (an 8.8 percentchange). Even this amount ofchange is not that extreme. Apossible reason for this low levelof change is the dampening effectthat transfer payments have onthe seasonality pattern. Asdiscussed above, transfer pay-
4444p4
ments form a base of income inMonroe County that is indepen-dent of employment (as a sourceof income), but is an importantdriving force in creating incomeand employment.
Historical Perspective
In economic impact analyses it isimportant to know if the yearduring which you surveyed is a“typical” year. By this we mean,was this a good or bad year, wasthere a recession in the U.S.economy, and if so, how might ithave affected the local economy?In Table 4, gross sales, income(by place of work) and employ-ment data were compiled for theyears 1989 through 1995. Sales,after increasing slightly between1989 and 1990, then decreasingslightly in 1991, had robust growthin 1992 and 1993 (8.13 percentand 11.24 percent, respectively),then slowed in 1994 (to an in-crease of 3.56 percent). Duringour survey period (June 1995 -May 1996) sales picked up againto $2.203 billion (an increase of9.51 percent). Income showedfairly consistent growth between1989 and 1995 ranging between3.31 percent in 1991 to 7.88percent in 1993. In our surveyperiod income was $1.123 billion(a growth of 7.55 percent from1994). Employment had fairlyslow growth in general with twoyears of growth over 4 percent(1990 and 1993). During oursurvey period, employment was47,000, an increase of 0.4 percentfrom 1994. In our judgment, theperiod of study (June 1995 - May1996) was a little better thanaverage, so our conclusions aboutthe economic contribution oftourism to the local economy arenot significantly over- or underesti-mated.
Table 4. Historical Data for Sales, Income and Employment for Monroe County
($000's)/Employment % Change
1989 Sales 1,594,096Income 795,473Employment 42,546
1990 Sales 1,636,212 2.64%Income 855,311 7.52%Employment 44,276 4.07%
1991 Sales 1,615,442 -1.27%Income 883,614 3.31%Employment 44,344 0.15%
1992 Sales 1,746,707 8.13%Income 939,366 6.31%Employment 44,746 0.91%
1993 Sales 1,942,961 11.24%Income 1,013,430 7.88%Employment 46,632 4.21%
1994 Sales 2,012,035 3.56%Income 1,044,824 3.10%Employment 46,784 0.33%
1995/19961
Sales 2,203,305 9.51%Income 1,123,686 7.55%Employment 47,000 0.46%
1. Survey period: June 1995 - May 1996
Source: Florida Department of Revenue and Regional Economic Information System, Bureau of Economic Analysis, U.S. Department of Commerce
28
29
30
31
32Ja
nuar
y
Feb
ruar
y
Mar
ch
Apr
il
May
June
July
Aug
ust
Sep
tem
ber
Oct
ober
Nov
embe
r
Dec
embe
r
Em
plo
ymen
t(00
0’s)
1989 1990 1991 1992
Source: Mulkey, David and Charles Adams, 1994. Monroe County: An Economic Overview Final Report of a Component Study (Volume II) for the Economic Adjustment Assistance Development Grant for Monroe County (UF Acct., No. 7306186-13) University of Florida, Gainesville, FL.
Figure 1. Monthly Non-proprietor Employment in Monroe County: 1989 - 1992
5
Definitions
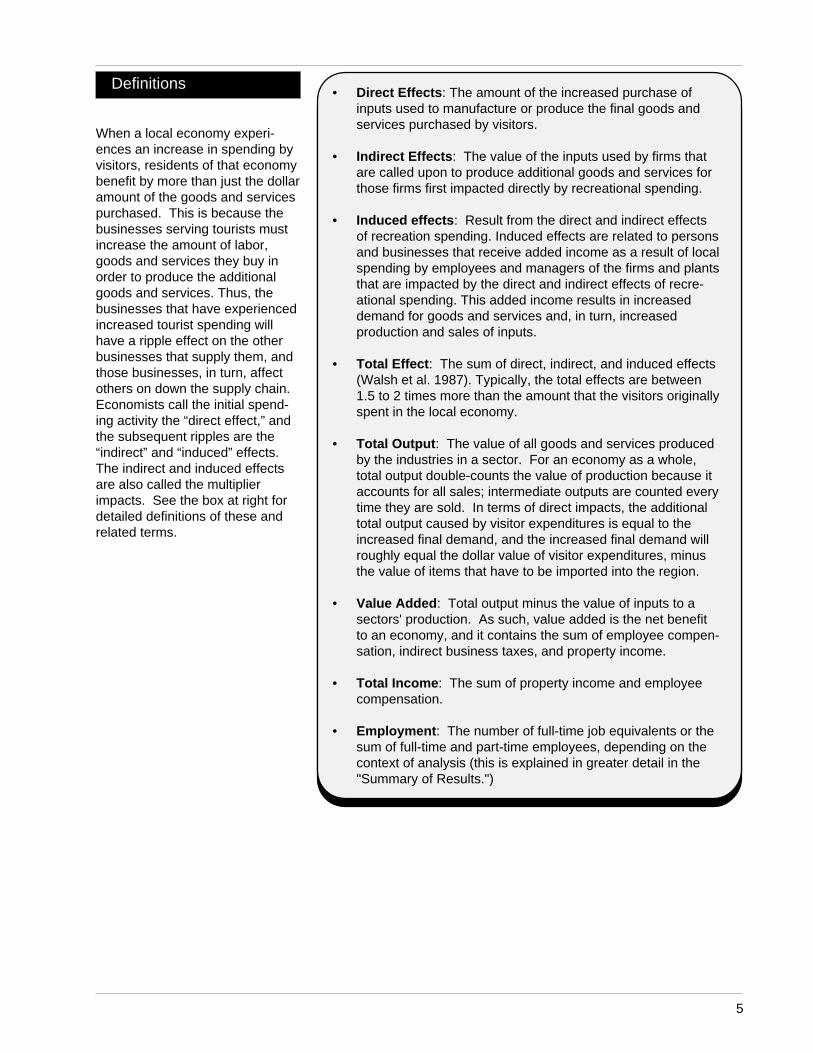
When a local economy experi-ences an increase in spending byvisitors, residents of that economybenefit by more than just the dollaramount of the goods and servicespurchased. This is because thebusinesses serving tourists mustincrease the amount of labor,goods and services they buy inorder to produce the additionalgoods and services. Thus, thebusinesses that have experiencedincreased tourist spending willhave a ripple effect on the otherbusinesses that supply them, andthose businesses, in turn, affectothers on down the supply chain.Economists call the initial spend-ing activity the “direct effect,” andthe subsequent ripples are the“indirect” and “induced” effects.The indirect and induced effectsare also called the multiplierimpacts. See the box at right fordetailed definitions of these andrelated terms.
• Direct Effects : The amount of the increased purchase ofinputs used to manufacture or produce the final goods andservices purchased by visitors.
• Indirect Effects : The value of the inputs used by firms thatare called upon to produce additional goods and services forthose firms first impacted directly by recreational spending.
• Induced effects : Result from the direct and indirect effectsof recreation spending. Induced effects are related to personsand businesses that receive added income as a result of localspending by employees and managers of the firms and plantsthat are impacted by the direct and indirect effects of recre-ational spending. This added income results in increaseddemand for goods and services and, in turn, increasedproduction and sales of inputs.
• Total Effect : The sum of direct, indirect, and induced effects(Walsh et al. 1987). Typically, the total effects are between1.5 to 2 times more than the amount that the visitors originallyspent in the local economy.
• Total Output : The value of all goods and services producedby the industries in a sector. For an economy as a whole,total output double-counts the value of production because itaccounts for all sales; intermediate outputs are counted everytime they are sold. In terms of direct impacts, the additionaltotal output caused by visitor expenditures is equal to theincreased final demand, and the increased final demand willroughly equal the dollar value of visitor expenditures, minusthe value of items that have to be imported into the region.
• Value Added : Total output minus the value of inputs to asectors' production. As such, value added is the net benefitto an economy, and it contains the sum of employee compen-sation, indirect business taxes, and property income.
• Total Income : The sum of property income and employeecompensation.
• Employment : The number of full-time job equivalents or thesum of full-time and part-time employees, depending on thecontext of analysis (this is explained in greater detail in the"Summary of Results.")
6666p6
Summary of Results
Monroe County
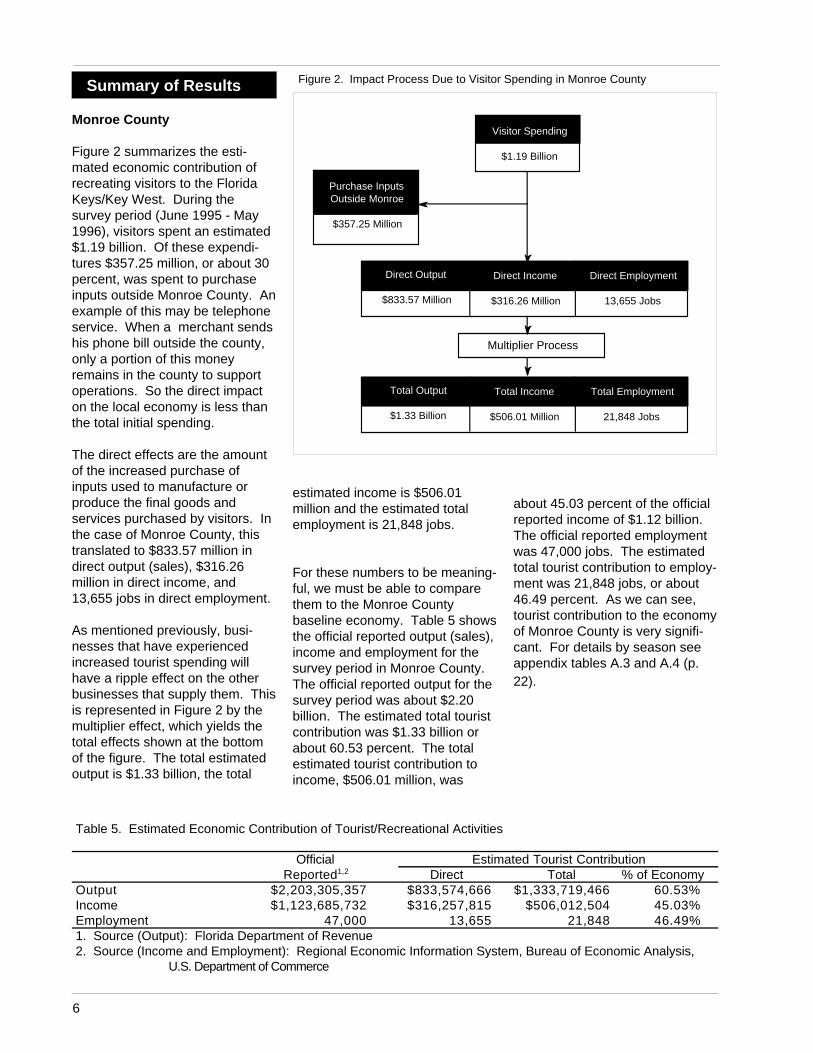
Figure 2 summarizes the esti-mated economic contribution ofrecreating visitors to the FloridaKeys/Key West. During thesurvey period (June 1995 - May1996), visitors spent an estimated$1.19 billion. Of these expendi-tures $357.25 million, or about 30percent, was spent to purchaseinputs outside Monroe County. Anexample of this may be telephoneservice. When a merchant sendshis phone bill outside the county,only a portion of this moneyremains in the county to supportoperations. So the direct impacton the local economy is less thanthe total initial spending.
The direct effects are the amountof the increased purchase ofinputs used to manufacture orproduce the final goods andservices purchased by visitors. Inthe case of Monroe County, thistranslated to $833.57 million indirect output (sales), $316.26million in direct income, and13,655 jobs in direct employment.
As mentioned previously, busi-nesses that have experiencedincreased tourist spending willhave a ripple effect on the otherbusinesses that supply them. Thisis represented in Figure 2 by themultiplier effect, which yields thetotal effects shown at the bottomof the figure. The total estimatedoutput is $1.33 billion, the total
about 45.03 percent of the officialreported income of $1.12 billion.The official reported employmentwas 47,000 jobs. The estimatedtotal tourist contribution to employ-ment was 21,848 jobs, or about46.49 percent. As we can see,tourist contribution to the economyof Monroe County is very signifi-cant. For details by season seeappendix tables A.3 and A.4 (p.22).
estimated income is $506.01million and the estimated totalemployment is 21,848 jobs.
For these numbers to be meaning-ful, we must be able to comparethem to the Monroe Countybaseline economy. Table 5 showsthe official reported output (sales),income and employment for thesurvey period in Monroe County.The official reported output for thesurvey period was about $2.20billion. The estimated total touristcontribution was $1.33 billion orabout 60.53 percent. The totalestimated tourist contribution toincome, $506.01 million, was
Figure 2. Impact Process Due to Visitor Spending in Monroe County
Multiplier Process
Visitor Spending
$1.19 Billion
Purchase InputsOutside Monroe
$357.25 Million
Direct Output
$833.57 Million
Direct Income
$316.26 Million
Direct Employment
13,655 Jobs
Total Income
$506.01 Million
Total Employment
21,848 Jobs
Total Output
$1.33 Billion
Table 5. Estimated Economic Contribution of Tourist/Recreational Activities
Official Estimated Tourist ContributionReported1,2 Direct Total % of Economy
Output $2,203,305,357 $833,574,666 $1,333,719,466 60.53%Income $1,123,685,732 $316,257,815 $506,012,504 45.03%Employment 47,000 13,655 21,848 46.49%1. Source (Output): Florida Department of Revenue2. Source (Income and Employment): Regional Economic Information System, Bureau of Economic Analysis, U.S. Department of Commerce
7
South Florida
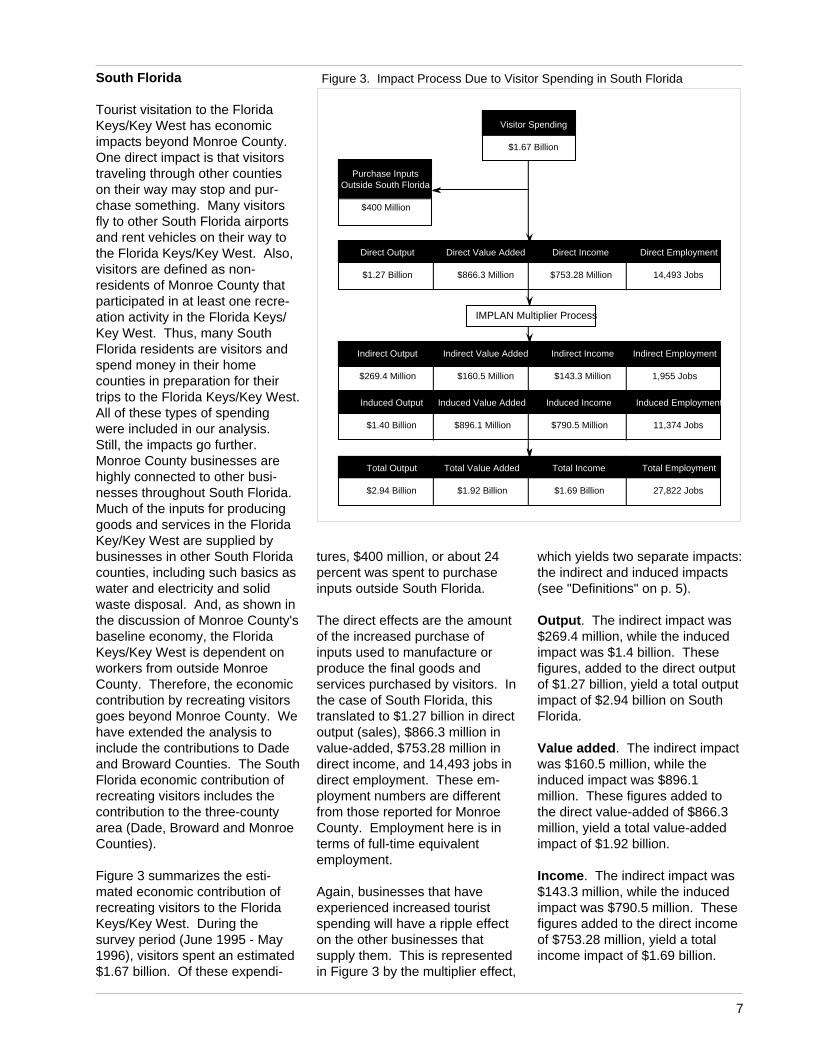
Tourist visitation to the FloridaKeys/Key West has economicimpacts beyond Monroe County.One direct impact is that visitorstraveling through other countieson their way may stop and pur-chase something. Many visitorsfly to other South Florida airportsand rent vehicles on their way tothe Florida Keys/Key West. Also,visitors are defined as non-residents of Monroe County thatparticipated in at least one recre-ation activity in the Florida Keys/Key West. Thus, many SouthFlorida residents are visitors andspend money in their homecounties in preparation for theirtrips to the Florida Keys/Key West.All of these types of spendingwere included in our analysis.Still, the impacts go further.Monroe County businesses arehighly connected to other busi-nesses throughout South Florida.Much of the inputs for producinggoods and services in the FloridaKey/Key West are supplied bybusinesses in other South Floridacounties, including such basics aswater and electricity and solidwaste disposal. And, as shown inthe discussion of Monroe County'sbaseline economy, the FloridaKeys/Key West is dependent onworkers from outside MonroeCounty. Therefore, the economiccontribution by recreating visitorsgoes beyond Monroe County. Wehave extended the analysis toinclude the contributions to Dadeand Broward Counties. The SouthFlorida economic contribution ofrecreating visitors includes thecontribution to the three-countyarea (Dade, Broward and MonroeCounties).
Figure 3 summarizes the esti-mated economic contribution ofrecreating visitors to the FloridaKeys/Key West. During thesurvey period (June 1995 - May1996), visitors spent an estimated$1.67 billion. Of these expendi-
tures, $400 million, or about 24percent was spent to purchaseinputs outside South Florida.
The direct effects are the amountof the increased purchase ofinputs used to manufacture orproduce the final goods andservices purchased by visitors. Inthe case of South Florida, thistranslated to $1.27 billion in directoutput (sales), $866.3 million invalue-added, $753.28 million indirect income, and 14,493 jobs indirect employment. These em-ployment numbers are differentfrom those reported for MonroeCounty. Employment here is interms of full-time equivalentemployment.
Again, businesses that haveexperienced increased touristspending will have a ripple effecton the other businesses thatsupply them. This is representedin Figure 3 by the multiplier effect,
which yields two separate impacts:the indirect and induced impacts(see "Definitions" on p. 5).
Output . The indirect impact was$269.4 million, while the inducedimpact was $1.4 billion. Thesefigures, added to the direct outputof $1.27 billion, yield a total outputimpact of $2.94 billion on SouthFlorida.
Value added . The indirect impactwas $160.5 million, while theinduced impact was $896.1million. These figures added tothe direct value-added of $866.3million, yield a total value-addedimpact of $1.92 billion.
Income . The indirect impact was$143.3 million, while the inducedimpact was $790.5 million. Thesefigures added to the direct incomeof $753.28 million, yield a totalincome impact of $1.69 billion.
Figure 3. Impact Process Due to Visitor Spending in South Florida
IMPLAN Multiplier Process
Visitor Spending
$1.67 Billion
Purchase InputsOutside South Florida
$400 Million
Direct Output
$1.27 Billion
Direct Value Added
$866.3 Million
Direct Income
$753.28 Million
Direct Employment
14,493 Jobs
Indirect Output
$269.4 Million
Indirect Value Added
$160.5 Million
Indirect Income
$143.3 Million
Indirect Employment
1,955 Jobs
Induced Output
$1.40 Billion
Induced Value Added
$896.1 Million
Induced Income
$790.5 Million
Induced Employment
11,374 Jobs
Total Output
$2.94 Billion
Total Value Added
$1.92 Billion
Total Income
$1.69 Billion
Total Employment
27,822 Jobs
8888p8
Employment . The indirect impactwas 1,955 jobs, while the inducedimpact was 11,374 jobs. Thesefigures, added to the direct impactof 14,493 jobs, yield a total impactof 27,822 full-time equivalent jobs.
For greater details by season andby sector for South Florida seeappendix tables A.3 and A.5 (pp.22-23).
Net contribution to Dade andBroward Counties . Visitors tothe Florida Keys/Key West madean economic contribution to Dadeand Broward Counties of about$1.61 billion in output (sales),$1.37 billion in income, and about8,300 full-time equivalent jobs.Thus, the economies of Dade andBroward Counties are somewhatconnected to recreation/tourism inthe Florida Keys/Key West, andthese activities are highly depen-dent on the quality of the naturalresources and environment of theFlorida Keys/Key West. As aresult, Dade and Broward Coun-ties also have an economic stakein the protection of the environ-ment of the Florida Keys/KeyWest.
9
Methods
Background Concepts
According to export base theory,economic growth in an economy isdue to growth in exports. Pur-chases of local goods by nonresi-dents are exports, as they bringoutside dollars into the localregion. Thus, impacts in aneconomy attributable to recreationare traceable to nonresidents whospend money for locally soldgoods and services while onrecreation trips (English andBergstrom 1994). In essence,food, lodging, and similar itemspurchased during a recreation tripare "exported" to people livingoutside the local economy.
This study used two differentmethods of regional economicanalysis. For the three-countymodel we used input-outputanalysis, which is one of the mostwidely applied methods in regionaleconomic analysis (Miller andBlair, 1985). Input-output modelsbasically consist of a system inwhich linear equations are used todescribe the linkages amongproduction sectors in a giveneconomy. The I-O component ofour model is the IMPLAN model.Through IMPLAN, one canconstruct a tailor-made I-O modelfor any group of counties or states(Alward et al. 1985). IMPLAN has528 industrial sector categoriesthat can account for a variety ofrecreation purchase patterns(Alward and Lofting 1985). Soft-ware modules calculate the direct,indirect and induced effects ofrecreational spending or otherfinal demand vectors. Interindustrylinkages in the local economydetermine the total output, valueadded, personal income, andemployment impacts. The advan-tages and disadvantages ofIMPLAN are discussed elsewhere
(Alward and Lofting 1985; Alwardet al. 1985; Propst 1985; Hotvedtet al. 1988).
Expenditure items included in ourmailback questionnaire weredeveloped specifically to providevisitor expenditure data that arecompatible with the economicsectors in the IMPLAN model.Expenditures are reported for thepurchase of specific recreation-related commodities, i.e., goodsand services. However, thesecommodities often affect multipleindustrial sectors, and must beallocated as such. Thus, expendi-tures reported by visitors are oftenallocated to a larger number ofeconomic sectors. The process ofallocating expenditures to varioussectors requires a series oftransformations that establish therelationship between visitorexpenditures and the sectors ofthe economy modeled by IM-PLAN. The allocations are basedon information from the Bureau ofEconomic Analysis (BEA) oncommodity and service productioncosts and the relationship betweennational average purchase prices,production costs, transportationcosts, and retail and wholesalemargins. The allocations used inthis report can be found in Englishet al. (1995).
Once expenditures are allocatedto the IMPLAN sectors, the meanexpenditure per person per trip foreach sector is calculated. Themean expenditure per person pertrip in each sector has beenmultiplied by our estimate of totalvisitation, and this is entered as afinal demand vector for impactanalysis in IMPLAN. The IMPLANsoftware calculates the effect ofrecreation expenditures on theimpact area economy. Economiceffects are reported as totaloutput, value-added, total incomeand employment.
For a market area with the smallsize and unique characteristics ofMonroe County, using IMPLANwas not feasible. When attempt-ing the analysis with IMPLAN itwas discovered that there was atendency for overestimation ofimpacts. Monroe County hasmany links to the surroundingSouth Florida economy. Properlycalibrating an IMPLAN model forMonroe County would requireadditional research to specify andnet-out transfers outside MonroeCounty. We decided that a moresimplified approach would bemore appropriate.
This approach uses Census ofBusiness wages-to-sales ratiosand wages-to-employment ratiosspecific to Monroe County, andapplies them to spending esti-mates (Bell and Leeworthy 1986).Spending categories are matchedto Standard Industrial Classifica-tions (SICs). This approach alsouses relationships from BEAbetween income from wages andsalaries and from proprietors toestimate total direct impacts. Inthis case, we calculated estimatedexpenditures (mean expendituresper person per trip multiplied byestimated person-trips) andapplied the wages-to-sales ratioby SIC based on the 1992 Censusof Business (see appendix tableA.2) to get estimated wages byspending category. We thendivided estimated wages by thewages-to-employment ratio by SICto get estimated employment byspending category. We thenapplied a multiplier of 1.6(Kearney/Centaur 1990; Bell1991) to the three direct measuresto derive total impact measures(see appendix table A.4). Notethat under this approach, wecannot estimate value-added, norcan we separately estimateindirect or induced effects.
10101010p10
Survey Design
Research Methods . Because ofthe many and varied goals of thisproject, a split sample design wasdeveloped. There were twocomponents of the survey: anonsite survey and a mailbacksurvey. This design allows thepursuit of multiple objectiveswithout overburdening any onesample of respondents. Thesurvey was conducted in two timeperiods. The first was in July andAugust of 1995. In this timeperiod, 1,334nsight exit interviewswere completed. Of these respon-dents, 505 also completed ex-penditure mailback question-naires. The second time period inwhich data was collected wasJanuary through April of 1996. Inthis time period, 2,250 onsite exitinterviews were completed, with1,036 of these respondents alsocompleting expenditure mailbackquestionnaires.
The onsite survey is a stratifiedrandom sample of all visitors tothe Florida Keys, and is stratifiedby mode of travel (air, auto, cruiseship) and by season. By tying thissample to data on car counts, airemplanement counts, and cruiseship passenger counts, estimatesof the number of person-trips canbe developed. This can be furtherbroken down into estimates of thenumber of person-trips by activity(for all activities) and by broadgeographic regions within theFlorida Keys (Upper Keys, MiddleKeys, Lower Keys, Key West).This sample is also used to obtainoverall profiles of the visitorpopulation in terms of age, sex,race, income, and place of resi-dence. The onsite sample wasused here to weight the expendi-ture mailback data to account forpossible non-response bias, andto provide the estimates of totalvisitation, which were used toextrapolate the expendituremailback sample to total visitorexpenditures for each season.
Detailed visitor profiles can befound in Leeworthy and Wiley(1996); the methods for sampleweighting and estimation of totalvisitation are in Leeworthy (1996).
The expenditure mailback compo-nent obtains information on typesof accommodations, modes oftransportation and expendituresmade on the entire trip to theFlorida Keys. Spending estimatesare obtained for equipment andtravel and activities. Spending isbroken down by spending in theFlorida Keys versus areas outsidethe Keys while traveling to theKeys, as well as related spendingat home prior to the trip.
Mailback Response Rates. Asmentioned above, in the summersurvey, 1,334 visitors wereinterviewed in the onsite exitsurvey. Each of these individualsreceived an expenditure question-naire to fill out and mail back. Aftera reminder postcard and secondquestionnaire mailing, 505, or37.86 percent, responded to themailback expenditure survey. Inthe winter survey, 2,250 onsitevisitors were interviewed duringJanuary-April 1996. Secondquestionnaires were mailed tonon-respondents in March (234were mailed), April (365) and May(571). A total of 1,036 people, or46.04 percent of the onsitecontacts, responded to the mail-back expenditure survey.
Response rates to the expendituresurvey varied according to severalfactors, the most significant ofwhich was income. The analysis ofresponse rates indicates thepotential for non-response bias inthe expenditure mailback. Overalllow response rates, or low re-sponse rates for certain socioeco-nomic groups, do not necessarilylead to non-response bias inexpenditure amounts. For non-response bias to exist, there must
be a relationship between theamount spent during the recre-ation trip and socioeconomiccharacteristics that are related tosurvey response. We tested fornon-response bias using simpleunivariate non-parametric tests fordifferences by socioeconomicfactors and with a multivariate testusing linear regressions. Based onthe results of these tests, weconcluded that the socioeconomicgroups for which we had relativelylow response rates do not gener-ally appear to have significantlydifferent expenditures. For a moredetailed explanation of responserates, the problem of non-re-sponse bias and our testingprocedures, refer to the TechnicalAppendix (Leeworthy 1996).
Weighting. We took a multivari-ate approach to sample weighting.We first constructed a matrix ofthe sample by age, race/ethnicity,income, foreign versus domesticvisitors, and mailback respondentsand non-respondents. Thesamples were first weighted forthe distribution by mode of travelaccording to the populationestimates derived from our onsiteexit survey. We then created amatrix based on combinations ofthe other four attributes to weightfor non-response. Again, for amore detailed explanation ofweighting, please refer to theTechnical Appendix (Leeworthy1996).
Expenditures.
Per Person Per Trip. Expendi-ture information was collected ona per group, per trip basis. Whenrespondents were interviewedonsite, they were asked if theypaid their own expenses, sharedexpenses with others, or if some-one else paid their expenses. Ifthey paid their own expenses orshared expenses, they were givena mailback survey. If someoneelse paid their expenses, thatperson was identified and given a
11
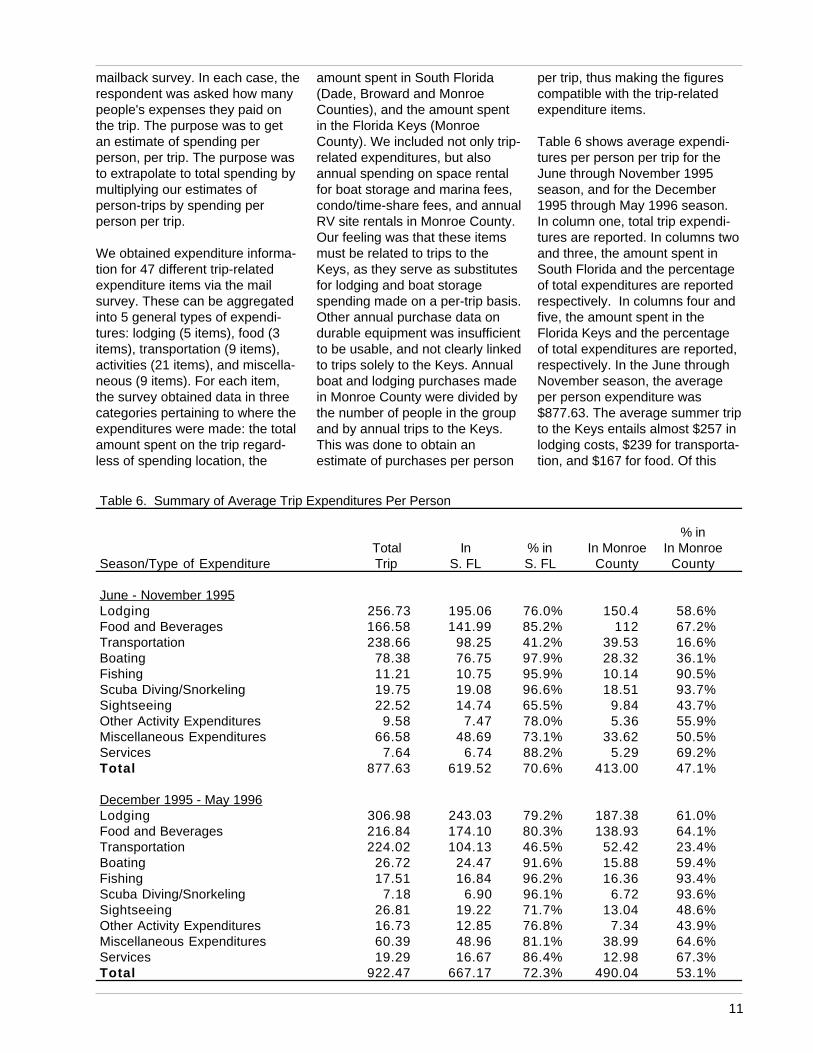
amount spent in South Florida(Dade, Broward and MonroeCounties), and the amount spentin the Florida Keys (MonroeCounty). We included not only trip-related expenditures, but alsoannual spending on space rentalfor boat storage and marina fees,condo/time-share fees, and annualRV site rentals in Monroe County.Our feeling was that these itemsmust be related to trips to theKeys, as they serve as substitutesfor lodging and boat storagespending made on a per-trip basis.Other annual purchase data ondurable equipment was insufficientto be usable, and not clearly linkedto trips solely to the Keys. Annualboat and lodging purchases madein Monroe County were divided bythe number of people in the groupand by annual trips to the Keys.This was done to obtain anestimate of purchases per person
per trip, thus making the figurescompatible with the trip-relatedexpenditure items.
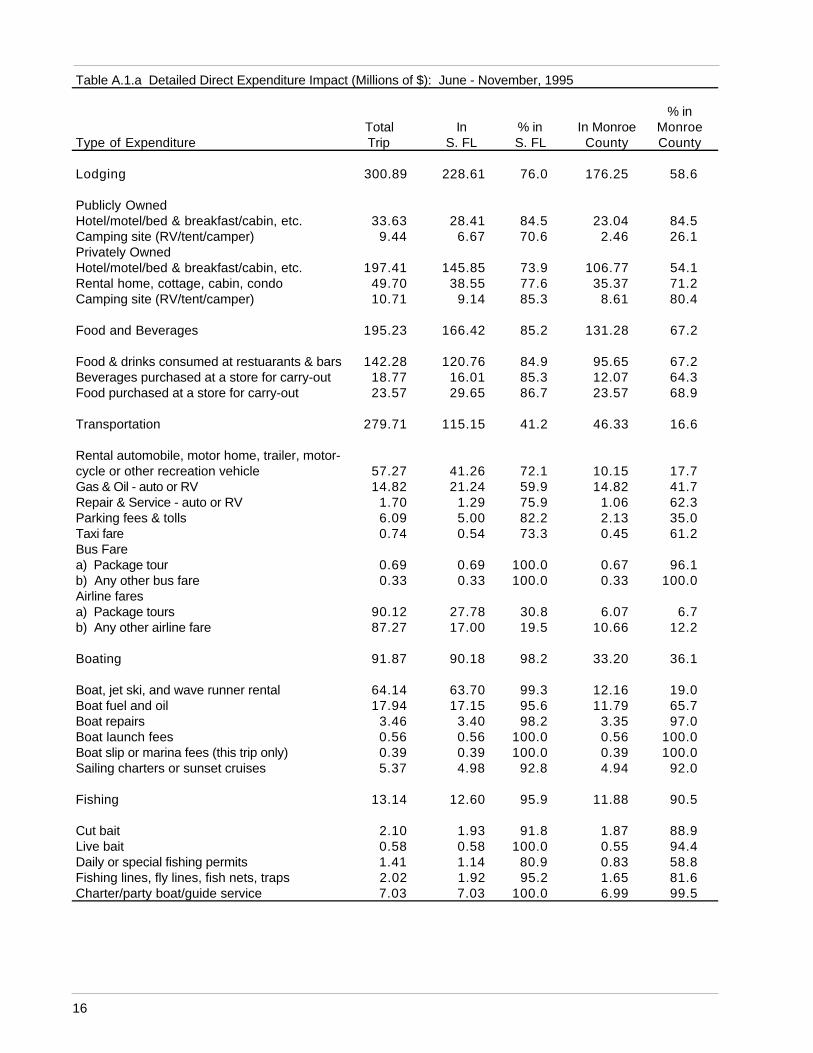
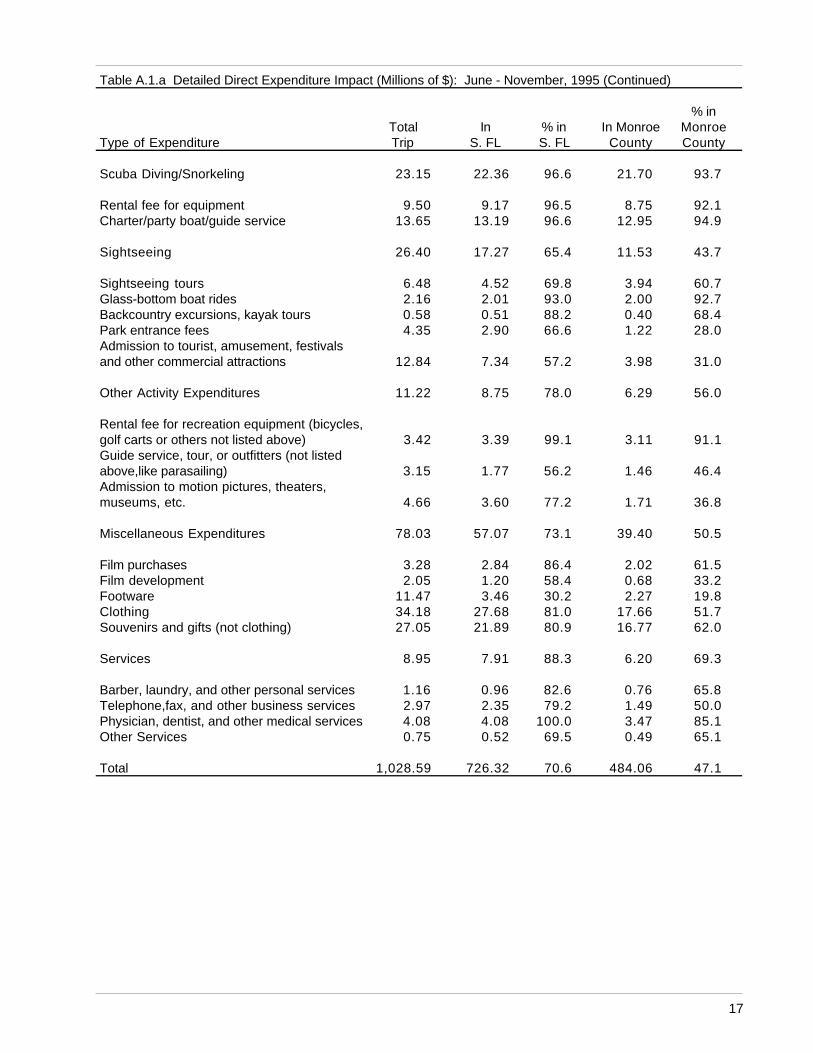
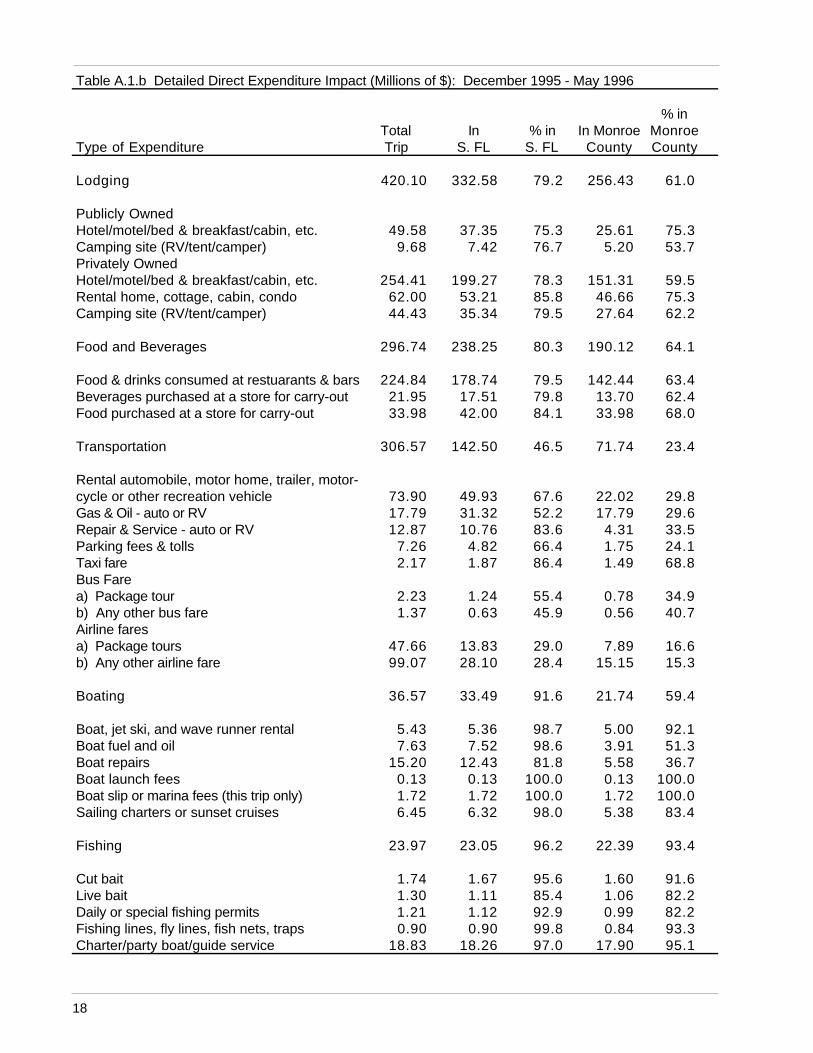
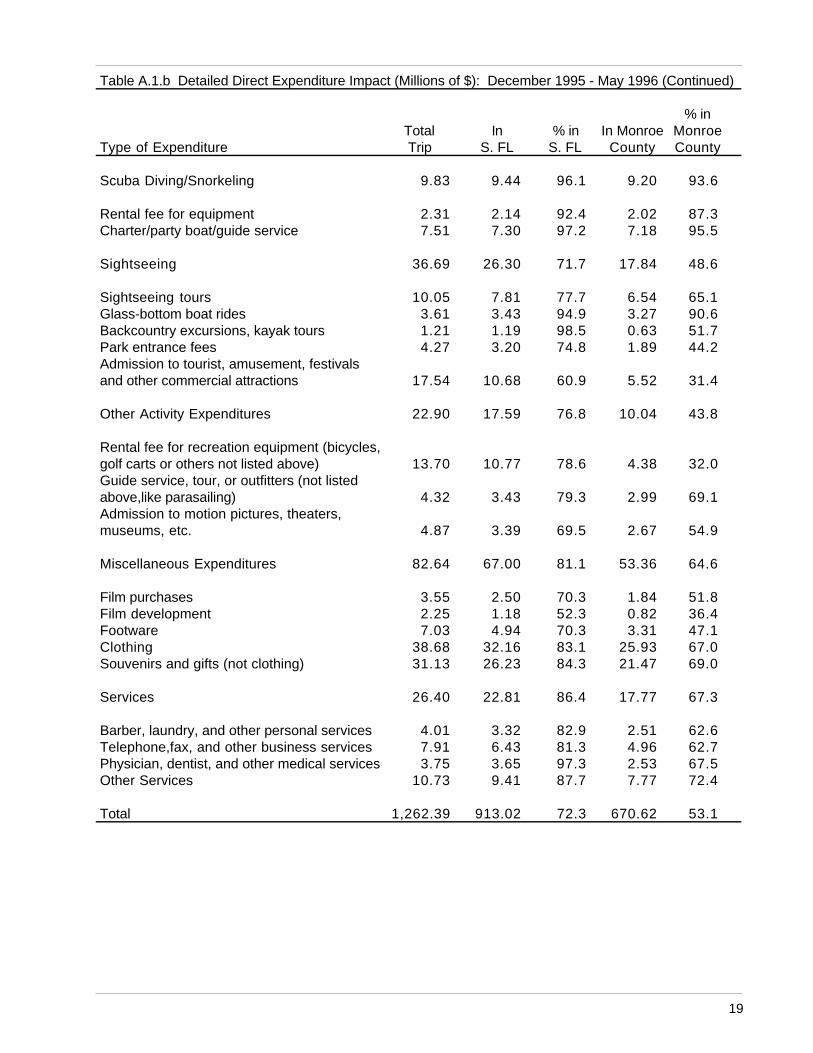
Table 6 shows average expendi-tures per person per trip for theJune through November 1995season, and for the December1995 through May 1996 season.In column one, total trip expendi-tures are reported. In columns twoand three, the amount spent inSouth Florida and the percentageof total expenditures are reportedrespectively. In columns four andfive, the amount spent in theFlorida Keys and the percentageof total expenditures are reported,respectively. In the June throughNovember season, the averageper person expenditure was$877.63. The average summer tripto the Keys entails almost $257 inlodging costs, $239 for transporta-tion, and $167 for food. Of this
mailback survey. In each case, therespondent was asked how manypeople's expenses they paid onthe trip. The purpose was to getan estimate of spending perperson, per trip. The purpose wasto extrapolate to total spending bymultiplying our estimates ofperson-trips by spending perperson per trip.
We obtained expenditure informa-tion for 47 different trip-relatedexpenditure items via the mailsurvey. These can be aggregatedinto 5 general types of expendi-tures: lodging (5 items), food (3items), transportation (9 items),activities (21 items), and miscella-neous (9 items). For each item,the survey obtained data in threecategories pertaining to where theexpenditures were made: the totalamount spent on the trip regard-less of spending location, the
Table 6. Summary of Average Trip Expenditures Per Person
% inTotal In % in In Monroe In Monroe
Season/Type of Expenditure Trip S. FL S. FL County County
June - November 1995Lodging 256.73 195.06 76.0% 150.4 58.6%Food and Beverages 166.58 141.99 85.2% 112 67.2%Transportation 238.66 98.25 41.2% 39.53 16.6%Boating 78.38 76.75 97.9% 28.32 36.1%Fishing 11.21 10.75 95.9% 10.14 90.5%Scuba Diving/Snorkeling 19.75 19.08 96.6% 18.51 93.7%Sightseeing 22.52 14.74 65.5% 9.84 43.7%Other Activity Expenditures 9.58 7.47 78.0% 5.36 55.9%Miscellaneous Expenditures 66.58 48.69 73.1% 33.62 50.5%Services 7.64 6.74 88.2% 5.29 69.2%Total 877.63 619.52 70.6% 413.00 47.1%
December 1995 - May 1996Lodging 306.98 243.03 79.2% 187.38 61.0%Food and Beverages 216.84 174.10 80.3% 138.93 64.1%Transportation 224.02 104.13 46.5% 52.42 23.4%Boating 26.72 24.47 91.6% 15.88 59.4%Fishing 17.51 16.84 96.2% 16.36 93.4%Scuba Diving/Snorkeling 7.18 6.90 96.1% 6.72 93.6%Sightseeing 26.81 19.22 71.7% 13.04 48.6%Other Activity Expenditures 16.73 12.85 76.8% 7.34 43.9%Miscellaneous Expenditures 60.39 48.96 81.1% 38.99 64.6%Services 19.29 16.67 86.4% 12.98 67.3%Total 922.47 667.17 72.3% 490.04 53.1%
12121212p12
total expenditure amount, 70.6percent (about $620) was spent inSouth Florida, including $195 forlodging, $142 for food, and $128for activity-related items. About 47percent (about $413) of all tripexpenses were made in theFlorida Keys, including about $150for lodging, $112 for food, $72 foractivities, and $40 for transporta-tion.
On average, winter visitors spendabout $922.47 per person for a tripto the Keys. Included in this total isabout $307 for lodging, $224 fortransportation, and $217 for food.Of the total trip spending, 72.3percent was spent in SouthFlorida, while 53.1 percent wasspent in the Florida Keys. Of themoney spent in South Florida,lodging ($243) is the largestexpenditure category, followed byfood and beverages ($174) andtransportation ($104). Of themoney spent in Monroe County,nearly 40 percent (about $187) isfor lodging, and almost 29 percent($139) is for food.
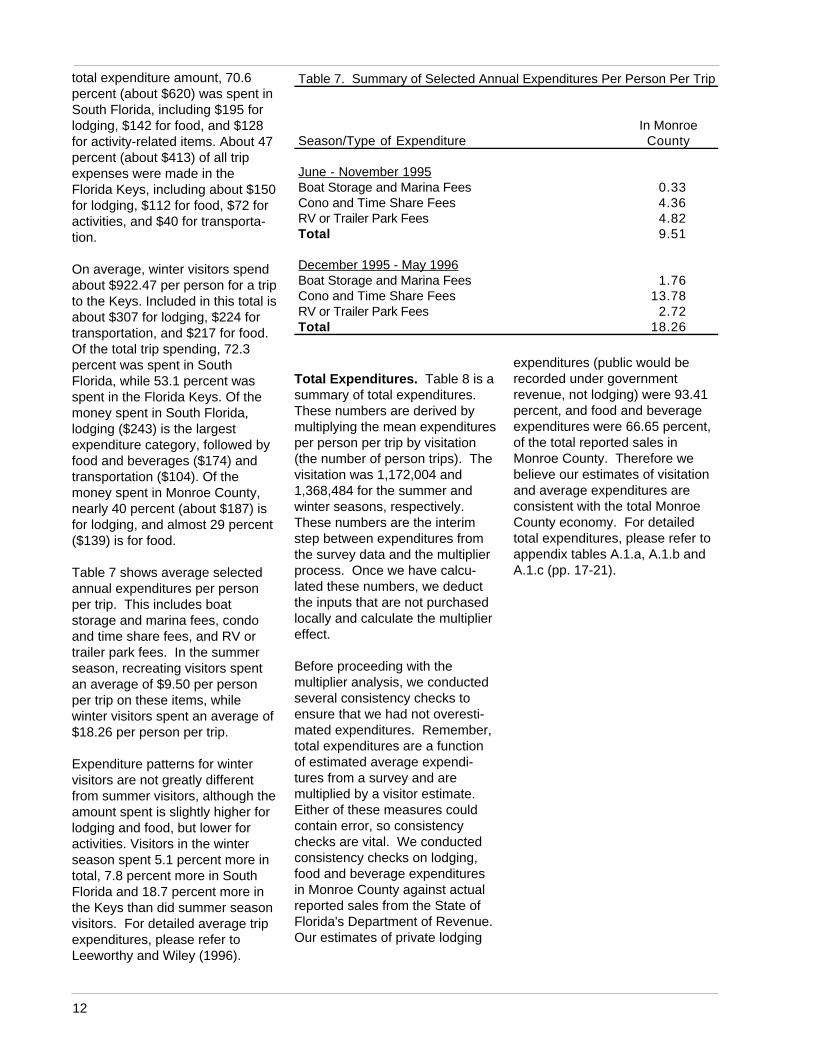
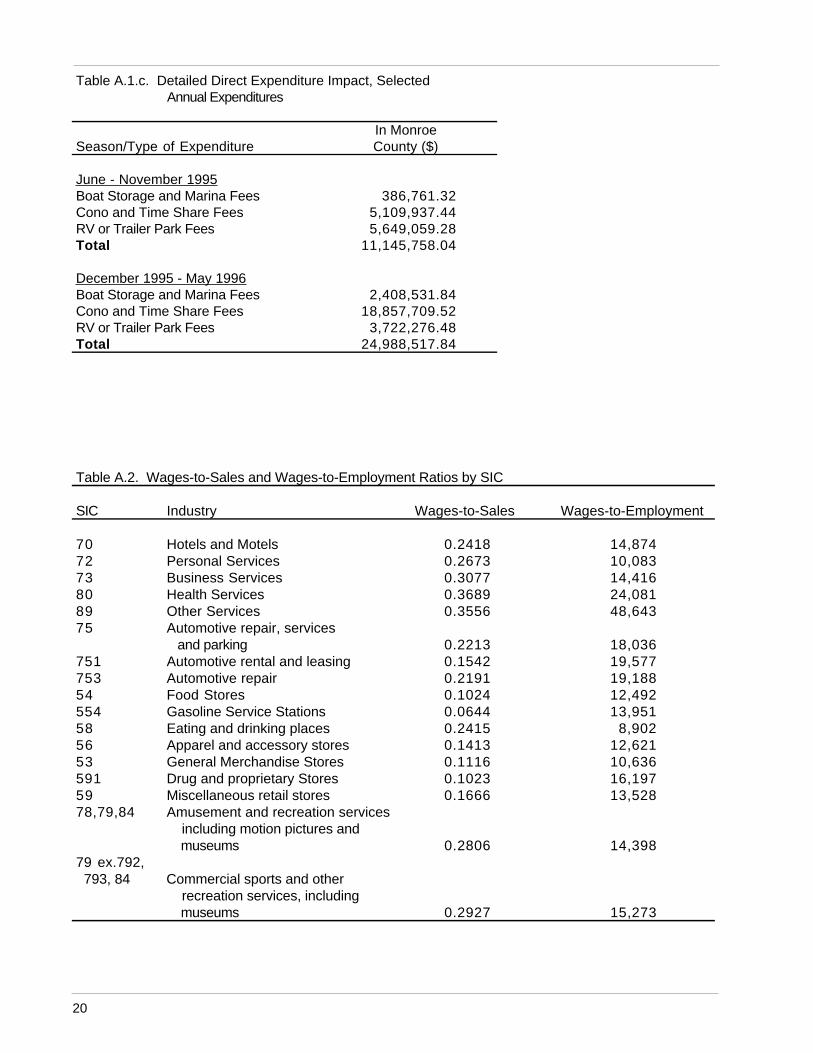
Table 7 shows average selectedannual expenditures per personper trip. This includes boatstorage and marina fees, condoand time share fees, and RV ortrailer park fees. In the summerseason, recreating visitors spentan average of $9.50 per personper trip on these items, whilewinter visitors spent an average of$18.26 per person per trip.
Expenditure patterns for wintervisitors are not greatly differentfrom summer visitors, although theamount spent is slightly higher forlodging and food, but lower foractivities. Visitors in the winterseason spent 5.1 percent more intotal, 7.8 percent more in SouthFlorida and 18.7 percent more inthe Keys than did summer seasonvisitors. For detailed average tripexpenditures, please refer toLeeworthy and Wiley (1996).
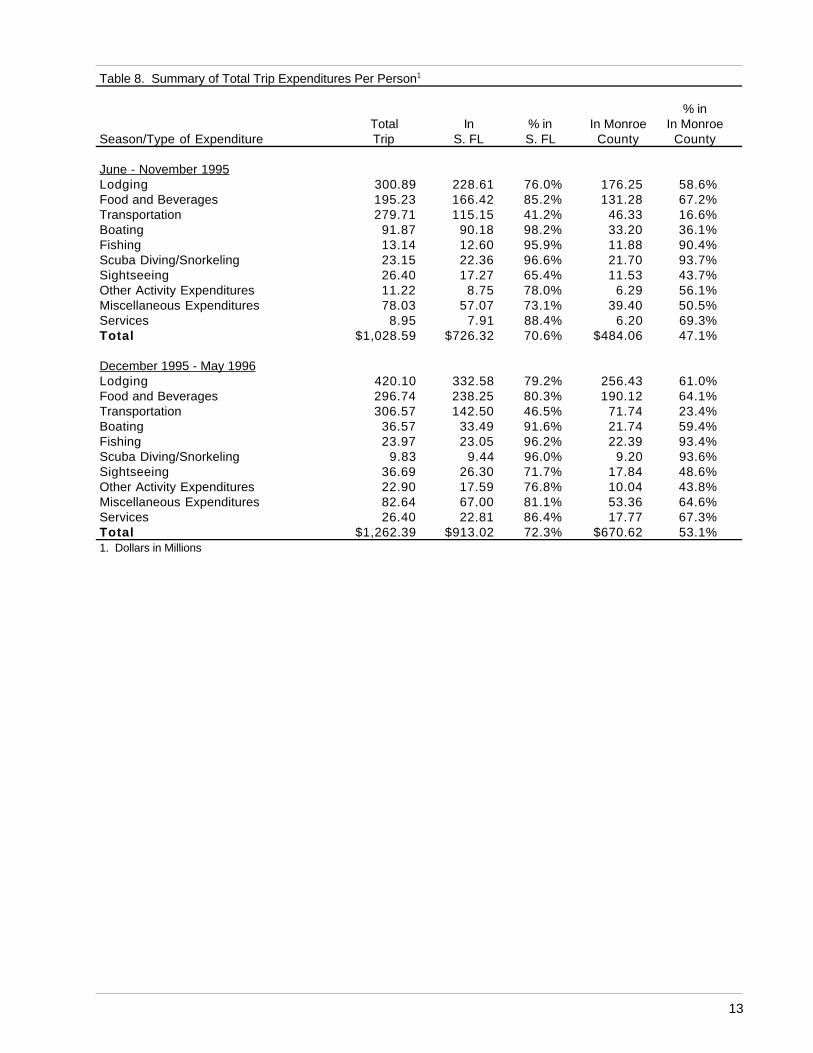
Total Expenditures. Table 8 is asummary of total expenditures.These numbers are derived bymultiplying the mean expendituresper person per trip by visitation(the number of person trips). Thevisitation was 1,172,004 and1,368,484 for the summer andwinter seasons, respectively.These numbers are the interimstep between expenditures fromthe survey data and the multiplierprocess. Once we have calcu-lated these numbers, we deductthe inputs that are not purchasedlocally and calculate the multipliereffect.
Before proceeding with themultiplier analysis, we conductedseveral consistency checks toensure that we had not overesti-mated expenditures. Remember,total expenditures are a functionof estimated average expendi-tures from a survey and aremultiplied by a visitor estimate.Either of these measures couldcontain error, so consistencychecks are vital. We conductedconsistency checks on lodging,food and beverage expendituresin Monroe County against actualreported sales from the State ofFlorida's Department of Revenue.Our estimates of private lodging
expenditures (public would berecorded under governmentrevenue, not lodging) were 93.41percent, and food and beverageexpenditures were 66.65 percent,of the total reported sales inMonroe County. Therefore webelieve our estimates of visitationand average expenditures areconsistent with the total MonroeCounty economy. For detailedtotal expenditures, please refer toappendix tables A.1.a, A.1.b andA.1.c (pp. 17-21).
Table 7. Summary of Selected Annual Expenditures Per Person Per Trip
In MonroeSeason/Type of Expenditure County
June - November 1995Boat Storage and Marina Fees 0.33Cono and Time Share Fees 4.36RV or Trailer Park Fees 4.82Total 9.51
December 1995 - May 1996Boat Storage and Marina Fees 1.76Cono and Time Share Fees 13.78RV or Trailer Park Fees 2.72Total 18.26
13
Table 8. Summary of Total Trip Expenditures Per Person1
% inTotal In % in In Monroe In Monroe
Season/Type of Expenditure Trip S. FL S. FL County County
June - November 1995Lodging 300.89 228.61 76.0% 176.25 58.6%Food and Beverages 195.23 166.42 85.2% 131.28 67.2%Transportation 279.71 115.15 41.2% 46.33 16.6%Boating 91.87 90.18 98.2% 33.20 36.1%Fishing 13.14 12.60 95.9% 11.88 90.4%Scuba Diving/Snorkeling 23.15 22.36 96.6% 21.70 93.7%Sightseeing 26.40 17.27 65.4% 11.53 43.7%Other Activity Expenditures 11.22 8.75 78.0% 6.29 56.1%Miscellaneous Expenditures 78.03 57.07 73.1% 39.40 50.5%Services 8.95 7.91 88.4% 6.20 69.3%Total $1,028.59 $726.32 70.6% $484.06 47.1%
December 1995 - May 1996Lodging 420.10 332.58 79.2% 256.43 61.0%Food and Beverages 296.74 238.25 80.3% 190.12 64.1%Transportation 306.57 142.50 46.5% 71.74 23.4%Boating 36.57 33.49 91.6% 21.74 59.4%Fishing 23.97 23.05 96.2% 22.39 93.4%Scuba Diving/Snorkeling 9.83 9.44 96.0% 9.20 93.6%Sightseeing 36.69 26.30 71.7% 17.84 48.6%Other Activity Expenditures 22.90 17.59 76.8% 10.04 43.8%Miscellaneous Expenditures 82.64 67.00 81.1% 53.36 64.6%Services 26.40 22.81 86.4% 17.77 67.3%Total $1,262.39 $913.02 72.3% $670.62 53.1%1. Dollars in Millions
14141414p14
References
Alward, G. S., H. G. Davis, K. A. Despotakis and E. M. Lofting. 1985. Regional Non-survey Input-Output Analysis with IMPLAN. Washington, DC: Southern Regional Science Association.
Alward, G. S. and E. M. Lofting. 1985. Opportunities for Analyzing the Economic Impacts of Recreation and Tourism Expenditures Using IMPLAN. Philadelphia, PA: Southern Regional Science Association.
Bell, F. W. 1991. An Analysis of the Economic Base of Monroe County, Florida with Implications for Oil and Gas Exploration, 1969 - 1988. Working Paper. Department of Economics, Florida State University. Tallahassee, FL: FSU
Bell, F. W. and V. R. Leeworthy. 1986. An Economic Analysis of the Importance of Saltwater Beaches in Florida. Report Number 82, Sea Grant Project No. R/C-P-12, Grant Number NA80AA-D-00038. Florida Sea Grant College, Department of Economics. Florida State University. Tallahasee, FL: FSU
Bergstrom, J. C., H. K. Cordell, A. E. Watson and G. A. Ashley. 1990. Economic Impacts of State Parks on State Economies in the South. Southern Journal of Agricultural Economics 22(1990):69-77.
English, D. B. K. and J. C. Bergstrom. The Conceptual Links Between Recreation Site Development and Regional Economic Impacts. Journal of Regional Science 34(1994):599-611.
English, D. B. K., J. M. Bowker, J. C. Bergstrom, and H. K. Cordell. 1995. Estimating the Economic Impacts of Recreation Response to Resource Management Alternatives. General Technical Report SE-91. USDA Forest Service, Southern Research Station. 24pp.
Hotvedt, J. E., R. L. Busby and R. E. Jacob. 1988. Use of IMPLAN for Regional Input-Output Studies. Buena Vista, Florida: Southern Forest Economic Association.
Kearney/Centaur. 1990. Impacts of Oil and Gas Development on the Recreation and Tourism off the Florida Straits. Herndon, VA: U.S. Department of the Interior.
Leeworthy, Vernon R. 1996. Linking the Economy and Environment of the Florida Keys/ Florida Bay: Technical Appendix. Silver Spring, MD: National Oceanic and Atmospheric Administration.
Leeworthy, Vernon R. and Wiley, Peter C. 1996 Visitor Profiles: Florida Keys/ Key West. Silver Spring, MD: National Oceanic and Atmospheric Administration.
Johnson, R.L. and E. Moore. Tourism Impact Estimation. Annals of Tourism Research 20(1993):279-288.
Miller, R. E. and P.D. Blair. 1985. Input-Output Analysis: Foundations and Extensions. Englewood Cliffs, NJ: Prentice-Hall, Inc.
Propst, D., 1985. Use of IMPLAN with the Public Area Recreation Visitor Survey (PARVS) Pretest Data: Findings and Recommendations. East Lansing, MI: Michigan State University.
Walsh, R.G. et al. 1987. Wildlife and fish use assessment: long-run forecasts of participation in fishing, hunting, and non-consumptive wildlife recreation. Colorado State University, Technical Report 50.

15
Appendix
16161616p16
Table A.1.a Detailed Direct Expenditure Impact (Millions of $): June - November, 1995
% inTotal In % in In Monroe Monroe
Type of Expenditure Trip S. FL S. FL County County
Lodging 300.89 228.61 76.0 176.25 58.6
Publicly OwnedHotel/motel/bed & breakfast/cabin, etc. 33.63 28.41 84.5 23.04 84.5Camping site (RV/tent/camper) 9.44 6.67 70.6 2.46 26.1Privately OwnedHotel/motel/bed & breakfast/cabin, etc. 197.41 145.85 73.9 106.77 54.1Rental home, cottage, cabin, condo 49.70 38.55 77.6 35.37 71.2Camping site (RV/tent/camper) 10.71 9.14 85.3 8.61 80.4
Food and Beverages 195.23 166.42 85.2 131.28 67.2
Food & drinks consumed at restuarants & bars 142.28 120.76 84.9 95.65 67.2Beverages purchased at a store for carry-out 18.77 16.01 85.3 12.07 64.3Food purchased at a store for carry-out 23.57 29.65 86.7 23.57 68.9
Transportation 279.71 115.15 41.2 46.33 16.6
Rental automobile, motor home, trailer, motor-cycle or other recreation vehicle 57.27 41.26 72.1 10.15 17.7Gas & Oil - auto or RV 14.82 21.24 59.9 14.82 41.7Repair & Service - auto or RV 1.70 1.29 75.9 1.06 62.3Parking fees & tolls 6.09 5.00 82.2 2.13 35.0Taxi fare 0.74 0.54 73.3 0.45 61.2Bus Farea) Package tour 0.69 0.69 100.0 0.67 96.1b) Any other bus fare 0.33 0.33 100.0 0.33 100.0Airline faresa) Package tours 90.12 27.78 30.8 6.07 6.7b) Any other airline fare 87.27 17.00 19.5 10.66 12.2
Boating 91.87 90.18 98.2 33.20 36.1
Boat, jet ski, and wave runner rental 64.14 63.70 99.3 12.16 19.0Boat fuel and oil 17.94 17.15 95.6 11.79 65.7Boat repairs 3.46 3.40 98.2 3.35 97.0Boat launch fees 0.56 0.56 100.0 0.56 100.0Boat slip or marina fees (this trip only) 0.39 0.39 100.0 0.39 100.0Sailing charters or sunset cruises 5.37 4.98 92.8 4.94 92.0
Fishing 13.14 12.60 95.9 11.88 90.5
Cut bait 2.10 1.93 91.8 1.87 88.9Live bait 0.58 0.58 100.0 0.55 94.4Daily or special fishing permits 1.41 1.14 80.9 0.83 58.8Fishing lines, fly lines, fish nets, traps 2.02 1.92 95.2 1.65 81.6Charter/party boat/guide service 7.03 7.03 100.0 6.99 99.5
17
Table A.1.a Detailed Direct Expenditure Impact (Millions of $): June - November, 1995 (Continued)
% inTotal In % in In Monroe Monroe
Type of Expenditure Trip S. FL S. FL County County
Scuba Diving/Snorkeling 23.15 22.36 96.6 21.70 93.7
Rental fee for equipment 9.50 9.17 96.5 8.75 92.1Charter/party boat/guide service 13.65 13.19 96.6 12.95 94.9
Sightseeing 26.40 17.27 65.4 11.53 43.7
Sightseeing tours 6.48 4.52 69.8 3.94 60.7Glass-bottom boat rides 2.16 2.01 93.0 2.00 92.7Backcountry excursions, kayak tours 0.58 0.51 88.2 0.40 68.4Park entrance fees 4.35 2.90 66.6 1.22 28.0Admission to tourist, amusement, festivalsand other commercial attractions 12.84 7.34 57.2 3.98 31.0
Other Activity Expenditures 11.22 8.75 78.0 6.29 56.0
Rental fee for recreation equipment (bicycles,golf carts or others not listed above) 3.42 3.39 99.1 3.11 91.1Guide service, tour, or outfitters (not listedabove,like parasailing) 3.15 1.77 56.2 1.46 46.4Admission to motion pictures, theaters,museums, etc. 4.66 3.60 77.2 1.71 36.8
Miscellaneous Expenditures 78.03 57.07 73.1 39.40 50.5
Film purchases 3.28 2.84 86.4 2.02 61.5Film development 2.05 1.20 58.4 0.68 33.2Footware 11.47 3.46 30.2 2.27 19.8Clothing 34.18 27.68 81.0 17.66 51.7Souvenirs and gifts (not clothing) 27.05 21.89 80.9 16.77 62.0
Services 8.95 7.91 88.3 6.20 69.3
Barber, laundry, and other personal services 1.16 0.96 82.6 0.76 65.8Telephone,fax, and other business services 2.97 2.35 79.2 1.49 50.0Physician, dentist, and other medical services 4.08 4.08 100.0 3.47 85.1Other Services 0.75 0.52 69.5 0.49 65.1
Total 1,028.59 726.32 70.6 484.06 47.1
18181818p18
Table A.1.b Detailed Direct Expenditure Impact (Millions of $): December 1995 - May 1996
% inTotal In % in In Monroe Monroe
Type of Expenditure Trip S. FL S. FL County County
Lodging 420.10 332.58 79.2 256.43 61.0
Publicly OwnedHotel/motel/bed & breakfast/cabin, etc. 49.58 37.35 75.3 25.61 75.3Camping site (RV/tent/camper) 9.68 7.42 76.7 5.20 53.7Privately OwnedHotel/motel/bed & breakfast/cabin, etc. 254.41 199.27 78.3 151.31 59.5Rental home, cottage, cabin, condo 62.00 53.21 85.8 46.66 75.3Camping site (RV/tent/camper) 44.43 35.34 79.5 27.64 62.2
Food and Beverages 296.74 238.25 80.3 190.12 64.1
Food & drinks consumed at restuarants & bars 224.84 178.74 79.5 142.44 63.4Beverages purchased at a store for carry-out 21.95 17.51 79.8 13.70 62.4Food purchased at a store for carry-out 33.98 42.00 84.1 33.98 68.0
Transportation 306.57 142.50 46.5 71.74 23.4
Rental automobile, motor home, trailer, motor-cycle or other recreation vehicle 73.90 49.93 67.6 22.02 29.8Gas & Oil - auto or RV 17.79 31.32 52.2 17.79 29.6Repair & Service - auto or RV 12.87 10.76 83.6 4.31 33.5Parking fees & tolls 7.26 4.82 66.4 1.75 24.1Taxi fare 2.17 1.87 86.4 1.49 68.8Bus Farea) Package tour 2.23 1.24 55.4 0.78 34.9b) Any other bus fare 1.37 0.63 45.9 0.56 40.7Airline faresa) Package tours 47.66 13.83 29.0 7.89 16.6b) Any other airline fare 99.07 28.10 28.4 15.15 15.3
Boating 36.57 33.49 91.6 21.74 59.4
Boat, jet ski, and wave runner rental 5.43 5.36 98.7 5.00 92.1Boat fuel and oil 7.63 7.52 98.6 3.91 51.3Boat repairs 15.20 12.43 81.8 5.58 36.7Boat launch fees 0.13 0.13 100.0 0.13 100.0Boat slip or marina fees (this trip only) 1.72 1.72 100.0 1.72 100.0Sailing charters or sunset cruises 6.45 6.32 98.0 5.38 83.4
Fishing 23.97 23.05 96.2 22.39 93.4
Cut bait 1.74 1.67 95.6 1.60 91.6Live bait 1.30 1.11 85.4 1.06 82.2Daily or special fishing permits 1.21 1.12 92.9 0.99 82.2Fishing lines, fly lines, fish nets, traps 0.90 0.90 99.8 0.84 93.3Charter/party boat/guide service 18.83 18.26 97.0 17.90 95.1
19
Table A.1.b Detailed Direct Expenditure Impact (Millions of $): December 1995 - May 1996 (Continued)
% inTotal In % in In Monroe Monroe
Type of Expenditure Trip S. FL S. FL County County
Scuba Diving/Snorkeling 9.83 9.44 96.1 9.20 93.6
Rental fee for equipment 2.31 2.14 92.4 2.02 87.3Charter/party boat/guide service 7.51 7.30 97.2 7.18 95.5
Sightseeing 36.69 26.30 71.7 17.84 48.6
Sightseeing tours 10.05 7.81 77.7 6.54 65.1Glass-bottom boat rides 3.61 3.43 94.9 3.27 90.6Backcountry excursions, kayak tours 1.21 1.19 98.5 0.63 51.7Park entrance fees 4.27 3.20 74.8 1.89 44.2Admission to tourist, amusement, festivalsand other commercial attractions 17.54 10.68 60.9 5.52 31.4
Other Activity Expenditures 22.90 17.59 76.8 10.04 43.8
Rental fee for recreation equipment (bicycles,golf carts or others not listed above) 13.70 10.77 78.6 4.38 32.0Guide service, tour, or outfitters (not listedabove,like parasailing) 4.32 3.43 79.3 2.99 69.1Admission to motion pictures, theaters,museums, etc. 4.87 3.39 69.5 2.67 54.9
Miscellaneous Expenditures 82.64 67.00 81.1 53.36 64.6
Film purchases 3.55 2.50 70.3 1.84 51.8Film development 2.25 1.18 52.3 0.82 36.4Footware 7.03 4.94 70.3 3.31 47.1Clothing 38.68 32.16 83.1 25.93 67.0Souvenirs and gifts (not clothing) 31.13 26.23 84.3 21.47 69.0
Services 26.40 22.81 86.4 17.77 67.3
Barber, laundry, and other personal services 4.01 3.32 82.9 2.51 62.6Telephone,fax, and other business services 7.91 6.43 81.3 4.96 62.7Physician, dentist, and other medical services 3.75 3.65 97.3 2.53 67.5Other Services 10.73 9.41 87.7 7.77 72.4
Total 1,262.39 913.02 72.3 670.62 53.1
20202020p20
Table A.2. Wages-to-Sales and Wages-to-Employment Ratios by SIC
SIC Industry Wages-to-Sales Wages-to-Employment
70 Hotels and Motels 0.2418 14,87472 Personal Services 0.2673 10,08373 Business Services 0.3077 14,41680 Health Services 0.3689 24,08189 Other Services 0.3556 48,64375 Automotive repair, services
and parking 0.2213 18,036751 Automotive rental and leasing 0.1542 19,577753 Automotive repair 0.2191 19,18854 Food Stores 0.1024 12,492554 Gasoline Service Stations 0.0644 13,95158 Eating and drinking places 0.2415 8,90256 Apparel and accessory stores 0.1413 12,62153 General Merchandise Stores 0.1116 10,636591 Drug and proprietary Stores 0.1023 16,19759 Miscellaneous retail stores 0.1666 13,52878,79,84 Amusement and recreation services
including motion pictures and museums 0.2806 14,398
79 ex.792, 793, 84 Commercial sports and other
recreation services, including museums 0.2927 15,273
Table A.1.c. Detailed Direct Expenditure Impact, Selected Annual Expenditures
In MonroeSeason/Type of Expenditure County ($)
June - November 1995Boat Storage and Marina Fees 386,761.32Cono and Time Share Fees 5,109,937.44RV or Trailer Park Fees 5,649,059.28Total 11,145,758.04
December 1995 - May 1996Boat Storage and Marina Fees 2,408,531.84Cono and Time Share Fees 18,857,709.52RV or Trailer Park Fees 3,722,276.48Total 24,988,517.84
21
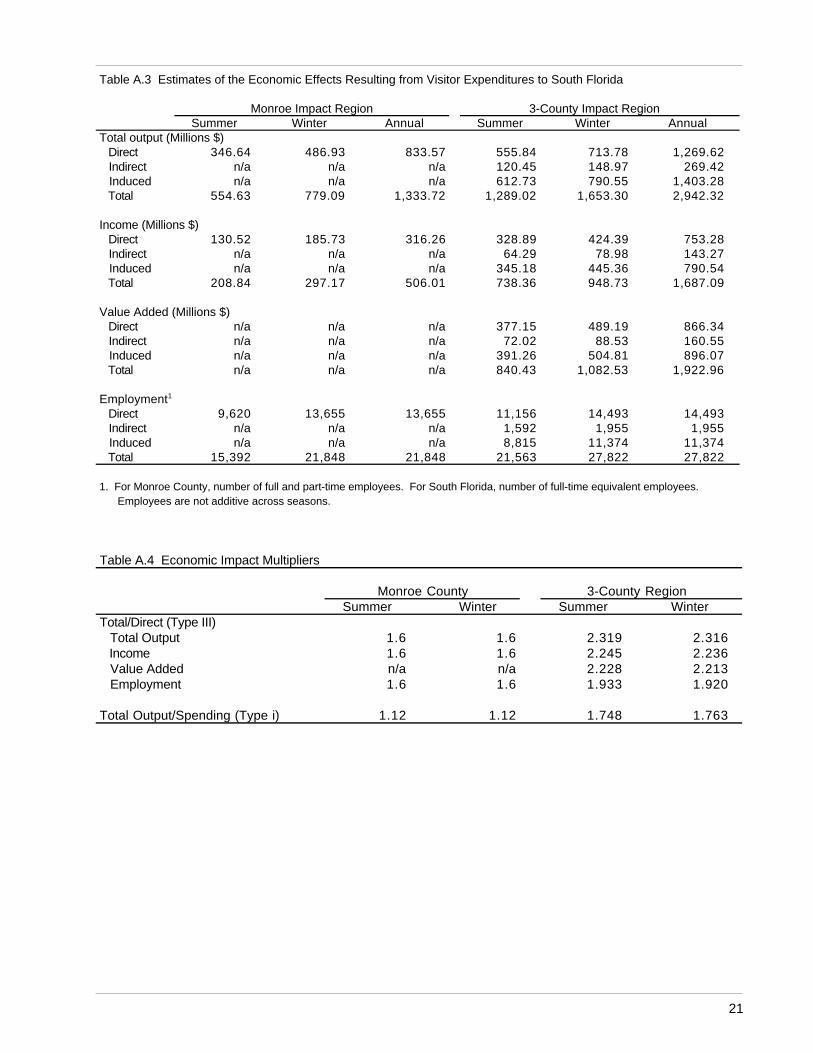
Table A.4 Economic Impact Multipliers
Monroe County 3-County RegionSummer Winter Summer Winter
Total/Direct (Type III) Total Output 1.6 1.6 2.319 2.316 Income 1.6 1.6 2.245 2.236 Value Added n/a n/a 2.228 2.213 Employment 1.6 1.6 1.933 1.920
Total Output/Spending (Type i) 1.12 1.12 1.748 1.763
Table A.3 Estimates of the Economic Effects Resulting from Visitor Expenditures to South Florida
Monroe Impact Region 3-County Impact RegionSummer Winter Annual Summer Winter Annual
Total output (Millions $) Direct 346.64 486.93 833.57 555.84 713.78 1,269.62 Indirect n/a n/a n/a 120.45 148.97 269.42 Induced n/a n/a n/a 612.73 790.55 1,403.28 Total 554.63 779.09 1,333.72 1,289.02 1,653.30 2,942.32
Income (Millions $) Direct 130.52 185.73 316.26 328.89 424.39 753.28 Indirect n/a n/a n/a 64.29 78.98 143.27 Induced n/a n/a n/a 345.18 445.36 790.54 Total 208.84 297.17 506.01 738.36 948.73 1,687.09
Value Added (Millions $) Direct n/a n/a n/a 377.15 489.19 866.34 Indirect n/a n/a n/a 72.02 88.53 160.55 Induced n/a n/a n/a 391.26 504.81 896.07 Total n/a n/a n/a 840.43 1,082.53 1,922.96
Employment1
Direct 9,620 13,655 13,655 11,156 14,493 14,493 Indirect n/a n/a n/a 1,592 1,955 1,955 Induced n/a n/a n/a 8,815 11,374 11,374 Total 15,392 21,848 21,848 21,563 27,822 27,822
1. For Monroe County, number of full and part-time employees. For South Florida, number of full-time equivalent employees. Employees are not additive across seasons.
22222222p22
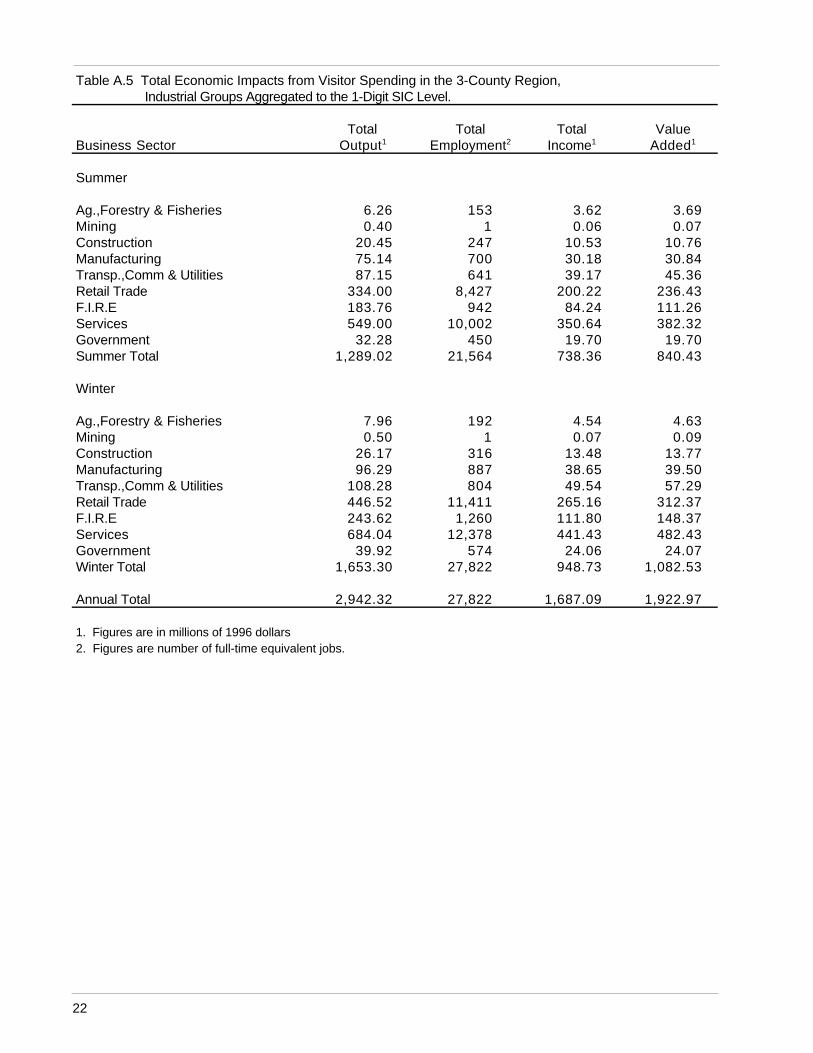
Table A.5 Total Economic Impacts from Visitor Spending in the 3-County Region, Industrial Groups Aggregated to the 1-Digit SIC Level.
Total Total Total ValueBusiness Sector Output1 Employment2 Income1 Added1
Summer
Ag.,Forestry & Fisheries 6.26 153 3.62 3.69Mining 0.40 1 0.06 0.07Construction 20.45 247 10.53 10.76Manufacturing 75.14 700 30.18 30.84Transp.,Comm & Utilities 87.15 641 39.17 45.36Retail Trade 334.00 8,427 200.22 236.43F.I.R.E 183.76 942 84.24 111.26Services 549.00 10,002 350.64 382.32Government 32.28 450 19.70 19.70Summer Total 1,289.02 21,564 738.36 840.43
Winter
Ag.,Forestry & Fisheries 7.96 192 4.54 4.63Mining 0.50 1 0.07 0.09Construction 26.17 316 13.48 13.77Manufacturing 96.29 887 38.65 39.50Transp.,Comm & Utilities 108.28 804 49.54 57.29Retail Trade 446.52 11,411 265.16 312.37F.I.R.E 243.62 1,260 111.80 148.37Services 684.04 12,378 441.43 482.43Government 39.92 574 24.06 24.07Winter Total 1,653.30 27,822 948.73 1,082.53
Annual Total 2,942.32 27,822 1,687.09 1,922.97
1. Figures are in millions of 1996 dollars2. Figures are number of full-time equivalent jobs.