Embed Size (px)
Citation preview
Economic Case and Image Economic Case and Image SurveySurvey
Final ReportFinal ReportPrepared By:
Market Probe2655 N. Mayfair RoadMilwaukee, WI 53226
February 9, 2004
©2004. Market Probe. All Rights Reserved.
2
IntroductionIntroduction
The American Society for Quality (ASQ) engaged Market Probe to conduct a survey of 600 American executives drawn from four industry segments; i.e., manufacturing, services, healthcare and education.
The survey will address two content areas: The economic benefits of quality
Perceptions of ASQ
3
Project ObjectivesProject Objectives
The purpose of the economic benefit part of the survey is to provide information on current executive perspectives of quality and quality professionals. These perspectives will be useful in developing communications designed to inform executives of the economic benefits of quality initiatives.
The purpose of the ASQ Image portion of the survey is to better understand executives’ awareness and image of ASQ.
4
Fielding MethodologyFielding Methodology
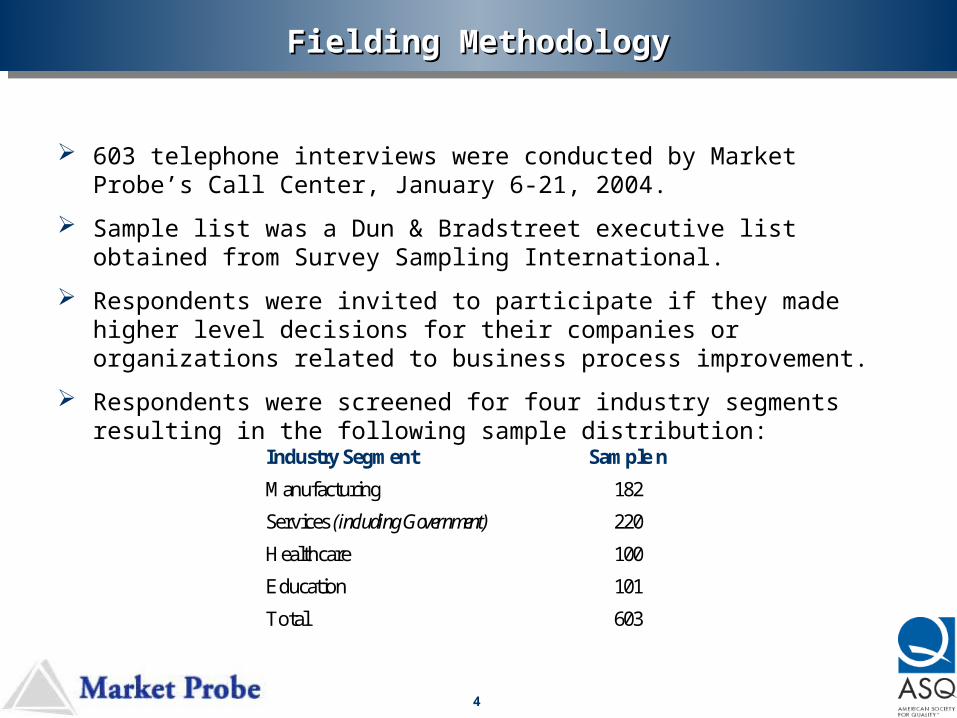
603 telephone interviews were conducted by Market Probe’s Call Center, January 6-21, 2004.
Sample list was a Dun & Bradstreet executive list obtained from Survey Sampling International.
Respondents were invited to participate if they made higher level decisions for their companies or organizations related to business process improvement.
Respondents were screened for four industry segments resulting in the following sample distribution:
Industry Segment Sample n
Manufacturing 182
Services (including Government) 220
Healthcare 100
Education 101
Total 603
5
Awareness of Six Business Process Improvement TechniquesAwareness of Six Business Process Improvement Techniques
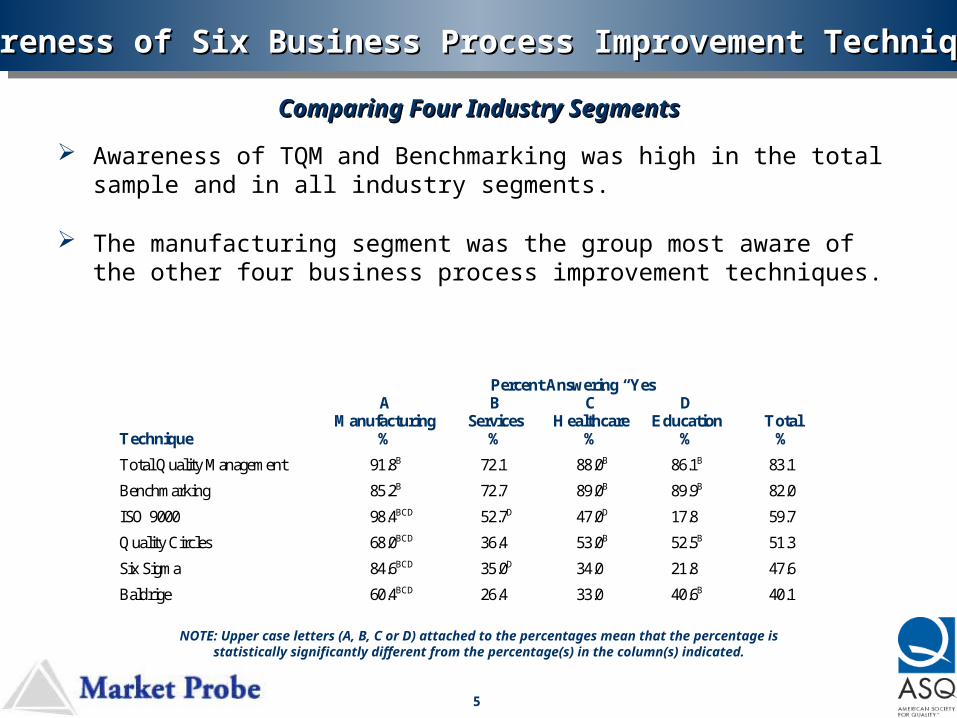
Awareness of TQM and Benchmarking was high in the total sample and in all industry segments.
The manufacturing segment was the group most aware of the other four business process improvement techniques.
Comparing Four Industry SegmentsComparing Four Industry Segments
Percent Answering “Yes”
Technique
A Manufacturing
%
B Services
%
C Healthcare
%
D Education
% Total
%
Total Quality Management 91.8B 72.1 88.0B 86.1B 83.1
Benchmarking 85.2B 72.7 89.0B 89.9B 82.0
ISO 9000 98.4BCD 52.7D 47.0D 17.8 59.7
Quality Circles 68.0BCD 36.4 53.0B 52.5B 51.3
Six Sigma 84.6BCD 35.0D 34.0 21.8 47.6
Baldrige 60.4BCD 26.4 33.0 40.6B 40.1
NOTE: Upper case letters (A, B, C or D) attached to the percentages mean that the percentage is statistically significantly different from the percentage(s) in the column(s)
indicated.
6
Use of Six Business Practices Improvement TechniquesUse of Six Business Practices Improvement Techniques
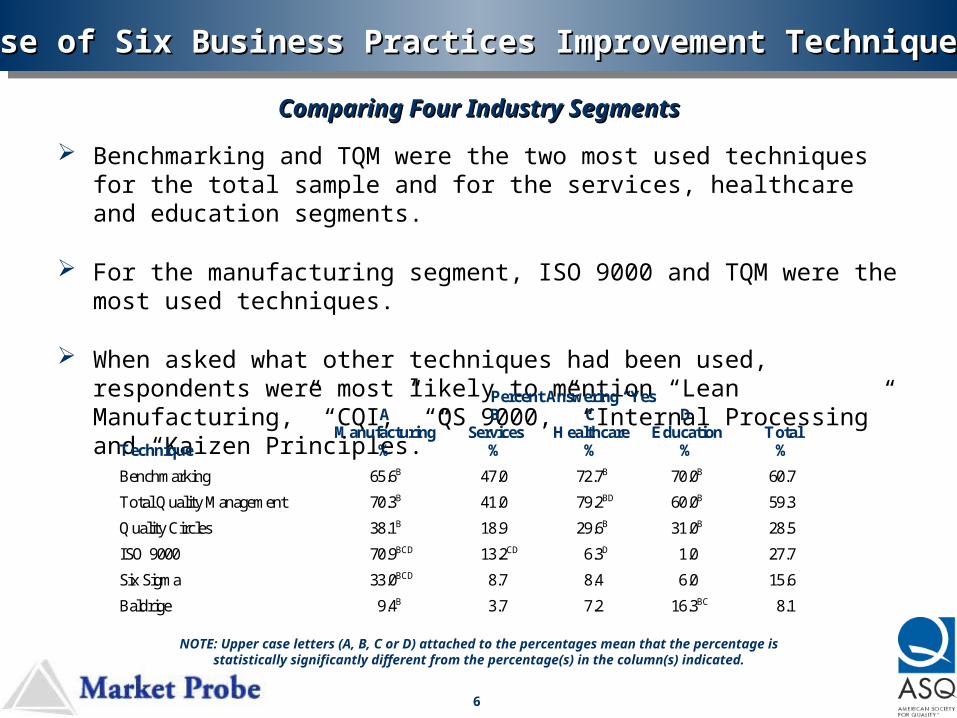
Benchmarking and TQM were the two most used techniques for the total sample and for the services, healthcare and education segments.
For the manufacturing segment, ISO 9000 and TQM were the most used techniques.
When asked what other techniques had been used, respondents were most likely to mention “Lean Manufacturing,” “CQI,” “QS 9000,” “Internal Processing” and “Kaizen Principles.”
Comparing Four Industry SegmentsComparing Four Industry Segments
NOTE: Upper case letters (A, B, C or D) attached to the percentages mean that the percentage is statistically significantly different from the percentage(s) in the column(s)
indicated.
Percent Answering “Yes”
Technique
A Manufacturing
%
B Services
%
C Healthcare
%
D Education
% Total
%
Benchmarking 65.6B 47.0 72.7B 70.0B 60.7
Total Quality Management 70.3B 41.0 79.2BD 60.0B 59.3
Quality Circles 38.1B 18.9 29.6B 31.0B 28.5
ISO 9000 70.9BCD 13.2CD 6.3D 1.0 27.7
Six Sigma 33.0BCD 8.7 8.4 6.0 15.6
Baldrige 9.4B 3.7 7.2 16.3BC 8.1
7
Comparing Familiarity and Use of Business Process TechniqueComparing Familiarity and Use of Business Process Technique
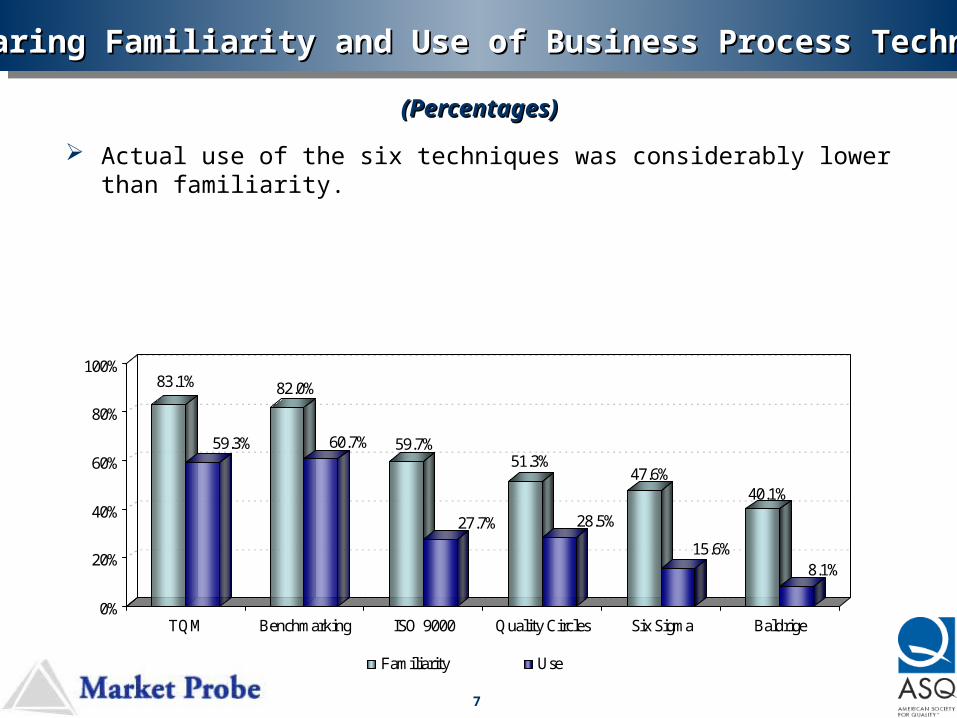
Actual use of the six techniques was considerably lower than familiarity.
(Percentages)(Percentages)
83.1%
59.3%
82.0%
60.7% 59.7%
27.7%
51.3%
28.5%
47.6%
15.6%
40.1%
8.1%
0%
20%
40%
60%
80%
100%
TQM Benchmarking ISO 9000 Quality Circles Six Sigma Baldrige
Familiarity Use
8
Defining Respondent’s Role in the Defining Respondent’s Role in the Organizational Decision-Making ProcessOrganizational Decision-Making Process
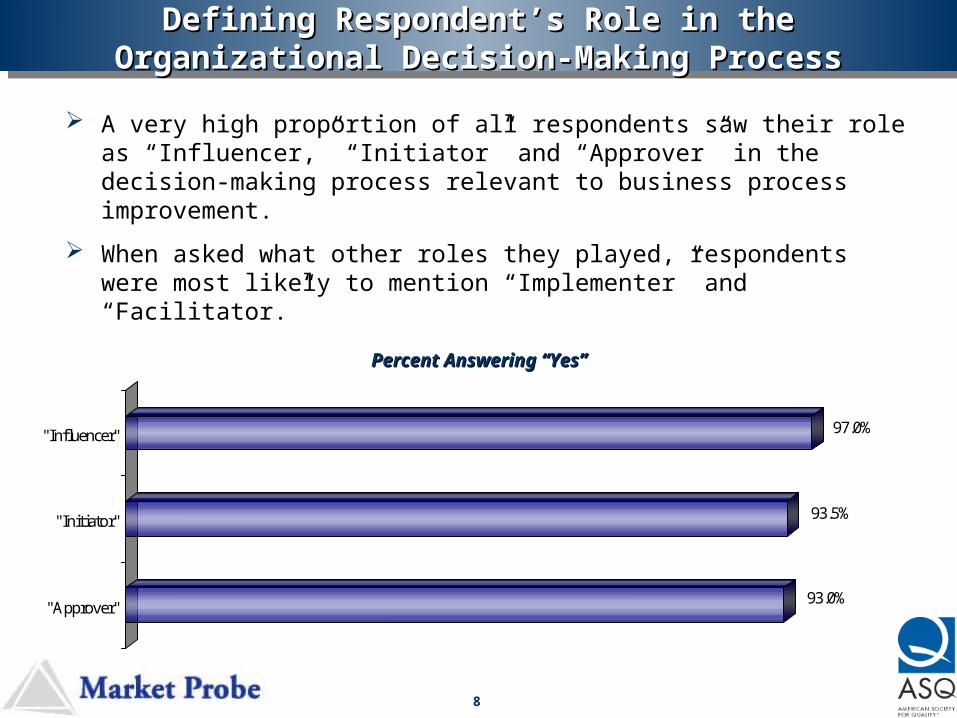
A very high proportion of all respondents saw their role as “Influencer,” “Initiator” and “Approver” in the decision-making process relevant to business process improvement.
When asked what other roles they played, respondents were most likely to mention “Implementer” and “Facilitator.”
93.0%
93.5%
97.0%
"Approver"
"Initiator"
"Influencer"
Percent Answering “Yes”Percent Answering “Yes”
9
When respondents were asked how their organizations define the word “quality,” the most common response was “customer satisfaction.”
Other common themes included:
Respondents’ Definitions of “Quality”Respondents’ Definitions of “Quality”
Meeting or exceeding customer expectations through excellence in products and services.
Getting the product “done right the first time.”
Producing the highest quality product with the least expense to the company.
Implementing an ongoing process towards perfection (continuous improvement) within the organization.
Setting a goal of zero defects and zero rejects. Within the educational segment, quality is defined as the
academic success of students.
10
Respondents were asked to select one of two optional opinions:
Beliefs Regarding Quality’s Contribution to the Bottom LineBeliefs Regarding Quality’s Contribution to the Bottom Line
Quality contributes to the bottom line?
Quality does not contribute to the bottom line?
Over 99% of the respondents said they believe quality contributes to the bottom line. This unexpectedly high level of agreement may be due to the fact respondents define “quality” very broadly.
When asked why quality contributes the most common responses were: Increased revenue through repeat business, referrals and
customer loyalty. Others noted that by setting quality standards, there is less re-work and a savings on labor and materials.
Only two respondents stated that quality does not contribute. Their reasons were, “We have found that it is expensive to achieve,” and “People are just interested in price, not quality.”
11
A recall survey of 100 respondents was conducted to test a revised version of the question about quality’s contribution to the bottom line. The new question was designed to provide a clearer definition of “quality.”
Quality’s Contribution to the Bottom Line RevisitedQuality’s Contribution to the Bottom Line Revisited
The results using the revised question were virtually the same. Ninety-two percent of respondents agreed that an organization-wide, coordinated effort to use quality techniques provides a positive return.
There are several definitions of the word “quality.” For this question, I want to define quality as an organization-wide, coordinated effort to use quality techniques and practices to achieve business process improvement. My question is, do you believe this type of quality effort provides a positive financial return or do you believe it usually costs more than the potential return?
1 Provides a positive financial return2 Costs more than the potential return3 Don’t know4 Refused
12
Quality as a Management ToolQuality as a Management Tool
55.3%
73.3%
62.1% 63.5% 64.4%
0%
20%
40%
60%
80%
100%
Manufacturing Services Healthcare Education Total
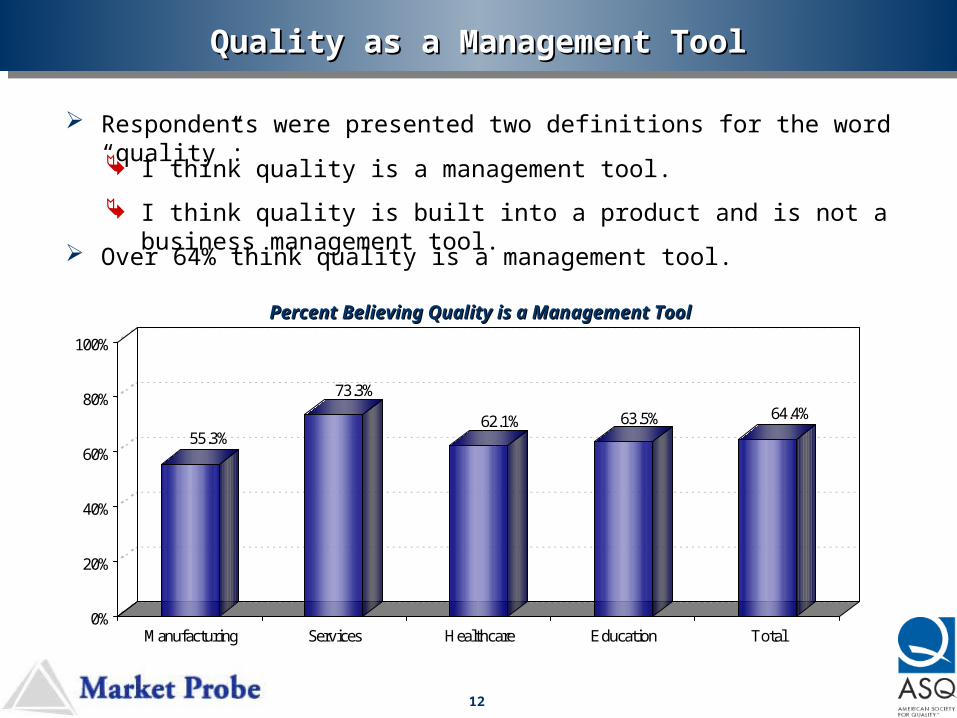
Respondents were presented two definitions for the word “quality”: I think quality is a management tool.
I think quality is built into a product and is not a business management tool. Over 64% think quality is a management tool.
Percent Believing Quality is a Management ToolPercent Believing Quality is a Management Tool
13
Sources of Information that Influence Use ofSources of Information that Influence Use ofBusiness Improvement TechniquesBusiness Improvement Techniques
NOTE: Upper case letters (A, B, C or D) attached to the percentages mean that the percentage is statistically significantly different from the percentage(s) in the column(s)
indicated.
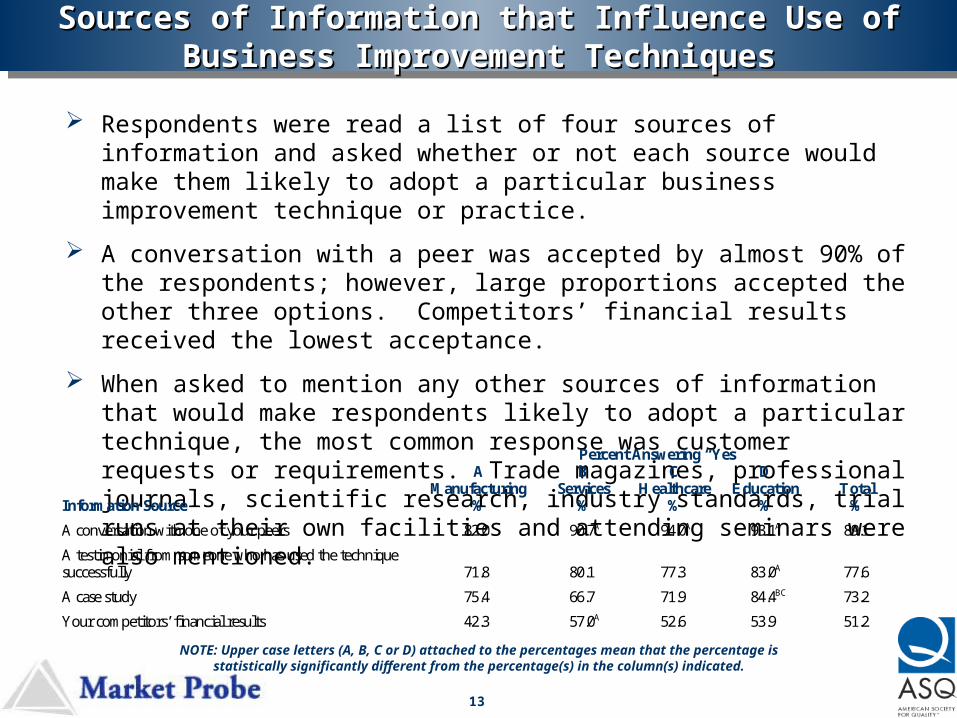
Respondents were read a list of four sources of information and asked whether or not each source would make them likely to adopt a particular business improvement technique or practice.
A conversation with a peer was accepted by almost 90% of the respondents; however, large proportions accepted the other three options. Competitors’ financial results received the lowest acceptance.
When asked to mention any other sources of information that would make respondents likely to adopt a particular technique, the most common response was customer requests or requirements. Trade magazines, professional journals, scientific research, industry standards, trial runs at their own facilities and attending seminars were also mentioned.
Percent Answering “Yes”
Information Source
A Manufacturing
%
B Services
%
C Healthcare
%
D Education
% Total
%
A conversation with one of your peers 82.0 90.7A 94.0A 93.1A 89.1
A testimonial from someone who has used the technique successfully 71.8 80.1 77.3 83.0A 77.6
A case study 75.4 66.7 71.9 84.4BC 73.2
Your competitors’ financial results 42.3 57.0A 52.6 53.9 51.2
14
Measuring the Economic Impact of Business Process ImprovementMeasuring the Economic Impact of Business Process Improvement
73.1%58.8% 54.2%
43.9%
60.0%
0%
20%
40%
60%
80%
100%
Manufacturing Services Healthcare Education Total
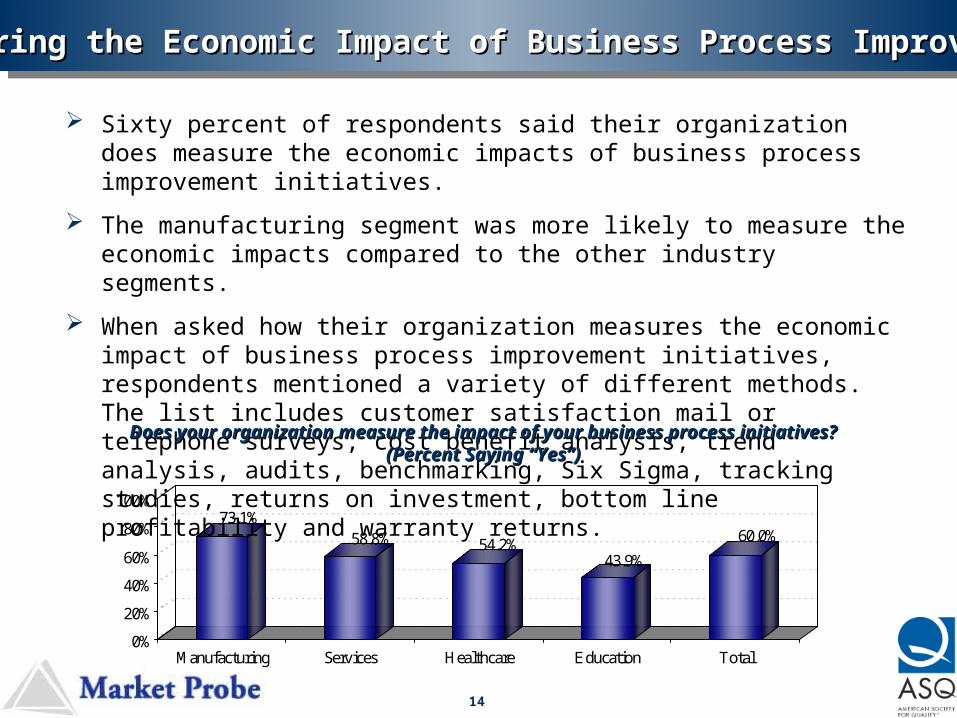
Sixty percent of respondents said their organization does measure the economic impacts of business process improvement initiatives.
The manufacturing segment was more likely to measure the economic impacts compared to the other industry segments.
When asked how their organization measures the economic impact of business process improvement initiatives, respondents mentioned a variety of different methods. The list includes customer satisfaction mail or telephone surveys, cost benefit analysis, trend analysis, audits, benchmarking, Six Sigma, tracking studies, returns on investment, bottom line profitability and warranty returns.
Does your organization measure the impact of your business process initiatives?Does your organization measure the impact of your business process initiatives?(Percent Saying “Yes”)(Percent Saying “Yes”)
15
Likelihood of Starting a Business Process Likelihood of Starting a Business Process ImprovementImprovement
Initiative in the Next 12 MonthsInitiative in the Next 12 Months
52.0%
34.9%
61.9%
31.3%
44.0%
0%
20%
40%
60%
80%
100%
Manufacturing Services Healthcare Education Total
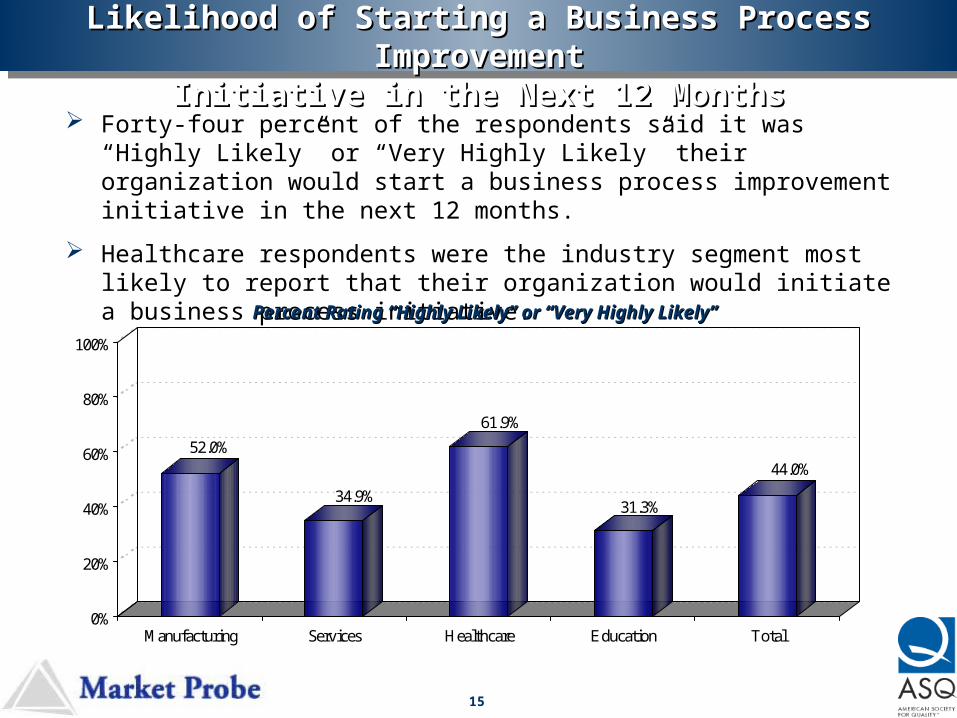
Forty-four percent of the respondents said it was “Highly Likely” or “Very Highly Likely” their organization would start a business process improvement initiative in the next 12 months.
Healthcare respondents were the industry segment most likely to report that their organization would initiate a business process initiative.
Percent Rating “Highly Likely” or “Very Highly Likely”Percent Rating “Highly Likely” or “Very Highly Likely”
16
59.8%
40.1%
49.5%
34.4%
46.7%
0%
20%
40%
60%
80%
100%
Manufacturing Services Healthcare Education Total
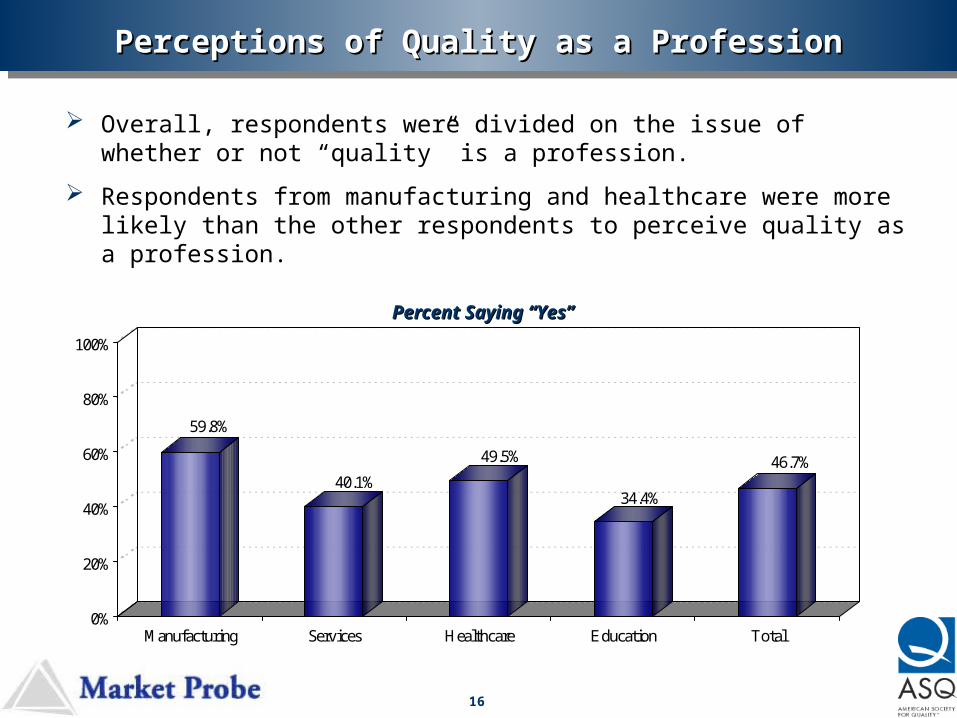
Overall, respondents were divided on the issue of whether or not “quality” is a profession.
Respondents from manufacturing and healthcare were more likely than the other respondents to perceive quality as a profession.
Percent Saying “Yes”Percent Saying “Yes”
Perceptions of Quality as a ProfessionPerceptions of Quality as a Profession
17
77.9%
39.9%
65.0%
18.8%
52.0%
0%
20%
40%
60%
80%
100%
Manufacturing Services Healthcare Education Total
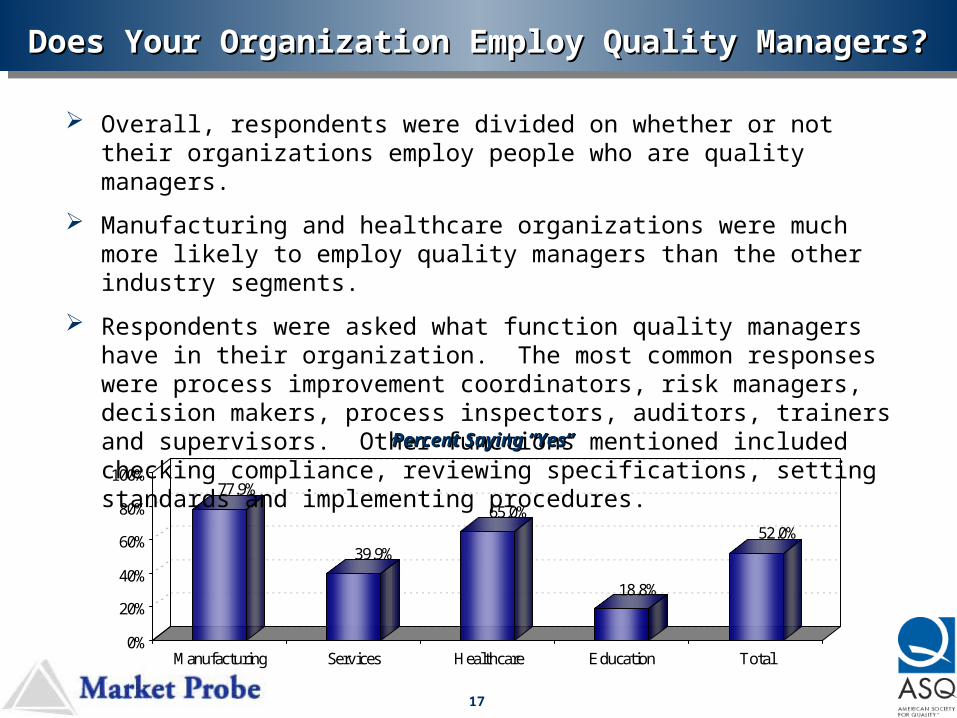
Overall, respondents were divided on whether or not their organizations employ people who are quality managers.
Manufacturing and healthcare organizations were much more likely to employ quality managers than the other industry segments.
Respondents were asked what function quality managers have in their organization. The most common responses were process improvement coordinators, risk managers, decision makers, process inspectors, auditors, trainers and supervisors. Other functions mentioned included checking compliance, reviewing specifications, setting standards and implementing procedures.Percent Saying “Yes”Percent Saying “Yes”
Does Your Organization Employ Quality Managers?Does Your Organization Employ Quality Managers?
18
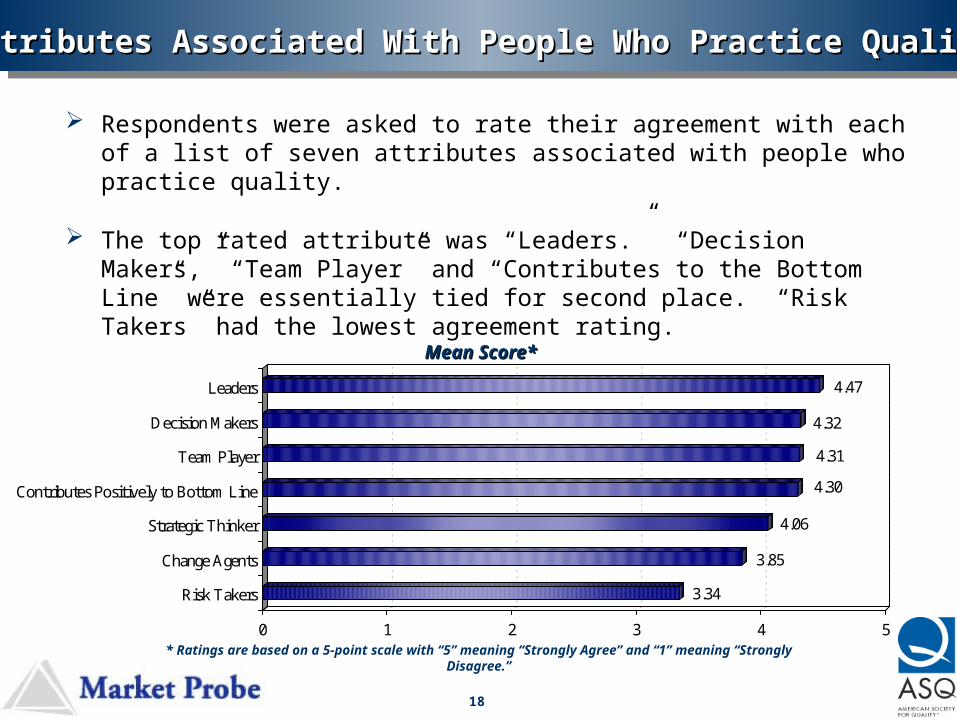
Respondents were asked to rate their agreement with each of a list of seven attributes associated with people who practice quality.
The top rated attribute was “Leaders.” “Decision Makers,” “Team Player” and “Contributes to the Bottom Line” were essentially tied for second place. “Risk Takers” had the lowest agreement rating.
Attributes Associated With People Who Practice QualityAttributes Associated With People Who Practice Quality
* Ratings are based on a 5-point scale with “5” meaning “Strongly Agree” and “1” meaning “Strongly Disagree.”
3.34
3.85
4.06
4.30
4.31
4.32
4.47
0 1 2 3 4 5
Risk Takers
Change Agents
Strategic Thinker
Contributes Positively to Bottom Line
Team Player
Decision Makers
Leaders
Mean Score*Mean Score*
19
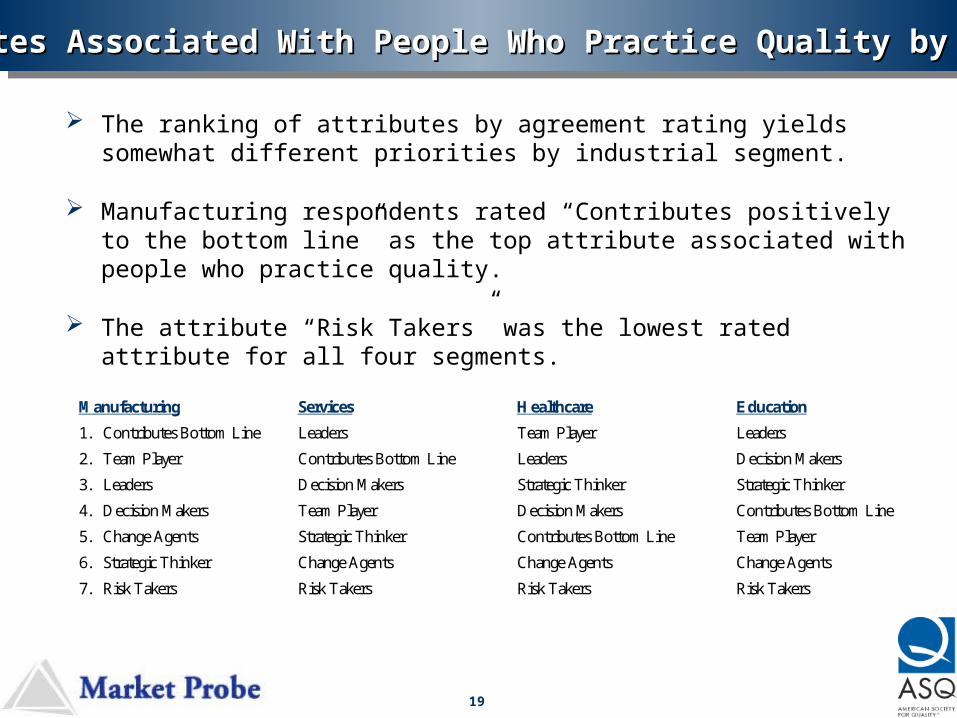
The ranking of attributes by agreement rating yields somewhat different priorities by industrial segment.
Manufacturing respondents rated “Contributes positively to the bottom line” as the top attribute associated with people who practice quality.
The attribute “Risk Takers” was the lowest rated attribute for all four segments.
Attributes Associated With People Who Practice Quality by SegmentAttributes Associated With People Who Practice Quality by Segment
Manufacturing Services Healthcare Education
1. Contributes Bottom Line Leaders Team Player Leaders
2. Team Player Contributes Bottom Line Leaders Decision Makers
3. Leaders Decision Makers Strategic Thinker Strategic Thinker
4. Decision Makers Team Player Decision Makers Contributes Bottom Line
5. Change Agents Strategic Thinker Contributes Bottom Line Team Player
6. Strategic Thinker Change Agents Change Agents Change Agents
7. Risk Takers Risk Takers Risk Takers Risk Takers
20
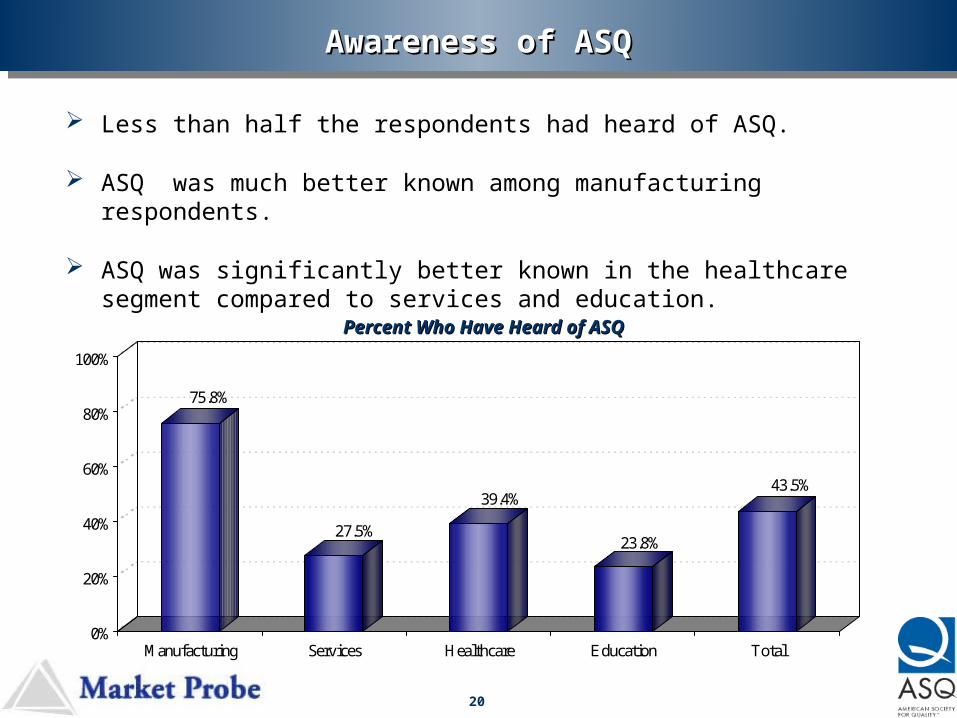
75.8%
27.5%
39.4%
23.8%
43.5%
0%
20%
40%
60%
80%
100%
Manufacturing Services Healthcare Education Total
Less than half the respondents had heard of ASQ.
ASQ was much better known among manufacturing respondents.
ASQ was significantly better known in the healthcare segment compared to services and education.
Percent Who Have Heard of ASQPercent Who Have Heard of ASQ
Awareness of ASQAwareness of ASQ
21
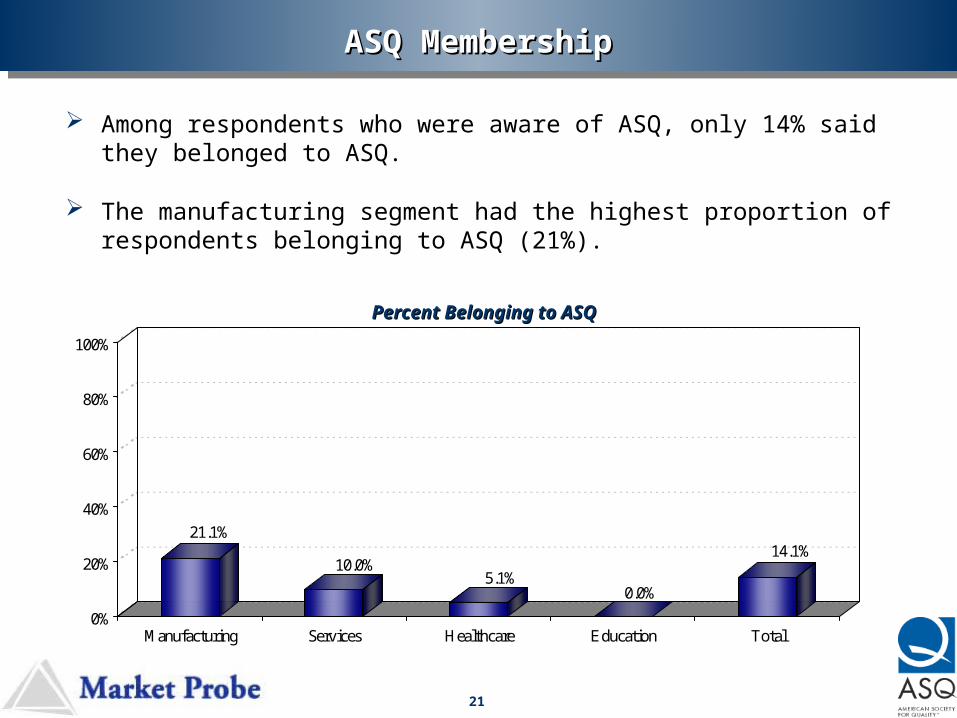
21.1%
10.0%5.1%
0.0%
14.1%
0%
20%
40%
60%
80%
100%
Manufacturing Services Healthcare Education Total
Percent Belonging to ASQPercent Belonging to ASQ
ASQ MembershipASQ Membership
Among respondents who were aware of ASQ, only 14% said they belonged to ASQ.
The manufacturing segment had the highest proportion of respondents belonging to ASQ (21%).
22
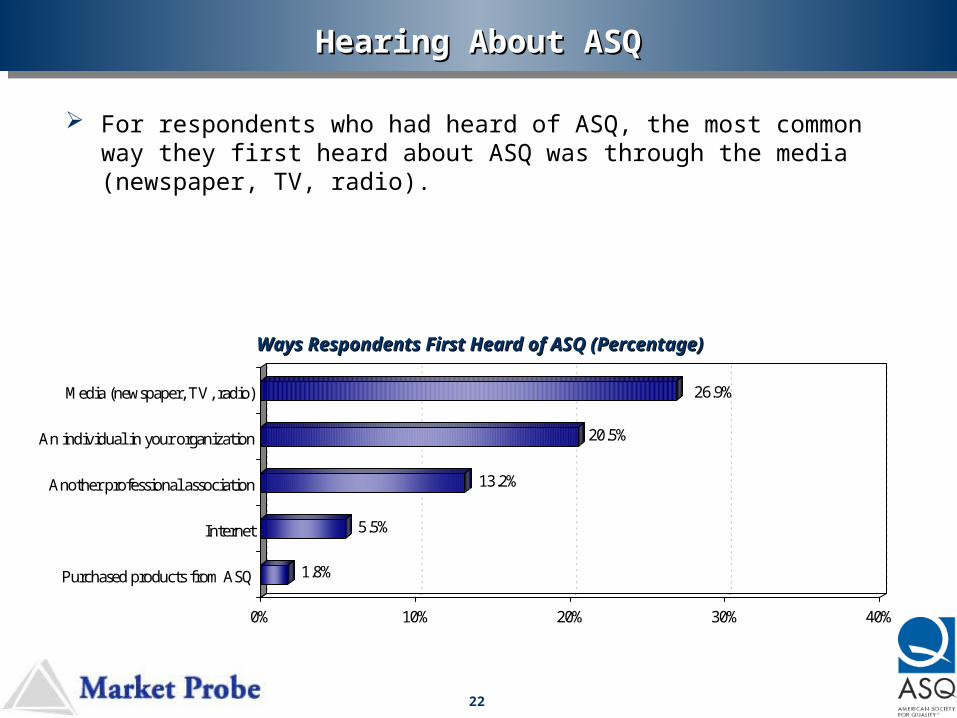
1.8%
5.5%
13.2%
20.5%
26.9%
0% 10% 20% 30% 40%
Purchased products from ASQ
Internet
Another professional association
An individual in your organization
Media (newspaper, TV, radio)
For respondents who had heard of ASQ, the most common way they first heard about ASQ was through the media (newspaper, TV, radio).
Ways Respondents First Heard of ASQ (Percentage)Ways Respondents First Heard of ASQ (Percentage)
Hearing About ASQHearing About ASQ
23
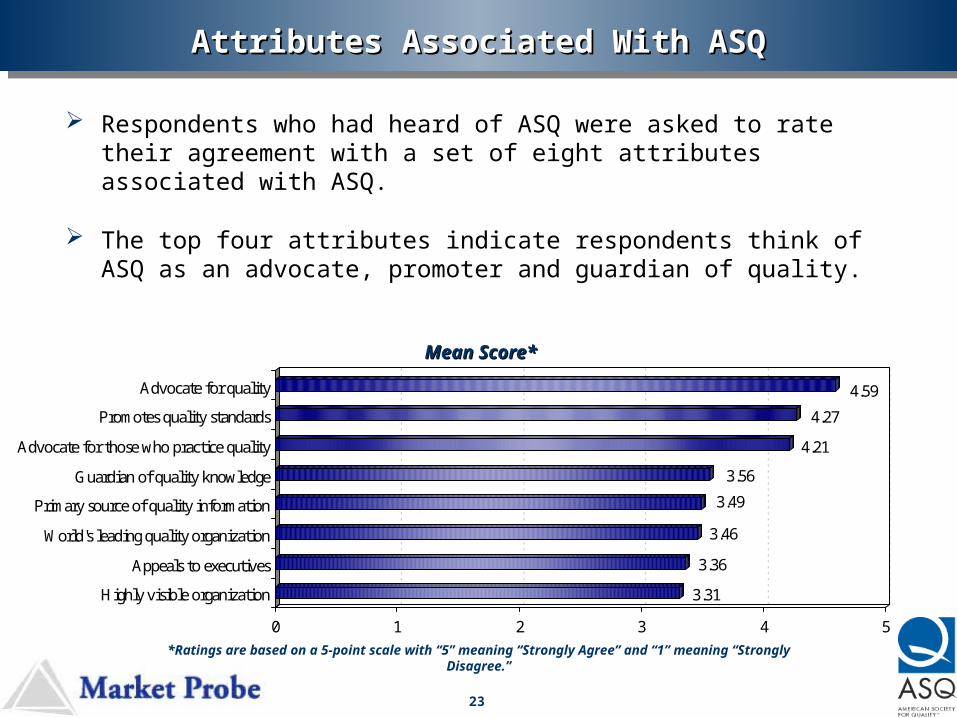
3.31
3.36
3.46
3.49
3.56
4.21
4.27
4.59
0 1 2 3 4 5
Highly visible organization
Appeals to executives
World's leading quality organization
Primary source of quality information
Guardian of quality knowledge
Advocate for those who practice quality
Promotes quality standards
Advocate for quality
Respondents who had heard of ASQ were asked to rate their agreement with a set of eight attributes associated with ASQ.
The top four attributes indicate respondents think of ASQ as an advocate, promoter and guardian of quality.
Mean Score*Mean Score*
Attributes Associated With ASQAttributes Associated With ASQ
*Ratings are based on a 5-point scale with “5” meaning “Strongly Agree” and “1” meaning “Strongly Disagree.”
24
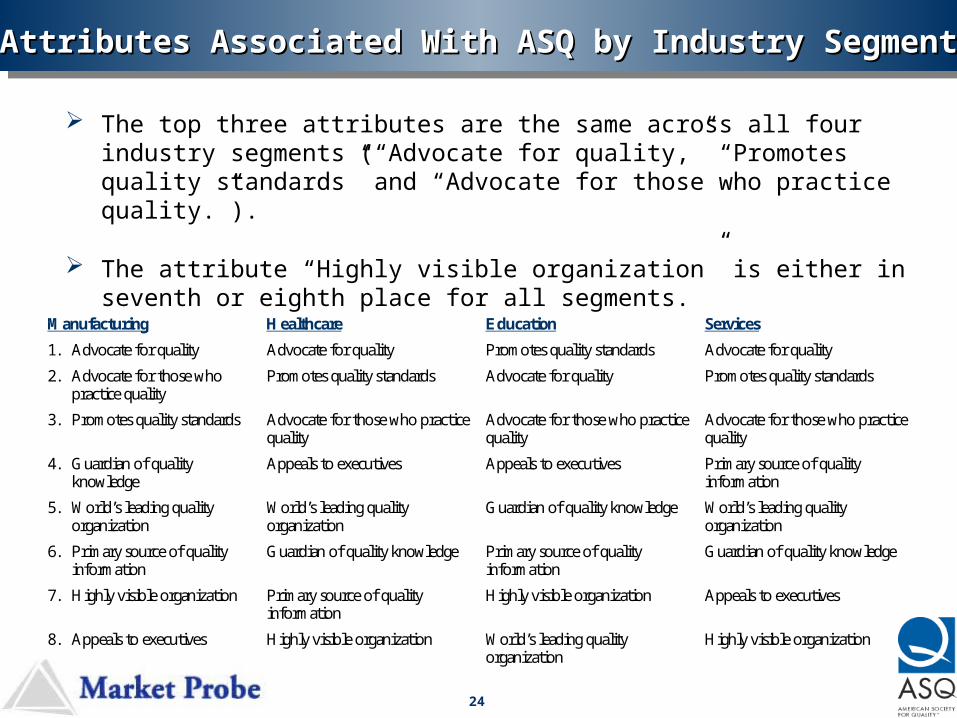
The top three attributes are the same across all four industry segments (“Advocate for quality,” “Promotes quality standards” and “Advocate for those who practice quality.”).
The attribute “Highly visible organization” is either in seventh or eighth place for all segments.
Attributes Associated With ASQ by Industry SegmentAttributes Associated With ASQ by Industry Segment
Manufacturing Healthcare Education Services
1. Advocate for quality Advocate for quality Promotes quality standards Advocate for quality
2. Advocate for those who practice quality
Promotes quality standards Advocate for quality Promotes quality standards
3. Promotes quality standards Advocate for those who practice quality
Advocate for those who practice quality
Advocate for those who practice quality
4. Guardian of quality knowledge
Appeals to executives Appeals to executives Primary source of quality information
5. World’s leading quality organization
World’s leading quality organization
Guardian of quality knowledge World’s leading quality organization
6. Primary source of quality information
Guardian of quality knowledge Primary source of quality information
Guardian of quality knowledge
7. Highly visible organization Primary source of quality information
Highly visible organization Appeals to executives
8. Appeals to executives Highly visible organization World’s leading quality organization
Highly visible organization
25
Respondents displayed relatively high awareness of TQM and Benchmarking across all four industry segments. As expected, business leaders in manufacturing have a much higher awareness of ISO 9000, Quality Circles, Six Sigma and Baldrige than leaders in the services, healthcare and education sectors. In these three sectors, leaders were less aware of these techniques.
In general, the actual use of the six quality techniques was considerably lower than awareness of these practices. Benchmarking and TQM were the most used techniques overall. The industry sectors have different patterns of use. In manufacturing, for example, the use of ISO 9000 and Six Sigma is significantly higher than any other segment. Also, the services sector tends to use these techniques less than the other three sectors.
Leaders in all four sectors saw themselves as an “Influencer,” “Initiator” and “Approver” in the decision-making process relevant to business process improvement.
Business leaders in all four sectors believed that an organization-wide, coordinated effort to use quality techniques provides a positive return on investment. The challenge, then, may not be to convince leaders of the benefits of quality initiatives, but to facilitate implementation.
Summary of FindingsSummary of Findings
A.A. Respondents’ Perceptions of Business Process ImprovementRespondents’ Perceptions of Business Process Improvement
26
Business leaders believed they would be more likely to adopt a particular business improvement technique if they heard about it in a conversation with one of their peers. However, testimonials from users and case studies would also be persuasive.
There was wide variation among industry segments in whether or not organizations measured the economic impacts of business improvement initiatives.
The manufacturing and healthcare sectors were more likely to start a business process improvement initiative in the next 12 months.
Business leaders were divided on the issue of whether or not “quality” is a profession.
Leaders in manufacturing and healthcare were the two sectors most likely to employ quality managers.
Business leaders tended to see people who practice quality as “Leaders,” “Decision Makers,” “Team Players” and people who “Contribute Positively to the Bottom Line.”
Summary of Findings Summary of Findings (Continued)(Continued)
27
While ASQ is well known in manufacturing, it is considerably less well known in the healthcare, services and educational sectors. ASQ may want to increase its visibility in these sectors.
Among respondents who were aware of ASQ, a low percentage were actually members.
The most common way for business leaders to first hear about ASQ was through the media (newspaper, TV and radio). Hearing about ASQ from another individual in their organization was also an important channel of information.
Business leaders think of ASQ as an advocate, promoter and guardian of quality. It is not as likely to be seen as a highly visible organization.
Summary of Findings Summary of Findings (Continued)(Continued)
B.B. Image of ASQImage of ASQ