Embed Size (px)
Citation preview

Towers Perrin February 2008
Economic Capital for Life Insurance Companies
Society of Actuaries
Prepared by: Ian Farr
Hubert Mueller Mark Scanlon Simon Stronkhorst

Table of Contents 1. Introduction.....................................................................................................................................1
1.1 Background and Scope ...........................................................................................................1
1.2 Definitions................................................................................................................................1
2. EC Methodologies Currently Used by Insurers ...........................................................................3
2.1 Prevalence of EC Calculation..................................................................................................3
2.2 Primary Drivers for Calculating EC..........................................................................................4
2.3 Differences in EC Approaches ................................................................................................5
2.4 Risk Factors Considered in EC Model ....................................................................................8
2.5 Evolution of EC Frameworks.................................................................................................10
3. Pros and Cons of Existing EC Methodologies...........................................................................12
3.1 Introduction............................................................................................................................12
3.2 The Liability Runoff Approach ...............................................................................................12
3.3 The One-Year Mark-to-Market Approach..............................................................................14
3.4 Pros and Cons of the Two Approaches.................................................................................15
3.5 Other Aspects of EC Methodology ........................................................................................20
4. EC Methodologies Compared to Other Risk Capital Approaches ...........................................23
5. Factors to Consider in Developing an EC Program ..................................................................30
5.1 Introduction............................................................................................................................30
5.2 Objectives of the EC implementation ....................................................................................30
5.3 Type of Business...................................................................................................................33
5.4 Constraints ............................................................................................................................34
6. Successfully Implementing EC: Risk Representation Issues ....................................................36
6.1 Interest Rate Risk ..................................................................................................................36
6.2 Equity Risk.............................................................................................................................37
6.3 Credit Risk .............................................................................................................................38
6.4 Liquidity Risk..........................................................................................................................41
6.5 Mortality Risk .........................................................................................................................42
Society of Actuaries Towers Perrin | i

6.6 Morbidity Risk ........................................................................................................................44
6.7 Underwriting Risk — Lapse Risk............................................................................................46
6.8 Operational Risk ....................................................................................................................47
6.9 Risk Aggregation ...................................................................................................................48
7. Successfully Implementing EC: Management Issues ...............................................................50
7.1 Governance and Achieving Buy-In........................................................................................50
7.2 Resources .............................................................................................................................52
7.3 Timeframes and Budgets ......................................................................................................53
7.4 Stochastic Processing Limitations.........................................................................................54
7.5 Model Testing (Including Back Testing) ................................................................................55
8. Use of EC in Insurance Company Operations ...........................................................................57
8.1 Capital Adequacy ..................................................................................................................57
8.2 Risk Monitoring and Control ..................................................................................................57
8.3 Performance Measurement and Management......................................................................58
8.4 Risk-Based Decision Making.................................................................................................59
8.5 Risk-Based Pricing ................................................................................................................59
8.6 Business and Strategic Planning...........................................................................................59
8.7 Mergers and Acquisitions ......................................................................................................60
Society of Actuaries Towers Perrin | ii

1. Introduction 1.1 Background and Scope Economic capital (EC) is taking on increasing importance within the insurance industry, but there is currently no global consensus as to how to define and calculate it. Consequently, the Society of Actuaries (SOA) Committee on Financial Research has commissioned the Tillinghast insurance consulting practice of Towers Perrin to develop this research paper, examining the mechanics and implementation of EC methods employed by insurance companies operating in the U.S. (both domestic and foreign-owned).
The SOA intends that this report might be used as a basis for constructive dialogue with rating agencies and regulators as to how capital requirements for the industry should be considered.
We would like to note that this document uses terminology appropriate to stock companies as opposed to mutuals. We believe, however, that with appropriate changes in terminology, most if not all of the content is equally applicable to mutual companies.
1.2 Definitions 1.2.1 What do we mean by capital? The capital held by an insurer represents the excess of the value of its assets over the value of its liabilities. Different definitions of capital will arise from different accounting conventions (e.g., GAAP, statutory, fair value, economic). These differences in accounting convention comprise primarily the inclusion of different subsets of the assets and liabilities (e.g., regulatory valuations typically exclude some or all intangible assets), and different methodologies being applied to value the assets and liabilities (e.g., book vs. market value for assets; inclusion of prudent margins in liabilities or otherwise).
For any chosen accounting convention, we further need to distinguish between the capital that is available⎯i.e., the excess of assets over liabilities under the chosen accounting convention⎯and the capital that is required to meet any set of criteria.
The term “economic capital” is typically used to refer to a measure of required capital under an economic accounting convention⎯where assets and liabilities are determined using economic principles. It would perhaps be more clearly referred to as “required economic capital.”
1.2.2 What drives the level of capital held by an insurer? The level of capital held by an insurer will ultimately be determined by its shareholders or by the management team who represent their interests. It can therefore be expected to be set so as to maximize the value of the shareholders’ interest in the company. Shareholder value is, however, critically dependent on the attraction and
Society of Actuaries Towers Perrin | 1

retention of policyholders, so in practice policyholder perspectives have a significant influence on the level of capital held.
The key ways in which capital influences shareholder value are as follows:
Holding more capital will in general enable the company to attract more risk averse policyholders, thus potentially increasing its franchise value.
Additional capital also reduces the costs of financial distress, incurred when the company nears insolvency, including potentially very significant losses in franchise value.
However, holding additional capital attracts frictional costs, relating to tax, investment costs and potentially agency effects, thus reducing shareholder value.
Additional capital also reduces the value of the “shareholder put option”⎯the shareholders’ right to walk away from the company once its liabilities exceed its assets.
In summary, shareholders will seek to minimize the level of capital held, subject to being able to attract and retain an ongoing stream of policyholders.
Note that the discussion above, and indeed much of the discussion in this report, is framed in the context of shareholder-owned insurance companies. However, it should be noted that most of the discussion and conclusions being made are usually as relevant for mutual insurers, albeit with a slightly different perspective.
1.2.3 Measures of Capital This paper addresses issues relating to economic capital (EC). EC is an internal calculation of the capital required, based on the company’s view of risk, with calculations based on economic principles. Broadly speaking, EC is an amount of capital required calculated to give a specified level of security to policyholders in relation to the payment of their policy benefits.
Society of Actuaries Towers Perrin | 2

2. EC Methodologies Currently Used by Insurers Market practice with respect to EC methodologies has changed significantly over the last several years. This section outlines current market practice and highlights expected areas of development and improvement in the years to come. Many of the findings are based on the 2006 Tillinghast ERM survey, which included responses from insurance executives in over 200 global companies, including 32 respondents from North American life insurers. Additional detail regarding the insurance companies included in the survey can be found in the 2006 Tillinghast ERM survey summary, available at www.towersperrin.com.
2.1 Prevalence of EC Calculation The importance of an EC analysis within an active risk management framework has increased substantially over the past several years. According to the 2006 Tillinghast ERM survey, 65% of all respondents now calculate a form of EC as part of their business practice. An additional 19% are considering calculating EC.
Exhibit 2.1 — Prevalence of EC calculation globally
65%
19%
16%
Do Not Currently Calculate EC
Currently Calculate EC
Considering Implementing EC
Framework
Question: Does your organization calculate economic capital (EC)?
Society of Actuaries Towers Perrin | 3

However, the survey indicates that life insurance companies have been slower to implement EC than other types of insurers.
Exhibit 2.2⎯Prevalence of EC calculation by type of insurers
Further, based on the ERM survey data, insurance respondents in the U.K. (90%), Bermuda (89%) and Asia-half
tion, although it is also used to measure risk-adjusted
han 36% of
Increasingly, EC is used as part of the pricing process, and may inform decisions regarding feasibility of certain
80%
72%
69%
55%
Reinsurers
Multi-line insurers
P/C insurers
Life insurers
Question: Does your organization calculate economic capital (EC)?
Pacific (72%) are more likely to calculate EC than U.S.-based respondents (49%). In the life sector, less than of the insurers in North America (47%) calculate EC, as compared to 61% of European life insurers.
2.2 Primary Drivers for Calculating EC The primary driver for calculating EC is capital allocaperformance and for making strategic and tactical decisions. Rating agency, regulatory and shareholder considerations were also cited by a majority of survey respondents as principal drivers of current risk management efforts. In North America, rating agency considerations are especially prevalent at more trespondents compared to 20% of respondents overall. Allocation of capital as a risk driver is more prevalent in Continental Europe, where 65% of respondents cited it as a consideration.
products and guarantees or management’s strategic decisions about whether to enter or exit certain market segments. For example, management may review EC requirements for a variable annuity product offering guaranteed minimum income, withdrawal or death benefits before deciding on the product’s feasibility. The use of EC in insurance company operations is discussed in more detail in Section 8 of this paper.
Society of Actuaries Towers Perrin | 4

Exhibit 2.3⎯Primary drivers for calculating EC
4%
8%
10%
20%
20%
20%
24%
30%
40%
42%
56%Allocation of capital
Measure of risk-adjusted performance
Making strategic or tactical decisions
Product pricing and design/business mix
Good business practice
Regulatory requirements
Rating agency considerations
Parent company requirement
Preparation for regulatory development
Shareholder reporting
Other
Question: What are your principal drivers for calculating EC? (Select up to three responses.)
EC is increasingly used as a risk management tool, rather than merely a risk metric. EC is more than a snapshot of the current financial standing of a company; it is used in strategic management of a company’s risk profile. Nearly two-thirds (64%) of survey respondents indicated they are focusing risk management efforts on managing the risk profile of the organization, and more than half (59%) are ensuring that risk management considerations are explicitly factored into decision making.
2.3 Differences in EC Approaches 2.3.1 Methodology Used to Calculate EC From a modeling perspective, most EC implementations follow one of two approaches, either stochastic modeling or stress and scenario testing. A majority of the respondents to the Tillinghast ERM survey that calculate EC (57% of such companies) do so using a stochastic approach. This approach is more prevalent in Continental Europe than in North America.
Of those respondents using a stochastic approach, 67% model each risk separately, and then aggregate results. The remaining 33% use a stochastic approach that models multiple risks together.
The 43% of respondents that do not use a stochastic approach use a stress and scenario testing approach (19%), a factor-based approach (11%) or some other method (13%). Other methods generally include a combination of factor-based and stochastic approaches as well as stress testing combined with a stochastic approach.
Society of Actuaries Towers Perrin | 5

Exhibit 2.4⎯Percentage of companies using various EC modeling approaches
ERM e
n
annual revenue use a form of stochastic approach. In contrast, only 27% of the respondents whose companies have annual revenue
ggest
ies and
The survey asked respondents to indicate the principal financial measures that are used to assess the impact of es are statutory or regulatory capital and surplus (56%) and
%,
. For example, based on the Tillinghast ERM survey, respondents in Asia Pacific and Continental Europe are more likely (at 44% of respondents) than the
n
annual revenue use a form of stochastic approach. In contrast, only 27% of the respondents whose companies have annual revenue
ggest
ies and
The survey asked respondents to indicate the principal financial measures that are used to assess the impact of es are statutory or regulatory capital and surplus (56%) and
%,
13%
11%
19%
38%
19%Stochastic approach⎯multiple risks modeled together
Stochastic approach⎯each risk modeled separately, then statistically aggregated
Stress and scenario testing
Factor-based
Other
Question: What methodology do you use for your EC calculations?
Approaches for calculating EC differ by region and by company sizeize. For example, based on the Tillinghast survey, respondents in Asia Pacific and Continental Europe are more likely (at 44% of respondents) than thglobal average (38% of respondents) to use a stochastic approach in which each risk is modeled separately. When both stochastic methods are viewed together ⎯ i.e., integrated stochastic methods and a stochastic approach iwhich each risk is modeled separately ⎯ North American life company respondents are slightly less likely than the global average to use a stochastic method (53% in North America versus 57% globally).
Further, 76% of the respondents in the survey whose companies have more than $10 billion of
global average (38% of respondents) to use a stochastic approach in which each risk is modeled separately. When both stochastic methods are viewed together ⎯ i.e., integrated stochastic methods and a stochastic approach iwhich each risk is modeled separately ⎯ North American life company respondents are slightly less likely than the global average to use a stochastic method (53% in North America versus 57% globally).
Further, 76% of the respondents in the survey whose companies have more than $10 billion of
less than $1 billion use a form of stochastic approach. Consistent with this, when looking at the use of stress and scenario testing, none of the respondents from the largest companies, and 49% of the respondents from the smaller companies, reported using this method. These statistics suggest that a fully robust EC model may present prohibitive cost and implementation challenges to small and medium sized insurers. Alternatively, it may suthat small and medium companies have been slower to implement EC calculations than their larger-sized counterparts: in many cases, stress and scenario testing approaches are the first step to implementing a more fully robust, stochastic model. Data from the 2006 Tillinghast ERM survey may also suggest that larger compancompanies outside of North America have moved farther along the learning curve.
2.3.2 Principal Financial Measures
risk. The most frequently cited financial measurrisk. The most frequently cited financial measureconomic/embedded value (68% combined). Use of regulatory capital and surplus is most frequently cited by participants in North America (70%) and the U.K. (67%). Respondents from life insurers and multi-line companies in North America (75% in each case) are more likely than their European counterparts (58% and 31
economic/embedded value (68% combined). Use of regulatory capital and surplus is most frequently cited by participants in North America (70%) and the U.K. (67%). Respondents from life insurers and multi-line companies in North America (75% in each case) are more likely than their European counterparts (58% and 31
Society of Actuaries Towers Perrin | 6

respectively) to focus on statutory or regulatory capital and surplus. The results were approximately the sP/C companies in North America (62%) and in Europe (60%).
2.3.3 Measure of Risk
ame for
The measure of risk tolerance varies over regions. Respondents globally reported using probability of ruin (or e hand, and Tail Value at Risk (TVaR) or conditional tail expectation (CTE) on the
There are significant differences in the period over which risk is assessed. From the respondents of all regions and sess over a one-year period and 14% assess risk over the runoff of the
ent period
Question: Over what period do you assess risk?
Value at Risk (VaR)) on the onother hand, at about the same extent. For North American life insurers, the use of CTE is significantly higher.
2.3.4 Assessment Period
lines of business, over half (56%) asportfolio. Among the North American life insurers in the survey, 20% use a one-year period and almost half (47%) use the runoff of the portfolio.
Exhibit 2.5⎯Use of risk assessm
Other period
14%
56%
30%
1 year
Runoff of portfolio
Society of Actuaries Towers Perrin | 7
2.3.5 Aggregation of Risks The correlation matrix is the most prevalent methodology for aggregating risk. Here’s the overall breakdown of methodologies used, showing both the percentages of all respondents and of North American (N.A.) life respondents: the correlation matrix (all: 44%, N.A. life: 47%), simple correlation (all: 12%, N.A. life: 20%), copulas (all: 5%, N.A. life: 0%), structural models (all: 21%, N.A. life: 13%), no aggregation (all: 8%, N.A. life: 7%) and other methods (all: 7%, N.A. life: 7%).
The observed differences in approach by region reflect the differences in the external drivers behind many insurers’ EC calculations. In Europe, regulatory guidance (including the U.K. and Swiss regulations and likely Solvency II) calls for a one-year time horizon using a value at risk (i.e., probability of ruin) risk measure. By contrast, the principles-based approaches being adopted by the NAIC in N.A. make use of a portfolio runoff approach with a CTE risk measure.
Overall, the results of the survey confirm the use of two main approaches in practice, namely a liability runoff approach and a one-year, mark-to-market approach. More discussion on the features and pros and cons of these two approaches can be found in Section 3 of this report.
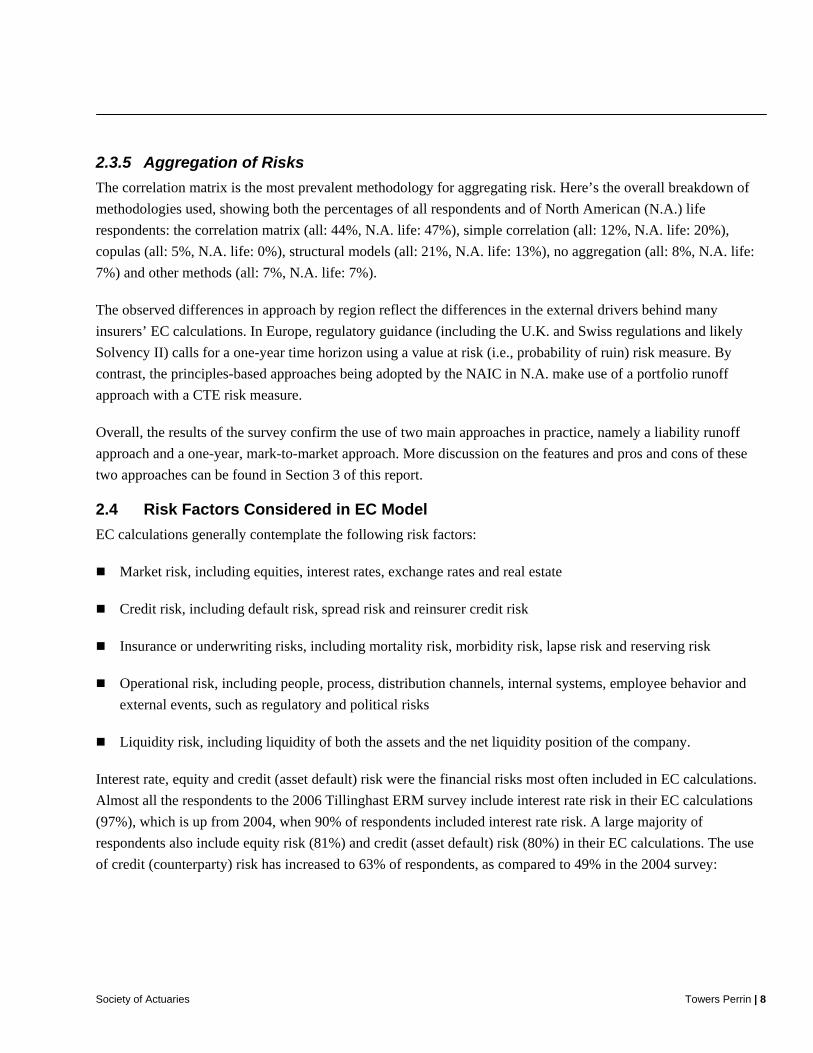
2.4 Risk Factors Considered in EC Model EC calculations generally contemplate the following risk factors:
Market risk, including equities, interest rates, exchange rates and real estate
Credit risk, including default risk, spread risk and reinsurer credit risk
Insurance or underwriting risks, including mortality risk, morbidity risk, lapse risk and reserving risk
Operational risk, including people, process, distribution channels, internal systems, employee behavior and external events, such as regulatory and political risks
Liquidity risk, including liquidity of both the assets and the net liquidity position of the company.
Interest rate, equity and credit (asset default) risk were the financial risks most often included in EC calculations. Almost all the respondents to the 2006 Tillinghast ERM survey include interest rate risk in their EC calculations (97%), which is up from 2004, when 90% of respondents included interest rate risk. A large majority of respondents also include equity risk (81%) and credit (asset default) risk (80%) in their EC calculations. The use of credit (counterparty) risk has increased to 63% of respondents, as compared to 49% in the 2004 survey:
Society of Actuaries Towers Perrin | 8

Exhibit 2.6⎯Financial risks included in EC calculations
51%
63%
80%
81%
97%
Property/real estate
Credit (counterparty)
Credit (asset default)
Equity
Interest rate
Question: Please select the risks that are included in your EC calculation⎯Summary
Mortality, lapse/surrender, longevity, expense and morbidity were the life insurance risks most commonly included in EC calculations:
Exhibit 2.7⎯Life insurance risks included in EC calculations
58%
70%
73%
73%
84%
92%
Policyholder behavior
Morbidity
Expenses
Longevity
Lapse/surrender
Mortality
Question: Please select the risks that are included in your EC calculations⎯Life Insurance Risks
The majority of respondents are now including operational (all: 79%, N.A. life: 80%) risks in their EC calculations. Of these firms, most are including event (all: 82%, N.A. life: 58%) and business (all: 70%, N.A. life: 75%) risks.
Since the 2004 ERM survey, insurers have generally increased the types of risks modeled as part of their EC framework. In particular, there has been an enhanced focus on the non-traditional risks such as operational risk. Despite this, there is no consensus on the appropriate way to model these risks. About three-quarters (all: 76%, N.A. life: 69%) of ERM survey respondents indicated they consider their ability to quantify operational risks important but are not satisfied with their current capabilities to quantify operational risks. Of these respondents, a
Society of Actuaries Towers Perrin | 9

greater number of reinsurers (88%) are more dissatisfied with their ability to quantify operational risks than direct writers — life (all: 74%, N.A. life: 69%), P/C (all: 67%, N.A. P/C: 65%) and multi-line companies (all: 72%, N.A. multi-line: 88%). Meaningful development in the modeling of these risks is expected over the next several years.
2.5 Evolution of EC Frameworks EC frameworks have evolved at a rapid pace over the past several years; this trend is expected to continue for the next several years. Most participants in the 2006 Tillinghast ERM survey expressed dissatisfaction with their current risk measurement and quantification processes. Nearly three-quarters (71%) of all respondents, whether or not they currently calculate EC, are dissatisfied with their ability to reflect risk considerations in performance measures. This suggests that EC could become increasingly important in product development (i.e., setting profitability) and financial reporting (i.e., measuring profitability) and in management incentive compensation plans.
Globally, 89% of respondents to the Tillinghast ERM survey that currently calculate EC are planning to make further improvements or enhancements to their EC calculations or frameworks. This is a particular focus of the participants in Asia Pacific (96%) and Canada (100%). North American life insurers (93%) also want to improve their EC calculations or framework.
Exhibit 2.8⎯Goals of planned improvements
2%23%
31%38%
50%52%53%53%54%
56%64%
70%Improving the aggregation capabilities Improving applications
Enhancing core methodology Extending the risks covered
Improving internal reporting capabilities Improving controls surrounding data and process
Increasing software modeling capabilities Improving the understanding and buy-in of senior management
Increasing modeling capabilities and efficiency Introducing or improving communication
Increasing hardware capability Other
Question: What are the goals of the planned or future improvements to the EC calculations or framework?
Of those planning improvements, the most frequently cited goal is to improve aggregation capabilities (70%), followed by improving applications (64%). The goals most frequently cited by North American life insurance respondents were improving the aggregation capabilities, extending the risks covered and increasing software
Society of Actuaries Towers Perrin | 10

modeling capabilities (71%), followed by improving the understanding and buy-in of senior management and increasing hardware capacity (64%).
Finally, in terms of reporting of EC, 60% of all respondents indicated they report on risk to the rating agencies at least annually. Reporting (at least annually) to rating agencies is a particular focus among North American respondents (76%) and Japanese respondents (79%).
Society of Actuaries Towers Perrin | 11

3. Pros and Cons of Existing EC Methodologies 3.1 Introduction There are a number of ways to define EC; key aspects include:
The time horizon to use (e.g., one year or runoff)
The measure(s) of risk to use (e.g., VaR or CTE)
The level of security to target (e.g., 0.5% or 0.1% VaR).
There are also a number of options as to the calculation approach, such as whether to use a stochastic or scenario testing methodology.
In practice, two broad methodologies have emerged as the most common: a liability runoff approach and a one-year mark-to-market approach. Most insurers calculating EC today do so following one (or sometimes both) of these approaches. While specific definitions and calculation approaches can vary, the two approaches can broadly be defined as follows:
The liability runoff approach, where EC represents the current market value of assets required to pay all future policyholder benefits, and associated expenses, at the chosen security level (expressed on a VaR or CTE basis), less the current value of the liabilities (typically defined on a mean or best estimate basis).
The one-year mark-to-market approach, where EC represents the current market value of assets required to ensure that the market-consistent value of liabilities can be covered in one-year’s time, at the chosen security level (typically expressed on a VaR basis), less the current market-consistent value of the liabilities.
3.2 The Liability Runoff Approach While there are a number of approaches to implementation, the liability runoff method is typically performed using a stochastic simulation approach as follows:
A set of (typically 1,000 or more) future scenarios for the runoff of the business is defined, and projected asset/liability cash flows and balance sheets developed for each scenario. The scenarios would include specifications for economic and demographic conditions, including risk drivers such as interest rate scenarios and asset default rates. Mortality levels and other insurance risk drivers may also be included in the stochastic scenario generation process, although this is less common among life insurers.
Under each scenario, the level of assets required at the beginning of the scenario to satisfy all obligations through to the end of the projection is determined. The level of “required assets” for all scenarios is then ranked to form a distribution.
Society of Actuaries Towers Perrin | 12

EC is defined by applying the chosen risk metric (e.g., VaR or CTE) to this distribution of total required asset levels and deducting the current value of the liabilities, measured on the selected basis (typically mean or best estimate).
Economic scenarios are typically derived from a proprietary “real world” economic scenario generator (ESG). While the provision of such software is commonly outsourced, it is important that management understand and agree on the theoretical models, the return and correlation assumptions and the calibration underlying the ESG.
As noted above, it is not typical among life insurers to develop a fully integrated stochastic model, where demographic and economic assumptions vary stochastically within the same model. Instead, capital for demographic risks such as mortality is more frequently examined using a stress testing approach, or possibly a standalone stochastic model, prior to aggregation with the economic risks on a simplified basis (e.g., using a correlation matrix).
The liability valuation basis used to define EC under the runoff approach can vary, with a different valuation basis resulting in a different split between liabilities and EC (but the same level of total “required assets”). In practice, mean or best estimate liability valuation bases are popular choices of liability valuation basis. Note that the most important measure for the purpose of policyholder protection is the required assets; the split of required assets between liabilities and EC is unimportant from this perspective, although will be relevant if EC is to be used in other contexts.
A few different variations of the liability runoff approach are observed in practice, in particular the inclusion of requirements to meet interim solvency measures during the runoff.
In its basic form, the liability runoff approach considers the asset level currently required to pay all claims and expenses throughout the runoff period, and does not explicitly take into account solvency levels at interim dates. Without any checks of interim solvency, there is an implicit assumption that adverse experience in earlier time periods can be offset against positive experience in later time periods. Put another way, the methodology allows the insurer to become technically insolvent in interim years providing it rebounds before the end of the runoff. This ignores the potential impact of regulatory intervention at times of technical insolvency.
Alternatively, the liability runoff approach can incorporate a check on solvency at interim points during the runoff. This raises the additional questions as to what measure of interim solvency should be used and how frequently it should be assessed. If the economic principles underlying the methodology are to be maintained, an economic basis of interim solvency would be required. Some European companies have incorporated interim solvency checks on a mark-to-market basis within their methodology. This can be computationally intensive.
The liability runoff approach (with interim solvency assessments) is the methodology preferred by U.S. regulators. It underpins the cash flow testing requirements for asset adequacy opinions and the C-3 capital determinations for fixed and variable annuities. Interim solvency is assessed by basing required capital on the
Society of Actuaries Towers Perrin | 13

“greatest accumulated deficiency” from each of the projected year ends rather than only looking at the present value of residual capital at the end of the projection. As of the writing of this document, this approach is intended to be the framework for the determination of all C-3 capital requirements under the emerging principles-based approaches for determining reserves and capital.
3.3 The One-Year Mark-to-Market Approach The one-year mark-to-market approach is based on the following main steps:
An economic balance sheet is developed as at the valuation date on a mark-to-market basis, i.e., with assets at market values and liabilities on a market-consistent basis. The difference between the value of assets and value of liabilities gives the economic value of net assets, i.e., the available capital at the valuation date measured on an economic basis.
For a number of scenarios, assets and liabilities are projected forward for one year, at which point a projected economic balance sheet (on a mark-to-market basis) is developed. The resulting projected economic value of net assets (positive or negative) is then discounted to the valuation date using the projected earned investment return over the year.
A negative discounted value quantifies the additional initial asset value the insurer needs to hold to ensure it remains solvent on a mark-to-market basis at the end of the year under that scenario. A positive discounted value quantifies the excess initial asset value over the amount needed to ensure solvency on a mark-to-market basis at the end of the year. The discounted value (of the projected economic value of net assets) is therefore subtracted from the market value of assets at the valuation date to give the required assets for that scenario.
The one-year mark-to-market approach can be implemented using a stochastic simulation approach as for the runoff method. The steps described above are performed for a large number of scenarios⎯perhaps 10,000 or more given the higher security levels that would typically be used in a one-year approach. This gives a distribution of required assets by scenario, from which the overall level of required assets can be determined (i.e., by calculating the chosen measure at the target confidence level). The EC requirement is then determined by deducting the initial market-consistent value of the liabilities from the required assets.
It is also common to implement the one-year mark-to-market approach using stress tests instead of stochastic simulation. This has tended to be more common for business with significant financial options and guarantees where the market-consistent value of liabilities requires the use of a risk neutral stochastic valuation. To implement a one-year stochastic approach to EC would therefore lead to computationally challenging “stochastic on stochastic” calculations (although replicating portfolio techniques have now been developed to overcome this).
With a stress testing approach to implementation, the full multi-dimensional distribution of required capital described is not developed. Rather a limited number of stress scenarios are run, where the scenarios have each been calibrated to the chosen security level. Scenarios are chosen to explore each of the key risks, and the capital
Society of Actuaries Towers Perrin | 14

results for each risk are typically combined using a correlation matrix approach. In some cases a number of multi-risk scenarios may also be considered, again calibrated to the chosen security level, to examine potential non-linearity in risk interaction.
It is important to note that even under the one-year approach, a runoff projection is still required, since a terminal value of liabilities at the end of the one-year horizon is needed. The future uncertainty surrounding the risk beyond the one-year horizon (including the cost of capital required to support that uncertainty) is captured within the market-consistent value of the liabilities at the end of the year.
While the one-year mark-to-market approach originated with the banking industry, it has also been adopted by many European multinational insurers and their global subsidiaries, which include many significant North American insurers. It is now being adopted as the basis for insurer solvency regulation across Europe (currently in the U.K. and Switzerland, expanding throughout Europe under Solvency II). A number of the largest North American insurers are also adopting this approach to EC calculations.
By its nature, the mark-to-market balance sheet is sensitive to market conditions and prices. Some consider that this results in market movements, particularly those driven by changes in market sentiment, having undue influence in setting capital requirements, given the long-term nature of a life insurance business. Others see the link to market prices as an advantage, both because they reveal the true market volatility of the balance sheet and because these prices may be very relevant when assessing risk management options available in adverse scenarios.
3.4 Pros and Cons of the Two Approaches 3.4.1 Risk Management Considerations The risk that policyholders do not receive their contractual entitlements in full is a function not only of the level of capital held by the organization but also of the way the organization is managed. Turning this around, the EC required by an organization can be seen to be a function on the actions it will take in managing risk as well as the selected level of security. This interaction between the calculated EC measure and the strategies adopted for managing risk within the organization is an important aspect and one in which the two primary approaches to EC take very different approaches:
The one-year mark-to-market approach examines a short period (i.e., one year) during which adverse experience emerges and during which there is an explicit assumption that limited management actions are taken. Such actions would typically be limited to a degree of trading of assets, to the extent that the organization has specific programs or strategies in place to perform such trades as markets develop (e.g., dynamic hedging strategies). At the end of the one-year period there is an assumption that the risk can be “closed out” by transactions at market prices, either through risk reduction (e.g., hedging of market risks), risk transfer (e.g., through reinsurance) or through a sale of the portfolio to a third party. This ability to close out the risks at the end of the year is what drives the use of the mark-to-market balance sheet.
Society of Actuaries Towers Perrin | 15

Risk emergence over a longer time horizon is not examined directly by the one-year mark-to-market approach (although the market-consistent value of the liabilities does bring in the price of such risks and how they might be managed). Similarly, the multitude of other management actions which are available over the longer term are excluded from the calculation, including variation in the asset strategy, the reinsurance strategy, the volume and pricing of new business, and the ability to raise additional capital or restrict shareholder dividend payments.
This is not to say that organizations adopting a one-year mark-to-market approach do not recognize the need to address longer-term risk issues and their potential consequences in terms of capital. They typically prefer to address such issues separately, outside the EC assessment, through deterministic adverse scenario analysis, over a business planning cycle of three to five years, bringing in all the range of management actions that might reasonably be taken in each scenario. So, for example, a prolonged period of poor equity returns might be considered, revealing a deteriorating capital and security position (using the one-year mark-to-market approach at each year end) if no action were to be taken. However, many of the management actions described above may be available in such a scenario, and it would appear reasonable for management to rely on their utilization, instead of holding additional capital at the outset to cover such a risk. Such scenario analysis typically goes by the name of Financial Condition Reporting in the U.K. and falls within the Own Risk and Solvency Assessment (ORSA) required under the proposed Solvency II regulations.
The stochastic liability runoff approach on the other hand does bring in all risks during the runoff of the portfolio, albeit often only those relating to the existing portfolio (sometimes with a limited number of years’ new business also included). A number of the actions available to management during that period may also be allowed for through formulae included in the stochastic model. However, it is very rare for the full range of such actions to be incorporated as it is difficult to allow formulaically for such actions as additional capital raising and increased utilization of hedging/reinsurance, as the capital position of the organization varies over time; also for the ability to vary new business volume and prices in circumstances where new business is modeled.
In this context a number of pros and cons can be observed.
The one-year mark-to-market approach gives strong recognition to the fact that an organization’s principal ability to control risk in the short term is through trading assets and/or liabilities, including through reinsurance and portfolio/business transfer. However, the lack of data available to calibrate a distribution of market-consistent prices for non-hedgeable liabilities such as mortality/morbidity may be regarded as a potentially significant weakness.
The liability runoff approach, on the other hand, can give insufficient recognition to this ability to control risk through asset/liability trading, unless sophisticated algorithms are built into the model to allow for it.
Society of Actuaries Towers Perrin | 16

The one-year mark-to-market approach relies on deterministic adverse scenario analysis to examine longer term risks and their management. This has a weakness in that it is reliant for its completeness on management’s scenario selection (as opposed to using a stochastic scenario generation process), but has a strong advantage in allowing management to make a realistic assessment of all the risk management actions it might take in such a scenario. Management can then make a conscious choice between taking such action and holding additional capital, additional to the one-year mark-to-market EC, effectively to cover their preference not to take such management action.
The liability runoff approach aims to build longer-term management actions into the stochastic model, although in practice this can be difficult to perform comprehensively. While this approach removes the reliance on management scenario selection, stochastic projections of longer-term risk emergence and management thereof can be less clear and more difficult to analyze than with a deterministic equivalent. There is a risk that EC can be overstated through the omission of actions that might reasonably be taken, or alternatively that the reason for the high capital requirement (a preference for, or an assumption of, less risk management action) is not clearly understood. In addition, in an environment where management changes can occur fairly frequently, making assumptions as to management actions over the longer term can be considered speculative.
Both approaches to EC allow longer-term risk issues to be addressed, but in different ways.
3.4.2 Risk-Based Performance Measurement A one-year mark-to-market approach to EC assesses the quantum of risk over the same one-year period as is typically used for shorter-term performance measurement purposes. This allows the consistent assessment of risk, capital and performance. A liability runoff approach to EC can result in a timing mismatch with short-term performance being compared with risk and capital assessments based on a longer-term horizon.
3.4.3 Ease of Communication and Understanding A one-year approach is generally viewed as being easier to understand and explain, especially to non-technical audiences. This can be particularly important when the EC results are being shared externally or discussed with the board of directors. The fact that it is consistent with similar measures used in other industries can also be helpful.
At a conceptual level, a liability runoff approach can also seem relatively easy to understand. However, at a slightly deeper level, complexities with respect to model assumptions, risk interactions and management actions can make this approach to EC relatively difficult to explain and hence easily misunderstood.
3.4.4 Implementation Considerations Assessing risks over the full runoff of the portfolio is typically challenging from an implementation perspective. To be effective, the liability runoff approach requires a wide range of management decisions to be modeled, each
Society of Actuaries Towers Perrin | 17

of them interacting with the scenario characteristics and the impact of that scenario on the organization (e.g., as to its solvency). While the results can provide significant insights, the consequences for model complexity can lead to longer implementation timeframes and add to the opaqueness of the process (unless major efforts are made to avoid this).
A key component of risk to the existing policyholders relates to management plans for new business and their ability to control its volume, mix and price (ultimately closing to new business if required). Modeling new business can add further to the complexity of a runoff model, requiring a number of decisions to be made, such as how many years’ new business to include, what sales volumes to include in each projection year and what pricing terms to assume. Additionally, the insurer would need to consider how each of these decisions would change under different projected paths. It is debatable whether such assumptions can realistically be represented formulaically beyond the first few years of the projection, and consequently each scenario path would need to be carefully considered for reasonableness.
A one-year mark-to-market approach on the other hand includes projected new business over the one-year time period, typically at levels expected within the business plan (without allowing for any management intervention over the one-year period). The capital implications of writing further years’ new business are considered as part of the longer-term deterministic scenario analysis described in 3.4.1 above.
While a one-year mark-to-market approach typically requires fewer management decisions to be modeled than under a liability runoff approach, it does have a number of implementation challenges. For liabilities including options and guarantees, the end year market-consistent liability valuations required can lead to the need for “stochastic on stochastic” calculations if risks over the year are to be assessed stochastically. Before the recent application of replicating portfolio techniques to insurance business, this has typically proved too much for many insurers’ systems to handle in a reasonable timeframe. Consequently, the one-year mark-to-market approach is often implemented, initially at least, using stress testing.
While a stress testing approach eases and speeds the computation and can give further benefits in terms of transparency and communication, the full capital distribution is not developed and the approach cannot therefore be considered to be as rich (or as accurate) as a stochastic approach. Calibrating appropriate stress tests to a target security level can also be challenging, particularly where complex (non-linear) risk interactions exist or where the relationship between risk distributions and capital distributions is not monotonic.
For liabilities/risks where there is no comparable liquid traded market (e.g., mortality) and irrespective of whether a stochastic approach or stress testing approach is used, the requirement to calibrate an end year market-consistent value, and its distribution across a range of scenarios, can be argued to make the one-year approach unduly subjective. Taking mortality as an example, it should be noted that a number of factors may influence the end year value, including:
Society of Actuaries Towers Perrin | 18

The individual insurer’s experience over the year,
The industry experience over the year,
Emergence over the year of factors changing the nature/impact of the future risk (e.g., medical developments),
Emergence over the year of additional knowledge and insight concerning the future development of the risk (e.g., additional analyses),
Changes in sentiment toward the risk within the markets.
Difficulties in assessing the pace of emergence of information in relation to the risk (which in practice will tend to be somewhat lumpy) have led to some insurers in practice assuming, for the purpose of their EC calculations, full emergence of the information about the risk over the year, which may tend to overstate capital requirements.
3.4.5 Calibration
It is generally viewed as easier to calibrate EC to a target security level under a one-year approach. As discussed in 3.5.2 below, there is a significant body of statistics available regarding corporate bond defaults against which a reasonable calibration can be made. These statistics relate primarily to annual rates of default and take into account all risks to which the organization is exposed over that one-year period. The more limited data available regarding insurer defaults are determined in a similar way. These datasets are therefore derived from the same situation as is represented in a one-year approach to EC, including new business.
Calibration of a liability runoff approach to an external data source is more difficult as:
The block of business (and therefore the risk exposure) will typically be reducing over time, and
The projection would typically not include all risks for all time periods; in particular, new business may be included for only a limited time period, if at all.
Therefore, there will not typically be external statistics available against which to calibrate the target security level, and some approximations will need to be made. In addition, different lines of business run off over different periods and may need different calibrations.
3.4.6 Aggregation
Under the one-year mark-to-market approach, all risks are measured over the same time horizon, thus ensuring consistent aggregation of risks and facilitating arguments for diversification benefits (as any offsets occur in the same time period). Providing strong justification of diversification benefits to rating agencies and regulators is critical to achieving the reductions in capital requirements that most insurers seek from their EC calculations.
Society of Actuaries Towers Perrin | 19

Under the liability runoff approach, if no interim solvency assessments are made, the approach will implicitly assume that short term losses on one line can be offset against longer term profits on another. Justifying this, and the consequent diversification benefits, can be challenging. The issue goes away if interim solvency assessments are included.
3.5 Other Aspects of EC Methodology There are a two other key aspects to EC methodology that need to be considered, whichever of the two principal approaches (as described above) is adopted⎯the measure of risk to be adopted and how to calibrate it for EC purposes (the target security level).
3.5.1 Measure of Risk While a number of different measures of risk can be used within an EC calculation, in practice most can be categorized into one of two groups. These reflect the two aspects of downside risk faced by policyholders, namely the probability that they suffer a loss compared to their expectations (“probability of ruin” measures), and the extent of that loss (“cost of ruin” measures). Value at Risk (VaR) and conditional tail expectation (CTE) are common probability of ruin and cost of ruin measures, respectively, and are used below to illustrate the differences.
Both types of risk measure can be used with either of the two main approaches to calculating EC. Some relative advantages and disadvantages of the two types of risk measure are considered below.
Conceptually, VaR is relatively simple to understand and use. It is widely known and used, especially in the banking industry, and is the approach favored in Europe under Solvency II. VaR is also generally consistent with the majority of the calibration data available from rating agencies, which tends to focus more on the probability of default rather than the loss given default.
Computationally, CTE is generally more demanding to calculate accurately than VaR and can be more difficult to calibrate to historical data (due to a relative lack of data from rating agencies). It is the approach prescribed by the U.S. regulator in C-3 capital calculations. To achieve an accurate CTE result requires knowledge of the shape of the risk and loss distributions in the extreme tail of the distribution, which can be difficult to justify (given that the focus is typically on events that occur very rarely). VaR is less demanding of accuracy of modeling in extreme scenarios and requires fewer scenarios to achieve a stable result. However, it can result in inadequate, possibly even zero, levels of capitalization for low probability, high-loss lines of business — for example, in higher-level coverage for reinsurance or earthquake protection.
Perhaps the most important difference cited between the two measures is that CTE (and most other cost of ruin approaches) is a coherent risk measure, thus ensuring reasonable results when aggregating capital across risks/BUs or alternatively when allocating capital among risks/BUs. VaR is not a coherent risk measure and can lead to inconsistent results when aggregating/allocating capital. In practice, however, this does not present an
Society of Actuaries Towers Perrin | 20

issue for most risk distributions encountered within the life industry. P&C insurers often face more skewed distributions, and the coherence of the measure is therefore a more important factor. For further information on the application of coherent capital measures to insurance business, see Artzner1.
3.5.2 Target Security Level The calculated level of EC is designed to provide a target level of protection to policyholders, determined in such a way that this target can be communicated meaningfully to all the relevant stakeholders (including regulators and rating agencies). This target security level forms one component of the company’s risk appetite.
There is no prescribed way in which such a target security level should be expressed, although it is logical to relate it in broad terms to other measures of financial strength and resilience, such as rating agency assessments (AAA, AA, A, etc.) of the company’s corporate debt (if any) and insurance financial strength rating, of which policyholders (or at a minimum their agents) will be aware.
In structuring such a target security level, it is worthwhile to observe certain characteristics of insurer and corporate bond default experience, perhaps most notably that the probability of default increases with the duration of exposure to the company. That is, there is a higher probability that a 10-year corporate bond will default at some point during its term than a 5-year bond of the same rating. Thus it would appear reasonable to adopt a similar approach for insurance policyholders, namely to offer a higher level of security, over the full term of their policies, to short-term policyholders than to long-term policyholders. Indeed, targeting the same level of security for policyholders of all durations seems doomed to failure.
In calibrating such a target security level, the most natural approach might be to relate it to insurer’s financial strength rating by deriving a probability of default, or an expectation of loss on default, from historical experience of insurers of that financial strength rating. However, there is relatively little data available on insurer defaults (as there have been relatively few) to perform such a calibration, and consequently most companies have instead referred for EC calibration purposes to the much larger body of data available in relation to corporate bonds. The level of security provided to policyholders is thus set to be broadly equivalent to the level of security available to holders of corporate bonds of the chosen rating category. This provides an approach that is justifiable in broad terms, can be calibrated to a fairly extensive dataset and can be communicated to the relevant stakeholders.
The use of corporate bond default data is sometimes criticized, and these criticisms usually relate to the issue raised above concerning the relevance of corporate bond loss data to insurance financial strength.
In addition, rating agency historical default statistics do not reflect economic insolvency; rather they typically reflect accounting measures of insolvency together with cash flow or financing shortfalls. It is possible that the 1 Artzner, Philippe; 1999; “Application Of Coherent Risk Measures To Capital Requirements In Insurance”; North American Actuarial Journal,
Volume 3, Number 2.
Society of Actuaries Towers Perrin | 21

Society of
In theory, corporate bond default data could also be used to calibrate a cost of ruin measure such as CTE, although there is less detailed data available as to historical losses given default. In addition, it can be argued that such loss data may not be appropriate in calibrating CTE measures for EC purposes as policyholders may reasonably have a significantly lower expectation of loss given default than the corporate bondholders in a similarly rated company (corporate bonds typically ranking behind corporate debt in the event of insolvency). In practice CTE measures are typically calibrated judgmentally, taking into account guidance from regulators.
declaration of insolvency under such measures might be avoided in many circumstances where use of an economic measure would show insolvency; therefore, rating agency default statistics might be understated compared to those that would result from an economic assessment, and an EC calculation calibrated to such statistics will be overstated.
Actuaries Towers Perrin | 22

4. EC Methodologies Compared to Other Risk Capital Approaches The table below provides insights into the relationship between the insurance EC methodologies and other existing or developing solvency/risk capital frameworks.
Framework Overall Observations Risks Covered
Approaches Used: Standard Formulas, Models and
Scenarios Assessment Period, Risk
Metrics and Confidence Level Correlation and Hedging
U.S. NAIC RBC: Factor Approach
Factor-based approach determines specific C-1, C-2, C-3 and C-4 components
Special formula allowing for covariance between C-1 and C-3 risk reduces overall requirements and makes them nonadditive
Uses U.S. statutory (i.e., NAIC) balance sheet components or more refined details on the same basis
Covers all insurance and asset risks (C-1, C-2, C-3 risks) and some operational risk via the C-4 component
Factors for most components Period is the remaining policy lifetime
Confidence level of factors is implicit rather than explicit (approximately 90% confidence or CTE95)
Correlation of C-1 and C-3 via covariance calculation
U.S. NAIC RBC: Principles-based Approach
C-3 Phase I for single premium interest-sensitive products
C-3 Phase II enacted as of year-end 2005 for variable annuities (VAs) with guarantees
C-3 Phase III for life and C-3 Phase IV for fixed annuities: new capital models
Principles-based approach (PBA) would be subject to peer review (involving a qualified actuary and review actuary) as well as criteria for setting prudent assumptions and margins
For reserves, the new
All cover only market risks, modeled stochastically
Other risks will be included based on prudent estimates with margins to account for mis-estimation and adverse deviation (to be defined)
C-3 Phase I using internal models with prescribed stochastic scenarios
C-3 Phase II for VAs is the first NAIC model based on PBA
Stochastic modeling using prudent estimates
Real world stochastic scenarios are prescribed and provided by NAIC; or companies can use their own scenarios if calibration criteria are met
Recent proposal for reserves would be equal to the maximum of deterministic reserves (gross premium
All done over the runoff of the business
RBC is equal to CTE 90 (i.e., average of worst 10% of the distribution of total asset requirements) less statutory reserves
Reported reserve is generally set at CTE 65 of the sum of the value of starting assets and the sum of the present value of accumulated deficiencies
Correlations between product segments are included, but not across risks or across segments
Society of Actuaries Towers Perrin | 23

Framework
Approaches Used: Standard
Overall Observations Risks Covered Formulas, Models and Assessment Period, Risk
Scenarios Metrics and Confidence Level Correlation and Hedging approach will initially apply prospectively, i.e., to new business only; in-force business will remain on the existing NAIC formulaic approach (except VAs)
For capital requirements, the new approach will apply retrospectively, i.e., to all in-force business at once
valuation, seriatim, policy-by-policy, based on net asset returns, company-specific not exit values as is the case in Solvency II with minimum cash value) and stochastic reserves (with prudent estimates for assumptions based on aggregated cash flows)
Risk discount rates are company-specific and based on net asset returns
Solvency II — Draft Framework Directive — July 2007 (Solvency Capital Requirements)
A three-pillar approach similar to Basel II
Pillar I represents the quantification of risks
Pillar II is the governance process (both internal and regulatory) and capital add-ons if necessary with a risk-based focus
Pillar III sets for criteria for disclosure, both supervisory and public— the latter seeking to use market forces to encourage better risk management and capital levels
Total balance sheet approach based on market-consistent valuations
Two major levels of capital: Solvency capital
requirements (SCR) Minimum capital
Risks covered are underwriting, market, credit, liquidity, operational, legal
EC is thus one component of an integrated ERM framework (as demonstrated by the regular Own Risk and Solvency Assessment (ORSA) to be performed by companies)
If certain conditions are met, group supervision will override certain capital requirements (e.g., solo SCR, but not solo MCR)
SCR determined either using a standard approach or via approved internal models
Fixed EU parameterization for the MCR and SCR standard approach; cannot use entity-specific experience to determine stresses
Internal model approval has three main criteria: use test (closely linked to ERM), calibration test (how comparable results are with standard approach and other insurers’ models, other things being equal), statistical test (robustness of the approach, data and assumptions). Freedom to calibrate model and use own experience subject to approval)
Partial models will be allowed using approval criteria very similar to those
SCR will be set at VaR, measured at a targeted confidence level of 99.5% over a one-year horizon (1 in 200 year loss to risk insolvency). SCR is the higher of the two solvency control levels. It is the solvency control level where supervisory intervention would start
MCR methodology has not yet been decided. MCR looks likely to set at 80% – 90% confidence level. MCR is the solvency control level at which ultimate supervisory intervention would take place
Risk mitigation is allowed Correlation approach is the prescribed method for the MCR and SCR standard approach. It is possible that adjustments for non-linearity effects may be included
There is no prescribed approach for internal models and, subject to regulatory approval, other aggregation techniques such as copulas could be used
Society of Actuaries Towers Perrin | 24

Framework
Approaches Used: Standard
Overall Observations Risks Covered Formulas, Models and Assessment Period, Risk
Scenarios Metrics and Confidence Level Correlation and Hedging requirements (MCR)
Emphasis is on the capacity of capital to withstand short- term extremely adverse events
for internal models Technical provisions will be based on the concept of exit values, not company-specific. Risks that can be hedged will be valued on an MTM basis, while non-hedgeable risks will be valued as the discounted (risk-free) best estimates plus a risk margin using cost of capital approach with no adjustments for own credit
Capital eligible to cover capital requirements based on three-tiered approach
Basel II Based on a three-pillar approach:
Pillar I is focused on capital requirements
Pillar II is focused on regulatory supervision
Pillar III is focused on disclosure requirements
Mostly focused on credit risk for the banking book, market risk for the trading book and operational risk
Other risks treated as part of Pillar II
Standard formulas and internal models allowed, subject to qualifying criteria
Credit risk calculated taking into account frequency, exposure at default and loss given default
Concentration of credit risk taken into account
The measure is specified per risk category:
For credit risk and for operational risk, the one-year VaR at the 99.9% confidence level is used
For market risk, the ten-day VaR at the 99% confidence level with a scale factor of 3 is used
Some correlation allowed in the standard formulas for credit risk
No correlation allowed between risk
Hedging can be taken into account in internal models, both for credit risk and operational risk
For operational risk, insurance as a hedge limited to 20% of required capital
UK ICA and general capital requirements
Significant focus by regulator on Board ownership of governance, risk process and controls and individual capital assessment (ICA) results
With the advent of Solvency II in Europe, ICA will be replaced by Solvency II
All risks to meeting policyholder expectations to be considered
Only done at solo level and not at the group level
Capital determined by applying stress and scenario tests to best estimate liability projections. Typically projections of liabilities on a market-consistent basis
Companies determine the calibration and assumptions used, with supervisor
Companies can use either a one-year or multi-year time period with the confidence level adjusted appropriately
Life companies invariably use a one-year 99.5th percentile VaR approach, as market risk is the most significant risk
Diversification both intra-risk and inter-risk allowable. Considerable focus on how risks interact in adverse circumstances (i.e., does everything go wrong together?)
Flexibility over aggregation approach, e.g. via using a
Society of Actuaries Towers Perrin | 25

Framework
Approaches Used: Standard
Overall Observations Risks Covered Formulas, Models and Assessment Period, Risk
Scenarios Metrics and Confidence Level Correlation and Hedging reviewing their reasonableness and applying a capital add-on if appropriate
Typically stress tests of individual risks with consolidation through the use of correlation matrix
Also consider individual scenarios and must be aware of scenarios where risks interact to produce greater capital requirements than the use of individual stress tests
Capital eligible to cover capital requirements based on three-tiered approach
Non-life companies typically use a multi-year approach (e.g. ten-year VaR at 95th percentile
real world ESG for market risk or copulas
Swiss Solvency Test: SST
Market-consistent valuation Market value margins (MVM) Principles based, but standard model exists in order to support companies
All embedded options need to be reflected
Successfully applied for four years
Market, credit and insurance risks, not operational risks
Focus on obligations toward policyholders
Standard is an analytical approach, convoluted with comprehensive scenarios
Internal models strongly encouraged
One-year 99% expected shortfall (TVaR)
Standard approach: correlation matrix
Internal models: Correlation models Trend to copula
approach Diversification benefit within legal entities applicable
Society of Actuaries Towers Perrin | 26
Framework
Approaches Used: Standard
Overall Observations Risks Covered Formulas, Models and Assessment Period, Risk
Scenarios Metrics and Confidence Level Correlation and Hedging
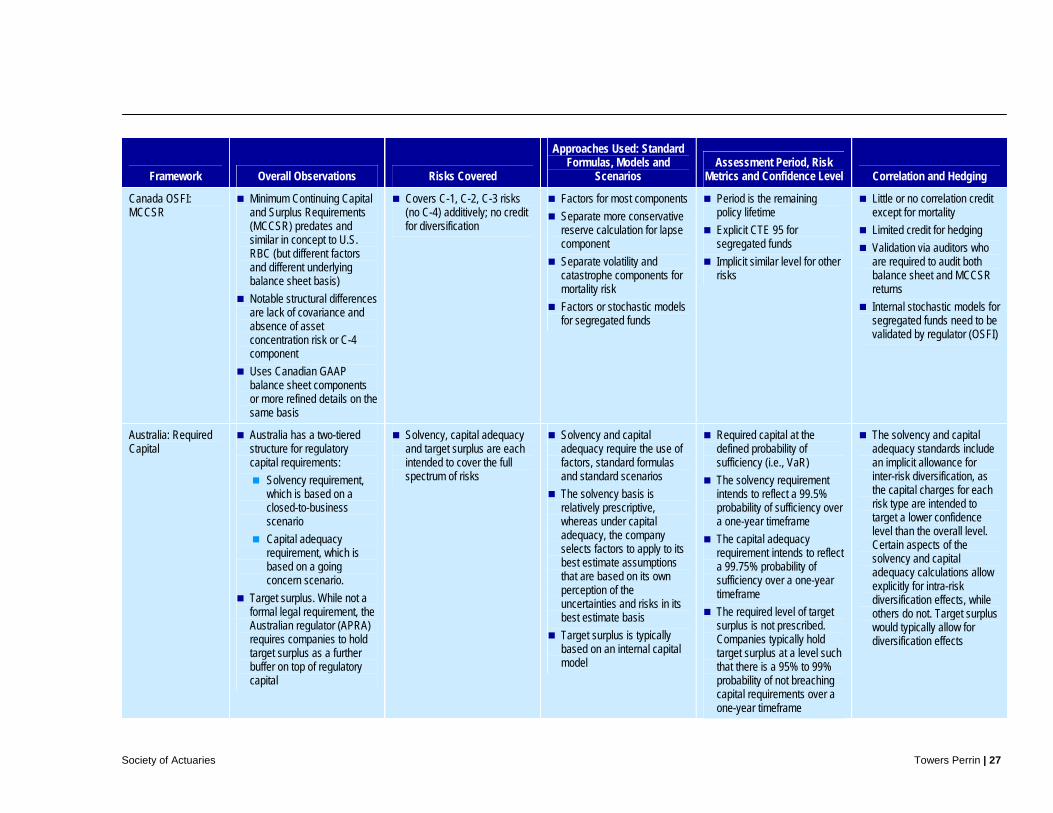
Canada OSFI: MCCSR
Minimum Continuing Capital and Surplus Requirements (MCCSR) predates and similar in concept to U.S. RBC (but different factors and different underlying balance sheet basis)
Notable structural differences are lack of covariance and absence of asset concentration risk or C-4 component
Uses Canadian GAAP balance sheet components or more refined details on the same basis
Covers C-1, C-2, C-3 risks (no C-4) additively; no credit for diversification
Factors for most components Separate more conservative reserve calculation for lapse component
Separate volatility and catastrophe components for mortality risk
Factors or stochastic models for segregated funds
Period is the remaining policy lifetime
Explicit CTE 95 for segregated funds
Implicit similar level for other risks
Little or no correlation credit except for mortality
Limited credit for hedging Validation via auditors who are required to audit both balance sheet and MCCSR returns
Internal stochastic models for segregated funds need to be validated by regulator (OSFI)
Australia: Required Capital
Australia has a two-tiered structure for regulatory capital requirements:
Solvency requirement, which is based on a closed-to-business scenario
Capital adequacy requirement, which is based on a going concern scenario.
Target surplus. While not a formal legal requirement, the Australian regulator (APRA) requires companies to hold target surplus as a further buffer on top of regulatory capital
Solvency, capital adequacy and target surplus are each intended to cover the full spectrum of risks
Solvency and capital adequacy require the use of factors, standard formulas and standard scenarios
The solvency basis is relatively prescriptive, whereas under capital adequacy, the company selects factors to apply to its best estimate assumptions that are based on its own perception of the uncertainties and risks in its best estimate basis
Target surplus is typically based on an internal capital model
Required capital at the defined probability of sufficiency (i.e., VaR)
The solvency requirement intends to reflect a 99.5% probability of sufficiency over a one-year timeframe
The capital adequacy requirement intends to reflect a 99.75% probability of sufficiency over a one-year timeframe
The required level of target surplus is not prescribed. Companies typically hold target surplus at a level such that there is a 95% to 99% probability of not breaching capital requirements over a one-year timeframe
The solvency and capital adequacy standards include an implicit allowance for inter-risk diversification, as the capital charges for each risk type are intended to target a lower confidence level than the overall level. Certain aspects of the solvency and capital adequacy calculations allow explicitly for intra-risk diversification effects, while others do not. Target surplus would typically allow for diversification effects
Society of Actuaries Towers Perrin | 27

Framework
Approaches Used: Standard
Overall Observations Risks Covered Formulas, Models and Assessment Period, Risk
Scenarios Metrics and Confidence Level Correlation and Hedging
S&P: New RBC Insurance Capital Model to assess each company’s EC in relation to its risks
Goal is to determine the amount of capital necessary to cover a myriad of risks at different levels of confidence in excess of reserves
Target capital covers market, credit, operational, underwriting and catastrophic risk
Factor-based approach Total adjusted capital is compared to target capital for a given targeted rating
Present value of the expected economic losses in surplus measured over the expected duration of the assets and liabilities and observed over a one-year period for the stress scenario corresponding to the desired rating
Confidence levels chosen to be in line with the company’s new target rating over a five-year period stress scenario: 99.9% for AAA; 99.7% for AA; 99.4% for A; 97.2% for BBB
Credit for diversification will be recognized for correlations in the tail, but at a lower value than observed in the industry (50% haircut)
S&P: New Internal EC models acceptability criteria for insurance companies
Principles on the acceptability of internal models in discussion
Generally internal models will only be given partial credit for companies with higher ratings
Must be related to management’s desired risk tolerance statement and cover all material risks
For insurers with strong and excellent ERM, internal models are appropriate, both based on stochastic and stress test approaches
Supportive of both real world and market-consistent approaches
Risk metric must be appropriate to reflect underlying company risks and must be justified
Diversification effects for both intra-risk and inter-risk can be accounted for, in particular in the tail of the distribution
Moody’s General EC principles to assess each company’s EC
Approach based on interrogation, not replication
Output of the EC analysis will be integrated with overall risk assessment
Internal model must be integrated in business and risk management processes, reflecting risk tolerance
All risks included in NAIC RBC model
Emphasis is on stress tests to make sure the internal models are conservative enough
Generally relies on statutory metrics (mainly RBC)
Based on Statutory RBC only
Fitch Prism EC Model to assess each company’s EC in relation to its risks
Will be used as part of the overall credit assessment of insurers. Weightings have not been specified
Output of model will compare required capital to available capital at a specific rating level. Fitch's EC model
Real world stochastic approach used for both assets and liabilities
Prism is flexible enough to
Tail VaR (TVaR) corresponding to an insurer’s financial strength ratings
TVaR can vary according to
Will take diversification effects into account
Partial credit for hedging
Society of Actuaries Towers Perrin | 28

Society of Actuaries Towers Perrin | 29
Framework Overall Observations Risks Covered
Approaches Used: Standard Formulas, Models and
Scenarios Assessment Period, Risk
Metrics and Confidence Level Correlation and Hedging applies a runoff approach function within a one-year
approach or a runoff approach
assessment period selected by insurer
E.g., for one-year TVaR: 99.98% for AAA; 99.96% for AA; 99.9% for A; 99.2% for BBB
A. M. Best EC principles
EC models must be used in the management of the risk exposures and risk limits
Credit given for internal EC models (over time)
EC models are part of an ERM process
Models must capture all material risks
Consistent with NAIC RBC risks
Scenarios and stress tests must be used to quantify unexpected and extreme events
Current Best’s capital adequacy ratio (BCAR) model will be adapted to PBA model once PBA is fully implemented
Mainly statutory metrics (RBC and others) for now, but this is expected to change to PBA
Models must capture correlations between risks
Models must assess hedge effectiveness
Models must be updated, back tested and run frequently

5. Factors to Consider in Developing an EC Program 5.1 Introduction Insurers face many options in implementing EC, ranging from the definition of the core EC metric to the quantification methodologies and choice of systems. A number of factors need to be considered when selecting among these options, in particular:
the insurer’s objectives for the EC implementation,
the risk profile of the business it writes, and
the constraints it faces in relation to the implementation.
Each of these three aspects is considered in more detail below.
It should be noted that many insurers adopt a phased approach to the introduction of EC, with a simpler, quicker and cheaper approach (such as stress testing) being adopted first, so as to gain familiarity with the concepts and tools, as well as the insurer’s specific risk profile. Once a full initial EC calculation on this basis has been performed, the level of sophistication of approach can gradually be increased, focusing on the areas of particular importance to that insurer and skipping over those aspects not material to its EC result.
5.2 Objectives of the EC implementation An insurer’s objectives for calculating EC, including how the results are to be used in the business, will have an important influence on the appropriate implementation approach. Among other things, the intended utilization of EC will have an impact on the level of detail and frequency of the calculation required and these factors in turn will influence choices around EC definition, calculation approach and systems design. It is likely that trade-offs will need to be made, for example, between the accuracy of the EC results and the timeliness of their availability for business utilization.
5.2.1 Capital Adequacy The core use of EC for most insurers is as an assessment of their “true” level of capital adequacy, i.e., an assessment calculated on an economic basis and not distorted by regulatory or financial reporting requirements. This application of EC is often driven by a need to facilitate discussions on this subject with external parties (e.g., regulators and rating agencies).
Capital adequacy is relatively undemanding on the level of detail to be included in the EC calculation, providing the result gives a reasonable picture of capital adequacy at the entity and/or group levels (an assessment of capital adequacy on a more granular basis can only be made to the extent assets are specifically allocated at a more
Society of Actuaries Towers Perrin | 30

granular level). Thus risks that diversify significantly within the insurer (e.g., the annual volatility of mortality claims) attract less focus than they would for a product level EC assessment.
Regarding the frequency of calculation, annual results will be a core requirement, but quarterly if not monthly updates are increasingly needed (albeit with some approximations). A process to determine capital adequacy at any point in time (again likely using some approximations) is also increasingly a requirement, in particular for market risk, given the speed at which market movements can occur and the need to demonstrate externally that the EC measure is at the core of the insurer’s risk management framework.
Because there will be a need to discuss the capital adequacy results at board level internally and with several external third parties (e.g., regulators, rating agencies and the investment community), an approach that uses more familiar concepts and that is easy to communicate has advantages. For example, this is a reason why the risk of ruin (VaR) measure is often chosen over tail VaR or CTE, in spite of the theoretical advantages of the latter metrics.
The insurer will also need to give consideration to any views or guidance that these third parties offer in relation to the EC implementation approach. To date, the rating agencies have not expressed strong opinions in relation to one approach over another, preferring the insurer to develop its own views, taking into account the risk profile of its business. Regulators, for example in the U.K. and within the emerging Solvency II regime, have similarly allowed flexibility of approach, but have typically steered insurers towards their own preferences. For example, under Solvency II, the one-year mark-to-market approach must be determined as a benchmark for policyholder protection even if a different approach is used for EC calculations.
5.2.2 Risk Monitoring and Control EC is a key measure of risk from a policyholder perspective. It therefore frequently features as an important component of an insurer’s risk appetite framework and in the risk measurement and monitoring processes implemented to ensure the insurer remains within that risk appetite. For this purpose, EC needs to be captured not only at the corporate level but also at a more granular level, with the precise decomposition of EC being determined by the insurer’s risk management structure. For example, in some insurers management control of all risks lies with the business units, whereas in others market and credit risks are managed at the corporate centre, with business units primarily being responsible for insurance and operational risks. Either way, a process for the allocation of EC at a more granular level is normally required.
The decision to use EC to monitor and control risk at an operational level can also have significant implications for the model design and choice of systems. EC needs to be calculated at (or allocated down to) a detailed level and needs to be calculated at a frequency appropriate to the risk being captured. For example, weekly or daily updates may be needed where EC is used to monitor asset/liability or hedging exposures, given the rapid pace of market movements and the potential changes in asset exposure. Indeed, if EC is to be used to monitor the trading
Society of Actuaries Towers Perrin | 31

activities of individual staff (including potential fraud), a link to real time asset data is likely to be needed. While this approach has been adopted in banks, it has rarely been considered appropriate within insurers.
Because of the difficulties in calculating EC at the level of granularity and at the frequency required for risk monitoring, in practice, companies have often used alternative metrics for monitoring and controlling risk, albeit with the intention that these are broadly consistent with the EC measure. Advances in modeling approaches (e.g., the use of replicating portfolio techniques) are permitting the direct use of EC as a risk measure for such purposes.
5.2.3 Performance Measurement and Management The use of EC to measure and manage performance requires a level of granularity appropriate to the performance management framework (e.g., typically by business unit) and a frequency of calculation appropriate to the pace of change in risk profile (e.g., more frequently where for market risk where rapid changes can occur). In addition, there will be a strong need to demonstrate the consistency of the EC metric across different risks and lines of business if it is to be applied uniformly in performance measurement and management.
Use of EC for this purpose requires the approach to be (or at least perceived to be) robust, objective and not open to manipulation. These requirements need to be reflected in the governance of the EC process and have resulted in some companies adopting a greater degree of central control over modeling systems and their parameterization than would otherwise be the case.
Finally, if the advantages of the use of EC in this context are to be realized, the approach must be capable of clear explanation to the individuals affected.
It should be noted that EC does not directly give a measure of performance by itself; and either needs to be combined with a related measure of return (e.g., within a RoRAC framework) or built into a value measure such as embedded value. Combining metrics in this way also raises issues of consistency⎯for example, if performance is to be assessed over one year, it can be questioned whether it is appropriate to take into account longer term risks within the EC metric to be used.
5.2.4 Risk-Based Decision Making EC is often implemented with the objective of providing management with a better informed basis from which it can make risk-based decisions, including hedging, reinsurance and mergers and acquisitions. For EC to be a useful tool in this regard, companies need to ensure it can be applied at a sufficient level of granularity and determined at a sufficient level of accuracy to be applied to the range of possible decisions with which they are, or could be, faced. For example, an approximate approach to EC that did not reflect the full detail of asset/liability mismatches would be of limited use in determining detailed asset strategy.
We have already discussed in section 3.4.1 how the two principal EC approaches incorporate in different ways the impact of management decisions over both short- and long-term time horizons. In practice, some insurers have found it useful to determine multiple EC metrics to address different time horizons for decision making.
Society of Actuaries Towers Perrin | 32

5.2.5 Risk-Based Pricing EC is often incorporated in the product pricing process so that risk and capital are charged on an economic basis, so that pricing reflects the true nature of the underlying business.
To do so requires a process for allocating EC down to the product level, including the level of diversification credit considered appropriate. It also requires the projection of the chosen (allocated) measure of EC over the term of the products being priced, allowing in a reasonable way for the changes in risk profile over that term. In practice, given the potential runtime requirements of determining projected EC measures, significant approximations have typically been made in projecting the EC metric⎯for example, by selecting appropriate “risk carriers” and assuming EC develops in proportion to these. As noted earlier, modeling developments are now reaching a stage that direct projection of EC metrics can feasibly be contemplated.
5.3 Type of Business The type and range of business and the consequent type and range of risk written by an insurer is an important factor in selecting an EC implementation approach. For many of the applications of EC referred to above, consistency across different business units, product lines and risks in the calculation of EC is essential if its use is to be effective. This applies in particular to the use of EC in performance measurement/management and product pricing but also to its use in risk monitoring, decision making and capital adequacy. In fact, one of the main benefits of an EC calculation (for capital adequacy purposes in particular)⎯the demonstration of diversification benefits⎯can be lost if inconsistent approaches are taken. For example, it is difficult to argue for diversification benefits if a one-year approach is adopted for life business and a runoff approach for P&C business. To do so would suggest that an offset between short-term losses within the life business and longer-term gains within the P&C business could be justified.
The principal EC implementation issue which tends to vary by type of business is the appropriate time horizon to use. This relates to the different pace at which different risks evolve and the timing of the management actions available to mitigate the risks. For example, the market risk exposure within the trading book of a banking operation may be most appropriately measured over a very short time horizon, reflecting the potential rapid emergence of market risks and the speed at which trading can occur to reduce or eliminate the exposure. On the other hand, longevity risk within the life insurance operation of the same company may be most appropriately measured over a longer time horizon, reflecting the pace at which developments occur in longevity risk and the options available (e.g., reinsurance, securitization, sale of book) to manage the exposure.
These differences are also reflected in the nature of the systems required to support the EC calculation. The market risk in the banking trading operation described above may well require a daily EC calculation using real time asset feeds, whereas for the longevity risk in the life insurance operation an annual detailed EC calculation may suffice, providing an approximate process is available to update it for mid-year volume and key assumption changes.
Society of Actuaries Towers Perrin | 33

The calculation of a consistent measure of EC across a diverse set of operations therefore needs to find a reasonable methodological compromise among the potentially conflicting demands and also to develop a systems infrastructure that can satisfy the needs of all the businesses. For example, where market risk is a major factor, the EC system might be developed primarily to facilitate rapid update of the EC calculation as markets move, bringing in updates to the insurance risk exposure on a less frequent basis, or when there is a major change in assumptions/parameters.
5.4 Constraints While an insurer’s objectives for calculating EC would typically determine the main factors that need to be considered when developing EC, most companies are also faced with a number of constraints that can influence in selecting an EC approach. Further discussion on aspects of these issues (e.g., budgets, timeframes, resourcing) is included in Section 7 of this report.
5.4.1 Budget Constraints Approaches to EC can vary significantly in implementation and ongoing costs (covering both human and systems resources). A company may decide to opt for a less sophisticated approach to EC if it can be implemented and maintained on a lower budget, but still allow the company to meet its high priority objectives.
Alternatively, a company faced by budget constraints may adopt a phased implementation, beginning with an approach that can be put in place fairly easily and then expanded and made increasingly more sophisticated over time.
5.4.2 Time Constraints As with budget constraints, a company faced with tight timeframes (whether imposed internally or externally), may decide to opt for an approach with a shorter expected implementation timeframe, even if this is not the approach to EC they ultimately desire. Where the time constraint only relates to the initial implementation and the objectives for this initial phase are limited, a company may adopt a phased approach, where a simpler but quicker approach to EC is adopted initially, but then developed over time to obtain an approach that satisfies the company’s long-range objectives.
Companies may also face time constraints on an ongoing basis. For example, once EC has been implemented, it may be necessary to calculate it with a fast turnaround time to support a frequent risk monitoring and control process. In this case, the company may have to settle for a relatively simpler approach to EC even if it is not theoretically the most appropriate approach for that application.
5.4.3 System Constraints While it is true that system constraints have reduced somewhat over time, increases in computing capacity and improved systems design are frequently matched by increased demands on the part of users (whether for more
Society of Actuaries Towers Perrin | 34

complex calculations or faster runtimes). Systems capabilities are therefore likely to continue to be a constraint in implementing EC.
A particular issue is the potential need to calculate a projected mark-to-market balance sheet for business with embedded optionality, either in the context of a one-year EC time horizon or as an intermediate solvency check within a runoff approach. If a stochastic approach to EC is adopted, this theoretically requires “stochastic on stochastic” modeling, which remains highly system intensive even with the latest hardware and software. As a result, companies have often implemented simpler approaches to EC, such as stress testing based approaches. These give a good indication of overall EC requirements and of the exposure to specific risk factors, although careful thought needs to be given to how the impact of the different risk drivers is aggregated (for example by the examination of combined risk scenarios). The recent application of replicating portfolio techniques to insurance business can have a significant effect in reducing the system constraints on EC implementation.
Where system constraints prevent a sophisticated but system-intensive approach to EC being run frequently, it may still be possible to benefit from this approach by calibrating a simpler EC methodology to the more sophisticated approach, say annually, and using this simpler methodology for intermediate reporting.
5.4.4 People Constraints Limited availability of skilled staff can restrict an insurer’s options when embarking on an EC implementation. This constraint may apply separately in the implementation phase and on an ongoing basis. In implementation, companies may simply find they do not have sufficiently skilled or knowledgeable staff. On an ongoing basis, the company may not be able to justify the cost of a large dedicated EC team on a full-time basis as may be required to maintain some of the more sophisticated EC approaches. In implementation, many companies make use of external consultants to provide the expertise in implementation, while at the same time training the company’s staff to manage much of the process on an ongoing basis.
Society of Actuaries Towers Perrin | 35

6. Successfully Implementing EC: Risk Representation Issues The ability to model risks accurately is integral to successful EC implementation. For each risk, this involves consideration of the nature of the risk, the data is available and how relevant this data is in estimating how the risk will emerge in the future. In practice, lack of relevant data can pose challenges and significant judgment is usually required.
6.1 Interest Rate Risk 6.1.1 Nature of Risk Fluctuations in interest rates can have potentially severe implications on the economic position of life insurers. This is especially applicable in the U.S., where a large portion of many companies’ assets are invested in fixed income securities. The EC related to interest rate risk is therefore often significant, especially for insurers writing business containing interest rate guarantees.
This mismatch of assets and liabilities is at the core of interest rate risk. The greater the level of mismatch, the more the change in market value of assets due to changes in the interest rate curve will differ from the change in market value of liabilities. The term structure of interest rates adds another level of complexity to the nature of the risk, making it more challenging to model, particularly where the influences of interest rate movements vary in impact along the curve Insurance company balance sheets, and therefore EC, can also be sensitive to changes in the level of interest rate volatilities.
Modeling interest rates can therefore be challenging. Many different interest rate models are available, each with specific strengths and weaknesses. Even when different valuation techniques can be used simultaneously, including both analytical formulas and simulations, e.g., to model the embedded options and guarantees, a consistent underlying interest model should be used.
6.1.2 Data Availability In modeling interest rate risk, one of the important decisions is which interest rate curve(s) to use. In practice, data commonly come from treasury rates, treasury strips and swap rates. The amount of historical data varies for different datasets. Considering the period over which insurers assess risk within EC models, as well as the fact that in calculating EC they need to be able to measure tail events, the data available is often insufficient, even for interest rate series with a lot of available history. For example, in order to calibrate a 99.95% tail event over a one-year risk horizon (i.e., a 1 in 2,000 year event), several thousand independent observation points would be needed, but most interest rate data series have less than 100 years’ worth of history (some with a lot less). This contrasts with the banking industry, where the risk horizons are usually much shorter (sometimes as short as a day), and so a few years’ worth of history can suffice.
Society of Actuaries Towers Perrin | 36

6.1.3 Typical Approaches to Modeling In practice, the method to assessing interest rate risk differs depending on whether a stochastic or stress test approach is being used.
With the stochastic approach, there are a number of theoretical interest rate models available, which companies can use to develop projected interest rates scenarios. Some of these can be implemented relatively easily, but this exercise can often become complex, particularly when there is a need to integrate with other risks. Thus, while some insurers develop these models and scenarios in house, most insurers opt for an external ESG. Several third parties offer proprietary software that can create sets of scenarios. Once the set of economic scenarios has been generated (which in practice may include other market risks, such as equity risk), they can then be run through cash flow-based projection model used for calculating EC. The results (e.g., market value assets minus market value liabilities) of the scenarios can be ordered and using the predefined confidence level, the level of EC for interest risk (or for several market risks in aggregation) can be determined. In following this approach, consideration needs to be given to the interaction of interest rates and other risks, for example policyholder behavior such as excessive lapses or additional premium payments.
Using the stress test approach, different interest scenarios have to be defined, where these scenarios are calibrated to the target security level. One technique to calibrate the interest rate stresses is principal component analysis (PCA), which derives a few factors, or components, that explain most of the historically observed volatility in an interest rate data series. These principal components can then be used to specify interest rate scenarios that correspond to the target security level (e.g., 99.5th percentile) on the interest rate distribution. The first three principal components are often used, which are seen to explain the historically observed interest rate “shifts” (i.e., movements up and down), “tilts” (i.e., changes in the slope of the interest rate curve) and “twists” (i.e., movements where the short end and long end of the curve move in the opposite direction to the middle range of the curve). Once the scenarios have been specified, the cash flow projection models are run under each scenario and the EC relating to interest rate risk determined from the stressed results.
6.2 Equity Risk 6.2.1 Nature of Risk Companies are subject to equity market risk not only from investments supporting the general account liabilities and surplus investments, but also from separate account products with associated guarantees and revenue streams. As with interest rates, the relative size of the risk depends on the extent to which the insurer’s assets and liabilities are matched. This link between assets and liabilities needs to be reflected in the modeling of equity risk. Unlike interest rate risk, equity risk does not have the added dimension of a term structure and so its impact on an insurer’s assets
Society of Actuaries Towers Perrin | 37

and liabilities is usually clearer to understand, which can make it easier to model. As with interest rates, results can also be sensitive to the level of equity volatility as well as expected return. For equity (and real estate) risk, less sophistication is usually required than for interest rate risk. Companies often find one asset class for equity risk is sufficient for their purposes, especially where the insurer’s exposure is limited.
6.2.2 Data Availability As with interest rate risk, considering the period over which insurers assess risk, the amount of market data available is relatively limited. Assumptions may be needed when calibrating to a higher confidence level than underlying history can account for. Data used for the level of equity risk are commonly equity indices such as the S&P 500 and the Dow Jones Industrial Average. There are a number of indices available that allow for tailoring the data to the characteristics of the asset portfolio (e.g., using indices varying by industry, company size, geography). As data for the volatility of equity, implied volatilities on equity indices or equity volatility indices like the VIX can be used. Varying volatility over the maturities generally requires more effort.
6.2.3 Typical Approaches to Modeling Typical approaches to determine EC for equity risk are a stochastic or stress test approach.
Using a stochastic approach, the parameters are usually set (explicitly or implicitly) in the ESG. The application of the scenarios is essentially the same as with interest rate risk. The required parameters and calibration are set in the ESG before the projection. Sophisticated methods may be used to capture real-market features such as the equity volatility surface, where the implied volatility of options varies based upon whether the options are deep in or deep out of the money, along with time to maturity.
Stress test scenarios can be defined using historical data such as stock indices. They could be used to take into account a certain drop in equity markets over a specified time horizon. For many companies, a single-scenario stress test based on an expected fall in equity values may be sufficient for modeling equity returns. Companies may also need to include stresses relating to equity volatility. This could be run separately, or combined with the equity level stress and run as one combined stress scenario. Depending on the characteristics of the asset portfolio and the significance of equity risk, insurers may use a set of equity stresses (e.g., using indices varying by industry, company size, geography) in an attempt to be more specific. In this case, assumptions on correlations between the different stresses will be required.
6.3 Credit Risk Credit risk relates to the possibility of loss or adverse change in the company’s financial situation due to non-fulfillment of contractual obligations by third parties.
Society of Actuaries Towers Perrin | 38

6.3.1 Nature of Risk Credit risk can be described as a main risk category with underlying sub risks. These risks include the following:
Spread risk: related to the change of spread, which in turn leads to a change in market value of the assets. This is the risk originating from financial instruments that is explained by the volatility of credit spreads over the risk-free interest rate term structure. It reflects the change in value due to a movement of the credit curve relative to the risk-free term structure.
Default risk: the risk of not receiving the principal and/or interest over outstanding loans. For an insurance company this commonly focuses on the bonds in a portfolio, but may also be applied to policyholders that do not pay their contractual premiums.
Counterparty default risk: the risk of default by counterparties to reinsurance contracts or over-the-counter risk mitigating derivative contracts.
Concentration risk: additional risk of partial or total losses of value due to large exposures to the same issuer or counterparty.
Other risk categories: migration risk, spread volatility risk and settlement risk.
6.3.2 Data Availability Sufficient and credible data is a challenge in modeling credit risk.
Where a one-year mark-to-market approach to EC is used, modeling credit risk often focuses on changes in the spread, since this tends to be the biggest driver of change in market values of a one-year time horizon. The yield-to-maturity of bonds can be separated into the risk-free rate and a spread. In the U.S., the risk-free rate is usually either taken to be the rate on U.S. treasury debt instruments or a swap rate. Credit spreads can be derived from yield curves for different credit classes and different maturities. Alternatively, indices specific to credit quality are also available.
For modeling default risk directly (which for longer-term projections is often viewed as the main driver of credit risk on corporate bonds and similar instruments), risk parameters such as probability of default, loss-given default and exposure at default are needed. A certain amount of relevant historical data is readily available (e.g., from reports published by major rating agencies), but this may be in insufficient detail to allow for modeling of credit risk at a very granular level (e.g., for each instrument explicitly). In these instances, it may be possible to acquire data (and valuation models) from third party providers. When looking at highly rated bonds (e.g., AA and AAA rated bonds), the lack of historical defaults can make the model calibration process more challenging. As with the previously discussed economic risks, lack of sufficient historical data can often be a problem. In modeling credit risk, parameters are usually linked to a credit rating. This can pose challenges where issuers of
Society of Actuaries Towers Perrin | 39
bonds or counterparties do not have a credit rating. Depending on the modeling approach adopted, input may also be required on correlations between credit exposures. Correlation assumptions generally exert a heavy influence on the resulting capital requirement.
6.3.3 Typical Approaches to Modeling Particularly for credit risk, the relevance and modeling approach of the sub risks depend on the approach to determine EC (e.g., liability runoff or one-year mark-to-market).
With the stochastic approach, using existing EV or similar cash flow-based projection models may allow for interaction with liabilities, including policyholder behavior. Assets will likely have to be aggregated to be computationally practical. ESGs can generally be set up to create the necessary economic parameters such as return, spreads or, if required, default rates. Depending on the data input, such as the correlations between the asset classes and ratings, results can vary widely.
The stress test approach is most commonly used with a one-year mark-to-market EC calculation, and so for credit risk the focus is usually on spread risk. In some respects, the analysis of credit spreads is similar to that for interest rates, but with the added dimension of differing credit qualities. Analysis could be done on calculated credit spreads or on the credit curves directly. As for interest rates, principal component analysis is one technique that can be used for this analysis to assist in the specification of the stress scenarios. Once the scenarios have been defined, the determination of EC is relatively straightforward using the economic balance sheet approach. Under this approach, companies sometimes use a load to the spread scenario as a proxy to allow implicitly for default risk and migration risk.
For default risk, a challenge for the insurer is the interaction of credit risk with liabilities. The link between assets and liabilities within credit risk is complicated to model. For products (e.g., pure term) where all credit risk resides with the insurer (i.e., the liability cash flows are not directly dependent on credit risk), the use of advanced credit risk modeling techniques using proprietary software is an option. Examples applied in the banking sector include CreditMetrics by J.P. Morgan, KMV by Moody’s and CreditRisk+ by Credit Suisse First Boston. For pure investment-type products where all credit risk resides with the policyholder, the insurer carries zero risk and so credit risk should not directly result in any requirement for the insurer to hold risk capital. However, with products in which the credit risk is shared (e.g., fixed deferred annuities), credit risk is challenging to model and the relationship between the asset and liabilities needs to be clearly specified.
A factor-based approach is generally considered too crude to base management decisions upon for the spread risk and default risk. For other sub risks such as counterparty default risk and concentration risk, a company may consider a factor-based approach, at least as a first approach. This can identify the risks that are most worth exploring toward a next level of sophistication. Counterparty default risk can also be modeled directly, in a manner similar to the modeling of default risk.
Society of Actuaries Towers Perrin | 40

6.4 Liquidity Risk 6.4.1 Nature of Risk Liquidity risk refers to the possibility that an insurer will face uncertain cash flow requirements in the future arising from its day-to-day activities. Liquidity risk takes on many forms and can arise from both the liability and asset sides of the insurer’s operations. The main drivers of liquidity risk can be internally generated (e.g., poor underwriting of insurance risk, operational risk, credit risk exposure, and difficulty in managing ALM risk), and they can be externally generated (e.g., general economic downturns, a currency crisis, a flight to quality during major political events).
Contrary to banks, insurers may have liabilities that are less sensitive to liquidity risk. The long-term nature of insurance liabilities, as well as the surrender charge structures in many product designs, combine to make life insurance liabilities less sensitive to “run on the bank” type situations. However, unlike commercial banks, which have access to central banks, insurers do not have access to lenders of last resort that can provide liquidity on short notice. This makes measuring and managing liquidity more critical to insurers. On the asset side, most insurance company portfolios tend to be very liquid in nature. However, this is not always the case.
When calculating EC, most insurers do not include an explicit allowance for liquidity risk, because they do not consider it to be that significant.
6.4.2 Data Availability Industry data and averages to use in defining parameters for liquidity risk may be available from investment bankers, regulators and rating agencies. Parameters are commonly set subjectively using expert judgment from the asset manager or actuary.
6.4.3 Typical Approaches to Modeling An extensive approach to assess this risk is through dynamic cash flow models that reflect the interaction of liquidity arising from both internal and external events that can affect the asset or the liability side of the balance sheet. The liquidity risk assessment should reflect the adverse conditions expected in extreme scenarios.
In terms of assessing this risk, institutions have traditionally relied on static factors. This approach does not recognize the dynamic nature of this risk and its interactions to other risks, in particular in times of stress, but is obviously easier to apply. Companies are also known to account for the typical liquidity risks under the operational risk.
In cases where liquidity risk is modeled explicitly, this usually includes:
Modeling a lack of counterparties and therefore a delayed closure of exposure for certain options and futures, if the market drops more than a few percent on a given day.
Explicitly modeling asset/liability mismatch risk when modeling interest rate risk.
Society of Actuaries Towers Perrin | 41

6.5 Mortality Risk 6.5.1 Nature of Risk Features of mortality risk to be considered include:
Catastrophe risk: Short-term factors such as weather conditions, natural disasters and infectious disease pandemics can cause temporarily adverse mortality experience. In practice, pandemics are likely to be the primary cause of catastrophe loss for an insurance company — e.g., the 2004 Asian tsunami killed about 300,000 people, whereas the 1918 – 1919 Spanish flu pandemic is estimated to have killed 40 – 50 million people worldwide.
Volatility risk: In the context of mortality risk there are two main sources of volatility: variations in the number of deaths and variations in the size of claims. The impact on capital due to volatility is generally significantly smaller than that due to other risks.
Mis-estimation risk (or parameter risk): This is the risk that past experience is not necessarily a good guide to future experience. This could be caused by:
⎯ Past random fluctuations, which can act in a way similar to how the average of a sample might be a poor estimate of the population mean.
⎯ Heterogeneous data, i.e., differences in the type of business written, changes in underwriting standards, different distribution channel mixes or use of an inappropriate mortality table shape.
⎯ Errors in collecting or analyzing the data, which are generally considered under operational risk.
Trend risk: This risk relates to how future experience might evolve. For example, medical advances might result in greater than expected reductions in mortality rates or, alternatively, infectious diseases (e.g., from AIDS) and the lack of cures (e.g., antibiotics becoming less effective) might result in lower than expected reductions in mortality rates and, possibly, increases in mortality rates.
6.5.2 Data Availability Literature on extreme events can be used to guide the calibration of catastrophe risk. While there is some data available about historical catastrophic mortality events, the accuracy of the data is often questionable, and deciding on the implied probability of occurrence can be subjective. For volatility risk, statistics from the insurer’s portfolio are readily available for the most part. The insurer’s mortality studies can provide a basis for calibration for mis-estimation risk. Historical population mortality statistics are readily available, which can be used in calibrating the trend risk. Since the period of mortality of insured population is usually limited, companies typically use general population statistics.
Society of Actuaries Towers Perrin | 42

6.5.3 Typical Approaches to Modeling Mortality may be modeled using stress testing or stochastic modeling.
For EC purposes, a stress testing approach is often applied. This determines EC by calculating the financial impact of a selected group of adverse mortality events (i.e., stress events). The adverse events are selected so that they target desired percentiles on the underlying mortality distributions. Depending on the relative significance of mortality risk for the insurer, one or more of the risks are sometimes combined into a single scenario. This can shorten the time taken to calculate EC, but can pose some extra challenges in the calibration.
Where stochastic models are used, they are typically run as stand-alone models, separately from the modeling of other risks. A stochastic approach requires the specification and parameterization of distributions for the different aspects of mortality risk. A fully integrated stochastic approach may also be possible, where mortality is modeled together with other risks. This has the advantage of allowing modeling for interactions between mortality and other risks, such as economic risks. However, run times are usually a limiting factor.
There are other considerations when modeling the mortality risks:
Catastrophe risk: Catastrophe risk involves modeling both the probability of a catastrophe occurring and the severity of claims. Generally, significant judgment is required. Where a one-year projection is used, this is typically included as a one-time addition to the mortality in the first year. Where a runoff projection is used, the timing of catastrophes is an extra dimension, which may be modeled using a Poisson distribution.
Volatility risk: The number of deaths will follow a binomial distribution, which could be approximated by a Poisson distribution and used to estimate random variations. The impact of random variations in case size may be assessed using the tools of risk theory, or more approximately by assuming a normal distribution (or some other standard distribution) for the distribution of the sums at risk.
Mis-estimation risk:
⎯ Past random fluctuations. This could be estimated using an approach similar to that used for volatility risk, but as parameter the number of observed deaths in the mortality study is applied.
⎯ Heterogeneous data. When setting the best estimate assumptions, the effect of heterogeneous data is minimized by grouping similar policies and having separate assumptions for these groups. Notwithstanding this, the various groups will not be totally homogeneous, and the characteristics of each group may not be known in advance. One approach is to consider the types of losses that might arise from possible pricing mistakes, such as pricing a portfolio as broker business while it was actually nearer in quality to that sold by a direct sales force.
Society of Actuaries Towers Perrin | 43

Trend risk: Historical mortality statistics can be used to estimate a distribution of mortality improvement. This distribution is applied in the EC models to project future mortality improvements.
Correlations of mortality risks are another important consideration. This includes correlation between the different mortality risk types (typically assumed uncorrelated), between the different mortality products (e.g., between life annuities and protection business), and between mortality risk and other risks such as market, operational and other underwriting risks (which may be different in tail events than in a best estimate scenario).
6.6 Morbidity Risk 6.6.1 Nature of Risk At a high level, there are a number of similarities between aspects of mortality risk and morbidity risk. However, the nature of morbidity risk can vary considerably depending on the type of product being sold. Critical illness, disability income, lump sum disability and long-term care are all morbidity risk-related products, but the impact of different risk factors could vary considerably among the different products. In addition to differences in the basic product design, disability products can be very company-specific, for example with different waiting periods, definitions of disability and exclusions.
The aspects of morbidity risk that could be considered include:
Catastrophe risk: For critical illness products, catastrophic claims experience could result from a natural or man-made disaster (e.g., a nuclear accident) resulting in a higher incidence of cancer or other critical illnesses. Similarly, a medical breakthrough that gives rise to an increased detection of covered illnesses could be seen as a catastrophic claims event. Given the high correlation normally witnessed between disability income claims and economic conditions, a depression-type scenario would be expected to lead to catastrophic claims incidence for disability income business.
Volatility risk: Depending on the type of product, there may be two or three sources of volatility for morbidity risk: variations in the number of claims; variations in the size of claims; and where relevant, variations in the duration of claims. The impact on capital due to volatility is generally significantly smaller than that due to other risks.
Mis-estimation risk (or parameter risk): This is the risk that past experience is not necessarily a good guide to future experience. As with mortality risk, this could be caused by errors in collecting or analyzing the data, past random fluctuations or heterogeneous data.
Trend risk: This risk relates to how future experience might evolve — for example, through medical advances. Trend risk would usually be expected to be a significant contributor to EC for all types of morbidity risk products, although the specific factors that give rise to the risk would likely vary by product.
Society of Actuaries Towers Perrin | 44

6.6.2 Data Availability Data availability is generally a problem when analyzing morbidity risk. Many morbidity-related products are relatively new, and there is generally not much historical data available. What data is available is often of questionable value, given changes that have taken place in the design of these products over time, often in reaction to a past adverse event.
6.6.3 Typical Approaches to Modeling As with mortality, morbidity may be modeled using a stress testing or stochastic modeling approach. For EC purposes, a stress testing approach is often applied, especially where morbidity risk is not a significant part of the insurer’s business. For specialist writers of disability products, a more advanced modeling approach may be more appropriate.
There are numerous considerations when examining the different aspects of morbidity risks:
Catastrophe risk: Catastrophe risk involves modeling both the probability of a catastrophe occurring and the severity of claims. Generally, significant judgment is required. Where a one-year projection is used, this is typically included as a one-time addition to the mortality in the first year. Where a runoff projection is used, the timing of catastrophes is an extra dimension, which may be modeled using a Poisson distribution.
Volatility risk: The number of claims will follow a binomial distribution, which could be approximated by a Poisson distribution and used to estimate random variations. The impact of random variations in case size may be assessed using the tools of risk theory, or more approximately by assuming a normal distribution (or some other standard distribution) for the distribution of the sums at risk.
Mis-estimation risk: Mis-estimation risk can be modeled in a manner similar to that for mortality mis-estimation risk, or it may be modeled together with trend risk.
Trend risk: Historical morbidity statistics (where available) can be used to estimate a distribution of possible future changes in incidence rates. Judgment is required to analyze the data and results for applicability, with possible adjustments for known changes.
Correlations of morbidity risks: Correlation between different morbidity risks (e.g., catastrophe and mis-estimation) would typically be assumed to be low, while the correlation of the same risk across products would vary depending on the type and nature of the product, but would generally be expected to be quite high. Correlation between morbidity and other risks also needs to be considered. For example, there is generally a high correlation between high disability incidence rates and adverse economic conditions.
Society of Actuaries Towers Perrin | 45

6.7 Underwriting Risk — Lapse Risk 6.7.1 Nature of Risk Typically, companies analyze persistency in terms of market and non-market linked lapses. Changes in persistency due to market-linked events are generally reflected explicitly in EC models through the use of dynamic assumptions. As such, the focus is on non-market-linked events.
The majority of persistency events that would be considered catastrophic can be seen as being tied to operational risk (e.g., major scandal at company) or market risk (e.g., a run on the bank scenario) and so these events would usually have already been considered explicitly (e.g., in operational risk EC) or implicitly (e.g., a dynamic lapse function that reflects changes in market performance).
There are several drivers of variations from non-market-related best estimate persistency assumptions, including the following:
Volatility risk. With a finite sample, random fluctuation will affect experience. For large blocks of business, this is not expected to be a significant contributor to EC.
Past random fluctuations. When these occur, they underscore how the average of a sample might be a poor estimate of the population mean. However, given the number of lapses that typically support a persistency study, the effect of past random fluctuations on estimates of future persistency is usually small.
Heterogeneous data. Examples of causes include differences in the type of business written and different distribution channel mixes. When setting the best estimate assumptions, the effect of heterogeneous data is minimized by grouping similar policies and having separate assumptions for these groups. Notwithstanding this, the various groups will not be totally homogeneous, and the characteristics of each group may not be known in advance. One approach is to consider the types of losses that might arise from possible pricing mistakes, such as pricing a portfolio as broker business while it was actually nearer in quality to that sold by a direct sales force.
Errors in collecting or analyzing the data. This would typically be provided for in operational risk.
6.7.2 Data Availability Data for the non-market lapses are product-specific and company-specific. Therefore, the use and maintenance of historical lapse experience is crucial in defining appropriate stresses. Expert opinions can be added to define the stresses. Industry averages are typically not available or applicable and may be used as benchmark.
6.7.3 Typical Approaches to Modeling Although stochastic modeling of lapses is certainly possible (and can be seen as being similar to modeling mortality stochastically), most insurers do not use this approach.
Society of Actuaries Towers Perrin | 46
Typically, a stress test approach is applied. This approach determines the EC by calculating the financial impact of selected stress events. While the inherent lapse risks can be modeled independently, the lapse stresses typically consist of one high lapse scenario and one low lapse scenario, modeled simply as a multiple of the base lapses.
6.8 Operational Risk 6.8.1 Nature of Risk Operational risk for regulatory purposes is usually defined to cover all direct and indirect losses resulting from failures in processes, human behavior, systems not limited to IT systems, and external events. For internal purposes, a broader definition can be adopted to include all risks that are not already included elsewhere and therefore include strategic, business and reputation risks as well.
Operational risk should cover both direct losses related to the actual costs in solving operational risk events, and indirect losses, including legal payments such as fines, restitution of profits and class-actions suits. Particularly in the U.S., legal claims and regulatory fines have had a huge impact on operational events in the recent past.
6.8.2 Data Availability Little typical data or industry averages are available to use in defining parameters for operational risk. Risks and parameters are very company-specific and could therefore be based on historical experience and expert opinions that should reflect the insurer’s characteristics.
Parameters on operational risks were defined in Basel II for the banking sector. With the regulatory definition of operational risk, EC for operational risk was stated to represent about 15% of total EC. Basel II further states that percentages of 12% for less risky companies and 18% for more risky companies may be appropriate.
6.8.3 Typical Approaches to Modeling More out of lack of alternative better approaches, several companies still apply the Basel II parameters to estimate EC for operational risk. More sophistication is being adopted using a number of other approaches. In practice, companies use a combination of these:
Factor-based approach. The factor-based approach estimates the operational risk exposure by applying a parameter to readily available business values. These methods are easy to implement and explain, but generally do not appropriately capture characteristics of operational risks.
Actuarial modeling approach. This category includes different mathematical approaches such as traditional actuarial models where enough data is available or methods like extreme value theory (EVT) for more catastrophic operational risks. The actuarial modeling may consist of modeling separately the frequency of loss, the severity of the loss and the recovery of the loss. Challenges include explicitly recognizing the effectiveness of controls that companies have put in place and the unavailability of operational risk data, particularly data on the tails.
Society of Actuaries Towers Perrin | 47

Scenario-based approach. The scenario-based approach has gained in popularity. It is relatively easy to develop and is based on some data and expert input. It can be applied in new processes and applied to model the tail events in the loss curve. Since it is used for the low-frequency and high-impact operational risks with large financial consequences, it tends to drive the calculation of EC for operational risk.
Causal modeling. Causal modeling drills down to the risk drivers of operational risk. It usually starts with the mapping of business processes and the related controls that may exist at each major step in an operation or a company. It usually relies heavily on the experts who manage their operations. But, instead of being done in silos, it links the different silos to form chains of events. This kind of analysis is well suited to evaluate strategic risks and process risks and also allows evaluating the costs and benefits of implementing new approaches to control operational risk.
6.9 Risk Aggregation 6.9.1 Aggregation Approaches Aggregation is the final step in calculating EC. This involves combining the EC that has been calculated separately at a certain level of detail (e.g., by risk type and/or by product or line of business) to arrive at the aggregate EC for the insurer. The most appropriate aggregation approach in a particular situation will depend on the level of detail at which the component EC has been calculated, which is very closely linked to the quantification methodology used.
The required capital for all risks together will typically be less than the sum of the required capital for each individual risk. Insurance involves diversification, spreading risks and the law of large numbers. The worst case scenario does not happen for all individual risks at the same time. Determining the aggregate EC while allowing for diversification requires assumptions to be made about the relationship between different risks for different products and lines of business.
In stochastic modeling, depending on the level of sophistication of the model, capital requirements can be directly determined for groups of risks. Under this approach, much of the aggregation by risk has already taken place within the scenario generator and is embedded within the scenarios themselves. Consequently, most aggregation reduces to a simple addition of EC by product or line of business (depending on the level of detail at which the models were run).
Under a stress testing approach, EC is calculated by risk type, so in order to arrive at an aggregate level of EC, assumptions are required about the correlations between different risks. A variance-covariance matrix (or similarly, a correlation matrix) describes the dependency among the individual risks and can be applied to the amounts determined for the individual risks. Where stress testing calculations have been done at a very granular level, the size of the variance-covariance matrix can become very large, and this can pose a challenge to parameterize.
Society of Actuaries Towers Perrin | 48

If a factor-based quantification methodology has been used, the approach to aggregation will depend on how the factors have been calibrated. It could be a simple addition, or require some explicit correlation assumptions with a similar technique as for stress testing.
6.9.2 Correlations Between Risks Significantly, irrespective of whether a stochastic or stress testing approach has been used, correlation assumptions are required. What differs is where in the process the correlations are applied and whether they are applied implicitly or explicitly.
In the determination of the correlation parameters, it is important to realize that dependencies may behave differently in extreme scenarios than scenarios that are closer to the mean of the risk distribution. For example, a small change to expected mortality is unlikely to have any strong link with the economy (and related market and credit risks), but extreme mortality events may exhibit an increased correlation with market risks.
Determining the correlation assumptions can be a subjective process. Lack of available data may make techniques for determining parameters impractical. For risks related to market risk or credit risk, it is possible to find historical data that can be analyzed and used to quantify correlations. However, even then, there may be insufficient historical data to determine the tail correlations with a large degree of confidence.
For insurance risks such as mortality or lapses, available information is generally a lot more limited. Therefore, correlations among these risks and with other risks often need to be made subjectively. In these instances, the results need to be interpreted bearing this in mind; sensitivity testing can also be important to gain comfort with the results.
A copula is a useful statistical function to model and describe such interrelationships between different risks. Copulas and correlations of risks under extreme conditions are covered in detail in SOA’s research project “Risk Based Capital Covariance Project”2. The CRO Forum that represents the major European insurers has published its collection of views on correlations in 20053.
2 The paper can be downloaded from
http://www.soa.org/research/risk-management/research-risk-based-capital-covariance-project.aspx 3 The paper “A Framework for Incorporating Diversification in the Solvency Assessment of Insurers” can be downloaded from
http://www.croforum.org/publications.ecp
Society of Actuaries Towers Perrin | 49

7. Successfully Implementing EC: Management Issues This section discusses a number of aspects that management needs to consider with an EC implementation.
7.1 Governance and Achieving Buy-In Good governance is a critical factor in determining the success of an EC implementation, both in the development phase as well as on an ongoing basis as enhancements are made. Successful EC implementation involves a significant amount of active participation and direction by senior management. With key decisions around the implementation and use of EC being driven from the top, there is ownership and buy-in of EC at the leadership level of the organization.
EC is usually viewed within the context of a broader enterprise risk management (ERM) framework — i.e., it needs to be considered as part of a company’s broader risk governance structure and not in isolation. In this context, it is used as a tool to help management make better informed decisions, by providing them with quantitative assessments of the true risks within the business. However, an EC program should go beyond a calculation process. To be considered successful, EC needs to be embedded within the organization, providing valuable information for better decision making on a consistent basis to senior executives and business managers throughout the enterprise.
On an operational level, there needs to be a clear business owner of EC, which typically falls under the responsibility of a senior executive. This role is an important strategic one and includes providing the overall strategy and guidance on use of EC within the organization. It should be viewed as distinct from the role of those that physically run the models and perform the calculations on a day-to-day basis (although the link between these two roles is very important and needs to be clearly defined).
In addition to senior level buy-in, buy-in across all levels of the organization is important. Generally, this is readily achieved with effective communication coming from the senior management or even the board of directors, where ultimate responsibility lies. Internal and external communication is integral to a successful EC implementation.
Internally, an effective top-down communication plan can help secure buy-in at all levels of the organization. The details of the communication are typically tailored to the audience and can include topics such as the rationale for the company’s decision to implement EC, the short-term and long-term plans for EC within the company, the overall EC methodology, the modeling requirements and the expected involvement from the business. Training at various levels within the organization is also considered an important aspect of internal communication. The communication of specific information, coupled with training, can be particularly important in influencing the behavior and thinking of the people in the business lines who will ultimately be responsible for making EC become part of the normal operations of the business.
Society of Actuaries Towers Perrin | 50

Bottom-up communication can also be important by giving the business managers the opportunity to react and provide feedback to the top-down EC communication from senior management. This process may include allowing those within the business to contribute to the development of the EC methodology and related decisions. In these situations, a challenge for many companies can be deciding on when to involve businesses and to what extent to involve them.
Externally, insurers’ main audiences tend to be rating agencies, regulators, shareholders and policyholders. A consideration for many insurers implementing EC is deciding on how much to disclose and when to disclose. On one hand, companies may want to reap the rewards that can come from announcements about implementing a strong EC and ERM framework (e.g., positive reaction from shareholders and rating agencies). However, there is also downside risk to making disclosures too early in the implementation process, especially with respect to disclosing information that the company is not able to defend or explain clearly. With respect to discussions with rating agencies and regulators, the timing and amount of disclosure with respect to EC can often depend on the nature and strength of the existing relationships.
Centralized Versus Decentralized
In establishing the internal infrastructure and processes for implementing EC and calculating it on an ongoing basis, a question many insurers face is to what extent the work should be maintained at the corporate level, e.g., by a dedicated ERM team, or pushed down into the business. There are certain aspects that typically remain at the centralized level such as setting out the high-level methodology; aggregating results across the businesses and reporting in a consistent manner; and determining capital allocation and the use of diversification credits.
Irrespective of long-term plans, it is natural for most EC implementations to start at the corporate level, at least conceptually. The decision to embark on an enterprise-wide EC implementation needs to be endorsed at the highest level of the firm. Nonetheless, an early consideration in making long-term plans for EC within the organization is the extent to which the company’s leaders ultimately want certain aspects of EC to be pushed down to the business versus the extent they want to maintain central management and control of the calculations. Some of the areas where control and decisions can be made centrally or at the business level include:
Overall EC methodology, including how it is defined, what the model outputs will be, how it will be used in decision making processes
Building and running of models, including decisions around what software to use
Assumptions underlying the calculations.
These decisions are obviously much more relevant for larger insurers, with business spread across multiple lines of business and geographies. In practice, this decision is often driven by the existing organizational structure and broader corporate culture within the organization.
Society of Actuaries Towers Perrin | 51

When more control is kept at the center, the business will not be as directly involved in the development or operation of the EC processes, and this in turn may make it more difficult to embed EC within the decision making processes, especially to the extent it impacts those in the business. For example, convincing the managers of a line of business to use the centrally developed EC in pricing may be a challenge if the managers and experts had limited input into its development. Another consideration is that without the benefit of the detailed knowledge at the business level, it may be difficult for the central team to model the business to a sufficient degree of accuracy and complexity. However, when much of the development and management of EC is pushed down to the business level it can also pose other challenges such as inconsistency in software and modeling, methodology and reporting.
There is definitely a fine art in creating a balance between consistency and ownership. Market best practice tends to be that it is most important to have consistent methodology and reporting across all areas of the business and so these decisions are made centrally, while detailed decisions about exactly how it will be modeled are made at the business level.
7.2 Resources Companies need to budget accordingly for the resources, both internal and external, that they expect to dedicate to EC, both in implementation and on an ongoing basis. This includes having the people with the needed talent and skills.
7.2.1 Human Resources The process of implementing EC typically involves the development and introduction of new concepts, methodologies and tools within an organization. As well as requiring specific skills, it also typically involves a significant one-off effort. Consequently, it is common for companies to recruit additional staff and/or to hire external consultants to supplement their existing capabilities by overseeing or assisting in various areas of work, from providing guidance with some of the conceptual and strategic issues around EC definition, governance and planning, to providing modeling resources to execute the required model changes.
On an ongoing basis, most companies recognize the importance of being able to run and maintain the EC models and processes internally without the need for external consultants. Nonetheless, a number of companies retain consultants on an ongoing basis to assist in a number of specific areas, such as providing an independent review of the EC methodology, assumptions, models and results. This can be particularly important where companies are disclosing EC information publicly or to external third parties, or using the information as the basis to make strategic decisions. In addition, the continuing evolution of EC best practice and the desire to improve on initial approximations in the EC calculation typically result in a significant need for ongoing development of the EC implementation over several years. Section 2.5 discusses the 2006 Tillinghast ERM survey, which found that a large majority of survey respondents (including companies that had been calculating EC for a number of years) indicated that they plan to make further improvements or enhancements to their EC calculations or frameworks. Consequently, external consultants are often retained by companies even after an initial EC implementation has
Society of Actuaries Towers Perrin | 52

been completed successfully. Similarly, external consultants can provide support to companies where internal modeling and or other resources are not available or fully trained.
7.2.2 System Resources Most companies use sophisticated financial modeling software for their EC calculations. Spreadsheet calculations are no longer adequate for efficient production and maintenance of these advanced calculations and furthermore cannot satisfy the current requirements for controls on financial processes. While a few companies have chosen to develop their own projection software, most opt for licensing third party-software.
The process of selecting a software provider should not be underestimated. While systems are mostly used for the same purposes, the differences between providers and their systems can be considerable. Several parties should be involved in the selection process, including the actuarial department, IT and financial reporting, to ensure the most suitable system is selected and to ensure high level of buy-in from key parties after the choice has been made.
7.3 Timeframes and Budgets Time and financial budgets are often the most significant constraints an insurer faces when embarking on an EC implementation. Not surprisingly, the expected time and cost of an implementation can depend on many factors, including:
Size, diversity and complexity of business
Availability of data, for example the information needed to develop assumptions about risk distributions and correlations
Nature of financial models already in existence and the amount of additional modeling required
Complexity of the proposed EC methodology being implemented
The extent to which an implementation is to be phased in over time
The extent and nature of work conducted by external consultants
How much new software or hardware is needed, which in addition to the direct costs, would necessitate further time and costs associated with setup, testing and training.
Taking these factors into account, it should not be surprising that there is a wide range of possibilities in terms of the implementation time and costs. It may be possible for a company to calculate EC within a couple of months, with relatively little investment required. By contrast, some companies’ implementations can last several years, with costs running into several million dollars.
Society of Actuaries Towers Perrin | 53

To the extent an EC implementation is viewed as a gradual process that could evolve over several years, it is not always clear at what point EC moves from being in implementation to being a process embedded and used widely within the organization. Successful EC implementations typically involve an end result in a pre-defined timeframe, and then cycle back and refine the EC calculation and analysis. When making long-term planning decisions, companies will therefore need to consider the resources they expect to dedicate to EC on an ongoing basis.
An important factor influencing expected resources and costs over the long term will be the frequency and level at which EC is used within the organization. For example, an aggregate EC calculation updated annually will require far fewer resources than when EC is used frequently in risk monitoring and control, pricing, performance measurement and other periodic activities. Additionally, many of the factors that impact the budgets in the implementation phase can also have an impact on the ongoing costs associated with having EC calculations and processes in place. Clearly, a company using a highly complex EC methodology and models can count on higher costs, both in implementation and on an ongoing basis.
7.4 Stochastic Processing Limitations The calculations required to determine EC are often demanding on processing power. This particularly applies to stochastic approaches, but even a stress-based approach can involve significant computational requirements if the business includes options and guarantees. Although major improvements have been made in recent years, projections can take hours, and occasionally days, of computation time, often using multiple processors. Memory capacities are also often at their limit due to the need to model emerging relationships between assets and liabilities. Companies are forced to find a balance between accuracy (e.g., number of scenarios, product features, level of aggregation), expenses (e.g., computation hardware, staff), and timeliness of delivery (e.g., run time, time to analyze results and present results)⎯which is particularly important for increased business utilization of the EC results.
A major driver of run time and sometimes memory utilization is the number of scenarios to be run. It is common for companies to run 1,000 scenarios. However, this selection may be based more on run time or memory considerations than on theoretical grounds. Generally, the higher the confidence level being considered, the greater the number of scenarios required to give reasonably accurate results. So, for example, when considering the 99th percentile, 1,000 scenarios may prove adequate. If considering the 99.95th percentile, 10,000 scenarios or more may be necessary. In any case, statistical estimates of the confidence interval around the results should be determined to assess their acceptability.
Potential solutions to these processing requirements include hardware upgrades, clean-up of models, improvements in model efficiency (e.g., by optimizing the order of calculation), reductions in the amount of output and grouping of policies. In addition, the incorporation of scenario selection and variance reduction techniques, often in conjunction with replication portfolio methodologies, can have a dramatic impact in reducing
Society of Actuaries Towers Perrin | 54

processing requirements. Such improvements in runtime are very important in facilitating the increased business utilization of EC in areas such as risk monitoring and control (which many companies are seeking).
7.5 Model Testing (Including Back Testing) Model testing and validation is an important part of the EC implementation process, both in the initial phase and on an ongoing basis. Companies’ EC models are often based on existing cash flow projection models used, for example, for calculating EV, and may already have been subject to testing appropriate to those purposes. Such testing would typically have been on a deterministic basis, focusing on the best estimate economic scenario and possibly also on a number of economic sensitivities. Testing of models to be used for EC purposes, however, needs to extend beyond such deterministic testing and should include detailed examination of results in the adverse tail of the distribution, which will be critical to the EC results. In particular, the validity of management actions (such as credited rate assumptions or asset strategy) and policyholder behavior assumptions should be reviewed in the context of the scenario being examined.
One particular aspect of testing often referred to in the context of EC implementation is the back testing of the models against actual historical data. This is primarily used to test the calibration of the risk factor distributions and correlation assumptions, although it can also serve as a test on other assumptions and parameters in the model.
Back testing of EC models and their calibration is performed extensively in the banking sector, particularly in the context of market risk to trading books. EC models for this business are typically set up using a daily time step and a VaR measure of say 99% over a ten-day period might be set as a starting point in determining the EC requirement, with EC typically being set at three times this ten-day 99% VaR level. Given that these models use a daily time step, there is extensive historical data available (approximately 250 trading days per year), against which to back test the model calibration. Back testing involves the application of these historical datasets of actual market movements to the model and comparing the distribution of results (particularly in the tail) with the distribution generated by the risk factors in the EC model. If the model does not replicate reasonably the historical distribution, the model and parameters would have to be examined to understand the reasons why and adjustments made if appropriate.
In the insurance industry, EC models are typically set up using an annual time step. Consequently, back testing the EC models can generally not be performed in the same way as in banking because there is insufficient historical data available. For example, testing a one-year VaR approach calibrated to a 99.5% confidence level would require several hundred years of historical data to derive meaningful back testing results. This is simply not available.
While it is not possible to back test EC models precisely, available historical data is often used to perform some level of back testing, even though this may be more of a reasonability test of the risk factor calibration. For example, if the last 50 years of experience is applied to the model and results in one or a number of losses that
Society of Actuaries Towers Perrin | 55

exceed the EC result at a 1 in 200 level, the calibration of the EC model would need to be carefully considered (although it is not necessarily incorrect as it is quite possible for a 1 in 500 year event, for example, to have occurred in the last 50 years).
In addition to the use of actual historical data, the calibration of the EC model can also be tested using plausible adverse multi-risk scenarios developed by management (potentially with external input). Once again, if these scenarios showed a loss greater than the calculated EC, the model calibration would be reconsidered. Similarly if the scenario was considered fairly extreme and showed a loss significantly lower than the calculated EC, there may also be grounds for re-examination of the calibration.
Society of Actuaries Towers Perrin | 56

8. Use of EC in Insurance Company Operations Implementation of EC will only add value if it is used effectively within the business operations of an insurer. As well as contributing to improved risk-based decision making, business utilization of EC is a requirement of rating agencies and of a number of regulatory regimes (e.g., UK ICAS and Solvency II) for recognition of the results of EC calculations in their capital adequacy assessments. The justification for such business utilization is in turn dependent on the expectation that regulators and rating agencies will in fact recognize the EC results. So obtaining maximum benefit from EC requires both internal utilization and external recognition.
The principal areas in which EC can be used within an insurance business are considered below.
8.1 Capital Adequacy Capital adequacy is the core use of EC for most insurers⎯providing a measure of capital that truly captures the risk of the insurer’s own portfolio, free from the distortions of regulatory reserving and capital requirements and the approximations within most rating agency models.
Effective use of EC in measuring capital adequacy requires the EC measure to be integrated into the capital management process, with potential EC requirements along a number of scenario paths being developed and capital funding strategies developed to address these. Strategies also need to be developed for addressing fluctuations in experience over time, which will result in variations in the difference between actual capital held and the EC requirement. Typically actual capital is targeted to remain within a band based on the EC calculation, with action being taken if EC falls outside this band⎯either to raise or refund capital or to modify the risk profile of the company to align it better with the available capital.
As noted above, acceptance of the EC calculations by regulators and rating agencies is key to achieving its business benefits, and EC now often features strongly in discussions on capital adequacy with these third parties. The EC results would usually only be presented at a high level⎯perhaps for the company overall or by major business segment⎯but there would also be a discussion of the underlying methodology, models and assumptions, with the company explaining clearly why the approach and results appropriately reflect the underlying risk profile of the company. EC also often plays a significant role in presentations to shareholders and investment analysts, typically as part of the insurer’s overall risk and financial management framework.
8.2 Risk Monitoring and Control EC is a key measure of risk from a policyholder perspective and therefore frequently features as an important component of an insurer’s risk appetite framework and in the risk measurement and monitoring processes implemented to ensure the insurer remains within that risk appetite. To do this, target ranges (including, in particular, upper limits) for EC utilization need to be established for each geography, business unit and/or risk, and actual EC monitored against these target ranges (e.g., by way of a risk dashboard). The setting of such ranges and limits needs to take into account the expected level of diversification between risks while bearing in mind the
Society of Actuaries Towers Perrin | 57

potential variation in the level of diversification over the ranges that are set. So, for example, if business unit A is exposed primarily to equity market falls and business unit B to mortality risk, a reasonable level of diversification might be allowed in setting the EC limits for the two business units. If, however, the structure of the limits and controls allows business unit B to take on equity market risk, it would be prudent to allow for a lower level of diversification in setting the limits for the two businesses.
Utilization of EC for this purpose requires an ability to update EC (and available capital) on a frequent basis to reflect the changing risk profile of the organization. This potentially implies daily updating for market risk movements, albeit with some approximation being permissible.
8.3 Performance Measurement and Management Improved performance measurement is often one of the most commonly cited reasons given by companies for wanting to calculate EC. In broad terms, a higher level of EC for one business unit compared to another signifies a higher level of risk and therefore suggests that a higher level of reward should be expected. At a more detailed level, however, insurers are exposed to risks of many types, with the balance varying significantly between business units, and it is generally accepted that the appropriate level of reward for risk varies by the nature of that risk. In particular, diversifiable risks attract lower returns than those that cannot be diversified (often referred to as systematic risks).
It is important to note that by itself, EC does not represent a measure of business performance, but rather gives a measure of the risk related to the business. In order to use EC to measure performance, it needs to be incorporated in, or combined with, some related measure of return. In practice there are two broad approaches adopted by companies when using EC in performance measurement.
One approach involves calculating a return on capital, using EC as the (risk-adjusted) capital measure in the denominator of the calculation. This is a measure of Return on Risk-Adjusted Capital (RORAC). Consideration then needs to be given to the appropriate measure of return to be used in the formula and whether this also needs to be risk adjusted (taking into account the nature of the risks in each business segment). The measure of return used will have a critical impact on the results and on the relative perception of different business units. A true economic measure of performance requires an economic return to be used. In practice non-economic measures such as GAAP earnings are sometimes used as the “return” in the formula; the potential impact this might have on results (compared to an economic return) should, however, be carefully considered before following this route.
An alternative approach to measuring performance on a risk-adjusted basis involves the inclusion of EC as the measure of required capital within a value-based measure, such as embedded value (EV). Companies calculating EV are increasingly using EC for this purpose rather than statutory or rating agency based capital (as had typically been done in the past).
Society of Actuaries Towers Perrin | 58

Historically, economic value measures like EV have not been that widely used in the U.S., with the main exception being the U.S. subsidiaries of European multinationals. With companies moving toward using EC frameworks as part of the risk and capital management process, there may be an increased use of value-based measures for performance measurement, incorporating EC as a capital measure, irrespective of the approach to EC that is selected.
The EC-based performance measures mentioned above are also starting to be used in incentive compensation schemes, although this has not been that common to date. Indeed this can in many respects be considered the critical test as to whether EC, and ERM more generally, is fully embedded within the business. Given the push from rating agencies (and regulators, in Europe at least) for such embedding of EC, it seems likely that risk-adjusted measures will increasingly become part of the incentive compensation structure of insurers.
8.4 Risk-Based Decision Making EC is frequently incorporated in key risk-based decision processes such as strategic asset allocation, more detailed asset/liability management and reinsurance strategy. The impact of such decisions on the organization’s EC requirement can be significant, and before embarking on any particular course of action its impact on EC⎯and consequently on value and performance⎯should be taken into account.
8.5 Risk-Based Pricing According to the 2006 Tillinghast Pricing Methodology Survey of 80 North American life insurers, only 10% of companies then used EC as the main driver of target surplus in pricing. However, as companies develop and become more comfortable with their EC frameworks and there is acceptance that the EC requirement will genuinely drive capital requirements, there is a natural progression for EC to be embedded in the product pricing process.
The incorporation of EC would typically involve its utilization as the capital requirement within the normal pricing processes. As noted in section 5.2.5, this requires EC to be calculated at a granular (i.e., product line) level, taking into account diversification benefits, and also to project EC requirements over the duration of the policy⎯typically requiring a number of approximations.
8.6 Business and Strategic Planning If EC is adopted as the measure of capital that the business needs to hold, it is only natural that it should be included within strategic and business planning processes. In this way the economic impact on capital requirements of alternative strategies and business plans (including alternative product mixes and volumes) can be assessed. For example, strategies involving a wide range of products or a broad geographical spread will likely give higher diversification benefits and hence lower unit capital requirements.
It should be noted, however, that overzealous pursuit of high diversification strategies may result in limited expertise being spread too thin or even result in entry to markets where the insurer has insufficient expertise. This
Society of Actuaries Towers Perrin | 59

reinforces the need to combine EC with a return or value measure in determining the optimal course of action. A clear expression of risk strategy and risk appetite is also important in guiding decisions towards those where maximum value is likely to be created.
In practice, projecting EC requirements, particularly for a large number of strategic or business plan options, can be demanding on system resources unless systems are designed specifically for the purpose. Consequently most insurers project EC only on an approximate basis for these purposes.
8.7 Mergers and Acquisitions For a buyer that manages its capital on an economic basis, EC will play an important role in the merger and acquisition process. The buyer will need to consider the EC requirements of the target company and the result of aggregating these with its own EC requirements, taking into account diversification where appropriate. This could occur, for example, when a company with high mortality risk and low credit risk acquires a company with low mortality risk and high credit risk. There can also be EC offsets when combining different aspects of the same risk. For example, a company with high mortality risk in a large block of term business may partially offset this exposure by acquiring a large writer of group payout annuity business.
To set against these diversification benefits on acquisitions is the potential need to provide an increased level of capital in relation to the target if its existing capitalization is below the level of the buyer’s EC requirement. This may be simply because the target is poorly capitalized, but may alternatively be the result of the buyer setting a higher security level than that set by its target. So, for example, a AA rated buyer may well have to provide additional capital to bring a BBB target up to its own security level.
Of course, diversification also works in the opposite direction⎯EC requirements for retained business will typically increase when part of the business is sold.
Society of Actuaries Towers Perrin | 60