Embed Size (px)
Citation preview
Report to:
New Zealand Wind Energy Association
ECONOMIC BENEFITS OF WIND FARMS IN NEW ZEALAND
Final report
Prepared by
Jason Leung-Wai
Amapola Generosa
June 2012
Copyright© BERL
BERL ref #5157
JEL Classification:
Final report
2 Economic Benefits of Wind Farms in New Zealand New Zealand Wind Energy Association
June 2012
Economic benefits of wind farms in New Zealand
1 Summary .......................................................................................... 4
2 Introduction .................................................................................... 10
2.1 Methodology .......................................................................................... 10
2.1 Format of the report ............................................................................... 12
3 Electricity supply and forecasts ................................................... 13
3.1 New Zealand Energy Outlook, 2011 ..................................................... 13
3.2 Wind Energy Association growth target ................................................ 14
4 Analysis .......................................................................................... 15
4.1 Local and overseas studies ................................................................... 15
4.2 Survey ................................................................................................... 18
4.3 Case studies .......................................................................................... 18
4.4 Summary ............................................................................................... 18
5 The wind energy industry in New Zealand ................................... 20
5.1 Composition ........................................................................................... 20
5.2 Current size ........................................................................................... 22
6 Economic benefits ......................................................................... 23
6.1 Approach ............................................................................................... 23
6.2 Economic benefits of activities between 2010 and 2011 ...................... 24
6.3 Economic benefits of a steady output growth to 2030 .......................... 25
6.4 Other benefits ........................................................................................ 26
6.5 Comparison within the Energy sector.................................................... 29
7 Conclusion ..................................................................................... 30
8 Appendices .................................................................................... 32
8.1 Data collection ....................................................................................... 32
8.2 Data analysis ......................................................................................... 32
8.3 List of companies in the New Zealand wind energy industry ................ 34
9 References ..................................................................................... 35

Final report
3 Economic Benefits of Wind Farms in New Zealand New Zealand Wind Energy Association
June 2012
Tables
Table 1.1 FTEs per MW, NZWEA-BERL survey ............................................................... 5
Table 1.2 Economic contribution of wind energy industry, 2010-2011 .............................. 5
Table 1.3 Economic contribution of 3,500MW of installed wind capacity by 2030 ............ 6
Table 4.1 Estimated employment per megawatt, renewable and fossil power plants ..... 17
Table 4.2 FTEs per MW, BERL-NZWEA survey ............................................................. 18
Table 4.3 Comparison of employment per megawatt ..................................................... 19
Table 5.1 Type of companies in the New Zealand wind energy industry ........................ 21
Table 6.1 Summary of economic benefits, 2011 ............................................................. 24
Table 6.2 Contribution to national GDP ($2011m) by 2030 ............................................ 26
Table 6.3 Skill and qualification required to support growth of the wind energy industry 29
Table 6.4 Comparison within the Energy sector ............................................................. 29
Table 7.1 Summary of economic benefits of a 3,500MW generation ............................. 30
Table 8.1 FTE per MW by phase, New Zealand, 2010 to 2011 ...................................... 33
Table 8.2 List of companies included in the analysis ...................................................... 34
Figures
Figure 1.1 Estimated total employment (FTEs) benefit, 2011 ........................................... 5
Figure 1.2 Estimated total GDP benefit ($2011m), 2011 .................................................. 6
Figure 1.3 Estimated total employment benefit, 2012 to 2030 .......................................... 7
Figure 1.4 Estimated total employment benefit, 2030 ....................................................... 7
Figure 1.5 Estimated total GDP benefit ($2011m), 2030 .................................................. 8
Figure 2.1 Companies’ primary involvement in the wind energy industry, 2011 ............. 11
Figure 3.1 Electricity supply by renewable and non-renewable, 1990 to 2030 ............... 13
Figure 3.2 Supply of electricity from wind, 1990 to 2030, MED and NZ forecasts .......... 14
Figure 5.1 Composition of the New Zealand wind energy industry, 2011 ....................... 21
Figure 5.2 Composition of the direct employment in the wind energy industry, 2011 ..... 22
Figure 6.1 Estimated total employment benefit by phase, 2011 ..................................... 24
Figure 6.2 Estimated total employment benefit by phase, 2012 to 2030 ........................ 25
Figure 6.3 Opportunities from the expansion of the wind energy industry ...................... 28
Final report
4 Economic Benefits of Wind Farms in New Zealand New Zealand Wind Energy Association
June 2012
1 Summary
Wind is a growing contributor to New Zealand’s energy supply mix. Wind energy generation has
increased from 138GWh in 2001 to 1,930GWh in 2011, an annual increase of 28 percent. In total,
wind energy’s contribution to electricity supply in New Zealand was nearly five percent in 20111. This
proportion is expected to grow in the future.
The wind energy industry provides a renewable electricity source that complements the existing mix of
hydro and geothermal generation. The wind energy industry also contributes to the regional and
national economies in relation to economic activity.
This report has been prepared by BERL for the New Zealand Wind Energy Association (NZWEA) to
determine the wind energy industry’s economic contribution to New Zealand. It applies an
internationally accepted method to determine the economic value of a megawatt (MW) of installed wind
generation capacity with respect to employment and GDP.
What the industry looks like
As of the end of 2011, there are 16 operating wind farms, with a combined capacity of about 623MW
throughout New Zealand. These wind farms are operated by companies like Meridian Energy,
Trustpower Limited, and NZ Windfarms2. Most of the current generation is in the Wairarapa-Manawatu
and Wellington regions.
The New Zealand wind energy industry is composed of diverse businesses. Some offer highly
specialised services and others provide general services to support wind farms. This report has
identified about 100 businesses associated with activities during the planning and project development,
construction and installation, and operation and maintenance (O&M) phases of wind farm activity.
Most of these businesses are privately owned. They are engaged across areas such as consulting and
engineering services, construction and installation, and wind energy facility development. As a result,
people working in the industry are diverse, with a varied mix of skills and expertise.
Economic benefits
Current - 2010-2011
The survey undertaken as part of this project shows that in terms of Full-Time Equivalents (FTEs) per
MW of installed capacity, most employment is generated in the construction and installation phase
(1.79 FTEs per MW). This compares to 0.81 FTEs per MW in the planning and project development
phase.
1 The percent contribution of wind energy to total annual electricity generation in New Zealand is based on Ministry
of Economic Development data.
2 The other operators of wind farms in New Zealand are Genesis Energy, Energy
3 and Pioneer Generation.
Final report
5 Economic Benefits of Wind Farms in New Zealand New Zealand Wind Energy Association
June 2012
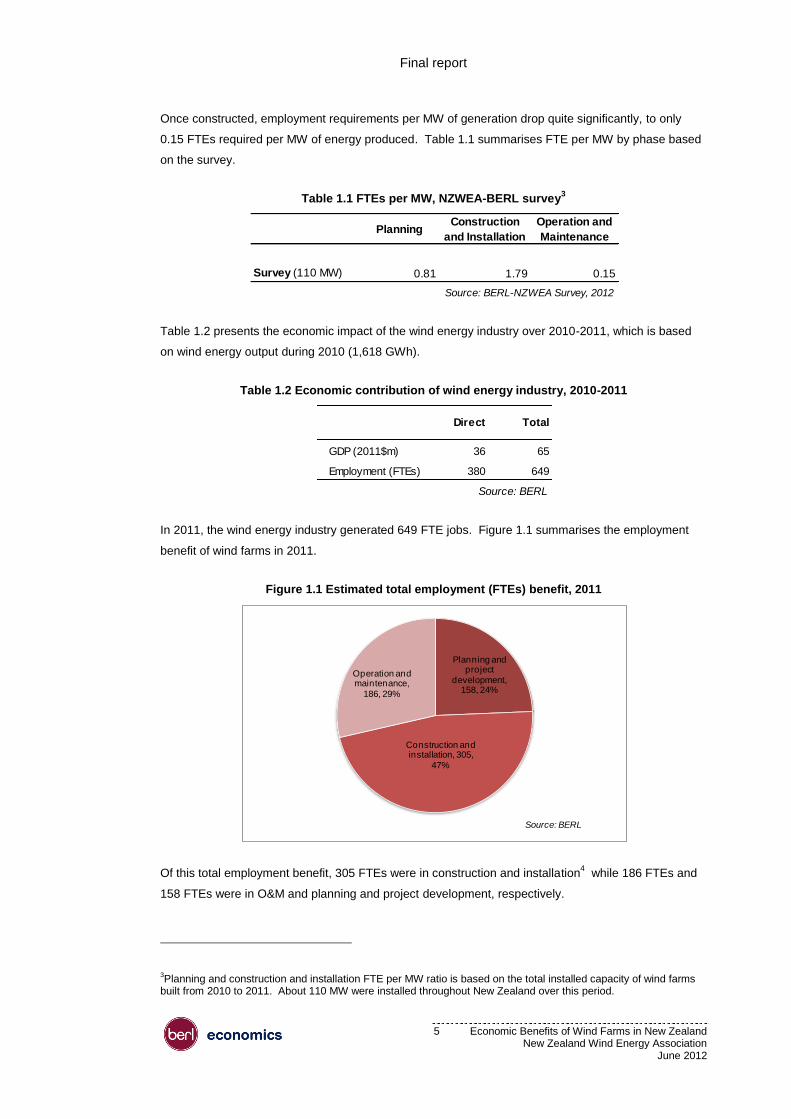
Once constructed, employment requirements per MW of generation drop quite significantly, to only
0.15 FTEs required per MW of energy produced. Table 1.1 summarises FTE per MW by phase based
on the survey.
Table 1.1 FTEs per MW, NZWEA-BERL survey3
Table 1.2 presents the economic impact of the wind energy industry over 2010-2011, which is based
on wind energy output during 2010 (1,618 GWh).
Table 1.2 Economic contribution of wind energy industry, 2010-2011
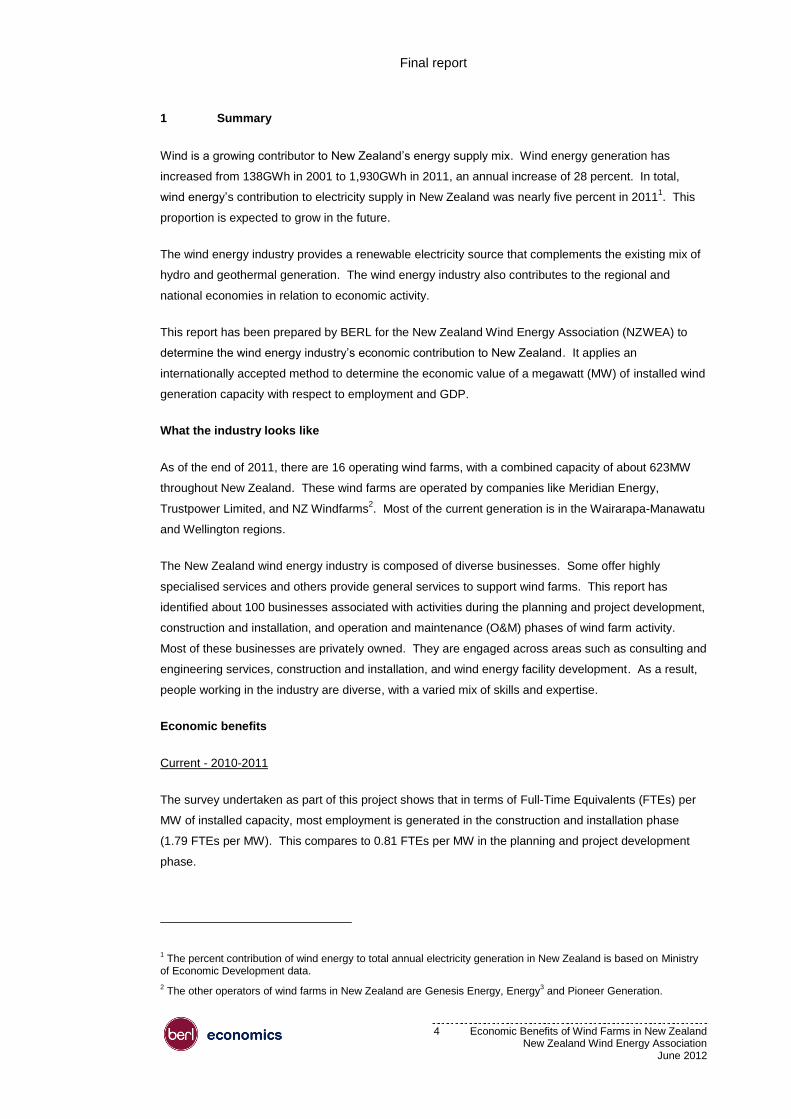
In 2011, the wind energy industry generated 649 FTE jobs. Figure 1.1 summarises the employment
benefit of wind farms in 2011.
Figure 1.1 Estimated total employment (FTEs) benefit, 2011
Of this total employment benefit, 305 FTEs were in construction and installation4 while 186 FTEs and
158 FTEs were in O&M and planning and project development, respectively.
3Planning and construction and installation FTE per MW ratio is based on the total installed capacity of wind farms
built from 2010 to 2011. About 110 MW were installed throughout New Zealand over this period.
PlanningConstruction
and Installation
Operation and
Maintenance
Survey (110 MW) 0.81 1.79 0.15
Source: BERL-NZWEA Survey, 2012
Direct Total
GDP (2011$m) 36 65
Employment (FTEs) 380 649
Source: BERL
Planning and project
development, 158, 24%
Construction and installation, 305,
47%
Operation and maintenance,
186, 29%
Source: BERL

Final report
6 Economic Benefits of Wind Farms in New Zealand New Zealand Wind Energy Association
June 2012
The wind energy industry contributed $65 million to GDP. Figure 1.2 summarises the GDP benefit of
the wind energy industry in 2011.
Figure 1.2 Estimated total GDP benefit ($2011m), 2011
In terms of GDP, the wind energy industry contributes about $65 million to the national economy. Of
this, $28 million is from construction and installation activity, while $22 million and $15 million are from
O&M activities and planning and project development of wind farms built from 2010 to 2011,
respectively.
2030 scenario
A larger wind energy industry in New Zealand will result in bigger economic benefits in terms of GDP
and employment. Under a scenario where there is 3,500MW of installed wind capacity throughout New
Zealand in 2030, the employment and GDP generated by the wind energy industry is likely to double.
Table 1.3 summarises the economic benefits of the wind energy industry under a 3,500MW scenario.
Table 1.3 Economic contribution of 3,500MW of installed wind capacity by 2030
Overall, the total economic benefit associated with 3,500 MW of wind capacity will be about 1,400
FTEs and about $156 million in GDP by 2030. The key sectors that are likely to benefit from the wind
energy industry’s expansion are those businesses that are involved along the lifetime of wind farms.
These include those in wind farm development, consulting services, finance and other business
services, retail trade, component manufacturing, industrial goods distribution, and construction.
4 The combined installed capacity of wind farms completed between 2010 and 2011 is about 110 MW.
Planning and project
development, 15, 23%
Construction and installation, 28,
43%
Operation and maintenance, 22,
34%
Source: BERL
Direct Total
GDP ($2011m) 81 156
Employment (FTEs) 764 1,430
Source: BERL

Final report
7 Economic Benefits of Wind Farms in New Zealand New Zealand Wind Energy Association
June 2012
Much of the growth in employment will be in the O&M workforce as there will be a larger number of
wind farms to manage.
Figure 1.3 shows the total employment benefit under a scenario where the industry grows by 150MW
each year from 2012 to 2030, broken down by phase of development.
Figure 1.3 Estimated total employment benefit, 2012 to 2030
By 2030, the potential total employment benefit of the wind energy industry is about 1,400 FTEs.
Figure 1.4 shows the breakdown of the potential employment impact of the wind energy industry by
2030.
Figure 1.4 Estimated total employment benefit, 2030
The industry will create about 930 full-time equivalent O&M related jobs. From 29 percent of total
employment benefit in 2011, O&M related employment would make up 65 percent of the total full-time
equivalent jobs in the wind energy industry in 2030.
0
200
400
600
800
1,000
1,200
1,400
1,600
Nu
mb
er
of
FTEs
Planning and project development Construction and installation O & M
Source: BERL
Planning and project
development, 140, 10%
Constructionand installation,
359, 24%Operation and maintenance,
930, 65%
Source: BERL

Final report
8 Economic Benefits of Wind Farms in New Zealand New Zealand Wind Energy Association
June 2012
In terms of GDP benefits, the wind energy industry’s total contribution to national GDP increases from
$65 million in 2011 to $156 million in 2030.5 Figure 1.5 summarises the GDP benefit of wind energy
industry in 2011.
Figure 1.5 Estimated total GDP benefit ($2011m), 2030
The leading contributor to this gain in national GDP will be related to O&M activities. From about $22
million in 2011, the potential contribution to GDP of O&M related activities increases to about $110
million.
This is a very conservative estimate, where we have assumed that the ratio of employment to activity
remains constant over time. In reality, we would expect an increasing ratio of employment to activity.
This is because, as the industry develops, capability and expertise increases. This means that a
greater proportion of the activity can be done within New Zealand.
To illustrate this, an analogy can be drawn with the oil and gas exploration industry in New Zealand. In
the early phases of oil and gas exploration in New Zealand, most expertise and equipment in
constructing oil platforms and pipelines was imported into the country. New Zealand did not have the
capability, expertise, or reputation to undertake this work. New Zealand company activity was limited
to site preparation, support services and general contracting.
As the industry developed, local contractors, such as Fitzroy Engineering, became increasingly active
in the sector – first providing maintenance and then progressing to engineering components. A similar
pattern occurred with other New Zealand businesses, especially as the industry was concentrated in
the Taranaki region. Now, the local content in the construction phases of oil and gas exploration and
extraction is significantly higher than what it was when the industry was in its infancy. We would
expect a similar pattern to occur in the wind energy industry.
5
Planning and project
development, 13, 9%
Construction and installation,
33, 21%
Operation and maintenance, 110,
70%
Source: BERL

Final report
9 Economic Benefits of Wind Farms in New Zealand New Zealand Wind Energy Association
June 2012
Comparison to other sectors
The wind energy industry in 2011 was a relatively small industry. However, by 2030, the wind energy
industry is expected to be a relatively mature industry, generating employment and GDP on a par with
other mature industries in New Zealand such as the oil and gas exploration and extraction sector, or
aquaculture.
In terms of employment, the wind energy industry in 2030, with 764 FTEs, will be similar in size to the
hydro-electricity generation industry (771 FTEs), oil and gas extraction (592 FTEs), and gas supply
(540 FTEs).
In terms of GDP, the wind energy industry in 2030 will be comparable in economic activity to metal ore
mining ($84 million) and aquaculture ($93 million).
The report uses a conservative approach that is based on multiplying existing employment by the
amount of windfarms that will be developed (linear growth). It is likely that as the wind energy industry
grows, New Zealand companies will start to develop within and around the industry.
Over time, New Zealand companies will provide services that are currently provided overseas. This
pattern of growing local content occurred in the oil and gas exploration industries and there is no
reason to assume that it won’t happen in the wind industry. The methodology used in this report has
not allowed for this “home grown” effect. Therefore, the report is likely to underestimate employment
figures associated with 3,500 MW of wind generation.

Final report
10 Economic Benefits of Wind Farms in New Zealand New Zealand Wind Energy Association
June 2012
2 Introduction
The wind energy industry is well established internationally with an installed capacity of over
230,000MW at the end of 2011. In New Zealand, it is a small but growing contributor to the supply of
electricity. Over the past decade, the wind energy industry’s contribution to electricity supply has been
increasing.
This report presents the economic benefits of wind farms in New Zealand in terms of employment and
GDP. The report identifies the economic impact in the 2011 year. It then uses an FTE per MW ratio to
identify the economic impact in a scenario where the wind energy industry expands to an installed
capacity of 3,500MW by 2030. The report also looks at the additional benefits of wind farms and the
type of employment generated within the industry.
The report draws mainly from the responses received from companies that completed a questionnaire
and participated in a phone survey, consultation with key stakeholders in the wind energy industry, and
publicly available information from NZWEA member companies.
2.1 Methodology
The approach is based on identifying the ratio of employment to installed generation capacity, or an
FTE per MW ratio, for the key activity areas of wind energy generation. This ratio is then used to
determine total employment directly related to levels of wind generation activity. Input output analysis
is applied to estimate GDP contribution from employment ratios. Multipliers are then used to determine
indirect and induced effects of that direct employment and GDP. Throughout this report, all GDP
figures are expressed in inflation-adjusted (i.e. constant price) 2011$ values.
The FTE per MW ratio is identified through three approaches. The first is a literature review of
economic impacts, which provides a method and comparators to review the survey findings. The
second is a survey of New Zealand Wind Energy Association (NZWEA) members and non-NZWEA
member suppliers to identify their employment related to wind generation. The third uses case studies
of two recent New Zealand wind farms to estimate the level of employment generated.
The literature review of New Zealand wind farm economic impacts and international studies on
economic contributions provide an initial framework and a set of ratios used to check the validity of the
New Zealand calculations.
From the survey and New Zealand case studies, high and low ratios across three distinct phases of
wind farm activity were identified:
1. planning and project management
2. construction and installation
3. O&M.
The forecast growth scenario to 2030 is 3,500MW. Steady output growth of 150MW per year is
assumed.

Final report
11 Economic Benefits of Wind Farms in New Zealand New Zealand Wind Energy Association
June 2012
The BERL-NZWEA Survey
BERL, along with NZWEA, surveyed companies involved in activities related to the project
development, construction and installation, and O&M of wind farms.
The survey, both by phone and questionnaire, covered three main areas. First, a description of the
company’s main activities related to the wind energy industry. When possible, companies were asked
what proportion of their total activities directly relates to the wind energy industry. Second, they were
asked for the number of FTEs related to the planning and project development, construction and
installation, and O&M phases of wind farms from 2010 to 2011. Finally, the survey asked participants
about the role of wind farms in the growth of local and national businesses.
The survey included NZWEA member and non-NZWEA member companies that maintain offices in
New Zealand. The questionnaire was sent to 30 NZWEA members and 10 non-NZWEA members.
The survey was augmented with a quick phone survey to non-respondents, and a review of available
annual reports. Overall, 42 companies were covered in the analysis. Of this number, 11 companies
completed the questionnaire, 18 companies participated in the phone survey while employment
information on the remaining 13 companies6 were from annual reports and company websites.
Figure 2.1 shows the type of companies included in the analysis.
Figure 2.1 Companies’ primary involvement in the wind energy industry, 20117
Most companies operate in one of three activity areas: consulting/engineering, wind farm developers,
construction and installation. The consulting/engineering services (12 out of 42 companies) activity
area had the largest number of businesses associated with the wind energy industry. These
companies provide engineering, environmental, and legal services during the planning and project
development phase of a wind farm.
6 For this group of companies, we assume that about one percent of their total employment is related to wind energy
activities. This proportion is based on the report of companies that participated in the phone/questionnaire survey. The respondents estimate that about a percent of their total employment is associated with activities in the wind energy industry.
7 The categories are not mutually exclusive. Some companies are manufacturers and provide operation and
maintenance services to the wind farms.
Developers19%
Manufacturers9%
Consulting/Engineering
29%
Construction & installation
17%
Operation & maintenance
9%
Utility10%
Others7%
Source: BERL
Final report
12 Economic Benefits of Wind Farms in New Zealand New Zealand Wind Energy Association
June 2012
Nineteen percent (eight companies) are mainly engaged in wind farm development while 17 percent
(seven companies) are involved during the construction and installation phase. It should be noted that
this profile of companies in the wind energy industry does not include suppliers who did not respond to
the survey or who were not surveyed.
Case studies
BERL undertook case studies to determine the economic activity for two specific wind farm
developments. The first case study was of West Wind, which is operated by Meridian Energy, has an
installed capacity of about 143MW. The second was Vestas, which maintains four wind farms:
Tararua, Te Apiti, White Hill, and Mahinerangi. The combined capacity of these wind farms is about
346MW, which is more than half of the current total installed capacity of wind farms in New Zealand.
BERL referred to the West Wind project for FTE jobs related to the construction and installation of wind
farms. The Vestas case study is used to crosscheck FTEs related to O&M against the survey of
companies associated with the wind energy industry.
2.1 Format of the report
Section 3 describes the context of the current analysis. The section describes electricity supply and
forecasts, both of renewable and non-renewable generation. It also highlights electricity generation
from wind.
Section 4 presents key findings from economic impact analyses of wind farms and the wind industry
completed in New Zealand and overseas. The current study used the key findings from those studies
as a benchmark for employment per unit of installed wind energy capacity. The section also discusses
the methodology.
Section 5 summarises key findings from a survey of businesses involved in wind farm related activities.
Section 6 presents the economic benefits of wind farms in New Zealand. The section highlights the
economic impact, in terms of GDP and employment, of 3,500MW of wind capacity in New Zealand.
Section 6 also identifies other benefits from wind farms.
Conclusions of the economic impact analysis are presented in Section 7.
Final report
13 Economic Benefits of Wind Farms in New Zealand New Zealand Wind Energy Association
June 2012
3 Electricity supply and forecasts
This section outlines the case for the NZWEA forecast of wind energy supply.
3.1 New Zealand Energy Outlook, 2011
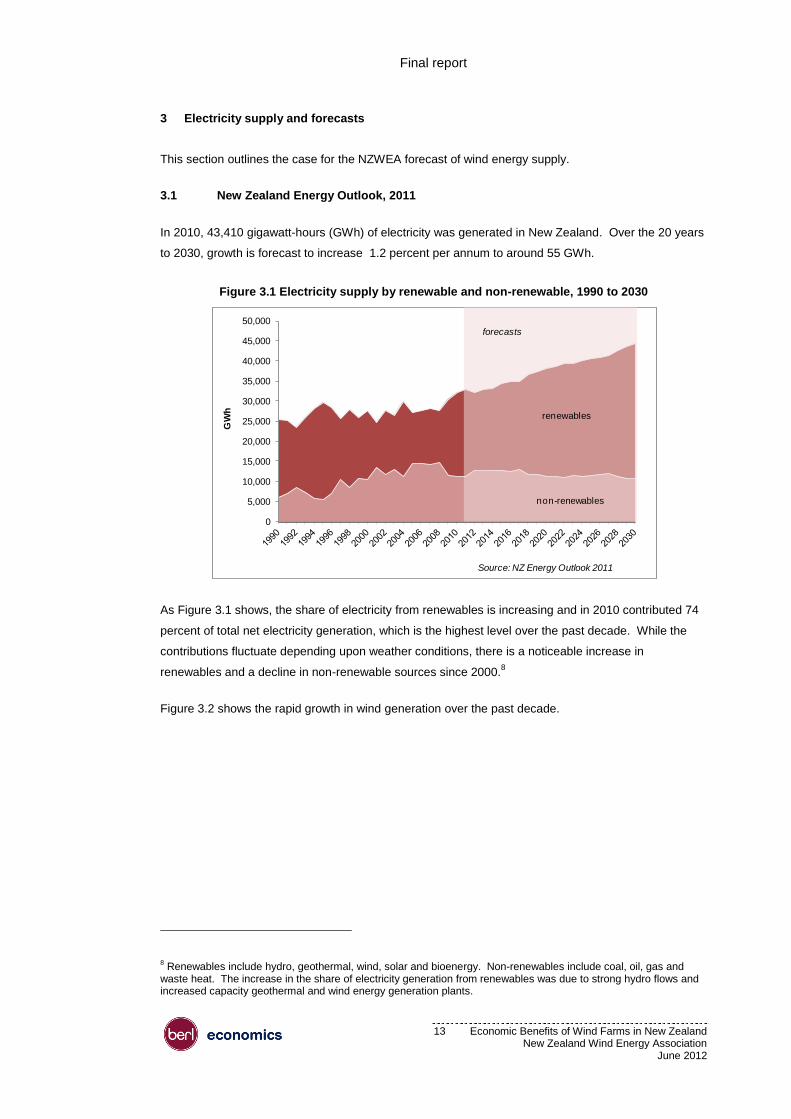
In 2010, 43,410 gigawatt-hours (GWh) of electricity was generated in New Zealand. Over the 20 years
to 2030, growth is forecast to increase 1.2 percent per annum to around 55 GWh.
Figure 3.1 Electricity supply by renewable and non-renewable, 1990 to 2030
As Figure 3.1 shows, the share of electricity from renewables is increasing and in 2010 contributed 74
percent of total net electricity generation, which is the highest level over the past decade. While the
contributions fluctuate depending upon weather conditions, there is a noticeable increase in
renewables and a decline in non-renewable sources since 2000.8
Figure 3.2 shows the rapid growth in wind generation over the past decade.
8 Renewables include hydro, geothermal, wind, solar and bioenergy. Non-renewables include coal, oil, gas and
waste heat. The increase in the share of electricity generation from renewables was due to strong hydro flows and increased capacity geothermal and wind energy generation plants.
0
5,000
10,000
15,000
20,000
25,000
30,000
35,000
40,000
45,000
50,000
GW
h
renewables
non-renewables
forecasts
Source: NZ Energy Outlook 2011

Final report
14 Economic Benefits of Wind Farms in New Zealand New Zealand Wind Energy Association
June 2012
Figure 3.2 Supply of electricity from wind, 1990 to 2030, MED and NZ forecasts
In 2010, wind energy supplied 1,618 GWh of electricity. This is five percent of the total 32,211 GWh of
electricity supply from renewable sources in that year.9 Wind generation has increased at 28 percent
per annum since 2001. However, looking forward to 2030, the New Zealand Energy Outlook 2011
scenario has wind energy contributing 4,361 GWh, an annual growth rate of only 5.1 percent.
3.2 Wind Energy Association growth target
The current growth (last 10 years) in wind generation is significantly higher than the forecast growth by
the Ministry of Economic Development (MED). The difference between the MED modelling and actual
growth led the wind industry, through NZWEA, to identify a plausible scenario for industry growth out to
2030. The New Zealand wind industry expects installed capacity to grow by an average of 150MW per
year, increasing to 3,500MW by 2030. This capacity would be sufficient to generate an estimated
12,700 GWh, or 20 percent of New Zealand’s annual electricity demand in 2030.
The industry is well positioned to meet this potential as wind energy is becoming economic with
improvements in technology and as the price of energy increases. Wind energy will become an
important part of the current mix of renewable and non-renewable energy sources.
9 This includes electricity from hydro (24,470 GWh), geothermal (5,551 GWh), wind (1,618 GWh), wood (346 GWh)
and biogas (226 GWh). Electricity generated from wind is 3.7 percent of the total generation (renewable and non-renewable) in 2010.
0
2,000
4,000
6,000
8,000
10,000
12,000
14,000
GW
h
forecasts
Source: NZ Energy Outlook 2011
NZWEA
MED

Final report
15 Economic Benefits of Wind Farms in New Zealand New Zealand Wind Energy Association
June 2012
4 Analysis
This section identifies the FTE per MW ratio used to determine direct employment over the three
phases of a life of a wind farm in New Zealand. The analysis covers a scan of local and overseas
studies of the economic benefits of wind farms; the findings of the BERL-NZWEA survey; employment
required during the construction and installation stage of the West Wind wind farm; and the number of
full-time jobs Vestas employs for O&M activities.
4.1 Local and overseas studies
This section summarises the economic benefits of wind farms and the wind energy industry from
analyses completed in New Zealand and overseas. The FTE per MW identified from these studies are
used to benchmark findings from the New Zealand analysis.
4.1.1 Local studies
Turitea Wind Farm
A 2008 analysis by New Zealand Institute of Economic Research (NZIER, 2008) of the economic
impact of the construction of Turitea Wind Farm in Palmerston North suggests that the direct spend of
constructing a wind farm with an installed capacity of 300MW to 360MW is between $750 million to
$900 million. Of this total construction expenditure, about 20 percent or approximately $150 million to
$180 million is spent in the local economy. The construction of the wind farm is likely to employ about
100 FTEs on site. The study also reports that the direct impact during the O&M phase is between $0.8
to $1.2 million per year and a further 10 to 15 FTEs in terms of local employment (depending on the
final size of the wind farm).
West Wind
Based on an interview conducted for the current study, West Wind, with a total installed capacity of
about 143MW, required about 150 FTEs during the construction and installation phase. Most people
employed were from the Greater Wellington and Manawatu-Wairarapa regions.
Castle Hill Wind Farm
A BERL report in relation to the Castle Hill Wind Farm project suggests that a wind farm with a
generation capacity of up to 860MW could directly create 147 FTEs, $51.3 million in expenditure and
contribute $15.6 million during its construction phase over the first five years.10
The study cites that the
construction phase is estimated to have a total cost of $1.7 billion over the five years, of which $246
million will be spent in the development area (Masterton-Tararua Districts). During the operational
phase, Castle Hill Wind Farm is expected to generate $9.4 million in expenditure, $3.9 million in GDP
and 37 FTEs in local employment.
10 BERL (2011). The wind farm will be constructed in stages, with any first stage in the order of 300 MW installed
capacity.

Final report
16 Economic Benefits of Wind Farms in New Zealand New Zealand Wind Energy Association
June 2012
4.1.2 Overseas studies
Studies completed in Canada, the United States, and Europe show that the wind energy industry
contributes significantly to local and national employment.
Europe
A study completed by the European Wind Energy Association (EWEA, 2009), shows that the wind
energy sector directly employed 108,600 people in the European Union (EU). Of this direct
employment, 59 percent are in the wind turbine and component manufacturing industries. Including
indirect11
employment, the sector employed 154,000 people throughout the EU in 2007. Turbine and
component manufacturing account for the largest share of wind energy industry’s employment in
Europe.
Other key areas of employment are wind farm development (16 percent), and installation and O&M (11
percent). Utilities and power providers support an extra 9 percent, while consultants, and research and
development make up three percent and one percent, respectively.
The study also reports that countries with developed industries like Denmark, Germany and Spain, who
are exporting technologies, turbines, and other components, are likely to experience the highest
benefits in terms of employment in the future.
United States
A 2008 study in the US suggests that every 100MW of installed wind power capacity provides 310
FTEs in the manufacturing sector, 67 contracting and installation jobs, and 9.5 FTEs in O&M every
year.12
According to the American Wind Energy Association (AWEA), increasing the nation’s total wind power
generating capacity by 50 percent in 2008 has increased total employment in the sector in the US to
85,000 from 50,000 in 2007. The share of domestically manufactured wind turbine components has
also grown from under 30 percent in 2005 to about 50 percent in 2008 due to new facilities opened
from 2007 to 2008. Of the 85,000 jobs in the sector, AWEA estimates that about 8,000 of these are
construction jobs. Other jobs include those in turbine component manufacturing, construction and
installation of wind turbines, O&M, and legal and marketing services.
Another study by the American Solar Energy Society and Management Information Services, Inc.,
published at the end of 2008, looked at the typical employee profile of a 250-person wind turbine
manufacturing company and identified 126 occupations. The study suggests that the workforce within
the wind energy industry is varied and diverse.
11 Those employed indirectly as component manufacturers, consultants, legal professionals, financial services
providers and so on.
12 Methipara, J., Sauer, A., Elles, C., and Beck, F. (2009).

Final report
17 Economic Benefits of Wind Farms in New Zealand New Zealand Wind Energy Association
June 2012
Canada
A 2006 survey of businesses associated with the wind energy industry estimated that the wind energy
industry directly employed 1,200 FTEs in 200613
. Of this employment, about 70 percent were in non-
support functions including managers, consultants, engineers and scientists, and trades people.
Support staff (including labourers and assistants) contributed a further 360 FTEs.
Including indirect employment, total employment in the Canadian wind energy industry was estimated
at 2,280 FTEs. This employment was expected to grow to 5,300 FTEs by 2011. Employment among
trades people and labourers was expected to increase from 270 FTEs in 2006 to 1,800 FTEs by 2011.
In 2010, wind farms in Canada had an installed capacity of 3,400MW.
Other international comparisons
In terms of the average employment over the life of an energy facility, wind power generates more jobs
per MW during the manufacturing, construction and installation phase than biomass, coal-fired and
natural gas facilities. This suggests that wind farms can potentially generate more employment than
coal and gas plants during the construction and installation phase.
The FTE per MW ratios in Table 4.1 imply that most employment in the wind energy industry and in the
other renewable energy types is in manufacturing and construction while most employment in coal and
gas plants is in fuel processing and O&M.
Table 4.1 Estimated employment per megawatt, renewable and fossil power plants14
In summary, the findings presented in local and overseas studies reveal that the wind energy industry
is an international industry offering diverse employment opportunities. Overseas evidence suggests
that most employment is in turbine and component manufacturing. However, in most cases this
evidence was from countries that were early adopters of wind energy and were involved in turbine and
component manufacture.
13 Canadian Wind Energy Association (2006).
14 The table presents average employment over the life of the facility. See UNEP/ILO/IOE/ITUC (2008). Green
jobs: towards decent work in a sustainable, low carbon world.
Manufacturing,
construction,
installation
Operation &
Maintenance/Fuel
processing
Total
Solar PV 5.76 to 6.21 1.2 to 4.80 6.96 to 11.01
Wind pow er 0.43 to 2.51 0.27 0.70 to 2.78
Biomass 0.40 0.38 to2.44 0.78 to 2.84
Coal-f ired 0.27 0.74 1.01
Natural gas fired 0.25 0.70 0.95
Source: UNEP/ILO/IOE/ITUC (2008)
Note: Based on findings from a range of studies in the United States
and Europe published in 2001–04. Assumed capacity factor is 21 percent for solar PV
35 percent for w ind, 80 percent for coal, and 85 percent for biomass and natural gas.

Final report
18 Economic Benefits of Wind Farms in New Zealand New Zealand Wind Energy Association
June 2012
4.2 Survey
Table 4.2 summarises the FTE per MW ratio by phase based on the BERL-NZWEA survey. The
survey reveals that the largest proportion of employment in the New Zealand wind energy industry is
related to construction and installation activities (about 190 FTEs), followed by planning and project
development activities (81 FTEs). For O&M, the survey reveals that there were 93 FTE jobs
associated with about 623MW generation of operating wind farms over the same period.
Table 4.2 FTEs per MW, BERL-NZWEA survey15
4.3 Case studies
BERL undertook two case studies to determine the economic activity related to wind farm development
and O&M. The first was with West Wind, operated by Meridian Energy, which has an installed capacity
of about 143MW. Construction and installation of the wind farm directly required 150 FTEs. This
means that the construction and installation of the 62 turbine-wind farm employed about 1.05 FTEs per
MW.
The second was Vestas, one of the world’s leading turbine manufacturers. Vestas maintains four wind
farms in New Zealand: Tararua, Te Apiti, White Hill, and Mahinerangi. The combined capacity of these
wind farms is about 346MW, which is more than half of the current total installed capacity of wind farms
in New Zealand. Vestas employs 43 technicians to provide repair and maintenance services to these
wind farms. This suggests that the Vestas-managed wind farms required about 0.12 FTE per MW for
O&M services across the four wind farms. This FTE per MW ratio was compared with the FTE per MW
ratio estimated from employment reported in the survey.
4.4 Summary
Table 4.3 summarises the employment requirement by phase of wind farm development and operation.
15 Planning and construction and installation FTE per MW ratio is based on the total installed capacity of wind farms
built from 2010 to 2011. About 110 MW were installed throughout New Zealand over this period.
PlanningConstruction
and Installation
Operation and
Maintenance
Survey (110 MW) 0.81 1.79 0.15
Source: BERL-NZWEA Survey, 2012

Final report
19 Economic Benefits of Wind Farms in New Zealand New Zealand Wind Energy Association
June 2012
Table 4.3 Comparison of employment per megawatt
In New Zealand, the construction and installation phase has more impact on employment compared to
the planning and project development, and O&M phases.
Overseas evidence suggests that most employment is in turbine and component manufacturing, while
New Zealand case studies indicate that the construction and installation phase has more impact on
employment than the planning and project development and O&M phases. This is because there is
currently no major manufacturing base or capability within New Zealand. We would expect that as the
industry develops, the share and level of activity captured during the construction and installation
phase increases.
The large difference in employment ratios during the planning and product development phase is likely
due to the fact that, in the case studies, much of the planning and project development related
activities such as feasibility analysis, scientific studies and obtaining consents and permits had already
been done. The low ratio identified from the case studies is likely to be the ongoing planning and
project development as part of the construction and operation of the wind farm.
Planning and
project
development
Construction
and
installation
Operation and
Maintenance
Survey (110MW) 0.81 1.79 0.15
Vestas (345.8MW) 0.12
New Zealand case study
West Wind (142.6MW) 0.08 1.05
Tararua 3 (93MW) 1.08
Te Uku (64.4MW) 0.08
International case study
European Wind Energy Association
Annual MW 1.3a1.2 0.07
Cumulative MW 0.07a0.33
UNEP/ILO/IOE/ITUC b0.43 to 2.51 0.38 to 2.44
a Other direct employment in IPP/utilities, consultants, research institutions, universities,
f inancial services and others. This estimate is based on annual MW.
b Based on findings from a range of studies in the United States and Europe published in 2001 to
2004. Assumed capacity factor is 35 percent for w ind.
FTE per MW
Sources: BERL-NZWEA (2012), EWEA (2009), UNEP/ILO/IOE/ITUC (2008)

Final report
20 Economic Benefits of Wind Farms in New Zealand New Zealand Wind Energy Association
June 2012
5 The wind energy industry in New Zealand
This section highlights the type of companies covered in the analysis and the current size of the New
Zealand wind energy industry.
5.1 Composition
The wind energy industry is composed of companies providing diverse services at various phases,
from wind project development to O&M. The nature of those services, as well as the scale and scope
of their operation, varies according to three phases.
5.1.1 Planning and project development
Companies that are involved in this phase are responsible for site selection, wind power feasibility
analysis and other scientific studies16
, wind farm design layout, wind turbine selection and acquisition,
obtaining consents and permits, construction contracting, acquiring leases, energy production
estimates, and project financing. Legal and financing companies are also involved in this phase.
5.1.2 Construction and installation
The companies providing engineering, procurement, and construction services such as civil work,
laying cables for electrical infrastructures and installing wind turbines are involved in this phase.
Companies that deliver technical assessments (e.g. geotechnical assessments) and those who are
engaged in wind turbine, industrial heavy equipment and components/materials transport are involved
in this phase.
5.1.3 Operations and maintenance17
Operations include scheduling site personnel, observing turbine operation, dealing with equipment
failure, and coordinating with the utility to respond to curtailments or outages. Maintenance includes
both scheduled (preventative) services, such as periodic equipment inspections, oil and filter changes,
calibration of electronic sensors, blade cleaning, and unscheduled services to repair component
malfunctions. For this analysis, we included wind turbine and component manufacturers under this
category.
NZWEA membership suggests that there are at least 57 New Zealand based-companies involved in
the wind energy industry. Figure 5.1 presents the composition of these companies by the three
phases.
16 Apart from individual companies, universities, government, and crown entities are involved in research and
development related to wind energy.
17 This also covers the routine maintenance of wind turbines after the manufacturer warranty has expired. Wind
farm operators may perform maintenance on their own, or sub-contract the service to independent service companies.

Final report
21 Economic Benefits of Wind Farms in New Zealand New Zealand Wind Energy Association
June 2012
Figure 5.1 Composition of the New Zealand wind energy industry, 2011
Of the 57 companies, 23 (40 percent) are involved in activities related to planning and project
development, 20 companies in the construction and installation, and 14 companies provide O&M
related services. Including other suppliers and non-NZWEA members, we estimate that the industry
has about 10018
companies engaged in the various phases of wind farm development.
Table 5.1 shows the type of companies under each phase of a life of a wind farm.
Table 5.1 Type of companies in the New Zealand wind energy industry
Table 5.1 suggests the wind energy industry is composed of diverse businesses ranging from those
offering highly specialised products and services, to those providing general services such as
consulting and telecommunication services. With this diversity in the composition of businesses, we
18 The estimate of the number of companies whose main activities relates to the planning, construction and
installation, and O&M phases of wind farms is based on NZWEA membership. Key companies such as Vestas, Trustpower Limited and TRH Services identified the suppliers.
Planning and project
development, 23, 40%
Construction and installation, 20,
35%
Operation and maintenance, 14,
25%
Source: NZWEA
Planning and project
development
Construction and
installation
Operation and
maintenance
Consulting services Wind turbine manufacturer
Pow er transmission and
distribution
Wind energy facility developer Lines company Electricity generator
Design and build Components manufacturer
Broadcast and
telecommunication services
Electricity generator Engineering and services System operator
Transport Trading, retailing and metering
Generator/Supply company/
Lines company/ Retailer Personal protection equipment
Electrical equipment
manufacturer Gearbox repair
Cable manufacturer Wind turbine manufacturer
Earthing accessories supplier
Other suppliers
Source: NZWEA

Final report
22 Economic Benefits of Wind Farms in New Zealand New Zealand Wind Energy Association
June 2012
expect that the job profile in the industry would also be as diverse as the type of companies associated
with the wind energy industry.
5.2 Current size
The New Zealand wind energy industry is largely a private sector-based industry. Of the 100
companies associated with the wind energy industry in New Zealand, 42 companies are covered in the
analysis. These companies employ about 7,90019
people throughout New Zealand. Of this total
employment, the survey indicates that about 380 FTEs relate directly to wind energy activities.
Figure 5.2 presents the composition of direct employment in the industry.
Figure 5.2 Composition of the direct employment in the wind energy industry, 2011
Most employment from 2010 to 2011 was in companies related to construction and installation (167
FTEs), followed by consulting and engineering services (75 FTEs), and wind turbine manufacturing (73
FTEs). Components manufacturers (7 FTEs) and energy facility developers20
(23 FTEs) were also
engaged in wind energy related activities over the same period.
There were about 22 FTEs directly related to the wind energy activities in utility companies. This
employment is in planning and project development, and O&M phases.21
19The estimate was based from data compiled from annual reports and publicly available information (such as
company websites) on the number of people employed in the company. This estimate of total people employed in companies involved in wind related activities is likely to be underestimated, as some suppliers do not report employment in their annual report nor in their websites. The list of companies included in the analysis is reported in the Appendices.
20 These are wind turbine manufacturing companies providing O&M services to wind farms.
21 Based on the proportion reported by a company engaged in electricity transmission and distribution, about 20
percent of their wind energy related employment goes to planning a wind project, while about 80 percent of wind energy related employment of those in the electricity generation also goes to planning and wind project development.
Developers, 23, 6%
Component manufacturers, 7,
2%
Consulting/Engineering, 75,
20%
Construction and installation, 167,
44%
Wind turbine manufacturing, 73,
19%
Utility, 22, 6%
Others, 14, 3%
Source: BERL

Final report
23 Economic Benefits of Wind Farms in New Zealand New Zealand Wind Energy Association
June 2012
6 Economic benefits
This section presents the economic impact assessment of wind farms in New Zealand. Using
employment as a measure of activity in the wind energy industry, direct and total economic benefits in
terms of GDP and employment were estimated. The section focuses on the economic benefits of
increasing the generation capacity of wind farms in New Zealand to 3,500MW.
6.1 Approach
The approach used to estimate the economic benefits from wind farms in New Zealand is to identify the
level of activity of businesses directly involved in wind farms during the planning and project
development, construction and installation, and O&M phases. National multipliers22
are then applied to
determine the indirect and induced effects of the direct activities of companies related to the wind
energy industry. To avoid double counting, where the company might be included in the indirect
multiplier as well, we have excluded the first round effect when calculating the indirect and induced
impacts for the industry.
For this analysis, employment is used as the base measure of activity. Employment was identified
through a variety of sources, including survey, interviews of business in the wind energy industry, and
public information (such as websites and annual reports)23
. A survey and interviews were also used to
determine how wind farms impact local and national employment in New Zealand. Websites and
annual reports of 13 companies identified that supply goods and services to the wind energy industry
were reviewed. This allowed non-respondents to the survey and non-NZWEA member businesses to
be included in the analysis. Combining the information from all sources (survey, interviews and public
information), the analysis covered 42 businesses.24
The findings from the survey, interviews and secondary materials served as basis for describing the
base employment as well as the potential employment and GDP contribution of the wind energy
industry if its installed capacity increases from 623MW in 2011 to 3,500MW in 2030.
22 At the national level, we use 2005-2006 New Zealand multipliers that have been revised by BERL/Infometrics.
These are multipliers broken down into 59 industries. We used GDP deflators that take into account inflation to provide real prices.
23 The method of data collection is presented in the Appendices.
24 The companies included in the analysis are listed in the Appendices. Four of the 42 companies are identified
suppliers of Vestas and TRH Services while the rest are NZWEA members.

Final report
24 Economic Benefits of Wind Farms in New Zealand New Zealand Wind Energy Association
June 2012
6.2 Economic benefits of activities between 2010 and 2011
The economic benefits of activities between 2010 and 2011 is summarised in Table 6.1.
Table 6.1 Summary of economic benefits, 2011
From 2010 to 2011, 58 wind turbines with a combined installed capacity of about 110MW were
installed throughout New Zealand. Over this period, the industry has directly contributed 380 FTEs to
national employment and added $36 million to the national GDP. A further 140 FTEs and $52 million in
GDP were generated from indirect activities. The total benefit from the wind energy industry is 649
FTEs in employment and $65 million in GDP, with induced effects from consumption spending of those
working in the wind energy industry.
6.2.1 Employment by phase of activity
Figure 6.1 summarises the total employment benefits at each phase of wind farm development and
operation.
Figure 6.1 Estimated total employment benefit by phase, 2011
Most of the employment benefit was in construction and installation activities. Of the 649 FTEs, 305
FTEs were in construction and installation25
jobs while 186 FTEs were in O&M jobs.
Overall, the wind energy industry has directly contributed 380 FTEs and about $36 million to New
Zealand’s GDP in 2011. These economic benefits to New Zealand imply that each full-time job
generated by the industry contributed about $94,000 to GDP in 2011.
25 The combined installed capacity of wind farms completed between 2010 and 2011 is about 110MW.
Direct Total
GDP (2011$m) 36 65
Employment (FTEs) 380 649
Source: BERL
Planning and project
development, 158, 24%
Construction and installation, 305,
47%
Operation and maintenance,
186, 29%
Source: BERL

Final report
25 Economic Benefits of Wind Farms in New Zealand New Zealand Wind Energy Association
June 2012
6.3 Economic benefits of a steady output growth to 2030
For this analysis, we present the quantum of economic benefits of increasing the generation capacity of
the wind farms in New Zealand in the future. We assume that the wind energy industry has a steady
annual growth of about 150MW over the next 18 years. Thus by 2030, wind farms in New Zealand will
have a total installed capacity of 3,500MW. This future capacity of wind farms is about 2,880MW more
than the operating capacity of wind farms in the country in 2011.
The employment calculations are based on a scaling up (straight multiplication) of existing activities. A
plausible scenario is that the NZ industry develops to support the wind industry, as has occurred in the
oil and gas exploration industry. The methodology used in this report does not allow for this kind of
effect. Thus, the report takes a conservative approach to employment associated with the wind
industry in 2030.
6.3.1 Employment benefits at 2030
Figure 6.2 shows the total employment trends from a steady output growth of 150MW per year, from
2012 to 2030. A 150MW per year output expansion is expected to result in an annual increase of
about 20 permanent full-time O&M jobs each year over the next 18 years. By 2030, the total
employment benefit of wind farms in New Zealand is about 1,400 FTEs. Of this employment, the wind
industry directly creates 764 FTEs.
Figure 6.2 Estimated total employment benefit by phase, 2012 to 2030
Of the direct employment benefit, about 215 FTEs will be in construction and installation activities while
about 100 FTEs will be in planning and wind farm development activities. The operational workforce
will rise from 89 FTEs in 2011 to 450 FTEs by 2030, making up about 65 percent of the total
employment benefit. This implies that the industry will require roles such as site technicians, lines
men, health and safety experts, qualified operators and support staff in the future.
0
200
400
600
800
1,000
1,200
1,400
1,600
Nu
mb
er
of
FTEs
Planning and project development Construction and installation O&M
Source: BERL

Final report
26 Economic Benefits of Wind Farms in New Zealand New Zealand Wind Energy Association
June 2012
6.3.2 GDP contribution at 203026
In 2030, the wind energy industry is expected to directly contribute about $81 million in GDP. This is
more than double its estimated total impact on GDP in 2011. About $54 million of this contribution
comes from O&M while the rest is split between planning and development ($9 million) and
construction and installation activities ($18 million).
Increasing the generation capacity of the wind energy industry is likely to stimulate activities in other
non-wind energy industry related sectors such as accommodation and retail trade. These indirect
effects add a further $45 million to New Zealand’s GDP in 2030. Including induced effects, the wind
energy industry can potentially contribute a further $30 million to national GDP.27
Table 6.2 presents the contribution to national GDP by phase of wind farm development and operation.
Table 6.2 Contribution to national GDP ($2011m) by 2030
By 2030, the wind energy industry will have a total impact of about $156 million in GDP. The largest
contribution to GDP will be in O&M activities, followed by construction and installation activities. Thus,
businesses in the electricity transmission and distribution, electricity generation, and turbine and
component manufacturing are likely to benefit from a larger wind energy industry in the future.
6.4 Other benefits
6.4.1 Export of expert services
New Zealand’s wind energy industry also exports its expertise. Some companies (e.g. Aurecon,
Windflow Technology and Vestas) are developing skills and expertise in New Zealand and exporting it
to markets in Australia, Europe and Asia. New Zealand can expect to grow its share of service exports
as the industry expands.
6.4.2 Research and development
Some businesses in the wind energy industry are establishments that construct individual components
and systems that make up the wind turbine. These businesses are localising production to take
advantage of a growing market, reduce transportation costs, and minimise the risks associated with
26 GDP figures are expressed in inflation-adjusted (i.e. constant price) 2011$ values.
27 The sum of the direct ($81 million), indirect ($45 million) and induced ($30 million) effects gives the total economic
impact ($156 million) of the wind energy industry to national GDP.
Direct Total
Planning and project development 9 13
Construction and installation 18 33
Operation and maintenance 54 110
Total GDP 81 156
Source: BERL

Final report
27 Economic Benefits of Wind Farms in New Zealand New Zealand Wind Energy Association
June 2012
exchange rates. They conduct research and development that leads to innovation. One example is
Windflow Technology, a turbine manufacturer based in Christchurch. In 2012, Windflow signed an
agreement with General Dynamics SATCOM for joint development, manufacture and sales of the
Windflow 500 technology.
Suppliers of components are also expected to localise their assembly line. The growth of the wind
energy industry will provide new opportunities for New Zealand workers. More jobs are likely to be
created as suppliers and component manufacturers innovate and localise their businesses and
assembly lines.
6.4.3 Regional development
Wind energy projects are anchored to a geographic area. As a result, they have significant impact on
local communities and economies during construction and operation by creating jobs and supporting
local businesses.
Wind farms can also create stable incomes. Landowners receive rental for the turbine sites, roadways,
and power line easements. This rental can help preserve and protect traditional uses of rural lands. In
most cases, this provides substantial new income. For those owners who rely primarily on agriculture
or forestry, where incomes can vary depending on weather patterns and commodity prices, regular
lease payments create more stability in incomes and diversify income sources.
6.4.4 Electric power supply portfolios
Compared with fossil fuel generation wind energy has low risk associated with fuel costs (the fuel –
wind – is free) and cost of greenhouse gas emissions. Hence, rising fossil fuel prices or the
introduction of the cost of greenhouse gas emission is unlikely to affect the cost of wind energy.
Electricity generators and retailers such as Meridian Energy, Contact Energy, Genesis Energy and
Mighty River Power have wind energy options. As these options are realised, New Zealand will have a
more diversified energy mix with more wind farms. Moreover, the addition of wind energy to the
resource portfolio spreads energy-related risks in New Zealand.
6.4.5 Tourism
Communities that host wind farms benefit not only in terms of additional income for property owners
but also in terms of increased activity flows related to tourism. Although there is no published study on
the tourism impact of wind farms in New Zealand, wind farms are used as an icon that promotes
tourism in local areas in the Tararua-Manawatu and Wellington regions.
The construction and maintenance of roads to service wind farms also improves access for local
residents and tourists who would enjoy hiking, biking and other outdoor related activities. For example,
the West Wind Recreation Area has been open to the public since December 2011. The recreation
area boasts of platforms where views of the wind farm and the coast can be enjoyed, as well as access
Final report
28 Economic Benefits of Wind Farms in New Zealand New Zealand Wind Energy Association
June 2012
to the Makara beach and two mountain biking tracks.28
Te Apiti and Hau Nui wind farms also have
viewing and information area that are open to the public.
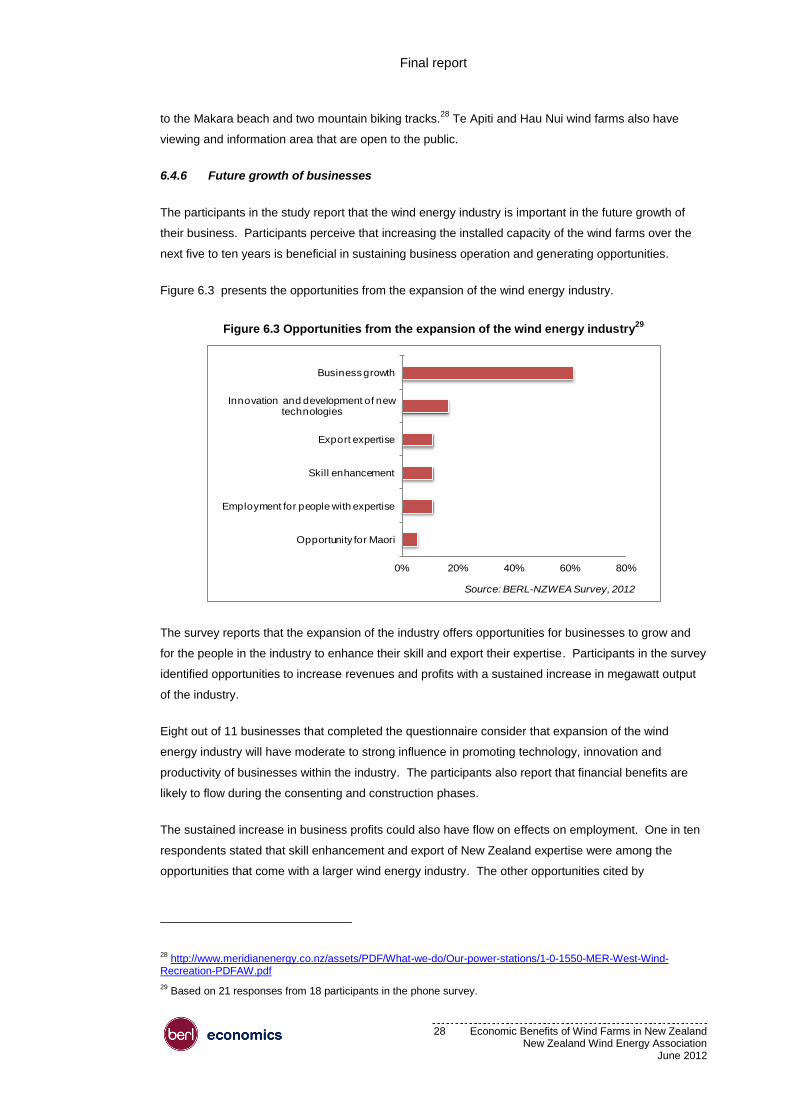
6.4.6 Future growth of businesses
The participants in the study report that the wind energy industry is important in the future growth of
their business. Participants perceive that increasing the installed capacity of the wind farms over the
next five to ten years is beneficial in sustaining business operation and generating opportunities.
Figure 6.3 presents the opportunities from the expansion of the wind energy industry.
Figure 6.3 Opportunities from the expansion of the wind energy industry29
The survey reports that the expansion of the industry offers opportunities for businesses to grow and
for the people in the industry to enhance their skill and export their expertise. Participants in the survey
identified opportunities to increase revenues and profits with a sustained increase in megawatt output
of the industry.
Eight out of 11 businesses that completed the questionnaire consider that expansion of the wind
energy industry will have moderate to strong influence in promoting technology, innovation and
productivity of businesses within the industry. The participants also report that financial benefits are
likely to flow during the consenting and construction phases.
The sustained increase in business profits could also have flow on effects on employment. One in ten
respondents stated that skill enhancement and export of New Zealand expertise were among the
opportunities that come with a larger wind energy industry. The other opportunities cited by
28 http://www.meridianenergy.co.nz/assets/PDF/What-we-do/Our-power-stations/1-0-1550-MER-West-Wind-
Recreation-PDFAW.pdf
29 Based on 21 responses from 18 participants in the phone survey.
0% 20% 40% 60% 80%
Opportunity for Maori
Employment for people with expertise
Skill enhancement
Export expertise
Innovation and development of new technologies
Business growth
Source: BERL-NZWEA Survey, 2012

Final report
29 Economic Benefits of Wind Farms in New Zealand New Zealand Wind Energy Association
June 2012
participants were increased employment of people with expertise in civil and earth works, electrical
engineering and project management, and real business opportunity for Māori.
6.4.7 Skills and qualification required to support growth
To support its future growth, the wind energy industry will require a diverse and technically skilled
workforce. Table 6.3 summarises what the survey participants report as skills and qualifications
required to support the future growth of the wind energy industry.
Table 6.3 Skill and qualification required to support growth of the wind energy industry
6.5 Comparison within the Energy sector
The wind energy industry’s estimated direct contribution ($36 million) to national GDP is about two
percent of the GDP contribution of the electricity supply industry ($1,968 million) in 2011. The
estimated direct employment from the wind energy industry is comparable to the employment of oil and
gas extraction (592 FTEs), and gas supply (540 FTEs) industries.
Table 6.4 presents the GDP and employment contribution of the wind energy industry, gas supply and
electricity supply industries in 2011.
Table 6.4 Comparison within the Energy sector
Compared to other energy related sectors, the wind energy industry’s contribution is about three
percent and 44 percent of the 2011 GDP of the electricity supply ($1,968 million) and gas supply ($148
million) industries.
Type of skills Specialisation
Engineering geodetic, structural, civil, electrical, mechanical, design, environmental
engineers
Project management wind project development, commissioning, planners
environmental engineers, wind specialist, consultants to assess the
feasibility of the project, ecologist, meteorologist
financial and legal consultants
health and safety experts
human resource managenent
Technical design and development, IT, GIS and other visualisation skills
Trade electrical, mechanical, builders, lines men, turbine technicians, qualified
operators
Administrative human resource management, finance, support
Others consumer/marketing, site assessment, insurance and risk assessment,
power transmission, transport specialist, policy experts
Source: BERL-NZWEA Survey 2012
Wind
energy
Electrcity
supply
Gas
supply
GDP (2011$m) 36 1,968 148
Employment (FTEs) 380 7,167 540
Source: BERL

Final report
30 Economic Benefits of Wind Farms in New Zealand New Zealand Wind Energy Association
June 2012
7 Conclusion
The wind energy industry is a growing industry. Forecast growth suggesting 3,500MW of installed wind
capacity would directly support 764 FTEs and contribute $81 million in GDP. The wind energy industry
employs people with technical, business, and relationship management skills. The economic impact
analysis suggests that, on average, each full-time job generated by the industry contributes about
$94,000 to GDP.
The expansion of the wind energy industry will also result in changes in the size and composition of its
workforce. The greater number of working wind farms means that the operational workforce will make
up more than half of the industry’s workforce by 2030. This implies that the industry will require roles
such as site technicians, lines men, health and safety experts, qualified operators, and support staff in
the future.
The expansion of the wind energy industry will have a positive impact on the labour market. The
planning and wind farm project development phase will directly support business services and
electricity generation sectors. This phase potentially creates about 100 full-time equivalent jobs by
2030.
The construction and installation phase supports the construction and retail industries. The expansion
of the wind energy industry will directly create about 215 construction and installation related full-time
jobs.
The O&M phase is likely to sustain more permanent full-time equivalent jobs over the lifetime of wind
farms. The operational workforce of the wind energy industry will be about 450 FTEs in 2030. These
new employment opportunities will be throughout New Zealand. Other employment opportunities will
result from linkages in the economy and the rest will be from induced effects of spending of workers
and their families. Applying indirect and induced multipliers, the wind energy industry can potentially
sustain about 1,400 FTEs, contributing about $156 million in GDP, in 2030.
Table 7.1 summarises the economic benefits of a 3,500MW wind farm industry in New Zealand.
Table 7.1 Summary of economic benefits of a 3,500MW generation
The report takes a conservative approach to the number of jobs created in the wind industry in the
future. As the industry grows, New Zealand companies could supply a greater proportion of the goods
and services than they currently supply. This has occurred in other industries such as the oil and gas
sector in Taranaki. As there are similarities between the two industries in terms of specialist technical
requirements and the concentration of activity, this could plausibly happen in the wind industry. The
Direct Total
GDP ($2011m) 81 156
Employment (FTEs) 764 1,430
Source: BERL

Final report
31 Economic Benefits of Wind Farms in New Zealand New Zealand Wind Energy Association
June 2012
methodology used in this report to calculate employment and GDP is conservative because it does not
consider this effect.
Looking ahead, the wind energy industry will continue to be multi-faceted and interdisciplinary. As
more wind farms are installed across New Zealand, employment opportunities within the industry are
expected to increase.
The economic contribution of the wind energy industry to New Zealand goes beyond employment and
contribution to GDP. The wind energy industry also encourages exports and tourism, promotes R&D
and skill development, supports regional economic development, improves the security of energy
supply and provides a renewable source of energy.
Final report
32 Economic Benefits of Wind Farms in New Zealand New Zealand Wind Energy Association
June 2012
8 Appendices
8.1 Data collection
The analysis used primary and secondary data. Primary data was collected through a survey of
businesses involved in the wind farm industry. Secondary data was collected from the annual reports
and websites of companies whose businesses are directly related to wind farm development and
operation in New Zealand.
The written survey turnout was low. The results were augmented with a phone survey to non-
respondents and a review of available annual reports and websites of companies involved in the wind
energy industry. Two interviews were conducted for the case study on employment in the industry.
The interviews focused on business and career opportunities in the wind energy industry, as well as
the skills and expertise required to support the growth of the wind energy industry in New Zealand.
Secondary data were also gathered from existing economic impact assessment of wind farms in New
Zealand and overseas. Information from secondary materials were used to identify FTE to MW ratios
related to the planning and project development, construction, and O&M phases of wind farms and to
check the order of magnitude of employment.
8.2 Data analysis
Standard multiplier analysis was used to estimate the economic impact of wind farms in New Zealand.
In a multiplier analysis, wind farms can have three impacts on the local and national economy:
Direct effects: these are expenditures during the wind project development, construction and
installation, and O&M phases (i.e. on-site jobs of contractors and crews, jobs at the turbine).
Indirect effects: this refers to the increase in economic activity that occurs when a contractor,
vendor, or manufacturer receives payment for goods or services and in turn is able to pay
others who support their business.
Induced effects: these are the change in wealth and income that is induced by the spending of
those persons directly and indirectly employed by the project (i.e., spending on food, clothes,
utilities, transportation, insurance, medical, etc.).
The results of the input-output analysis estimate these effects on the employment and GDP. The
estimates the economic impact on GDP and employment using survey data were compared to similar
studies overseas.
8.2.1 Direct employment by 2030
The FTEs per MW ratio was used to estimate the employment required to achieve a total installed
capacity of 3,500MW by 2030. The analysis assumes that there will be a steady growth of 150MW
rolled out between 2011 and 2030. A steady and sustainable increase in installed capacity over the

Final report
33 Economic Benefits of Wind Farms in New Zealand New Zealand Wind Energy Association
June 2012
next 18 years will allow companies to have sufficient time to adapt and build up their businesses in
order to cope with increasing number of MW being added every year.
To estimate the potential employment benefit from annually increasing the wind energy industry’s
output by 150MW, FTE per MW related to each phase of a wind farm was determined. Table 8.1
shows the FTE per MW ratios considered in the analysis.
Table 8.1 FTE per MW by phase, New Zealand, 2010 to 2011
The ratios were estimated based on the employment information collected during the survey and
interviews with key persons in the wind energy industry. FTEs per MW at each phase are the:
number of FTEs associated with planning a wind farm
number of FTEs employed to run 623MW output of wind farms in New Zealand in 2011
FTE employment to MW output ratio that is specific to the construction and installation of a
wind farm project.
The average ratios (from the low and high FTE per MW range) were used to determine the number of
FTEs at each phase, which can be directly generated from a 150MW per year expansion to a
3,500MW capacity by 2030.
Indirect employment was determined using standard multiplier analysis30
. The employment multiplier
will vary depending on the main activity of the companies included in the analysis. National multipliers
for other business services and other construction industries were used for the planning and project
development, and construction and installation phases, respectively. For the O&M phase, national
multipliers for electricity generation, electricity transmission and distribution and wholesale trade
(industrial goods) were applied. The latter were used for businesses in wind turbine and component
manufacturing, which are providing repair and maintenance services to the wind farms throughout the
country.
30 Based on a 59-industry composition of the New Zealand economy.
Planning and
project
development
Construction
and
installation
Operation
and
Maintenance
Low 0.08 1.05 0.12
Average 0.45 1.42 0.14
High 0.81 1.79 0.15
Source: BERL-NZWEA Survey, 2012

Final report
34 Economic Benefits of Wind Farms in New Zealand New Zealand Wind Energy Association
June 2012
8.3 List of companies in the New Zealand wind energy industry
Table 8.2 List of companies included in the analysis
Company Main Activity Affiliation
Total
number of
people
employed
GL Garrad Hassan Wind energy consulting NZWEA member 2
Vestas New Zealand Manufacture, installation and maintenance of wind turbines NZWEA member 45
URS New Zealand Ltd Engineering and environmental services NZWEA member 285
Blackley Construction Ltd
Pipe and cable installation using open excavation and
trenchless methods NZWEA member 6
Trustpower Ltd
Wind farm identification, development and operation, NZ
electricity Gentailer NZWEA member 428
Weld cone Wind Farm, Ludworth Wind Farm
and Energy Limited Distribution, wind farm development NZWEA member 1
Ashurst Engineering and Construction Co. (1989)
Fabrication, installation & maintenance to the electricity
industry NZWEA member 40
Energy3 Services
Wind energy facility developer; Small unit farm devt; monitoring
& assessment NZWEA member 6
Mainpower Electricity distribution NZWEA member 200
Seimens Wind turbine manufacturer NZWEA member 120
TRM Wind farm operation and maintenance NZWEA member 13
Beca Carter Hollings and FernerEngineering consultancy services
NZWEA member
1900
Meridian Electricity Generation NZWEA member 765
Meteorological Service of New Zealand Forecasting weather; tailor customed forecasts NZWEA member 220
Pioneer Generation
Renewable generating company; core business is hydro but
new buisness is on wind energy; electricity supply company NZWEA member 24
Boffa Miskell
Environmental planning; ecological assessment; urban
design consulting services NZWEA member 140
Ergo Consulting Electrical engineering; industrial and power related sevices NZWEA member 25
Ventus Energy Wind project development NZWEA member 1
Enercon Turbine manufacturer; intall and maintain NZWEA member 4
Higgins construction Construction services; infrastructure; roading NZWEA member 200
Powerco Lines company/ gas NZWEA member
Aurecon Consultant to the wind energy market; implementation NZWEA member 500
Oisoft Data collection and analysis; provides softwares NZWEA member
Marsh Limited
Consulting; insurance and risk implictions of the wind farm
projects; placement cover during the development and
construction phase NZWEA member 2
Wind Farms Development Wind farm project development NZWEA member 5
The Proprietor of Tararua, C Block Wind farm project development NZWEA member 3
OPUS International Ltd Consulting services NZWEA member 6
Downer
Engineering and infrastructure project services; overall
management services
Vestas supplier
25
Windflow Technology
Wind turbine design and assembly company based in
Christchurch; engineering design and R & D; production; and
O & M engineering
TRM supplier
12
ABB New Zealand Power and transmission distribution NZWEA member 650
Bremca
Design and manufacture of switchboards, switchgears and
automation solutions
TRM supplier
125
Hyspecs
Fluid power engineering; installation; maintenance and fault
finding services
TRM supplier
33
Daniel Smith Industries Ltd.
Civil engineering contractor; crane rental and civil engineering/
construction
Vestas supplier
60
MainPower New Zealand Lines Company NZWEA member 214
Mighty River Power
New Zealand-owned integrated energy generation, trading,
retailing and metering business.
NZWEA member
800
Buddle Findlay Consulting Services NZWEA member 92
Transpower Transmission / System Operator NZWEA member 520
Ergo Consulting Ltd Consulting Services NZWEA member 22
Kenex Ltd Consulting Services NZWEA member 14
Unison Networks Lines Company / Wind Farm Developer NZWEA member 160
WEL Networks Lines Company / Wind Farm Developer NZWEA member 192
Wind Farm Group Wind Energy Facility Developer NZWEA member 6
Source: Various annual reports and company websites

Final report
35 Economic Benefits of Wind Farms in New Zealand New Zealand Wind Energy Association
June 2012
9 References
Baker, C. (2010, September 08). News: Otago defies gloomy wind industry outlook.
Retrieved December 23, 2010, from The Southland Times: http://www.
stuff.co.nz/southland-times/news/40
BERL. (2011). Castle Hill Wind Farm: Economic impact assessment.
Callow, P. (2011). Publications: Economics of wind development in New Zealand.
Retrieved March 16, 2012, from New Zealand Wind Energy Association:
http://www.windenergy.org.nz/documents/conf11/pcallow.pdf
Canadian Wind Energy Association. (2006). Economic contribution of the wind energy
industry in Canada. Ontario: Canadian Wind Energy Association.
Centre for Renewable Energy-Department of Illinois. (2010, March 16). Wind powering
America. Retrieved October 2010, 22, from U.S. Department of Energy:
www.windpoweringamerica.gov
European Wind Energy Association. (2009). Wind at work. European Wind Energy
Association.
Genesis Energy. (2010). Project management brief: Castle Hill wind Farm. Wellington.
Genesis Energy. (2010). Project profile: Castle Hill Wind Farm. Wellington.
Hamilton, J., & Liming, D. (2010). Career in wind energy. Washington: U.S. Bureau of
Labor Statistics.
Methipara, J., Amy, S., Elles, C., & Beck, F. (2009). Fact Sheet: Jobs from renewable
energy and energy efficiency. Methipara, Jasmy, Amy Sauer, Chrissy Elles, and Frederic
Beck. (2008). Fact Sheet: Jo Environmental and Energy Study Institute.
New Zealand Institute of Economic Research. (2008). Economic assessment of Turitea
wind farm. Wellington: New Zealand Institute of Economic Research.
New Zealand Wind Energy Association. (2010). New Zealand Wind Energy Association.
Retrieved October 29, 2010, from Proposed wind farms: Castle Hill: http://windenergy.org.nz
Pedden, M. (2006). Analysis: economic impact of wind applications in rural communities.
NREL (SR 500-39099).

Final report
36 Economic Benefits of Wind Farms in New Zealand New Zealand Wind Energy Association
June 2012
UNEP/ILO/IOE/ITUC Green Jobs Initiatives. (2008). Green jobs: towards decent work in a
sustainable, low-carbon world. New York: United Nations Environment Programme.
World Wind Energy Association. (2011). The World Wind Energy Association Half-Year
Report 2011. Retrieved February 2012, 23, from World Wind Energy Association:
www.wwindea.org
All work is done, and services rendered at the request of, and for the purposes of the client only.
Neither BERL nor any of its employees accepts any responsibility on any grounds whatsoever,
including negligence, to any other person.
While every effort is made by BERL to ensure that the information, opinions and forecasts provided to
the client are accurate and reliable, BERL shall not be liable for any adverse consequences of the
client’s decisions made in reliance of any report provided by BERL, nor shall BERL be held to have
given or implied any warranty as to whether any report provided by BERL will assist in the performance
of the client’s functions.