Embed Size (px)
Citation preview
www.TheCIE.com.au
R E P O R T
Economic benefits of Australia’s North
Asian FTAs
Prepared for
Department of Foreign Affairs and Trade
12 June 2015
THE CENTRE FOR INTERNATIONAL ECONOMICS
www.TheCIE.com.au
The Centre for International Economics is a private economic research agency that
provides professional, independent and timely analysis of international and domestic
events and policies.
The CIE’s professional staff arrange, undertake and publish commissioned economic
research and analysis for industry, corporations, governments, international agencies
and individuals.
© Centre for International Economics 2015
This work is copyright. Individuals, agencies and corporations wishing to reproduce
this material should contact the Centre for International Economics at one of the
following addresses.
C A N B E R R A
Centre for International Economics
Ground Floor, 11 Lancaster Place
Canberra Airport ACT 2609
GPO Box 2203
Canberra ACT Australia 2601
Telephone +61 2 6245 7800
Facsimile +61 2 6245 7888
Email [email protected]
Website www.TheCIE.com.au
S Y D N E Y
Centre for International Economics
Suite 1, Level 16, 1 York Street
Sydney NSW 2000
GPO Box 397
Sydney NSW Australia 2001
Telephone +61 2 9250 0800
Facsimile +61 2 9250 0888
Email [email protected]
Website www.TheCIE.com.au
DISCLAIMER
While the CIE endeavours to provide reliable analysis and believes the material
it presents is accurate, it will not be liable for any party acting on such information.
Economic benefits of Australia’s North Asian FTAs iii
www.TheCIE.com.au
Contents
Executive summary 1
1 Introduction 3
2 Methodology 4
Scenarios 4
Modelling goods liberalisation under the FTAs 7
Modelling services liberalisation 9
Investment liberalisation 13
Modelling framework 14
3 Impact of other FTAs on Australia 17
Sectoral detail 18
4 Impact of Australia’s North Asian FTAs – goods liberalisation 21
Macroeconomic results 21
Sectoral details 22
5 Impact of Australia’s North Asian FTAs – services liberalisation 26
Macroeconomic results 26
Sectoral details 26
6 Impact of Australia’s North Asian FTAs – total macroeconomic impacts 28
Macroeconomic results 28
APPENDICES 33
A Impact of North Asian FTAs on employment 35
B Regional and sectoral detail of models 36
BOXES, CHARTS AND TABLES
1.1 Modelled FTAs 3
2.1 FTAs modelled in scenario 1 4
2.2 Illustration of approach to reporting results 6
2.3 What determines the extent of the impact of FTAs on exports? 7
2.4 Types of goods liberalisation offers 9
2.5 Observed rate of growth in trade in services (excluding travel) under
implemented FTAs compared with trade over the same period with trading
partner without FTA (from FTA implementation to 2013) 12
2.6 Assumptions for modelling services liberalisation 12
iv Economic benefits of Australia’s North Asian FTAs
www.TheCIE.com.au
3.1 FTAs modelled in scenario 1 17
3.2 Impact of other FTAs on Australia – key macroeconomic results, in 2035
after full implementation of FTAs, compared to baseline 18
3.3 Impact of the other FTAs on Australian exports and output by broad sector
group, change relative to the baseline, after full implementation in 2035 19
3.4 Impact of other FTAs on Australian exports and output by sector, change
relative to the baseline, after full implementation in 2035 19
4.1 Impact of goods liberalisation under North Asian FTAs (KAFTA, JAEPA
and ChAFTA) on Australia – key macroeconomic results, in 2035 after full
implementation of FTAs, compared to scenario 1 21
4.2 Impact of goods liberalisation under North Asian FTAs on Australian goods
exports and output by broad sector group, change relative to scenario 1, after
full implementation in 2035 24
4.3 Impact of goods liberalisation under North Asian FTAs on Australian goods
exports and output by sector, change relative to scenario 1, after full
implementation in 2035 24
5.1 Impact of services liberalisation of North Asian FTAs (KAFTA, JAEPA and
ChAFTA) on Australia – key macroeconomic results, in 2035 after full
implementation of FTAs, compared to scenario 1 26
5.2 Impact of services liberalisation of North Asian FTAs on Australian exports
and output by sector, change relative to scenario 1, after full implementation
in 2035 27
6.1 Impact of North Asian FTAs (KAFTA, JAEPA and ChAFTA) on Australia
– key macroeconomic results, in 2035 after full implementation of FTAs,
compared to scenario 1 29
6.2 Change in key macro results over time due to KAFTA, JAEPA and
ChAFTA, compared scenario 1 29
6.3 Impact of the North Asian FTAs on GDP, real consumption, real
consumption per household and employment at 2016 and 2035 30
6.4 Short term adjustments to liberalisation 31
6.5 Real and financial flows from liberalisation 32
A.1 Impacts of the North Asian FTAs on wages and employment, change from
corresponding year in scenario 1 35
B.1 Regions modelled 36
B.2 Description of modelled sectors 36
Economic benefits of Australia’s North Asian FTAs 1
www.TheCIE.com.au
Executive summary
This report
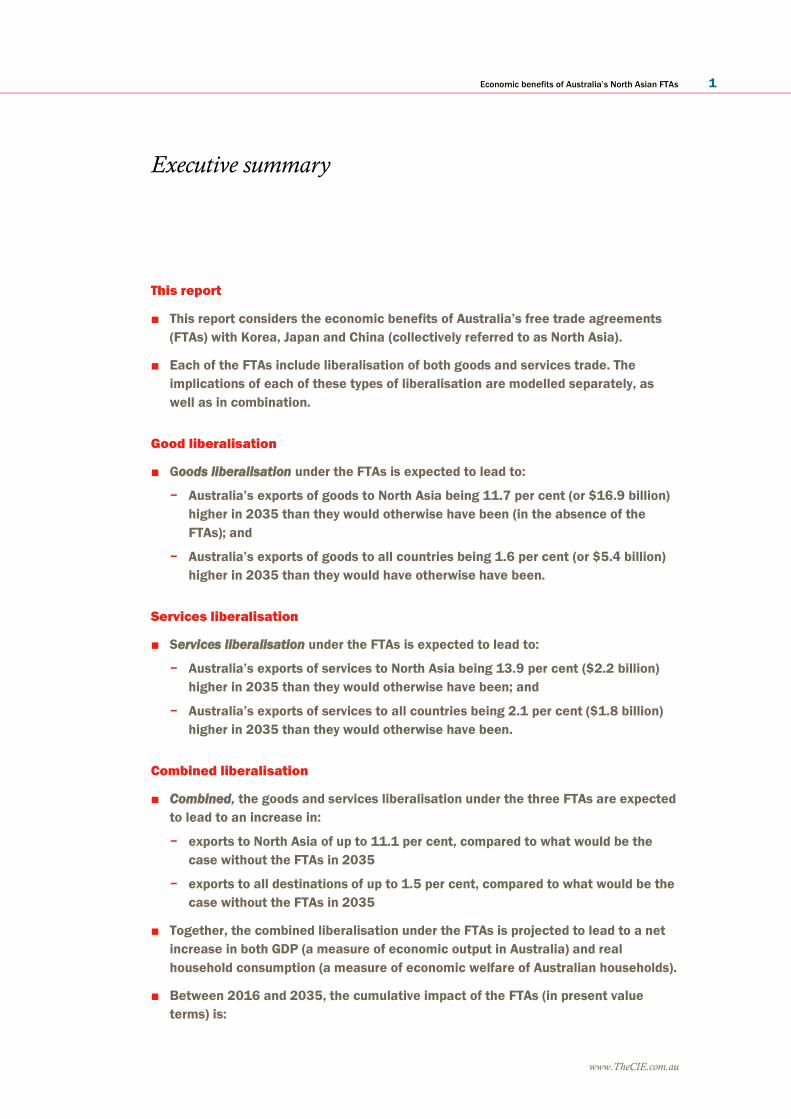
■ This report considers the economic benefits of Australia’s free trade agreements
(FTAs) with Korea, Japan and China (collectively referred to as North Asia).
■ Each of the FTAs include liberalisation of both goods and services trade. The
implications of each of these types of liberalisation are modelled separately, as
well as in combination.
Good liberalisation
■ Goods liberalisation under the FTAs is expected to lead to:
– Australia’s exports of goods to North Asia being 11.7 per cent (or $16.9 billion)
higher in 2035 than they would otherwise have been (in the absence of the
FTAs); and
– Australia’s exports of goods to all countries being 1.6 per cent (or $5.4 billion)
higher in 2035 than they would have otherwise have been.
Services liberalisation
■ Services liberalisation under the FTAs is expected to lead to:
– Australia’s exports of services to North Asia being 13.9 per cent ($2.2 billion)
higher in 2035 than they would otherwise have been; and
– Australia’s exports of services to all countries being 2.1 per cent ($1.8 billion)
higher in 2035 than they would otherwise have been.
Combined liberalisation
■ Combined, the goods and services liberalisation under the three FTAs are expected
to lead to an increase in:
– exports to North Asia of up to 11.1 per cent, compared to what would be the
case without the FTAs in 2035
– exports to all destinations of up to 1.5 per cent, compared to what would be the
case without the FTAs in 2035
■ Together, the combined liberalisation under the FTAs is projected to lead to a net
increase in both GDP (a measure of economic output in Australia) and real
household consumption (a measure of economic welfare of Australian households).
■ Between 2016 and 2035, the cumulative impact of the FTAs (in present value
terms) is:
2 Economic benefits of Australia’s North Asian FTAs
www.TheCIE.com.au
– an increase in GDP of $24.4 billion (compared with what would otherwise have
been the case);
– an increase in real consumption of $46.3 billion (compared with what would
otherwise be the case); and
– an increase in real consumption per household of $4,348 (compared with what
would otherwise have been the case).
■ The annual employment increase from the combined liberalisations (compared
with what would otherwise have been the case) is expected to:
– start at 7 900 persons in 2016;
– peak at 14 600 persons in 2020; and
– return to 5 400 persons in 2035.
■ Along with this employment change, real wages are also expected to increase by
up to 0.5 per cent (compared with what would otherwise have been the case).
Economic benefits of Australia’s North Asian FTAs 3
www.TheCIE.com.au
1 Introduction
The Department of Foreign Affairs and Trade (DFAT) commissioned the CIE to
conduct economic modelling of the benefits of Australia’s North Asian free trade
agreements (FTAs). The North Asian FTAs analysed are the Korea-Australia Free Trade
Agreement (KAFTA), the Japan-Australia Economic Partnership Agreement (JAEPA)
and the China-Australia Free Trade Agreement (ChAFTA). The aim of the project is to
understand the combined implication of these agreements for the Australian economy,
with a focus on macroeconomic indicators. The analysis considers the effects of
liberalisation of trade in goods, services and foreign investment.
DFAT were also interested in understanding the implications, for Australia, of other
trade agreements being implemented in the region under the assumption that Australia
had not pursued agreements with Korea, Japan and China. To analyse this, we have
modelled a range of recently signed trade agreements between these North Asian
countries and other economies. A full list of the agreements modelled in the two
scenarios is provided in table 1.1 below. The CIE conducted this analysis using two
global computable general equilibrium (CGE) economic models – GTAP and
CIE G Cubed.
The next chapter of this report sets out the approach to the modelling exercise
undertaken, including describing the scenarios modelled, the models used and the
method adopted to reflect the FTA arrangements in the models. The subsequent four
sections outline the key results of the modelling simulations for scenario 1, the goods
liberalisation effects of scenario 2, services liberalisation effects of scenario 2 and the
combined macroeconomic effects of scenario 2.
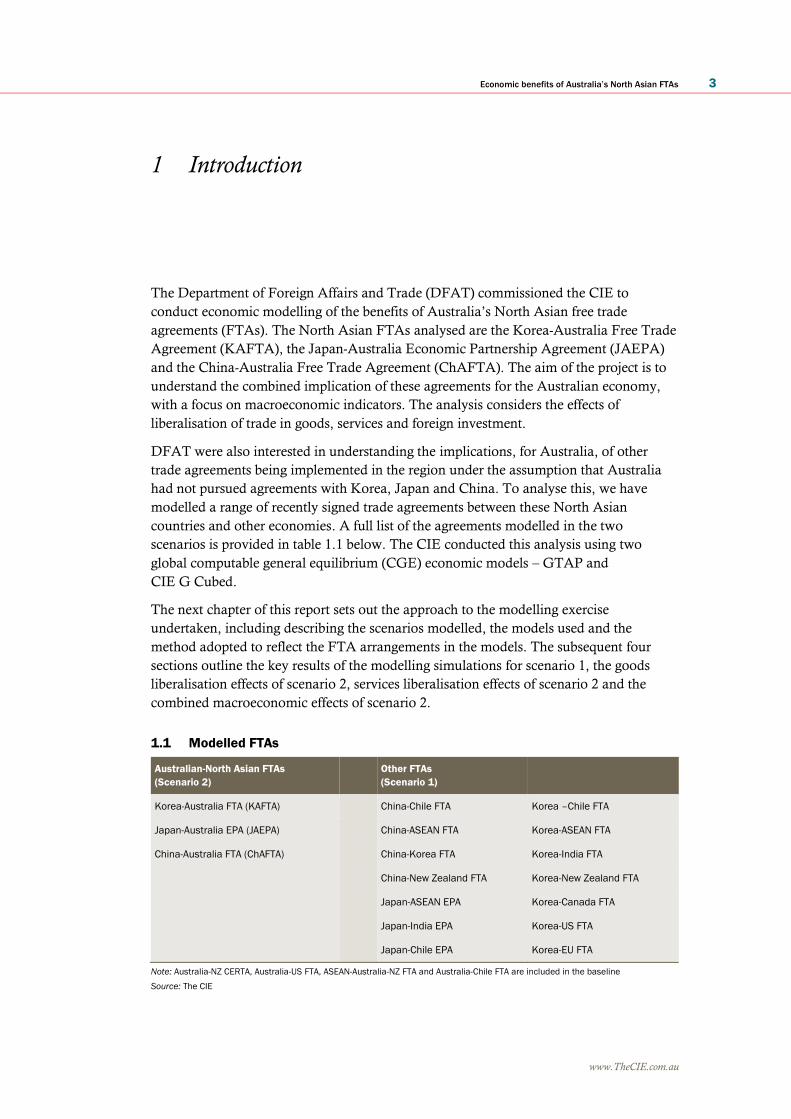
1.1 Modelled FTAs
Australian-North Asian FTAs
(Scenario 2)
Other FTAs
(Scenario 1)
Korea-Australia FTA (KAFTA) China-Chile FTA Korea –Chile FTA
Japan-Australia EPA (JAEPA) China-ASEAN FTA Korea-ASEAN FTA
China-Australia FTA (ChAFTA) China-Korea FTA Korea-India FTA
China-New Zealand FTA Korea-New Zealand FTA
Japan-ASEAN EPA Korea-Canada FTA
Japan-India EPA Korea-US FTA
Japan-Chile EPA Korea-EU FTA
Note: Australia-NZ CERTA, Australia-US FTA, ASEAN-Australia-NZ FTA and Australia-Chile FTA are included in the baseline
Source: The CIE
4 Economic benefits of Australia’s North Asian FTAs
www.TheCIE.com.au
2 Methodology
Scenarios
Scenario 1 – other North Asian FTAs in place
Two scenarios are developed for this project. The first seeks to represent a situation in
which Australia does not implement FTAs with Korea, Japan or China but other
countries continue to implement trade agreements with these North Asian trading
partners. The FTAs that are modelled for this scenario are listed in table 2.1.1 The results
of this scenario are compared to a baseline (or business as usual) scenario in which none
of these FTAs with Korea, Japan or China are assumed to exist.2 This scenario is
designed to provide insights into the implications for Australia of other countries
pursuing bilateral trade liberalisation with Australia’s North Asian trading partners while
Australia does not pursue these trade agreements.
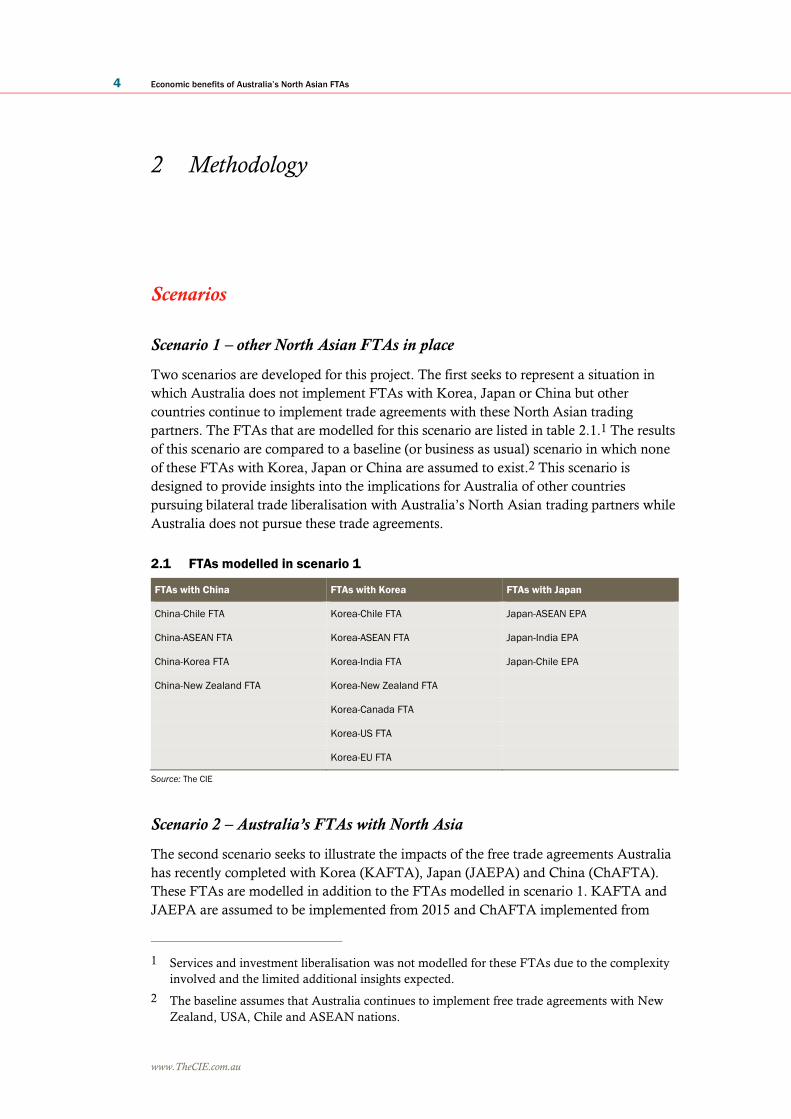
2.1 FTAs modelled in scenario 1
FTAs with China FTAs with Korea FTAs with Japan
China-Chile FTA Korea-Chile FTA Japan-ASEAN EPA
China-ASEAN FTA Korea-ASEAN FTA Japan-India EPA
China-Korea FTA Korea-India FTA Japan-Chile EPA
China-New Zealand FTA Korea-New Zealand FTA
Korea-Canada FTA
Korea-US FTA
Korea-EU FTA
Source: The CIE
Scenario 2 – Australia’s FTAs with North Asia
The second scenario seeks to illustrate the impacts of the free trade agreements Australia
has recently completed with Korea (KAFTA), Japan (JAEPA) and China (ChAFTA).
These FTAs are modelled in addition to the FTAs modelled in scenario 1. KAFTA and
JAEPA are assumed to be implemented from 2015 and ChAFTA implemented from
1 Services and investment liberalisation was not modelled for these FTAs due to the complexity
involved and the limited additional insights expected.
2 The baseline assumes that Australia continues to implement free trade agreements with New
Zealand, USA, Chile and ASEAN nations.
Economic benefits of Australia’s North Asian FTAs 5
www.TheCIE.com.au
2016. As the scenario aims to assess the impacts of the three FTAs as implemented, it is
compared to scenario 1, which most closely represents the current situation with all
FTAs in place. Scenario 2 includes liberalisation of trade in goods and liberalisation of
services trade.
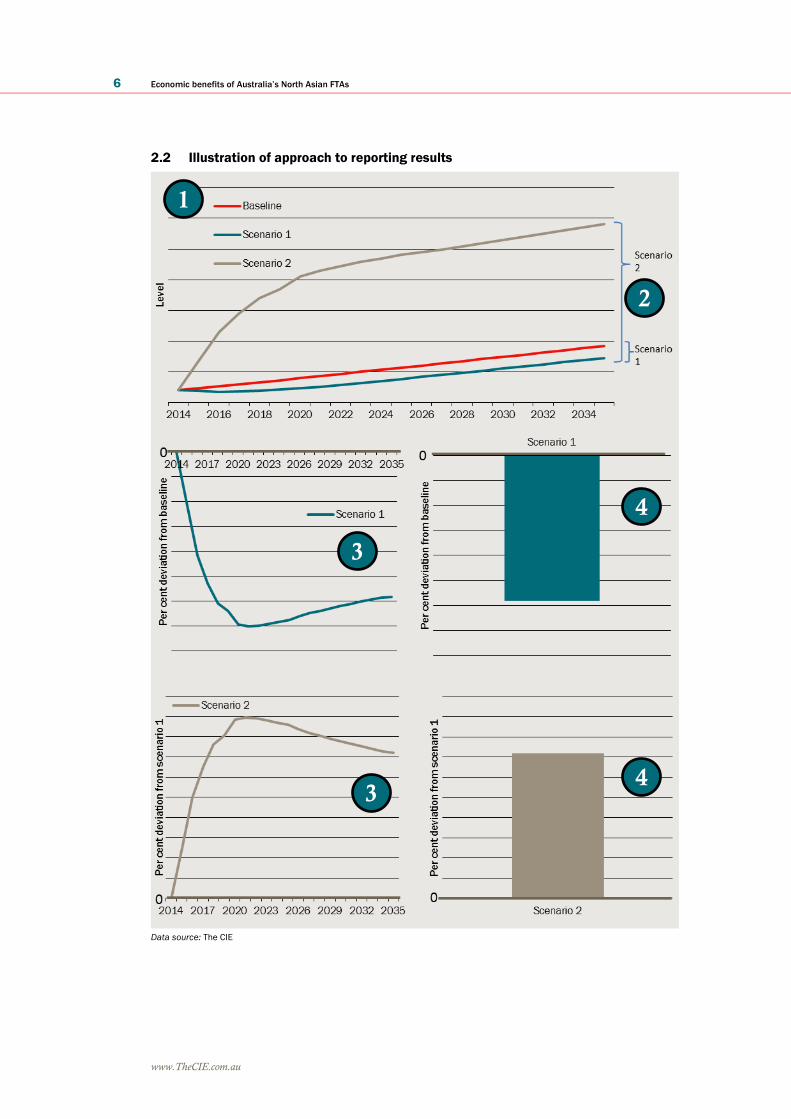
Illustration of scenarios and presentation of results
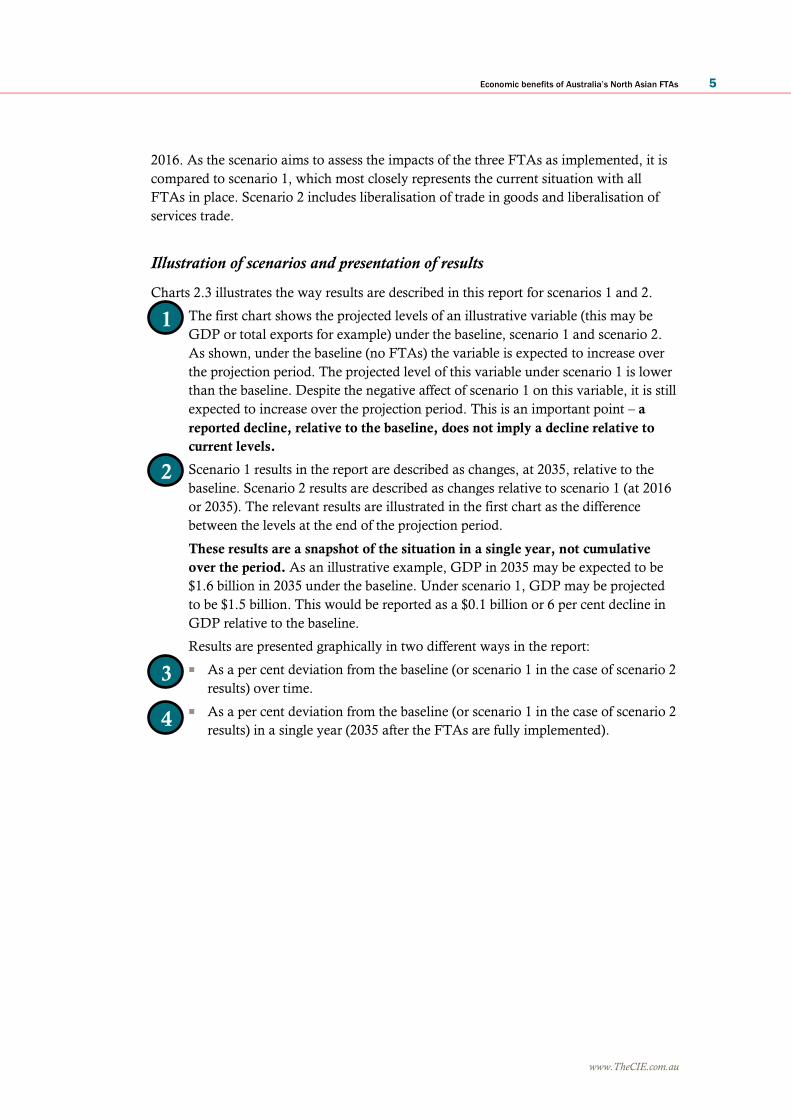
Charts 2.3 illustrates the way results are described in this report for scenarios 1 and 2.
1 The first chart shows the projected levels of an illustrative variable (this may be
GDP or total exports for example) under the baseline, scenario 1 and scenario 2.
As shown, under the baseline (no FTAs) the variable is expected to increase over
the projection period. The projected level of this variable under scenario 1 is lower
than the baseline. Despite the negative affect of scenario 1 on this variable, it is still
expected to increase over the projection period. This is an important point – a
reported decline, relative to the baseline, does not imply a decline relative to
current levels.
2 Scenario 1 results in the report are described as changes, at 2035, relative to the
baseline. Scenario 2 results are described as changes relative to scenario 1 (at 2016
or 2035). The relevant results are illustrated in the first chart as the difference
between the levels at the end of the projection period.
These results are a snapshot of the situation in a single year, not cumulative
over the period. As an illustrative example, GDP in 2035 may be expected to be
$1.6 billion in 2035 under the baseline. Under scenario 1, GDP may be projected
to be $1.5 billion. This would be reported as a $0.1 billion or 6 per cent decline in
GDP relative to the baseline.
Results are presented graphically in two different ways in the report:
■ As a per cent deviation from the baseline (or scenario 1 in the case of scenario 2
results) over time.
■ As a per cent deviation from the baseline (or scenario 1 in the case of scenario 2
results) in a single year (2035 after the FTAs are fully implemented).
1
2
3
4
6 Economic benefits of Australia’s North Asian FTAs
www.TheCIE.com.au
2.2 Illustration of approach to reporting results
Data source: The CIE
1
2
3
3
4
4
Economic benefits of Australia’s North Asian FTAs 7
www.TheCIE.com.au
Modelling goods liberalisation under the FTAs
Goods liberalisation under the FTAs is simulated in the models effectively by altering the
bilateral tariff rates for each of the modelled sectors. In the model database used there are
57 economic sectors, 42 of which are goods sectors and 14 services sectors (one sector
represents dwellings). Box 2.3 discusses the key factors that determine of the impact of
goods liberalisation on exports.
For each of the free trade agreements, the tariff rates (or quotas) that apply under the free
trade agreement, and during the implementation period, are set out in tariff elimination
schedules. These schedules specify the tariff rates for up to 11,000 different products.3
Box 2.4 describes the range of different types of goods liberalisation offers that may apply
in the FTAs. For each of the tariff elimination schedules for each of the FTAs, the tariff
rates under the agreement were aggregated up to the sectors in the model using a simple
averaging approach.4 For those tariff lines that were subject to WTO tariff rate quotas,
country specific quotas and agricultural safeguard measures, the quotas were converted
to equivalent tariff rates and then averaged. The conversion from quotas and specific
duties to ad valorem tariff equivalents was performed using available price information.
The availability of price information varied by country and product, and in some cases
may be unreliable. On average, however, we believe the estimated change in ad valorem
equivalent tariffs reflect the level of liberalisation for each of the sectors modelled.
2.3 What determines the extent of the impact of FTAs on exports?
Five major elements affect the extent of changes in exports that arise from the
implementation of goods liberalisation under free trade agreements and are captured
in the economic models.
1. Size of the barrier
The size of the trade barrier that is removed by the FTA has a major impact on the
extent that changes occur. Removal of a tariff barrier leads to the first round impact of
decreasing the price paid by importers and increasing the price received by exporters.
This acts to increase demand for these products. So, the removal of tariffs would be
expected to increase exports and production of the good. The extent of the increase
depends on the magnitude of the tariff reduction. A large reduction in tariffs (resulting
for example from the complete removal of a high tariff) would lead to greater changes
in exports and production than a smaller reduction in tariffs (from the complete
removal of a small tariff or a decrease in the tariff rate). A free trade agreement will
not result in this first round effect on products for which there are no tariffs to be
3 The tariff elimination schedules for each of the agreements except for ChAFTA are publicly
available. The ChAFTA schedules were provided to the CIE by DFAT on a confidential basis
for this project.
4 While no approach to aggregating tariff rates is ideal, experience suggests using a simple
average provides a result that sufficiently represents tariff rates and their changes. Trade
weighted averages are problematic as the tariffs themselves affect historical trade volumes.
Production weighted averages may be relevant but have significant data challenges.
8 Economic benefits of Australia’s North Asian FTAs
www.TheCIE.com.au
removed, or the product line is excluded from the agreement.
2. Importance in partner’s trade flows
The exporting country’s initial share of imports to the importing FTA trading partner
will affect the degree of change in exports. If the share is small, then the relative
impact of the tariff reduction will be large. For a larger share, the tariff reduction will
lead to a relatively smaller change in exports.
3. Redistribution of resources
When the demand for export products changes there are flow-on impacts to other
sectors of the exporting country’s economy. In order to meet an increase in demand
for exports of one product, resources in the exporting country are redistributed
towards production of that product but away from other products. This will lead to a
decrease in production (and potentially exports) of these other products. The extent to
which production of other products decreases will depend on their pattern of input use
and the elasticity of demand for these products. The opposite will happen if demand
for exports of a product fall.
4. Income effects
Trade liberalisation that is trade creating will increase the income (GDP) of both
trading partners. Increased income will mean that the countries are able to increase
consumption and increase imports from all countries. This impact will be greater for
FTAs that lead to greater trade creation and therefore greater increases in GDP. It is
possible that countries outside the FTA increase exports of some products due to the
increase in imports by the countries within the FTA.
5. Substitution effects
Consumer preferences in the importing country will also determine the extent of
changes in trade flows. If there is a greater preference for products from the FTA
trading partner compared to other countries and products, the removal of tariffs will
have a greater impact on imports from that country. The importers will substitute
towards products from the FTA trading partner.
Economic benefits of Australia’s North Asian FTAs 9
www.TheCIE.com.au
2.4 Types of goods liberalisation offers
Immediate elimination
All tariffs and quotas on the import of these goods are removed immediately from the
commencement of the FTA.
Staged elimination
All tariffs on the import of these goods are removed over a number of years (up to 20
years) from the commencement of the FTA. At the end of the implementation period,
these goods enter tariff free.
Excluded
These goods are excluded from liberalisation; there is no change in the tariff or quota
treatment of these goods under the FTA.
Partial elimination
These goods see a reduction in tariff rates over the implementation period to varying
degrees. The tariff rate then remains unchanged.
Seasonal tariffs
These goods have different tariff treatment depending on the months of the year the
good is imported.
Country specific quotas
Where a country specific quota is granted, these goods enter duty free (or at a
concessional rate) up to the quota level. Beyond this point either the WTO tariff rate
quota or standard tariff rate applies. The country specific quotas are either a constant
volume or an increasing volume over time. Some goods under a country specific
quota are granted duty free access at some point during the implementation period.
Agricultural safeguard measures
Agricultural safeguard measures apply in addition to one of the treatments listed
above. The measures are voluntary and may be applied by the importing country.
Under the safeguard measures, when imports exceed a trigger level a higher tariff may
apply to the imports above the trigger level. Generally, the trigger level increases over
time and the tariff rate applied decreases or remains constant.
Modelling services liberalisation
Modelling service liberalisation under the North Asian FTAs is less straight forward than
goods liberalisation. Each agreement includes provisions for increased cooperation and
recognition, providing service providers of the trading partner with no less favourable
10 Economic benefits of Australia’s North Asian FTAs
www.TheCIE.com.au
treatment than national or other foreign service providers. However, understanding the
implications of these provisions and quantifying them in terms applicable to the
modelling framework is challenging.
Services outcomes in the North Asian FTAs
Under each of the North Asian FTAs, Australia agrees to generally provide trading
partners’ service providers with no less favourable treatment than service providers from
Australia or other countries and not to impose limitations on market access. This is with
the usual exceptions of listed non-conforming measures.
Beyond these general provisions, Australia agreed to establish a number of working
groups or committees to work through any issues that arise and generally encourage
enhanced trade in services.
Under KAFTA, Korea has provided Australia with access equivalent to that provided to
the US and EU. This includes access to the legal consulting services market, the ability to
supply specified financial services without the need for commercial presence, freedom to
transfer data in and out of Korea and access to the accountancy consulting services
market. They will also enjoy improved access in the telecommunications market, film
and television services market. Access will be guaranteed for education services,
environmental services, engineering services and other professional services. The
countries will also work toward mutual recognition of qualifications.
Under JAEPA, Japan has guaranteed market access in legal services and education
services. Australian companies will enjoy greater access in financial services, including
trade in wholesale securities transactions, wholesale investment advice and portfolio
management services. Telecommunications providers will benefit from greater regulatory
certainty and transparency and will have access to telecommunications networks and
services. The agreement with Japan also includes a framework to support mutual
recognition of qualifications. Any future liberalisation by Japan will be extended to
Australia so that Australian companies will maintain the highest level of access to the
Japanese markets.
ChAFTA provides Australian service providers with considerably greater access to the
Chinese market compared to competitor countries, reducing significant barriers to
services trade. Improved access is granted in legal services, telecommunications services,
tourism related services, health and aged care services, construction and engineering
services, manufacturing services (including services for mineral resources industries),
architecture and urban planning, transport and other services.5
Historical impacts of FTAs on services trade
As the service liberalisation provided for under these three agreements are similar to that
under other agreements, we look to changes in service imports between countries which
5 Further details on the services commitments for all agreements are available from DFAT
(www.fta.gov.au).
Economic benefits of Australia’s North Asian FTAs 11
www.TheCIE.com.au
have been subject to an FTA for some time as an indication of what may happen under
the new FTAs.
In particular, we can observe the annual average rate of growth in service trade between
existing FTA partners before and after the implementation of the FTAs. For example,
■ the annual average rate of growth in Australian exports of services (excluding travel)
to the US increased by more than a factor of four with the implementation of the US
FTA (from an annual average of 0.69 per cent between 2000 and 2005, to 4.9 per cent
from 2005 to 2013).6
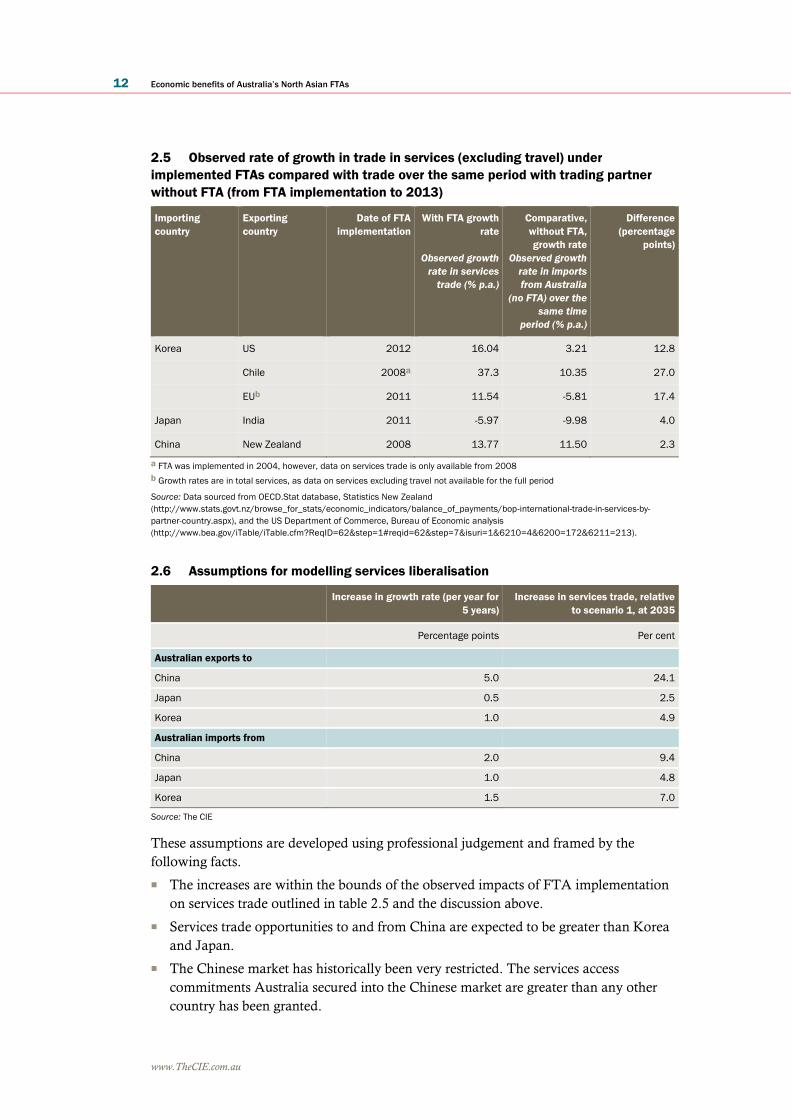
A further assessment can be made by comparing the growth in services trade between a
pair of countries with an FTA, to growth in services trade between countries that do not
have an FTA in place over the same period. This comparison (see table 2.5) seeks to
remove the effect of variations in economic activity between time periods.
■ For example, over the period from 2008 to 2013, Chinese imports of services
(excluding travel) from New Zealand increased at an annual average rate of 13.8 per
cent. Over the same period, imports from Australia grew at an annual average rate of
11.5 per cent. This difference of 2.3 per cent a year could be attributed to the
China-NZ FTA.
■ Moreover, in the period since 2012 when the US implemented an FTA with Korea,
Korean imports of services (excluding travel) from the US grew at an annual rate of
16.0 per cent. Over the same period, imports from Australia grew at an average
annual rate of 3.2 per cent (a difference exceeding a four-fold increase).
Additional examples are presented in table 2.5. Growth in trade is generally higher with
an FTA and the rate of growth ranges from being 2.3 percentage points greater to a five-
fold increase.
Assumed impacts of services trade liberalisation
The FTA outcomes regarding services trade promote an increase in services trade
between Australia and its North Asian trading partners. This improvement is expected to
be most significant in the case of China and less so for Korea and Japan.
To represent this increase in the model we have assumed a higher growth rate of
Australian imports and exports of services from and to China, Japan and Korea over the
period to 2020 after which it is expected that Australia’s competitive advantage under
ChAFTA would end as China concludes other FTAs. Table 2.6 outlines the assumed
increase in the growth rate in the initial period, and the resulting change in services,
compared to the baseline, at 2035.
6 Data sourced from OECD.Stat database.
12 Economic benefits of Australia’s North Asian FTAs
www.TheCIE.com.au
2.5 Observed rate of growth in trade in services (excluding travel) under
implemented FTAs compared with trade over the same period with trading partner
without FTA (from FTA implementation to 2013)
Importing
country
Exporting
country
Date of FTA
implementation
With FTA growth
rate
Observed growth
rate in services
trade (% p.a.)
Comparative,
without FTA,
growth rate
Observed growth
rate in imports
from Australia
(no FTA) over the
same time
period (% p.a.)
Difference
(percentage
points)
Korea US 2012 16.04 3.21 12.8
Chile 2008a 37.3 10.35 27.0
EUb 2011 11.54 -5.81 17.4
Japan India 2011 -5.97 -9.98 4.0
China New Zealand 2008 13.77 11.50 2.3
a FTA was implemented in 2004, however, data on services trade is only available from 2008
b Growth rates are in total services, as data on services excluding travel not available for the full period
Source: Data sourced from OECD.Stat database, Statistics New Zealand
(http://www.stats.govt.nz/browse_for_stats/economic_indicators/balance_of_payments/bop-international-trade-in-services-by-
partner-country.aspx), and the US Department of Commerce, Bureau of Economic analysis
(http://www.bea.gov/iTable/iTable.cfm?ReqID=62&step=1#reqid=62&step=7&isuri=1&6210=4&6200=172&6211=213).
2.6 Assumptions for modelling services liberalisation
Increase in growth rate (per year for
5 years)
Increase in services trade, relative
to scenario 1, at 2035
Percentage points Per cent
Australian exports to
China 5.0 24.1
Japan 0.5 2.5
Korea 1.0 4.9
Australian imports from
China 2.0 9.4
Japan 1.0 4.8
Korea 1.5 7.0
Source: The CIE
These assumptions are developed using professional judgement and framed by the
following facts.
■ The increases are within the bounds of the observed impacts of FTA implementation
on services trade outlined in table 2.5 and the discussion above.
■ Services trade opportunities to and from China are expected to be greater than Korea
and Japan.
■ The Chinese market has historically been very restricted. The services access
commitments Australia secured into the Chinese market are greater than any other
country has been granted.
Economic benefits of Australia’s North Asian FTAs 13
www.TheCIE.com.au
■ The assumed increase in growth rates are proportional to observed historical growth
rates in services trade. The assumed increases are between 15 and 25 per cent of the
observed historical growth rate (with the exception of Australian services exports to
Japan which have a very low growth rate).
Under the assumed temporarily higher growth rate, services exports to China would be
24.1 per cent higher in 2035 than they would otherwise be under the baseline. If the
growth rate was assumed to remain at the higher rate over the entire projection period,
services exports would 147.3 per cent greater in 2035 than otherwise, and if the growth
rate were assumed to double, services would be 1081 per cent greater relative to the
baseline.
Australia’s imports of services from North Asia are also expected to increase as a result of
the FTAs, although not by as much as service exports. This increase in services imports is
expected to come through improved recognition of qualifications, and improvements in
conditions brought about through working groups. Furthermore, the general increased
interactions between the trading partners is expected to lead to an increase in services
trade. For example, given the current rate of growth in services imports from China, and
an assumed elevated growth rate (by 2 percentage points) for 5 years, Australia’s services
imports from China in 2035 are assumed to be 9.4 per cent higher than would be the case
without ChAFTA (see table 2.6).
Investment liberalisation
The FTAs see some relaxation in Australia’s investment conditions for Chinese,
Japanese and Korean investors. The three agreements provide broadly the same
provisions for each trading partner. The agreements set out general clauses that ensure,
among other things, that:
■ the treatment of investments and investors from the partner country is no less
favourable than the treatment provided to investments and investors from its own
country or any other country;
■ covered investments from the partner country will be afforded fair and equitable
treatment and full protection and security; and
■ in the cases of Korea and China, investments and investors will have the right to
initiate investor-state dispute settlement proceedings in accordance with international
arbitration rules, including those under the International Centre for Settlement of
Investment Disputes Convention.
The agreements also specify non-conforming measures. Many of these are unchanged
from current arrangements that apply. Others, outlined below, represent liberation of
investment restrictions.
■ Australia will raise the screening threshold for private investments in non-sensitive
sectors from $252 million to $1094 million.
■ Australia will raise the screening threshold for investments in developed commercial
non-residential real estate from $55 million to $1094 million.
14 Economic benefits of Australia’s North Asian FTAs
www.TheCIE.com.au
Australia will retain the ability to screen investments in sensitive sectors at lower levels,
including media, telecommunications and defence related industries as well as all
investment proposals from state-owned enterprises and other foreign government
investors. Under the North Asian FTAs, the Australian government reserved the policy
space to screen proposals for North Asian investment in agricultural land of over $15
million and agribusiness of over $53 million.
In summary, liberalisation of Australia’s inward foreign direct investment arrangements
amounts to an increase in the screening thresholds for private investment in most sectors.
This makes Australia a more attractive destination of capital from Korea, Japan and
China. Despite this improvement in the conditions and reductions in regulatory burden
for North Asian investors, we note that:
■ screening of investments is not a significant barrier to FDI as very few applications are
rejected7; and
■ the proportion of total FDI affected (that is, from Korea, Japan or China and of the
relevant value and in the relevant sectors) is small.
Given the difficulty in using models to capture the long term confidence effects of closer
relations associated with the investment changes, we have not imposed any changes in
Australian investment conditions within the model simulations.
Similarly, while Korea, Japan and China have not made significant changes to FDI
conditions for Australian investors, the difficulty in using models to capture long term
confidence effects means that we have not imposed any changes on partner country
investment conditions within the model simulations.
The FDI flows between Australia and its North Asian trading partners may, however,
change as a result of the trade agreements through indirect means. For example,
liberalisation of services trade conditions may lead to increased investment by allowing
greater commercial presence. This is captured in the modelling through the services
liberalisation assumptions.
Modelling framework
The CIE has undertaken the analysis for the FTAs using the GTAP and CIE G Cubed
models. These are both global computable general equilibrium (CGE) models but have
different model structures that enable them to provide insights into the impacts of the
North Asian FTAs in slightly different ways. The GTAP model is a comparative static
model and therefore provides results for a single year, 2035, once the FTAs have been
fully implemented. CIE G Cubed is a dynamic model that traces the impacts of the FTAs
over the implementation period. Due to its dynamic representation of the economy, the
7 In 2012-13, 13,322 applications to the Foreign Investment Review Board were considered. Of
these, 12,731 were approved, 466 withdrawn and 145 exempt. No applications were rejected in
2012-13. In the preceding 5 years, 76 applications (from a total of 41,357 applications
considered) were rejected. The vast majority of applications rejected in the past have been
investments in real estate. (Figures from FIRB 2012-13 Annual report,
http://www.firb.gov.au/content/Publications/AnnualReports/2012-2013/05_Chapter_2.asp)
Economic benefits of Australia’s North Asian FTAs 15
www.TheCIE.com.au
CIE G Cubed model also provides indicators of the impact of the scenarios on
employment.
Both models, however, estimate changes in relative prices brought about by the FTAs
and estimate how these changes affect the level of demand for goods and services, and
income received from the production of goods and services. Flow-on impacts to the
economy from trade liberalisation may also include changes in resource use,
productivity, terms of trade, GDP and capital. The models incorporate all of these effects
and interactions between actors in the economy to determine the net effect of the FTAs.
Box 2.3 explains the different means by which FTAs impact on trade flows.
The modelling results presented in the report are described as percentage changes relative
to a baseline (or business as usual) scenario. That is, they compare the expected level of
GDP or exports at a future point in time under the FTA scenario with the expected level
at the same point in time had the FTAs not been in place. Therefore, a result that states
the FTA leads to a decline in exports of a particular commodity does not mean a decline
from the current level of exports. If exports were expected to increase over time without
the FTA, they still may increase over time with the FTA but to a lesser extent.8
The magnitude of changes (in the year 2035) differ slightly between the two models.
Some results reported in this report are from GTAP, others are from CIE G Cubed and
so results may not appear completely consistent between some tables and charts (the
model used is noted below each table and chart). Despite these differences, the results of
the two models are consistent in terms of the direction and order of magnitude of
changes.
GTAP
GTAP is a publicly available modelling framework and database managed from the
Center for Global Trade Analysis at Purdue University. The latest GTAP database
(version 8) forms the data component of both the GTAP model and the CIE G Cubed
model used in this report.
The standard GTAP model is a multiregion, multisector, CGE model, with perfect
competition and constant returns to scale. Innovative aspects of this model include:
■ the treatment of private household preferences using the non-homothetic CDE
functional form
■ the explicit treatment of international trade and transport margins. Bilateral trade is
handled via the Armington assumption
■ a global banking sector which intermediates between global savings and consumption.
The GTAP model also gives users a wide range of closure options, including
unemployment, tax revenue replacement and fixed trade balance closures, and a
selection of partial equilibrium closures (which facilitate comparison of results to studies
based on partial equilibrium assumptions). For this project, the GTAP model is used to
8 Further explanation of this point is provided on page 5.
16 Economic benefits of Australia’s North Asian FTAs
www.TheCIE.com.au
compare the world economy under current tariff rates with the state of the economy
under tariff rates after FTAs are fully implemented.
CIE G Cubed
The CIE G Cubed model is a more detailed specification of the G Cubed suite of models
developed by Professor Warwick McKibbin and Peter Wilcoxen. G Cubed is a world
model with substantial regional disaggregation and sectoral detail. Countries and regions
are linked both temporally and intertemporally through trade and financial markets.
G Cubed contains a strong foundation for analysis of both short run macroeconomic
policy analysis as well as long run growth consideration of alternative macroeconomic
policies.
Key features of the CIE G Cubed model are:
■ detailed identification of sectors and countries/regions comparable to the GTAP
database
■ identification of trade flows between countries/regions
■ identification of investment flows between countries/regions
■ incorporation of an integrated financial sector (comprising money, bonds, interest
rates, lending, borrowing, expectations, financial flows, and wealth)
■ full dynamics that can capture the time path of adjustment for each of the
economies/regions modelled
■ consumers and producers are allowed to borrow and lend money over time, with
decisions influenced by the return on capital versus other assets
■ inclusion of adjustment costs and expectations.
The CIE G Cubed model is used in this project to show the dynamic impacts of the FTAs
over the implementation period.
Economic benefits of Australia’s North Asian FTAs 17
www.TheCIE.com.au
3 Impact of other FTAs on Australia
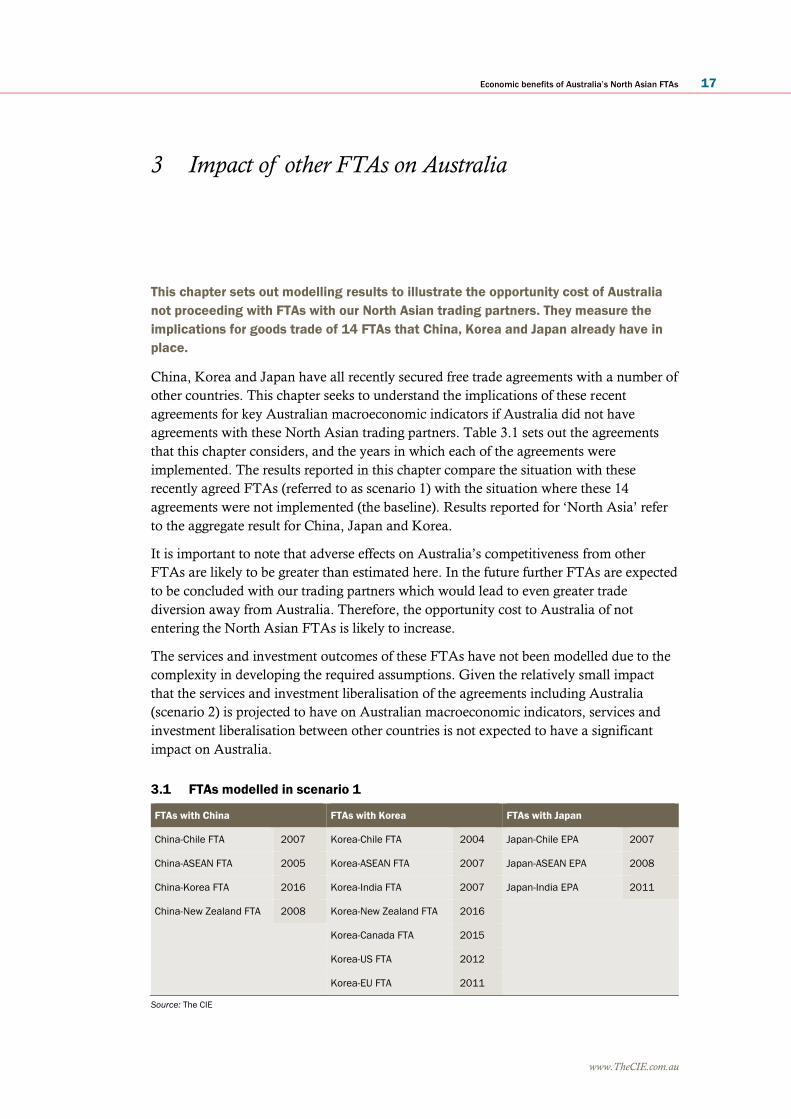
This chapter sets out modelling results to illustrate the opportunity cost of Australia
not proceeding with FTAs with our North Asian trading partners. They measure the
implications for goods trade of 14 FTAs that China, Korea and Japan already have in
place.
China, Korea and Japan have all recently secured free trade agreements with a number of
other countries. This chapter seeks to understand the implications of these recent
agreements for key Australian macroeconomic indicators if Australia did not have
agreements with these North Asian trading partners. Table 3.1 sets out the agreements
that this chapter considers, and the years in which each of the agreements were
implemented. The results reported in this chapter compare the situation with these
recently agreed FTAs (referred to as scenario 1) with the situation where these 14
agreements were not implemented (the baseline). Results reported for ‘North Asia’ refer
to the aggregate result for China, Japan and Korea.
It is important to note that adverse effects on Australia’s competitiveness from other
FTAs are likely to be greater than estimated here. In the future further FTAs are expected
to be concluded with our trading partners which would lead to even greater trade
diversion away from Australia. Therefore, the opportunity cost to Australia of not
entering the North Asian FTAs is likely to increase.
The services and investment outcomes of these FTAs have not been modelled due to the
complexity in developing the required assumptions. Given the relatively small impact
that the services and investment liberalisation of the agreements including Australia
(scenario 2) is projected to have on Australian macroeconomic indicators, services and
investment liberalisation between other countries is not expected to have a significant
impact on Australia.
3.1 FTAs modelled in scenario 1
FTAs with China FTAs with Korea FTAs with Japan
China-Chile FTA 2007 Korea-Chile FTA 2004 Japan-Chile EPA 2007
China-ASEAN FTA 2005 Korea-ASEAN FTA 2007 Japan-ASEAN EPA 2008
China-Korea FTA 2016 Korea-India FTA 2007 Japan-India EPA 2011
China-New Zealand FTA 2008 Korea-New Zealand FTA 2016
Korea-Canada FTA 2015
Korea-US FTA 2012
Korea-EU FTA 2011
Source: The CIE
18 Economic benefits of Australia’s North Asian FTAs
www.TheCIE.com.au
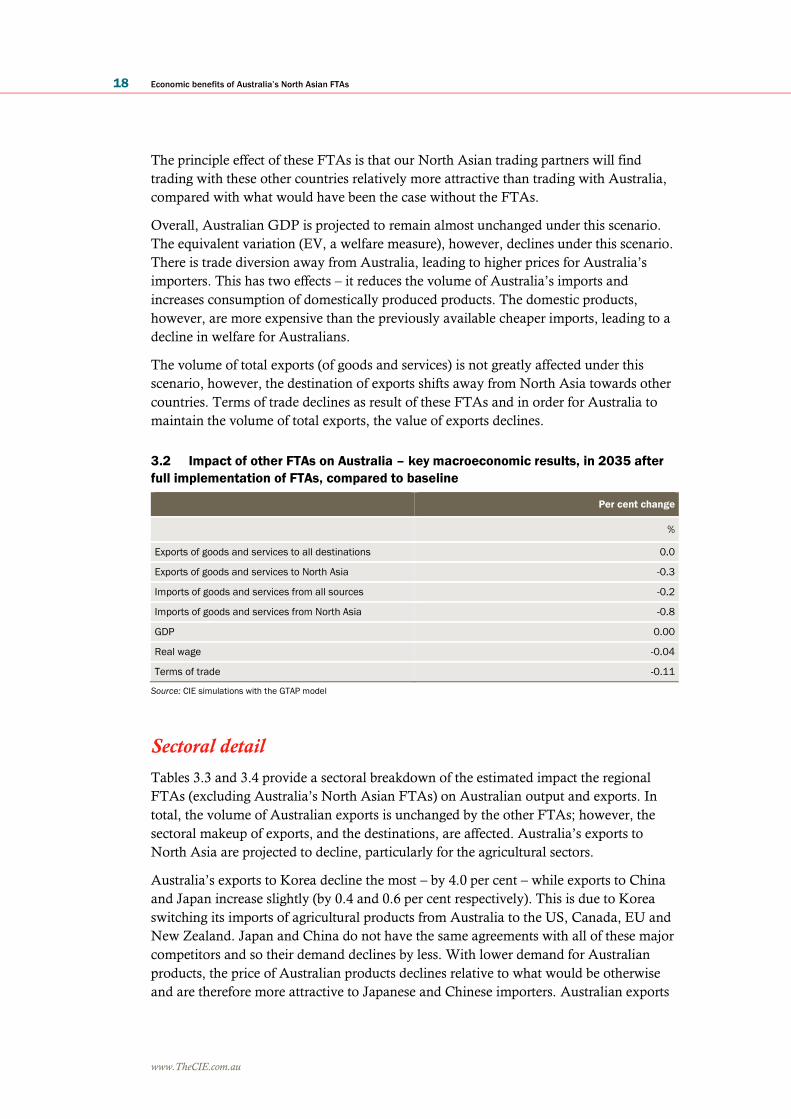
The principle effect of these FTAs is that our North Asian trading partners will find
trading with these other countries relatively more attractive than trading with Australia,
compared with what would have been the case without the FTAs.
Overall, Australian GDP is projected to remain almost unchanged under this scenario.
The equivalent variation (EV, a welfare measure), however, declines under this scenario.
There is trade diversion away from Australia, leading to higher prices for Australia’s
importers. This has two effects – it reduces the volume of Australia’s imports and
increases consumption of domestically produced products. The domestic products,
however, are more expensive than the previously available cheaper imports, leading to a
decline in welfare for Australians.
The volume of total exports (of goods and services) is not greatly affected under this
scenario, however, the destination of exports shifts away from North Asia towards other
countries. Terms of trade declines as result of these FTAs and in order for Australia to
maintain the volume of total exports, the value of exports declines.
3.2 Impact of other FTAs on Australia – key macroeconomic results, in 2035 after
full implementation of FTAs, compared to baseline
Per cent change
%
Exports of goods and services to all destinations 0.0
Exports of goods and services to North Asia -0.3
Imports of goods and services from all sources -0.2
Imports of goods and services from North Asia -0.8
GDP 0.00
Real wage -0.04
Terms of trade -0.11
Source: CIE simulations with the GTAP model
Sectoral detail
Tables 3.3 and 3.4 provide a sectoral breakdown of the estimated impact the regional
FTAs (excluding Australia’s North Asian FTAs) on Australian output and exports. In
total, the volume of Australian exports is unchanged by the other FTAs; however, the
sectoral makeup of exports, and the destinations, are affected. Australia’s exports to
North Asia are projected to decline, particularly for the agricultural sectors.
Australia’s exports to Korea decline the most – by 4.0 per cent – while exports to China
and Japan increase slightly (by 0.4 and 0.6 per cent respectively). This is due to Korea
switching its imports of agricultural products from Australia to the US, Canada, EU and
New Zealand. Japan and China do not have the same agreements with all of these major
competitors and so their demand declines by less. With lower demand for Australian
products, the price of Australian products declines relative to what would be otherwise
and are therefore more attractive to Japanese and Chinese importers. Australian exports
Economic benefits of Australia’s North Asian FTAs 19
www.TheCIE.com.au
to other countries increase as Australian exporters re-direct products to other countries
but receive lower prices.
The sector most adversely affected (in terms of declines in output and exports) under this
scenario is the meat products sector (beef and sheep meat).
Australian imports decline from each of the North Asian economies (by between 0.3 and
1.6 per cent). These declines are associated with manufactured goods (such as wearing
apparel and chemical, rubber and plastic products). The free trade agreements mean that
North Asian exporters find more favourable prices with their FTA partners than
Australia (compared to where there are no FTAs), reducing their trade with Australia.
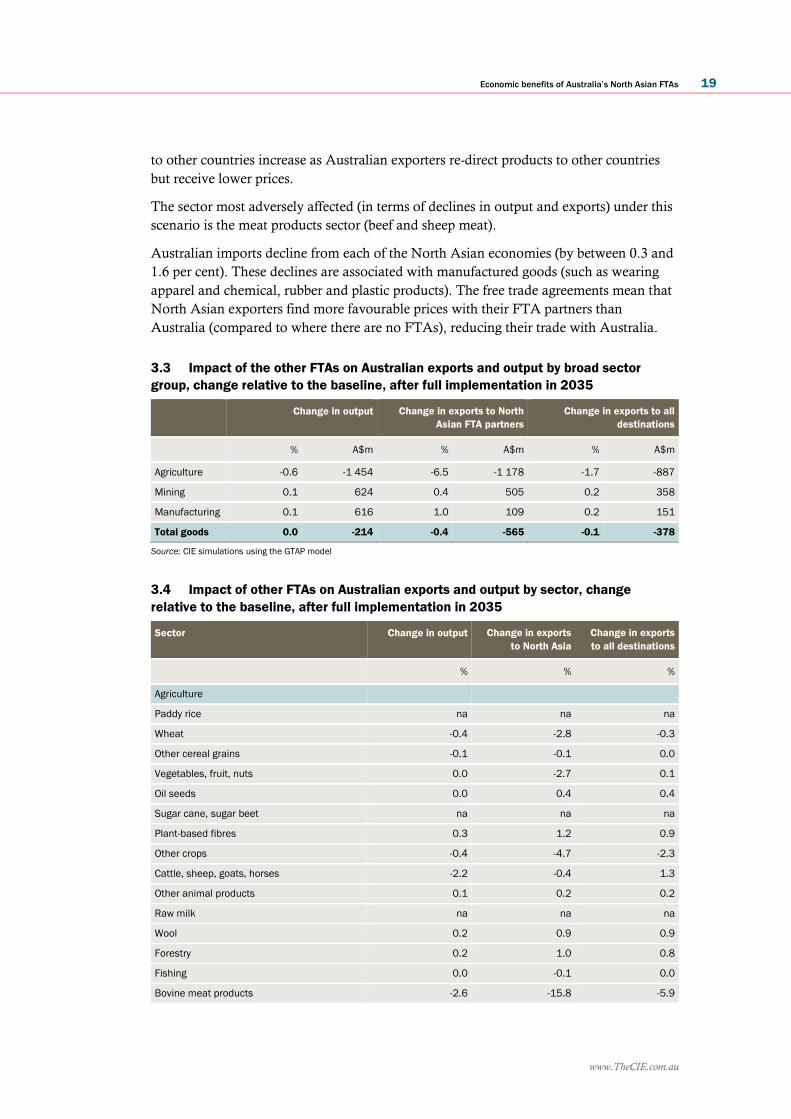
3.3 Impact of the other FTAs on Australian exports and output by broad sector
group, change relative to the baseline, after full implementation in 2035
Change in output Change in exports to North
Asian FTA partners
Change in exports to all
destinations
% A$m % A$m % A$m
Agriculture -0.6 -1 454 -6.5 -1 178 -1.7 -887
Mining 0.1 624 0.4 505 0.2 358
Manufacturing 0.1 616 1.0 109 0.2 151
Total goods 0.0 -214 -0.4 -565 -0.1 -378
Source: CIE simulations using the GTAP model
3.4 Impact of other FTAs on Australian exports and output by sector, change
relative to the baseline, after full implementation in 2035
Sector Change in output Change in exports
to North Asia
Change in exports
to all destinations
% % %
Agriculture
Paddy rice na na na
Wheat -0.4 -2.8 -0.3
Other cereal grains -0.1 -0.1 0.0
Vegetables, fruit, nuts 0.0 -2.7 0.1
Oil seeds 0.0 0.4 0.4
Sugar cane, sugar beet na na na
Plant-based fibres 0.3 1.2 0.9
Other crops -0.4 -4.7 -2.3
Cattle, sheep, goats, horses -2.2 -0.4 1.3
Other animal products 0.1 0.2 0.2
Raw milk na na na
Wool 0.2 0.9 0.9
Forestry 0.2 1.0 0.8
Fishing 0.0 -0.1 0.0
Bovine meat products -2.6 -15.8 -5.9
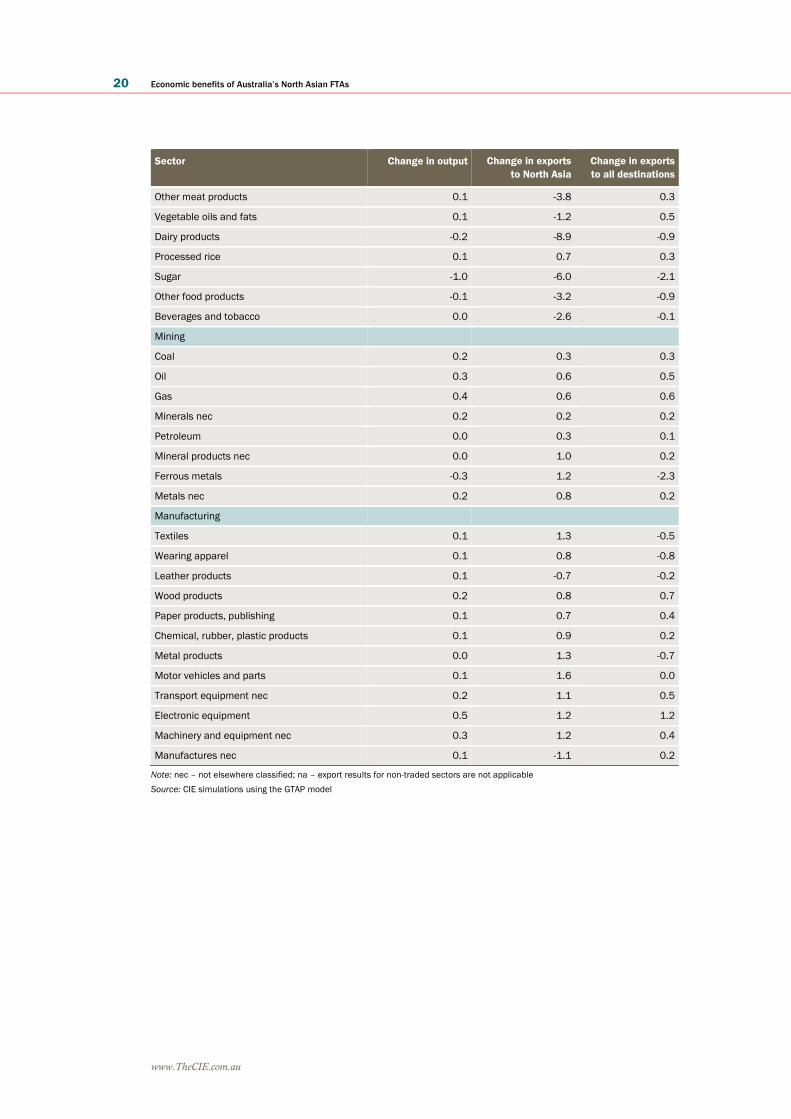
20 Economic benefits of Australia’s North Asian FTAs
www.TheCIE.com.au
Sector Change in output Change in exports
to North Asia
Change in exports
to all destinations
Other meat products 0.1 -3.8 0.3
Vegetable oils and fats 0.1 -1.2 0.5
Dairy products -0.2 -8.9 -0.9
Processed rice 0.1 0.7 0.3
Sugar -1.0 -6.0 -2.1
Other food products -0.1 -3.2 -0.9
Beverages and tobacco 0.0 -2.6 -0.1
Mining
Coal 0.2 0.3 0.3
Oil 0.3 0.6 0.5
Gas 0.4 0.6 0.6
Minerals nec 0.2 0.2 0.2
Petroleum 0.0 0.3 0.1
Mineral products nec 0.0 1.0 0.2
Ferrous metals -0.3 1.2 -2.3
Metals nec 0.2 0.8 0.2
Manufacturing
Textiles 0.1 1.3 -0.5
Wearing apparel 0.1 0.8 -0.8
Leather products 0.1 -0.7 -0.2
Wood products 0.2 0.8 0.7
Paper products, publishing 0.1 0.7 0.4
Chemical, rubber, plastic products 0.1 0.9 0.2
Metal products 0.0 1.3 -0.7
Motor vehicles and parts 0.1 1.6 0.0
Transport equipment nec 0.2 1.1 0.5
Electronic equipment 0.5 1.2 1.2
Machinery and equipment nec 0.3 1.2 0.4
Manufactures nec 0.1 -1.1 0.2
Note: nec – not elsewhere classified; na – export results for non-traded sectors are not applicable
Source: CIE simulations using the GTAP model
Economic benefits of Australia’s North Asian FTAs 21
www.TheCIE.com.au
4 Impact of Australia’s North Asian FTAs – goods
liberalisation
This chapter sets out modelling results to illustrate the impact of the goods
liberalisation under the three free trade agreements Australia has recently signed or
concluded with China, Korea and Japan. This scenario assumes all the other FTAs
(included in scenario 1) are also in place. The results are compared to scenario 1
where other countries have pursued FTAs in North Asia but Australia has not.
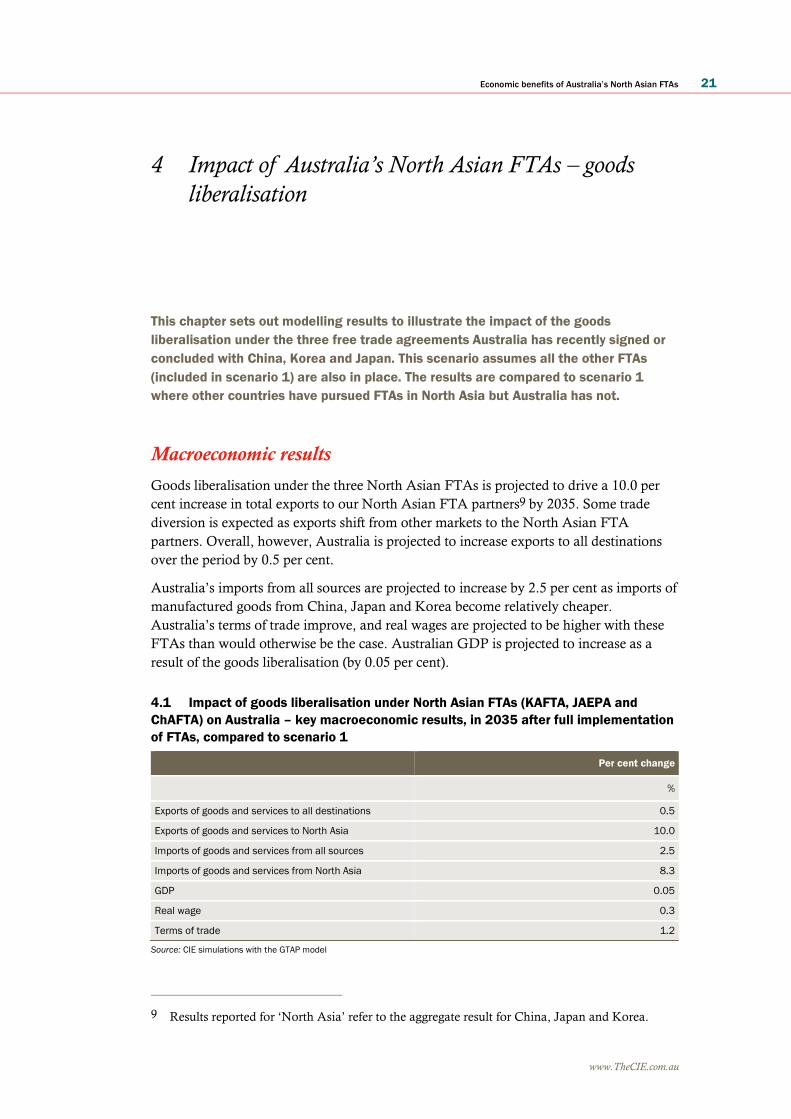
Macroeconomic results
Goods liberalisation under the three North Asian FTAs is projected to drive a 10.0 per
cent increase in total exports to our North Asian FTA partners9 by 2035. Some trade
diversion is expected as exports shift from other markets to the North Asian FTA
partners. Overall, however, Australia is projected to increase exports to all destinations
over the period by 0.5 per cent.
Australia’s imports from all sources are projected to increase by 2.5 per cent as imports of
manufactured goods from China, Japan and Korea become relatively cheaper.
Australia’s terms of trade improve, and real wages are projected to be higher with these
FTAs than would otherwise be the case. Australian GDP is projected to increase as a
result of the goods liberalisation (by 0.05 per cent).
4.1 Impact of goods liberalisation under North Asian FTAs (KAFTA, JAEPA and
ChAFTA) on Australia – key macroeconomic results, in 2035 after full implementation
of FTAs, compared to scenario 1
Per cent change
%
Exports of goods and services to all destinations 0.5
Exports of goods and services to North Asia 10.0
Imports of goods and services from all sources 2.5
Imports of goods and services from North Asia 8.3
GDP 0.05
Real wage 0.3
Terms of trade 1.2
Source: CIE simulations with the GTAP model
9 Results reported for ‘North Asia’ refer to the aggregate result for China, Japan and Korea.
22 Economic benefits of Australia’s North Asian FTAs
www.TheCIE.com.au
Sectoral details
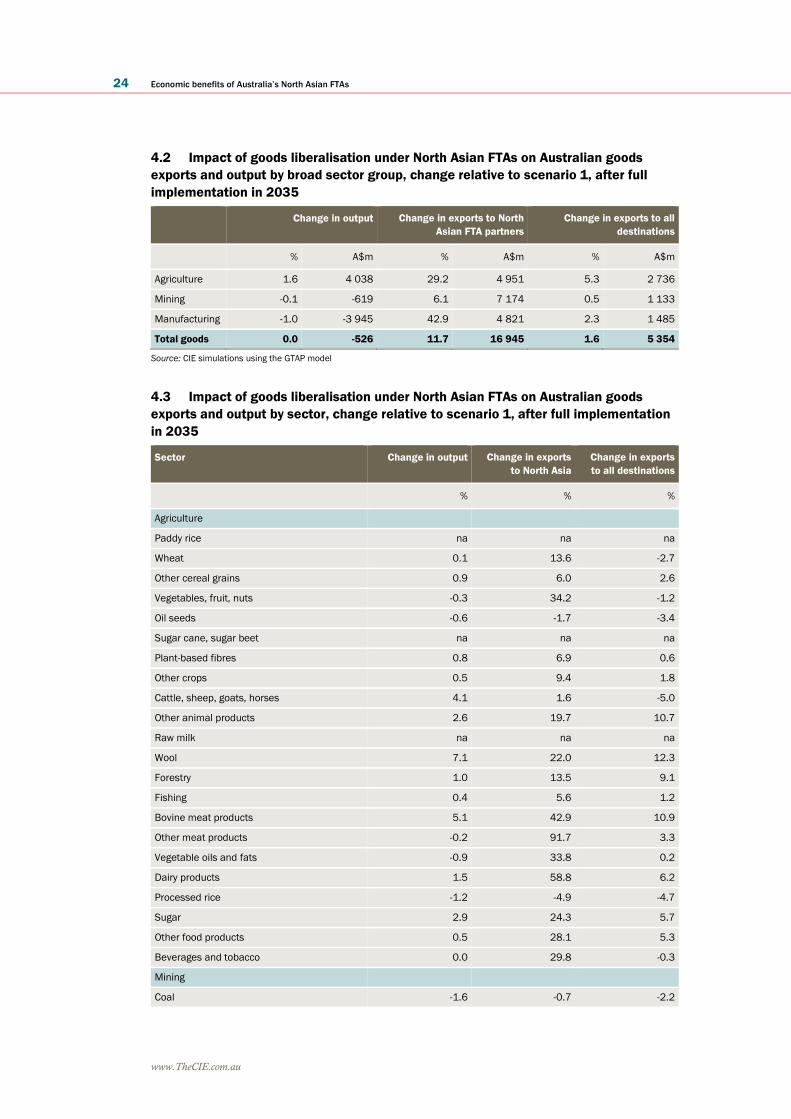
Table 4.2 and 4.3 provide sectoral detail for the goods liberalisation under scenario 2 –
Australia’s North Asian FTAs. The direction and magnitude of the changes in exports
for each sector will be driven by the factors outlined in box 2.3. The following section
explores some examples and describes the key factors at work.
Agriculture
Lower tariff barriers and higher country-specific quotas for Australian agricultural
products in the North Asian economies are projected to lead to increased exports and
production. Agricultural output is projected to be 1.6 per cent higher in 2035 than would
be the case if the FTAs were not pursued.
Total agricultural exports to all destinations are projected to increase by 5.3 per cent by
2035. The increase in agricultural exports is driven largely by increased wool, meat and
dairy product exports. These sectors are also expected to see associated increases in
production (although in percentage terms the output effect will appear smaller). Increases
in meat and dairy exports are largely due to significant reductions in trade barriers in
these sectors.
Increases in wool and cotton exports are partly driven by Australia’s own tariff
liberalisation (as well as tariff liberalisation in North Asia). Reductions in Australian
tariffs on wearing apparel, for example, increases demand for these products from China
and subsequently leads to increased Chinese demand for the raw inputs (wool and
cotton) from Australia.
The vegetables, fruit and nuts sector experiences a significant reduction in tariff barriers
under the three FTAs. This leads to an increase in exports to North Asia. However, at
the same time there are resource reallocation effects within the Australian economy. The
sector faces cost pressures as other sectors of the economy also demand greater resources,
putting downward pressure on output. As the share of production that is destined for the
North Asian markets is relatively small, the effects of resource allocations dominate those
of the increased North Asian demand. Overall, the result is lower output (than would be
the case without the North Asian FTAs) and lower total exports. The remaining exports
are redirected towards the more profitable North Asian markets.
Output from the oilseeds sector is also projected to decline compared to scenario 1. This
is also mostly due to reallocation of resources within the Australian economy. A
significant share of Australia’s oilseed exports are to Japan, but the tariff reductions
offered by Japan under JAEPA are limited. Therefore, the tariff liberalisation does not
drive a significant increase in export demand for Australian oilseeds. Income effects and
expansion of domestic oilseed-consuming sectors lead to a limited increase in domestic
demand, however, the major consumers of oilseeds (vegetable oils and fats) similarly
does not see an increase in output as a result of the FTAs. Consumption of oilseeds in
other sectors (for example the bovine meat products sector) is limited. Overall, therefore,
with limited increases in demand for oilseeds, the resource reallocation effects (higher
real wages) dominate and output (and exports) of the sector declines by 0.6 per cent (3.4
per cent) compared to without the North Asian FTAs.
Economic benefits of Australia’s North Asian FTAs 23
www.TheCIE.com.au
Australian imports of agricultural products are also projected to increase, however this is
off a small base and is not as significant as the increase in exports. The increases in
agricultural imports are mostly in processed food products.
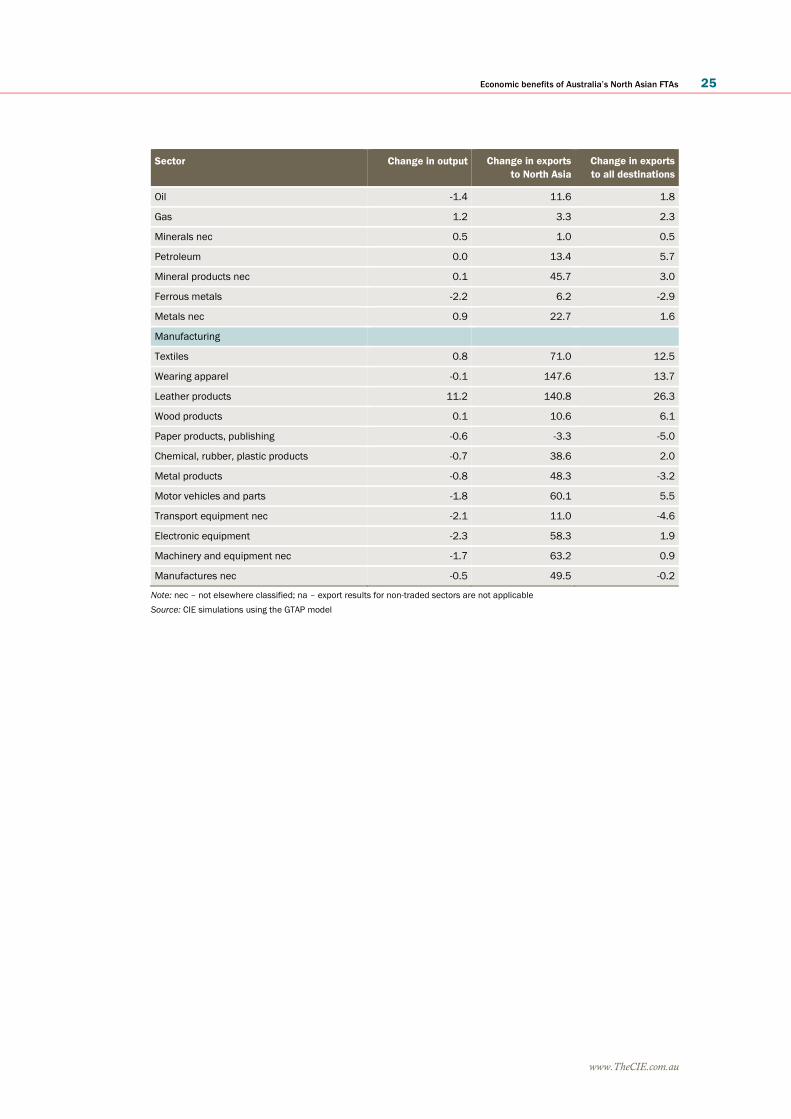
Mining and manufacturing
Manufacturing output is projected to decline as manufactured products from North Asia
become cheaper and imports increase. A greater share of Australia’s domestic
manufactured products is exported as consumption of domestic products is replaced with
cheaper imports.
Gaining a clear understanding of the impacts on key manufacturing sectors is
complicated slightly by the fact that, for some sectors, key inputs are manufactured
products from the same sector. This is the case for the chemicals, rubber and plastic
products sector and the motor vehicles and parts sector.
Australia lowered its tariffs on North Asian chemicals, rubber and plastics, leading to
cheaper imports for Australian consumers. The firms that benefit most from lower cost
inputs are those in the chemical, rubber and plastic sectors (which use chemical, rubber,
plastic inputs to produce different chemical, rubber, plastic products). This will have
conflicting effects on the sector, cheaper imports lowers demand for some domestic
products while the output in other parts of the sector will increase from the access to
cheaper inputs. At the same time, a reduction in tariffs in the North Asian countries
drives an increase in Australian exports of chemical, rubber and plastic products to these
countries, which increases demand for some Australian products but also demand for
imported inputs. Overall, the result is an increase in Australian exports of chemical,
rubber and plastic products but a decline in output from the sector as a greater proportion
of chemicals, rubber and plastic products consumed in Australia are imported. Motor
vehicles and parts sectors sees similar impacts.
Output and exports of the coal sector are projected to grow by less under scenario 2 than
projected under scenario 1 without the FTAs. This is driven by limited tariff reductions
offered by the North Asian partners and the higher real wage (that is, effects of resource
reallocations within the Australian economy). The tariff reductions under the three FTAs
for the coal sector are small in comparison to other sectors due to low existing tariff levels
(between 0.4 and 4 per cent for coal compared to 4 to 17 per cent for bovine meat
products and 5 to 20 per cent for dairy products). Resource redistribution to these sectors
with greater changes in demand for products will negatively affect the coal sector leading
to forecast output and exports being lower than under scenario 1.
24 Economic benefits of Australia’s North Asian FTAs
www.TheCIE.com.au
4.2 Impact of goods liberalisation under North Asian FTAs on Australian goods
exports and output by broad sector group, change relative to scenario 1, after full
implementation in 2035
Change in output Change in exports to North
Asian FTA partners
Change in exports to all
destinations
% A$m % A$m % A$m
Agriculture 1.6 4 038 29.2 4 951 5.3 2 736
Mining -0.1 -619 6.1 7 174 0.5 1 133
Manufacturing -1.0 -3 945 42.9 4 821 2.3 1 485
Total goods 0.0 -526 11.7 16 945 1.6 5 354
Source: CIE simulations using the GTAP model
4.3 Impact of goods liberalisation under North Asian FTAs on Australian goods
exports and output by sector, change relative to scenario 1, after full implementation
in 2035
Sector Change in output Change in exports
to North Asia
Change in exports
to all destinations
% % %
Agriculture
Paddy rice na na na
Wheat 0.1 13.6 -2.7
Other cereal grains 0.9 6.0 2.6
Vegetables, fruit, nuts -0.3 34.2 -1.2
Oil seeds -0.6 -1.7 -3.4
Sugar cane, sugar beet na na na
Plant-based fibres 0.8 6.9 0.6
Other crops 0.5 9.4 1.8
Cattle, sheep, goats, horses 4.1 1.6 -5.0
Other animal products 2.6 19.7 10.7
Raw milk na na na
Wool 7.1 22.0 12.3
Forestry 1.0 13.5 9.1
Fishing 0.4 5.6 1.2
Bovine meat products 5.1 42.9 10.9
Other meat products -0.2 91.7 3.3
Vegetable oils and fats -0.9 33.8 0.2
Dairy products 1.5 58.8 6.2
Processed rice -1.2 -4.9 -4.7
Sugar 2.9 24.3 5.7
Other food products 0.5 28.1 5.3
Beverages and tobacco 0.0 29.8 -0.3
Mining
Coal -1.6 -0.7 -2.2
Economic benefits of Australia’s North Asian FTAs 25
www.TheCIE.com.au
Sector Change in output Change in exports
to North Asia
Change in exports
to all destinations
Oil -1.4 11.6 1.8
Gas 1.2 3.3 2.3
Minerals nec 0.5 1.0 0.5
Petroleum 0.0 13.4 5.7
Mineral products nec 0.1 45.7 3.0
Ferrous metals -2.2 6.2 -2.9
Metals nec 0.9 22.7 1.6
Manufacturing
Textiles 0.8 71.0 12.5
Wearing apparel -0.1 147.6 13.7
Leather products 11.2 140.8 26.3
Wood products 0.1 10.6 6.1
Paper products, publishing -0.6 -3.3 -5.0
Chemical, rubber, plastic products -0.7 38.6 2.0
Metal products -0.8 48.3 -3.2
Motor vehicles and parts -1.8 60.1 5.5
Transport equipment nec -2.1 11.0 -4.6
Electronic equipment -2.3 58.3 1.9
Machinery and equipment nec -1.7 63.2 0.9
Manufactures nec -0.5 49.5 -0.2
Note: nec – not elsewhere classified; na – export results for non-traded sectors are not applicable
Source: CIE simulations using the GTAP model
26 Economic benefits of Australia’s North Asian FTAs
www.TheCIE.com.au
5 Impact of Australia’s North Asian FTAs – services
liberalisation
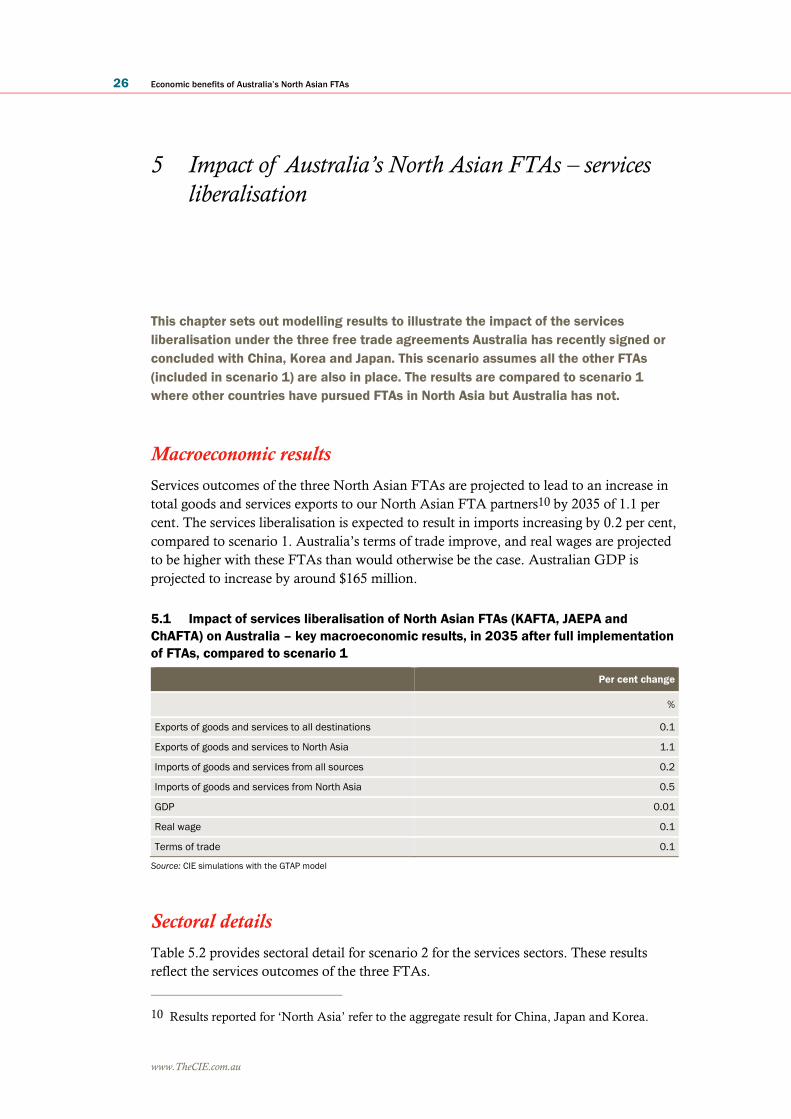
This chapter sets out modelling results to illustrate the impact of the services
liberalisation under the three free trade agreements Australia has recently signed or
concluded with China, Korea and Japan. This scenario assumes all the other FTAs
(included in scenario 1) are also in place. The results are compared to scenario 1
where other countries have pursued FTAs in North Asia but Australia has not.
Macroeconomic results
Services outcomes of the three North Asian FTAs are projected to lead to an increase in
total goods and services exports to our North Asian FTA partners10 by 2035 of 1.1 per
cent. The services liberalisation is expected to result in imports increasing by 0.2 per cent,
compared to scenario 1. Australia’s terms of trade improve, and real wages are projected
to be higher with these FTAs than would otherwise be the case. Australian GDP is
projected to increase by around $165 million.
5.1 Impact of services liberalisation of North Asian FTAs (KAFTA, JAEPA and
ChAFTA) on Australia – key macroeconomic results, in 2035 after full implementation
of FTAs, compared to scenario 1
Per cent change
%
Exports of goods and services to all destinations 0.1
Exports of goods and services to North Asia 1.1
Imports of goods and services from all sources 0.2
Imports of goods and services from North Asia 0.5
GDP 0.01
Real wage 0.1
Terms of trade 0.1
Source: CIE simulations with the GTAP model
Sectoral details
Table 5.2 provides sectoral detail for scenario 2 for the services sectors. These results
reflect the services outcomes of the three FTAs.
10 Results reported for ‘North Asia’ refer to the aggregate result for China, Japan and Korea.
Economic benefits of Australia’s North Asian FTAs 27
www.TheCIE.com.au
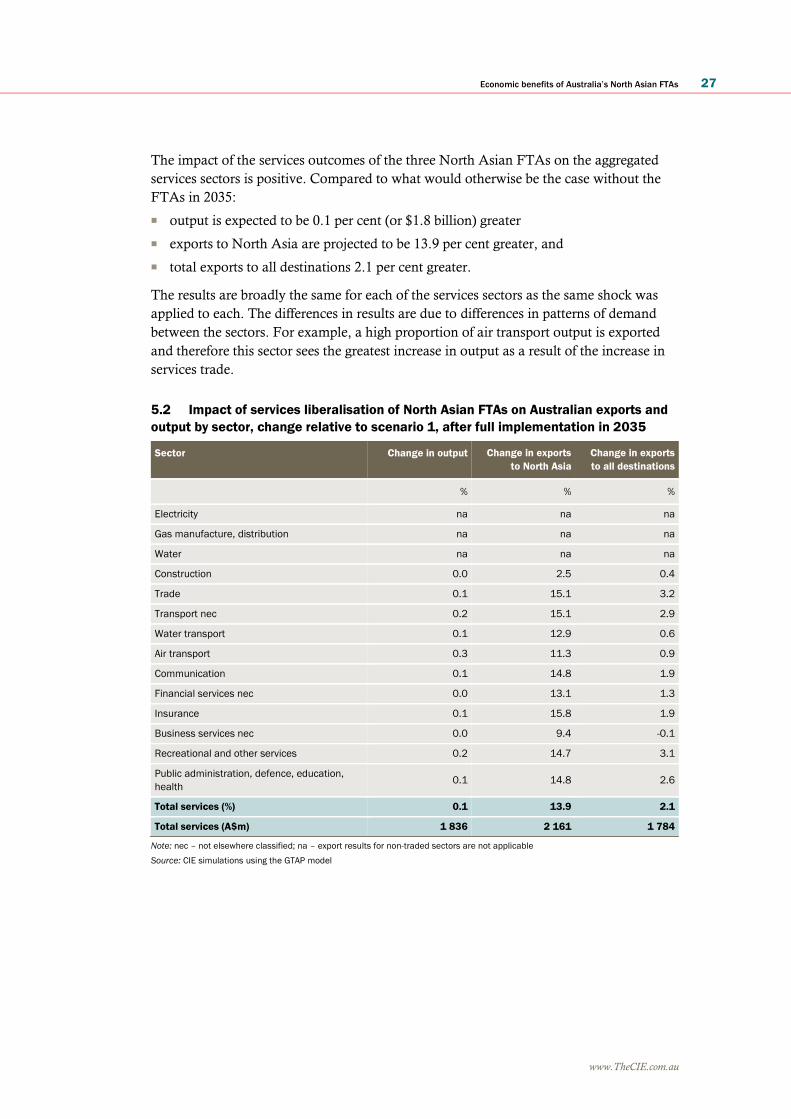
The impact of the services outcomes of the three North Asian FTAs on the aggregated
services sectors is positive. Compared to what would otherwise be the case without the
FTAs in 2035:
■ output is expected to be 0.1 per cent (or $1.8 billion) greater
■ exports to North Asia are projected to be 13.9 per cent greater, and
■ total exports to all destinations 2.1 per cent greater.
The results are broadly the same for each of the services sectors as the same shock was
applied to each. The differences in results are due to differences in patterns of demand
between the sectors. For example, a high proportion of air transport output is exported
and therefore this sector sees the greatest increase in output as a result of the increase in
services trade.
5.2 Impact of services liberalisation of North Asian FTAs on Australian exports and
output by sector, change relative to scenario 1, after full implementation in 2035
Sector Change in output Change in exports
to North Asia
Change in exports
to all destinations
% % %
Electricity na na na
Gas manufacture, distribution na na na
Water na na na
Construction 0.0 2.5 0.4
Trade 0.1 15.1 3.2
Transport nec 0.2 15.1 2.9
Water transport 0.1 12.9 0.6
Air transport 0.3 11.3 0.9
Communication 0.1 14.8 1.9
Financial services nec 0.0 13.1 1.3
Insurance 0.1 15.8 1.9
Business services nec 0.0 9.4 -0.1
Recreational and other services 0.2 14.7 3.1
Public administration, defence, education,
health 0.1 14.8 2.6
Total services (%) 0.1 13.9 2.1
Total services (A$m) 1 836 2 161 1 784
Note: nec – not elsewhere classified; na – export results for non-traded sectors are not applicable
Source: CIE simulations using the GTAP model
28 Economic benefits of Australia’s North Asian FTAs
www.TheCIE.com.au
6 Impact of Australia’s North Asian FTAs – total
macroeconomic impacts
This chapter sets out modelling results to illustrate the aggregate impact of the goods
and services liberalisation of the three free trade agreements Australia has recently
signed or concluded with China, Korea and Japan. This scenario assumes all the other
FTAs (included in scenario 1) are also in place. The results are compared to scenario 1
where other countries have pursued FTAs in North Asia but Australia has not.
Macroeconomic results
The three North Asian FTAs are projected to drive an 11.1 per cent increase in exports to
our North Asian FTA partners11 by 2035. Overall, Australia’s exports to all destinations
is projected to be 0.5 per cent higher in 2035 compared to scenario 1.
Australia’s imports are projected to be 2.7 per cent higher as imports of manufactured
goods from China, Japan and Korea become relatively cheaper. Australia’s trade deficit
increases slightly but this reflects a greater volume of more productive imports being
imported from North Asia. Australia’s terms of trade improve, and real wages are
projected to be higher with these FTAs than would otherwise be the case. Australian
GDP is projected to increase as a result of the FTAs. Based on the results of the dynamic
model, CIE G Cubed, the net present value of the cumulative increase in GDP (between
2016 and 2035) is projected to be $24.4 billion.
11 Results reported for ‘North Asia’ refer to the aggregate result for China, Japan and Korea.
Economic benefits of Australia’s North Asian FTAs 29
www.TheCIE.com.au
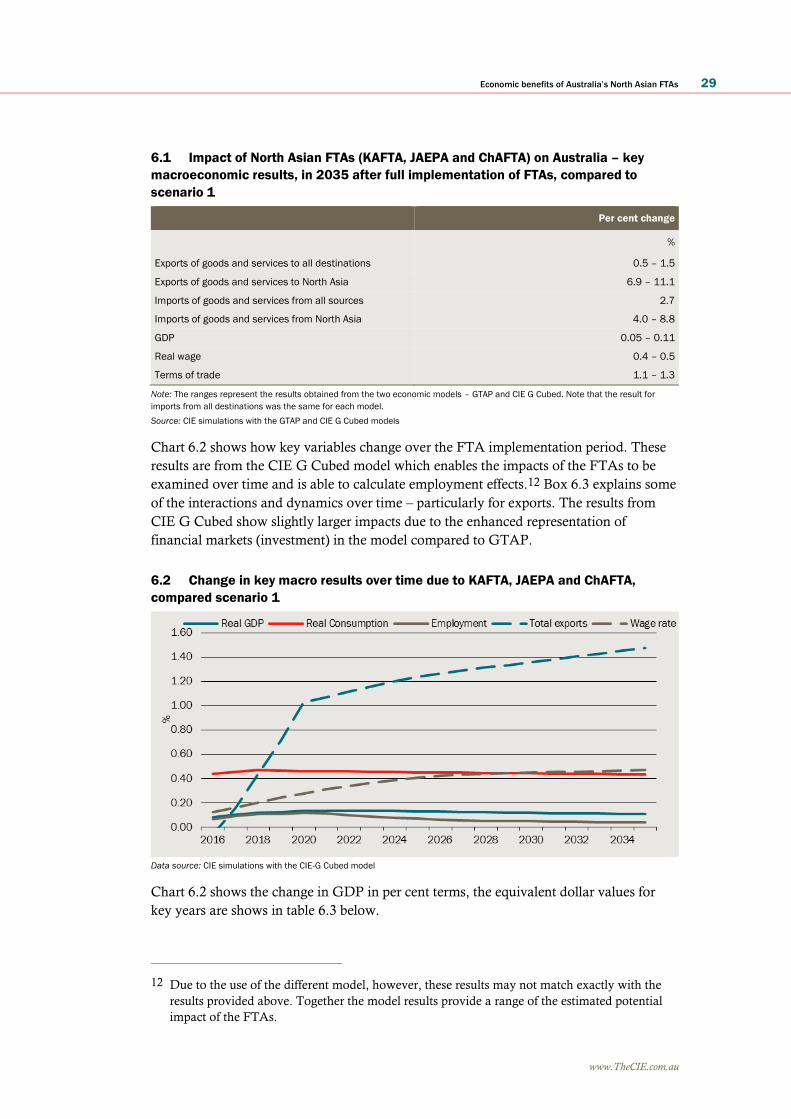
6.1 Impact of North Asian FTAs (KAFTA, JAEPA and ChAFTA) on Australia – key
macroeconomic results, in 2035 after full implementation of FTAs, compared to
scenario 1
Per cent change
%
Exports of goods and services to all destinations 0.5 – 1.5
Exports of goods and services to North Asia 6.9 – 11.1
Imports of goods and services from all sources 2.7
Imports of goods and services from North Asia 4.0 – 8.8
GDP 0.05 – 0.11
Real wage 0.4 – 0.5
Terms of trade 1.1 – 1.3
Note: The ranges represent the results obtained from the two economic models – GTAP and CIE G Cubed. Note that the result for
imports from all destinations was the same for each model.
Source: CIE simulations with the GTAP and CIE G Cubed models
Chart 6.2 shows how key variables change over the FTA implementation period. These
results are from the CIE G Cubed model which enables the impacts of the FTAs to be
examined over time and is able to calculate employment effects.12 Box 6.3 explains some
of the interactions and dynamics over time – particularly for exports. The results from
CIE G Cubed show slightly larger impacts due to the enhanced representation of
financial markets (investment) in the model compared to GTAP.
6.2 Change in key macro results over time due to KAFTA, JAEPA and ChAFTA,
compared scenario 1
Data source: CIE simulations with the CIE-G Cubed model
Chart 6.2 shows the change in GDP in per cent terms, the equivalent dollar values for
key years are shows in table 6.3 below.
12 Due to the use of the different model, however, these results may not match exactly with the
results provided above. Together the model results provide a range of the estimated potential
impact of the FTAs.
30 Economic benefits of Australia’s North Asian FTAs
www.TheCIE.com.au
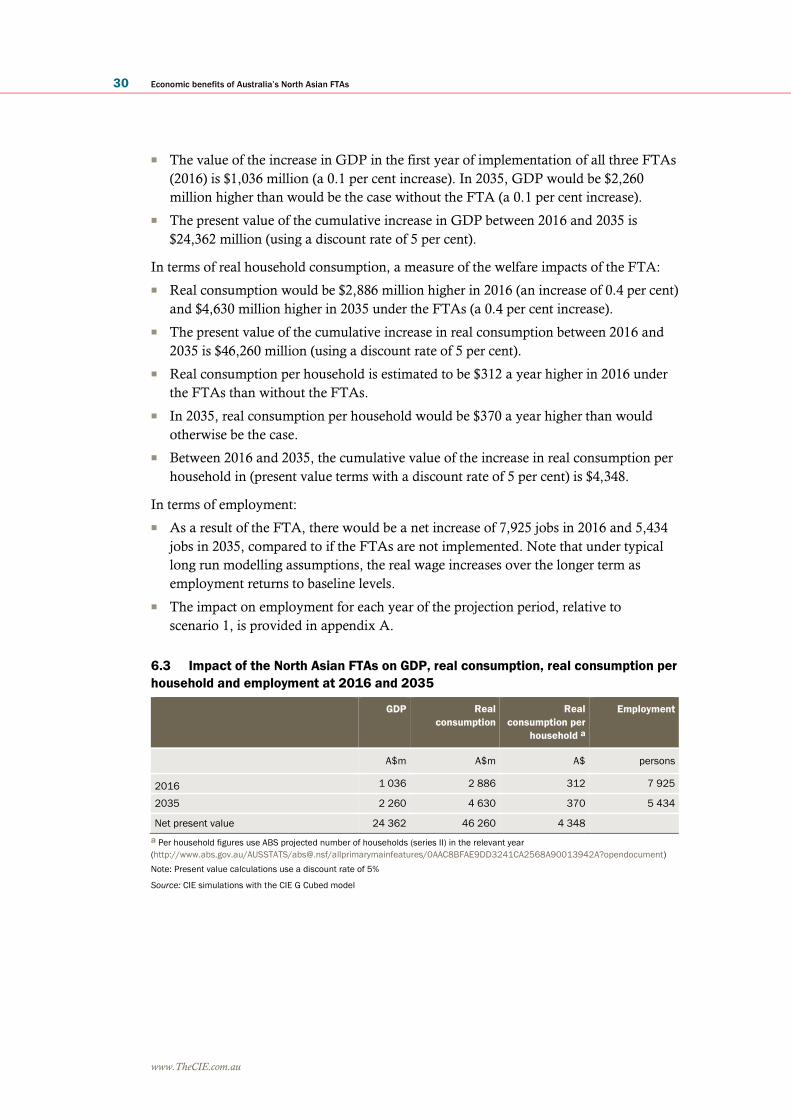
■ The value of the increase in GDP in the first year of implementation of all three FTAs
(2016) is $1,036 million (a 0.1 per cent increase). In 2035, GDP would be $2,260
million higher than would be the case without the FTA (a 0.1 per cent increase).
■ The present value of the cumulative increase in GDP between 2016 and 2035 is
$24,362 million (using a discount rate of 5 per cent).
In terms of real household consumption, a measure of the welfare impacts of the FTA:
■ Real consumption would be $2,886 million higher in 2016 (an increase of 0.4 per cent)
and $4,630 million higher in 2035 under the FTAs (a 0.4 per cent increase).
■ The present value of the cumulative increase in real consumption between 2016 and
2035 is $46,260 million (using a discount rate of 5 per cent).
■ Real consumption per household is estimated to be $312 a year higher in 2016 under
the FTAs than without the FTAs.
■ In 2035, real consumption per household would be $370 a year higher than would
otherwise be the case.
■ Between 2016 and 2035, the cumulative value of the increase in real consumption per
household in (present value terms with a discount rate of 5 per cent) is $4,348.
In terms of employment:
■ As a result of the FTA, there would be a net increase of 7,925 jobs in 2016 and 5,434
jobs in 2035, compared to if the FTAs are not implemented. Note that under typical
long run modelling assumptions, the real wage increases over the longer term as
employment returns to baseline levels.
■ The impact on employment for each year of the projection period, relative to
scenario 1, is provided in appendix A.
6.3 Impact of the North Asian FTAs on GDP, real consumption, real consumption per
household and employment at 2016 and 2035
GDP Real
consumption
Real
consumption per
household a
Employment
A$m A$m A$ persons
2016 1 036 2 886 312 7 925
2035 2 260 4 630 370 5 434
Net present value 24 362 46 260 4 348
a Per household figures use ABS projected number of households (series II) in the relevant year
(http://www.abs.gov.au/AUSSTATS/[email protected]/allprimarymainfeatures/0AAC8BFAE9DD3241CA2568A90013942A?opendocument)
Note: Present value calculations use a discount rate of 5%
Source: CIE simulations with the CIE G Cubed model
Economic benefits of Australia’s North Asian FTAs 31
www.TheCIE.com.au
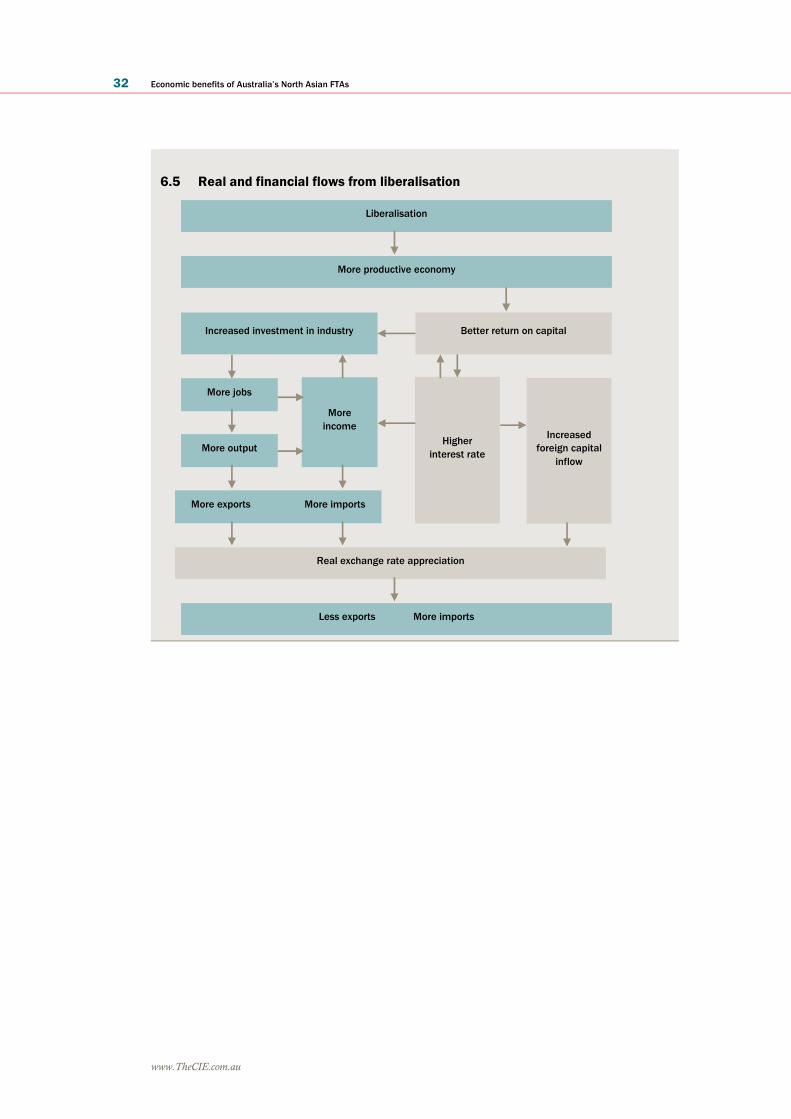
6.4 Short term adjustments to liberalisation
Complex interactions occur during the trade and investment liberalisation process in
real and financial markets. Chart 6.5 below sets out these interactions. This chart
helps to explain the initially slow increase in exports observed in chart 6.2. The areas
in grey represent financial market flows and blue are real flows.
Liberalisation leads to a more productive economy as resources are reallocated to
more efficient activities. This leads to a higher rate of return on capital which in turn
attracts foreign capital inflows and leads to a real exchange rate appreciation. The
extent of capital inflows is limited by the degree of improvement in the rate of return
on investment in Australia. There are two different effects on exports.
■ The exchange rate appreciation tends to decrease exports.
■ At the same time, increased investment in industry drives increased income,
output and exports.
In the long term, the increase in exports from greater and more efficient production
dominates the negative effects of the real exchange rate on exports. However, in the
short term this effect is less pronounced because the financial markets (particularly
international capital markets) react rapidly to market changes (and expectations of
changes). Adjustments in the real markets are slower which means the increase in
exports tends to be minimal at first and accelerate over the projection period as the
real markets catch up to the financial markets.
These effects reflect only the trade liberalisation being modelled and therefore any
other impacts on real and financial markets, for example the recently observed
devaluation of the Australian dollar, take place in addition to the effects described. In
reality, actual observed activity levels will reflect a range of different events, not just
the trade liberalisation.
32 Economic benefits of Australia’s North Asian FTAs
www.TheCIE.com.au
6.5 Real and financial flows from liberalisation
Liberalisation
More productive economy
Increased investment in industry
Higher
interest rate
More
income
More jobs
More output
More exports More imports
Less exports More imports
Real exchange rate appreciation
Increased
foreign capital
inflow
Better return on capital
Economic benefits of Australia’s North Asian FTAs 33
www.TheCIE.com.au
Appendices

34 Economic benefits of Australia’s North Asian FTAs
www.TheCIE.com.au
Economic benefits of Australia’s North Asian FTAs 35
www.TheCIE.com.au
A Impact of North Asian FTAs on employment
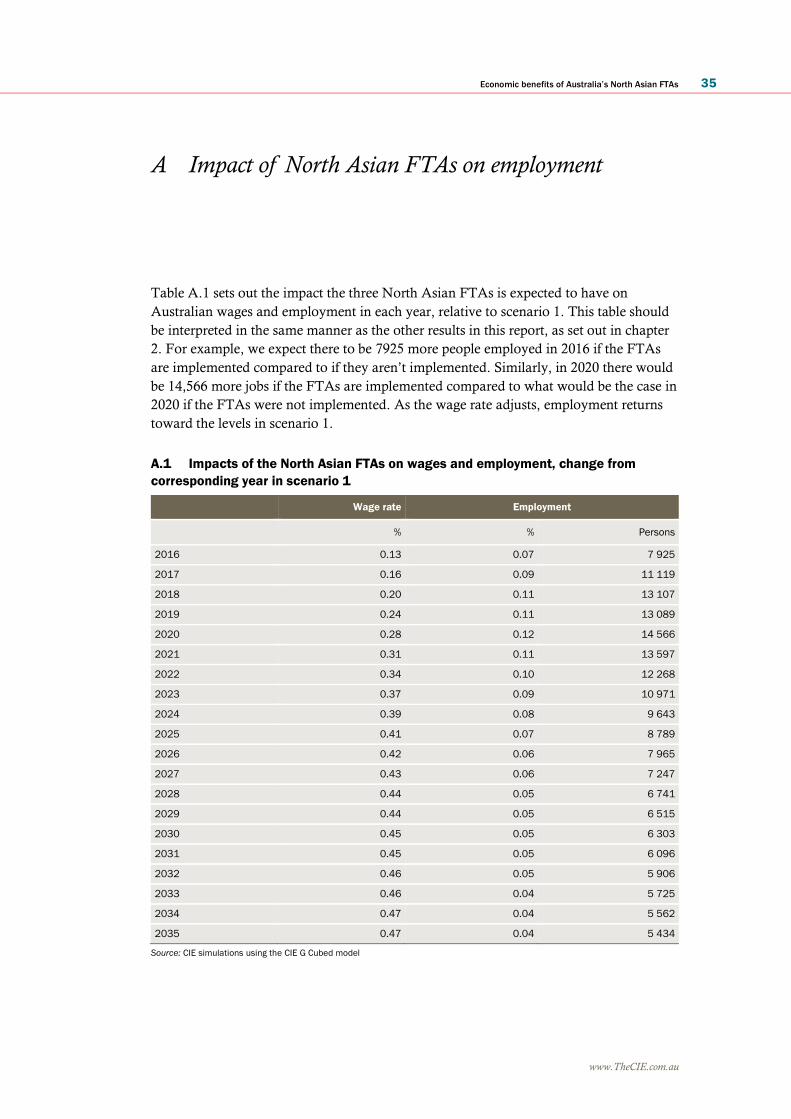
Table A.1 sets out the impact the three North Asian FTAs is expected to have on
Australian wages and employment in each year, relative to scenario 1. This table should
be interpreted in the same manner as the other results in this report, as set out in chapter
2. For example, we expect there to be 7925 more people employed in 2016 if the FTAs
are implemented compared to if they aren’t implemented. Similarly, in 2020 there would
be 14,566 more jobs if the FTAs are implemented compared to what would be the case in
2020 if the FTAs were not implemented. As the wage rate adjusts, employment returns
toward the levels in scenario 1.
A.1 Impacts of the North Asian FTAs on wages and employment, change from
corresponding year in scenario 1
Wage rate Employment
% % Persons
2016 0.13 0.07 7 925
2017 0.16 0.09 11 119
2018 0.20 0.11 13 107
2019 0.24 0.11 13 089
2020 0.28 0.12 14 566
2021 0.31 0.11 13 597
2022 0.34 0.10 12 268
2023 0.37 0.09 10 971
2024 0.39 0.08 9 643
2025 0.41 0.07 8 789
2026 0.42 0.06 7 965
2027 0.43 0.06 7 247
2028 0.44 0.05 6 741
2029 0.44 0.05 6 515
2030 0.45 0.05 6 303
2031 0.45 0.05 6 096
2032 0.46 0.05 5 906
2033 0.46 0.04 5 725
2034 0.47 0.04 5 562
2035 0.47 0.04 5 434
Source: CIE simulations using the CIE G Cubed model
36 Economic benefits of Australia’s North Asian FTAs
www.TheCIE.com.au
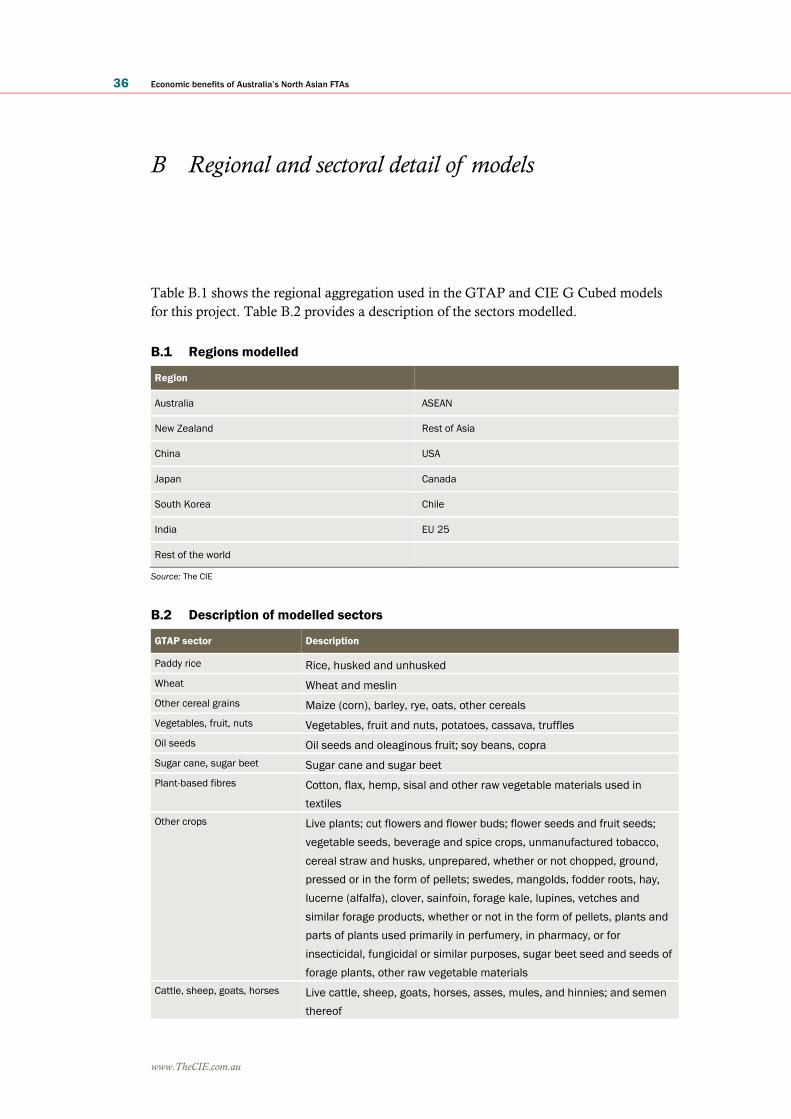
B Regional and sectoral detail of models
Table B.1 shows the regional aggregation used in the GTAP and CIE G Cubed models
for this project. Table B.2 provides a description of the sectors modelled.
B.1 Regions modelled
Region
Australia ASEAN
New Zealand Rest of Asia
China USA
Japan Canada
South Korea Chile
India EU 25
Rest of the world
Source: The CIE
B.2 Description of modelled sectors
GTAP sector Description
Paddy rice Rice, husked and unhusked
Wheat Wheat and meslin
Other cereal grains Maize (corn), barley, rye, oats, other cereals
Vegetables, fruit, nuts Vegetables, fruit and nuts, potatoes, cassava, truffles
Oil seeds Oil seeds and oleaginous fruit; soy beans, copra
Sugar cane, sugar beet Sugar cane and sugar beet
Plant-based fibres Cotton, flax, hemp, sisal and other raw vegetable materials used in
textiles
Other crops Live plants; cut flowers and flower buds; flower seeds and fruit seeds;
vegetable seeds, beverage and spice crops, unmanufactured tobacco,
cereal straw and husks, unprepared, whether or not chopped, ground,
pressed or in the form of pellets; swedes, mangolds, fodder roots, hay,
lucerne (alfalfa), clover, sainfoin, forage kale, lupines, vetches and
similar forage products, whether or not in the form of pellets, plants and
parts of plants used primarily in perfumery, in pharmacy, or for
insecticidal, fungicidal or similar purposes, sugar beet seed and seeds of
forage plants, other raw vegetable materials
Cattle, sheep, goats, horses Live cattle, sheep, goats, horses, asses, mules, and hinnies; and semen
thereof
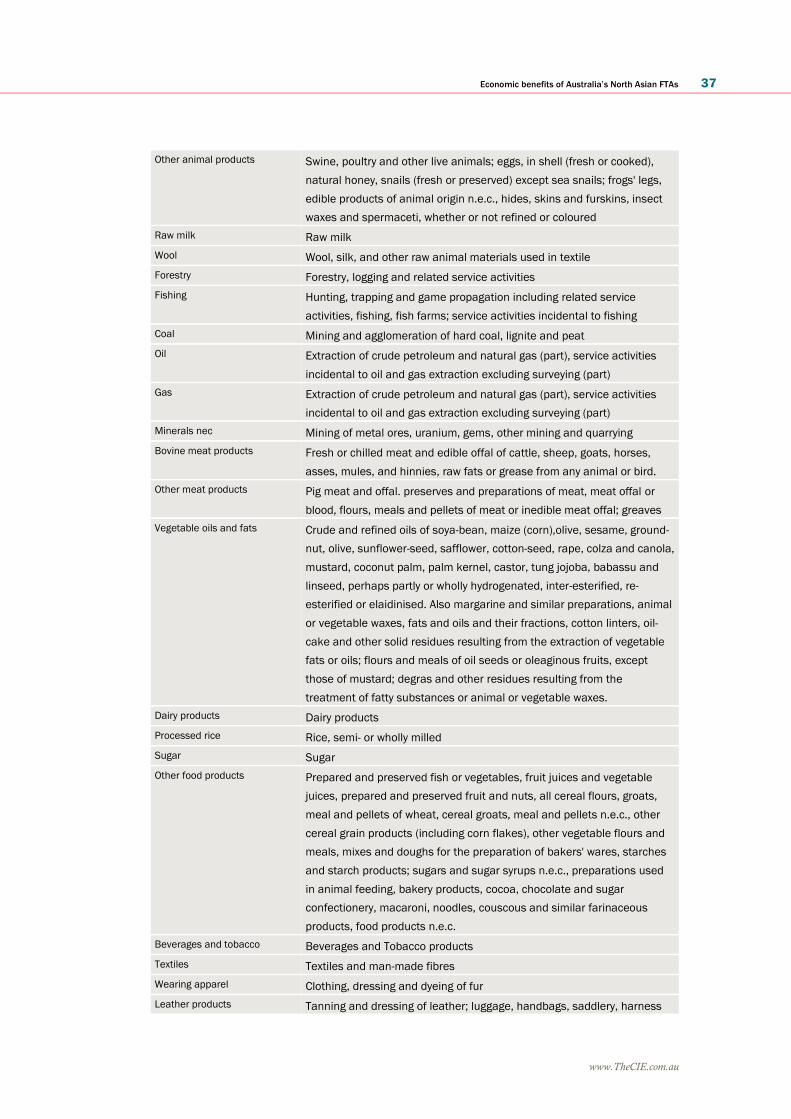
Economic benefits of Australia’s North Asian FTAs 37
www.TheCIE.com.au
Other animal products Swine, poultry and other live animals; eggs, in shell (fresh or cooked),
natural honey, snails (fresh or preserved) except sea snails; frogs' legs,
edible products of animal origin n.e.c., hides, skins and furskins, insect
waxes and spermaceti, whether or not refined or coloured
Raw milk Raw milk
Wool Wool, silk, and other raw animal materials used in textile
Forestry Forestry, logging and related service activities
Fishing Hunting, trapping and game propagation including related service
activities, fishing, fish farms; service activities incidental to fishing
Coal Mining and agglomeration of hard coal, lignite and peat
Oil Extraction of crude petroleum and natural gas (part), service activities
incidental to oil and gas extraction excluding surveying (part)
Gas Extraction of crude petroleum and natural gas (part), service activities
incidental to oil and gas extraction excluding surveying (part)
Minerals nec Mining of metal ores, uranium, gems, other mining and quarrying
Bovine meat products Fresh or chilled meat and edible offal of cattle, sheep, goats, horses,
asses, mules, and hinnies, raw fats or grease from any animal or bird.
Other meat products Pig meat and offal. preserves and preparations of meat, meat offal or
blood, flours, meals and pellets of meat or inedible meat offal; greaves
Vegetable oils and fats Crude and refined oils of soya-bean, maize (corn),olive, sesame, ground-
nut, olive, sunflower-seed, safflower, cotton-seed, rape, colza and canola,
mustard, coconut palm, palm kernel, castor, tung jojoba, babassu and
linseed, perhaps partly or wholly hydrogenated, inter-esterified, re-
esterified or elaidinised. Also margarine and similar preparations, animal
or vegetable waxes, fats and oils and their fractions, cotton linters, oil-
cake and other solid residues resulting from the extraction of vegetable
fats or oils; flours and meals of oil seeds or oleaginous fruits, except
those of mustard; degras and other residues resulting from the
treatment of fatty substances or animal or vegetable waxes.
Dairy products Dairy products
Processed rice Rice, semi- or wholly milled
Sugar Sugar
Other food products Prepared and preserved fish or vegetables, fruit juices and vegetable
juices, prepared and preserved fruit and nuts, all cereal flours, groats,
meal and pellets of wheat, cereal groats, meal and pellets n.e.c., other
cereal grain products (including corn flakes), other vegetable flours and
meals, mixes and doughs for the preparation of bakers' wares, starches
and starch products; sugars and sugar syrups n.e.c., preparations used
in animal feeding, bakery products, cocoa, chocolate and sugar
confectionery, macaroni, noodles, couscous and similar farinaceous
products, food products n.e.c.
Beverages and tobacco Beverages and Tobacco products
Textiles Textiles and man-made fibres
Wearing apparel Clothing, dressing and dyeing of fur
Leather products Tanning and dressing of leather; luggage, handbags, saddlery, harness
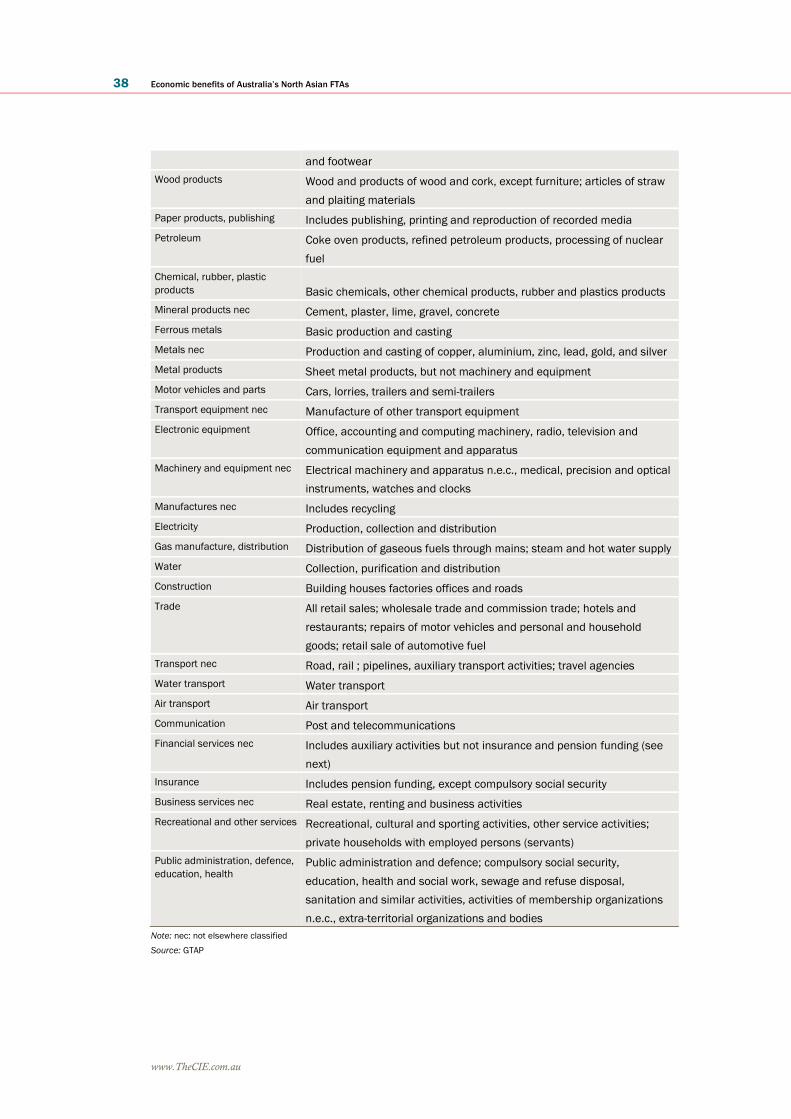
38 Economic benefits of Australia’s North Asian FTAs
www.TheCIE.com.au
and footwear
Wood products Wood and products of wood and cork, except furniture; articles of straw
and plaiting materials
Paper products, publishing Includes publishing, printing and reproduction of recorded media
Petroleum Coke oven products, refined petroleum products, processing of nuclear
fuel
Chemical, rubber, plastic
products Basic chemicals, other chemical products, rubber and plastics products
Mineral products nec Cement, plaster, lime, gravel, concrete
Ferrous metals Basic production and casting
Metals nec Production and casting of copper, aluminium, zinc, lead, gold, and silver
Metal products Sheet metal products, but not machinery and equipment
Motor vehicles and parts Cars, lorries, trailers and semi-trailers
Transport equipment nec Manufacture of other transport equipment
Electronic equipment Office, accounting and computing machinery, radio, television and
communication equipment and apparatus
Machinery and equipment nec Electrical machinery and apparatus n.e.c., medical, precision and optical
instruments, watches and clocks
Manufactures nec Includes recycling
Electricity Production, collection and distribution
Gas manufacture, distribution Distribution of gaseous fuels through mains; steam and hot water supply
Water Collection, purification and distribution
Construction Building houses factories offices and roads
Trade All retail sales; wholesale trade and commission trade; hotels and
restaurants; repairs of motor vehicles and personal and household
goods; retail sale of automotive fuel
Transport nec Road, rail ; pipelines, auxiliary transport activities; travel agencies
Water transport Water transport
Air transport Air transport
Communication Post and telecommunications
Financial services nec Includes auxiliary activities but not insurance and pension funding (see
next)
Insurance Includes pension funding, except compulsory social security
Business services nec Real estate, renting and business activities
Recreational and other services Recreational, cultural and sporting activities, other service activities;
private households with employed persons (servants)
Public administration, defence,
education, health Public administration and defence; compulsory social security,
education, health and social work, sewage and refuse disposal,
sanitation and similar activities, activities of membership organizations
n.e.c., extra-territorial organizations and bodies
Note: nec: not elsewhere classified
Source: GTAP


40 Economic benefits of Australia’s North Asian FTAs
www.TheCIE.com.au
THE CENTRE FOR INTERNATIONAL ECONOMICS
www.TheCIE.com.au