Embed Size (px)
Citation preview
Dollars and Sense: Economic Benefits and Impacts from two Oyster Reef Restoration Projects in the Northern Gulf of Mexico
Timm Kroeger, Ph.D.
Senior Environmental Economist Sustainability Science Team
Central Science Program
The Nature Conservancy
May 2012
i
Contents
List of Tables ................................................................................................................................................. ii
List of Figures ............................................................................................................................................... iv
Acknowledgments ......................................................................................................................................... v
Executive summary ...................................................................................................................................... vi
1. Background ........................................................................................................................................... 1
2. Methodology and Results ..................................................................................................................... 6
2.1. Estimates of Increases in Ecosystem Service Flows from Restored Oyster Reefs in Mobile Bay 12
2.1.1. Augmented Finfish and Crab Production from Restored Oyster Reefs .............................. 12
2.1.2. Denitrification ..................................................................................................................... 23
2.1.3. Reduction in Shoreline Erosion ........................................................................................... 24
2.2. Net Economic Benefits from Reef Restoration ........................................................................... 28
2.2.1. Conceptual approach and operationalization .................................................................... 28
2.2.1. Net benefits of oyster restoration to the commercial fishing and seafood processing
sectors…………… ................................................................................................................................... 30
2.2.2. Net benefits (consumer surplus) from additional seafood consumption........................... 34
2.2.3. Net benefits of oyster reef restoration to the recreational sector ..................................... 35
2.2.1. Denitrification ..................................................................................................................... 38
2.2.2. Reduction in shoreline erosion and associated costs ......................................................... 43
2.3. Economic Impacts from Reef Restoration .................................................................................. 46
2.3.1. Impacts from reef construction and monitoring ................................................................ 47
2.3.2. Impacts from enhancement of commercial fisheries through the two reefs ..................... 48
2.3.3. Share of Benefits and Impacts Captured in Baldwin and Mobile Counties ........................ 50
2.4. Resource Dependence, Support for Reef Restoration, and Share of Economic Benefits and
Impacts from Reef Restoration Absorbed by the Southeast-Asian American Community .................... 52
2.4.1. Share of benefits and impacts received by the Southeast Asian-American community .... 55
3. Conclusion ........................................................................................................................................... 59
3.1. Economic benefits and impacts from enhancement of commercial and recreational fisheries 59
3.2. Benefits from wave attenuation ................................................................................................. 62
3.3. Benefits associated with reduction of nitrogen levels in the Bay ............................................... 62
3.4. Scaling things up: Benefits and Impacts from Mobile Bay-wide oyster reef restoration ........... 63
3.5. Obstacles and opportunities for increasing the share of benefits and impacts captured by the
Southeast Asian-American community ................................................................................................... 68
3.6. Large-scale coastal restoration diversifies economic livelihoods and increases local
communities’ resilience to human-made and natural disasters ............................................................ 69
References .................................................................................................................................................. 71
Appendix 1: Ecosystem Services and associated Benefits from Gulf Oyster Reef Restoration .................. 80
Appendix 2: Historic and present reef extent and suitability for restoration ............................................ 87
ii
Appendix 3: Production enhancement estimates for selected species ...................................................... 89
Appendix 4: Adjustment of Peterson et al. (2003) biomass enhancement estimates for non-harvested
size classes .................................................................................................................................................. 90
Appendix 5: Wave characteristics in Mobile Bay ........................................................................................ 94
Appendix 6: Estimated fishing industry profit margins .............................................................................. 96
Appendix 7: Sportfishing value estimates reported in the literature for the Gulf of Mexico and Southeast
Florida ......................................................................................................................................................... 98
Appendix 8: Increase in sales along Alabama seafood chain from enhancement of commercial finfish and
crab harvest by Barton Island and Swift Tract reefs ................................................................................... 99
Appendix 9: RIMS II industry categories and multipliers for the two-county study area ......................... 100
List of Tables Table 1: Key characteristics, Swift Tract and Barton Island reef projects ................................................... 11
Table 2: Estimated increase in production of fish and large mobile crustaceans due to enhancement
effect of oyster reef, based on Peterson et al. (2003)................................................................ 13
Table 3: Commercially or recreationally fished species with the highest abundance enhancement from
oyster reefs compared to control sites, as found on two two-year old reefs in Mobile Bay ..... 13
Table 4: Mean production enhancement estimates for selected species, for individuals catchable in
gillnets......................................................................................................................................... 17
Table 5: Estimated enhancement of annual production of selected species by the Barton and Swift
restoration projects .................................................................................................................... 19
Table 6: Estimated annual enhancement of harvestable production of selected species by the Barton and
Swift restoration projects ........................................................................................................... 21
Table 7: 2010 Recreational and commercial landings in Alabama of fish species enhanced by oyster reefs
.................................................................................................................................................... 22
Table 8: Mobile Bay system characteristics and mean estimates of N removal by oyster reefs, from zu
Ermgassen et al. (unpublished data) .......................................................................................... 24
Table 9: Oyster densities of restored reefs in Mobile Bay .......................................................................... 24
Table 10: Estimated wave height and energy attenuation by Barton Island and Swift Tract reefs ........... 27
Table 11: Benefits quantified and values estimated in this study .............................................................. 30
Table 12: 2010 Dockside prices and value of increased commercial landings of fish species enhanced by
oyster reefs ................................................................................................................................. 31
Table 13: Value-added and mark-up along the seafood processing chain ................................................. 33
Table 14: Estimated increase in sales and profits in the commercial seafood processing chain from the
two constructed reefs ................................................................................................................. 33
Table 15: Estimated increase in recreational catch from the two reefs ..................................................... 36
Table 16: Consumer surplus estimates of enhanced recreational catch due to the two reefs .................. 38
Table 17: Estimated expenditures associated with the two reef projects ................................................. 48
iii
Table 18: Value added in the fishing and seafood products sector as a result of the two reefs ............... 49
Table 19: Total economic impacts in study region from restoration of the two oyster reefs .................... 50
Table 20: Seafood-related employment in Baldwin and Mobile counties in 2009 (pre-spill) .................... 51
Table 21: Selected characteristics of coastal resource dependence of Asian-American community in
Bayou La Batre, AL area .............................................................................................................. 53
Table 22: Average annual economic net benefit from enhancement of fisheries produced by 3.64 miles
of oyster reef restoration in Mobile Bay .................................................................................... 59
Table 23: Total economic impacts from commercial fishery enhancement and reef construction for 3.64
miles of oyster reef restoration in Mobile Bay ........................................................................... 60
Table 24: Economic benefits and impacts generated by harvest of 20 oysters per square meter per year
from Swift Tract and Barton Island reefs if reefs were opened up to harvest ........................... 61
Table 25: Reduction in wave height and energy by the two reefs ............................................................. 62
Table 26: Annual quantities of nitrogen removed by the two reefs .......................................................... 63
Table 27: Average annual economic net benefit from fisheries enhancement produced by 100-mile
oyster reef restoration project in Mobile Bay ............................................................................ 64
Table 28: Economic impacts from commercial fishery enhancement and reef construction for 100-mile
oyster reef restoration project in Mobile Bay ............................................................................ 67
Table A1: Ecosystem Services and associated benefits provided by oyster reefs……………………………………80 Table A3: Estimated total production enhancement of selected species from oyster reefs in Mobile Bay,
based on findings reported in Scyphers et al. (2011) and Geraldi et al. (2009)……………………….89 Table A4.1: Key species parameters for species analyzed in Peterson et al. (2003) .................................. 90
Table A4.2: Mean length Li of species at age 0-9 yrs .................................................................................. 90
Table A4.3: Proportion of age class (i-1) surviving to age class i, for age classes 0-9 ................................. 90
Table A4.4: Cumulative survival to age class i for age classes 0-9 .............................................................. 91
Table A4.5: Estimated mean weight (in grams) at age i of individuals of a species as a function of length
for age classes 0-9....................................................................................................................... 91
Table A4.6: Estimated distribution in any given year of total weight of individuals of a species across age
classes 0-9 ................................................................................................................................... 92
Table A4.7: Share of total weight of all individuals of a species that is below harvestable age in any given
year ............................................................................................................................................. 93
Table A5.1: Values of Wave Height and Period computed from wind speed record and fetch distances
computed at Swift Tract ............................................................................................................. 95
Table A5.2.: Statistics of wave height [m] and wave period p[s] in Mobile Bay based on estimated wave
power values ............................................................................................................................... 95
Table A7.1: Sportfishing value estimates for the Gulf of Mexico and Southeast Florida reported in the
literature ..................................................................................................................................... 98
Table A8: Increase in gross and net revenues in Alabama seafood sector from fishery enhancement by
the two study reefs ..................................................................................................................... 99
Table A9.1: Reef construction-related costs, corresponding RIMS II industries and multipliers for Mobile
and Baldwin Co. area ................................................................................................................ 100
Table A9.2: Sectors affected by fishery enhancement and corresponding RIMS II industries and
multipliers for Mobile and Baldwin Co. area ............................................................................ 101
iv
List of Figures Figure 2-1: Existing oyster reef restoration projects in Portersville Bay and the southern part of Mobile
Bay, Alabama and additional restoration planned under the Alabama 100/1000 project .......... 7
Figure 2-2: Suitability of Mobile Bay area sites for oyster restoration ......................................................... 8
Figure 2-3: Location of the Swift (top image) and Barton Island restoration projects ................................. 9
Figure 2-4: Relative coastal vulnerability to sea level rise .......................................................................... 25
Figure 2-5: Reduction in incident wave height by Swift Tract oyster reef, for high-impact wave (top left
panel) and median wave (top right panel). ................................................................................ 26
Figure 2-6: Reduction in incident wave height by Barton Island oyster reef, for high-impact wave (top left
panel) and median wave (top right panel). ................................................................................ 26
Figure 2-7: Flow of seafood and products through the Alabama seafood processing chain ..................... 33
Figure 2-8: Southeast Asian population in study area by Census tract ...................................................... 56
Figure 3-1: Vulnerability of Mobile Bay shoreline to erosion ..................................................................... 65
Figure 3-2: Suitability of Mobile Bay as oyster habitat ............................................................................... 66
Figure A2.1: Extent of present (1995; left image) and historic (1880; right image) oyster reefs in Mobile
Bay and Portersville Bay, Alabama ............................................................................................. 87
Figure A2.2: Spat settlement count (individuals per square meter per day) ............................................. 87
Figure A2.3: Oyster larvae concentration (individuals, log10 transformed) .............................................. 88
Figure A5.1: Wind roses of winds recorded at NOAA Station DPIA1.. ........................................................ 94
Figure A5.2: Fetch distances used for Swift Track estimates in Mobile Bay, AL. ........................................ 94

v
Acknowledgments This report was made possible through contributions from many people. Sincere thanks to Vinh Tran, Daniel Le and Grace Scirè of the Boat People SOS Gulf Coast Office; the participants in the focus group meetings and key informant interviews for sharing their knowledge and thoughts; Dr. Supin Wongbusarakum for leading the focus group and key informant meetings; Nigel Strafford for research assistance and literature reviews; Dr. Philine zu Ermgassen for sharing oyster reef denitrification estimates for Mobile Bay and reviewing drafts of the fishery enhancement and denitrification sections; Dr. Greg Guannel for conducting the wave attenuation modeling; Jeff de Quattro and Dr. Judy Haner for providing monitoring and project cost data and being an inexhaustible source of all matters oyster reef restoration; and Drs. Rob Brumbaugh and Mike Beck and Craig Leisher for help with overall project scoping. Harry and Shirley Hagey of the HRH Foundation, the Schooner Foundation, and Seth Neiman provided the funding to make this study possible.
vi
Executive summary
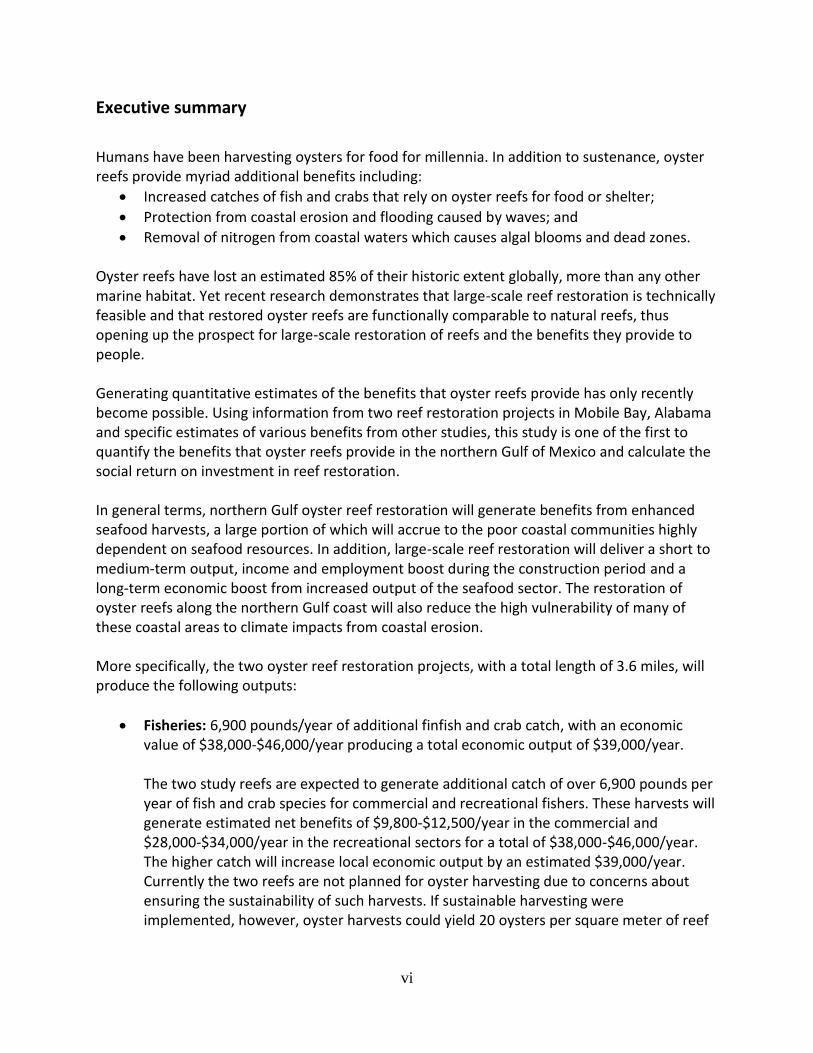
Humans have been harvesting oysters for food for millennia. In addition to sustenance, oyster reefs provide myriad additional benefits including:
Increased catches of fish and crabs that rely on oyster reefs for food or shelter;
Protection from coastal erosion and flooding caused by waves; and
Removal of nitrogen from coastal waters which causes algal blooms and dead zones. Oyster reefs have lost an estimated 85% of their historic extent globally, more than any other marine habitat. Yet recent research demonstrates that large-scale reef restoration is technically feasible and that restored oyster reefs are functionally comparable to natural reefs, thus opening up the prospect for large-scale restoration of reefs and the benefits they provide to people. Generating quantitative estimates of the benefits that oyster reefs provide has only recently become possible. Using information from two reef restoration projects in Mobile Bay, Alabama and specific estimates of various benefits from other studies, this study is one of the first to quantify the benefits that oyster reefs provide in the northern Gulf of Mexico and calculate the social return on investment in reef restoration. In general terms, northern Gulf oyster reef restoration will generate benefits from enhanced seafood harvests, a large portion of which will accrue to the poor coastal communities highly dependent on seafood resources. In addition, large-scale reef restoration will deliver a short to medium-term output, income and employment boost during the construction period and a long-term economic boost from increased output of the seafood sector. The restoration of oyster reefs along the northern Gulf coast will also reduce the high vulnerability of many of these coastal areas to climate impacts from coastal erosion. More specifically, the two oyster reef restoration projects, with a total length of 3.6 miles, will produce the following outputs:
Fisheries: 6,900 pounds/year of additional finfish and crab catch, with an economic value of $38,000-$46,000/year producing a total economic output of $39,000/year.
The two study reefs are expected to generate additional catch of over 6,900 pounds per year of fish and crab species for commercial and recreational fishers. These harvests will generate estimated net benefits of $9,800-$12,500/year in the commercial and $28,000-$34,000/year in the recreational sectors for a total of $38,000-$46,000/year. The higher catch will increase local economic output by an estimated $39,000/year. Currently the two reefs are not planned for oyster harvesting due to concerns about ensuring the sustainability of such harvests. If sustainable harvesting were implemented, however, oyster harvests could yield 20 oysters per square meter of reef
vii
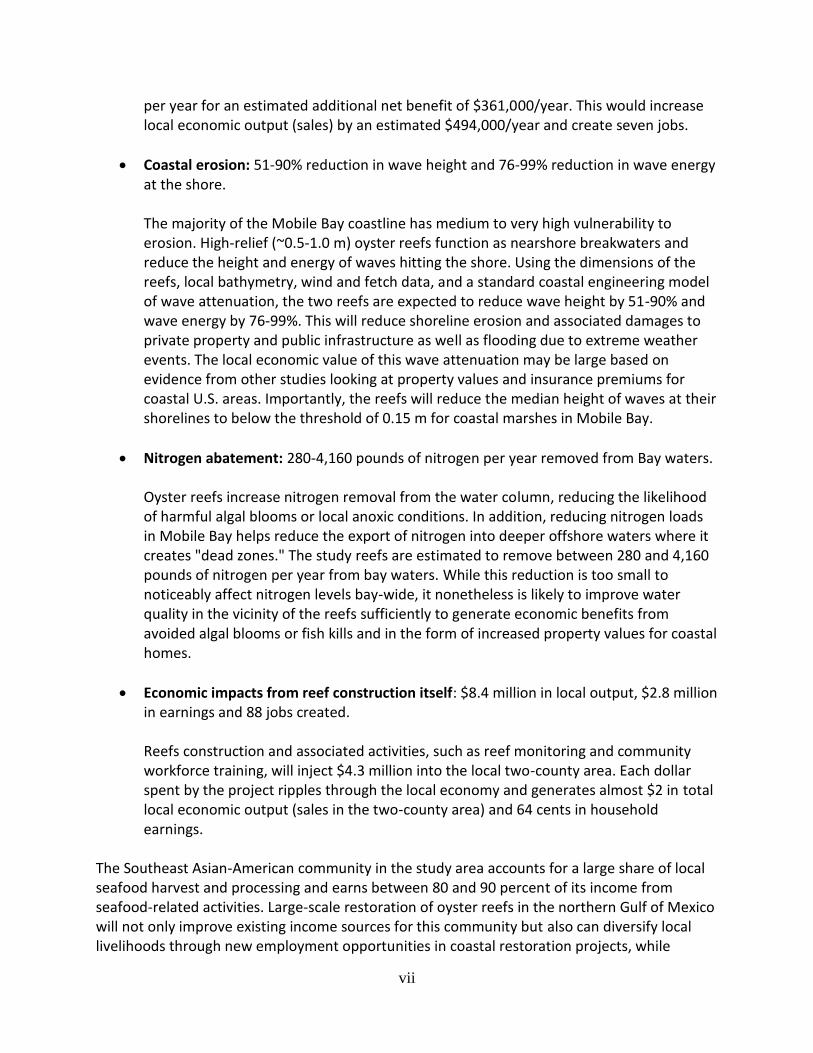
per year for an estimated additional net benefit of $361,000/year. This would increase local economic output (sales) by an estimated $494,000/year and create seven jobs.
Coastal erosion: 51-90% reduction in wave height and 76-99% reduction in wave energy at the shore. The majority of the Mobile Bay coastline has medium to very high vulnerability to erosion. High-relief (~0.5-1.0 m) oyster reefs function as nearshore breakwaters and reduce the height and energy of waves hitting the shore. Using the dimensions of the reefs, local bathymetry, wind and fetch data, and a standard coastal engineering model of wave attenuation, the two reefs are expected to reduce wave height by 51-90% and wave energy by 76-99%. This will reduce shoreline erosion and associated damages to private property and public infrastructure as well as flooding due to extreme weather events. The local economic value of this wave attenuation may be large based on evidence from other studies looking at property values and insurance premiums for coastal U.S. areas. Importantly, the reefs will reduce the median height of waves at their shorelines to below the threshold of 0.15 m for coastal marshes in Mobile Bay.
Nitrogen abatement: 280-4,160 pounds of nitrogen per year removed from Bay waters.
Oyster reefs increase nitrogen removal from the water column, reducing the likelihood of harmful algal blooms or local anoxic conditions. In addition, reducing nitrogen loads in Mobile Bay helps reduce the export of nitrogen into deeper offshore waters where it creates "dead zones." The study reefs are estimated to remove between 280 and 4,160 pounds of nitrogen per year from bay waters. While this reduction is too small to noticeably affect nitrogen levels bay-wide, it nonetheless is likely to improve water quality in the vicinity of the reefs sufficiently to generate economic benefits from avoided algal blooms or fish kills and in the form of increased property values for coastal homes.
Economic impacts from reef construction itself: $8.4 million in local output, $2.8 million in earnings and 88 jobs created.
Reefs construction and associated activities, such as reef monitoring and community workforce training, will inject $4.3 million into the local two-county area. Each dollar spent by the project ripples through the local economy and generates almost $2 in total local economic output (sales in the two-county area) and 64 cents in household earnings.
The Southeast Asian-American community in the study area accounts for a large share of local seafood harvest and processing and earns between 80 and 90 percent of its income from seafood-related activities. Large-scale restoration of oyster reefs in the northern Gulf of Mexico will not only improve existing income sources for this community but also can diversify local livelihoods through new employment opportunities in coastal restoration projects, while
viii
increasing the resilience of local communities to the impacts of natural disasters and rising sea levels. Perhaps most importantly, oyster reef restoration makes sense on cost-benefit grounds: Over a 50-year timeframe, the present value (NPV) of the economic net benefits from just the fishery enhancement provided by sustainably harvested oyster reefs (including oysters) is $5.6 million, giving the project a social return on investment (ROI) of 2.3. If avoided damages from coastal erosion and flooding are considered, the economic rationale for reef restoration becomes even stronger. Importantly, economic benefits and impacts increase proportionally with oyster reef area. The value proposition of reef restoration rests on the ability of the reefs to perform a number of functions in addition to fishery enhancement, such as water quality improvement and coastal erosion control. While other approaches—traditional "grey infrastructure" solutions such as bulkheads or rock revetments—might perform individual functions similarly well or at similar cost as oyster reefs, none of them produce the multiple benefits that reef restoration does. Thus, oyster reef restoration is likely to generate greater total benefits for society than competing single-objective solutions.
1
1. Background Oyster reefs have experienced the largest global loss of any marine habitat type, with an estimated reduction of 85 percent compared to their historic extent (Beck et al., 2011). The primary causes for the decline in oyster reefs are overharvesting and destructive harvesting practices (dredging, trawling), disease (often associated with non-native oysters used in aquaculture), alteration of shorelines, changes in salinity as a result of alterations of freshwater inflows, and increased loadings of sedimentation, nutrients and toxins (National Research Council, 2004). Oyster reefs have fared somewhat better in the Gulf of Mexico, with only 50-89% of the historic abundance lost. However, the state of oyster reefs is highly variable among different areas in Gulf. In the northern Gulf, documented losses range from an estimated 80% in Mobile Bay (zu Ermgassen et al., 2011) to 90-99% in the Mississippi Sound and Pensacola Bay (Beck et al., 2011). This dramatic loss of oyster reefs is of concern because oyster reefs provide a wide range of ecosystem functions in addition to oyster production. These include the reduction of water turbidity by filtration; the biodeposition of organics containing plant nutrients; the induction of denitrification associated with organic deposition; the sequestration of carbon; the provision of structural habitat that promotes epibiotic diversity and fish and crustacean production; and the stabilization of species habitat and shoreline (National Research Council, 2010). These functions in turn support many valuable ecosystem services that generate economic benefits for local communities and the wider economy. Many of these services have been quantified in the peer-reviewed literature (see Appendix 1).1 Although the harvest of the oysters themselves always has been recognized as an important benefit, the growing body of literature on the services provided by oyster reefs indicates that this direct use value of oysters as a harvested commodity likely pales in comparison with the value of the other services oyster reefs provide (Grabowski and Petersen, 2007; Peterson et al., 2003). In fact, some suggest that the value of the landings of fish that use oyster reefs may exceed oyster harvest values (Beck et al., 2011). Importantly, research suggests that there may be no significant difference in service provision levels between restored and intact natural reefs. 2 Reef restoration thus offers the potential for reversing the historical loss of ecosystem services from these systems.
1 The table follows the definition of ecosystem services suggested by Boyd and Banzhaf (2007), as the final inputs
from nature that are directly consumed or otherwise enjoyed to produce human well-being. While a number of other definitions are in use, the focus on final ecosystem services that support specific benefits facilitates the comprehensive accounting for ecosystem services while avoiding double-counting. Kroeger and Casey (2007) and 2 For example, a study on Ocracoke Island, NC showed that the value of fish caught on restored reefs was equal to
that of fish caught on natural reefs (North Carolina Sea Grant, 1997).
2
Such restoration would yield economic benefits. Importantly, these benefits may substantially exceed the costs of restoration. For example, Hicks et al.’s (2004) analysis of the costs and benefits of a native oyster reef restoration project in Chesapeake Bay indicates that the economic value of the benefits exceeds the costs several-fold. The feasibility of large-scale restoration has been demonstrated (Schulte et al., 2009), as has the superior performance (at least with respect to oyster productivity) of high-relief or vertical reefs (Schulte et al., 2009; Coen et al., 2007; Gregalis et al., 2008). However, as is the case for many habitat types, the absolute and relative magnitude of the various services provided by oyster reefs depends on site characteristics and thus varies across different locations (Gregalis et al., 2008). Taking into account key site characteristics that drive reef performance and selecting restoration sites accordingly thus can increase the flows of particular ecosystem services from reefs (North et al., 2010). This site-specificity is even more pronounced for the economic values of these services, which depend not just on the quantities of flows generated but also on the number of beneficiaries and the relative scarcity of the respective services in a particular location. Thus, the estimation of the flows and associated values produced by a restored oyster reef depends on the availability of local information about service flows and about the demand for those flows. Choice of study area, scope and objectives The Restoration Program of the Nature Conservancy’s Global Marine Team, in collaboration with staff from the Conservancy’s Gulf of Mexico oyster reef restoration projects and leading oyster specialists, has developed geospatial tools that map suitability characteristics for oyster restoration in the northern Gulf of Mexico. The Global Marine Team recently also completed an assessment of historic and present oyster stocks in the lower 48 States and produced estimates of the nitrogen removal by oyster reefs for a series of estuaries along the Atlantic, Pacific and Gulf coasts (zu Ermgassen et al., 2011). In addition, the Natural Capital Project’s Marine InVEST team has developed a simulation model that generates estimates of the wave height and energy attenuation provided by oyster reefs. Furthermore, several recent scientific studies in Mobile Bay provide estimates of the fisheries enhancement effect of restored reefs. The present study draws on this recent work to develop estimates of selected ecosystem service flows for two planned oyster reef restoration projects in Mobile Bay; and, where possible, to estimate the economic value of those services and the economic impacts of the restored reefs. Because Mobile Bay is home to a large, economically disadvantaged population of Southeast Asian immigrants and their families, we also assess the extent to which this community benefits from and supports oyster reef restoration. Finally, because our two study reef projects form part of a much larger planned restoration effort in Mobile Bay, we scale up our estimates to gain an approximate understanding of the economic benefits and impacts of baywide reef restoration.

3
Study Justification Restoration of oyster reefs, especially if done in a way that creates long-lasting, self-sustaining reefs, requires a considerable investment of resources. In a world where worthwhile project opportunities far exceed available funding, smart resource allocation requires an assessment of the comparative returns of competing alternatives. This is true both within conservation as well as across conservation and non-conservation projects and whether returns are defined in monetary terms or in different metrics. The principal value of assessing the returns of competing investments is that it allows for the maximization of target objectives—with the important caveat of data availability—and that it requires making explicit the trade-offs and choices. Reef restoration certainly offers the prospect of large benefits:
“These breakwater designs will lessen wave energy reaching the shoreline, thereby lessening erosion. They will also restore oysters and their associated ecological benefits, as well as enhance commercially valuable oyster reefs in other parts of the bay. Finally the construction of the reef materials and the reefs will help restore fishery related jobs along the Gulf Coast.” (McKee, 2010:20)
This study aims to begin to provide a quantitative underpinning to those expectations. However, the information it generates will serve several additional purposes. Need for assessing the relative cost-effectiveness of oyster reef restoration as a tool for economic revitalization Ecosystem restoration in general, and large-scale oyster reef restoration in particular, is being proposed as an approach that can help contribute to the revitalization of the economy of the northern Gulf of Mexico, which has been hard hit by recent natural and manmade disasters (Oxfam America, 2010). Substantial public and private resources are being devoted to coastal restoration and other efforts that support economic activity in the region, and these efforts are likely to continue or even increase in the coming years. Knowledge of the economic benefits and impacts of oyster restoration will allow comparisons of the return on investment (both in terms of cost/benefit and cost-effectiveness) of reef restoration with those of 1) other restoration projects; 2) non restoration projects (e.g., put-and-take oyster fishery projects; coastal hardening) that aim to generate or substitute some of the ecosystem services provided by conservation or restoration projects; and 3) projects whose primary purpose it is to increase economic output or jobs in the area. This information will be crucial for making the economic case for large-scale oyster restoration in the Gulf, as envisioned for example by the 100-1000
4
project in Alabama.3 Surveys of coastal residents in the region show that people are aware of the benefits shellfish provide (Fairbank, Maslin, Maullin and Associates, 2009), that they recognize economic benefits as an important reason (alongside ecological benefits) to protect and restore oyster reefs, that there is strong support for oyster reef restoration and protection (Scyphers and Powers, 2011), and that they support making shellfish protection and restoration a priority for state agencies (Fairbank, Maslin, Maullin and Associates, 2009). Yet oyster restoration projects are likely to attract more public funding if they can demonstrate their cost-effectiveness compared to alternative projects with the same economic goals. This study will provide some of the data needed to conduct such assessments. Data availability and representativeness of the study area
The Mobile Bay area was chosen as a case study site for several reasons. First, the Conservancy is implementing several oyster reef restoration projects in the area that are generating site-specific data against which to compare literature estimates on oyster ecosystem services from other areas in the Gulf. Even though these projects are still too young to generate the service flows provided by more mature reefs, the data they provide in many cases do allow qualitative comparisons with literature observations, including several recent studies conducted in Mobile Bay. In addition to these observational data, model-based estimates have been developed for the denitrification provided by oyster reefs in the Bay. Finally, Mobile Bay also is representative of many other sections of the northern Gulf coast in that oyster reefs and shellfish and finfish harvests form an important component of the local economy and represent crucial income sources for some sectors of the community that have few alternative employment options (Oxfam America, 2010; Mississippi Coalition of Vietnamese-American Fisherfolk and Families, 2010). Thus, the findings of our study are expected to be fairly representative of other areas along the northern Gulf coast.
Identifying oyster reef restoration benefits for disadvantages communities In addition to benefiting the local economy at large, coastal restoration projects also specifically benefit marine-resource dependent and often underprivileged local communities. However, the extent of those benefits depends on project design and implementation and has not been examined for oyster reefs in the northern Gulf. Identifying obstacles and opportunities for disadvantaged communities to engage fully in the restoration economy and diversify livelihoods The identification of obstacles and opportunities for disadvantaged local communities to actively engage and benefit from coastal restoration efforts is a necessary first step in reducing
3 See http://www.100-1000.org/final%20fact%20sheet.pdf
5
the often high dependency of those communities on seafood harvests (Mississippi Coalition of Vietnamese-American Fisherfolk and Families, 2010) and in diversifying livelihoods. More diverse livelihoods in turn are likely to increase the resiliency of local communities in the region to natural disasters and the impacts of climate change. Using focus group discussions and key informant interviews, our study represents a first effort to identify obstacles and opportunities for more community involvement in the restoration economy, and will inform future research efforts that employ more robust techniques such as statistical analyses. Assessing the effectiveness and cost-effectiveness of oyster restoration as a climate adaptation approach
Finally, by reducing coastal erosion and flooding, oyster reef restoration also could play a part in the adaptation of coastal communities in the northern Gulf to climate change and in reducing impacts from current climate events. Such ecosystem-based adaptation approaches in many places of the world have been found to be among the more cost-effective measures to reduce damages from climate events (Economics of Climate Adaptation Working Group, 2010; Caribbean Catastrophe Risk Insurance Facility, 2010). In fact, a preliminary analysis identified “wetlands restoration” as one of the recommended near-term actions to protect the northern Gulf region (Entergy Corp., 2010). However, “wetlands” comprise a range of coastal ecosystems, the restoration cost-effectiveness of which may vary substantially. Thus, research on the economic performance specifically of oyster reefs is needed.
6
2. Methodology and Results In this section, we first outline the metrics used in the economic analysis of the service flows from two restored reefs, followed by a brief description of the study sites and reef characteristics. This is followed by the estimation of the physical flows provided by the reefs (section 2.1), the economic benefits (section 2.2) and impacts (section 2.3) those services produce. Finally, we examine the local Southeast Asian community’s dependence on seafood resources, their support for coastal restoration and the obstacles and opportunities for increasing the engagement of that community in restoration projects (section 2.4). Metrics used for assessing the economic outcomes from oyster reef restoration
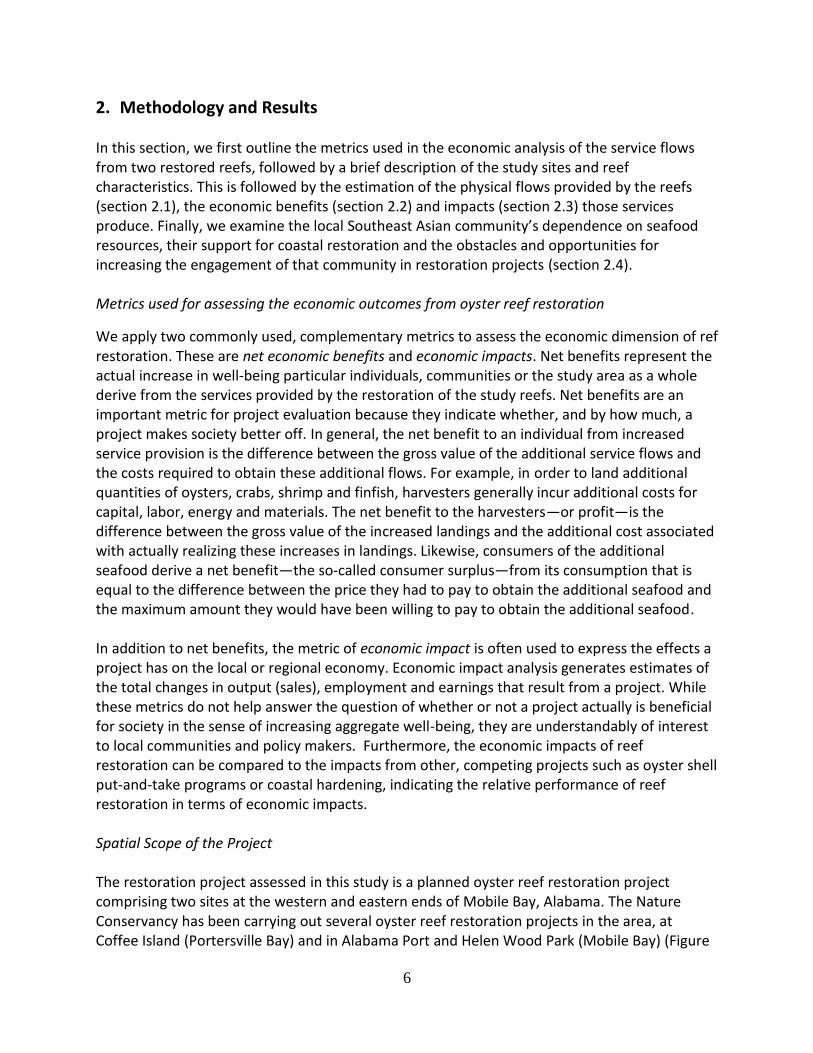
We apply two commonly used, complementary metrics to assess the economic dimension of ref restoration. These are net economic benefits and economic impacts. Net benefits represent the actual increase in well-being particular individuals, communities or the study area as a whole derive from the services provided by the restoration of the study reefs. Net benefits are an important metric for project evaluation because they indicate whether, and by how much, a project makes society better off. In general, the net benefit to an individual from increased service provision is the difference between the gross value of the additional service flows and the costs required to obtain these additional flows. For example, in order to land additional quantities of oysters, crabs, shrimp and finfish, harvesters generally incur additional costs for capital, labor, energy and materials. The net benefit to the harvesters—or profit—is the difference between the gross value of the increased landings and the additional cost associated with actually realizing these increases in landings. Likewise, consumers of the additional seafood derive a net benefit—the so-called consumer surplus—from its consumption that is equal to the difference between the price they had to pay to obtain the additional seafood and the maximum amount they would have been willing to pay to obtain the additional seafood. In addition to net benefits, the metric of economic impact is often used to express the effects a project has on the local or regional economy. Economic impact analysis generates estimates of the total changes in output (sales), employment and earnings that result from a project. While these metrics do not help answer the question of whether or not a project actually is beneficial for society in the sense of increasing aggregate well-being, they are understandably of interest to local communities and policy makers. Furthermore, the economic impacts of reef restoration can be compared to the impacts from other, competing projects such as oyster shell put-and-take programs or coastal hardening, indicating the relative performance of reef restoration in terms of economic impacts. Spatial Scope of the Project The restoration project assessed in this study is a planned oyster reef restoration project comprising two sites at the western and eastern ends of Mobile Bay, Alabama. The Nature Conservancy has been carrying out several oyster reef restoration projects in the area, at Coffee Island (Portersville Bay) and in Alabama Port and Helen Wood Park (Mobile Bay) (Figure
7
1), while the Alabama Department of Conservation of Natural Resources and Dauphin Island Sea Lab have restored reefs along much of Little Bay.4 These projects form part of the sites targeted by the 100-1000 Restore Coastal Alabama Partnership, which aims to restore 100 miles of oyster reefs along the Alabama coast (indicated by the light blue areas in Figure 2-1), protecting more than 1000 acres of saltwater marsh and sea grass habitats.
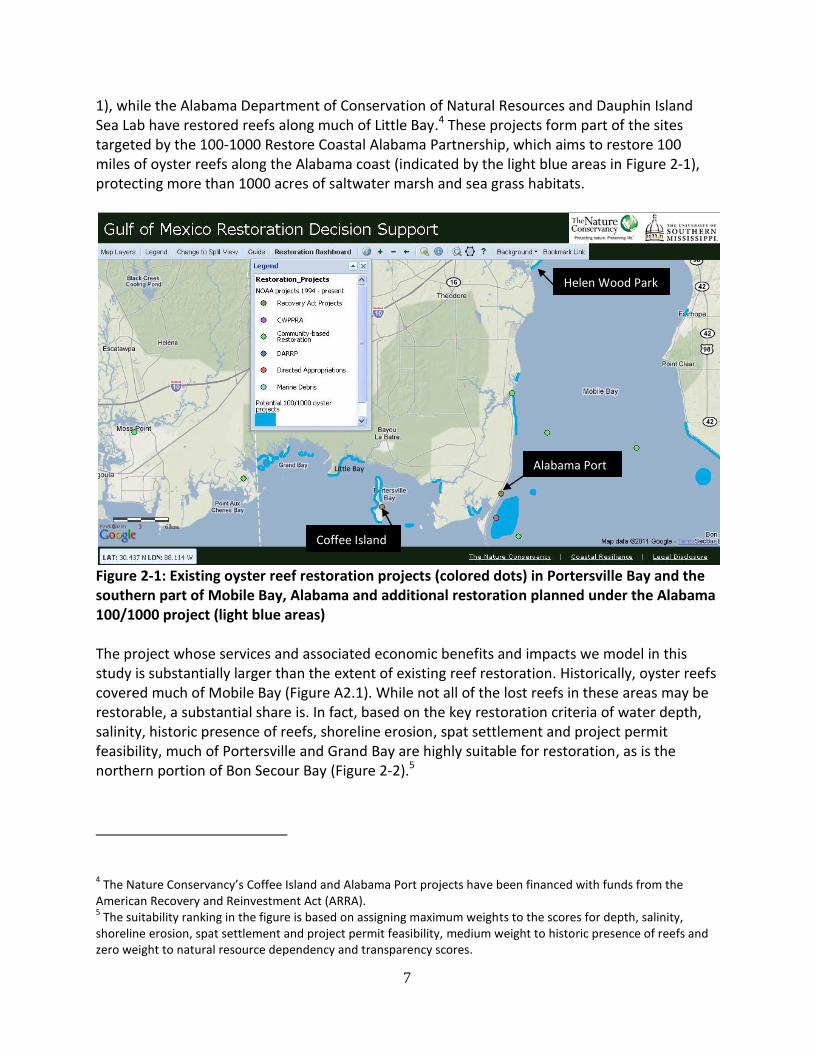
Figure 2-1: Existing oyster reef restoration projects (colored dots) in Portersville Bay and the southern part of Mobile Bay, Alabama and additional restoration planned under the Alabama 100/1000 project (light blue areas) The project whose services and associated economic benefits and impacts we model in this study is substantially larger than the extent of existing reef restoration. Historically, oyster reefs covered much of Mobile Bay (Figure A2.1). While not all of the lost reefs in these areas may be restorable, a substantial share is. In fact, based on the key restoration criteria of water depth, salinity, historic presence of reefs, shoreline erosion, spat settlement and project permit feasibility, much of Portersville and Grand Bay are highly suitable for restoration, as is the northern portion of Bon Secour Bay (Figure 2-2).5
4 The Nature Conservancy’s Coffee Island and Alabama Port projects have been financed with funds from the
American Recovery and Reinvestment Act (ARRA). 5 The suitability ranking in the figure is based on assigning maximum weights to the scores for depth, salinity,
shoreline erosion, spat settlement and project permit feasibility, medium weight to historic presence of reefs and zero weight to natural resource dependency and transparency scores.
Coffee Island
Alabama Port
Helen Wood Park
Little Bay
8
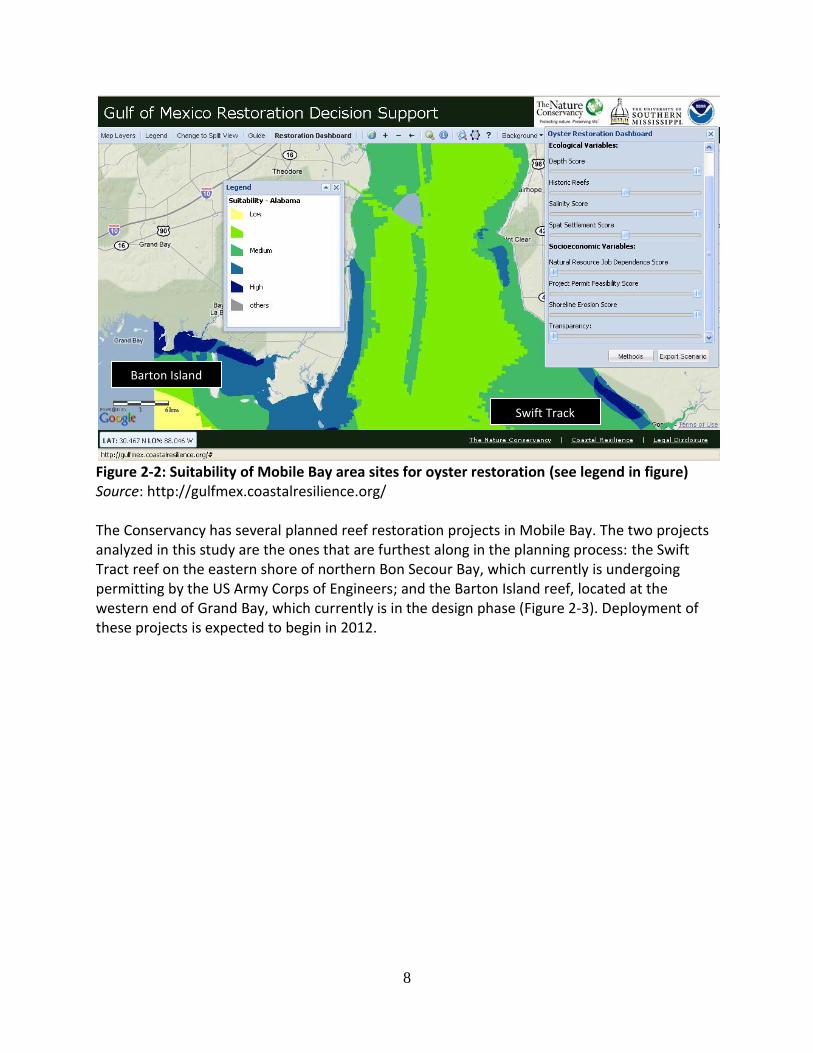
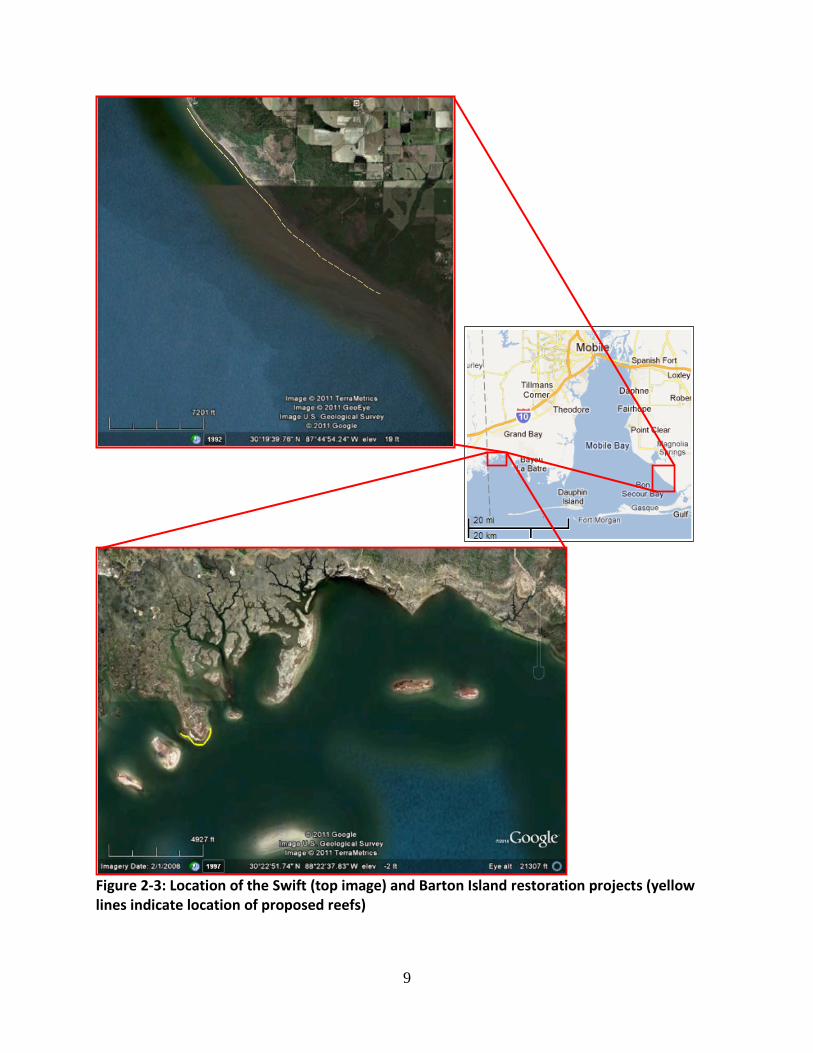
Figure 2-2: Suitability of Mobile Bay area sites for oyster restoration (see legend in figure) Source: http://gulfmex.coastalresilience.org/ The Conservancy has several planned reef restoration projects in Mobile Bay. The two projects analyzed in this study are the ones that are furthest along in the planning process: the Swift Tract reef on the eastern shore of northern Bon Secour Bay, which currently is undergoing permitting by the US Army Corps of Engineers; and the Barton Island reef, located at the western end of Grand Bay, which currently is in the design phase (Figure 2-3). Deployment of these projects is expected to begin in 2012.
Barton Island
Swift Track
9
Figure 2-3: Location of the Swift (top image) and Barton Island restoration projects (yellow lines indicate location of proposed reefs)
10
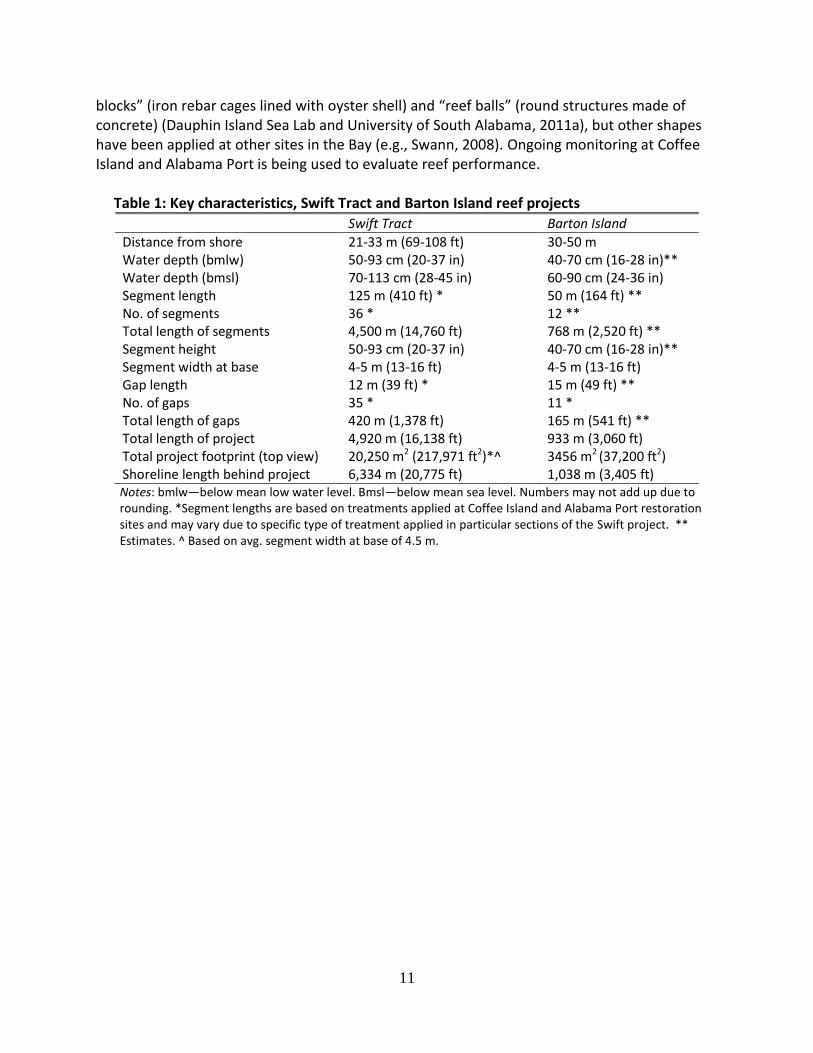
Ecosystem service flows included in the analysis This study develops quantitative estimates of the flows of three ecosystem services that the planned oyster reef restoration projects at Swift Tract and Barton Island would provide. The three services we focus on are those best documented in the literature: the enhancement of fisheries; the attenuation of waves at the shoreline behind reefs; and the removal of nitrogen from the water column. Our fishery enhancement and denitrification estimates for the two projects are based on findings reported in peer-reviewed studies. Most of these studies were conducted in Mobile Bay area, while a few have a larger geographic scope. Our wave attenuation estimates are generated through application of standard hydraulic modeling to reefs (Tallis et al., 2011). Because some of the fishery enhancement estimates in the scientific literature are from reefs that differ structurally from the planned Swift Tract and Barton Island reefs, we compare those estimates with measurements from recent reef restoration sites in Mobile Bay that employ a design similar to that the Swift Tract and Barton Island reefs will feature. These measurements are from two heavily monitored restored reefs at Coffee Island (constructed in spring 2010) and Alabama Port (constructed in 2011). Monitoring data for these sites include oyster production, diversity and abundance of populations of fish and shellfish species, and shoreline erosion.6 While ideally a study of the local economic benefits and impacts from oyster reef restoration would use measured changes in ecosystem service flows at mature restoration sites, there is no mature site in Mobile Bay for which such data are being collected.7 The existing restoration projects in the area for which monitoring data are available are so new that they are not yet producing the full flows of the ecosystem services examined in this study. For these reasons, our approach of scaling literature data reported for other sites to our study sites—cross-checked with local measurements of service flows from young restoration sites—represents the only available option of generating service flow estimates for mature restoration projects in our study area. Reef characteristics The overall characteristics of the two reefs analyzed in this study are shown in Table 1. Their high vertical relief sets these reefs and all other recent Conservancy reefs apart from less permanent structures employed in some research studies in the Mobile Bay (e.g., Scyphers et al., 2011; Stricklin et al., 2011). The reefs themselves may be constructed using a range of different materials. Recent restoration projects in Mobile Bay used bagged oyster shell; “reef
6 Monitoring comprises both pre-construction and post-construction, with quarterly reports for prepared by
Dauphin Island Sea Lab and the University of South Alabama. 7 The Nature Conservancy does have restored reefs in other areas of the Gulf that are older than the Coffee Island
reef.
11
blocks” (iron rebar cages lined with oyster shell) and “reef balls” (round structures made of concrete) (Dauphin Island Sea Lab and University of South Alabama, 2011a), but other shapes have been applied at other sites in the Bay (e.g., Swann, 2008). Ongoing monitoring at Coffee Island and Alabama Port is being used to evaluate reef performance.
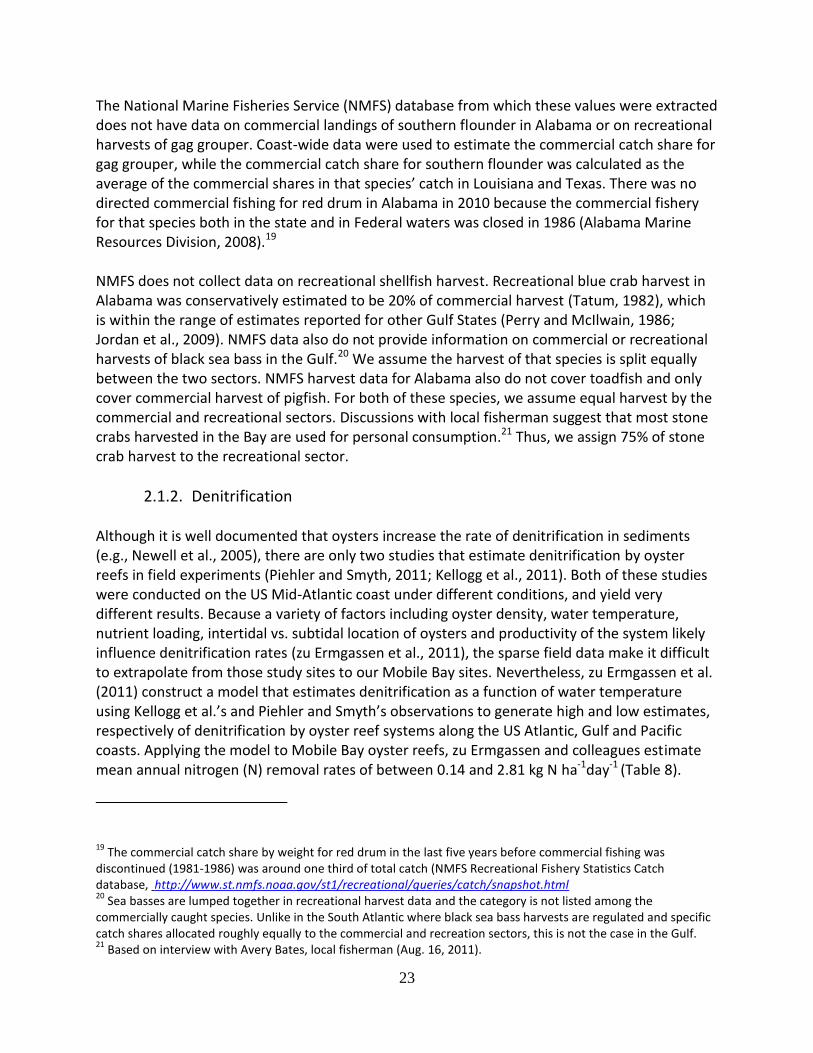
Table 1: Key characteristics, Swift Tract and Barton Island reef projects
Swift Tract Barton Island
Distance from shore 21-33 m (69-108 ft) 30-50 m Water depth (bmlw) 50-93 cm (20-37 in) 40-70 cm (16-28 in)** Water depth (bmsl) 70-113 cm (28-45 in) 60-90 cm (24-36 in) Segment length 125 m (410 ft) * 50 m (164 ft) ** No. of segments 36 * 12 ** Total length of segments 4,500 m (14,760 ft) 768 m (2,520 ft) ** Segment height 50-93 cm (20-37 in) 40-70 cm (16-28 in)** Segment width at base 4-5 m (13-16 ft) 4-5 m (13-16 ft) Gap length 12 m (39 ft) * 15 m (49 ft) ** No. of gaps 35 * 11 * Total length of gaps 420 m (1,378 ft) 165 m (541 ft) ** Total length of project 4,920 m (16,138 ft) 933 m (3,060 ft) Total project footprint (top view) 20,250 m2 (217,971 ft2)*^ 3456 m2 (37,200 ft2) Shoreline length behind project 6,334 m (20,775 ft) 1,038 m (3,405 ft) Notes: bmlw—below mean low water level. Bmsl—below mean sea level. Numbers may not add up due to rounding. *Segment lengths are based on treatments applied at Coffee Island and Alabama Port restoration sites and may vary due to specific type of treatment applied in particular sections of the Swift project. ** Estimates. ^ Based on avg. segment width at base of 4.5 m.
12
2.1. Estimates of Increases in Ecosystem Service Flows from Restored Oyster Reefs in Mobile Bay
In this section, we develop estimates of the service flows for each of the three services analyzed in this study. The economic benefits and impacts associated with these flows then are analyzed in sections 2 and 3, respectively.
2.1.1. Augmented Finfish and Crab Production from Restored Oyster Reefs
Reefs increase fish and crustacean production in two ways (Peterson et al., 2003). First, reefs increase the abundance of both highly and less reef-dependent species by enhancing recruitment, where recruitment is defined as the survival of individuals to a size that can be reliably censused. This adds additional fish and crustaceans to the system. Second, reefs also enhance fish and crustacean production by enhancing survival of reef-associated species that use the reef structure to seek refuge from predation, and by increasing the availability of reef-associated prey resources. This second pathway does not add new fish or crustaceans, but rather enhances survival of existing (i.e., post-recruitment) individuals and subsidizes their growth. Peterson et al. (2003) review six studies for the Southeastern US that compare differences in fish and crustacean abundance, respectively, between oyster reefs and nearby unstructured sedimentary (sand/mud) areas. Synthesizing the findings of those studies, Peterson et al. (2003) quantify the relative abundance enhancement effect specific fish and crustacean species experience in the presence of oyster reefs. Using species-specific density estimates, age distributions and growth curves, and scaling the observed enhancement effect by the percentage of food a particular species derives from reefs vs. mud/sand or open-water habitats, the authors then develop estimates of the annual increase in the biomass of reef-enhanced species, for the subset of species identified as reef-enhanced that is found in Tampa Bay, Florida, the focus of their study.
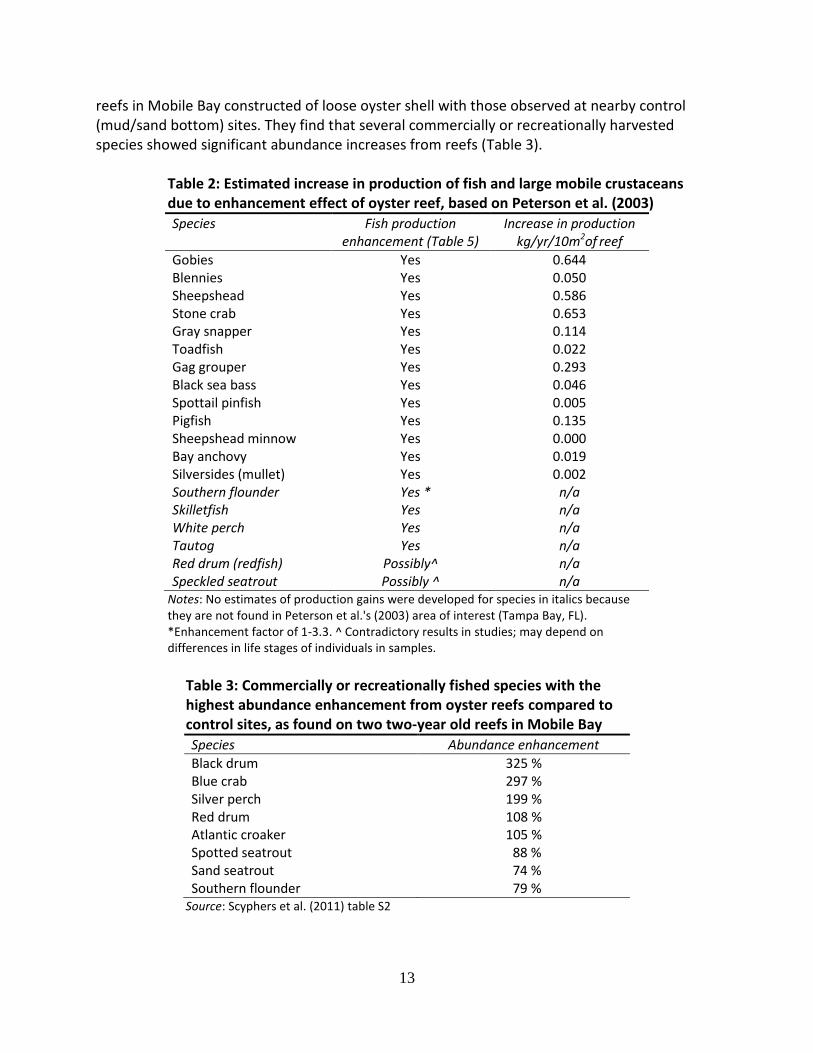
In addition to the species for which Peterson et al. (2003) estimate quantitative enhancement values, Table 2 also shows six species whose production their review indicates is, or possibly may be, enhanced by oyster reefs but for which the authors do not develop quantitative enhancement estimates because these species or close equivalents are not found in their area of interest. Of these, all except for the tautog are fished in Mobile Bay.8 Several other studies since Peterson et al. (2003) provide additional information for the species for which enhancement estimates are not developed by those authors. Scyphers et al. (2011) compare fish and shellfish abundance and community composition at two young breakwater
8 Based on http://www.dcnr.state.al.us/fishing/saltwater/fish.cfm and confirmed in interview with Mr. Avery
Bates, a local Bayou La Batre fisherman on Aug. 16, 2011.
13
reefs in Mobile Bay constructed of loose oyster shell with those observed at nearby control (mud/sand bottom) sites. They find that several commercially or recreationally harvested species showed significant abundance increases from reefs (Table 3).
Table 2: Estimated increase in production of fish and large mobile crustaceans due to enhancement effect of oyster reef, based on Peterson et al. (2003)
Species Fish production enhancement (Table 5)
Increase in production kg/yr/10m2of reef
Gobies Yes 0.644 Blennies Yes 0.050 Sheepshead Yes 0.586 Stone crab Yes 0.653 Gray snapper Yes 0.114 Toadfish Yes 0.022 Gag grouper Yes 0.293 Black sea bass Yes 0.046 Spottail pinfish Yes 0.005 Pigfish Yes 0.135 Sheepshead minnow Yes 0.000 Bay anchovy Yes 0.019 Silversides (mullet) Yes 0.002 Southern flounder Yes * n/a Skilletfish Yes n/a White perch Yes n/a Tautog Yes n/a Red drum (redfish) Possibly^ n/a Speckled seatrout Possibly ^ n/a
Notes: No estimates of production gains were developed for species in italics because they are not found in Peterson et al.'s (2003) area of interest (Tampa Bay, FL). *Enhancement factor of 1-3.3. ^ Contradictory results in studies; may depend on differences in life stages of individuals in samples.
Table 3: Commercially or recreationally fished species with the highest abundance enhancement from oyster reefs compared to control sites, as found on two two-year old reefs in Mobile Bay
Species Abundance enhancement
Black drum 325 % Blue crab 297 % Silver perch 199 % Red drum 108 % Atlantic croaker 105 % Spotted seatrout 88 % Sand seatrout 74 % Southern flounder 79 %
Source: Scyphers et al. (2011) table S2
14
Scyphers et al. (2011) do not report the mean weight of each of these species for the reef or control plots, so their estimates cannot be readily converted into absolute production enhancement values of kg per unit reef area. In another study in Mobile Bay, Gregalis et al. (2009) in 2003-2004 constructed a total of 24 small (25m x 25 m) reefs at three sites characterized by different combinations of sediment type, proximity to established oyster reefs, water quality and water movement patterns. All of the reefs were placed in depths of 2.5 to 3 m. One half of the reefs were high-relief (1 m in height), the other half, low relief (10 cm). Compared with the unstructured bottoms, reefs increased abundance of several species of small demersal fishes and sessile invertebrates but the total abundance on low-relief reefs and unstructured control areas was similar and often greater than that on high-relief reefs. Based on their finding of highly variable responses by resident and transient species to reef restoration, the authors suggest that the predictability of community responses to oyster restoration may be limited due to the interactions among location-specific biophysical characteristics.
A third study in Mobile Bay (Geraldi et al., 2009) found that oyster restoration in tidal salt marsh creeks on or near Dauphin Island in Mobile Bay had a significant positive effect on abundance and a marginally significant effect on biomass of demersal fishes, but not of other groups, although means for all groups were higher after the addition of the reefs. The authors hypothesize that this lack of an increase in all species may be due to the abundance of salt marshes in their study creeks, which in many aspects (e.g., nursery habitat [Minello et al., 2003; Heck et al., 2003]) may be functionally equivalent to oyster reefs and thus may make reefs redundant. The impact of surrounding habitats on the enhancement effect of reefs on fish was also documented by Grabowski et al. (2005) who compared the effect of reefs for seagrass, marsh and sand/mud bottoms areas. Geraldi et al. (2009) separately analyze the enhancement effect of reefs on the five most abundant demersal species at their sites. They find a significant increase in abundance and biomass for southern flounder but a significant decrease for silver perch.9 Scyphers et al. (2011) (Table 3) and monitoring results at the Alabama Port and Coffee Island restoration sites (Dauphin Island Sea Lab and University of South Alabama, 2011b) document positive effects of reefs on both silver perch and southern flounders.10 Anecdotal evidence from the Coffee Island and Alabama Port restoration sites further confirms the positive effect on flounders.11
9 The authors advise caution when interpreting these results because the variances of both species are not
homogenous, which may reduce the reliability of these findings. 10
Silver perch caught at the two restoration sites increased from 28 individuals pre-reconstruction to 38 half a year post reconstruction (Dauphin Island Sea Lab and University of South Alabama, 2011). 11
According to the monitoring data, southern flounders in the samples taken at the two sites increased from zero pre-construction to eight during Aug-Oct. 2010. Local fishermen are now fishing for flounder along (~10 ft distance) the reef restoration projects at Coffee Island and Alabama Port (pers. comm., Judy Haner, Marine Program Director, TNC Alabama; 17 Aug, 2011).
15
The biophysical characteristics of the restored reefs reported on by Gregalis et al. (2009) and Geraldi et al. (2009) differ in important respects from those of the reefs analyzed in this study. Gregalis et al.’s (2009) water depth is much higher than at our study sites (2.5-3.0 m vs. 0.7 m) and their reefs were of different construction (limestone or concrete marl base covered with oyster shell veneer, vs. bagged shell, ReefBLK or reef balls for the two study reefs). Geraldi et al.’s (2009) reefs were located in tidal marsh creeks surrounded by abundant salt marsh, while our restoration sites are located along linear shorelines. Also, their reefs had a much less pronounced vertical relief, with a height of 10 cm compared to our 40-90 cm (Table 1). An increased vertical relief generally is expected to result in an increased fish enhancement effect (e.g., Coen et al., 2007), thus the enhancement effect observed by Geraldi et al.’s (2009) may be smaller than what would be expected at our restoration sites. The reefs constructed by Scyphers et al. (2011) are similar in location and design to those analyzed in our study. Therefore, we expect their findings of clear enhancement of a variety of species, including several economically important ones, to be more indicative of the community impact that will result at the Swift Tract and Barton Island sites. The initially comparably high relief (1 m) of their reefs was reduced to around 0.3 m during the course of their study. Thus, even Scyphers et al.’s (2011) enhancement estimates may be conservative for our sites. This expectation of a clear enhancement effect is supported by the monitoring reports for the Coffee Island and Alabama Port restoration sites (Dauphin Island Sea Lab and University of South Alabama, 2011a). We develop conservative production enhancement estimates for our study area for the species not included in Peterson et al. (2003). To translate Scyphers et al.’s (2011) abundance enhancement estimates (Table 3) into annual production enhancement estimates per unit of additional reef area that can be used to complement Peterson et al.’s production enhancement estimates for additional species important in Mobile Bay, we use their control site catch per unit effort (CPUE, measured as individuals caught per hour) data from their 10 cm mesh size (stretched) gillnet samples.12 Since their gill nets were “soaked” for two hours, we multiply their per-hour CPUE estimates by a factor of two in order to obtain for each species the total mean biomass caught at their control sites during each sampling event. Because here we cannot develop growth- and survivorship-based production enhancement estimates à la Peterson et al. (2003), we need to use a different approach to translate Scyphers et al.’s (2011) enhancement estimates into estimates of annual production enhancement. To do so, we make the explicit assumption that the quantities of fish harvested in their gillnets during their study period are sustainable. This is an arbitrary but reasonable assumption given the imperfect efficiency of gillnets and their relatively low sampling frequency. To obtain annual
12 Since Scyphers et al. report blue crab abundance only for their seine net sampling, we develop estimates for blue
crab separately as described below. We use Scyphers et al.’s 10 cm gillnet data because this gear yielded the highest number of significant findings.
16
production enhancement estimates of the gillnet-size fractions of the species included in our analysis, we multiply Scyphers et al.’s mean catch per sampling by the total number of sampling events (40) and divide the result by 2.5 to scale the estimate of the mean total biomass of each species caught during 30 months of sampling events to one year, the time period for which Peterson et al. give their enhancement estimates (Table 2).13 We then multiply this mean annual control site catch by Scyphers et al.’s (2011) respective enhancement factors (Table 3) and by Geraldi et al.’s (2009) mean biomass values for the respective species.14 Scyphers et al.’s CPUE estimates are for 75 m long and 5 m wide reef treatments (three 25-m sections), with 30 m gillnets placed on each side of the reef complex perpendicular to the shore. Thus, their catch data are for a reef with a 375 m2 footprint. Therefore, we divide our annual production enhancement estimates by a factor of 37.5 to obtain production enhancement estimates per 10 m2 of reef as reported in Peterson et al. (2003). For the four species of interest for which Scyphers et al. also provide 5 cm gillnet data (spotted seatrout, sand seatrout, Atlantic croaker and silver perch), we repeated the above procedure for the 5-cm sample results and then added the two production enhancement estimates.15 For blue crabs, Scyphers et al. report results from seine net samples only, presumably because gillnetting is a very inefficient technique for that species. Seines catch a much wider size range of blue crab than gillnets. To convert Scyphers et al.’s seine results into their approximate gillnet equivalent, we use the gillnet (5 cm stretched mesh size) and seine results for abundance of blue crabs reported in Geraldi et al. (2009). Multiplying Scyphers et al.’s blue crab abundance at their control sites of 0.01 individuals/m2 by Geraldi et al.’s gillnet-to-seine abundance ratio for blue crabs of 0.3 yields an imputed gillnet abundance at Scyphers et al.’s control sites of 0.003 individuals/m2, assuming that the size distributions of crabs at the sites examined in the two studies are the same.16 Multiplying this imputed number of gillnet-size crabs that would have been caught by a gillnet with 5 cm mesh size at Scyphers et al.’s control sites by the mean weight of the gillnet-sampled blue crabs reported in Geraldi et al. of 163.7 g yields an imputed control site biomass of gillnetted crabs of 0.5 g/m2 of reef, or 5 g/10 m2 of reef. Multiplying this biomass by Scyphers et al.’s blue crab enhancement factor of 297% yields an estimated production enhancement of 15 g/10 m2 of reef for gillnet-size blue crabs, assuming that the enhancement effect of oyster reefs on blue crabs is identical across crab size classes. Scaled from the mean sampling event to one year (during which 16 sampling events occurred), this
13 Scyphers et al. (2011) report that gillnet samples were taken twice per month for one year following
construction (June 2007-May 2008; 24 events) and monthly thereafter (June-November 2008; March-November 2009; 15 events) except every other month during winter months (December 2008-February 2009; 1 event), for a total of 40 sampling events. 14
Because Scyphers et al. (2011) do not report mean biomass for control or treatment sites, we use Geraldi et al.’s (2009) values. 15
Scyphers et al.’s 30 m gillnets deployed on each side of a reef complex were composed of two 15 m-long panels each, one with 5 cm mesh size and one with 10 cm mesh size. Thus, the results from the two net sizes can be combined. 16
Geraldi et al.’s crab abundance is 0.05 individuals per m2
(avg. control and treatment sites; fig. 7) for their gillnet samples and 0.17 individuals per m
2 (avg. treatment and control; 1672/9959 m
2, table 1) for their seine samples.
17
translates to an estimated production enhancement of (5 cm gillnet-sized crabs) of 229 g/10 m2
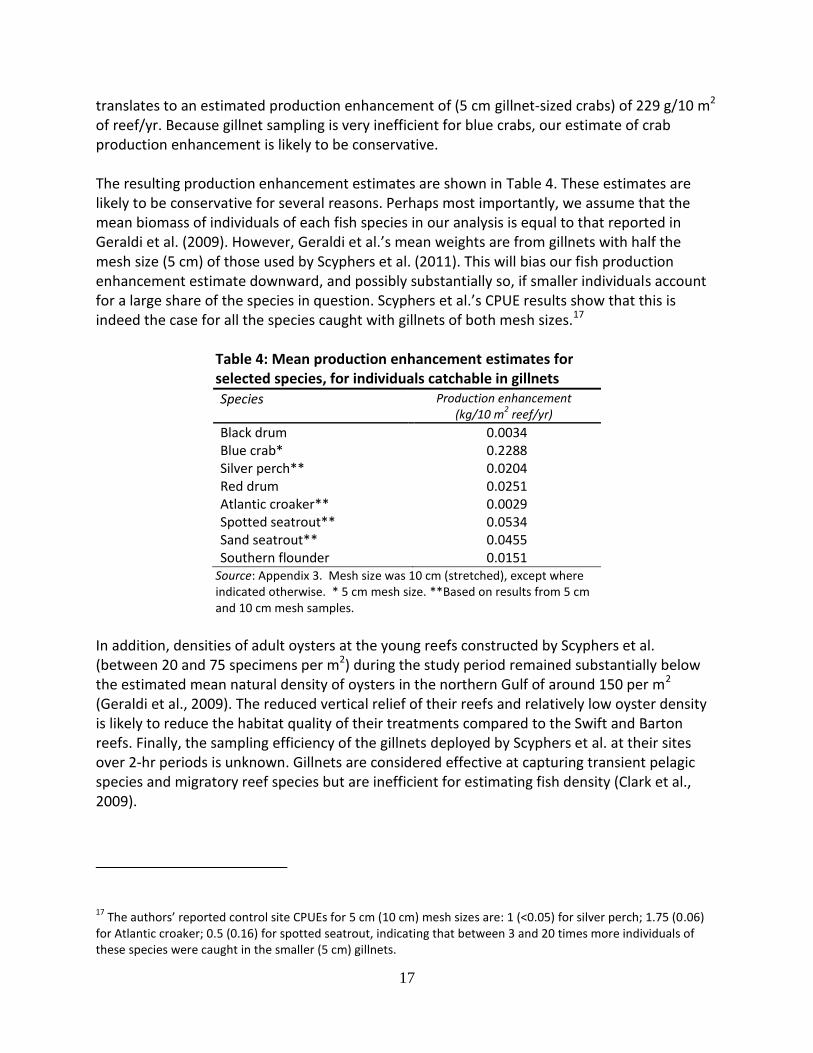
of reef/yr. Because gillnet sampling is very inefficient for blue crabs, our estimate of crab production enhancement is likely to be conservative. The resulting production enhancement estimates are shown in Table 4. These estimates are likely to be conservative for several reasons. Perhaps most importantly, we assume that the mean biomass of individuals of each fish species in our analysis is equal to that reported in Geraldi et al. (2009). However, Geraldi et al.’s mean weights are from gillnets with half the mesh size (5 cm) of those used by Scyphers et al. (2011). This will bias our fish production enhancement estimate downward, and possibly substantially so, if smaller individuals account for a large share of the species in question. Scyphers et al.’s CPUE results show that this is indeed the case for all the species caught with gillnets of both mesh sizes.17
Table 4: Mean production enhancement estimates for selected species, for individuals catchable in gillnets
Species Production enhancement (kg/10 m
2 reef/yr)
Black drum 0.0034 Blue crab* 0.2288 Silver perch** 0.0204 Red drum 0.0251 Atlantic croaker** 0.0029 Spotted seatrout** 0.0534 Sand seatrout** 0.0455 Southern flounder 0.0151
Source: Appendix 3. Mesh size was 10 cm (stretched), except where indicated otherwise. * 5 cm mesh size. **Based on results from 5 cm and 10 cm mesh samples.
In addition, densities of adult oysters at the young reefs constructed by Scyphers et al. (between 20 and 75 specimens per m2) during the study period remained substantially below the estimated mean natural density of oysters in the northern Gulf of around 150 per m2 (Geraldi et al., 2009). The reduced vertical relief of their reefs and relatively low oyster density is likely to reduce the habitat quality of their treatments compared to the Swift and Barton reefs. Finally, the sampling efficiency of the gillnets deployed by Scyphers et al. at their sites over 2-hr periods is unknown. Gillnets are considered effective at capturing transient pelagic species and migratory reef species but are inefficient for estimating fish density (Clark et al., 2009).
17 The authors’ reported control site CPUEs for 5 cm (10 cm) mesh sizes are: 1 (<0.05) for silver perch; 1.75 (0.06)
for Atlantic croaker; 0.5 (0.16) for spotted seatrout, indicating that between 3 and 20 times more individuals of these species were caught in the smaller (5 cm) gillnets.
18
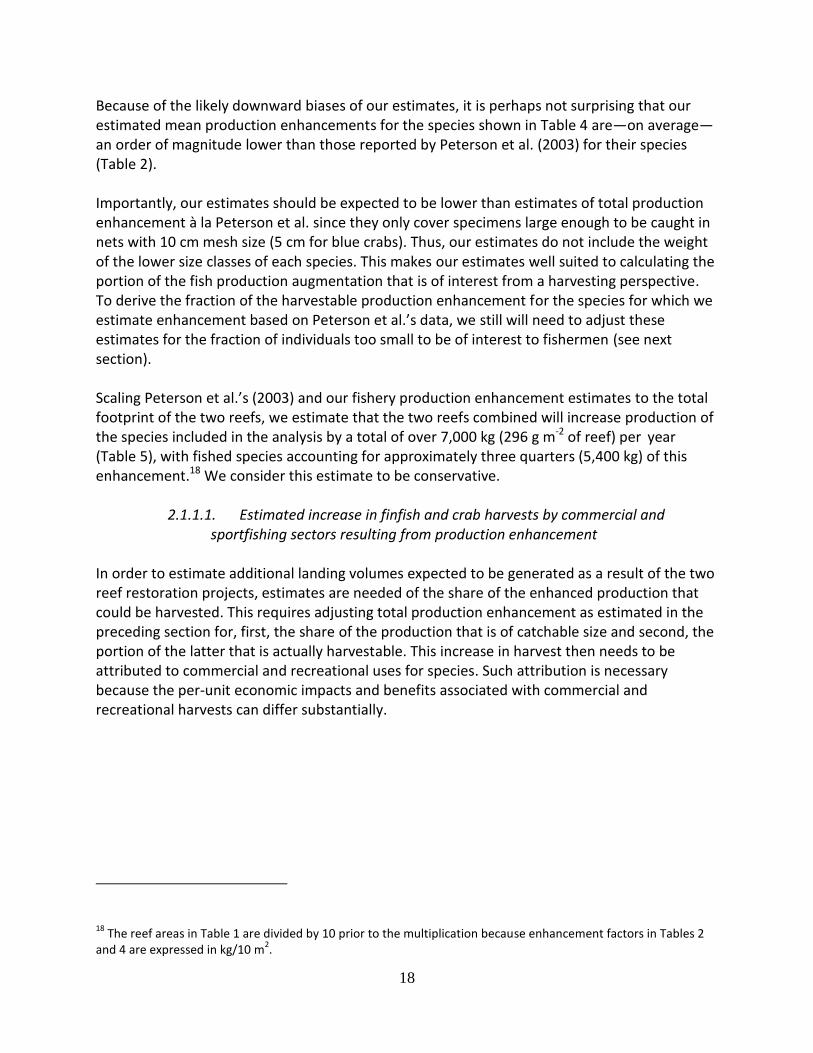
Because of the likely downward biases of our estimates, it is perhaps not surprising that our estimated mean production enhancements for the species shown in Table 4 are—on average—an order of magnitude lower than those reported by Peterson et al. (2003) for their species (Table 2). Importantly, our estimates should be expected to be lower than estimates of total production enhancement à la Peterson et al. since they only cover specimens large enough to be caught in nets with 10 cm mesh size (5 cm for blue crabs). Thus, our estimates do not include the weight of the lower size classes of each species. This makes our estimates well suited to calculating the portion of the fish production augmentation that is of interest from a harvesting perspective. To derive the fraction of the harvestable production enhancement for the species for which we estimate enhancement based on Peterson et al.’s data, we still will need to adjust these estimates for the fraction of individuals too small to be of interest to fishermen (see next section). Scaling Peterson et al.’s (2003) and our fishery production enhancement estimates to the total footprint of the two reefs, we estimate that the two reefs combined will increase production of the species included in the analysis by a total of over 7,000 kg (296 g m-2 of reef) per year (Table 5), with fished species accounting for approximately three quarters (5,400 kg) of this enhancement.18 We consider this estimate to be conservative.
2.1.1.1. Estimated increase in finfish and crab harvests by commercial and sportfishing sectors resulting from production enhancement
In order to estimate additional landing volumes expected to be generated as a result of the two reef restoration projects, estimates are needed of the share of the enhanced production that could be harvested. This requires adjusting total production enhancement as estimated in the preceding section for, first, the share of the production that is of catchable size and second, the portion of the latter that is actually harvestable. This increase in harvest then needs to be attributed to commercial and recreational uses for species. Such attribution is necessary because the per-unit economic impacts and benefits associated with commercial and recreational harvests can differ substantially.
18 The reef areas in Table 1 are divided by 10 prior to the multiplication because enhancement factors in Tables 2
and 4 are expressed in kg/10 m2.
19
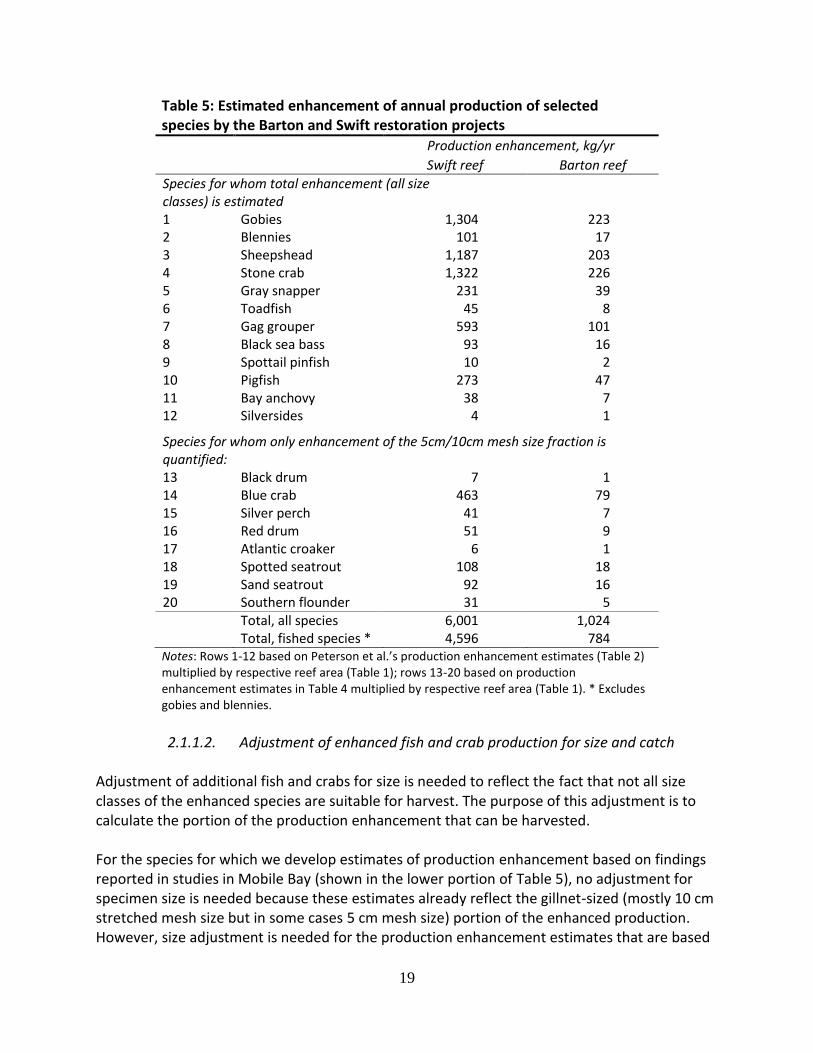
Table 5: Estimated enhancement of annual production of selected species by the Barton and Swift restoration projects
Production enhancement, kg/yr
Swift reef Barton reef
Species for whom total enhancement (all size classes) is estimated 1 Gobies 1,304 223 2 Blennies 101 17 3 Sheepshead 1,187 203 4 Stone crab 1,322 226 5 Gray snapper 231 39 6 Toadfish 45 8 7 Gag grouper 593 101 8 Black sea bass 93 16 9 Spottail pinfish 10 2 10 Pigfish 273 47 11 Bay anchovy 38 7 12 Silversides 4 1
Species for whom only enhancement of the 5cm/10cm mesh size fraction is quantified: 13 Black drum 7 1 14 Blue crab 463 79 15 Silver perch 41 7 16 Red drum 51 9 17 Atlantic croaker 6 1 18 Spotted seatrout 108 18 19 Sand seatrout 92 16 20 Southern flounder 31 5 Total, all species 6,001 1,024 Total, fished species * 4,596 784 Notes: Rows 1-12 based on Peterson et al.’s production enhancement estimates (Table 2) multiplied by respective reef area (Table 1); rows 13-20 based on production enhancement estimates in Table 4 multiplied by respective reef area (Table 1). * Excludes gobies and blennies.
2.1.1.2. Adjustment of enhanced fish and crab production for size and catch
Adjustment of additional fish and crabs for size is needed to reflect the fact that not all size classes of the enhanced species are suitable for harvest. The purpose of this adjustment is to calculate the portion of the production enhancement that can be harvested. For the species for which we develop estimates of production enhancement based on findings reported in studies in Mobile Bay (shown in the lower portion of Table 5), no adjustment for specimen size is needed because these estimates already reflect the gillnet-sized (mostly 10 cm stretched mesh size but in some cases 5 cm mesh size) portion of the enhanced production. However, size adjustment is needed for the production enhancement estimates that are based
20
on Peterson et al.’s (2003) enhancement estimates (shown in the upper portion of Table 5). Peterson et al. (2003) expect that their estimated annual fish and crab production enhancement values can be maintained over the functional lifetime of the reef, provided that reefs are protected from destructive oyster harvesting techniques, and calculate the estimated landings value of the production enhancement by multiplying enhancement by dockside prices for their species (Peterson et al., 2007). However, their enhancement estimates represent the total increased production across all age classes, yet some of their species are commercially valuable or even harvestable only from age class 2 or 3 (see Peterson et al., 2003, table 3).
To adjust Peterson et al.’s (2003) enhancement values for suitability for harvest based on size, we use the data provided in that study to develop estimates of the mean length and weight of each age class for the various species, as well as the proportion of each age class of a species that survives until reaching the next age class, taking into account species-specific mortality rates from natural causes and from fishing. From the age class-specific survival rates we calculate the cumulative survival rate for each age class and species. We then multiply for each age class of a species the mean weight of individuals in that age class with the cumulative survival rate to obtain the survivorship-weighted mean weight by age class for each species. Dividing the survivorship-weighted mean weight of each age class by the sum of the mean weights of all age classes of a given species yields the distribution (in percent) of the total weight of each species across all age classes. Summing the share of each species’ total weight that falls into age classes that are below harvestable age—determined based on data reported in Peterson et al. (2003)—yields the percentage of each species’ total production enhancement that is accounted for by specimens of below harvestable size (Table A4.7). These are the percentages by which we reduce those of our enhancement estimates (top portion in Table 5) that are based on Peterson et al.’s enhancement estimates. The harvestable production enhancement of fished species that is expected to result from the restoration of the Swift and Barton Island reefs is estimated at approximately 3,140 kg/yr, or 58% of the total enhanced production of fished species (Table 6).
21
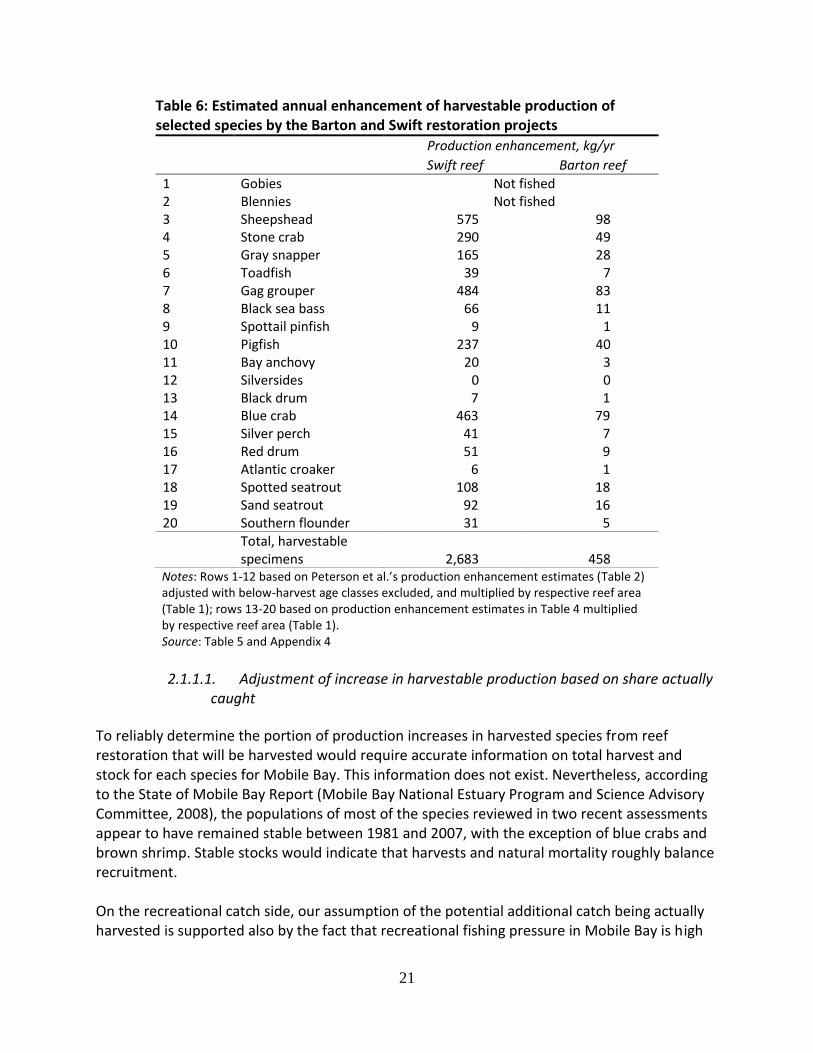
Table 6: Estimated annual enhancement of harvestable production of selected species by the Barton and Swift restoration projects
Production enhancement, kg/yr
Swift reef Barton reef
1 Gobies Not fished 2 Blennies Not fished 3 Sheepshead 575 98 4 Stone crab 290 49 5 Gray snapper 165 28 6 Toadfish 39 7 7 Gag grouper 484 83 8 Black sea bass 66 11 9 Spottail pinfish 9 1 10 Pigfish 237 40 11 Bay anchovy 20 3 12 Silversides 0 0 13 Black drum 7 1 14 Blue crab 463 79 15 Silver perch 41 7 16 Red drum 51 9 17 Atlantic croaker 6 1 18 Spotted seatrout 108 18 19 Sand seatrout 92 16 20 Southern flounder 31 5 Total, harvestable
specimens 2,683 458 Notes: Rows 1-12 based on Peterson et al.’s production enhancement estimates (Table 2) adjusted with below-harvest age classes excluded, and multiplied by respective reef area (Table 1); rows 13-20 based on production enhancement estimates in Table 4 multiplied by respective reef area (Table 1). Source: Table 5 and Appendix 4
2.1.1.1. Adjustment of increase in harvestable production based on share actually
caught
To reliably determine the portion of production increases in harvested species from reef restoration that will be harvested would require accurate information on total harvest and stock for each species for Mobile Bay. This information does not exist. Nevertheless, according to the State of Mobile Bay Report (Mobile Bay National Estuary Program and Science Advisory Committee, 2008), the populations of most of the species reviewed in two recent assessments appear to have remained stable between 1981 and 2007, with the exception of blue crabs and brown shrimp. Stable stocks would indicate that harvests and natural mortality roughly balance recruitment. On the recreational catch side, our assumption of the potential additional catch being actually harvested is supported also by the fact that recreational fishing pressure in Mobile Bay is high
22
(Dute, 2011). Because our estimates of harvestable production enhancement (Table 6) due to reef restoration are already corrected for natural mortality and specimens of below harvestable age, we do not adjust our production enhancement estimates further and instead make the assumption that they fully translate into additional harvests.
2.1.1.2. Apportionment of additional harvest volume to recreational and commercial fisheries
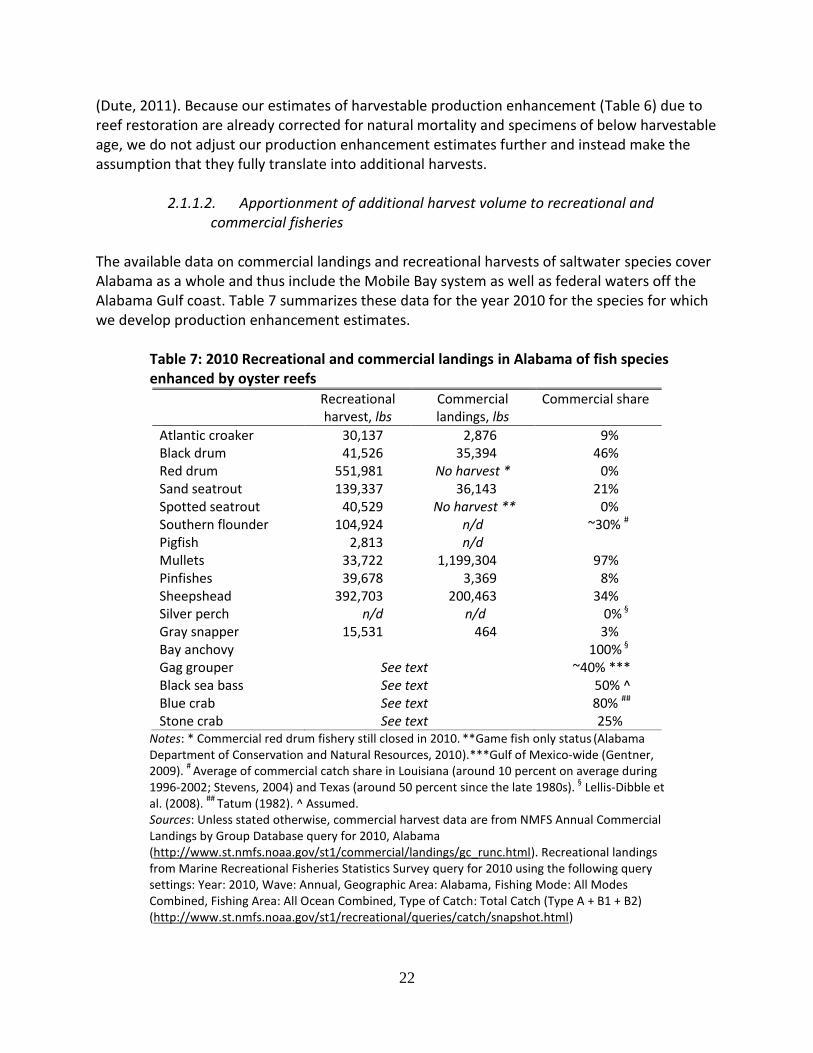
The available data on commercial landings and recreational harvests of saltwater species cover Alabama as a whole and thus include the Mobile Bay system as well as federal waters off the Alabama Gulf coast. Table 7 summarizes these data for the year 2010 for the species for which we develop production enhancement estimates.
Table 7: 2010 Recreational and commercial landings in Alabama of fish species enhanced by oyster reefs
Recreational harvest, lbs
Commercial landings, lbs
Commercial share
Atlantic croaker 30,137 2,876 9% Black drum 41,526 35,394 46% Red drum 551,981 No harvest * 0% Sand seatrout 139,337 36,143 21% Spotted seatrout 40,529 No harvest ** 0% Southern flounder 104,924 n/d ~30% # Pigfish 2,813 n/d Mullets 33,722 1,199,304 97% Pinfishes 39,678 3,369 8% Sheepshead 392,703 200,463 34% Silver perch n/d n/d 0% § Gray snapper 15,531 464 3% Bay anchovy 100% § Gag grouper See text ~40% *** Black sea bass See text 50% ^ Blue crab See text 80% ##
Stone crab See text 25% Notes: * Commercial red drum fishery still closed in 2010. **Game fish only status (Alabama Department of Conservation and Natural Resources, 2010).***Gulf of Mexico-wide (Gentner, 2009).
# Average of commercial catch share in Louisiana (around 10 percent on average during
1996-2002; Stevens, 2004) and Texas (around 50 percent since the late 1980s). § Lellis-Dibble et
al. (2008). ##
Tatum (1982). ^ Assumed.
Sources: Unless stated otherwise, commercial harvest data are from NMFS Annual Commercial Landings by Group Database query for 2010, Alabama (http://www.st.nmfs.noaa.gov/st1/commercial/landings/gc_runc.html). Recreational landings from Marine Recreational Fisheries Statistics Survey query for 2010 using the following query settings: Year: 2010, Wave: Annual, Geographic Area: Alabama, Fishing Mode: All Modes Combined, Fishing Area: All Ocean Combined, Type of Catch: Total Catch (Type A + B1 + B2) (http://www.st.nmfs.noaa.gov/st1/recreational/queries/catch/snapshot.html)
23
The National Marine Fisheries Service (NMFS) database from which these values were extracted does not have data on commercial landings of southern flounder in Alabama or on recreational harvests of gag grouper. Coast-wide data were used to estimate the commercial catch share for gag grouper, while the commercial catch share for southern flounder was calculated as the average of the commercial shares in that species’ catch in Louisiana and Texas. There was no directed commercial fishing for red drum in Alabama in 2010 because the commercial fishery for that species both in the state and in Federal waters was closed in 1986 (Alabama Marine Resources Division, 2008).19 NMFS does not collect data on recreational shellfish harvest. Recreational blue crab harvest in Alabama was conservatively estimated to be 20% of commercial harvest (Tatum, 1982), which is within the range of estimates reported for other Gulf States (Perry and McIlwain, 1986; Jordan et al., 2009). NMFS data also do not provide information on commercial or recreational harvests of black sea bass in the Gulf.20 We assume the harvest of that species is split equally between the two sectors. NMFS harvest data for Alabama also do not cover toadfish and only cover commercial harvest of pigfish. For both of these species, we assume equal harvest by the commercial and recreational sectors. Discussions with local fisherman suggest that most stone crabs harvested in the Bay are used for personal consumption.21 Thus, we assign 75% of stone crab harvest to the recreational sector.
2.1.2. Denitrification Although it is well documented that oysters increase the rate of denitrification in sediments (e.g., Newell et al., 2005), there are only two studies that estimate denitrification by oyster reefs in field experiments (Piehler and Smyth, 2011; Kellogg et al., 2011). Both of these studies were conducted on the US Mid-Atlantic coast under different conditions, and yield very different results. Because a variety of factors including oyster density, water temperature, nutrient loading, intertidal vs. subtidal location of oysters and productivity of the system likely influence denitrification rates (zu Ermgassen et al., 2011), the sparse field data make it difficult to extrapolate from those study sites to our Mobile Bay sites. Nevertheless, zu Ermgassen et al. (2011) construct a model that estimates denitrification as a function of water temperature using Kellogg et al.’s and Piehler and Smyth’s observations to generate high and low estimates, respectively of denitrification by oyster reef systems along the US Atlantic, Gulf and Pacific coasts. Applying the model to Mobile Bay oyster reefs, zu Ermgassen and colleagues estimate mean annual nitrogen (N) removal rates of between 0.14 and 2.81 kg N ha-1day-1 (Table 8).
19 The commercial catch share by weight for red drum in the last five years before commercial fishing was
discontinued (1981-1986) was around one third of total catch (NMFS Recreational Fishery Statistics Catch database, http://www.st.nmfs.noaa.gov/st1/recreational/queries/catch/snapshot.html 20
Sea basses are lumped together in recreational harvest data and the category is not listed among the commercially caught species. Unlike in the South Atlantic where black sea bass harvests are regulated and specific catch shares allocated roughly equally to the commercial and recreation sectors, this is not the case in the Gulf. 21
Based on interview with Avery Bates, local fisherman (Aug. 16, 2011).
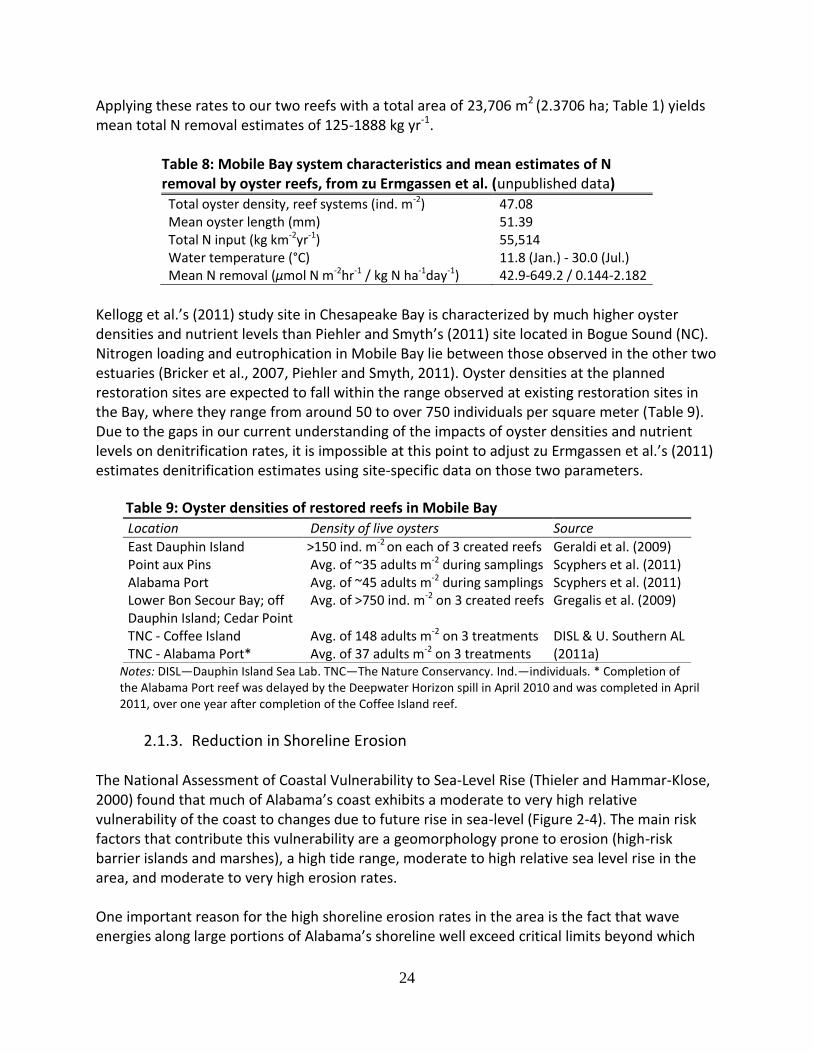
24
Applying these rates to our two reefs with a total area of 23,706 m2 (2.3706 ha; Table 1) yields mean total N removal estimates of 125-1888 kg yr-1.
Table 8: Mobile Bay system characteristics and mean estimates of N removal by oyster reefs, from zu Ermgassen et al. (unpublished data)
Total oyster density, reef systems (ind. m-2) 47.08 Mean oyster length (mm) 51.39 Total N input (kg km-2yr-1) 55,514 Water temperature (°C) 11.8 (Jan.) - 30.0 (Jul.) Mean N removal (μmol N m-2hr-1 / kg N ha-1day-1) 42.9-649.2 / 0.144-2.182
Kellogg et al.’s (2011) study site in Chesapeake Bay is characterized by much higher oyster densities and nutrient levels than Piehler and Smyth’s (2011) site located in Bogue Sound (NC). Nitrogen loading and eutrophication in Mobile Bay lie between those observed in the other two estuaries (Bricker et al., 2007, Piehler and Smyth, 2011). Oyster densities at the planned restoration sites are expected to fall within the range observed at existing restoration sites in the Bay, where they range from around 50 to over 750 individuals per square meter (Table 9). Due to the gaps in our current understanding of the impacts of oyster densities and nutrient levels on denitrification rates, it is impossible at this point to adjust zu Ermgassen et al.’s (2011) estimates denitrification estimates using site-specific data on those two parameters.
Table 9: Oyster densities of restored reefs in Mobile Bay
Location Density of live oysters Source
East Dauphin Island >150 ind. m-2 on each of 3 created reefs Geraldi et al. (2009) Point aux Pins Avg. of ~35 adults m-2 during samplings Scyphers et al. (2011) Alabama Port Avg. of ~45 adults m-2 during samplings Scyphers et al. (2011) Lower Bon Secour Bay; off Dauphin Island; Cedar Point
Avg. of >750 ind. m-2 on 3 created reefs Gregalis et al. (2009)
TNC - Coffee Island Avg. of 148 adults m-2 on 3 treatments DISL & U. Southern AL (2011a) TNC - Alabama Port* Avg. of 37 adults m-2 on 3 treatments
Notes: DISL—Dauphin Island Sea Lab. TNC—The Nature Conservancy. Ind.—individuals. * Completion of the Alabama Port reef was delayed by the Deepwater Horizon spill in April 2010 and was completed in April 2011, over one year after completion of the Coffee Island reef.
2.1.3. Reduction in Shoreline Erosion The National Assessment of Coastal Vulnerability to Sea-Level Rise (Thieler and Hammar-Klose, 2000) found that much of Alabama’s coast exhibits a moderate to very high relative vulnerability of the coast to changes due to future rise in sea-level (Figure 2-4). The main risk factors that contribute this vulnerability are a geomorphology prone to erosion (high-risk barrier islands and marshes), a high tide range, moderate to high relative sea level rise in the area, and moderate to very high erosion rates. One important reason for the high shoreline erosion rates in the area is the fact that wave energies along large portions of Alabama’s shoreline well exceed critical limits beyond which
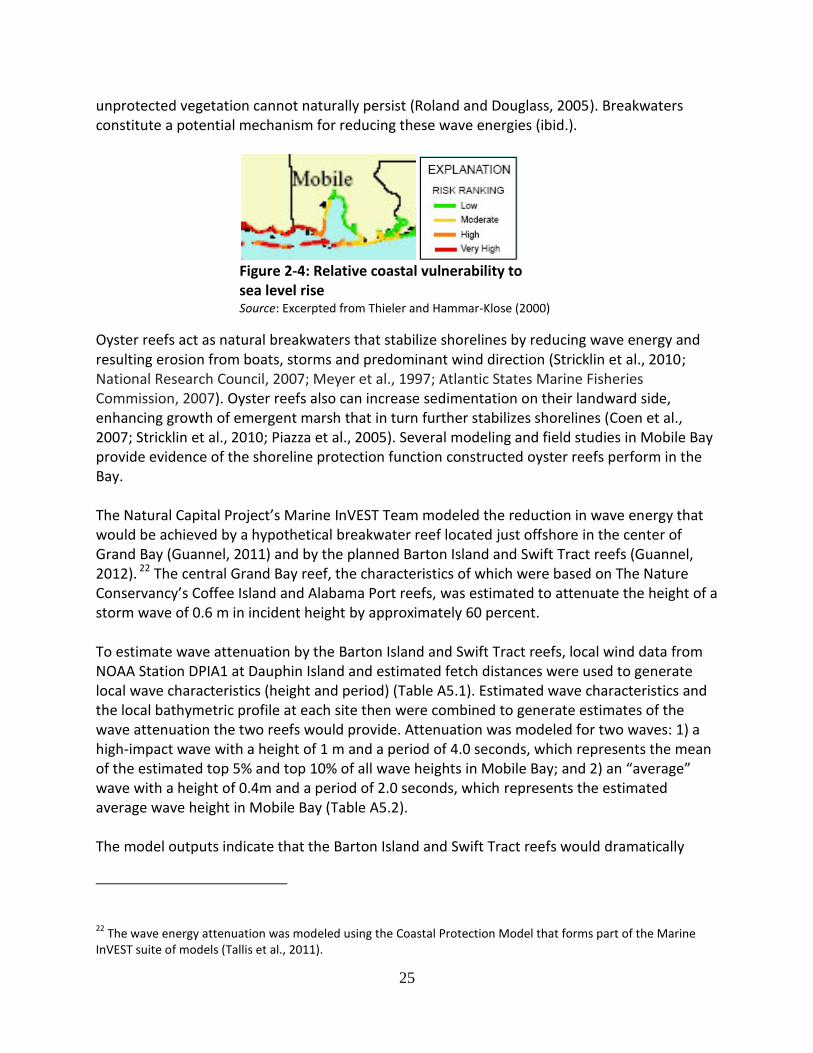
25
unprotected vegetation cannot naturally persist (Roland and Douglass, 2005). Breakwaters constitute a potential mechanism for reducing these wave energies (ibid.).
Figure 2-4: Relative coastal vulnerability to sea level rise Source: Excerpted from Thieler and Hammar-Klose (2000)
Oyster reefs act as natural breakwaters that stabilize shorelines by reducing wave energy and resulting erosion from boats, storms and predominant wind direction (Stricklin et al., 2010; National Research Council, 2007; Meyer et al., 1997; Atlantic States Marine Fisheries Commission, 2007). Oyster reefs also can increase sedimentation on their landward side, enhancing growth of emergent marsh that in turn further stabilizes shorelines (Coen et al., 2007; Stricklin et al., 2010; Piazza et al., 2005). Several modeling and field studies in Mobile Bay provide evidence of the shoreline protection function constructed oyster reefs perform in the Bay. The Natural Capital Project’s Marine InVEST Team modeled the reduction in wave energy that would be achieved by a hypothetical breakwater reef located just offshore in the center of Grand Bay (Guannel, 2011) and by the planned Barton Island and Swift Tract reefs (Guannel, 2012). 22 The central Grand Bay reef, the characteristics of which were based on The Nature Conservancy’s Coffee Island and Alabama Port reefs, was estimated to attenuate the height of a storm wave of 0.6 m in incident height by approximately 60 percent. To estimate wave attenuation by the Barton Island and Swift Tract reefs, local wind data from NOAA Station DPIA1 at Dauphin Island and estimated fetch distances were used to generate local wave characteristics (height and period) (Table A5.1). Estimated wave characteristics and the local bathymetric profile at each site then were combined to generate estimates of the wave attenuation the two reefs would provide. Attenuation was modeled for two waves: 1) a high-impact wave with a height of 1 m and a period of 4.0 seconds, which represents the mean of the estimated top 5% and top 10% of all wave heights in Mobile Bay; and 2) an “average” wave with a height of 0.4m and a period of 2.0 seconds, which represents the estimated average wave height in Mobile Bay (Table A5.2). The model outputs indicate that the Barton Island and Swift Tract reefs would dramatically
22 The wave energy attenuation was modeled using the Coastal Protection Model that forms part of the Marine
InVEST suite of models (Tallis et al., 2011).
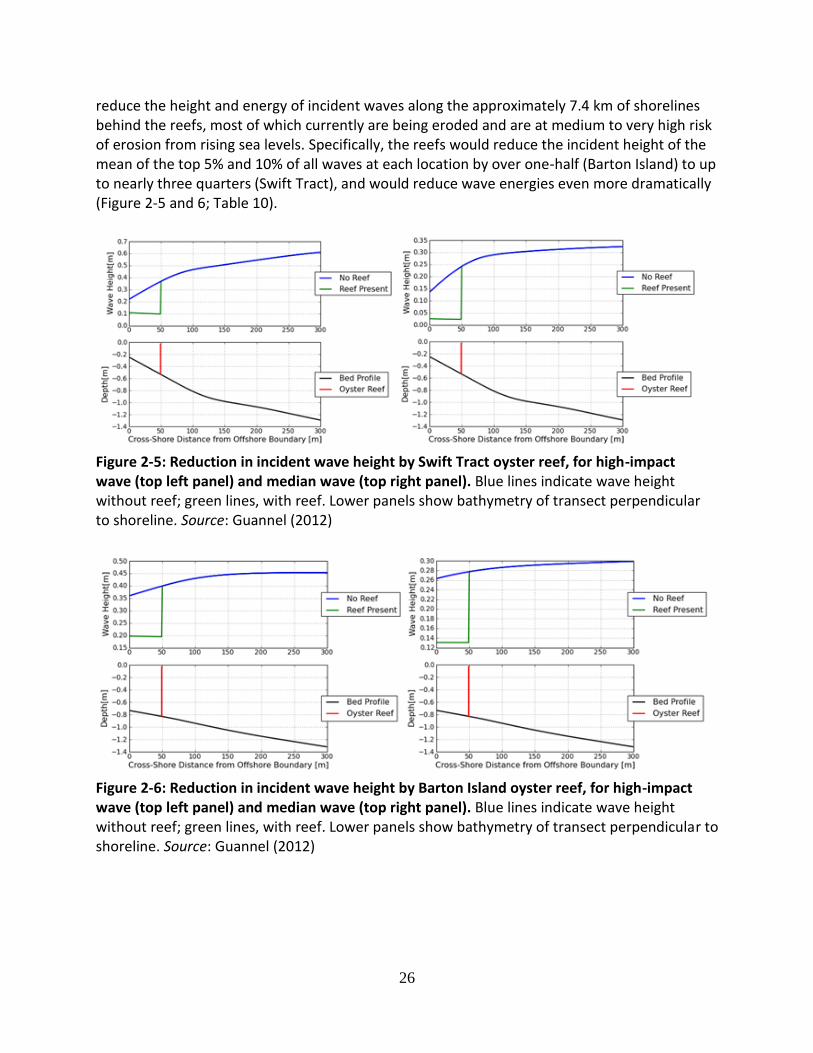
26
reduce the height and energy of incident waves along the approximately 7.4 km of shorelines behind the reefs, most of which currently are being eroded and are at medium to very high risk of erosion from rising sea levels. Specifically, the reefs would reduce the incident height of the mean of the top 5% and 10% of all waves at each location by over one-half (Barton Island) to up to nearly three quarters (Swift Tract), and would reduce wave energies even more dramatically (Figure 2-5 and 6; Table 10).
Figure 2-5: Reduction in incident wave height by Swift Tract oyster reef, for high-impact wave (top left panel) and median wave (top right panel). Blue lines indicate wave height without reef; green lines, with reef. Lower panels show bathymetry of transect perpendicular to shoreline. Source: Guannel (2012)
Figure 2-6: Reduction in incident wave height by Barton Island oyster reef, for high-impact wave (top left panel) and median wave (top right panel). Blue lines indicate wave height without reef; green lines, with reef. Lower panels show bathymetry of transect perpendicular to shoreline. Source: Guannel (2012)
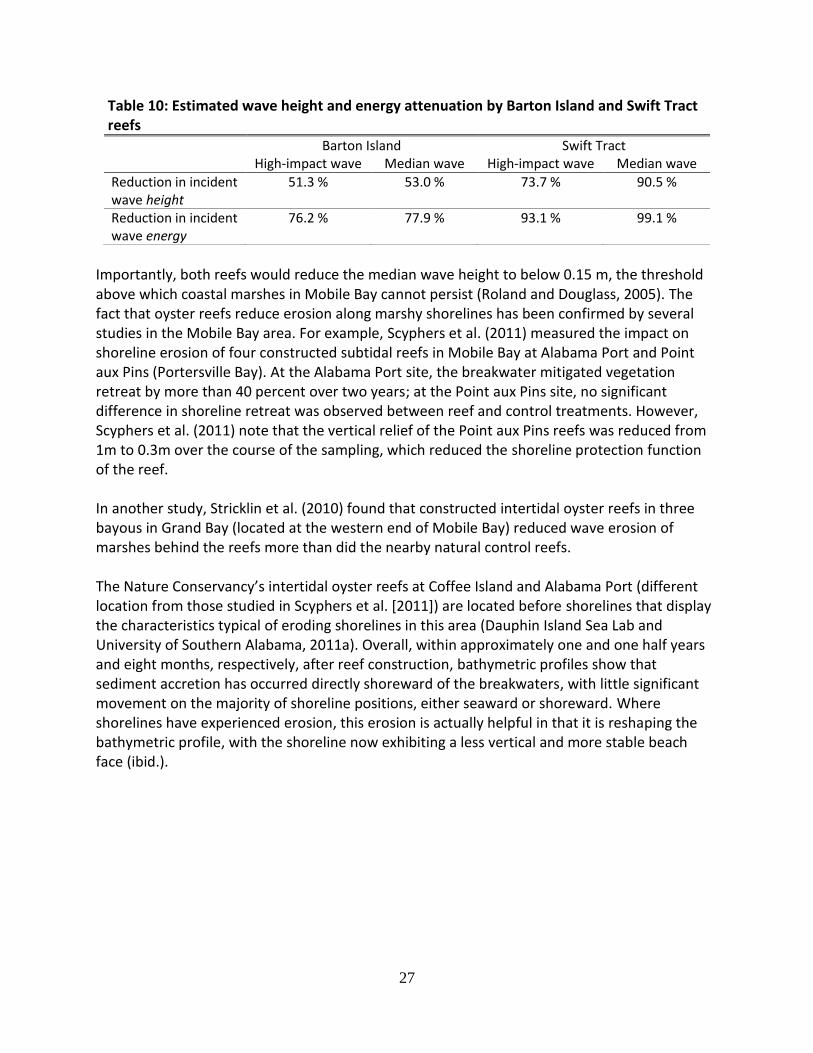
27
Table 10: Estimated wave height and energy attenuation by Barton Island and Swift Tract reefs
Barton Island Swift Tract High-impact wave Median wave High-impact wave Median wave
Reduction in incident wave height
51.3 % 53.0 % 73.7 % 90.5 %
Reduction in incident wave energy
76.2 % 77.9 % 93.1 % 99.1 %
Importantly, both reefs would reduce the median wave height to below 0.15 m, the threshold above which coastal marshes in Mobile Bay cannot persist (Roland and Douglass, 2005). The fact that oyster reefs reduce erosion along marshy shorelines has been confirmed by several studies in the Mobile Bay area. For example, Scyphers et al. (2011) measured the impact on shoreline erosion of four constructed subtidal reefs in Mobile Bay at Alabama Port and Point aux Pins (Portersville Bay). At the Alabama Port site, the breakwater mitigated vegetation retreat by more than 40 percent over two years; at the Point aux Pins site, no significant difference in shoreline retreat was observed between reef and control treatments. However, Scyphers et al. (2011) note that the vertical relief of the Point aux Pins reefs was reduced from 1m to 0.3m over the course of the sampling, which reduced the shoreline protection function of the reef. In another study, Stricklin et al. (2010) found that constructed intertidal oyster reefs in three bayous in Grand Bay (located at the western end of Mobile Bay) reduced wave erosion of marshes behind the reefs more than did the nearby natural control reefs. The Nature Conservancy’s intertidal oyster reefs at Coffee Island and Alabama Port (different location from those studied in Scyphers et al. [2011]) are located before shorelines that display the characteristics typical of eroding shorelines in this area (Dauphin Island Sea Lab and University of Southern Alabama, 2011a). Overall, within approximately one and one half years and eight months, respectively, after reef construction, bathymetric profiles show that sediment accretion has occurred directly shoreward of the breakwaters, with little significant movement on the majority of shoreline positions, either seaward or shoreward. Where shorelines have experienced erosion, this erosion is actually helpful in that it is reshaping the bathymetric profile, with the shoreline now exhibiting a less vertical and more stable beach face (ibid.).
28
2.2. Net Economic Benefits from Reef Restoration
2.2.1. Conceptual approach and operationalization The net benefits from reef restoration are a measure of how much individuals are made better off as a result of the ecosystem services provided by the restored reefs. The economic value of a change in well-being is defined as the maximum amount an individual is willing to pay to obtain (an additional unit of) the good or service from which the change in well-being is derived (e.g., an additional seafood meal), or the minimum amount she is willing to accept as compensation in order for her to give up (the next unit of) the good or service. Willingness to pay (WTP) and willingness to accept compensation (WTA) are the preferred measures of value in economics because they rely on the assessment of value by the actual individuals whose changes in well-being are being measured (Arrow et al., 1996). The net value to an individual from an additional unit of a good or service is the difference between her willingness to pay for that unit and what she is actually paying. For example, if an individual would be willing to pay a maximum of $10 for an additional meal containing one pound of crab meat but the actual cost of the meal to her is $5, then the net value of the meal to her is $5. This difference between willingness to pay and actual price paid is called the consumer surplus. For businesses, net benefit is defined as a change in net revenue from production of an additional unit of a good or service. This net revenue is the difference between the change in total production cost as a result of the production of an additional unit and the price the producer obtains for that unit. This difference is called the producer surplus. To estimate the consumer surplus associated with the increase in an ecosystem service produced by the new reefs, one needs to know the demand curve for that service. For market traded goods such as particular seafood species, demand curves can be constructed based on observed quantities transacted at different prices, if sufficient data points are available. Based on demand curve and market price, the total consumer surplus associated with different quantities of the service can then be estimated. In cases where the service itself is not traded on markets (e.g., the stock of a certain species supporting recreational fishing), demand for the service can be estimated based on people’s expenditures on market-traded complements (travel and equipment spending on fishing trips). Alternatively, if sufficient market information is lacking, so-called stated preference approaches can be applied in which value estimates are derived from surveys instead of observed behavior. In the most common of these approaches—contingent valuation (CV)—a hypothetical market for a particular resource is constructed by presenting individuals with a well-defined change in the quantity or quality of the resource, and then asking them directly how much they would be willing to pay to obtain that change (in case of a positive change) or to prevent it (in case of a negative change), or how much they would require in compensation to accept the change (in case of a negative change). In a less often used stated preference technique—conjoint analysis (e.g., Milon et al., 1999)—respondents are not directly asked to state their WTP or WTA for a hypothetical change, but rather are presented with, and asked to choose among, different options, each of which represents a
29
bundle of particular resource quantity and quality changes and project costs. WTP or WTA then are estimated through statistical analysis of respondents’ choices. The construction of hypothetical scenarios that yield accurate and logically consistent answers from respondents is a complex undertaking because there are several factors that can result in biased responses that do not express respondents true WTP (e.g., Diamond and Hausman, 1994; Stevens et al., 1991, 1993). In a thorough review of the issue, a “blue ribbon” panel of influential economists convened by NOAA (Arrow et al., 1993) established a set of guidelines for the use of CV methods and concluded that CV can provide a valid economic measure of value associated with resources people do not actually use but whose existence they may nevertheless value. Comprehensive literature reviews found that while good CV study design is a significant challenge, there is broad evidence that CV estimates in general are consistent with economic theory and similar to their revealed preference counterparts (Carson et al., 1996, 2001). Producer surplus is measured by examining the supply (cost) and demand (revenue) curves for commercial producers of seafood, including harvesters, processors, wholesalers and distributors, as well as the supply and demand curves of for-hire recreational service providers. For both the recreational and commercial fishing and the seafood sectors, total economic value is the sum of consumer and producer surplus.
Table 11 shows the benefits from oyster restoration quantified in this study, whether those benefits accrue to producers or consumers, and indicates those benefits for which we develop monetary value estimates.
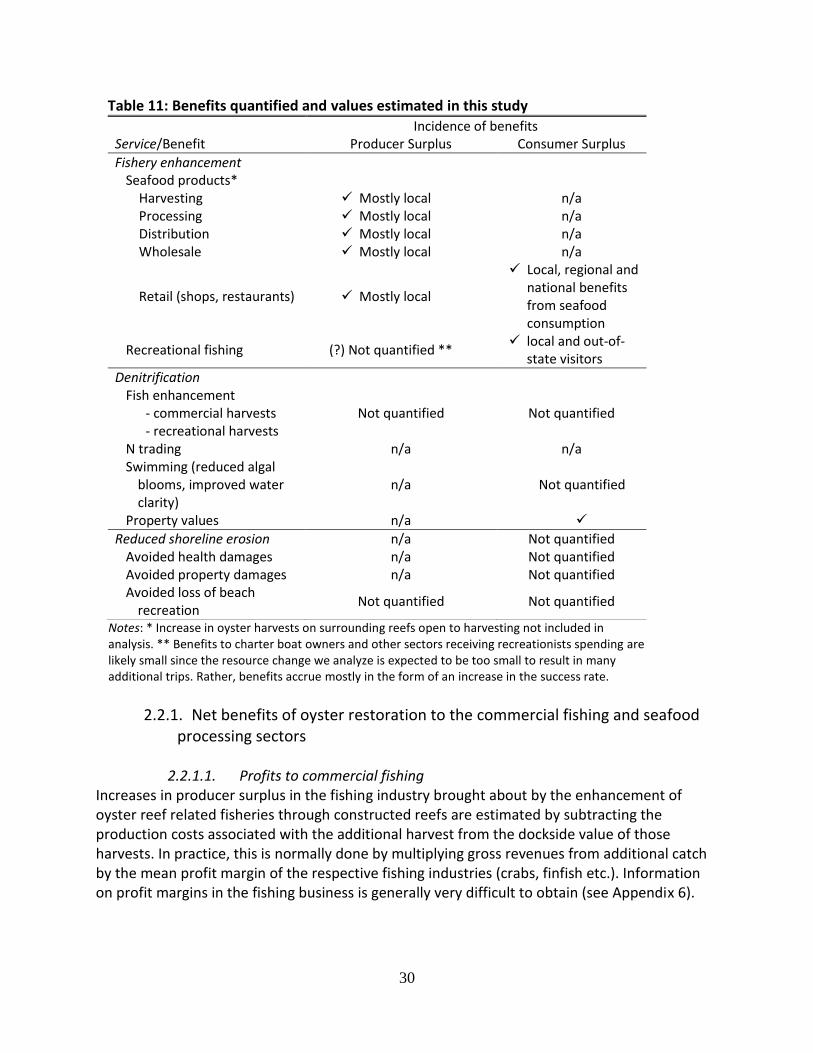
30
Table 11: Benefits quantified and values estimated in this study
Incidence of benefits Service/Benefit Producer Surplus Consumer Surplus
Fishery enhancement Seafood products*
Harvesting Mostly local n/a Processing Mostly local n/a Distribution Mostly local n/a Wholesale Mostly local n/a
Retail (shops, restaurants) Mostly local
Local, regional and national benefits from seafood consumption
Recreational fishing (?) Not quantified ** local and out-of-
state visitors
Denitrification Fish enhancement
- commercial harvests - recreational harvests
Not quantified Not quantified
N trading n/a n/a Swimming (reduced algal
blooms, improved water clarity)
n/a Not quantified
Property values n/a
Reduced shoreline erosion n/a Not quantified Avoided health damages n/a Not quantified Avoided property damages n/a Not quantified Avoided loss of beach
recreation Not quantified Not quantified
Notes: * Increase in oyster harvests on surrounding reefs open to harvesting not included in analysis. ** Benefits to charter boat owners and other sectors receiving recreationists spending are likely small since the resource change we analyze is expected to be too small to result in many additional trips. Rather, benefits accrue mostly in the form of an increase in the success rate.
2.2.1. Net benefits of oyster restoration to the commercial fishing and seafood processing sectors
2.2.1.1. Profits to commercial fishing
Increases in producer surplus in the fishing industry brought about by the enhancement of oyster reef related fisheries through constructed reefs are estimated by subtracting the production costs associated with the additional harvest from the dockside value of those harvests. In practice, this is normally done by multiplying gross revenues from additional catch by the mean profit margin of the respective fishing industries (crabs, finfish etc.). Information on profit margins in the fishing business is generally very difficult to obtain (see Appendix 6).
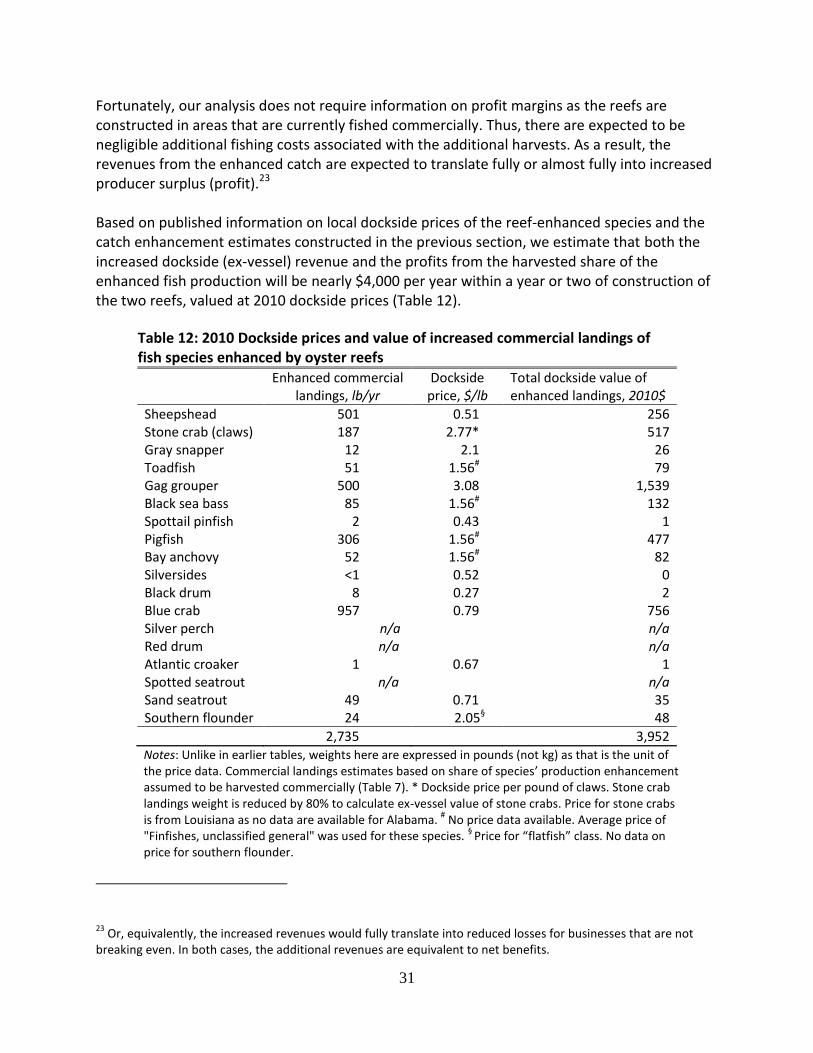
31
Fortunately, our analysis does not require information on profit margins as the reefs are constructed in areas that are currently fished commercially. Thus, there are expected to be negligible additional fishing costs associated with the additional harvests. As a result, the revenues from the enhanced catch are expected to translate fully or almost fully into increased producer surplus (profit).23 Based on published information on local dockside prices of the reef-enhanced species and the catch enhancement estimates constructed in the previous section, we estimate that both the increased dockside (ex-vessel) revenue and the profits from the harvested share of the enhanced fish production will be nearly $4,000 per year within a year or two of construction of the two reefs, valued at 2010 dockside prices (Table 12).
Table 12: 2010 Dockside prices and value of increased commercial landings of fish species enhanced by oyster reefs
Enhanced commercial landings, lb/yr
Dockside price, $/lb
Total dockside value of enhanced landings, 2010$
Sheepshead 501 0.51 256 Stone crab (claws) 187 2.77* 517 Gray snapper 12 2.1 26 Toadfish 51 1.56# 79 Gag grouper 500 3.08 1,539 Black sea bass 85 1.56# 132 Spottail pinfish 2 0.43 1 Pigfish 306 1.56# 477 Bay anchovy 52 1.56# 82 Silversides <1 0.52 0 Black drum 8 0.27 2 Blue crab 957 0.79 756 Silver perch n/a n/a Red drum n/a n/a Atlantic croaker 1 0.67 1 Spotted seatrout n/a n/a Sand seatrout 49 0.71 35 Southern flounder 24 2.05§ 48
2,735 3,952 Notes: Unlike in earlier tables, weights here are expressed in pounds (not kg) as that is the unit of the price data. Commercial landings estimates based on share of species’ production enhancement assumed to be harvested commercially (Table 7). * Dockside price per pound of claws. Stone crab landings weight is reduced by 80% to calculate ex-vessel value of stone crabs. Price for stone crabs is from Louisiana as no data are available for Alabama.
# No price data available. Average price of
"Finfishes, unclassified general" was used for these species. §
Price for “flatfish” class. No data on price for southern flounder.
23 Or, equivalently, the increased revenues would fully translate into reduced losses for businesses that are not
breaking even. In both cases, the additional revenues are equivalent to net benefits.
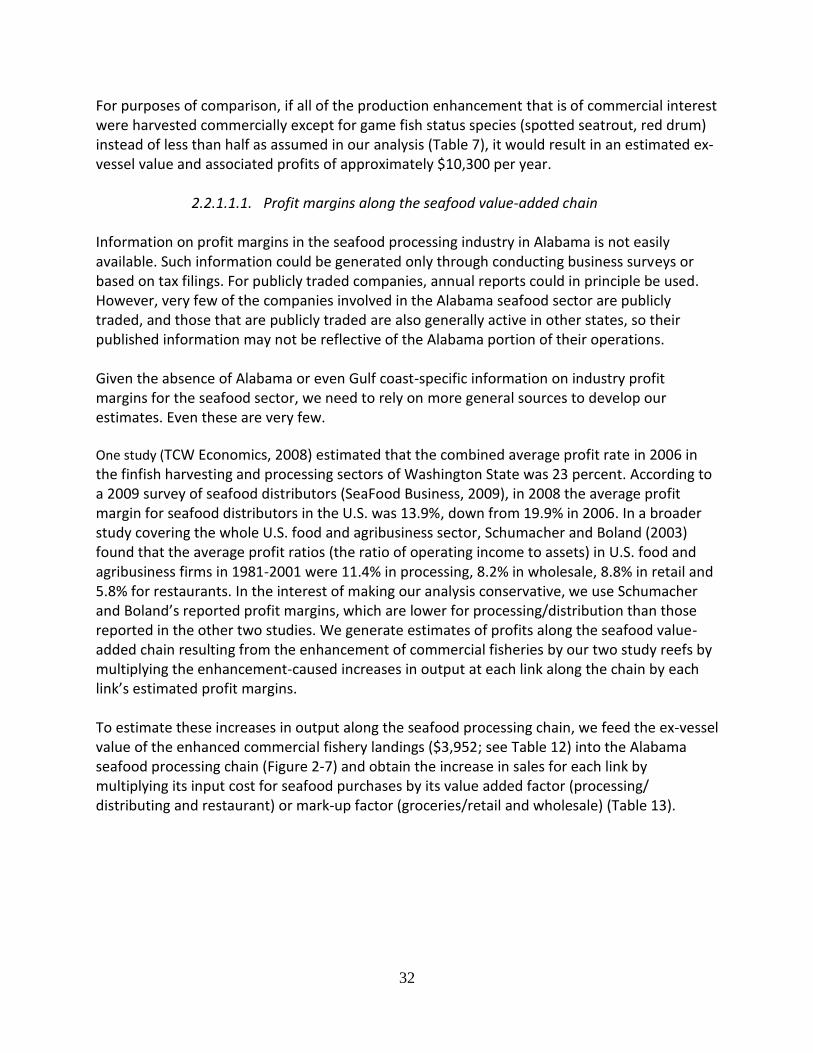
32
For purposes of comparison, if all of the production enhancement that is of commercial interest were harvested commercially except for game fish status species (spotted seatrout, red drum) instead of less than half as assumed in our analysis (Table 7), it would result in an estimated ex-vessel value and associated profits of approximately $10,300 per year.
2.2.1.1.1. Profit margins along the seafood value-added chain
Information on profit margins in the seafood processing industry in Alabama is not easily available. Such information could be generated only through conducting business surveys or based on tax filings. For publicly traded companies, annual reports could in principle be used. However, very few of the companies involved in the Alabama seafood sector are publicly traded, and those that are publicly traded are also generally active in other states, so their published information may not be reflective of the Alabama portion of their operations. Given the absence of Alabama or even Gulf coast-specific information on industry profit margins for the seafood sector, we need to rely on more general sources to develop our estimates. Even these are very few.
One study (TCW Economics, 2008) estimated that the combined average profit rate in 2006 in the finfish harvesting and processing sectors of Washington State was 23 percent. According to a 2009 survey of seafood distributors (SeaFood Business, 2009), in 2008 the average profit margin for seafood distributors in the U.S. was 13.9%, down from 19.9% in 2006. In a broader study covering the whole U.S. food and agribusiness sector, Schumacher and Boland (2003) found that the average profit ratios (the ratio of operating income to assets) in U.S. food and agribusiness firms in 1981-2001 were 11.4% in processing, 8.2% in wholesale, 8.8% in retail and 5.8% for restaurants. In the interest of making our analysis conservative, we use Schumacher and Boland’s reported profit margins, which are lower for processing/distribution than those reported in the other two studies. We generate estimates of profits along the seafood value-added chain resulting from the enhancement of commercial fisheries by our two study reefs by multiplying the enhancement-caused increases in output at each link along the chain by each link’s estimated profit margins. To estimate these increases in output along the seafood processing chain, we feed the ex-vessel value of the enhanced commercial fishery landings ($3,952; see Table 12) into the Alabama seafood processing chain (Figure 2-7) and obtain the increase in sales for each link by multiplying its input cost for seafood purchases by its value added factor (processing/ distributing and restaurant) or mark-up factor (groceries/retail and wholesale) (Table 13).
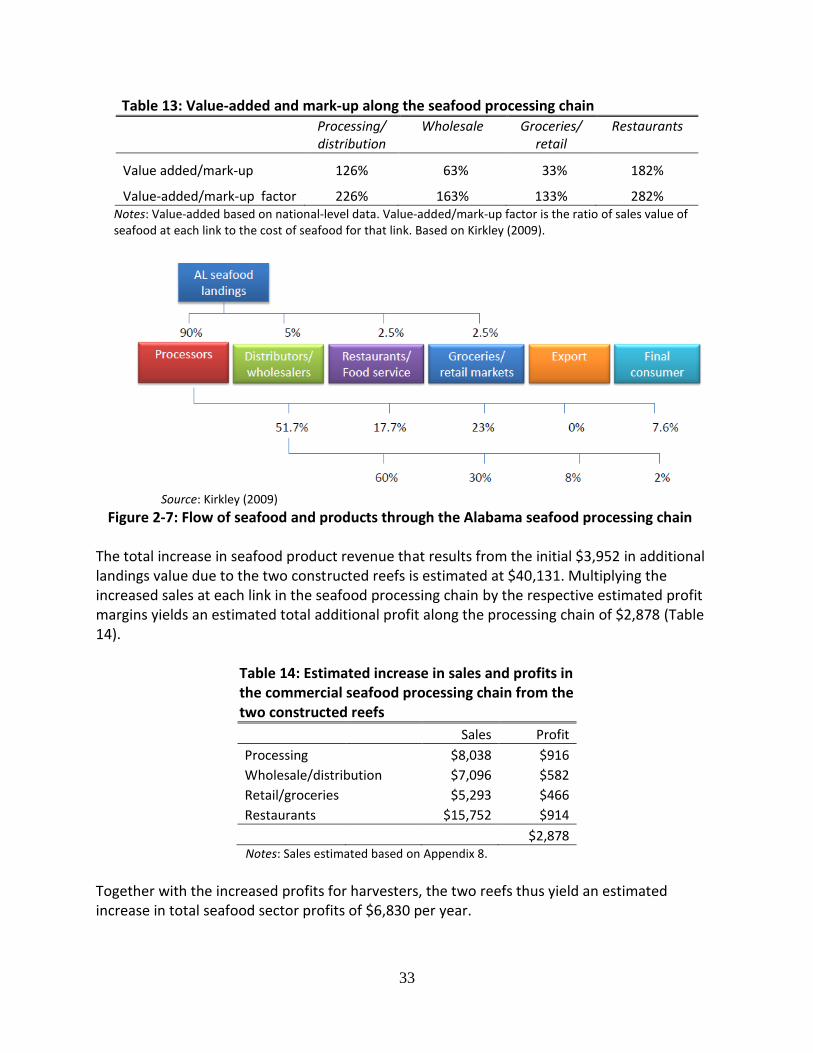
33
Table 13: Value-added and mark-up along the seafood processing chain
Processing/ distribution
Wholesale Groceries/ retail
Restaurants
Value added/mark-up 126% 63% 33% 182%
Value-added/mark-up factor 226% 163% 133% 282% Notes: Value-added based on national-level data. Value-added/mark-up factor is the ratio of sales value of seafood at each link to the cost of seafood for that link. Based on Kirkley (2009).
Source: Kirkley (2009)
Figure 2-7: Flow of seafood and products through the Alabama seafood processing chain
The total increase in seafood product revenue that results from the initial $3,952 in additional landings value due to the two constructed reefs is estimated at $40,131. Multiplying the increased sales at each link in the seafood processing chain by the respective estimated profit margins yields an estimated total additional profit along the processing chain of $2,878 (Table 14).
Table 14: Estimated increase in sales and profits in the commercial seafood processing chain from the two constructed reefs
Sales Profit
Processing $8,038 $916
Wholesale/distribution $7,096 $582
Retail/groceries
$5,293 $466
Restaurants $15,752 $914
$2,878
Notes: Sales estimated based on Appendix 8.
Together with the increased profits for harvesters, the two reefs thus yield an estimated increase in total seafood sector profits of $6,830 per year.
34
We expect that most of these sales and profits will occur in the two-county (Mobile and Baldwin) coastal area in which the two construction (or restoration) projects are located, for several reasons. First, while Alabama exports seafood products to other states and abroad, almost all of these out-of-state sales are accounted for by shrimp, and to a much lesser extent, blue crabs, which in 2009 made up 88 and 2 percent, respectively, of total seafood landings value in the state (NMFS, 2010). Even for these two species, much of the processing and at least a portion of the wholesale and distribution occur within Alabama. The additional commercial harvests of the other species enhanced by the two reefs are expected to be mostly consumed in-state, based on the fact that Alabamans’ estimated seafood consumption exceeds the seafood landings in the state.24 Taking into account shrimp-based exports to other states and abroad, this makes it likely that most of the remaining seafood is consumed in the state.
2.2.2. Net benefits (consumer surplus) from additional seafood consumption Consumer surplus gains from the additional commercial seafood harvest could occur as a result of either a reduction in the price of seafood (e.g., Anderson, 1989) or as a result of the increased consumption itself. The first effect is unlikely to occur since the estimated increment in commercial seafood landings attributable to the two reefs (2,735 pounds; Table 12) would account for only approximately 0.01 percent of total 2009 Alabama seafood landings of 27.6 million pounds. Unfortunately, very few consumer surplus estimates for seafood consumption are available. We were able to identify just one study providing such values that was useful for our analysis. Haab et al. (2002) surveyed Mid-Atlantic households in four states (Delaware, Maryland, Virginia and North Carolina) and the District of Columbia to estimate the loss in consumer surplus associated with a published or reported fish kill in an estuary in the region. Based on the seafood consumption and cost information collected in their 1,797 useful survey responses, Haab and colleagues estimated that the average consumer surplus per seafood meal was between $1.70 and $3.31 (in 2000 $) for their sample. The seafood most frequently eaten by their respondents were flounder, shrimp and crabs. Many factors may influence consumer surplus from seafood consumption. These include the species consumed, the cost of seafood, consumers’ income (i.e., ability to pay), prices of complements and substitutes, and preferences and information (e.g., on the health aspects of seafood consumption in general or of particular species). Because the Alabama Gulf coast and
24 In 2010, average annual seafood consumption in the US was 15.8 pounds of edible meat per person (NMFS,
2011). With a state population of 4.78 million and assuming that average per-capita seafood consumption in the state is the same as for the country as a whole, Alabamans consumed a total of 75.5 million pounds of edible seafood meat, a value that far exceeds total landings, which were 27.6 million pounds of total live weight in 2009 (NMFS, 2011). (2010 landings were just 14.4 million pounds [NMFS, 2011], due to the disruption in fishing caused by the Deepwater Horizon oil spill).
35
Mid Atlantic differ in many of these characteristics, it is likely that consumer surplus for seafood consumption in our study area differs from that in the Mid-Atlantic section of the country. While it is impossible here to adjust Haab et al.’s estimate for differences in all WTP-relevant characteristics between our and their study sites, we note that flounders, crabs and many other species are consumed both by people in our region and by their respondents, and adjust for differences in mean household income between their sample and our study area. Haab and colleagues found that as income increased by 10%, willingness to pay in their sample decreased by 0.33%. While this appears counterintuitive, the authors also observe among their respondents a positive effect of the price variable on willingness to pay, and interpret these findings as indicating that risk reduction and income are substitute goods. Assuming a constant elasticity of WTP with respect to income, we adjust Haab et al.’s WTP estimate to our site by multiplying it by the product of the absolute difference in mean household incomes in their sample ($50,120 in 2000) and our study area (population-weighted median household income in Baldwin and Mobile counties of $35,410 in 1999), expressed in percent, and their estimated income elasticity of WTP of -0.033. This adjustment increases Haab et al.’s WTP estimates by 1 percent. Expressed in 2010 dollars, the estimated consumer surplus of a seafood meal in our study area based on Haab et al.’s estimates is between $2.14 and $4.16. To translate our enhanced commercial catch into the number of corresponding seafood meals, we assume that half of the catch will be turned into filets while the other half will be turned into steaks. This is expected to result in a conservative estimate of the number of meals as undoubtedly a portion of the fish will be prepared whole. We apply the NMFS’s average conversion factors from live weight to fillets (33 percent) and steaks (60 percent) (Lipton, 1990) except for stone crabs, for which we use a conversion factor of 20 percent that represents the ratio of claw meat to total body weight (Grabowski and Petersen, 2007). Assuming that a seafood meal contains on average one pound of seafood, the enhanced commercial catch of 2,735 pounds will produce an additional 1,222 seafood meals per year, with an associated total consumer surplus of $2,933-$5,711.
2.2.3. Net benefits of oyster reef restoration to the recreational sector The biomass enhancement by oyster reefs of recreationally fished species may result in net benefit gains for anglers and for businesses that provide inputs to sportfishing. The latter include most importantly charter boat owners and fishing gear and bait shops, but also restaurants, lodging places, and retail outlets, as well as the supply chains that support all of these businesses. However, the restored reefs will generate producer surplus only to the extent that they result in additional angling trips or equipment purchases. Given the very small increase in the overall Alabama recreational fishery that would be produced by the two reefs (Table 15)—4,190 pounds, or 0.1 percent of the nearly 3.5 million pounds caught by
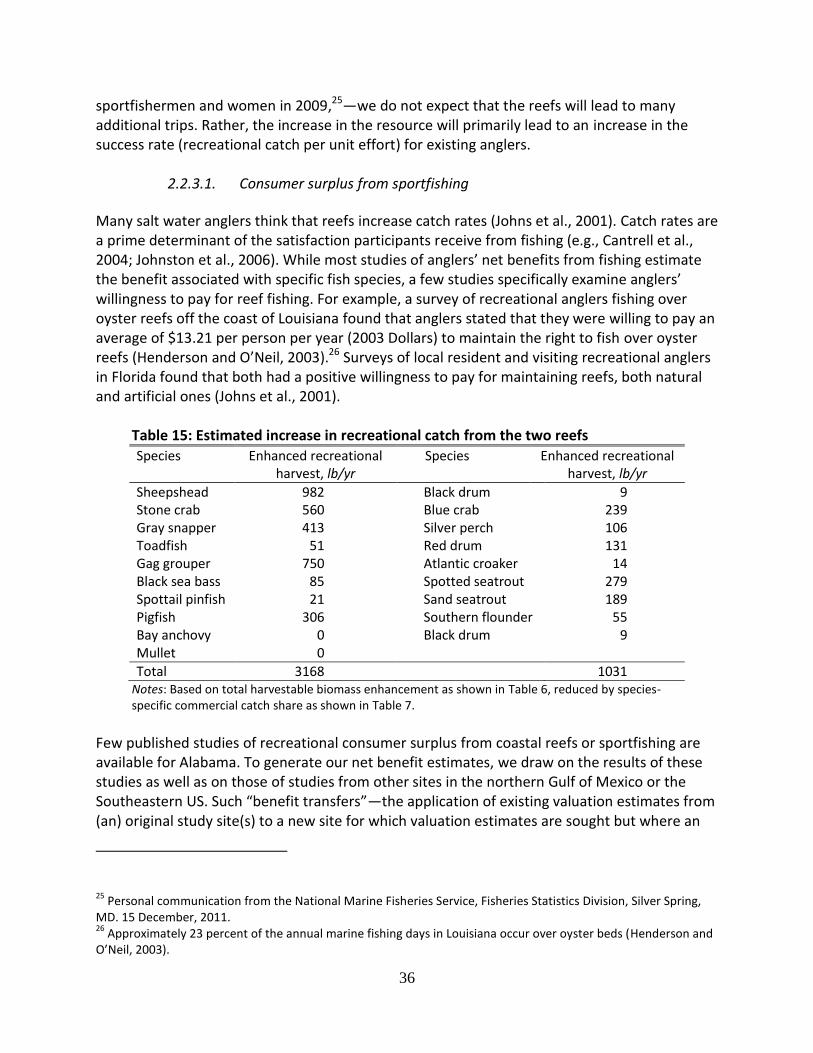
36
sportfishermen and women in 2009,25—we do not expect that the reefs will lead to many additional trips. Rather, the increase in the resource will primarily lead to an increase in the success rate (recreational catch per unit effort) for existing anglers.
2.2.3.1. Consumer surplus from sportfishing
Many salt water anglers think that reefs increase catch rates (Johns et al., 2001). Catch rates are a prime determinant of the satisfaction participants receive from fishing (e.g., Cantrell et al., 2004; Johnston et al., 2006). While most studies of anglers’ net benefits from fishing estimate the benefit associated with specific fish species, a few studies specifically examine anglers’ willingness to pay for reef fishing. For example, a survey of recreational anglers fishing over oyster reefs off the coast of Louisiana found that anglers stated that they were willing to pay an average of $13.21 per person per year (2003 Dollars) to maintain the right to fish over oyster reefs (Henderson and O’Neil, 2003).26 Surveys of local resident and visiting recreational anglers in Florida found that both had a positive willingness to pay for maintaining reefs, both natural and artificial ones (Johns et al., 2001).
Table 15: Estimated increase in recreational catch from the two reefs
Species Enhanced recreational harvest, lb/yr
Species Enhanced recreational harvest, lb/yr
Sheepshead 982 Black drum 9 Stone crab 560 Blue crab 239 Gray snapper 413 Silver perch 106 Toadfish 51 Red drum 131 Gag grouper 750 Atlantic croaker 14 Black sea bass 85 Spotted seatrout 279 Spottail pinfish 21 Sand seatrout 189 Pigfish 306 Southern flounder 55 Bay anchovy 0 Black drum 9 Mullet 0
Total 3168 1031 Notes: Based on total harvestable biomass enhancement as shown in Table 6, reduced by species-specific commercial catch share as shown in Table 7.
Few published studies of recreational consumer surplus from coastal reefs or sportfishing are available for Alabama. To generate our net benefit estimates, we draw on the results of these studies as well as on those of studies from other sites in the northern Gulf of Mexico or the Southeastern US. Such “benefit transfers”—the application of existing valuation estimates from (an) original study site(s) to a new site for which valuation estimates are sought but where an
25 Personal communication from the National Marine Fisheries Service, Fisheries Statistics Division, Silver Spring,
MD. 15 December, 2011. 26
Approximately 23 percent of the annual marine fishing days in Louisiana occur over oyster beds (Henderson and O’Neil, 2003).
37
original study is not feasible due to lack of time or cost constraints (Bergstrom and De Civita, 1999)—are common practice (ibid; Allen and Loomis, 2008) and can take the form of simple point or average value transfers or more complex function transfers based on meta-analysis (Richardson and Loomis, 2009; Kroeger and Casey, 2006) or preference calibration (Smith et al., 2002). Because economic values always are context dependent, the validity of transfer-based estimates depends on the closeness of the match between study and policy site contexts. Thus, to ensure validity, our estimates should be drawn from valuation studies that are similar to our site in terms of the key variables influencing sportfishing values: species, angler characteristics and resource context (Johnston et al., 2006).27 The eight studies we were able to identify that estimate consumer surplus for sportfishing in the northern Gulf of Mexico or the Southeastern US (Appendix 7) develop willingness to pay estimates for specific individual species (e.g., spotted seatrout, red drum, gag grouper) or broader groups of fish that together cover most of the species enhanced by oyster reefs (e.g., bottom fish, flat fish). The only species for which no willingness to pay estimates are available are blue crabs and stone crabs, so we omit these two from our valuation analysis. Where studies provided a range of value estimates, we used the mean of these estimates. In cases where estimates for a species were available from more than one study, we chose the lowest estimate for our analysis. Together with the omission of blue and stone crabs this introduces a conservative bias into our estimates. This conservative bias is intended to counteract a possible upward bias in some of our value estimates for the other species that may result from our using mean species weights for recreational catch from the National Marine Fisheries Service’s (NMFS) recreational survey data to translate our biomass enhancement estimates into numbers of fish, as the NMFS cautions that their weight estimates are minimums that may not accurately reflect actual weights.28 Table 16 shows the recreational consumer surplus estimates per fish we use in this study, the units to which the estimates refer (e.g., fish, pound of fish), and the estimated total consumer surplus by species. Summing over all species, the total consumer surplus the two reefs are expected to provide to recreational anglers is estimated at approximately $28,000 per year. Using the mean of the values from all available studies for a given species as opposed to the lowest value would increase total estimated net benefits to over $33,600 per year. While we used literature observations specific to the species for which we construct value estimates, we did not examine any potential differences in angler or resource context
27 In addition to these factors, estimation methodology also impacts sportfishing value estimates (Johnston et al.,
2006). However, since benefit transfers do not actually involve an original valuation study to generate value estimates, this variable cannot be used to match available studies to the policy context unless the estimated values are intended to reflect the use of a particular elicitation format (e.g., travel cost methods or contingent valuation). 28
Personal communication from the National Marine Fisheries Service, Fisheries Statistics Division, Silver Spring, MD. 15 December 2011.
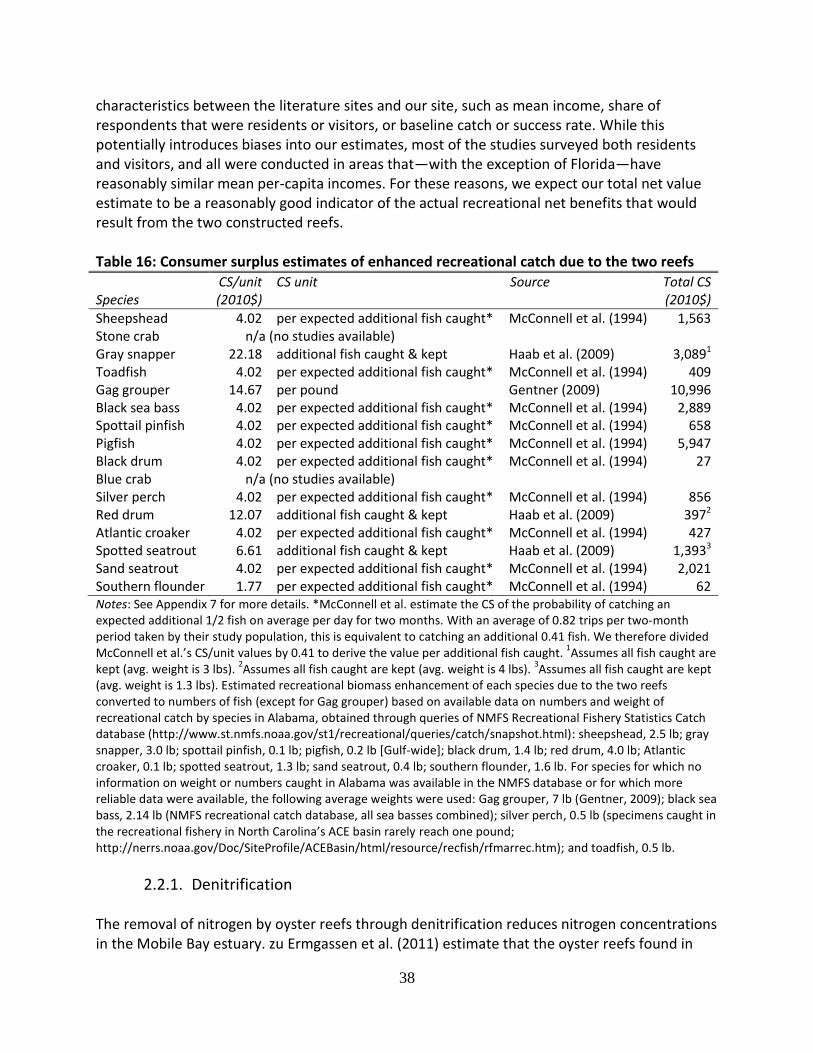
38
characteristics between the literature sites and our site, such as mean income, share of respondents that were residents or visitors, or baseline catch or success rate. While this potentially introduces biases into our estimates, most of the studies surveyed both residents and visitors, and all were conducted in areas that—with the exception of Florida—have reasonably similar mean per-capita incomes. For these reasons, we expect our total net value estimate to be a reasonably good indicator of the actual recreational net benefits that would result from the two constructed reefs. Table 16: Consumer surplus estimates of enhanced recreational catch due to the two reefs
Species CS/unit (2010$)
CS unit Source Total CS (2010$)
Sheepshead 4.02 per expected additional fish caught* McConnell et al. (1994) 1,563 Stone crab n/a (no studies available) Gray snapper 22.18 additional fish caught & kept Haab et al. (2009) 3,0891
Toadfish 4.02 per expected additional fish caught* McConnell et al. (1994) 409 Gag grouper 14.67 per pound Gentner (2009) 10,996 Black sea bass 4.02 per expected additional fish caught* McConnell et al. (1994) 2,889 Spottail pinfish 4.02 per expected additional fish caught* McConnell et al. (1994) 658 Pigfish 4.02 per expected additional fish caught* McConnell et al. (1994) 5,947 Black drum 4.02 per expected additional fish caught* McConnell et al. (1994) 27 Blue crab n/a (no studies available) Silver perch 4.02 per expected additional fish caught* McConnell et al. (1994) 856 Red drum 12.07 additional fish caught & kept Haab et al. (2009) 3972
Atlantic croaker 4.02 per expected additional fish caught* McConnell et al. (1994) 427 Spotted seatrout 6.61 additional fish caught & kept Haab et al. (2009) 1,3933
Sand seatrout 4.02 per expected additional fish caught* McConnell et al. (1994) 2,021 Southern flounder 1.77 per expected additional fish caught* McConnell et al. (1994) 62 Notes: See Appendix 7 for more details. *McConnell et al. estimate the CS of the probability of catching an expected additional 1/2 fish on average per day for two months. With an average of 0.82 trips per two-month period taken by their study population, this is equivalent to catching an additional 0.41 fish. We therefore divided McConnell et al.’s CS/unit values by 0.41 to derive the value per additional fish caught.
1Assumes all fish caught are
kept (avg. weight is 3 lbs). 2Assumes all fish caught are kept (avg. weight is 4 lbs).
3Assumes all fish caught are kept
(avg. weight is 1.3 lbs). Estimated recreational biomass enhancement of each species due to the two reefs converted to numbers of fish (except for Gag grouper) based on available data on numbers and weight of recreational catch by species in Alabama, obtained through queries of NMFS Recreational Fishery Statistics Catch database (http://www.st.nmfs.noaa.gov/st1/recreational/queries/catch/snapshot.html): sheepshead, 2.5 lb; gray snapper, 3.0 lb; spottail pinfish, 0.1 lb; pigfish, 0.2 lb [Gulf-wide]; black drum, 1.4 lb; red drum, 4.0 lb; Atlantic croaker, 0.1 lb; spotted seatrout, 1.3 lb; sand seatrout, 0.4 lb; southern flounder, 1.6 lb. For species for which no information on weight or numbers caught in Alabama was available in the NMFS database or for which more reliable data were available, the following average weights were used: Gag grouper, 7 lb (Gentner, 2009); black sea bass, 2.14 lb (NMFS recreational catch database, all sea basses combined); silver perch, 0.5 lb (specimens caught in the recreational fishery in North Carolina’s ACE basin rarely reach one pound; http://nerrs.noaa.gov/Doc/SiteProfile/ACEBasin/html/resource/recfish/rfmarrec.htm); and toadfish, 0.5 lb.
2.2.1. Denitrification The removal of nitrogen by oyster reefs through denitrification reduces nitrogen concentrations in the Mobile Bay estuary. zu Ermgassen et al. (2011) estimate that the oyster reefs found in
39
the Bay at the beginning of the 20th century would remove between 0.04 and 0.6 percent of present-day total nitrogen inputs, estimated at 59,900 metric tons per year (Bricker et al., 2007). By comparison, today’s reefs, which contain only about one fifth of total historic oyster biomass (zu Ermgassen et al., 2011), are estimated to denitrify only around 0.01 to 0.15 percent of total nitrogen inputs into the Bay. While oyster reefs have a relatively small impact on average bay-wide N concentrations, locally their impact may be much larger. For example, the eastern section of Mobile Bay suffers from eutrophication and has experienced harmful algal blooms that caused fish kills (Mobile Bay National Estuary Program and Science Advisory Committee, 2008). Because denitrification by oysters is highest during summer months which also is the time when eutrophication-related problems such as harmful algal blooms or low dissolved oxygen content are most severe, removal of an estimated additional 107-1613 kg N yr-1 by the Swift reef project may make a noticeable contribution to maintaining local water quality in that section of the eastern Bay by avoiding nitrogen concentration thresholds that may trigger algal blooms. Harmful algae blooms cause acute health effects in the form of respiratory problems in humans from the inhalation of toxic sea spray or skin irritation through contact with the algae in the water or on beaches (Mobile Bay National Estuary Program and Science Advisory Committee, 2008) or poisoning from the ingestion of toxic shellfish (Watkins et al., 2008). Harmful algae blooms also can disrupt marine food chains and cause poisoning-related morbidity and mortality in marine animals (HARRNESS, 2005). In addition to these health impacts, harmful algae blooms lead to losses in recreation values (Carson and Mitchell, 1993; Freeman, 1995; Lipton, 2004) that negatively affect the tourism sector (Mobile Bay National Estuary Program and Science Advisory Committee, 2008). Low concentrations of dissolved oxygen, which are caused by blooms of both harmful and harmless algae, also often lead to fish kills and thus negatively affect both recreational and commercial fisheries and the seafood industry (HARRNESS, 2005). A substantial body of literature exists that quantifies the economic values associated with changes in water quality in the US (Van Houtven et al., 2007). Reduced nitrogen levels in coastal sections of the Bay also may increase the attractiveness of coastal properties and thus property values. While the impact of water quality on home values has been well-documented in the literature (Van Houtven et al., 2007), relatively few studies focus on estuaries or coastal waters (e.g., Leggett and Bockstael, 2000; Parsons, 1992, Czajkowski and Bin, 2011). For example, Poor et al. (2007) conduct a hedonic analysis in the St. Mary’s River watershed of Chesapeake Bay that analyzed the impact of water quality on home prices. The authors found that the estimated marginal implicit price of a one milligram per liter reduction in total suspended solids—which oysters also reduce—and total dissolved inorganic N were almost $1,100 and over $17,600, respectively. In another analysis of home sales prices and water quality in Southeast Florida, Czajkowski and Bin (2011) estimate that a one percent improvement in visibility, evaluated at the mean value, increases home values by over $36,000, or nearly four percent of mean home values. These values only capture the benefits local home owners receive from improved water quality—they do not include the value of any recreational or fishery benefits. While these values are not directly transferable to coastal properties in
40
Mobile and Baldwin counties due to differences in mean home prices, income, and possibly individuals’ preferences and use patterns of coastal resources, they nevertheless allow the generation of order-of-magnitude estimates of the property value increases generated by the N reductions achieved by our Swift reef, which is located at the southern end of a developed stretch of shore and accounts for 85% of the total area and an equivalent portion of N removal by our two study reefs. Nitrogen concentrations in the eastern central coastal section of Bon Secour Bay at water quality monitoring stations BRNSD1 and the mouth of the Intracoastal Waterway were measured as 0.0296 and 0.0203 mg N L-1 (avg. concentrations during the 2005 measurement campaign), respectively, which falls into the ”fair” (0.02–0.04 mg L-1) range of the National Coastal Assessment’s Water Quality Criteria for N (Mobile Bay National Estuary Program et al., 2008). Assuming that the reported concentrations are representative of annual mean concentrations along the eastern Bon Secour Bay coast, we multiply the mean water depth in the coastal section of the bay of around 1.5 m (Mobile Bay National Estuary Program et al., 2008) by the length of the reef (4,920m) and by 100 to obtain the water volume within 100m from shore over the length of the reef. We multiply the result by the average of the two measured N levels (0.02495 mg L-1) and a factor of 1,000 (L to m3) to calculate the total N contained in that volume of water. Finally, to calculate the N that the Swift reef removes from this body of water, we multiply the mean daily removal rate of the reef by a factor of 9, which is the mean residence time of water in Mobile Bay in days (Bricker et al., 2007). We use a large real estate website providing up-to-date (2012) satellite images of the coastline where the Swift reef is located to identify waterfront and waterview homes on Beach Rd., N. and S. Bay Rd. and Shore Dr. in Foley CCD (Census Tract 114.01, Baldwin Co.).29 All homes are located within 65 m of the shore, and the majority are within 20 m of the shore. The same database provides prices for 36 percent of these homes. We use the mean price of this subsample as the average price of the homes located near the Swift reef. We calculate the estimated increase in total home value due to reduced N levels by multiplying the mean home value by the product of the change in value (9.6%) Poor et al. (2007) report for a 1 mg L-1 N reduction and the reduction the Swift reef would achieve, and summing over all properties. Given the average residence time of water in the Bay (9 days) and the 0.292-4.419 kg N the Swift reef removes on average per day, the reef would reduce daily N concentrations within 100 m from shore by 14-100% along its 4,920 m extent (i.e., over an area of 49.2 ha). In fact, at the upper estimated removal rate, the reef would remove an amount of N equivalent to all N contained in the surrounding 106 ha of water. Improvements in water quality would be even larger during summer months when N removal by oysters is highest and eutrophication-related problems are most severe. These reduced N levels are expected to affect the market value of the 47 waterfront or waterview homes located just off the northern end of the Swift reef. With an estimated mean price of $165,000 and a reduction in N concentrations by the reef of 0.0036-0.025 mg L-1, the
29 Search performed at www.homes.com on 21 February 2012.
41
reef is estimated to increase total home value by an estimated total $2,600-$18,600. Note that unlike the benefits from fishery enhancement, this is one-time benefit. The property value increases do not reflect any benefits reduced N levels may produce for human health or local commercial and recreational fisheries in eastern Bon Secour Bay. It should be noted that the mean reported N concentration from the two monitoring points in Bon Secour Bay are only approximately 1/3 of the lower end of the concentrations in Poor et al. (2007) study (0.082 mg L-1). Thus, if there is a threshold effect with respect to the benefits home owners receive from N removal, and if that threshold is located above the N levels observed in our study area, our estimates would be biased upward. However, the fact that N levels in the bay are sufficiently high to occasionally cause algal blooms and thus visibly impair water uses would seem to suggest that N levels are sufficiently high to obtain benefits from reducing them. Note also that Poor et al.’s (2007) study covered both waterfront and other properties. Since it is likely that waterfront residents on average receive higher benefits from water quality improvements than non-waterfront properties and since the vast majority of the properties in our study are waterfront properties and the remainder has water views, using Poor et al.’s (2007) findings to value water quality improvements should introduce a downward bias into our estimates, all else equal.
Reduced near-shore nitrogen concentrations also generate off-site benefits. The main off-site impact of increased denitrification in the Bay is a reduced nitrogen input into the hypoxic zone off the northern Gulf coast (Committee on Environment and Natural Resources, 2010). A reduction in the extent or intensity of the hypoxic zone is likely to generate benefits in the form of avoided fishery losses and endangered species impacts (HARRNESS, 2005). Nevertheless, it is likely that large-scale restoration of oyster reefs along large sections of the northern Gulf would be required to reduce nitrogen loads sufficiently to affect the hypoxic zone. Because the quantities of N removed from the water column by the two planned reefs are fairly small in terms of total bay-wide N quantities, it is unlikely that the reefs will have an impact on the extent of the hypoxic zone. The local impacts on recreation and fisheries are difficult to estimate as they would require the estimation of the marginal effect the reduced N would have on the likelihood of occurrence and the severity of local algal blooms. Deriving such estimates is likely challenging and is beyond the scope of this paper. Nevertheless, it is likely that reef restoration, especially if carried out at a scale larger than the two reefs examined in this study, would generate measurable benefits from water quality improvements. Finally, nitrogen removal by oyster reefs could generate net benefits for sources facing nitrogen emission restrictions and oyster reef owners. Principally, the benefits to nitrogen emitters can take two forms. First, if oysters maintain nitrogen levels in estuaries below thresholds that would lead to the imposition of emission limits, oysters effectively save the sources the compliance costs they otherwise would incur. That oysters indeed have the capacity to dramatically impact nitrogen levels in estuarine systems has been pointed out in several studies. For example, Newell et al. (2005) estimate that if oyster populations in the Bay were increased from an estimated 1 m-2 in 2000 to 10 m-2 —approximately one tenth of their historic
42
population levels—they would remove about half of all nitrogen inputs into the Bay in summer months. Second, in cases where restrictions on nitrogen emissions into surface waters are in place and a tradable market exists for nitrogen credits, restored oyster reefs could be a producer of credits similar to agricultural producers in some trading markets. Currently, several water quality markets in the US exist that allow the generation of nitrogen credits through changes in nitrogen effluent-reducing land use practices on agricultural lands (e.g., Bay Bank, 2012; World Resources Institute, 2007), and additional ones are under development (Environmental Protection Agency, 2011). Those credits are purchased by regulated point sources whose end-of-pipe nitrogen abatement costs exceed the price of the credits offered on the applicable nitrogen market. By allowing regulated sources to purchase emission credits from others who can achieve such reductions more cheaply, water quality markets can achieve pollution reductions more cheaply than if each source had to reduce its own emissions. This reduces overall compliance costs, yielding net benefits (increased profits) to both credit buyers and suppliers. It is important to note that all these water quality markets require regulatory drivers that impose emission limits. In the absence of such drivers, sources lack the incentive to reduce emissions.30 Absent incentives for pollution reduction, the potential benefits oyster reefs provide in terms of minimizing the costs of achieving such reductions remain unrealized. Regulatory drivers of water quality improvements commonly take the form of Clean Water Act-based TMDL (total maximum daily load) limits that cap permitted emission by individual sources in a watershed as part of an EPA-approved plan to bring water quality to a level where it is sufficient to supports all designated uses for a particular water body or portion thereof. In Alabama there currently exist no water quality markets. Nevertheless, the basis may exist for the creation of such markets in the Mobile Bay area for nitrogen. Specifically, in the Mobile Bay HUC 8 watershed (HUC code 03160205), Rabbit Creek, Dog River and Threemile Creek all have approved TMDL plans for nitrogen (among other pollutants), and the Middle Fork Deer River and Baker Branch are listed for nitrogen impairments awaiting TMDL plan development (EPA, 2012). Likewise, towards the western end of the Bay in the Mississippi Coastal HUC 8 (HUC code 03170009) located close to the Barton Island reef site, Bayou Cumbest has an approved TMDL for nitrogen, and the East Pascagoula River awaits a TMDL for organic enrichment (ibid.). While these TMDLs are not for Mobile Bay but rather for specific watersheds entering the Bay, conditions in Mobile Bay do affect water quality in these tidally-influenced streams (e.g., Alabama Department of Environmental Management and Tetra Tech, Inc., 2005). Thus, TMDLs could be modified to allow achievement of load reductions partially through nitrogen
30 The exception to this are the rare cases in which detrimental impacts on downstream parties are attributable
beyond a reasonable doubt to a particular source and property rights are clearly defined, in which case liability laws in some cases may serve as a sufficient incentive for some level of effluent control.
43
reductions in Mobile Bay, with the option of achieving such reductions through trading. To assess whether or not this is realistic and what quantity of terrestrial nitrogen loads into these water bodies could be offset through reduction of nitrogen levels in Mobile Bay requires further analysis of the relative importance of Mobile Bay nitrogen loads for the nitrogen levels in the listed water bodies. In addition, nitrogen markets could be created either in Alabama to reduce nitrogen loads in Mobile Bay (perhaps under a bay-wide TMDL analogous to the one that exists for the Chesapeake Bay), or across the Gulf States and the Mississippi watershed to reduce nitrogen inputs into the deeper waters of the Gulf of Mexico and reduce the hypoxic zone in the Gulf. Research suggests that reducing nitrogen runoff into the Gulf of Mexico through a tradable permit market could produce significant cost savings (Ribaudo et al., 2005). Restored oyster reefs could form an important source of nitrogen credits for these markets by providing “nutrient assimilation service credits” (Stephenson et al., 2010). The use of such assimilation credits has been proposed or explored in the literature for wetlands, stream restoration and biomass harvests (Heberling et al., 2007; Cherry et al., 2007; Shabman and Stephenson, 2007; Newell, 2004). In the Chesapeake Bay, incorporation of oyster projects into the Bay’s nitrogen trading market is currently being studied by NOAA and the Bay Bank.31 It is not our intention to suggest that effective, well-functioning nutrient credit markets are easy to design or implement. On the contrary, the institutional design and local context matter greatly and deserve in-depth analysis if the resulting market is to achieve its objectives (Stephenson and Shabman, 2011). Nevertheless, the fact remains that reductions in nitrogen loads in both Mobile Bay and the northern Gulf as a whole could generate dramatic benefits in terms of fishery enhancement alone. Oyster reef restoration could play an important part in bringing about such reductions in a cost-effective manner.
2.2.2. Reduction in shoreline erosion and associated costs The Gulf coast already is experiencing high annual economic losses from climate, and these losses are expected to increase over the next decades as a result of an increase in development and the frequency and severity of extreme climate events (Entergy Corporation, 2010). Recent studies suggest that the restoration and protection of coastal ecosystems may form part of a cost-effective adaptation strategy against damages from major climate events (ibid.). Equally importantly, coastal ecosystems also reduce continuous, incremental damages from non-catastrophic climate events. An example of the latter are losses of portions of shoreline properties or damages to coastal infrastructure such as roads caused by creeping shoreline erosion, which is occurring along many sections of Alabama’s coastline (Thieler and Hammar-Klose, 2000) including in the areas in which our two study reefs are located (Stricklin et al.,
31 Pers. communication, Ariana Sutton-Grier, NOAA. Feb. 1, 2011.
44
2010; Dauphin Island Sea Lab and University of Southern Alabama, 2011b).32 To date, no study exists that assesses the erosion reduction value of oyster reefs in the Gulf of Mexico. At the conceptual level, the erosion reduction value of an oyster reef is equivalent to the costs that would be incurred absent that reef. The most accurate approach to estimating these costs is an engineering-economics approach that maps out projected shoreline erosion and storm-related flooding for the coastal areas lying behind the reef for scenarios with and without the reef and analyzes the incremental damages to human-made and natural assets and human health. Due to the stochastic nature of climate events, such damage assessments should span multi-year time periods and calculate avoided damages in any given year as average annualized damages over the period of analysis. For prospective reefs, such analyses require forecasts of development footprints and climate impacts (e.g., Entergy Corporation, 2010; Economics of Climate Adaptation Working Group, 2010; Caribbean Catastrophe Risk Insurance Facility, 2010) that are beyond the scope of this paper. A recent Gulf-wide analysis of projected climate-related impacts and available adaptation measures (Entergy Corporation, 2010) estimates that beach nourishment and wetland restoration would avoid average annual losses in 2030 of $3.0 and $7.5 billion, respectively for all U.S. gulf states combined. Along many sections of the Alabama coast oyster reefs are the intermediate ecosystem service that produces the final ecosystem services of coastal wetlands and beaches because the latter would be eroded in the absence of these protective natural breakwaters (Roland and Douglass, 2005). Thus, it would be appropriate to attribute the protection values of coastal wetlands and beaches to oyster reefs. Unfortunately, this still prevents downscaling of the Entergy Corporation (2010) loss avoidance values of wetlands and beach nourishment because those values are driven by local geomorphological, climate and economic characteristics, making it difficult to assess whether average, Gulf coast-wide values estimated in that study are appropriate indicators of avoided losses in Mobile Bay. Furthermore, these values would tend to underestimate the full damage avoidance value of oyster reefs because reefs—in addition to “producing” damage avoidance through maintenance of wetlands and beaches—produce their own, additional damage avoidance by reducing wave height and thus the extent of coastal flooding from major storm events. In the case of losses such as flooding that can be covered by insurance, differences in insurance rates among properties protected by oyster reefs and those not protected by reef could serve as an indicator of the damage avoidance value of reefs for those specific properties. Conversely, properties not insured against flood damages would be expected to command lower prices, all else equal, because in a well-functioning real estate market, flood risk and associated expected losses would be capitalized (though likely not perfectly) into property values. A study of property values in a flood zone in coastal Carteret County, North Carolina (Bin et al., 2008)
32 For example, Shell Belt Road in Coden, located just south of Bayou La Batre, is currently protected by a concrete
sea wall that is failing and will need to be repaired or replaced.
45
found that when location amenities were controlled for, location in a flood zone indeed lowered property values.33
The authors found that flood insurance premiums in the coastal housing market do convey risk information, and that location within a floodplain lowered the average property’s value ($163,911 in 2004$) by 7.3 percent. Furthermore, the price discount for location within a higher risk area for flooding was significantly larger than for location within a lower risk area. Location within a 100-year floodplain lowered the average property’s value by 7.8 percent, while location within a 500-year floodplain lowers average property value by 6.2 percent. Using current and projected flood footprints and real estate prices in the Mobile Bay area, these findings potentially could be transferred to our study area, yet possible differences in risk attitudes and experiences with flood events may affect the validity of such a transfer.34 In addition, insurance premiums may not accurately reflect changing flood risks due to climate change. They also do not cover incremental losses to shoreline property values due to ongoing erosion from normal wave action. Such losses in principle could be estimated through a statistical analysis of changes in property values over time that corrects for other important variables. Most importantly, analyses that infer the damage avoidance value of coastal protection from insurance premium differentials do not capture the value of avoided losses to public infrastructure and natural assets such as beaches and marshes used for recreation. The value of these avoided damages requires separate analyses. Alternatively, following an approach used by Shepard et al. (2011), spatial maps of reductions in the area flooded by storm surges could be combined with storm surge probability distributions and real estate data to estimate the reduction in flood damages the reefs produce as a result of reducing wave height. Yet analyses of reductions in damages from erosion or floods are outside the scope of our study.
Because the Swift and Barton reefs will be located along eroding shorelines that are at moderate to severe risk from climate change impacts and that support a variety of human uses from residential to recreational, it is clear that these reefs will provide economic benefits in the form of coastal protection from flooding and erosion.
33 The authors controlled for most of the amenity values of floodplain location that influences the price of coastal
properties. Without such controls the amenity values mask the negative risk value associated with floodplain location. 34
For example, Bin and Polasky (2004) found that price discounts for location in a floodplain in North Carolina’s Pitt County increased significantly after Hurricane Floyd.
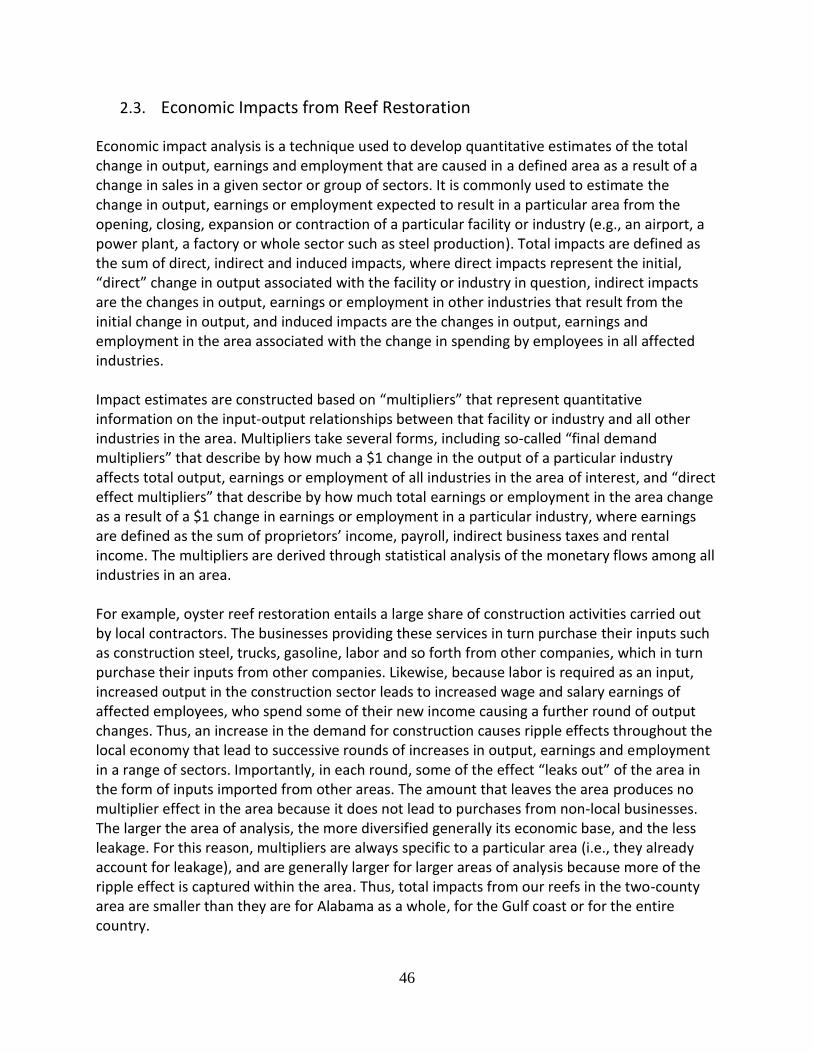
46
2.3. Economic Impacts from Reef Restoration
Economic impact analysis is a technique used to develop quantitative estimates of the total change in output, earnings and employment that are caused in a defined area as a result of a change in sales in a given sector or group of sectors. It is commonly used to estimate the change in output, earnings or employment expected to result in a particular area from the opening, closing, expansion or contraction of a particular facility or industry (e.g., an airport, a power plant, a factory or whole sector such as steel production). Total impacts are defined as the sum of direct, indirect and induced impacts, where direct impacts represent the initial, “direct” change in output associated with the facility or industry in question, indirect impacts are the changes in output, earnings or employment in other industries that result from the initial change in output, and induced impacts are the changes in output, earnings and employment in the area associated with the change in spending by employees in all affected industries. Impact estimates are constructed based on “multipliers” that represent quantitative information on the input-output relationships between that facility or industry and all other industries in the area. Multipliers take several forms, including so-called “final demand multipliers” that describe by how much a $1 change in the output of a particular industry affects total output, earnings or employment of all industries in the area of interest, and “direct effect multipliers” that describe by how much total earnings or employment in the area change as a result of a $1 change in earnings or employment in a particular industry, where earnings are defined as the sum of proprietors’ income, payroll, indirect business taxes and rental income. The multipliers are derived through statistical analysis of the monetary flows among all industries in an area. For example, oyster reef restoration entails a large share of construction activities carried out by local contractors. The businesses providing these services in turn purchase their inputs such as construction steel, trucks, gasoline, labor and so forth from other companies, which in turn purchase their inputs from other companies. Likewise, because labor is required as an input, increased output in the construction sector leads to increased wage and salary earnings of affected employees, who spend some of their new income causing a further round of output changes. Thus, an increase in the demand for construction causes ripple effects throughout the local economy that lead to successive rounds of increases in output, earnings and employment in a range of sectors. Importantly, in each round, some of the effect “leaks out” of the area in the form of inputs imported from other areas. The amount that leaves the area produces no multiplier effect in the area because it does not lead to purchases from non-local businesses. The larger the area of analysis, the more diversified generally its economic base, and the less leakage. For this reason, multipliers are always specific to a particular area (i.e., they already account for leakage), and are generally larger for larger areas of analysis because more of the ripple effect is captured within the area. Thus, total impacts from our reefs in the two-county area are smaller than they are for Alabama as a whole, for the Gulf coast or for the entire country.

47
For our analysis we use the Bureau of Economic Analysis (BEA) Regional Input-Output Modeling System (RIMS II) Type II 2002 benchmark multipliers (U.S. Department of Commerce, 1997) for Baldwin and Mobile counties. These multipliers (U.S. Department of Commerce, 2011) account for direct, indirect and induced impacts and are based on 2002 national-level input-output data and 2008 regional data. They cover 472 industries at the national level, out of which 410 are present in the two-county area. The economic impacts from the two reef restoration projects consist of additional output (sales), earnings and employment generated both by the reef construction itself, as well as by the increased commercial and recreational harvests supported by the reefs. As discussed in the previous section, in this analysis we assume that the recreational catch enhancement is too small to increase the number of angler days and thus does not cause economic impacts. However, larger restoration projects may enhance recreational catch sufficiently in order to increase the number of angler days, and thus would create economic impacts. We identify the industries that experience direct sales impacts as a result of reef construction itself or of the resulting fishery enhancement and then multiply the sales increases in those industries by the final demand multipliers to obtain estimates of the total increase in output, earnings and employment in the two-county area that result from the two reef projects.
2.3.1. Impacts from reef construction and monitoring Table 17 shows the expected expenditures for the Swift and Barton reef restoration projects. The amounts shown are based on extrapolations from recent reef construction projects in Mobile Bay, adjusted to the two study sites. Reef construction is expected to be completed in approximately one year. We assigned the expenditure categories to the appropriate RIMS II industries as shown in Table A9.1. In the few cases where there was no obvious match between a spending category and a RIMS II industry, we identified the appropriate industry based on the Standard Industry Classification (SIC) equivalents of RIMS II industries and the detailed descriptions of SIC sectors. TNC local project staff salaries (“project design, supervision, administration” in Table 17) represent an increase in the demand for services in the local “Environmental and other technical consulting services” sector and that sector’s multipliers were used to estimate their total impacts in the study area. The two reef construction projects are estimated to generate increases in total output and household earnings in the two-county area of $8.39 million and $2.76 million, respectively, and generate a total of 88 full and part time jobs. Because the total output includes the spending by the project ($4.28 million), the total output effect estimate of $8.39 million indicates that the project is expected to generate an additional output of $4.12 million in the region. Most (80 percent) of the output, earnings and jobs result from construction activity, which accounts for
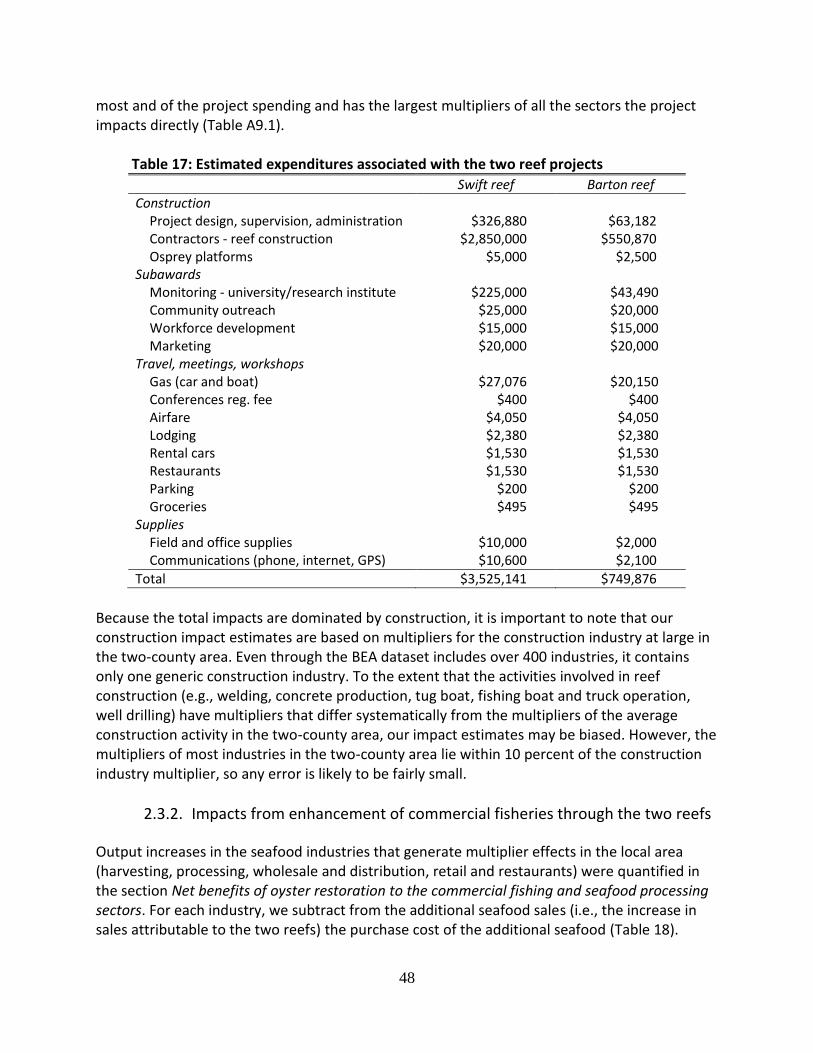
48
most and of the project spending and has the largest multipliers of all the sectors the project impacts directly (Table A9.1).
Table 17: Estimated expenditures associated with the two reef projects
Swift reef Barton reef
Construction Project design, supervision, administration $326,880 $63,182 Contractors - reef construction $2,850,000 $550,870 Osprey platforms $5,000 $2,500
Subawards Monitoring - university/research institute $225,000 $43,490 Community outreach $25,000 $20,000 Workforce development $15,000 $15,000 Marketing $20,000 $20,000
Travel, meetings, workshops Gas (car and boat) $27,076 $20,150 Conferences reg. fee $400 $400 Airfare $4,050 $4,050 Lodging $2,380 $2,380 Rental cars $1,530 $1,530 Restaurants $1,530 $1,530 Parking $200 $200 Groceries $495 $495
Supplies Field and office supplies $10,000 $2,000 Communications (phone, internet, GPS) $10,600 $2,100
Total $3,525,141 $749,876
Because the total impacts are dominated by construction, it is important to note that our construction impact estimates are based on multipliers for the construction industry at large in the two-county area. Even through the BEA dataset includes over 400 industries, it contains only one generic construction industry. To the extent that the activities involved in reef construction (e.g., welding, concrete production, tug boat, fishing boat and truck operation, well drilling) have multipliers that differ systematically from the multipliers of the average construction activity in the two-county area, our impact estimates may be biased. However, the multipliers of most industries in the two-county area lie within 10 percent of the construction industry multiplier, so any error is likely to be fairly small.
2.3.2. Impacts from enhancement of commercial fisheries through the two reefs
Output increases in the seafood industries that generate multiplier effects in the local area (harvesting, processing, wholesale and distribution, retail and restaurants) were quantified in the section Net benefits of oyster restoration to the commercial fishing and seafood processing sectors. For each industry, we subtract from the additional seafood sales (i.e., the increase in sales attributable to the two reefs) the purchase cost of the additional seafood (Table 18).
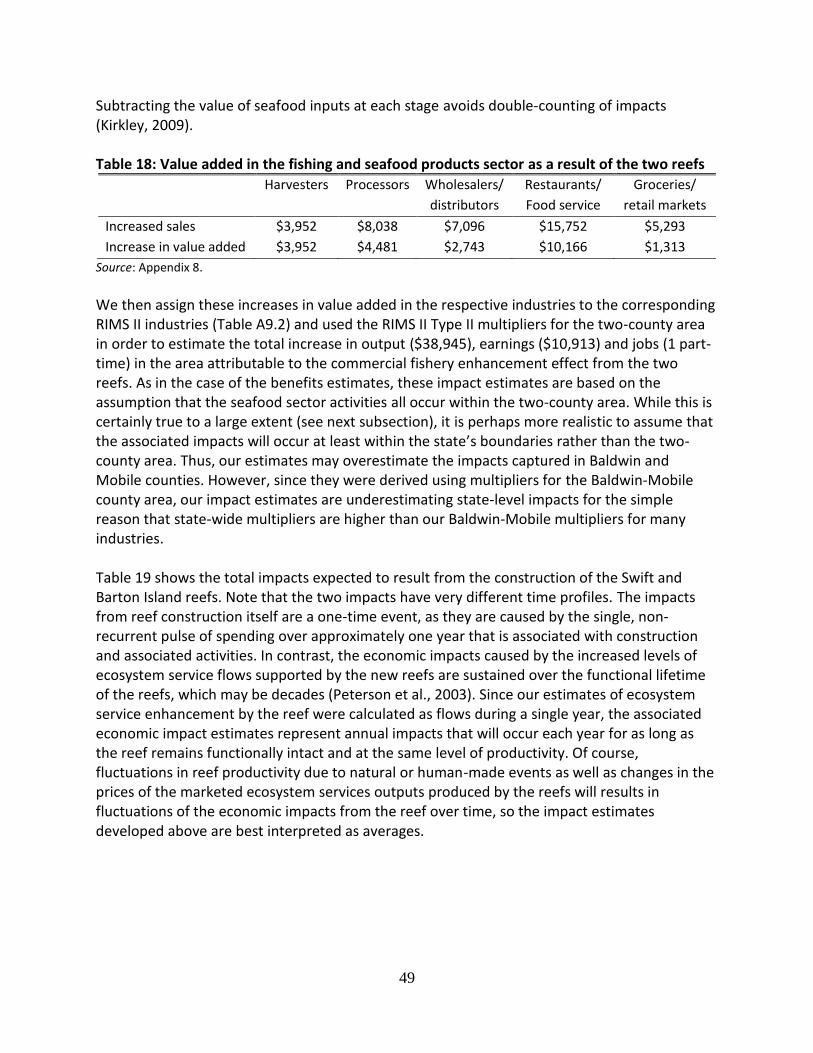
49
Subtracting the value of seafood inputs at each stage avoids double-counting of impacts (Kirkley, 2009). Table 18: Value added in the fishing and seafood products sector as a result of the two reefs
Harvesters Processors Wholesalers/
distributors
Restaurants/
Food service
Groceries/
retail markets
Increased sales $3,952 $8,038 $7,096 $15,752 $5,293
Increase in value added $3,952 $4,481 $2,743 $10,166 $1,313
Source: Appendix 8.
We then assign these increases in value added in the respective industries to the corresponding RIMS II industries (Table A9.2) and used the RIMS II Type II multipliers for the two-county area in order to estimate the total increase in output ($38,945), earnings ($10,913) and jobs (1 part-time) in the area attributable to the commercial fishery enhancement effect from the two reefs. As in the case of the benefits estimates, these impact estimates are based on the assumption that the seafood sector activities all occur within the two-county area. While this is certainly true to a large extent (see next subsection), it is perhaps more realistic to assume that the associated impacts will occur at least within the state’s boundaries rather than the two-county area. Thus, our estimates may overestimate the impacts captured in Baldwin and Mobile counties. However, since they were derived using multipliers for the Baldwin-Mobile county area, our impact estimates are underestimating state-level impacts for the simple reason that state-wide multipliers are higher than our Baldwin-Mobile multipliers for many industries. Table 19 shows the total impacts expected to result from the construction of the Swift and Barton Island reefs. Note that the two impacts have very different time profiles. The impacts from reef construction itself are a one-time event, as they are caused by the single, non-recurrent pulse of spending over approximately one year that is associated with construction and associated activities. In contrast, the economic impacts caused by the increased levels of ecosystem service flows supported by the new reefs are sustained over the functional lifetime of the reefs, which may be decades (Peterson et al., 2003). Since our estimates of ecosystem service enhancement by the reef were calculated as flows during a single year, the associated economic impact estimates represent annual impacts that will occur each year for as long as the reef remains functionally intact and at the same level of productivity. Of course, fluctuations in reef productivity due to natural or human-made events as well as changes in the prices of the marketed ecosystem services outputs produced by the reefs will results in fluctuations of the economic impacts from the reef over time, so the impact estimates developed above are best interpreted as averages.
50
Table 19: Total economic impacts in study region from restoration of the two oyster reefs
Output Earnings Jobs
Reef construction
Project design and management $846,407 $296,331 9 Construction $6,805,833 $2,204,875 68 Monitoring $526,965 $187,352 8 Community outreach, workforce
development, marketing $214,168 $67,007 2
Total, reef construction $8,393,372 $2,755,564 88
Commercial fishery enhancement Harvesters $6,947 $2,060 0.1 Processors $7,383 $1,450 0.1 Wholesalers/distributors $4,495 $1,393 0.0 Restaurant/Food service $17,871 $5,300 0.3 Groceries/Retail markets $2,248 $711 0.0
Total, seafood sector $38,945 $10,913 0.5 Notes: Region comprises Mobile and Baldwin counties, Alabama, Based on Tables 17 and 18 and Appendices 8 and 9. Numbers may not add up due to rounding. All dollar values are in 2010 prices.
2.3.3. Share of Benefits and Impacts Captured in Baldwin and Mobile Counties The benefit and impact estimates developed in the preceding sections describe the effects that construction of the Swift and Barton reefs are expected to have in the Mobile and Baldwin county area. However, given the lack of information on the exact movement of products among seafood sectors (Kirkley, 2009), it is impossible to estimate with any degree of confidence the portion of these effects that will accrue to areas outside of Baldwin and Mobile counties. As discussed above, if Alabamians consume seafood at a rate similar to the national average, the state’s seafood consumption exceeds landings. Thus, we do not expect a sizeable share of the additional finfish or crab harvest produced by the two reefs to leave the study area. To a large extent, this is also true for the additional crabs harvested. While a portion of the additional seafood undoubtedly would be absorbed by retail shops and restaurants in other regions in the state, most of the seafood processors, distributors/wholesalers and retailers in Alabama are located Baldwin and Mobile counties (Table 20). In addition, given the high density in the coastal area of seafood restaurants catering to visitors from in- and out-of-state, it is likely that much of the additional catch purchased by restaurants will end up in the two coastal counties as well. The concentration of processors and wholesalers in the area is not surprising given that most seafood harvested in Alabama waters and a sizeable share of seafood caught in Louisiana and Mississippi are landed in Bayou La Batre.35
35 In 2009, Bayou La Batre, the main fishing port in the area, ranked as the 24
th largest seafood port in the US in
terms of landings value and as the 6th
largest in the Gulf of Mexico (National Marine Fisheries Service, 2010). In
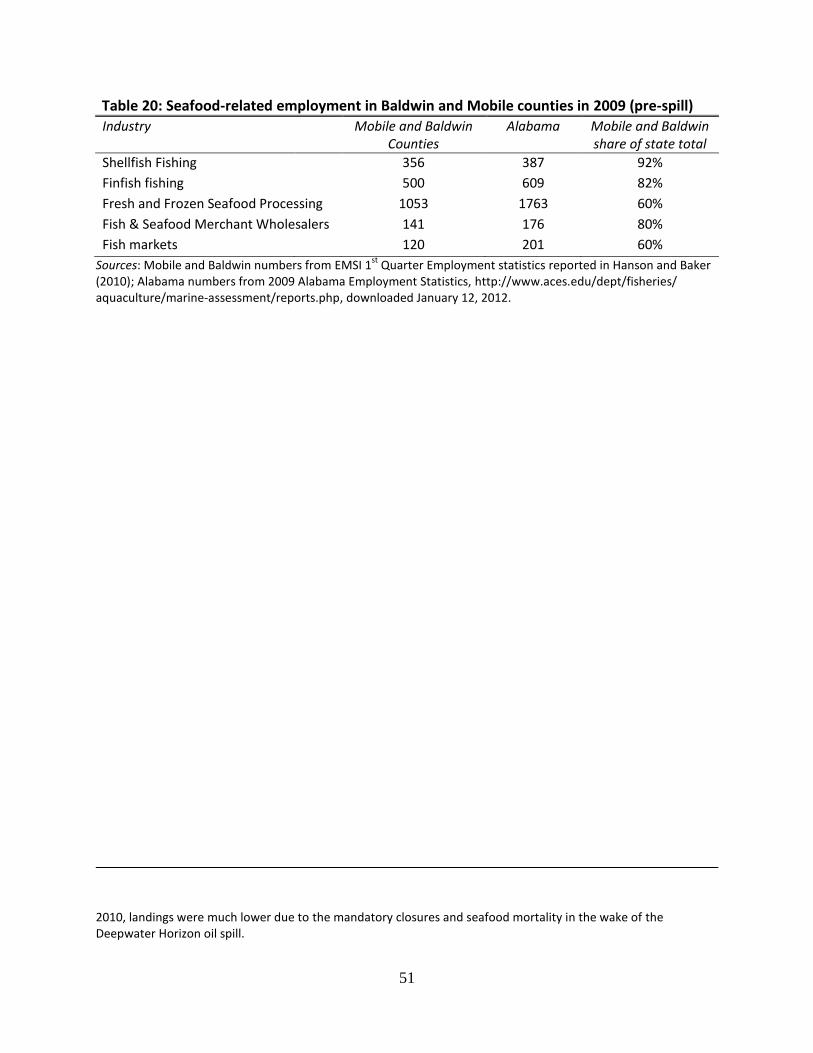
51
Table 20: Seafood-related employment in Baldwin and Mobile counties in 2009 (pre-spill)
Industry Mobile and Baldwin Counties
Alabama Mobile and Baldwin share of state total
Shellfish Fishing 356 387 92%
Finfish fishing 500 609 82%
Fresh and Frozen Seafood Processing 1053 1763 60%
Fish & Seafood Merchant Wholesalers 141 176 80%
Fish markets 120 201 60%
Sources: Mobile and Baldwin numbers from EMSI 1st
Quarter Employment statistics reported in Hanson and Baker (2010); Alabama numbers from 2009 Alabama Employment Statistics, http://www.aces.edu/dept/fisheries/ aquaculture/marine-assessment/reports.php, downloaded January 12, 2012.
2010, landings were much lower due to the mandatory closures and seafood mortality in the wake of the Deepwater Horizon oil spill.
52
2.4. Resource Dependence, Support for Reef Restoration, and Share of Economic Benefits and Impacts from Reef Restoration Absorbed by the Southeast-Asian American Community
In order to develop an initial understanding of the community’s awareness of the linkages between oyster reefs and oyster, crab and finfish fisheries and of the community’s support for reef restoration, we conducted a series of focus group meetings and key informant interviews in Bayou La Batre. These formats were confirmed to be appropriate for the Asian-American community in the area through consultation with the Gulf Coast office of Boat People SOS (BPSOS), a national organization that provides support to Southeast Asian immigrants and communities. Due to the fairly strong segregation of the three main sectors (Vietnamese, Laotian, Cambodian) in the local Asian-American community both by origin and by main seafood-related activity (shrimp and finfish vs. crabs vs. oysters; harvesting vs. processing), the BPSOS Gulf Coast office in Bayou La Batre recommended three focus groups, one for each sector of the population. BPSOS informed community members of the upcoming meetings, invited selected individuals to the focus group meetings, and convened the meetings, which took place in the BPSOS offices in Bayou La Batre in August 2011. In discussions with community members, BPSOS also identified and arranged four key informant interviewees. These included two individuals from the Laotian American community who substituted for the initially planned Laotian focus group, one Caucasian fisherman who was identified in discussions with the Organized Seafood Association of Alabama, and one owner of a seafood processing plant. The last however eventually was unavailable for an interview. The meetings and interviews were intended to gauge the magnitude of the dependence of the local Asian American community on seafood resources and the community’s awareness of, attitudes toward, interest in, potential for and obstacles to increased capture by the community of benefits from coastal restoration. A later survey conducted as part of a larger, Gulf-wide project focusing on enhancing community resilience through coastal ecosystem restoration will build on the insights generated by the focus groups and key informant interviews to generate reliable quantitative findings. The high dependence of the Asian American community in Bayou La Batre on seafood resources is documented in Table 21. Both the Laotian and Cambodian communities derive over three quarters of their overall income from seafood-related activities. While we did not obtain an estimate of the overall dependence on seafood of Bayou La Batre’s Vietnamese community, based on our Vietnamese focus group meeting and other sources (Burrage, 2009; Mississippi Coalition of Vietnamese-American Fisherfolk and Families, 2010), we expect dependence to be similarly high in that community. All three are engaged heavily in both the seafood harvest and processing sectors as both business owners and employees. Many Vietnamese and Laotian men also work as welders in shipyards or in boat repair shops.
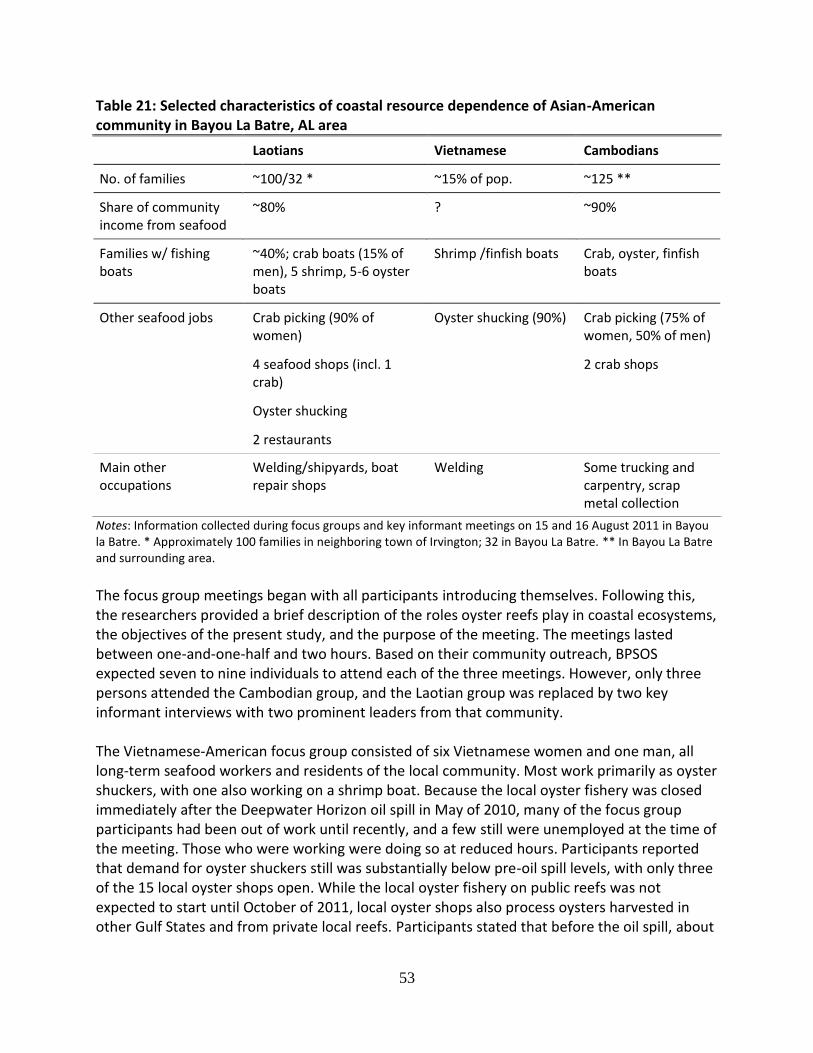
53
Table 21: Selected characteristics of coastal resource dependence of Asian-American community in Bayou La Batre, AL area
Laotians Vietnamese Cambodians
No. of families ~100/32 * ~15% of pop. ~125 **
Share of community income from seafood
~80% ? ~90%
Families w/ fishing boats
~40%; crab boats (15% of men), 5 shrimp, 5-6 oyster boats
Shrimp /finfish boats Crab, oyster, finfish boats
Other seafood jobs Crab picking (90% of women)
Oyster shucking (90%) Crab picking (75% of women, 50% of men)
4 seafood shops (incl. 1 crab)
2 crab shops
Oyster shucking
2 restaurants
Main other occupations
Welding/shipyards, boat repair shops
Welding Some trucking and carpentry, scrap metal collection
Notes: Information collected during focus groups and key informant meetings on 15 and 16 August 2011 in Bayou la Batre. * Approximately 100 families in neighboring town of Irvington; 32 in Bayou La Batre. ** In Bayou La Batre and surrounding area.
The focus group meetings began with all participants introducing themselves. Following this, the researchers provided a brief description of the roles oyster reefs play in coastal ecosystems, the objectives of the present study, and the purpose of the meeting. The meetings lasted between one-and-one-half and two hours. Based on their community outreach, BPSOS expected seven to nine individuals to attend each of the three meetings. However, only three persons attended the Cambodian group, and the Laotian group was replaced by two key informant interviews with two prominent leaders from that community. The Vietnamese-American focus group consisted of six Vietnamese women and one man, all long-term seafood workers and residents of the local community. Most work primarily as oyster shuckers, with one also working on a shrimp boat. Because the local oyster fishery was closed immediately after the Deepwater Horizon oil spill in May of 2010, many of the focus group participants had been out of work until recently, and a few still were unemployed at the time of the meeting. Those who were working were doing so at reduced hours. Participants reported that demand for oyster shuckers still was substantially below pre-oil spill levels, with only three of the 15 local oyster shops open. While the local oyster fishery on public reefs was not expected to start until October of 2011, local oyster shops also process oysters harvested in other Gulf States and from private local reefs. Participants stated that before the oil spill, about
54
half of the oysters processed by local shops came from local waters, but that share decreased to around one fifth in the 2011 season. Oyster shuckers get paid by weight of oyster meat produced. The average shucker processes about seven sacks of oysters a day. During winter months when oysters tend to be bigger, this yields around seventy pounds of meat, while during summer months it yields around 35-42 pounds. Shuckers get paid about $1 per pound of meat in winter and $1.10 in summer, for average earnings of around $70 and $50-60, respectively, per day for the average shucker. Focus group participants observed that the average size of oyster has declined, stating that while currently there are about eight oysters to a pound, ten years ago there were three. Only one of the seven participants had heard about local oyster restoration projects. That person had been hired for the Coffee Island restoration project, where she was paid $15 per hour for filling oysters into sacks. Others in the group also expressed interest in participating in future restoration projects, stating that there was no work to be had in the area. All attendees were in favor of restoration, with job creation during the construction period the key reason for their support. Asked whether they thought that the community would be able to rely on coastal and marine resources in the future, participants thought that generally yes, but that they were less certain about oysters in particular, stating that while shrimp and fish can swim away from pollution and later return, oysters cannot escape. People stated that the oil spill had changed things. While livelihoods were “all right” pre-Katrina and recovered within several months after the hurricane, that had not been the case after the oil spill. Asked what jobs they would want for their children, people chose computer science, engineering, welding, government worker, the military and chef. When prompted about entering the seafood business, none considered that desirable. The Cambodian-American focus group consisted of three women. One of the three works as a crab picker specializing in crab claws and has been working in crab shops from an early age. The group stated that this is quite common as many parents do not have family members to watch their children at home and so they take them to work where the children begin crab picking at an early age to increase household income. The other two participants used to pick crabs as well but do not do so now. One of them currently is unemployed; her Caucasian husband works as a crab cook. The other participant now works as a translator for a community support organization. The three stated that many in their families also pick crabs. While the crab season is year-round, catch is low during October thru March. Because of their high dependence on crab picking, this means that monthly income for most Cambodian families drops off sharply during half of the year. For this reason, most Cambodians in Bayou La Batre who have a chance to obtain a year-round job leave the crab picking business. However, these are mostly younger people, quite a few of whom enter nursing or beautician careers or pursue education beyond K-12. Most older Cambodian-Americans in the area lack sufficient English skills to be able to obtain jobs other than in seafood processing, although some are engaged in scrap metal collection. Those who have sufficient English skills often work as truck drivers or construction site carpenters. This is seen as standing in stark contrast to Laotian-Americans, whose comparatively good English skills have allowed them to move into welding in local shipyards.
55
The three stated that most crab pickers lost their jobs after the oil spill, but that harvests by now have recovered to pre-oil spill levels. About three quarters of the crabs processed in the area are harvested elsewhere. Crab pickers are paid per pound of meat picked, earning around $1.50 per pound for claw meat and $2 for body meat (which is more difficult to pick). Workdays last from ten to over twelve hours during the high season and often run from the very early morning hours thru early to mid-afternoon. Many crab pickers try to work as much as possible during the high season in order to earn enough income for the rest of the year, due to the scarcity of other job opportunities. Crab pickers pick between 50 and 100 pounds per day, earning between $75 and over $180 a day during the six-month crab high season. Participants could not describe what they thought the term “coastal restoration” meant, but they had heard about an oyster project the preceding year that employed around ten people from the Asian-American community. Construction jobs were seen as the most important benefit to the local community from reef restoration, but the increase in seafood harvests the researchers had described earlier was seen as important as well. Asked how they thought the local community could benefit more from reef restoration projects, participants thought that more construction work would be good as it would create more jobs and income. Asked whether they thought their community could rely on coastal and marine resources in the future, participants responded in the affirmative. They also stated that more restoration would help sustain resources, and the increased seafood and jobs would help sustain their community. Respondents thought that access to non-seafood jobs was limited not just by the pervasive language barrier for the older generation but also by a strong sense of pride and self-sufficiency that keeps individuals from asking for assistance and makes outreach to the community difficult. All three ethnic groups considered the restoration of seafood stocks in Mobile Bay to be of high importance and stated they were highly supportive of oyster reef restoration if it helped to achieve that goal. In addition, they saw coastal restoration projects such as reef construction as desirable because of the jobs such projects might bring to the area.
2.4.1. Share of benefits and impacts received by the Southeast Asian-American community
The Southeast Asian-American population in the area is heavily concentrated along the coast in the towns of Bayou la Batre, Coden and Irvington where most of the seafood processing shops and plants are located (Figure 2-8). Likewise, many of the seafood markets and restaurants are located along the tourist-dense coastal portion of the two-county area.
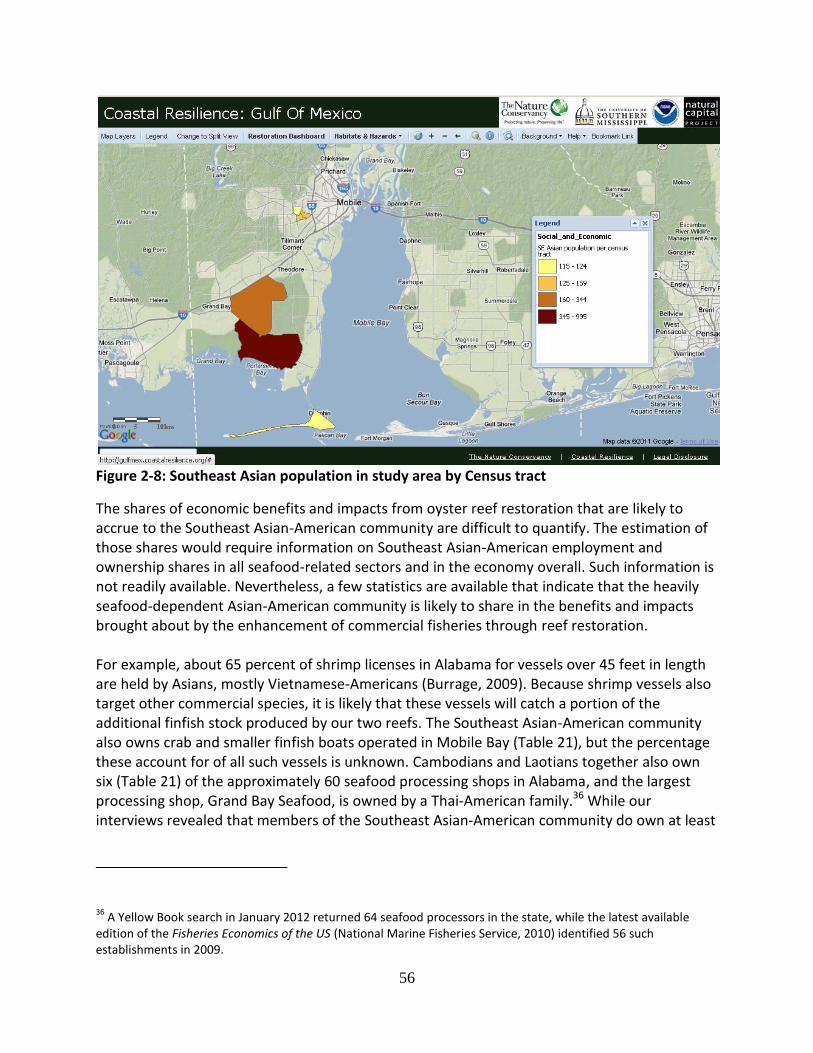
56
Figure 2-8: Southeast Asian population in study area by Census tract
The shares of economic benefits and impacts from oyster reef restoration that are likely to accrue to the Southeast Asian-American community are difficult to quantify. The estimation of those shares would require information on Southeast Asian-American employment and ownership shares in all seafood-related sectors and in the economy overall. Such information is not readily available. Nevertheless, a few statistics are available that indicate that the heavily seafood-dependent Asian-American community is likely to share in the benefits and impacts brought about by the enhancement of commercial fisheries through reef restoration. For example, about 65 percent of shrimp licenses in Alabama for vessels over 45 feet in length are held by Asians, mostly Vietnamese-Americans (Burrage, 2009). Because shrimp vessels also target other commercial species, it is likely that these vessels will catch a portion of the additional finfish stock produced by our two reefs. The Southeast Asian-American community also owns crab and smaller finfish boats operated in Mobile Bay (Table 21), but the percentage these account for of all such vessels is unknown. Cambodians and Laotians together also own six (Table 21) of the approximately 60 seafood processing shops in Alabama, and the largest processing shop, Grand Bay Seafood, is owned by a Thai-American family.36 While our interviews revealed that members of the Southeast Asian-American community do own at least
36 A Yellow Book search in January 2012 returned 64 seafood processors in the state, while the latest available
edition of the Fisheries Economics of the US (National Marine Fisheries Service, 2010) identified 56 such establishments in 2009.
57
two restaurants in the area, the Southeast Asian-American share of ownership of seafood retail establishments and restaurants is unknown. Based on this information, it is clear that the community is poised to capture a significant portion of the producer surplus associated with the harvesting and processing of the fishery enhancement produced by the two reefs, as well as a smaller portion of the producer surplus associated with seafood retailing and restaurants. Our discussions with community members also revealed that Asian-Americans make up a substantial share of the deckhands employed on fishing vessels in the area. In addition, a large number of seafood processing plants in Alabama, Mississippi and Louisiana are primarily staffed by Asian-Americans, with Vietnamese making up the largest percentage of the work force, followed by Laotians and Cambodians (Burrage, 2009). While the shares of the Asian-American workforce in other parts of the seafood sectors and the economy at large are unknown, it is obvious that this community will receive some of the employee earnings associated with increased fish harvests and resulting multiplier effects in other sectors in the local and regional economies. This superficial assessment confirms the view community members expressed during our meetings that an improvement in the seafood resource would benefit the community. A more detailed evaluation would require an in-depth household and business survey of the community.
By comparison, reef construction itself to date seems to have had very limited benefits for and impacts on the Southeast Asian-American community. One participant in our focus groups had been contracted for manual labor by the main contractor for construction of the Coffee Island reef. Several others had heard of that project through the staff at BPSOS’ Bayou La Batre office, who had been contacted by the local Conservancy chapter to alert them to the project and the short-term employment opportunities it offered. The lack of construction businesses operated by Southeast Asian-Americans precludes them from capturing a share of the construction business and associated profits and a larger share of the earnings from employment.
Clearly, the community currently is not well-placed to fully realize the economic opportunities coastal restoration projects could offer. Individuals do benefit indirectly from coastal construction projects through the boost such projects deliver to employment in the wider local economy and through limited short-term employment as manual labor. However, these benefits are fairly diffuse and incremental compared to the concentrated and large benefits that accrue to professionals or owners of companies directly involved in reef construction.
Still, opportunities exist for increasing the benefits future coastal restoration projects provide to this community. Realizing these opportunities requires two key conditions: increased access and improved capacity. Community involvement in and access to construction projects can be enhanced immediately through improved outreach to the community and through emphatically promoting the application of equal hiring practices on the part of contractors, and in the
58
medium term through language training. Importantly, our discussions with community members suggest that the effectiveness of outreach could be much improved if it included key community institutions such as churches and temples. The lack on the part of many community members of the ability to communicate in or even understand English has been a key obstacle for government agencies to engaging the community (Burrage, 2009). Our focus groups confirmed that this is equally true for businesses. While federal agencies appear to have begun to address this problem by hiring bilingual staff (ibid.), this is unlikely to dramatically increase community access to private employment opportunities. The latter can only be achieved by equipping as many individuals in the community as possible with the ability to communicate in English. In turn, the capacity of the community for more fully engaging in restoration projects can be improved in the short term through workforce training. However, there are several measures that require more time to implement but are equally crucial. These include the improved access to state and federal agencies involved in coastal management and restoration and an active support for the creation of private or community-owned enterprises that can work as lead or subcontractors for the construction work. BPSOS staff stated that at present, nobody in the community even conceives of the possibility of starting construction businesses, either jointly or individually owned ones. This may have a variety of reasons, ranging from obvious ones such as a lack of familiarity with this field of business or with administrative licensing requirements, to less obvious ones such as limited credit access. A more in-depth discussion with community members would be needed to ascertain the key obstacles, real or perceived. All of the measures outlined above would not only benefit the community by improving their ability to engage in coastal restoration projects but would help diversify the economic base of the community and thus its resiliency to man-made or natural disasters. Several of the short-term measures discussed are already being incorporated into the planning of the current suite of restoration projects, including Barton Island and the Swift Tract. These include improved outreach, workforce training, and contractor requirements regarding community hires for the projects.
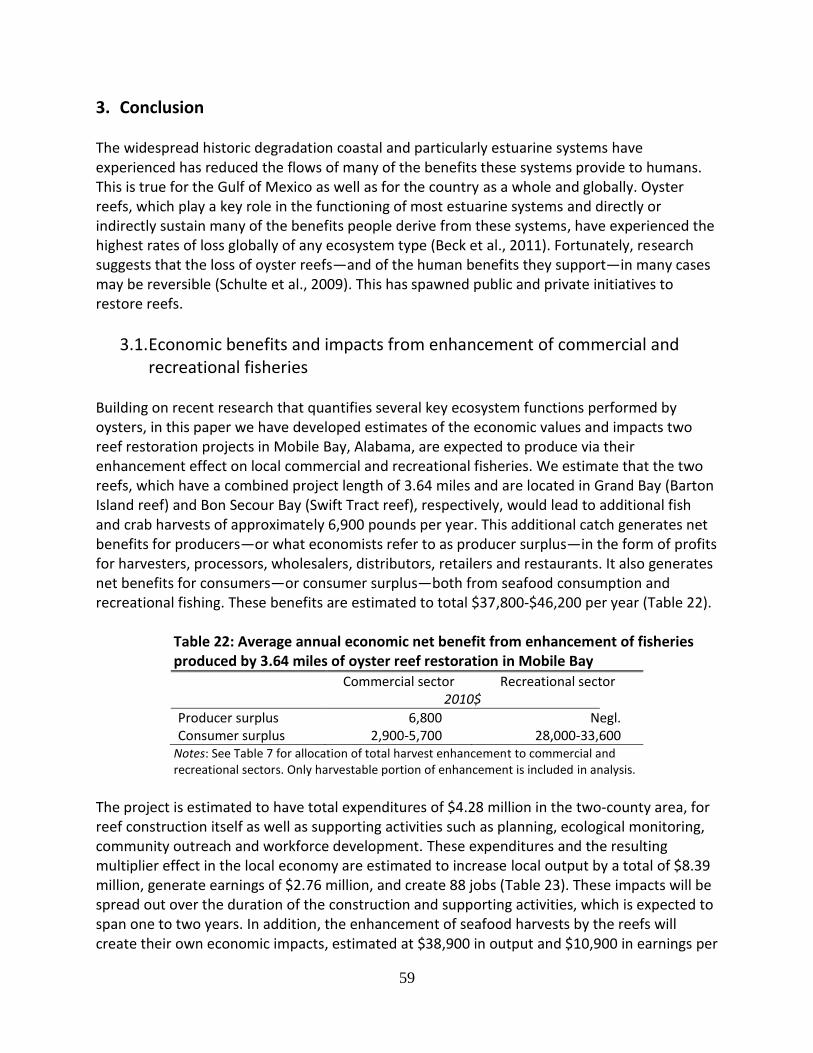
59
3. Conclusion The widespread historic degradation coastal and particularly estuarine systems have experienced has reduced the flows of many of the benefits these systems provide to humans. This is true for the Gulf of Mexico as well as for the country as a whole and globally. Oyster reefs, which play a key role in the functioning of most estuarine systems and directly or indirectly sustain many of the benefits people derive from these systems, have experienced the highest rates of loss globally of any ecosystem type (Beck et al., 2011). Fortunately, research suggests that the loss of oyster reefs—and of the human benefits they support—in many cases may be reversible (Schulte et al., 2009). This has spawned public and private initiatives to restore reefs.
3.1. Economic benefits and impacts from enhancement of commercial and recreational fisheries
Building on recent research that quantifies several key ecosystem functions performed by oysters, in this paper we have developed estimates of the economic values and impacts two reef restoration projects in Mobile Bay, Alabama, are expected to produce via their enhancement effect on local commercial and recreational fisheries. We estimate that the two reefs, which have a combined project length of 3.64 miles and are located in Grand Bay (Barton Island reef) and Bon Secour Bay (Swift Tract reef), respectively, would lead to additional fish and crab harvests of approximately 6,900 pounds per year. This additional catch generates net benefits for producers—or what economists refer to as producer surplus—in the form of profits for harvesters, processors, wholesalers, distributors, retailers and restaurants. It also generates net benefits for consumers—or consumer surplus—both from seafood consumption and recreational fishing. These benefits are estimated to total $37,800-$46,200 per year (Table 22).
Table 22: Average annual economic net benefit from enhancement of fisheries produced by 3.64 miles of oyster reef restoration in Mobile Bay
Commercial sector Recreational sector 2010$
Producer surplus 6,800 Negl. Consumer surplus 2,900-5,700 28,000-33,600
Notes: See Table 7 for allocation of total harvest enhancement to commercial and recreational sectors. Only harvestable portion of enhancement is included in analysis.
The project is estimated to have total expenditures of $4.28 million in the two-county area, for reef construction itself as well as supporting activities such as planning, ecological monitoring, community outreach and workforce development. These expenditures and the resulting multiplier effect in the local economy are estimated to increase local output by a total of $8.39 million, generate earnings of $2.76 million, and create 88 jobs (Table 23). These impacts will be spread out over the duration of the construction and supporting activities, which is expected to span one to two years. In addition, the enhancement of seafood harvests by the reefs will create their own economic impacts, estimated at $38,900 in output and $10,900 in earnings per
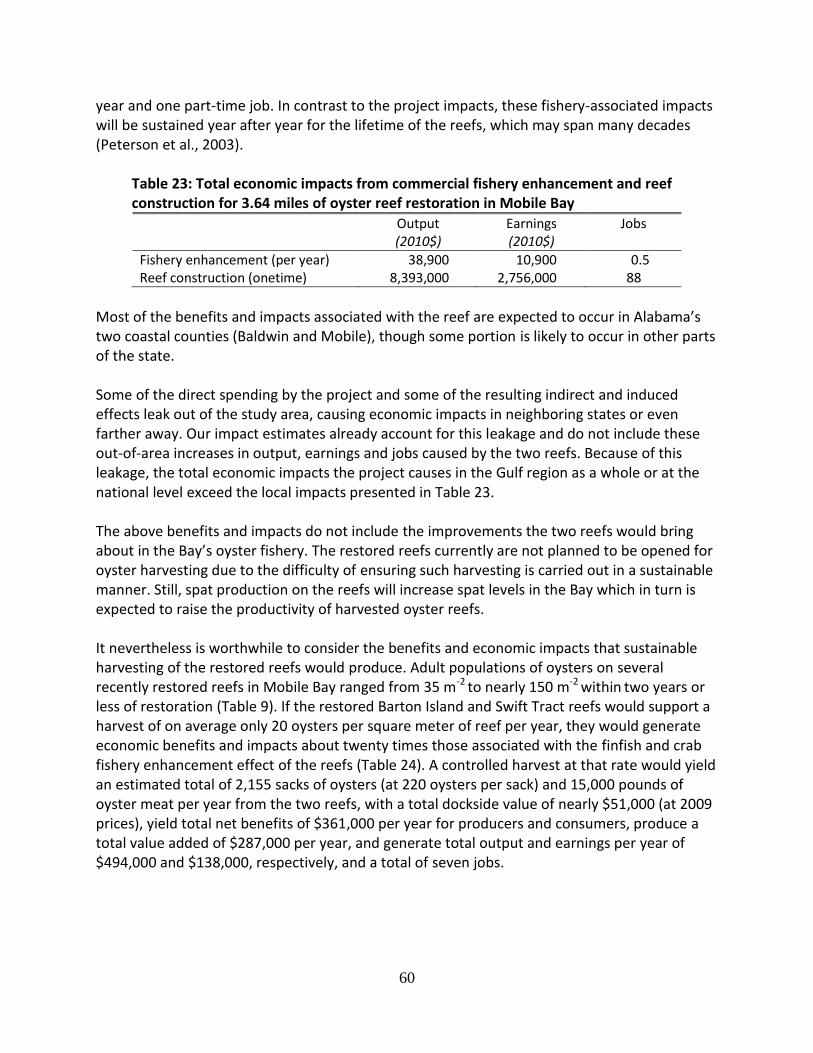
60
year and one part-time job. In contrast to the project impacts, these fishery-associated impacts will be sustained year after year for the lifetime of the reefs, which may span many decades (Peterson et al., 2003).
Table 23: Total economic impacts from commercial fishery enhancement and reef construction for 3.64 miles of oyster reef restoration in Mobile Bay
Output Earnings Jobs (2010$) (2010$)
Fishery enhancement (per year) 38,900 10,900 0.5 Reef construction (onetime) 8,393,000 2,756,000 88
Most of the benefits and impacts associated with the reef are expected to occur in Alabama’s two coastal counties (Baldwin and Mobile), though some portion is likely to occur in other parts of the state. Some of the direct spending by the project and some of the resulting indirect and induced effects leak out of the study area, causing economic impacts in neighboring states or even farther away. Our impact estimates already account for this leakage and do not include these out-of-area increases in output, earnings and jobs caused by the two reefs. Because of this leakage, the total economic impacts the project causes in the Gulf region as a whole or at the national level exceed the local impacts presented in Table 23. The above benefits and impacts do not include the improvements the two reefs would bring about in the Bay’s oyster fishery. The restored reefs currently are not planned to be opened for oyster harvesting due to the difficulty of ensuring such harvesting is carried out in a sustainable manner. Still, spat production on the reefs will increase spat levels in the Bay which in turn is expected to raise the productivity of harvested oyster reefs. It nevertheless is worthwhile to consider the benefits and economic impacts that sustainable harvesting of the restored reefs would produce. Adult populations of oysters on several recently restored reefs in Mobile Bay ranged from 35 m-2 to nearly 150 m-2 within two years or less of restoration (Table 9). If the restored Barton Island and Swift Tract reefs would support a harvest of on average only 20 oysters per square meter of reef per year, they would generate economic benefits and impacts about twenty times those associated with the finfish and crab fishery enhancement effect of the reefs (Table 24). A controlled harvest at that rate would yield an estimated total of 2,155 sacks of oysters (at 220 oysters per sack) and 15,000 pounds of oyster meat per year from the two reefs, with a total dockside value of nearly $51,000 (at 2009 prices), yield total net benefits of $361,000 per year for producers and consumers, produce a total value added of $287,000 per year, and generate total output and earnings per year of $494,000 and $138,000, respectively, and a total of seven jobs.
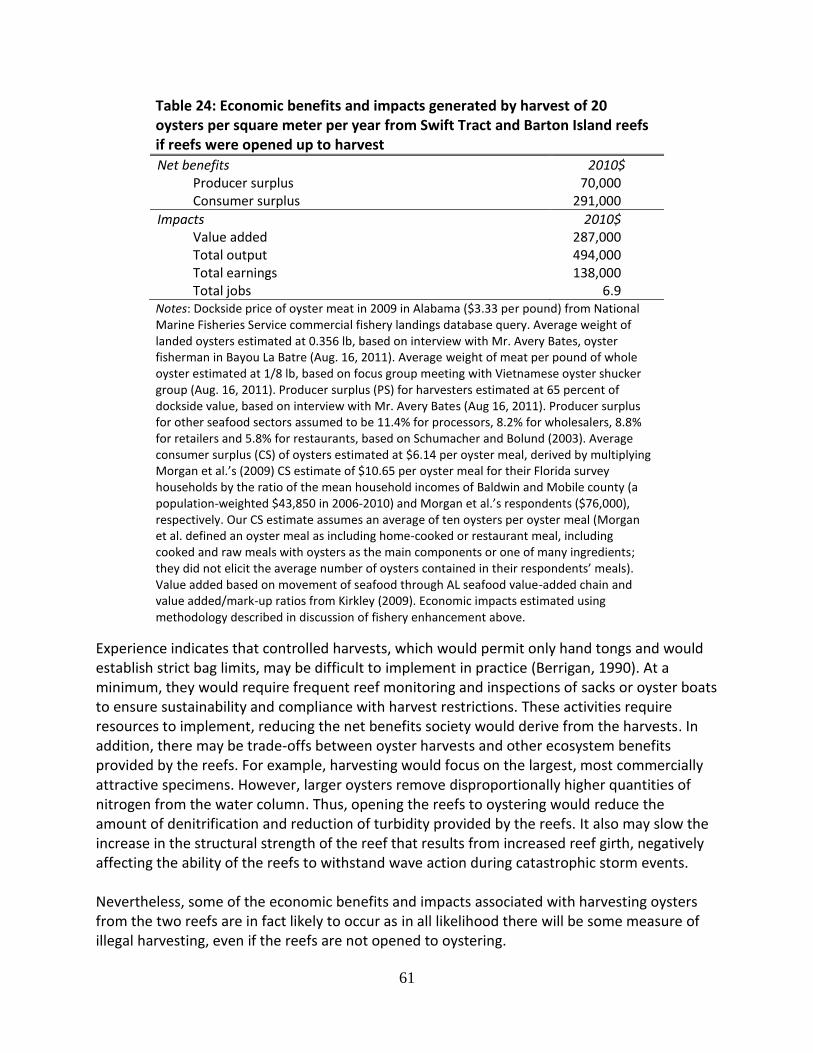
61
Table 24: Economic benefits and impacts generated by harvest of 20 oysters per square meter per year from Swift Tract and Barton Island reefs if reefs were opened up to harvest
Net benefits 2010$ Producer surplus 70,000 Consumer surplus 291,000
Impacts 2010$ Value added 287,000 Total output 494,000 Total earnings 138,000 Total jobs 6.9
Notes: Dockside price of oyster meat in 2009 in Alabama ($3.33 per pound) from National Marine Fisheries Service commercial fishery landings database query. Average weight of landed oysters estimated at 0.356 lb, based on interview with Mr. Avery Bates, oyster fisherman in Bayou La Batre (Aug. 16, 2011). Average weight of meat per pound of whole oyster estimated at 1/8 lb, based on focus group meeting with Vietnamese oyster shucker group (Aug. 16, 2011). Producer surplus (PS) for harvesters estimated at 65 percent of dockside value, based on interview with Mr. Avery Bates (Aug 16, 2011). Producer surplus for other seafood sectors assumed to be 11.4% for processors, 8.2% for wholesalers, 8.8% for retailers and 5.8% for restaurants, based on Schumacher and Bolund (2003). Average consumer surplus (CS) of oysters estimated at $6.14 per oyster meal, derived by multiplying Morgan et al.’s (2009) CS estimate of $10.65 per oyster meal for their Florida survey households by the ratio of the mean household incomes of Baldwin and Mobile county (a population-weighted $43,850 in 2006-2010) and Morgan et al.’s respondents ($76,000), respectively. Our CS estimate assumes an average of ten oysters per oyster meal (Morgan et al. defined an oyster meal as including home-cooked or restaurant meal, including cooked and raw meals with oysters as the main components or one of many ingredients; they did not elicit the average number of oysters contained in their respondents’ meals). Value added based on movement of seafood through AL seafood value-added chain and value added/mark-up ratios from Kirkley (2009). Economic impacts estimated using methodology described in discussion of fishery enhancement above.
Experience indicates that controlled harvests, which would permit only hand tongs and would establish strict bag limits, may be difficult to implement in practice (Berrigan, 1990). At a minimum, they would require frequent reef monitoring and inspections of sacks or oyster boats to ensure sustainability and compliance with harvest restrictions. These activities require resources to implement, reducing the net benefits society would derive from the harvests. In addition, there may be trade-offs between oyster harvests and other ecosystem benefits provided by the reefs. For example, harvesting would focus on the largest, most commercially attractive specimens. However, larger oysters remove disproportionally higher quantities of nitrogen from the water column. Thus, opening the reefs to oystering would reduce the amount of denitrification and reduction of turbidity provided by the reefs. It also may slow the increase in the structural strength of the reef that results from increased reef girth, negatively affecting the ability of the reefs to withstand wave action during catastrophic storm events. Nevertheless, some of the economic benefits and impacts associated with harvesting oysters from the two reefs are in fact likely to occur as in all likelihood there will be some measure of illegal harvesting, even if the reefs are not opened to oystering.
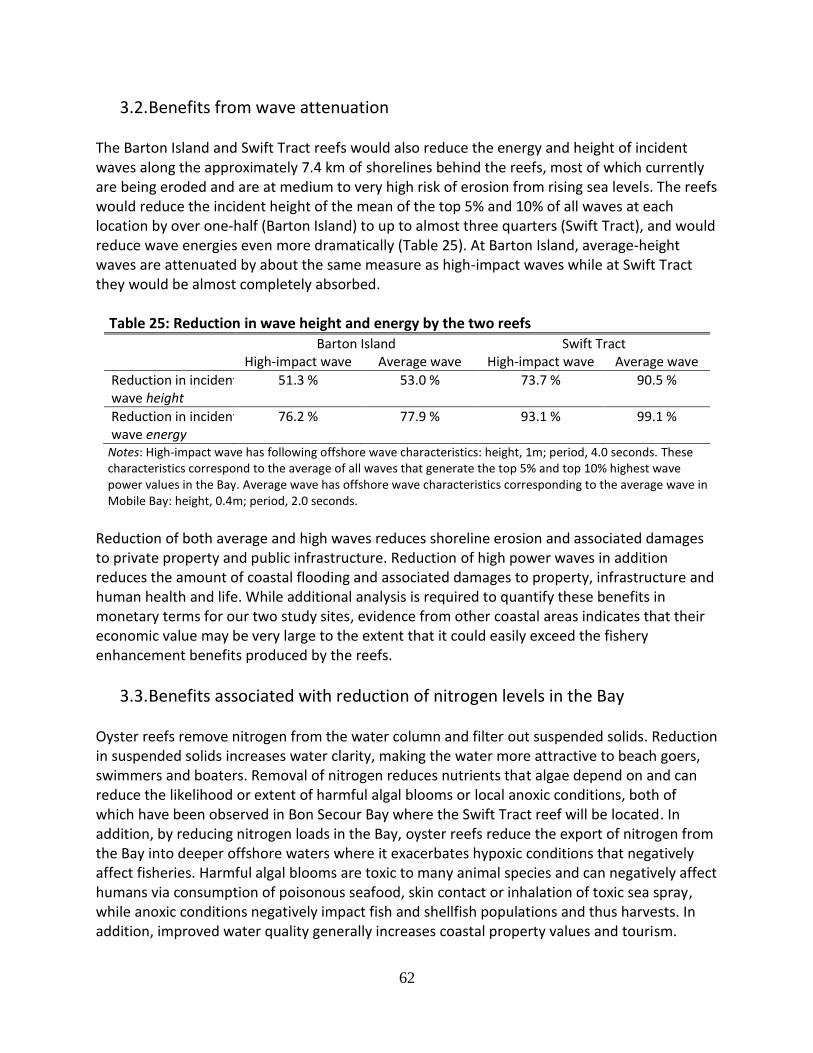
62
3.2. Benefits from wave attenuation The Barton Island and Swift Tract reefs would also reduce the energy and height of incident waves along the approximately 7.4 km of shorelines behind the reefs, most of which currently are being eroded and are at medium to very high risk of erosion from rising sea levels. The reefs would reduce the incident height of the mean of the top 5% and 10% of all waves at each location by over one-half (Barton Island) to up to almost three quarters (Swift Tract), and would reduce wave energies even more dramatically (Table 25). At Barton Island, average-height waves are attenuated by about the same measure as high-impact waves while at Swift Tract they would be almost completely absorbed. Table 25: Reduction in wave height and energy by the two reefs
Barton Island Swift Tract High-impact wave Average wave High-impact wave Average wave
Reduction in incident wave height
51.3 % 53.0 % 73.7 % 90.5 %
Reduction in incident wave energy
76.2 % 77.9 % 93.1 % 99.1 %
Notes: High-impact wave has following offshore wave characteristics: height, 1m; period, 4.0 seconds. These characteristics correspond to the average of all waves that generate the top 5% and top 10% highest wave power values in the Bay. Average wave has offshore wave characteristics corresponding to the average wave in Mobile Bay: height, 0.4m; period, 2.0 seconds.
Reduction of both average and high waves reduces shoreline erosion and associated damages to private property and public infrastructure. Reduction of high power waves in addition reduces the amount of coastal flooding and associated damages to property, infrastructure and human health and life. While additional analysis is required to quantify these benefits in monetary terms for our two study sites, evidence from other coastal areas indicates that their economic value may be very large to the extent that it could easily exceed the fishery enhancement benefits produced by the reefs.
3.3. Benefits associated with reduction of nitrogen levels in the Bay Oyster reefs remove nitrogen from the water column and filter out suspended solids. Reduction in suspended solids increases water clarity, making the water more attractive to beach goers, swimmers and boaters. Removal of nitrogen reduces nutrients that algae depend on and can reduce the likelihood or extent of harmful algal blooms or local anoxic conditions, both of which have been observed in Bon Secour Bay where the Swift Tract reef will be located. In addition, by reducing nitrogen loads in the Bay, oyster reefs reduce the export of nitrogen from the Bay into deeper offshore waters where it exacerbates hypoxic conditions that negatively affect fisheries. Harmful algal blooms are toxic to many animal species and can negatively affect humans via consumption of poisonous seafood, skin contact or inhalation of toxic sea spray, while anoxic conditions negatively impact fish and shellfish populations and thus harvests. In addition, improved water quality generally increases coastal property values and tourism.
63
While nitrogen removal by the two restored reefs is too low to affect nitrogen levels baywide (Table 26), it may nonetheless improve local water quality. The quantification of the economic value of water quality improvements brought about by the two reefs is beyond the scope of our study and is likely to be small compared to the value of direct enhancement of fisheries and avoided coastal erosion and flooding.
Table 26: Annual quantities of nitrogen removed by the two reefs
Barton Island Swift Tract kg/yr
Low estimate 18 107 High estimate 275 1,613
Nitrogen removal by oysters may generate additional benefits in the form of reduced compliance costs for regulated emission sources and revenues from nitrogen credit sales from reefs, in case local or regional water quality trading markets for nitrogen develop. Water quality markets are driven by Clean Water Act-based total maximum daily loads (TMDL), which place legal limits on the amounts of specified pollutants that particular sources can emit into a water body. Mobile Bay contains several waters with nitrogen TMDLs, and several more that are awaiting such TMDLs. Water quality trading could be incorporated into nitrogen TMDLs, allowing regulated sources to purchase nitrogen credits from other sources that can achieve reductions more cheaply. In some water quality markets in the US, oyster reefs have been proposed as sources for such credits, as have been wetland or stream restoration. If a larger market for nitrogen were to emerge as part of a large-scale effort to reduce the hypoxic zone off the cost of the northern Gulf of Mexico, restored oyster reefs could qualify as sources of nitrogen credits in such a market.
3.4. Scaling things up: Benefits and Impacts from Mobile Bay-wide oyster reef restoration
These results clearly show that the two restored reefs would produce sizeable economic benefits for local and regional producers and consumers as well as significant impacts in the local and regional economies. Yet, these benefits and impacts pale in comparison to what could be achieved through large-scale restoration of oyster reefs in the Bay.
For example, Restore Coastal Alabama’s goal of adding 100 miles of reefs would go a long way towards returning oyster reef coverage in the Bay to the estimated 1,150 ha it was around the turn of the previous century (zu Ermgassen et al., 2011, supplementary data). Oysters in Mobile Bay have been harvested since prehistoric times, at an average rate of a million pounds per year since the 1880s (Wallace et al., 1999) and have been negatively affected by other human activities such as pollution (Heck and Spitzer, 2003). Thus, even this “historic” extent of oyster reefs does not represent pristine conditions. In any case, construction of oyster reefs need not be limited to sites in which reefs have been documented to occur historically. Rather,

64
establishment of successful reefs is limited primarily by suitable habitat in the Bay, which some estimates put at 24,000 ha (Wallace et al., 1999). Estimates of the economic benefits to people and impacts on the economy from larger reef restoration projects can be derived fairly straightforwardly through a proportional scaling up of the benefit and impact estimates developed for our two reefs, unless the project in question is large enough to affect prices of outputs (seafood products) or inputs (e.g., construction materials or labor). A 100-mile reef restoration project that uses the breakwater reef design employed by the Barton Island and Swift Tract reefs (Table 1) would produce 90 miles of reef segments with a total footprint of approximately 65.2 ha (161 acres), or 27.5 times the combined footprint of the Barton Island and Swift Tract reefs. Such a project would produce an estimated 118,000 pounds (53.5 metric tons) per year in additional finfish and crab harvest that would generate an estimated $1-$1.2 million in economic net benefits per year even without accounting for the producer surplus associated with increases in recreational angling likely to result from a non-negligible increase in attractiveness of the Bay for sportfishermen/women; sustainable oyster harvests from those reefs would increase these net benefits by an order of magnitude (Table 27).37
Table 27: Average annual economic net benefit from fisheries enhancement produced by 100-mile oyster reef restoration project in Mobile Bay
Commercial sector Recreational sector Sum 2010$
Finfish and crabs Producer surplus 188,000 >0 >188,000 Consumer surplus 81,000-157,000 770,000-924,000 850,000-1,081,000
Sum 268,000-345,000 770,000-924,000 1,038,000-1,269,000
Oysters Producer surplus 1,918,000 n/a 1,918,000
Consumer surplus 8,009,000 n/a 8,009,000 Notes: See Table 7 for allocation of total harvest enhancement (117,908 lb) to commercial and recreational sectors. Only harvestable portion of enhancement is included in analysis. Oyster harvests assumed to be 20 individuals m
-2 yr
-1. Note: Numbers may not add up due to rounding.
The additional reefs also would remove an estimated 3.4-51.9 metric tons (7,600-114,000 pounds) of nitrogen from the Bay each year. While this is equivalent to less than one tenth of one percent of total nitrogen loading of the Bay, these reductions are concentrated in the shallow coastal waters of the Bay where they in some cases may make a significant contribution
37 Because the increase in commercial landings amounts to only about one fifth of one percent of total seafood
landings in Alabama (based on 2009, pre-spill landings of 27.5 million pounds), the project will have a negligible effect on seafood prices.
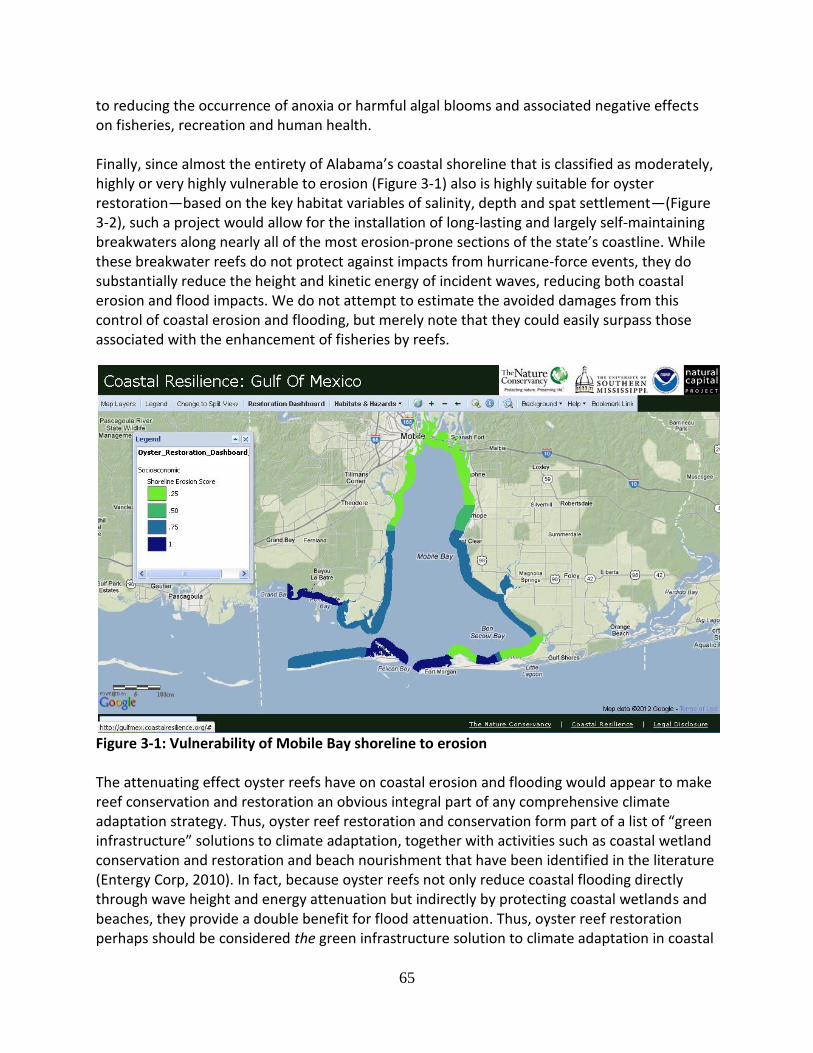
65
to reducing the occurrence of anoxia or harmful algal blooms and associated negative effects on fisheries, recreation and human health.
Finally, since almost the entirety of Alabama’s coastal shoreline that is classified as moderately, highly or very highly vulnerable to erosion (Figure 3-1) also is highly suitable for oyster restoration—based on the key habitat variables of salinity, depth and spat settlement—(Figure 3-2), such a project would allow for the installation of long-lasting and largely self-maintaining breakwaters along nearly all of the most erosion-prone sections of the state’s coastline. While these breakwater reefs do not protect against impacts from hurricane-force events, they do substantially reduce the height and kinetic energy of incident waves, reducing both coastal erosion and flood impacts. We do not attempt to estimate the avoided damages from this control of coastal erosion and flooding, but merely note that they could easily surpass those associated with the enhancement of fisheries by reefs.
Figure 3-1: Vulnerability of Mobile Bay shoreline to erosion The attenuating effect oyster reefs have on coastal erosion and flooding would appear to make reef conservation and restoration an obvious integral part of any comprehensive climate adaptation strategy. Thus, oyster reef restoration and conservation form part of a list of “green infrastructure” solutions to climate adaptation, together with activities such as coastal wetland conservation and restoration and beach nourishment that have been identified in the literature (Entergy Corp, 2010). In fact, because oyster reefs not only reduce coastal flooding directly through wave height and energy attenuation but indirectly by protecting coastal wetlands and beaches, they provide a double benefit for flood attenuation. Thus, oyster reef restoration perhaps should be considered the green infrastructure solution to climate adaptation in coastal
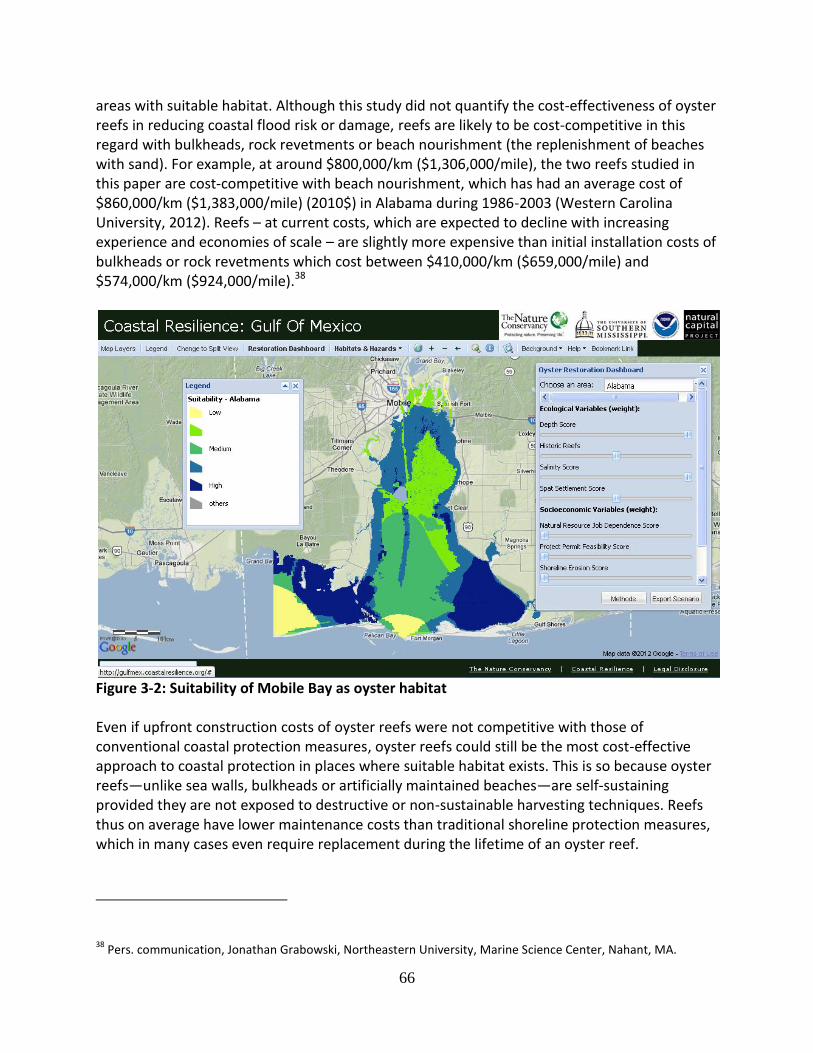
66
areas with suitable habitat. Although this study did not quantify the cost-effectiveness of oyster reefs in reducing coastal flood risk or damage, reefs are likely to be cost-competitive in this regard with bulkheads, rock revetments or beach nourishment (the replenishment of beaches with sand). For example, at around $800,000/km ($1,306,000/mile), the two reefs studied in this paper are cost-competitive with beach nourishment, which has had an average cost of $860,000/km ($1,383,000/mile) (2010$) in Alabama during 1986-2003 (Western Carolina University, 2012). Reefs – at current costs, which are expected to decline with increasing experience and economies of scale – are slightly more expensive than initial installation costs of bulkheads or rock revetments which cost between $410,000/km ($659,000/mile) and $574,000/km ($924,000/mile).38
Figure 3-2: Suitability of Mobile Bay as oyster habitat Even if upfront construction costs of oyster reefs were not competitive with those of conventional coastal protection measures, oyster reefs could still be the most cost-effective approach to coastal protection in places where suitable habitat exists. This is so because oyster reefs—unlike sea walls, bulkheads or artificially maintained beaches—are self-sustaining provided they are not exposed to destructive or non-sustainable harvesting techniques. Reefs thus on average have lower maintenance costs than traditional shoreline protection measures, which in many cases even require replacement during the lifetime of an oyster reef.
38 Pers. communication, Jonathan Grabowski, Northeastern University, Marine Science Center, Nahant, MA.
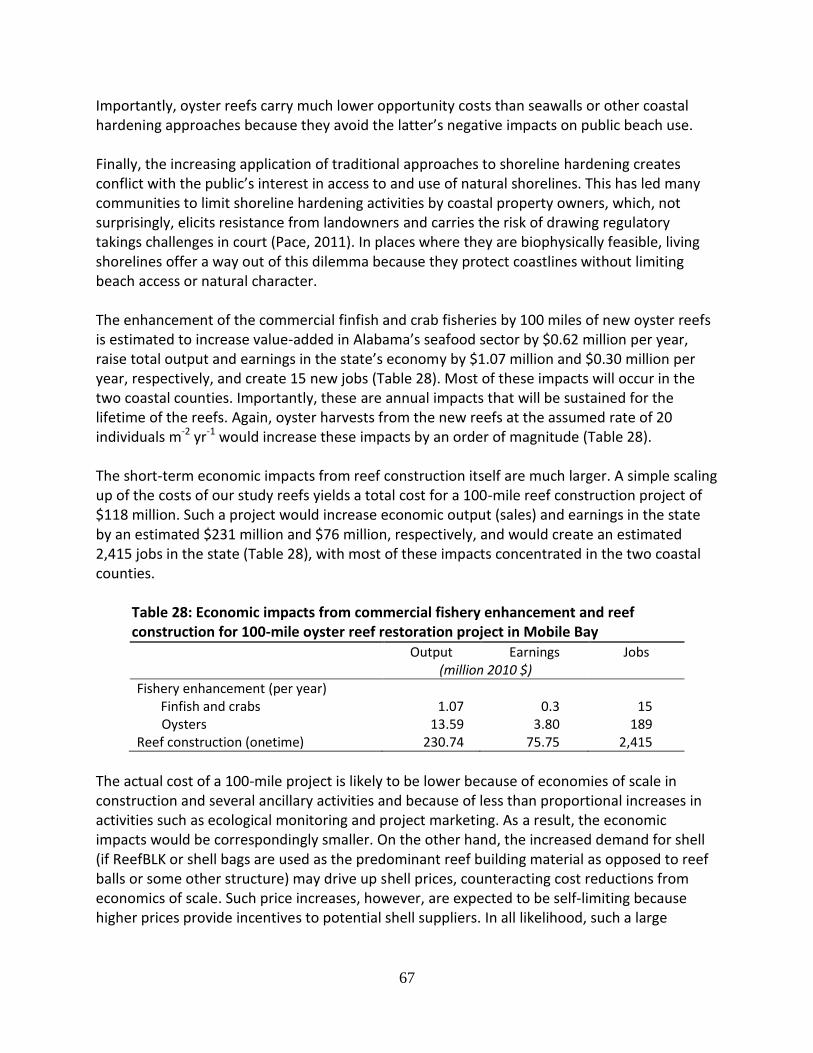
67
Importantly, oyster reefs carry much lower opportunity costs than seawalls or other coastal hardening approaches because they avoid the latter’s negative impacts on public beach use. Finally, the increasing application of traditional approaches to shoreline hardening creates conflict with the public’s interest in access to and use of natural shorelines. This has led many communities to limit shoreline hardening activities by coastal property owners, which, not surprisingly, elicits resistance from landowners and carries the risk of drawing regulatory takings challenges in court (Pace, 2011). In places where they are biophysically feasible, living shorelines offer a way out of this dilemma because they protect coastlines without limiting beach access or natural character. The enhancement of the commercial finfish and crab fisheries by 100 miles of new oyster reefs is estimated to increase value-added in Alabama’s seafood sector by $0.62 million per year, raise total output and earnings in the state’s economy by $1.07 million and $0.30 million per year, respectively, and create 15 new jobs (Table 28). Most of these impacts will occur in the two coastal counties. Importantly, these are annual impacts that will be sustained for the lifetime of the reefs. Again, oyster harvests from the new reefs at the assumed rate of 20 individuals m-2 yr-1 would increase these impacts by an order of magnitude (Table 28). The short-term economic impacts from reef construction itself are much larger. A simple scaling up of the costs of our study reefs yields a total cost for a 100-mile reef construction project of $118 million. Such a project would increase economic output (sales) and earnings in the state by an estimated $231 million and $76 million, respectively, and would create an estimated 2,415 jobs in the state (Table 28), with most of these impacts concentrated in the two coastal counties.
Table 28: Economic impacts from commercial fishery enhancement and reef construction for 100-mile oyster reef restoration project in Mobile Bay Output Earnings Jobs (million 2010 $)
Fishery enhancement (per year) Finfish and crabs 1.07 0.3 15 Oysters 13.59 3.80 189
Reef construction (onetime) 230.74 75.75 2,415
The actual cost of a 100-mile project is likely to be lower because of economies of scale in construction and several ancillary activities and because of less than proportional increases in activities such as ecological monitoring and project marketing. As a result, the economic impacts would be correspondingly smaller. On the other hand, the increased demand for shell (if ReefBLK or shell bags are used as the predominant reef building material as opposed to reef balls or some other structure) may drive up shell prices, counteracting cost reductions from economics of scale. Such price increases, however, are expected to be self-limiting because higher prices provide incentives to potential shell suppliers. In all likelihood, such a large
68
construction project would be spread out over a number of years and thus would create a multi-year boost for the local economy rather than a short, one-year spike.
3.5. Obstacles and opportunities for increasing the share of benefits and impacts captured by the Southeast Asian-American community
Like neighboring states, coastal Alabama is home to a large Southeast Asian-American community composed primarily of people of Vietnamese, Laotian and Cambodian origin. Consisting predominantly of first-generation immigrants and their families who began settling along the Gulf coast in the 1970s, in our study area this population is heavily concentrated in the city of Bayou La Batre and the surrounding area where in 2010 it accounted for approximately 22 percent of the total population. This community is heavily dependent on the seafood sector, with most families having one or several members working in seafood harvesting and processing. The information collected during our focus group meetings and key informant interviews with members of the Vietnamese, Laotian and Cambodian-American communities in Bayou La Batre indicate that seafood-related income on average accounts for around 80-90% of total household income in these communities. This heavy dependence on a single income source makes the community vulnerable to natural and manmade disasters that negatively affect marine ecosystems, such as hurricanes or oil spills. This point has been made abundantly clear in recent years, as first hurricane Katrina in 2005 and then the Deepwater Horizon oil spill in 2010 have caused severe economic hardship to many Southeast Asian families. As a result, it is likely that Southeast Asian-American households are even less well-off compared to the average household in the area than they were in 2000, when their median household income was less than 75 percent that of all households in Mobile county. This dependence on coastal resources also may explain the strong support for oyster reef restoration exhibited by participants in our community meetings. Individuals expressed the belief that they would benefit from reef restoration and broader restoration of coastal ecosystems, both because of the jobs they expect the projects to generate and the positive effect restoration has on the populations of harvested species. Because of their heavy participation in seafood harvesting—as both owners and employees—and in seafood processing—primarily as employees—the Southeast Asian community in the study area will directly benefit from the fishery enhancement effect of restored oyster reefs. To the extent that they are employed in other sectors that see their output increase as a result of increased seafood production, members of this community will further benefit from oyster restoration projects. However, the community currently is not in a position to fully capitalize on the additional economic opportunities coastal restoration projects offer during the construction phase. While individuals do benefit indirectly from coastal construction projects through the boost such projects deliver to employment in the wider local economy and through limited short-term employment as manual labor in the projects themselves, these benefits are fairly diffuse and
69
incremental compared to the concentrated and large benefits that accrue to professionals or owners of companies directly involved in reef construction. Increasing the benefits to this community from coastal restoration projects requires action on several fronts. First, community awareness of employment opportunities can be increased through improved outreach that actively engages churches and temples in addition to private support organizations and public agencies. In addition, access of the community to employment in coastal construction projects in the short term can be improved by emphatically promoting equal hiring practices on the part of contractors or explicitly incorporating hiring quotas, and in the medium term through programs aimed at breaking down language barriers. Furthermore, workforce training can increase the capacity of the community to engage in restoration projects. There are several additional measures that require more time to implement but that are equally crucial to making sure the Southeast Asian community benefits more from coastal restoration projects. These include the improvement of the community’s access to state and federal agencies involved in coastal management and restoration and the provision of active support for the creation of private or community-owned enterprises that can work as lead or subcontractors for the construction work. That the latter currently is not even conceived of by community members as a possibility may have a variety of reasons. More in-depth discussion with community members is needed to ascertain what the real or perceived key obstacles are to starting up construction businesses. If it turns out that they are technical in nature, such as for example licensing requirements, permits or barriers to credit access, they may be overcome through the provision of targeted support.
3.6. Large-scale coastal restoration diversifies economic livelihoods and increases local communities’ resilience to human-made and natural disasters
In addition to generating immediate, tangible benefits to individuals’ well-being, boosting the local economy, and reducing the vulnerability of coastal property and infrastructure to climate impacts, restoration of coastal ecosystems in general and of oyster reefs in particular along the northern Gulf of Mexico also would contribute to the diversification of local livelihoods by creating or increasing the number of new, “green” jobs. This would reduce the very high dependence of many coastal communities on income from seafood harvesting and processing. Furthermore, if restoration projects are designed to better achieve broader participation specifically of the economically most disadvantaged local communities in the construction phase and are accompanied by programs that increase community capacity for such participation, they would decrease the vulnerability and increase the resiliency specifically of those communities most in need of such change. Even though our analysis stops short of the monetary valuation of what is likely to be the highest or second-highest value benefit of oyster reefs along the northern Gulf of Mexico—
70
reduction in damages from coastal erosion—our findings indicate that reef restoration makes sense on cost-benefit grounds: The net economic benefits from just the fishery enhancement provided by sustainably harvested oyster reefs exceed the cost of the reefs. Specifically, assuming that no fish or crab harvest enhancement will occur during the first year after construction, that oysters will not be harvested during the first two years after reef construction and after that will be harvested at a rate of 20 oysters m-2 yr-1 and using discount rates appropriate for long-lived environmental projects (Weitzman, 2001), over a 50 period our reefs have a social return on investment (ROI) of 2.3 and an NPV of $5.6M, respectively.39 The actual ROI and NPV of oyster reefs along developed sections of shoreline likely are substantially higher due to the additional benefits provided beyond fishery enhancement. Importantly, ROI and NPV of oyster reefs are likely to increase substantially as increasing experience with reef restoration and economies of scale continue to reduce unit-costs. For each of the functions performed by oyster reefs and other “living shorelines”―from erosion and flood control to fishery enhancement to water quality improvements―there may exist alternative approaches that may match or exceed the performance or cost-effectiveness of reefs. However, very few if any of those alternatives possess the multifunctional character of oyster reefs. Thus, choosing an approach for achieving a particular objective such as coastal protection, fishery enhancement or water quality improvements based on cost-effectiveness grounds may lead to outcomes that do not generate the greatest benefits for society. We acknowledge that not every coastal project can implement a full cost-benefit analysis of available alternative solutions. However, we strongly recommend that the selection process at least include a qualitative assessment of the suite of functions performed by each alternative and of the categories of economic benefits associated with those functions. We hope that this would lead to more informed decisions and the making explicit of tradeoffs and choices.
39 While the lifetime of any particular oyster reef depends on fishing practices, sedimentation, changes in water
salinity and incidence of catastrophic storm events, the high vertical relief, partly concrete-based structure of our reefs has a functional lifetime expected to substantially exceed the 20-30 years assumed for the historically common loose shell deposition projects (Peterson et al., 2003).
71
References Alabama Department of Conservation and Natural Resources. 2010. Alabama Regulations 2010-
2011: Game, Fish and Fur Bearing Animals. 124 pp. Alabama Department of Environmental Management and Tetra Tech, Inc. 2005. Final Organic
Enrichment/Dissolved Oxygen TMDL: Rabbit Creek AL/03160205_020-01; Dog River AL/03160205_020-02. Alabama Department of Environmental Management, Water Quality Branch, Water Division. March 2005. 68 pp.
Alabama Marine Resources Division. 2008. 2008 Red Drum Assessment. http://www.gulfcouncil.org/beta/gmfmcweb/downloads/BB%20APRIL%202010/L%20-%203%28d%29%20Red%20Drum%20Escapement%20-%20Alabama.pdf Last accessed Sep. 25, 2011.
Allen, B.P. and J.B. Loomis. 2008. The decision to use benefit transfer or conduct original valuation research for benefit-cost and policy analysis. Contemporary Economic Policy 26(1):1-12.
Anderson, E. 1989. Economic Benefits of Habitat Restoration: Seagrass and the Virginia Hard- Shell Blue Crab Fishery. North American Journal of Fisheries Management 9:140–149.
Arrow, K.J., M.L. Cropper, G.C. Eads, R.W. Hahn, L.B. Lave, R.G. Noll, P.R. Portney, M. Russell, R. Schmalensee, K.V. Smith and R.N. Stavins. 1996. Is there a role for benefit-cost analysis in environmental, health, and safety regulation? Science 272:221-222.
Arrow, K., R. Solow, P.R. Portney, E.E. Leamer, R. Radner and H. Schuman. 1993. Report of the NOAA Panel on Contingent Valuation. Federal Register 58(10):4602-14.
Atlantic States Marine Fisheries Commission. 2007. The importance of habitat created by shellfish and shell beds along the Atlantic coast of the U.S. Prepared by Coen, L.D. and R. Grizzle with contributions by Lowery, J. and K.T. Paynter Jr. Washington, DC: Atlantic States Marine Fisheries Commission. Pp. 1–116.
Bay Bank. 2012 . Water Quality Protection. http://www.thebaybank.org/education/ water_quality_protection#cf_how_generate Last accessed Jan. 12, 2012.
Beck, M.W., R.D. Brumbaugh, L. Airoldi, A. Carranza, L.D. Coen, C. Crawford, O. Defeo, G.J. Edgar, B. Hancock., M.C. Kay, H.S. Lenihan, M.W. Luckenbach, C.L. Toropova, G. Zhang and X. Guo. 2011. Oyster reefs at risk and recommendations for conservation, restoration and management. BioScience 61(2):107-116.
Bergstrom, J.C., J.H. Dorfman and J. Loomis. 2004. Estuary management and recreational fishing benefits. Coastal Management 32:417-432.
Bergstrom, J.C. and P. De Civita. 1999. Status of benefits transfer in the United States and Canada: A review. Canadian Journal of Agricultural Economics 47(1):79-87.
Berrigan, M.E. 1990. Biological and economical assessment of an oyster resource development project in Apalachicola Bay, Florida. Journal of Shellfish Research 9(1):149-158.
Bin, O., J. Brown Kruse and C.E. Landry. 2008. Flood hazards, insurance rates, and amenities: Evidence from the coastal housing market. The Journal of Risk and Insurance 75(1):63-82.
Bin, O. and S. Polasky. 2004. Effects of flood hazards on property values: Evidence before and after Hurricane Floyd. Land Economics 80(4):490-500.
Boyd, J. and S. Banzhaf. 2007. What are ecosystem services? The need for standardized environmental accounting units. Ecological Economics 63:616-626.
72
Bricker, S., B. Longstaff, W. Dennison, A. Jones, K. Boicourt, C. Wicks and J. Woerner. 2007. Effects of Nutrient Enrichment In the Nation’s Estuaries: A Decade of Change. NOAA Coastal Ocean Program Decision Analysis Series No. 26. National Centers for Coastal Ocean Science, Silver Spring, MD. 328 pp.
Brown, T.C., J.C. Bergstrom and J.B. Loomis. 2007. Defining, valuing and providing ecosystem goods and services. Natural Resources Journal 47(2):329-376.
Burrage, D. 2009. Addressing ethnic change in the northern Gulf of Mexico seafood industry. Journal of Extension 47(5):Article Number 5IAW4.
Cantrell, R.N., M. Garcia, P. Leung and D. Ziemann. 2004. Recreational anglers’ willingness to pay for increased catch rates of Pacific threadfin (Polydactylus sexfilis) in Hawaii. Fisheries Research 68(1-3):149-158.
Caribbean Catastrophe Risk Insurance Facility (CCRIF). 2010. Enhancing The Climate Risk and Adaptation Fact Base: Preliminary Results of the ECA Study. CCRIF’s Economics of Climate Adaptation (ECA) Initiative. Grand Cayman, Caymand Islands: CCRIF. August 2010. 28 pp.
Carson, R.T., N.E. Flores and N.F. Meade. 2001. Contingent valuation: Controversies and evidence. Environmental and Resource Economics 19(2):173-210.
Carson, R.T., N.E. Flores, K.M. Martin and J.L. Wright. 1996. Contingent valuation and revealed preference methodologies: Comparing the estimates for quasi-public goods. Land Economics 72:80-99.
Carson, R.T. and R.C. Mitchell. 1993. The value of clean water: The public’s willingness to pay for boatable, fishable, swimmable, quality water. Water Resources Research 29(7):2445-54.
Cherry, S., E.M. Britney, L.S. Siegel, M.J. Muscari and R.L. Strauch. 2007. Wetlands and water quality trading: Review of current science and economic practices with selected case studies. Environmental Protection Agency, EPA/600/R-06/155.
Clark, R.D., S. Pittman, C. Caldow, J. Christensen, B. Roque, R.S. Appeldoorn and M.E. Monaco. 2009. Nocturnal fish movement and trophic flow across habitat boundaries in a coral reef ecosystem (SW Puerto Rico). Caribbean Journal of Science 45(2-3):282-303.
Coen, L.D., R.D. Brumbaugh, D. Bushek, R. Grizzle, M.W. Luckenbach, M.H. Posey, S.P. Powers and S.G. Tolley. 2007. Ecosystem services related to oyster restoration. Marine Ecology Progress Series 341: 303-307.
Committee on Environment and Natural Resources. 2010. Scientific Assessment of Hypoxia in U.S. Coastal Waters. Interagency Working Group on Harmful Algal Blooms, Hypoxia, and Human Health of the Joint Subcommittee on Ocean Science and Technology. Washington, DC. 154 pp.
Crosson, S. 2010. A social and economic analysis of commercial fisheries in North Carolina: Beaufort Inlet to the South Carolina State line. Morehead City, NC: North Carolina Division of Marine Fisheries. 25 pp.
Czajkowski, J. and O. Bin. 2011. Simple is Better? Understanding the impact of technical and non-technical measures of water quality on hedonic property values in South Florida. Working paper http://www.ecu.edu/cs-educ/econ/upload/ecu1007_201106.pdf
Dauphin Island Sea Lab and University of South Alabama. 2011a. Alabama Economic Recovery and Ecological Restoration Project. Post-Restoration Monitoring Report (November 2010-June 2011). Prepared for The Nature Conservancy. 40 pp.
73
Dauphin Island Sea Lab and University of South Alabama. 2011b. Alabama Economic Recovery and Ecological Restoration Project. Post-Restoration Monitoring Report (August-October 2010), Addendum: Oyster densities. Prepared for The Nature Conservancy.
Dauphin Island Sea Lab and University of South Alabama. 2010. Alabama Economic Recovery and Ecological Restoration Project. Post-Restoration Monitoring Report (May-July 2010). Prepared for The Nature Conservancy. 39 pp.
Diamond, P.A. and J.A. Hausman. 1994. Contingent valuation: Is some number better than no number? The Journal of Economic Perspectives 8 (4): 45-64.
Dute, J. 2011. Reel Report: Fishing remains fruitful despite adverse factors. June 30. Al.com http://www.al.com/sports/index.ssf/2011/06/reel_report_fishing_remains_fr.html Accessed Sep. 30, 2011.
Economics of Climate Adaptation Working Group. 2010. Shaping Climate-Resilient Development: A Framework for Decision-making. A report of the Economics of Climate Adaptation Working Group (World Bank Global Environment Facility, McKinsey & Company, Swiss Re, Rockefeller Foundation, ClimateWorks Foundation, European Commission, and Standard Chartered Bank). 159 pp.
Entergy Corp. 2010. Building a Resilient Energy Gulf Coast: Executive Report. http://entergy.com/gulfcoastadaptation
Environmental Protection Agency (EPA). 2012. Nitrogen and Phosphorus Pollution Data Access Tool. http://gispub2.epa.gov/npdat/ Queried on January 11, 2012.
Environmental Protection Agency. 2011. State and Individual Trading Programs. http://water.epa.gov/type/watersheds/trading/tradingmap.cfm Last accessed Jan. 12, 2012.
Environmental Protection Agency (EPA). 2004. Economic and Benefits Analysis for the Final Section 316(b) Phase II Existing Facilities Rule (EPA-821-R-04-005). Washington, DC: U.S. EPA, Office of Water. February 2004.
Escobedo, F., T. Kroeger and J. Wagner. 2011. Urban forests and pollution mitigation: Analyzing ecosystem services and disservices. Environmental Pollution 159:2078-2087.
Fairbank, Maslin, Maullin and Associates. 2009. Key Findings from Gulf Coast Shellfish Issues Survey. August 12, 2009.
Freeman, A. M. III. 2003. The Measurement of Environmental and Resource Values. Theory and Methods. Second Ed. Washington, DC: Resource for the Future Press. 420 pp.
Freeman, A.M. III. 1995. The benefits of water quality improvements for marine recreation: A review of the empirical evidence. Marine Resource Economics 10(4):385-406.
Gentner, B. 2009. Allocation Analysis of the Gulf of Mexico Gag and Red Grouper Fisheries. Prepared for the Coastal Conservation Association. 27 pp.
Geraldi, N.R., S.P. Powers, K.L. Heck and J. Cebrian. 2009. Can habitat restoration be redundant? Response of mobile fishes and crustaceans to oyster reef restoration in marsh tidal creeks. Marine Ecology Progress Series 389:171-180.
Grabowski, J.H. and C.H. Petersen. 2007. Restoring oyster reefs to recover ecosystem services. In: Cuddington, K., J.E. Byers, W.G. Wilson and A. Hastings (eds). Ecosystem Engineers: Concepts, Theory and Applications. Elsevier-Academic Press, Amsterdam. Pp. 281-298.
Grabowski, J.H., A.R. Hughes, D.L. Kimbro and M.A. Dolan. 2005. How habitat setting influences restored oyster reef communities. Ecology 86:1926–1935.
74
Gregalis, K.C., M.W. Johnson and S.P. Powers. 2009. Restored oyster reef location and design affect responses of resident and transient fish, crab, and shellfish species in Mobile Bay, Alabama. Transactions of the American Fisheries Society 138(2):314-327.
Gregalis, K.C., S. Powers and K. Heck. 2008. Restoration of oyster reefs along a bio-physical gradient in Mobile Bay, Alabama. Journal of Shellfish Research 27(5):1163-1169.
Guannel, G. 2012. Marine InVEST Coastal Protection Model runs for Barton Island and Swift tract reefs. Personal communication, Jan. 23, 2012.
Guannel, G. 2011. Incorporation of Oyster Reefs in Marine InVEST. 19 pp. July 25, 2011. Haab, T., R. Hicks, K. Schnier and J. Whitehead. 2009 (revised). Angler Heterogeneity and the
Species-Specific Demand for Recreational Fishing in the Southeast United States. Final Report Marine Fisheries Initiative (MARFIN) Grant #NA06NMF4330055. December 29, 2008.
Haab, T.C., J.C. Whitehead, G.R. Parsons, J. Kirkley and D. Lipton. 2002. The Economic Effects of Pfiesteria in the Mid-Atlantic Region. Report. 263 pp.
Hanson, T. and J. Baker. 2010. Alabama’s Coastal Economic Inventory. Quarterly Report: October 22, 2010. http://www.aces.edu/dept/fisheries/aquaculture/marine-assessment/reports.php Last accessed Dec. 12, 2011. 10 pp.
Harding, J.M., M.J. Southworth and R. Mann. 2010. Observations of Blue Crabs (Callinectes sapidus, Rathbun 1896) on Shell Bar Oyster Reef, Great Wicomico River, Virginia. Journal of Shellfish Research 29(4):995-1004.
HARRNESS. 2005. Harmful Algal Research and Response: A National Environmental Science Strategy 2005–2015. Ramsdell, J.S., D.M. Anderson and P.M. Gilbert (Eds.). Washington DC: Ecological Society of America. 96 pp.
Heberling, M.T., H.W. Thurston and M. Mikota. 2007. Incorporating wetlands in water quality trading: Economic considerations. National Wetlands Newsletter 29 (1):6-10.
Heck, K.L., C.G. Hays and R.J. Orth. 2003. Critical evaluation of the nursery role hypothesis for seagrass meadows. Marine Ecology Progress Series 253:123–136.
Heck, K.L. Jr. and P.M. Spitzer. 2003. Oyster Reefs. In The Mobile Bay Oyster Gardening Program: Bringing the Reef to the People. Pp. 22-28. Mississippi-Alabama Sea Grant Consortium (2011). 39 pp. http://masgc.org/oyster/documents/2011OGmanual.pdf Accessed Dec. 12, 2011.
Henderson, J. and J. O’Neil. 2003. Economic Values Associated with Construction of Oyster Reefs by the Corps of Engineers. EMRRP Technical Notes Collection (ERDC TN-EMRRP-ER-01), U.S. Army Engineer Research and Development Center, Vicksburg, MS. 10 pp.
Hicks, R., T. Haab and D. Lipton. 2004. The Economic Benefits of Oyster Reef Restoration in the Chesapeake Bay. Final Report: Chesapeake Bay Foundation. April 20, 2004.
Johns, G.M., V.R. Leeworthy, F.W. Bell. and M.A. Bonn. 2001. Socioeconomic study of reefs in southeast Florida. Final report, October 2001, revised April, 2003. Hazen and Sawyer, P.C. 344 pp. http://marineeconomics.noaa.gov/Reefs/PDF's/Document.pdf
Johnston, R.J., M.H. Ranson, E.Y. Besedin and E.C. Helm. 2006. What determines willingness to pay per fish? A meta-analysis of recreational fishing values. Marine Resource Economics 21:1–32.
Jordan, S. J., L. M. Smith and J. A. Nestlerode. 2008. Cumulative effects of coastal habitat alterations on fishery resources: toward prediction at regional scales. Ecology and Society 14(1): 16.
75
Kellogg, M.L., J.C. Cornwell, K.T. Paynter and M.S. Owens. 2011. Nitrogen removal and sequestration capacity of a restored oyster reef. Final report to the Oyster Recovery Partnership. UMCES Technical Report Series No. TS-623-11. University of Maryland Center for Environmental Science. 65pp.
Kirkley, J. 2009. The NMFS Commercial Fishing & Seafood Industry Input/Output Model (CFSI I/O Model). Prepared for the National Marine Fisheries Service (NMFS). Virginia Institute of Marine Science. August 2009. 30 pp. https://www.st.nmfs.noaa.gov/documents/Commercial%20Fishing%20IO%20Model.pdf
Kroeger, T. and F. Casey. 2007. An assessment of market-based approaches to providing ecosystem services on agricultural lands. Ecological Economics 64(2):321-332.
Kroeger, T. and F. Casey. 2006. Economic impacts of designating critical habitat under the U.S. Endangered Species Act: Case study of the Canada lynx (Lynx Canadensis). Human Dimensions of Wildlife 11(6):437-453.
Leggett, C. and N.E. Bockstael. 2000. Evidence of the effects of water quality on residential land prices. Journal of Environmental Economics and Management 39(2):121–144.
Lellis-Dibble, K. A., K. E. McGlynn and T. E. Bigford. 2008. Estuarine Fish and Shellfish Species in U.S. Commercial and Recreational Fisheries: Economic Value as an Incentive to Protect and Restore Estuarine Habitat. U.S. Dep. Commerce, NOAA Tech. Memo. NMFSF/SPO-90, 94 pp.
Lipton, D. 2004. The value of improved water quality to Chesapeake Bay boaters. Marine Resource Economics 19(2):265-270.
Lipton, D. 1990. Understanding Fish Pricing: From Production to the Table. Maryland Sea Grant Extension Fish Aquaculture Factsheet #5. Publication Number UM-SG-MAP-90-01. http://www.mdsg.umd.edu/programs/extension/aquaculture/finfish/factsheets/FF5/#6 Accessed Dec. 22, 2011.
Lovell, S.J. and L.A. Drake. 2009. Tiny stowaways: Analyzing the economic benefits of a U.S. Environmental Protection Agency permit regulating ballast water discharges. Environmental Management 43:546–555.
Lovell, S., E. Besedin and E. Grosholz. 2007. Modeling economic impacts of the European green crab. Presented at the American Agricultural Economics Association Annual Meeting, Portland, OR.
McConnell, K.E., I.E. Strand, S.K. Valdes and Q.R. Weninger. 1994. The economic value of mid and south Atlantic sportfishing. Report between the University of Maryland, the US Environmental Protection Agency, the National Marine Fisheries Service, and the National Oceanic and Atmospheric Administration. Cooperative agreement no. CR-811043-01-0. College Park, MD: University of Maryland.
McKee, J. 2010. Analysis and Design Plan: Coastal Alabama Economic Recovery and Ecological Restoration Project. Dauphin Island Sea Lab. 28 pp.
Meyer, D.L., E.C. Townsend and G.W. Thayer. 1997. Stabilization and erosion control value of oyster cultch for intertidal marsh. Restoration Ecology 5:93–99.
Milon, J.W., A.W. Hodges, A. Rial, C.F. Kiker and F. Casey. 1999. Public Preferences and Economic Values for Restoration of the Everglades/South Florida Ecosystem. Economics Report 99-1, August 1999. Gainesville: Food & Resource Economics Dept., University of Florida.
76
Milon, J.W. 1988. Travel cost methods for estimating the recreational use benefits of artificial marine habitat. Southern Journal of Agricultural Economics 20(1):87-101.
Minello, T.J., K.W. Able, M.P. Weinstein and C.G. Hays. 2003. Salt marshes as nurseries for nekton: testing hypotheses on density, growth and survival through meta-analysis. Marine Ecology Progress Series 246:39–59.
Mississippi Coalition of Vietnamese-American Fisherfolk and Families. 2010. Mississippi Coalition Preliminary Report. Impact of BP Oil Spill on Vietnamese American communities and seafood industry. 20 pp.
Mobile Bay National Estuary Program and Science Advisory Committee. 2008. State of Mobile Bay: A Status Report on Alabama’s Coastline from the Delta to Our Coastal Waters. November 2008. 46 pp.
Mobile Bay National Estuary Program (NEP), Alabama Department of Environmental Management (ADEM), Gulf of Mexico Program US Environmental Protection Agency (US EPA). 2008. Mobile Bay Sub-Estuary Monitoring Program Report: Bon Secour River / Intracoastal Waterway / Oyster Bay Sub-Estuary. April 2008. 28 pp. http://www.mobilebaynep.com/images/uploads/library/BonSecourFINAL_2008.pdf
Morgan, O.A., G.S. Martin and W.L. Huth. 2009. Oyster demand adjustments to counter-information and source treatments in response to Vibrio vulnificus. Journal of Agricultural and Applied Economics 41(3):683–696.
National Marine Fisheries Service (NMFS). 2011. Fisheries of the United States 2010. Current Fishery Statistics No. 2010. Silver Spring, MD:NOAA NMFS Fisheries Statistics Division. 103 pp.
National Marine Fisheries Service (NMFS). 2010. Fisheries Economics of the United States, 2009. U.S. Dept. Commerce, NOAA. Tech. Memo. NMFS-F/SPO-118, 172p. Available at: https://www.st.nmfs.noaa.gov/st5/publication/index.html.
National Research Council. 2010. Ecosystem Concepts for Sustainable Bivalve Mariculture. Washington, DC: National Academy Press.
National Research Council. 2007. Mitigating Shore Erosion Along Sheltered Coasts. National Research Council. Washington, DC: National Academies Press.
National Research Council. 2004. Non-native Oysters in the Chesapeake Bay. National Academy Press.
Newell, R.I.E., T.R. Fisher, R.R. Holyoke and J.C. Cornwell. 2005. Influence of eastern oysters on Nitrogen and Phosphorus Regeneration in Chesapeake Bay, USA. Pp. 93-120. In Dame, R., and S. Olenin, eds. The Comparative Roles of Suspension Feeders in Ecosystems. Vol. 47, NATO Science Series IV: Earth and Environmental Sciences. Springer, Netherlands.
Newell, R.I.E. 2004. Ecosystem influences of natural and cultivated populations of suspension-feeding bivalve molluscs: A review. Journal of Shellfish Research 23(1):51-61.
North, E.W., D.M. King, J. Xu, R.R. Hood, R.I E. Newell, K. Paynter, M.L. Kellogg, M.K. Liddel and D.F. Boesch. 2010. Linking optimization and ecological models in a decision support tool for oyster restoration and management. Ecological Applications 20:851–866.
North Carolina Sea Grant. 1997. Use of restored oyster reef habitat by economically valuable fishes and crabs in North Carolina: an experimental approach with economic analyses. Project 96FEC-104, Morehead City, NC.
77
Oxfam America. 2010. One Gulf, Resilient Gulf: A Plan for Coastal Community Recovery. Washington, DC: Oxfam America. 14 pp.
Pace, N.L. 2011. Wetlands or seawalls? Adapting shoreline regulation to address sea level rise and wetland preservation in the Gulf of Mexico. Journal of Land Use 26(2):327-363.
Parsons, G. 1992. The effect of coastal land use restrictions on housing prices: a repeat sales analysis. Journal of Environmental Economics and Management 22(1):25–37.
Perry, H.M. and T.D. McIlwain. 1986. Species profiles: life histories and environmental requirements of coastal fishes and invertebrates (Gulf of Mexico): Blue crab. U.S. Fish and Wildlife Service. Biological Report 82 (11.55). U.S. Army Corps of Engineers, TR EL-82-4. 21pp.
Peterson, C. H., J. H. Grabowski and S. P. Powers. 2003. Estimated enhancement of fish production resulting from restoring oyster reef habitat: quantitative valuation. Marine Ecology Progress Series 264:251-256.
Piazza, B.P., P.D. Banks and M.K. La Peyre. 2005. The potential for created oyster shell reefs as a sustainable shoreline protection strategy in Louisiana. Restoration Ecology 13(3):499–506.
Piehler, M.F. and A.R. Smyth. 2011. Habitat-specific distinctions in estuarine denitrification affect both ecosystem function and services. Ecosphere 2(1): 1-16.
Poor, P.J., K.L. Pessagno and R.W. Paul. 2007. Exploring the hedonic value of ambient water quality: A local watershed-based study. Ecological Economics 60:797-806.
Ribaudo, M.O., R. Heimlich and M. Peters. 2005. Nitrogen sources and Gulf hypoxia: potential for environmental credit trading. Ecological Economics 52:159-168.
Richardson, L. and J.B. Loomis. 2009. The total economic value of threatened, endangered and rare species: An updated meta-analysis. Ecological Economics 68:1535-1548.
Roland R.M., and S.L. Douglass. 2005. Estimating wave tolerance of Spartina alterniflora in coastal Alabama. Journal of Coastal Research 21: 453–463.
SeaFood Business. 2009. Economy, seafood sales primed for upswing in 2010. By James Wright. 1. Dec. 2009. http://www.seafoodbusiness.com/articledetail.aspx?id=4294993649 Last accessed 9 Dec. 2011.
Schulte, D.M., R.P. Burke and R.N. Lipcius. 2009. Unprecedented restoration of a native oyster metapopulation. Science 325:1124-1128.
Schumacher, S.K. and M.A. Boland. 2003. Measuring industry and firm effects in food and agribusiness firms. International Food and Agribusiness Management Review 5 (4): http://ageconsearch.umn.edu/bitstream/34405/1/0504sc01.pdf (last accessed 10. Dec. 2011)
Scyphers, S.B. and S.P. Powers. 2011. USA Restoration Briefs Volume Six: Oyster Reefs and Coastal Societies. Spring 2011. University of South Alabama Oyster Reef and Fisheries Habitat Enhancement Program.
Scyphers, S.B., S.P. Powers, K.L. Heck Jr. and D. Byron. 2011. Oyster reefs as natural breakwaters mitigate shoreline loss and facilitate fisheries. PLoS ONE 6(8):e22396.
Shabman, L. and K. Stephenson. 2007. Achieving nutrient water quality goals: Bringing market like principles to water quality management. Journal of the American Water Resources Association 43(4):1076-1089.
78
Shepard, C.C., V.N. Agostini, B. Gilmer, T. Allen, J. Stone, W. Brooks and M.W. Beck. 2011. Assessing future risk: Quantifying the effects of sea level rise on storm surge risk for the southern shores of Long Island, New York. Natural Hazards 60(2):727-745.
Smith, V.K., G.L. Van Houtven and S.K. Pattanayak. 2002. Benefit transfer via preference calibration: “Prudential algebra” for policy. Land Economics 78(1):132-152.
Stephenson, K. and L. Shabman. 2011. Rhetoric and reality of water quality trading and the potential for market-like reform. Journal of American Water Resources Association 47(1):15-28.
Stephenson, K., S. Aultman, T. Metcalfe and A. Miller. 2010. An evaluation of nutrient nonpoint offset trading in Virginia: A role for agricultural nonpoint sources? Water Resources Research 46:W04519, 11 pp.
Stevens, M.M. 2004. Southern flounder (Paralichthys lethostigma): Gulf of Mexico and South Atlantic regions. Final report. Monterrey Bay Aquarium and Seafood Watch. 24 pp.
Stevens, T.H., T.A. More and R.J. Glass. 1993. Measuring the existence value of wildlife: Reply. Land Economics 69(3):309-12.
Stevens, T.H., J. Echeverria, R.J. Glass, T. Hager and T.A. More. 1991. Measuring the existence value of wildlife: What do CVM estimates really show? Land Economics 67 (4):390-400.
Stricklin, A.G., M.S. Peterson, J.D. Lopez, C.A. May, C.F. Mohrman and M.S. Woodrey. 2010. Do small, patchy, constructed intertidal oyster reefs reduce salt marsh erosion as well as natural reefs? Gulf and Caribbean Research 22:21-27.
Sumaila, U.R. and E. Suatoni. 2006. Economic Benefits of Rebuilding U.S. Ocean Fish Populations. Fisheries Economics Research Unit. Working paper #2006-04. Vancouver, Canada: University of British Columbia. 23 pp.
Swann, D.L. 2008. The use of living shorelines to mitigate the effects of storm events on Dauphin Island, Alabama, USA. American Fisheries Symposium 64:12 pp. Downloaded from http://livingshorelinesolutions.com/uploads/Dr._LaDon_Swann__Living_Shorelines_Paper.pdf on Jan. 20, 2012.
Tallis, H.T., T. Ricketts, A.D. Guerry, S.A. Wood, R. Sharp, E. Nelson, D. Ennaanay, S. Wolny, N. Olwero, K. Vigerstol, D. Pennington, G. Mendoza, J. Aukema, J. Foster, J. Forrest, D. Cameron, K. Arkema, E. Lonsdorf, C. Kennedy, G. Verutes, C.K. Kim, G. Guannel, M. Papenfus, J. Toft, M. Marsik and J. Bernhardt. 2011. InVEST 2.2.0 User’s Guide. The Natural Capital Project, Stanford.
Tatum, W.M. 1982. The blue crab fishery of Alabama. In: H.M. Perry and W.A. Van Engel, eds. Proc. Blue Crab Colloquium, Oct. 18-19, 1979, Biloxi, Mississippi. Gulf States Marine Fisheries Commission 7:23-28.
TCW Economics. 2008. Economic analysis of the non-treaty commercial and recreational fisheries in Washington State. December 2008. Sacramento, CA. With technical assistance from The Research Group, Corvallis, OR. 36 pp.
Texas Parks and Wildlife. 2009. Status of the southern flounder population in Texas. Texas Department of Parks and Wildlife, Coastal Fisheries Division. 35 pp. http://www.ccatexas.org/files/2009/03/tpwdflounderwgpresentationfinal.pdf (Last accessed Sep. 25, 2011)
79
Thieler, E.R. and E.S. Hammar-Klose. 2000. National Assessment of Coastal Vulnerability to Sea-Level Rise: Preliminary Results for the U.S. Gulf of Mexico Coast. U.S. Geological Survey Open-File Report 00-179. Woods Hole: USGS.
U.S. Department of Commerce. 2011. RIMS II multipliers produced by the Regional Product Division of the Bureau of Economic Analysis on 11/30/2011.
U.S. Department of Commerce, Bureau of Economic Analysis. 1997. Regional Multipliers: A User Handbook for the Regional Input-Output Modeling System (RIMS II). Washington, DC: U.S. Government Printing Office. 3rd Ed. 62 pp.
Van Houtven, G., J. Powers and S.K. Pattanayak. 2007. Valuing water quality improvements in the United States using meta-analysis: Is the glass half-full or half-empty for national policy analysis? Resource and Energy Economics 29(3):206-228.
Wallace, R.K., K. Heck and M. Van Hoose. 1999. Oyster Restoration in Alabama. In Luckenback, M.W., R. Mann and J.A. Wesson (eds.). Oyster Reef Habitat Restoration: A Synopsis and Synthesis of Approaches. Gloucester Point, VA: Virginia Institute of Marine Science Press. Pp. 101-106.
Watkins S.M., A. Reich, L.E. Fleming and R. Hammond. 2008. Neurotoxic shellfish poisoning. Marine Drugs 6(3):431-455.
Weitzman, M.L. 2001. Gamma discounting. American Economic Review 91(1):261-271. Western Carolina University. 2012. Beach Nourishment: The U.S. Beach Nourishment
Experience Including New England, East Coast Barrier Islands, Pacific Coast, and Gulf of Mexico Shorelines. Living database, http://www.wcu.edu/1038.asp Downloaded January 31, 2012.
World Resources Institute. 2007. NutrientNet: Reducing Watershed Nutrient Runoff. http://www.nutrientnet.org/about.cfm
zu Ermgassen, P., M. Spalding and R. Brumbaugh. 2011. Development of national scale oyster reef restoration goals. Final Report from The Nature Conservancy (Grant #1047) to the National Fish and Wildlife Foundation, Washington, DC. 12pp.
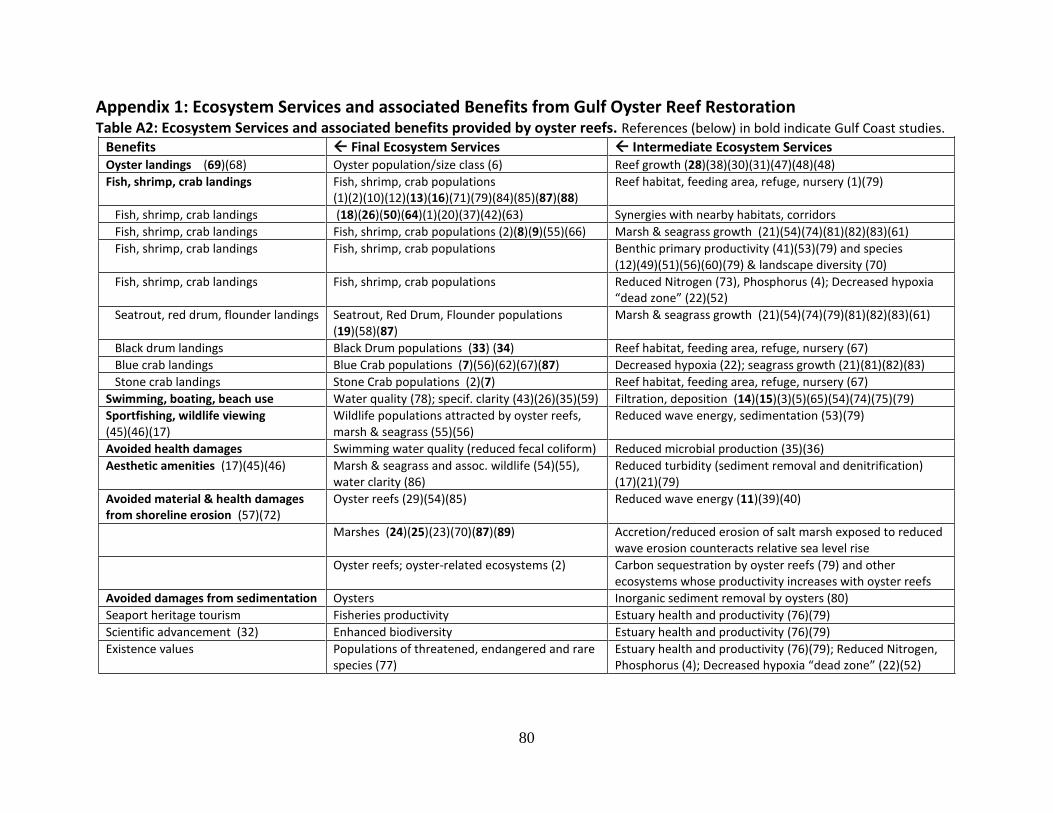
80
Appendix 1: Ecosystem Services and associated Benefits from Gulf Oyster Reef Restoration
Table A2: Ecosystem Services and associated benefits provided by oyster reefs. References (below) in bold indicate Gulf Coast studies.
Benefits Final Ecosystem Services Intermediate Ecosystem Services Oyster landings (69)(68) Oyster population/size class (6) Reef growth (28)(38)(30)(31)(47)(48)(48)
Fish, shrimp, crab landings Fish, shrimp, crab populations (1)(2)(10)(12)(13)(16)(71)(79)(84)(85)(87)(88)
Reef habitat, feeding area, refuge, nursery (1)(79)
Fish, shrimp, crab landings (18)(26)(50)(64)(1)(20)(37)(42)(63) Synergies with nearby habitats, corridors
Fish, shrimp, crab landings Fish, shrimp, crab populations (2)(8)(9)(55)(66) Marsh & seagrass growth (21)(54)(74)(81)(82)(83)(61)
Fish, shrimp, crab landings Fish, shrimp, crab populations Benthic primary productivity (41)(53)(79) and species (12)(49)(51)(56)(60)(79) & landscape diversity (70)
Fish, shrimp, crab landings Fish, shrimp, crab populations Reduced Nitrogen (73), Phosphorus (4); Decreased hypoxia “dead zone” (22)(52)
Seatrout, red drum, flounder landings Seatrout, Red Drum, Flounder populations (19)(58)(87)
Marsh & seagrass growth (21)(54)(74)(79)(81)(82)(83)(61)
Black drum landings Black Drum populations (33) (34) Reef habitat, feeding area, refuge, nursery (67)
Blue crab landings Blue Crab populations (7)(56)(62)(67)(87) Decreased hypoxia (22); seagrass growth (21)(81)(82)(83)
Stone crab landings Stone Crab populations (2)(7) Reef habitat, feeding area, refuge, nursery (67)
Swimming, boating, beach use Water quality (78); specif. clarity (43)(26)(35)(59) Filtration, deposition (14)(15)(3)(5)(65)(54)(74)(75)(79)
Sportfishing, wildlife viewing (45)(46)(17)
Wildlife populations attracted by oyster reefs, marsh & seagrass (55)(56)
Reduced wave energy, sedimentation (53)(79)
Avoided health damages Swimming water quality (reduced fecal coliform) Reduced microbial production (35)(36)
Aesthetic amenities (17)(45)(46) Marsh & seagrass and assoc. wildlife (54)(55), water clarity (86)
Reduced turbidity (sediment removal and denitrification) (17)(21)(79)
Avoided material & health damages from shoreline erosion (57)(72)
Oyster reefs (29)(54)(85) Reduced wave energy (11)(39)(40)
Marshes (24)(25)(23)(70)(87)(89) Accretion/reduced erosion of salt marsh exposed to reduced wave erosion counteracts relative sea level rise
Oyster reefs; oyster-related ecosystems (2) Carbon sequestration by oyster reefs (79) and other
ecosystems whose productivity increases with oyster reefs
Avoided damages from sedimentation Oysters Inorganic sediment removal by oysters (80)
Seaport heritage tourism Fisheries productivity Estuary health and productivity (76)(79)
Scientific advancement (32) Enhanced biodiversity Estuary health and productivity (76)(79)
Existence values Populations of threatened, endangered and rare species (77)
Estuary health and productivity (76)(79); Reduced Nitrogen, Phosphorus (4); Decreased hypoxia “dead zone” (22)(52)
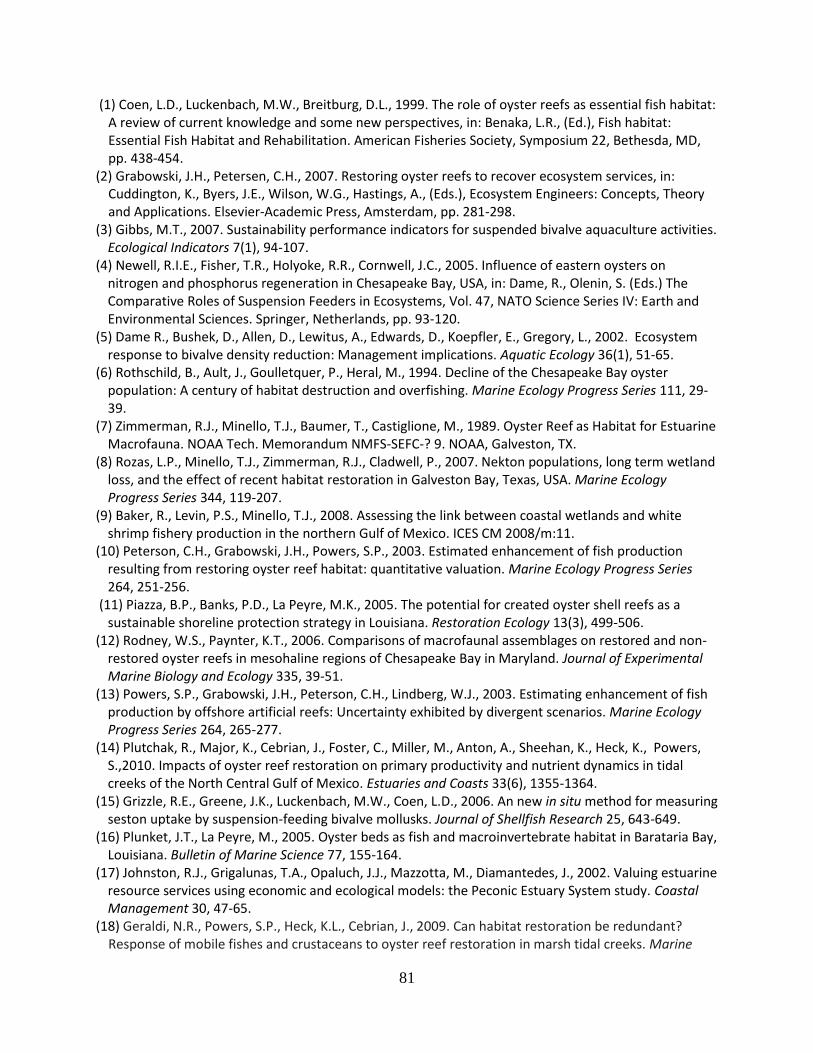
81
(1) Coen, L.D., Luckenbach, M.W., Breitburg, D.L., 1999. The role of oyster reefs as essential fish habitat: A review of current knowledge and some new perspectives, in: Benaka, L.R., (Ed.), Fish habitat: Essential Fish Habitat and Rehabilitation. American Fisheries Society, Symposium 22, Bethesda, MD, pp. 438-454.
(2) Grabowski, J.H., Petersen, C.H., 2007. Restoring oyster reefs to recover ecosystem services, in: Cuddington, K., Byers, J.E., Wilson, W.G., Hastings, A., (Eds.), Ecosystem Engineers: Concepts, Theory and Applications. Elsevier-Academic Press, Amsterdam, pp. 281-298.
(3) Gibbs, M.T., 2007. Sustainability performance indicators for suspended bivalve aquaculture activities. Ecological Indicators 7(1), 94-107.
(4) Newell, R.I.E., Fisher, T.R., Holyoke, R.R., Cornwell, J.C., 2005. Influence of eastern oysters on nitrogen and phosphorus regeneration in Chesapeake Bay, USA, in: Dame, R., Olenin, S. (Eds.) The Comparative Roles of Suspension Feeders in Ecosystems, Vol. 47, NATO Science Series IV: Earth and Environmental Sciences. Springer, Netherlands, pp. 93-120.
(5) Dame R., Bushek, D., Allen, D., Lewitus, A., Edwards, D., Koepfler, E., Gregory, L., 2002. Ecosystem response to bivalve density reduction: Management implications. Aquatic Ecology 36(1), 51-65.
(6) Rothschild, B., Ault, J., Goulletquer, P., Heral, M., 1994. Decline of the Chesapeake Bay oyster population: A century of habitat destruction and overfishing. Marine Ecology Progress Series 111, 29-39.
(7) Zimmerman, R.J., Minello, T.J., Baumer, T., Castiglione, M., 1989. Oyster Reef as Habitat for Estuarine Macrofauna. NOAA Tech. Memorandum NMFS-SEFC-? 9. NOAA, Galveston, TX.
(8) Rozas, L.P., Minello, T.J., Zimmerman, R.J., Cladwell, P., 2007. Nekton populations, long term wetland loss, and the effect of recent habitat restoration in Galveston Bay, Texas, USA. Marine Ecology Progress Series 344, 119-207.
(9) Baker, R., Levin, P.S., Minello, T.J., 2008. Assessing the link between coastal wetlands and white shrimp fishery production in the northern Gulf of Mexico. ICES CM 2008/m:11.
(10) Peterson, C.H., Grabowski, J.H., Powers, S.P., 2003. Estimated enhancement of fish production resulting from restoring oyster reef habitat: quantitative valuation. Marine Ecology Progress Series 264, 251-256.
(11) Piazza, B.P., Banks, P.D., La Peyre, M.K., 2005. The potential for created oyster shell reefs as a sustainable shoreline protection strategy in Louisiana. Restoration Ecology 13(3), 499-506.
(12) Rodney, W.S., Paynter, K.T., 2006. Comparisons of macrofaunal assemblages on restored and non-restored oyster reefs in mesohaline regions of Chesapeake Bay in Maryland. Journal of Experimental Marine Biology and Ecology 335, 39-51.
(13) Powers, S.P., Grabowski, J.H., Peterson, C.H., Lindberg, W.J., 2003. Estimating enhancement of fish production by offshore artificial reefs: Uncertainty exhibited by divergent scenarios. Marine Ecology Progress Series 264, 265-277.
(14) Plutchak, R., Major, K., Cebrian, J., Foster, C., Miller, M., Anton, A., Sheehan, K., Heck, K., Powers, S.,2010. Impacts of oyster reef restoration on primary productivity and nutrient dynamics in tidal creeks of the North Central Gulf of Mexico. Estuaries and Coasts 33(6), 1355-1364.
(15) Grizzle, R.E., Greene, J.K., Luckenbach, M.W., Coen, L.D., 2006. An new in situ method for measuring seston uptake by suspension-feeding bivalve mollusks. Journal of Shellfish Research 25, 643-649.
(16) Plunket, J.T., La Peyre, M., 2005. Oyster beds as fish and macroinvertebrate habitat in Barataria Bay, Louisiana. Bulletin of Marine Science 77, 155-164.
(17) Johnston, R.J., Grigalunas, T.A., Opaluch, J.J., Mazzotta, M., Diamantedes, J., 2002. Valuing estuarine resource services using economic and ecological models: the Peconic Estuary System study. Coastal Management 30, 47-65.
(18) Geraldi, N.R., Powers, S.P., Heck, K.L., Cebrian, J., 2009. Can habitat restoration be redundant? Response of mobile fishes and crustaceans to oyster reef restoration in marsh tidal creeks. Marine
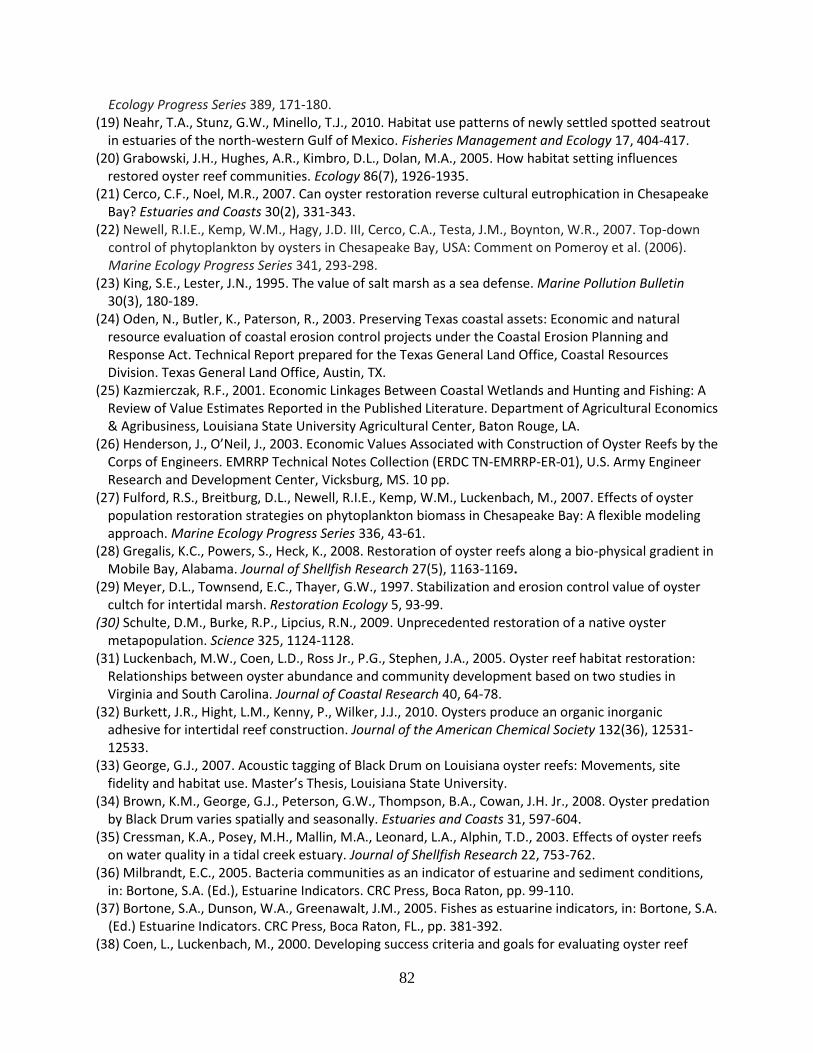
82
Ecology Progress Series 389, 171-180. (19) Neahr, T.A., Stunz, G.W., Minello, T.J., 2010. Habitat use patterns of newly settled spotted seatrout
in estuaries of the north-western Gulf of Mexico. Fisheries Management and Ecology 17, 404-417. (20) Grabowski, J.H., Hughes, A.R., Kimbro, D.L., Dolan, M.A., 2005. How habitat setting influences
restored oyster reef communities. Ecology 86(7), 1926-1935. (21) Cerco, C.F., Noel, M.R., 2007. Can oyster restoration reverse cultural eutrophication in Chesapeake
Bay? Estuaries and Coasts 30(2), 331-343. (22) Newell, R.I.E., Kemp, W.M., Hagy, J.D. III, Cerco, C.A., Testa, J.M., Boynton, W.R., 2007. Top-down
control of phytoplankton by oysters in Chesapeake Bay, USA: Comment on Pomeroy et al. (2006). Marine Ecology Progress Series 341, 293-298.
(23) King, S.E., Lester, J.N., 1995. The value of salt marsh as a sea defense. Marine Pollution Bulletin 30(3), 180-189.
(24) Oden, N., Butler, K., Paterson, R., 2003. Preserving Texas coastal assets: Economic and natural resource evaluation of coastal erosion control projects under the Coastal Erosion Planning and Response Act. Technical Report prepared for the Texas General Land Office, Coastal Resources Division. Texas General Land Office, Austin, TX.
(25) Kazmierczak, R.F., 2001. Economic Linkages Between Coastal Wetlands and Hunting and Fishing: A Review of Value Estimates Reported in the Published Literature. Department of Agricultural Economics & Agribusiness, Louisiana State University Agricultural Center, Baton Rouge, LA.
(26) Henderson, J., O’Neil, J., 2003. Economic Values Associated with Construction of Oyster Reefs by the Corps of Engineers. EMRRP Technical Notes Collection (ERDC TN-EMRRP-ER-01), U.S. Army Engineer Research and Development Center, Vicksburg, MS. 10 pp.
(27) Fulford, R.S., Breitburg, D.L., Newell, R.I.E., Kemp, W.M., Luckenbach, M., 2007. Effects of oyster population restoration strategies on phytoplankton biomass in Chesapeake Bay: A flexible modeling approach. Marine Ecology Progress Series 336, 43-61.
(28) Gregalis, K.C., Powers, S., Heck, K., 2008. Restoration of oyster reefs along a bio-physical gradient in Mobile Bay, Alabama. Journal of Shellfish Research 27(5), 1163-1169.
(29) Meyer, D.L., Townsend, E.C., Thayer, G.W., 1997. Stabilization and erosion control value of oyster cultch for intertidal marsh. Restoration Ecology 5, 93-99.
(30) Schulte, D.M., Burke, R.P., Lipcius, R.N., 2009. Unprecedented restoration of a native oyster metapopulation. Science 325, 1124-1128.
(31) Luckenbach, M.W., Coen, L.D., Ross Jr., P.G., Stephen, J.A., 2005. Oyster reef habitat restoration: Relationships between oyster abundance and community development based on two studies in Virginia and South Carolina. Journal of Coastal Research 40, 64-78.
(32) Burkett, J.R., Hight, L.M., Kenny, P., Wilker, J.J., 2010. Oysters produce an organic inorganic adhesive for intertidal reef construction. Journal of the American Chemical Society 132(36), 12531-12533.
(33) George, G.J., 2007. Acoustic tagging of Black Drum on Louisiana oyster reefs: Movements, site fidelity and habitat use. Master’s Thesis, Louisiana State University.
(34) Brown, K.M., George, G.J., Peterson, G.W., Thompson, B.A., Cowan, J.H. Jr., 2008. Oyster predation by Black Drum varies spatially and seasonally. Estuaries and Coasts 31, 597-604.
(35) Cressman, K.A., Posey, M.H., Mallin, M.A., Leonard, L.A., Alphin, T.D., 2003. Effects of oyster reefs on water quality in a tidal creek estuary. Journal of Shellfish Research 22, 753-762.
(36) Milbrandt, E.C., 2005. Bacteria communities as an indicator of estuarine and sediment conditions, in: Bortone, S.A. (Ed.), Estuarine Indicators. CRC Press, Boca Raton, pp. 99-110.
(37) Bortone, S.A., Dunson, W.A., Greenawalt, J.M., 2005. Fishes as estuarine indicators, in: Bortone, S.A. (Ed.) Estuarine Indicators. CRC Press, Boca Raton, FL., pp. 381-392.
(38) Coen, L., Luckenbach, M., 2000. Developing success criteria and goals for evaluating oyster reef
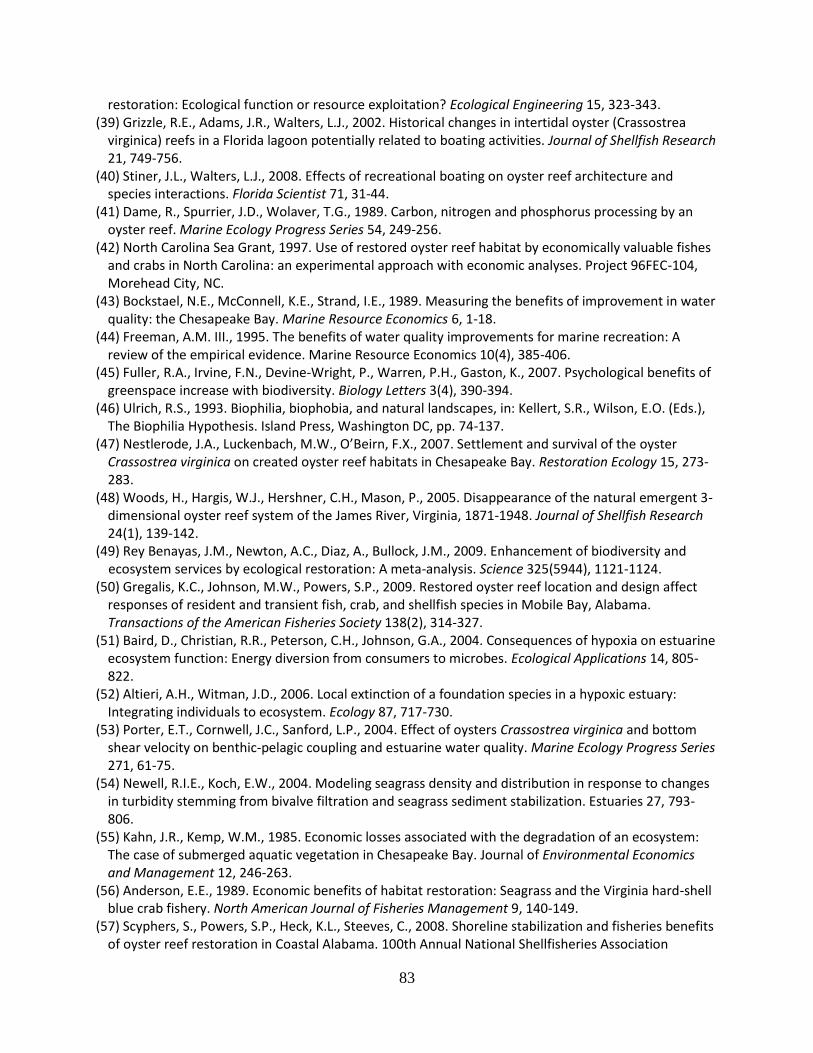
83
restoration: Ecological function or resource exploitation? Ecological Engineering 15, 323-343. (39) Grizzle, R.E., Adams, J.R., Walters, L.J., 2002. Historical changes in intertidal oyster (Crassostrea
virginica) reefs in a Florida lagoon potentially related to boating activities. Journal of Shellfish Research 21, 749-756.
(40) Stiner, J.L., Walters, L.J., 2008. Effects of recreational boating on oyster reef architecture and species interactions. Florida Scientist 71, 31-44.
(41) Dame, R., Spurrier, J.D., Wolaver, T.G., 1989. Carbon, nitrogen and phosphorus processing by an oyster reef. Marine Ecology Progress Series 54, 249-256.
(42) North Carolina Sea Grant, 1997. Use of restored oyster reef habitat by economically valuable fishes and crabs in North Carolina: an experimental approach with economic analyses. Project 96FEC-104, Morehead City, NC.
(43) Bockstael, N.E., McConnell, K.E., Strand, I.E., 1989. Measuring the benefits of improvement in water quality: the Chesapeake Bay. Marine Resource Economics 6, 1-18.
(44) Freeman, A.M. III., 1995. The benefits of water quality improvements for marine recreation: A review of the empirical evidence. Marine Resource Economics 10(4), 385-406.
(45) Fuller, R.A., Irvine, F.N., Devine-Wright, P., Warren, P.H., Gaston, K., 2007. Psychological benefits of greenspace increase with biodiversity. Biology Letters 3(4), 390-394.
(46) Ulrich, R.S., 1993. Biophilia, biophobia, and natural landscapes, in: Kellert, S.R., Wilson, E.O. (Eds.), The Biophilia Hypothesis. Island Press, Washington DC, pp. 74-137.
(47) Nestlerode, J.A., Luckenbach, M.W., O’Beirn, F.X., 2007. Settlement and survival of the oyster Crassostrea virginica on created oyster reef habitats in Chesapeake Bay. Restoration Ecology 15, 273-283.
(48) Woods, H., Hargis, W.J., Hershner, C.H., Mason, P., 2005. Disappearance of the natural emergent 3-dimensional oyster reef system of the James River, Virginia, 1871-1948. Journal of Shellfish Research 24(1), 139-142.
(49) Rey Benayas, J.M., Newton, A.C., Diaz, A., Bullock, J.M., 2009. Enhancement of biodiversity and ecosystem services by ecological restoration: A meta-analysis. Science 325(5944), 1121-1124.
(50) Gregalis, K.C., Johnson, M.W., Powers, S.P., 2009. Restored oyster reef location and design affect responses of resident and transient fish, crab, and shellfish species in Mobile Bay, Alabama. Transactions of the American Fisheries Society 138(2), 314-327.
(51) Baird, D., Christian, R.R., Peterson, C.H., Johnson, G.A., 2004. Consequences of hypoxia on estuarine ecosystem function: Energy diversion from consumers to microbes. Ecological Applications 14, 805-822.
(52) Altieri, A.H., Witman, J.D., 2006. Local extinction of a foundation species in a hypoxic estuary: Integrating individuals to ecosystem. Ecology 87, 717-730.
(53) Porter, E.T., Cornwell, J.C., Sanford, L.P., 2004. Effect of oysters Crassostrea virginica and bottom shear velocity on benthic-pelagic coupling and estuarine water quality. Marine Ecology Progress Series 271, 61-75.
(54) Newell, R.I.E., Koch, E.W., 2004. Modeling seagrass density and distribution in response to changes in turbidity stemming from bivalve filtration and seagrass sediment stabilization. Estuaries 27, 793-806.
(55) Kahn, J.R., Kemp, W.M., 1985. Economic losses associated with the degradation of an ecosystem: The case of submerged aquatic vegetation in Chesapeake Bay. Journal of Environmental Economics and Management 12, 246-263.
(56) Anderson, E.E., 1989. Economic benefits of habitat restoration: Seagrass and the Virginia hard-shell blue crab fishery. North American Journal of Fisheries Management 9, 140-149.
(57) Scyphers, S., Powers, S.P., Heck, K.L., Steeves, C., 2008. Shoreline stabilization and fisheries benefits of oyster reef restoration in Coastal Alabama. 100th Annual National Shellfisheries Association
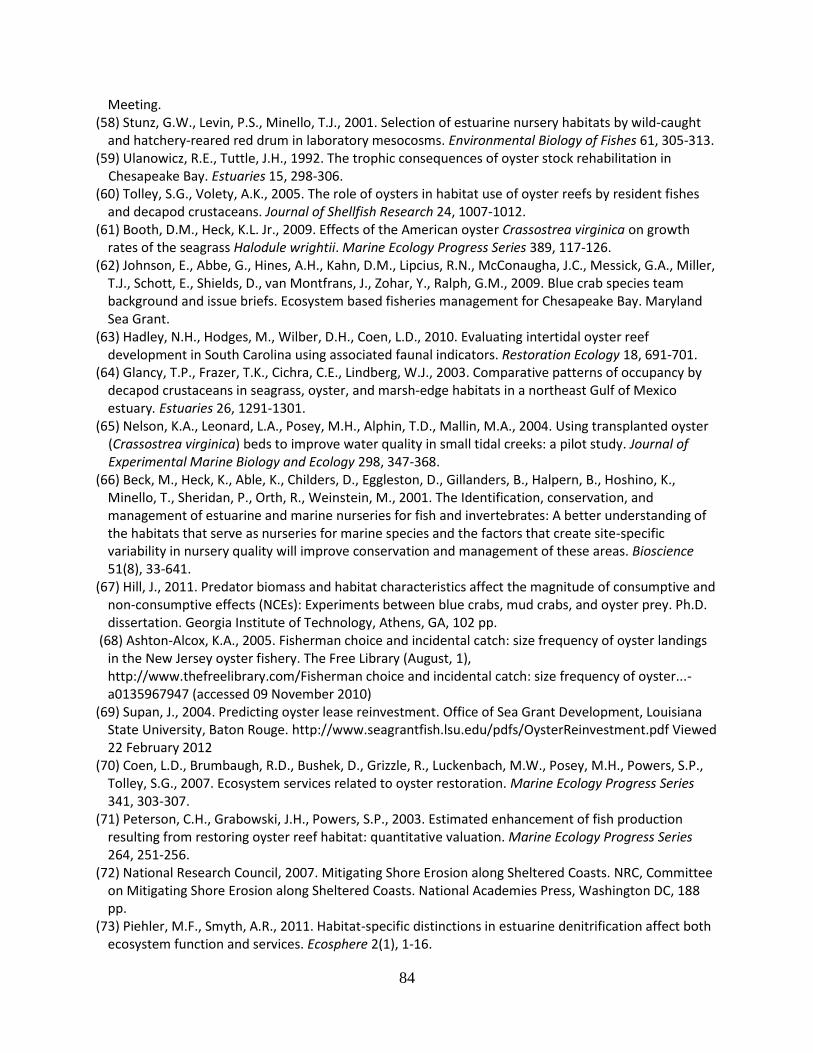
84
Meeting. (58) Stunz, G.W., Levin, P.S., Minello, T.J., 2001. Selection of estuarine nursery habitats by wild-caught
and hatchery-reared red drum in laboratory mesocosms. Environmental Biology of Fishes 61, 305-313. (59) Ulanowicz, R.E., Tuttle, J.H., 1992. The trophic consequences of oyster stock rehabilitation in
Chesapeake Bay. Estuaries 15, 298-306. (60) Tolley, S.G., Volety, A.K., 2005. The role of oysters in habitat use of oyster reefs by resident fishes
and decapod crustaceans. Journal of Shellfish Research 24, 1007-1012. (61) Booth, D.M., Heck, K.L. Jr., 2009. Effects of the American oyster Crassostrea virginica on growth
rates of the seagrass Halodule wrightii. Marine Ecology Progress Series 389, 117-126. (62) Johnson, E., Abbe, G., Hines, A.H., Kahn, D.M., Lipcius, R.N., McConaugha, J.C., Messick, G.A., Miller,
T.J., Schott, E., Shields, D., van Montfrans, J., Zohar, Y., Ralph, G.M., 2009. Blue crab species team background and issue briefs. Ecosystem based fisheries management for Chesapeake Bay. Maryland Sea Grant.
(63) Hadley, N.H., Hodges, M., Wilber, D.H., Coen, L.D., 2010. Evaluating intertidal oyster reef development in South Carolina using associated faunal indicators. Restoration Ecology 18, 691-701.
(64) Glancy, T.P., Frazer, T.K., Cichra, C.E., Lindberg, W.J., 2003. Comparative patterns of occupancy by decapod crustaceans in seagrass, oyster, and marsh-edge habitats in a northeast Gulf of Mexico estuary. Estuaries 26, 1291-1301.
(65) Nelson, K.A., Leonard, L.A., Posey, M.H., Alphin, T.D., Mallin, M.A., 2004. Using transplanted oyster (Crassostrea virginica) beds to improve water quality in small tidal creeks: a pilot study. Journal of Experimental Marine Biology and Ecology 298, 347-368.
(66) Beck, M., Heck, K., Able, K., Childers, D., Eggleston, D., Gillanders, B., Halpern, B., Hoshino, K., Minello, T., Sheridan, P., Orth, R., Weinstein, M., 2001. The Identification, conservation, and management of estuarine and marine nurseries for fish and invertebrates: A better understanding of the habitats that serve as nurseries for marine species and the factors that create site-specific variability in nursery quality will improve conservation and management of these areas. Bioscience 51(8), 33-641.
(67) Hill, J., 2011. Predator biomass and habitat characteristics affect the magnitude of consumptive and non-consumptive effects (NCEs): Experiments between blue crabs, mud crabs, and oyster prey. Ph.D. dissertation. Georgia Institute of Technology, Athens, GA, 102 pp.
(68) Ashton-Alcox, K.A., 2005. Fisherman choice and incidental catch: size frequency of oyster landings in the New Jersey oyster fishery. The Free Library (August, 1), http://www.thefreelibrary.com/Fisherman choice and incidental catch: size frequency of oyster...-a0135967947 (accessed 09 November 2010)
(69) Supan, J., 2004. Predicting oyster lease reinvestment. Office of Sea Grant Development, Louisiana State University, Baton Rouge. http://www.seagrantfish.lsu.edu/pdfs/OysterReinvestment.pdf Viewed 22 February 2012
(70) Coen, L.D., Brumbaugh, R.D., Bushek, D., Grizzle, R., Luckenbach, M.W., Posey, M.H., Powers, S.P., Tolley, S.G., 2007. Ecosystem services related to oyster restoration. Marine Ecology Progress Series 341, 303-307.
(71) Peterson, C.H., Grabowski, J.H., Powers, S.P., 2003. Estimated enhancement of fish production resulting from restoring oyster reef habitat: quantitative valuation. Marine Ecology Progress Series 264, 251-256.
(72) National Research Council, 2007. Mitigating Shore Erosion along Sheltered Coasts. NRC, Committee on Mitigating Shore Erosion along Sheltered Coasts. National Academies Press, Washington DC, 188 pp.
(73) Piehler, M.F., Smyth, A.R., 2011. Habitat-specific distinctions in estuarine denitrification affect both ecosystem function and services. Ecosphere 2(1), 1-16.
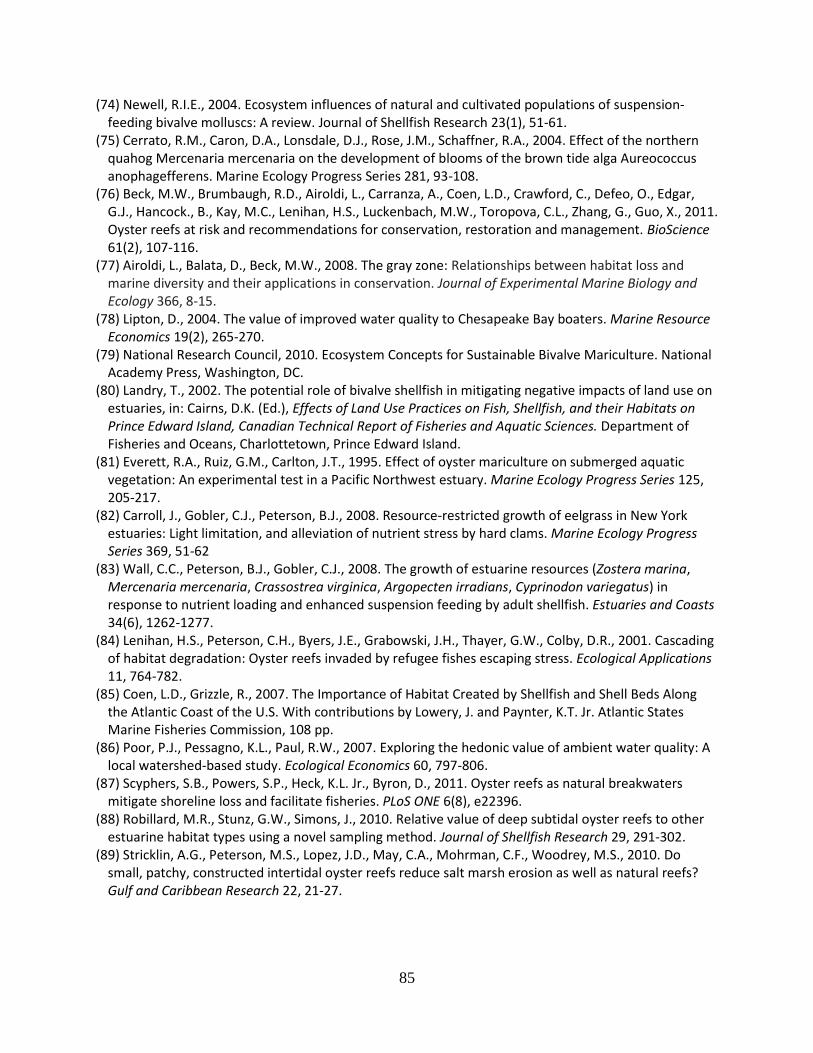
85
(74) Newell, R.I.E., 2004. Ecosystem influences of natural and cultivated populations of suspension-feeding bivalve molluscs: A review. Journal of Shellfish Research 23(1), 51-61.
(75) Cerrato, R.M., Caron, D.A., Lonsdale, D.J., Rose, J.M., Schaffner, R.A., 2004. Effect of the northern quahog Mercenaria mercenaria on the development of blooms of the brown tide alga Aureococcus anophagefferens. Marine Ecology Progress Series 281, 93-108.
(76) Beck, M.W., Brumbaugh, R.D., Airoldi, L., Carranza, A., Coen, L.D., Crawford, C., Defeo, O., Edgar, G.J., Hancock., B., Kay, M.C., Lenihan, H.S., Luckenbach, M.W., Toropova, C.L., Zhang, G., Guo, X., 2011. Oyster reefs at risk and recommendations for conservation, restoration and management. BioScience 61(2), 107-116.
(77) Airoldi, L., Balata, D., Beck, M.W., 2008. The gray zone: Relationships between habitat loss and marine diversity and their applications in conservation. Journal of Experimental Marine Biology and Ecology 366, 8-15.
(78) Lipton, D., 2004. The value of improved water quality to Chesapeake Bay boaters. Marine Resource Economics 19(2), 265-270.
(79) National Research Council, 2010. Ecosystem Concepts for Sustainable Bivalve Mariculture. National Academy Press, Washington, DC.
(80) Landry, T., 2002. The potential role of bivalve shellfish in mitigating negative impacts of land use on estuaries, in: Cairns, D.K. (Ed.), Effects of Land Use Practices on Fish, Shellfish, and their Habitats on Prince Edward Island, Canadian Technical Report of Fisheries and Aquatic Sciences. Department of Fisheries and Oceans, Charlottetown, Prince Edward Island.
(81) Everett, R.A., Ruiz, G.M., Carlton, J.T., 1995. Effect of oyster mariculture on submerged aquatic vegetation: An experimental test in a Pacific Northwest estuary. Marine Ecology Progress Series 125, 205-217.
(82) Carroll, J., Gobler, C.J., Peterson, B.J., 2008. Resource-restricted growth of eelgrass in New York estuaries: Light limitation, and alleviation of nutrient stress by hard clams. Marine Ecology Progress Series 369, 51-62
(83) Wall, C.C., Peterson, B.J., Gobler, C.J., 2008. The growth of estuarine resources (Zostera marina, Mercenaria mercenaria, Crassostrea virginica, Argopecten irradians, Cyprinodon variegatus) in response to nutrient loading and enhanced suspension feeding by adult shellfish. Estuaries and Coasts 34(6), 1262-1277.
(84) Lenihan, H.S., Peterson, C.H., Byers, J.E., Grabowski, J.H., Thayer, G.W., Colby, D.R., 2001. Cascading of habitat degradation: Oyster reefs invaded by refugee fishes escaping stress. Ecological Applications 11, 764-782.
(85) Coen, L.D., Grizzle, R., 2007. The Importance of Habitat Created by Shellfish and Shell Beds Along the Atlantic Coast of the U.S. With contributions by Lowery, J. and Paynter, K.T. Jr. Atlantic States Marine Fisheries Commission, 108 pp.
(86) Poor, P.J., Pessagno, K.L., Paul, R.W., 2007. Exploring the hedonic value of ambient water quality: A local watershed-based study. Ecological Economics 60, 797-806.
(87) Scyphers, S.B., Powers, S.P., Heck, K.L. Jr., Byron, D., 2011. Oyster reefs as natural breakwaters mitigate shoreline loss and facilitate fisheries. PLoS ONE 6(8), e22396.
(88) Robillard, M.R., Stunz, G.W., Simons, J., 2010. Relative value of deep subtidal oyster reefs to other estuarine habitat types using a novel sampling method. Journal of Shellfish Research 29, 291-302.
(89) Stricklin, A.G., Peterson, M.S., Lopez, J.D., May, C.A., Mohrman, C.F., Woodrey, M.S., 2010. Do small, patchy, constructed intertidal oyster reefs reduce salt marsh erosion as well as natural reefs? Gulf and Caribbean Research 22, 21-27.

86
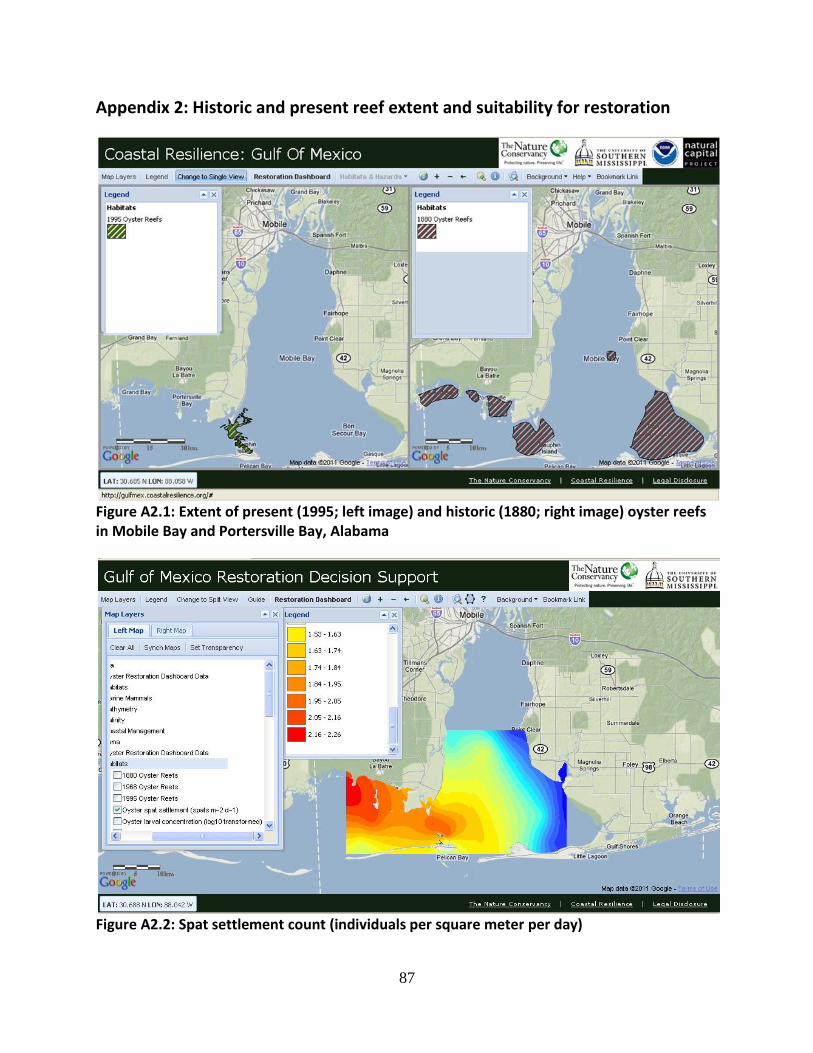
87
Appendix 2: Historic and present reef extent and suitability for restoration
Figure A2.1: Extent of present (1995; left image) and historic (1880; right image) oyster reefs in Mobile Bay and Portersville Bay, Alabama
Figure A2.2: Spat settlement count (individuals per square meter per day)
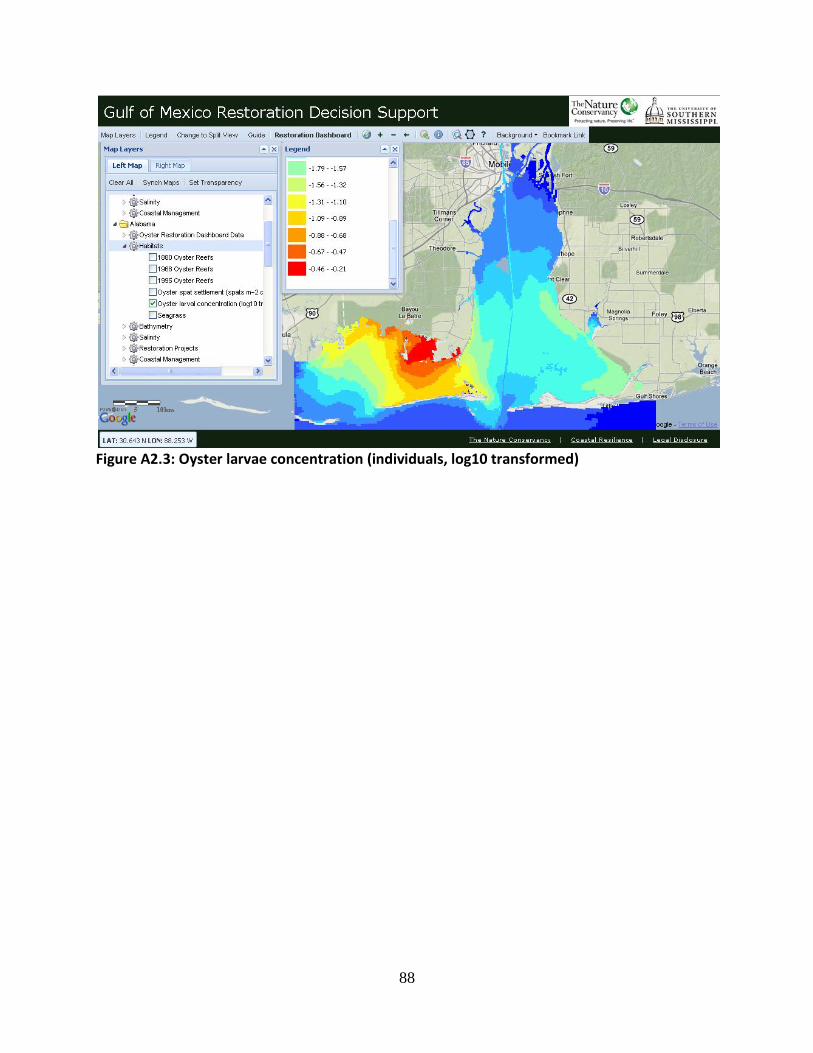
88
Figure A2.3: Oyster larvae concentration (individuals, log10 transformed)
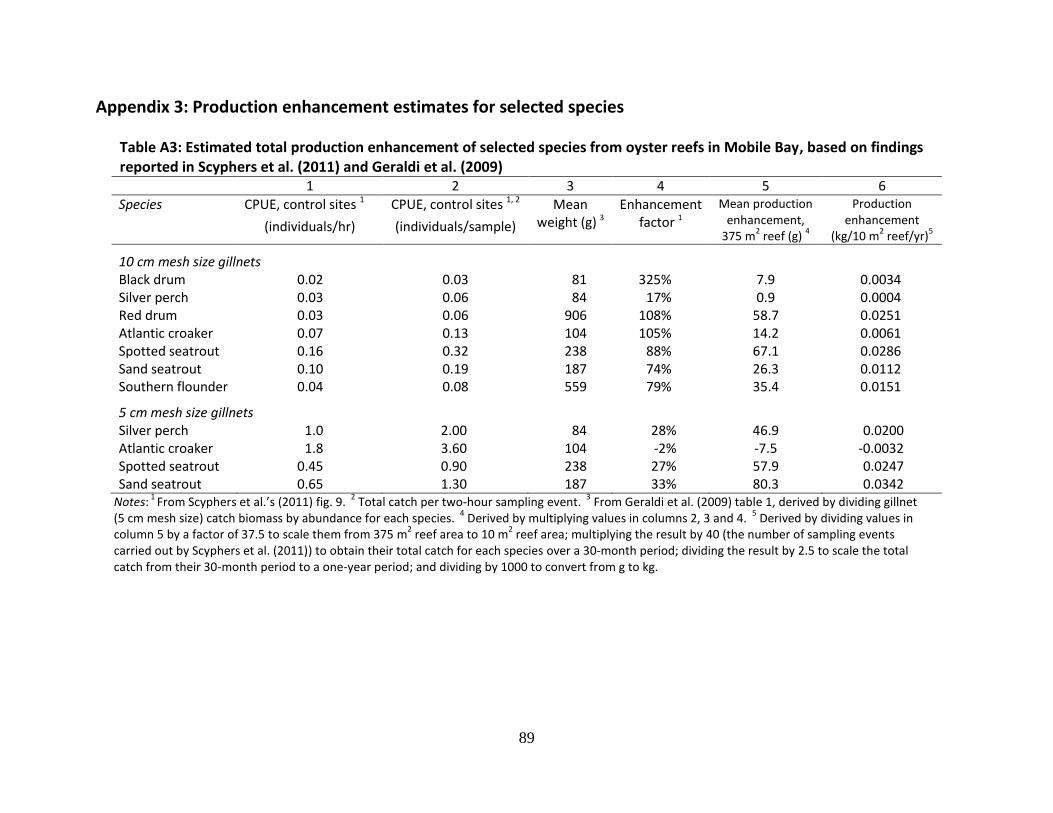
89
Appendix 3: Production enhancement estimates for selected species
Table A3: Estimated total production enhancement of selected species from oyster reefs in Mobile Bay, based on findings reported in Scyphers et al. (2011) and Geraldi et al. (2009)
1 2 3 4 5 6
Species CPUE, control sites 1 CPUE, control sites 1, 2 Mean
weight (g) 3
Enhancement factor 1
Mean production enhancement,
375 m2 reef (g)
4
Production enhancement
(kg/10 m2 reef/yr)
5 (individuals/hr) (individuals/sample)
10 cm mesh size gillnets
Black drum 0.02 0.03 81 325% 7.9 0.0034 Silver perch 0.03 0.06 84 17% 0.9 0.0004 Red drum 0.03 0.06 906 108% 58.7 0.0251 Atlantic croaker 0.07 0.13 104 105% 14.2 0.0061 Spotted seatrout 0.16 0.32 238 88% 67.1 0.0286 Sand seatrout 0.10 0.19 187 74% 26.3 0.0112 Southern flounder 0.04 0.08 559 79% 35.4 0.0151
5 cm mesh size gillnets
Silver perch 1.0 2.00 84 28% 46.9 0.0200 Atlantic croaker 1.8 3.60 104 -2% -7.5 -0.0032 Spotted seatrout 0.45 0.90 238 27% 57.9 0.0247 Sand seatrout 0.65 1.30 187 33% 80.3 0.0342
Notes: 1
From Scyphers et al.’s (2011) fig. 9. 2
Total catch per two-hour sampling event. 3
From Geraldi et al. (2009) table 1, derived by dividing gillnet (5 cm mesh size) catch biomass by abundance for each species.
4 Derived by multiplying values in columns 2, 3 and 4.
5 Derived by dividing values in
column 5 by a factor of 37.5 to scale them from 375 m2 reef area to 10 m
2 reef area; multiplying the result by 40 (the number of sampling events
carried out by Scyphers et al. (2011)) to obtain their total catch for each species over a 30-month period; dividing the result by 2.5 to scale the total catch from their 30-month period to a one-year period; and dividing by 1000 to convert from g to kg.
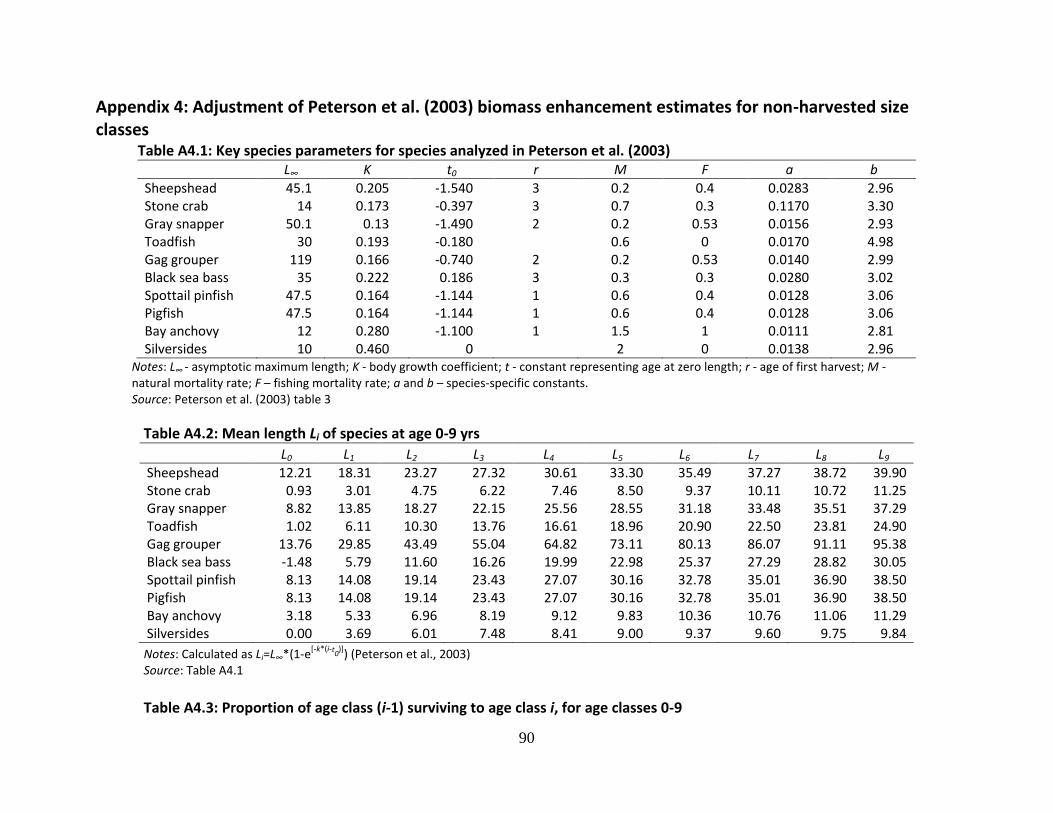
90
Appendix 4: Adjustment of Peterson et al. (2003) biomass enhancement estimates for non-harvested size classes
Table A4.1: Key species parameters for species analyzed in Peterson et al. (2003) L∞ K t0 r M F a b
Sheepshead 45.1 0.205 -1.540 3 0.2 0.4 0.0283 2.96 Stone crab 14 0.173 -0.397 3 0.7 0.3 0.1170 3.30 Gray snapper 50.1 0.13 -1.490 2 0.2 0.53 0.0156 2.93 Toadfish 30 0.193 -0.180 0.6 0 0.0170 4.98 Gag grouper 119 0.166 -0.740 2 0.2 0.53 0.0140 2.99 Black sea bass 35 0.222 0.186 3 0.3 0.3 0.0280 3.02 Spottail pinfish 47.5 0.164 -1.144 1 0.6 0.4 0.0128 3.06 Pigfish 47.5 0.164 -1.144 1 0.6 0.4 0.0128 3.06 Bay anchovy 12 0.280 -1.100 1 1.5 1 0.0111 2.81 Silversides 10 0.460 0 2 0 0.0138 2.96
Notes: L∞ - asymptotic maximum length; K - body growth coefficient; t - constant representing age at zero length; r - age of first harvest; M - natural mortality rate; F – fishing mortality rate; a and b – species-specific constants. Source: Peterson et al. (2003) table 3
Table A4.2: Mean length Li of species at age 0-9 yrs
L0 L1 L2 L3 L4 L5 L6 L7 L8 L9
Sheepshead 12.21 18.31 23.27 27.32 30.61 33.30 35.49 37.27 38.72 39.90 Stone crab 0.93 3.01 4.75 6.22 7.46 8.50 9.37 10.11 10.72 11.25 Gray snapper 8.82 13.85 18.27 22.15 25.56 28.55 31.18 33.48 35.51 37.29 Toadfish 1.02 6.11 10.30 13.76 16.61 18.96 20.90 22.50 23.81 24.90 Gag grouper 13.76 29.85 43.49 55.04 64.82 73.11 80.13 86.07 91.11 95.38 Black sea bass -1.48 5.79 11.60 16.26 19.99 22.98 25.37 27.29 28.82 30.05 Spottail pinfish 8.13 14.08 19.14 23.43 27.07 30.16 32.78 35.01 36.90 38.50 Pigfish 8.13 14.08 19.14 23.43 27.07 30.16 32.78 35.01 36.90 38.50 Bay anchovy 3.18 5.33 6.96 8.19 9.12 9.83 10.36 10.76 11.06 11.29 Silversides 0.00 3.69 6.01 7.48 8.41 9.00 9.37 9.60 9.75 9.84
Notes: Calculated as Li=L∞*(1-e[-k*(i-t0
)]) (Peterson et al., 2003)
Source: Table A4.1
Table A4.3: Proportion of age class (i-1) surviving to age class i, for age classes 0-9
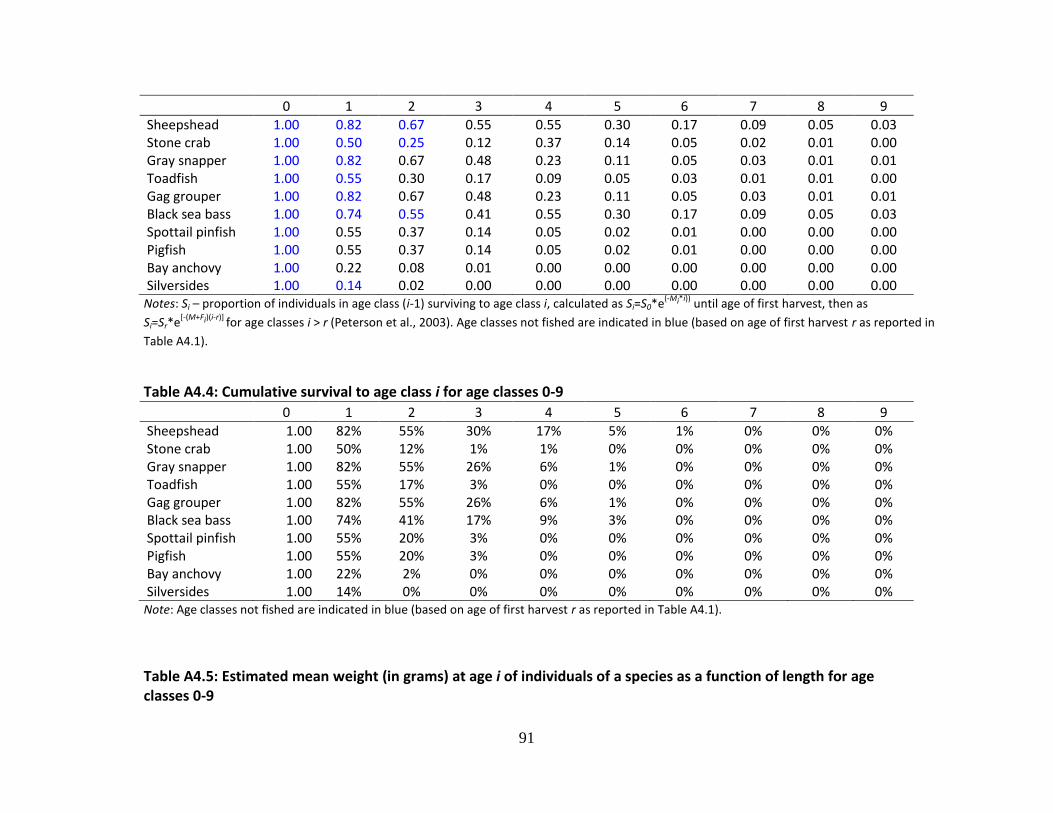
91
0 1 2 3 4 5 6 7 8 9
Sheepshead 1.00 0.82 0.67 0.55 0.55 0.30 0.17 0.09 0.05 0.03 Stone crab 1.00 0.50 0.25 0.12 0.37 0.14 0.05 0.02 0.01 0.00 Gray snapper 1.00 0.82 0.67 0.48 0.23 0.11 0.05 0.03 0.01 0.01 Toadfish 1.00 0.55 0.30 0.17 0.09 0.05 0.03 0.01 0.01 0.00 Gag grouper 1.00 0.82 0.67 0.48 0.23 0.11 0.05 0.03 0.01 0.01 Black sea bass 1.00 0.74 0.55 0.41 0.55 0.30 0.17 0.09 0.05 0.03 Spottail pinfish 1.00 0.55 0.37 0.14 0.05 0.02 0.01 0.00 0.00 0.00 Pigfish 1.00 0.55 0.37 0.14 0.05 0.02 0.01 0.00 0.00 0.00 Bay anchovy 1.00 0.22 0.08 0.01 0.00 0.00 0.00 0.00 0.00 0.00 Silversides 1.00 0.14 0.02 0.00 0.00 0.00 0.00 0.00 0.00 0.00
Notes: Si – proportion of individuals in age class (i-1) surviving to age class i, calculated as Si=S0*e(-Mi*i))
until age of first harvest, then as
Si=Sr*e[-(M+Fi)(i-r)]
for age classes i > r (Peterson et al., 2003). Age classes not fished are indicated in blue (based on age of first harvest r as reported in
Table A4.1).
Table A4.4: Cumulative survival to age class i for age classes 0-9
0 1 2 3 4 5 6 7 8 9
Sheepshead 1.00 82% 55% 30% 17% 5% 1% 0% 0% 0% Stone crab 1.00 50% 12% 1% 1% 0% 0% 0% 0% 0% Gray snapper 1.00 82% 55% 26% 6% 1% 0% 0% 0% 0% Toadfish 1.00 55% 17% 3% 0% 0% 0% 0% 0% 0% Gag grouper 1.00 82% 55% 26% 6% 1% 0% 0% 0% 0% Black sea bass 1.00 74% 41% 17% 9% 3% 0% 0% 0% 0% Spottail pinfish 1.00 55% 20% 3% 0% 0% 0% 0% 0% 0% Pigfish 1.00 55% 20% 3% 0% 0% 0% 0% 0% 0% Bay anchovy 1.00 22% 2% 0% 0% 0% 0% 0% 0% 0% Silversides 1.00 14% 0% 0% 0% 0% 0% 0% 0% 0%
Note: Age classes not fished are indicated in blue (based on age of first harvest r as reported in Table A4.1).
Table A4.5: Estimated mean weight (in grams) at age i of individuals of a species as a function of length for age classes 0-9
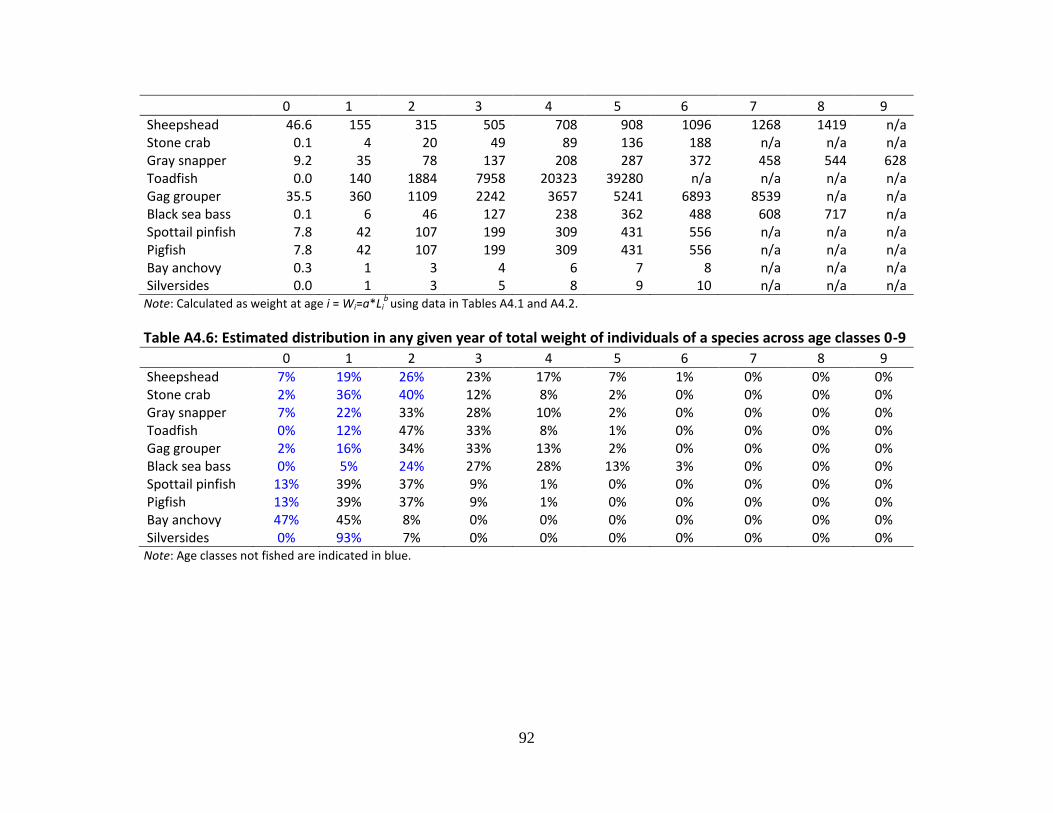
92
0 1 2 3 4 5 6 7 8 9
Sheepshead 46.6 155 315 505 708 908 1096 1268 1419 n/a Stone crab 0.1 4 20 49 89 136 188 n/a n/a n/a Gray snapper 9.2 35 78 137 208 287 372 458 544 628 Toadfish 0.0 140 1884 7958 20323 39280 n/a n/a n/a n/a Gag grouper 35.5 360 1109 2242 3657 5241 6893 8539 n/a n/a Black sea bass 0.1 6 46 127 238 362 488 608 717 n/a Spottail pinfish 7.8 42 107 199 309 431 556 n/a n/a n/a Pigfish 7.8 42 107 199 309 431 556 n/a n/a n/a Bay anchovy 0.3 1 3 4 6 7 8 n/a n/a n/a Silversides 0.0 1 3 5 8 9 10 n/a n/a n/a
Note: Calculated as weight at age i = Wi=a*Lib
using data in Tables A4.1 and A4.2.
Table A4.6: Estimated distribution in any given year of total weight of individuals of a species across age classes 0-9
0 1 2 3 4 5 6 7 8 9
Sheepshead 7% 19% 26% 23% 17% 7% 1% 0% 0% 0% Stone crab 2% 36% 40% 12% 8% 2% 0% 0% 0% 0% Gray snapper 7% 22% 33% 28% 10% 2% 0% 0% 0% 0% Toadfish 0% 12% 47% 33% 8% 1% 0% 0% 0% 0% Gag grouper 2% 16% 34% 33% 13% 2% 0% 0% 0% 0% Black sea bass 0% 5% 24% 27% 28% 13% 3% 0% 0% 0% Spottail pinfish 13% 39% 37% 9% 1% 0% 0% 0% 0% 0% Pigfish 13% 39% 37% 9% 1% 0% 0% 0% 0% 0% Bay anchovy 47% 45% 8% 0% 0% 0% 0% 0% 0% 0% Silversides 0% 93% 7% 0% 0% 0% 0% 0% 0% 0%
Note: Age classes not fished are indicated in blue.
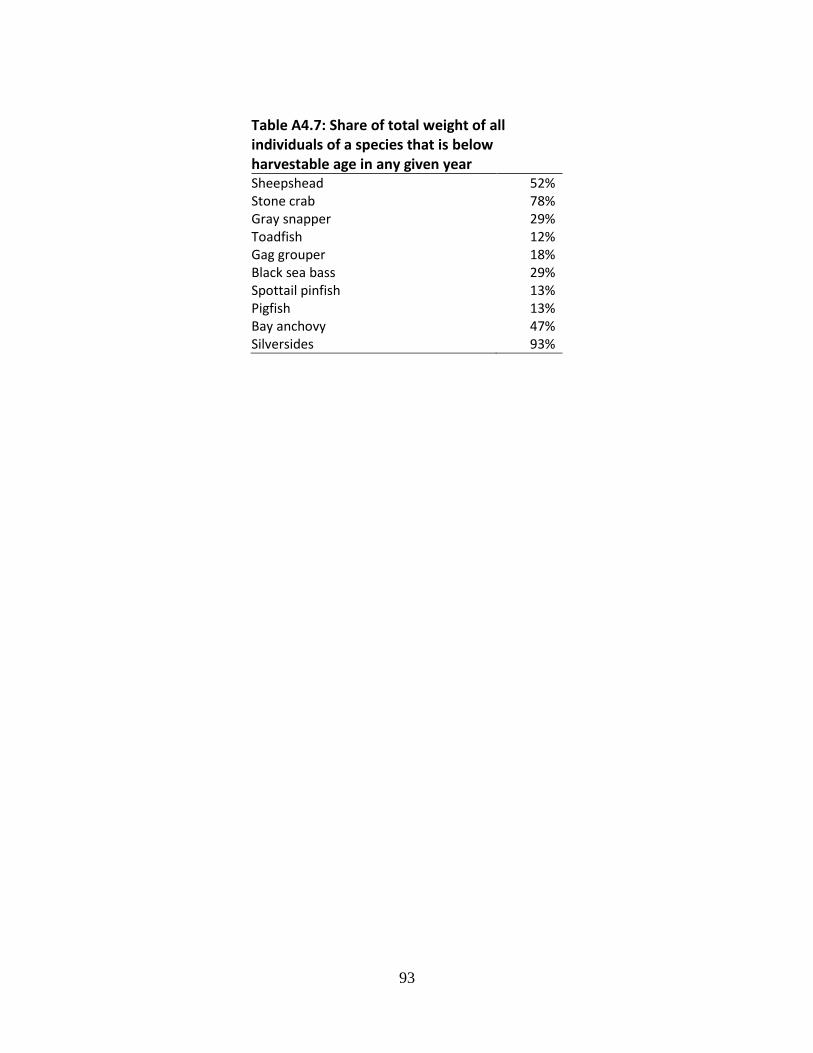
93
Table A4.7: Share of total weight of all individuals of a species that is below harvestable age in any given year Sheepshead 52% Stone crab 78% Gray snapper 29% Toadfish 12% Gag grouper 18% Black sea bass 29% Spottail pinfish 13% Pigfish 13% Bay anchovy 47% Silversides 93%
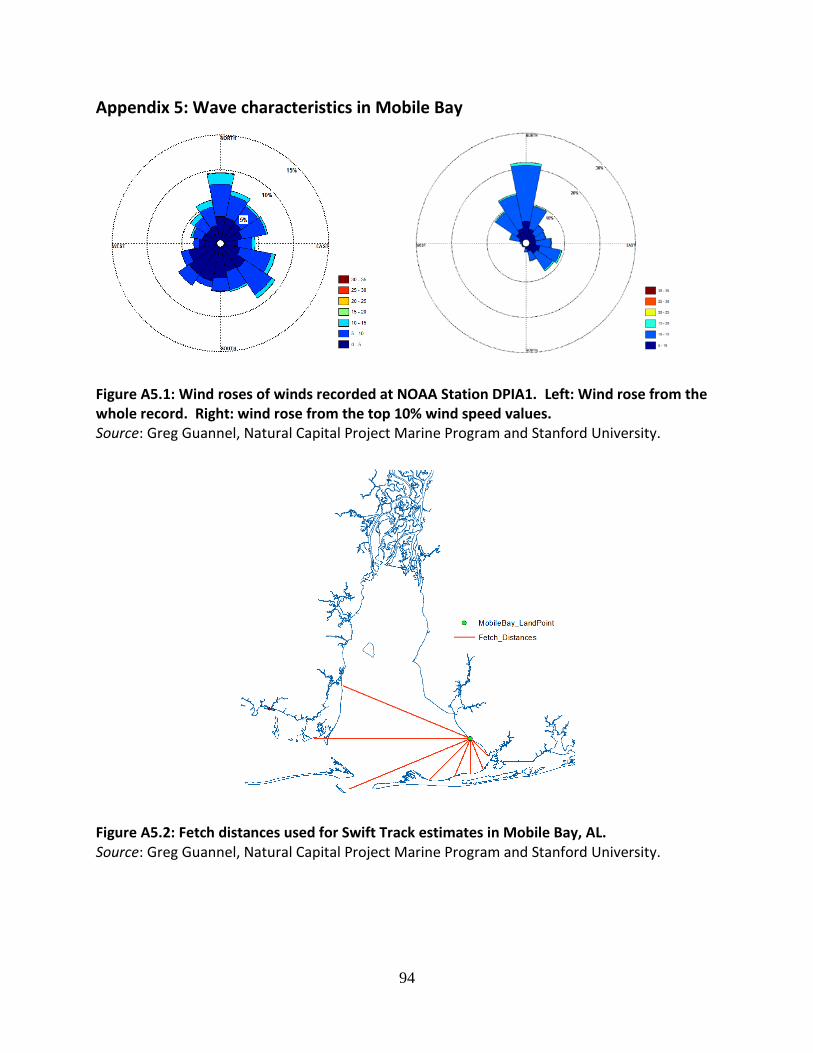
94
Appendix 5: Wave characteristics in Mobile Bay
Figure A5.1: Wind roses of winds recorded at NOAA Station DPIA1. Left: Wind rose from the whole record. Right: wind rose from the top 10% wind speed values. Source: Greg Guannel, Natural Capital Project Marine Program and Stanford University.
Figure A5.2: Fetch distances used for Swift Track estimates in Mobile Bay, AL. Source: Greg Guannel, Natural Capital Project Marine Program and Stanford University.
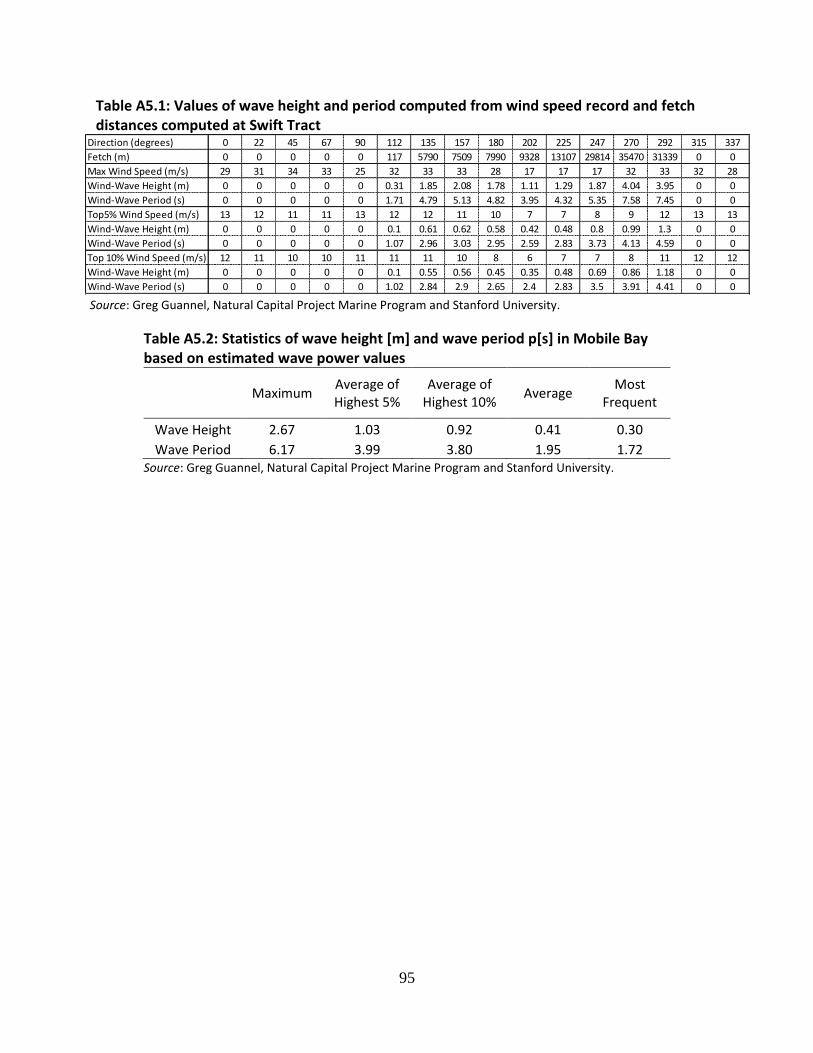
95
Table A5.1: Values of wave height and period computed from wind speed record and fetch distances computed at Swift Tract
Source: Greg Guannel, Natural Capital Project Marine Program and Stanford University.
Table A5.2: Statistics of wave height [m] and wave period p[s] in Mobile Bay based on estimated wave power values
Maximum
Average of Highest 5%
Average of Highest 10%
Average Most
Frequent
Wave Height 2.67 1.03 0.92 0.41 0.30
Wave Period 6.17 3.99 3.80 1.95 1.72 Source: Greg Guannel, Natural Capital Project Marine Program and Stanford University.
Direction (degrees) 0 22 45 67 90 112 135 157 180 202 225 247 270 292 315 337
Fetch (m) 0 0 0 0 0 117 5790 7509 7990 9328 13107 29814 35470 31339 0 0
Max Wind Speed (m/s) 29 31 34 33 25 32 33 33 28 17 17 17 32 33 32 28
Wind-Wave Height (m) 0 0 0 0 0 0.31 1.85 2.08 1.78 1.11 1.29 1.87 4.04 3.95 0 0
Wind-Wave Period (s) 0 0 0 0 0 1.71 4.79 5.13 4.82 3.95 4.32 5.35 7.58 7.45 0 0
Top5% Wind Speed (m/s) 13 12 11 11 13 12 12 11 10 7 7 8 9 12 13 13
Wind-Wave Height (m) 0 0 0 0 0 0.1 0.61 0.62 0.58 0.42 0.48 0.8 0.99 1.3 0 0
Wind-Wave Period (s) 0 0 0 0 0 1.07 2.96 3.03 2.95 2.59 2.83 3.73 4.13 4.59 0 0
Top 10% Wind Speed (m/s) 12 11 10 10 11 11 11 10 8 6 7 7 8 11 12 12
Wind-Wave Height (m) 0 0 0 0 0 0.1 0.55 0.56 0.45 0.35 0.48 0.69 0.86 1.18 0 0
Wind-Wave Period (s) 0 0 0 0 0 1.02 2.84 2.9 2.65 2.4 2.83 3.5 3.91 4.41 0 0

96
Appendix 6: Estimated fishing industry profit margins
Producer surplus is difficult to estimate directly as data on production cost functions for the fishing industry are not readily available in official fisheries statistics (Lovell and Drake, 2009). Nevertheless, some estimates are available from previous studies. EPA regulatory research (Lovell et al., 2007) estimated the ratio of producer surplus to gross revenues for the shellfish fishing industry at 58 percent, based on the average variable cost of shellfish fishing in the Northeastern US. However, this ratio may be lower in the Gulf of Mexico because in the Gulf there are fewer access restrictions than in the northeast and thus lower expected profit margins (Lovell and Drake, 2009).
The Research Group’s 2004 Fisheries Economic Assessment Model (cited in Sumaila and Suatoni, 2006) estimated the profit margin of large groundfish trawlers on the US Pacific coast at 10 percent. Another study (TCW Economics, 2008) estimated that the combined average profit rate in 2006 in the finfish harvesting and processing sectors of Washington State was 23 percent.
A study of North Carolina’s southern district (Crosson, 2010), a region consisting of six coastal counties north of the South Carolina state border, yields another point of comparison that may be particularly appropriate for our study area. The southern district is characterized by a mix of small, medium and larger fishing businesses, with only half of all participants considering themselves full-time fishermen while the remainder engages in additional income-generating activities such as construction, the service sector, landscaping, work in fish houses or maritime trading. Total landings value in 2008 of 1,316 fishermen in this estuarine-based fishery was $5.94 million, with input costs totaling $3.38 million, yielding a total proprietary income after out-of-pocket costs of $2.57 million, or 43 percent of landings value. The situation varied widely among participants, from 20 percent who just broke even or lost money to 5 percent who earned more than $30,000 from fishing that year. Out-of-pocket costs do not include opportunity costs of capital and own-labor, so proprietary income must be adjusted for these costs to derive producer surplus or profit. With an average vessel value of just over $20,000 and at a 5 percent interest rate, the opportunity cost of the average participant’s investment in fishing capital is approximately $1,000 per year. Reducing reported average net earnings in 2008 ($4,516) by this amount reduces the mean profit rate from 43 to 21 percent. Crosson (2010) does not provide information on the average number of hours participants in the industry spent fishing. Nevertheless, the actual mean profit rate of fishing in his study area is likely to be below 21 percent, if own labor indeed is an opportunity cost for participants. The latter is not the case if no alternative employment is available or if other uncompensated activities fishermen would have engaged in yield less satisfaction than fishing. Given the high unemployment rate in Crosson’s study area, at least the first of these two conditions may be met for many fishermen. Given this information, we conclude that in 2008 the mean producer surplus in Crosson’s study area was 21 percent or less.

97
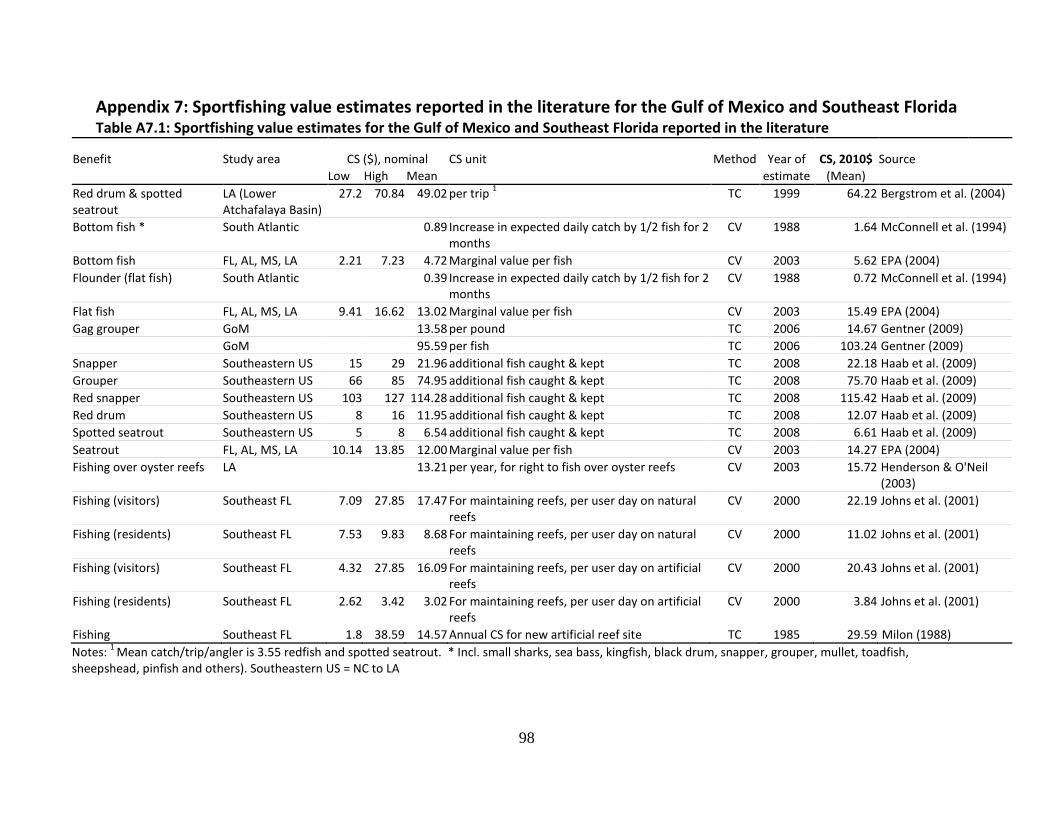
98
Appendix 7: Sportfishing value estimates reported in the literature for the Gulf of Mexico and Southeast Florida Table A7.1: Sportfishing value estimates for the Gulf of Mexico and Southeast Florida reported in the literature
Benefit Study area CS ($), nominal CS unit Method Year of CS, 2010$ Source
Low High Mean
estimate (Mean)
Red drum & spotted seatrout
LA (Lower Atchafalaya Basin)
27.2 70.84 49.02 per trip 1
TC 1999 64.22 Bergstrom et al. (2004)
Bottom fish * South Atlantic 0.89 Increase in expected daily catch by 1/2 fish for 2 months
CV 1988 1.64 McConnell et al. (1994)
Bottom fish FL, AL, MS, LA 2.21 7.23 4.72 Marginal value per fish CV 2003 5.62 EPA (2004)
Flounder (flat fish) South Atlantic 0.39 Increase in expected daily catch by 1/2 fish for 2 months
CV 1988 0.72 McConnell et al. (1994)
Flat fish FL, AL, MS, LA 9.41 16.62 13.02 Marginal value per fish CV 2003 15.49 EPA (2004)
Gag grouper GoM 13.58 per pound TC 2006 14.67 Gentner (2009)
GoM 95.59 per fish TC 2006 103.24 Gentner (2009)
Snapper Southeastern US 15 29 21.96 additional fish caught & kept TC 2008 22.18 Haab et al. (2009)
Grouper Southeastern US 66 85 74.95 additional fish caught & kept TC 2008 75.70 Haab et al. (2009)
Red snapper Southeastern US 103 127 114.28 additional fish caught & kept TC 2008 115.42 Haab et al. (2009)
Red drum Southeastern US 8 16 11.95 additional fish caught & kept TC 2008 12.07 Haab et al. (2009)
Spotted seatrout Southeastern US 5 8 6.54 additional fish caught & kept TC 2008 6.61 Haab et al. (2009)
Seatrout FL, AL, MS, LA 10.14 13.85 12.00 Marginal value per fish CV 2003 14.27 EPA (2004)
Fishing over oyster reefs LA 13.21 per year, for right to fish over oyster reefs CV 2003 15.72 Henderson & O'Neil (2003)
Fishing (visitors) Southeast FL 7.09 27.85 17.47 For maintaining reefs, per user day on natural reefs
CV 2000 22.19 Johns et al. (2001)
Fishing (residents) Southeast FL 7.53 9.83 8.68 For maintaining reefs, per user day on natural reefs
CV 2000 11.02 Johns et al. (2001)
Fishing (visitors) Southeast FL 4.32 27.85 16.09 For maintaining reefs, per user day on artificial reefs
CV 2000 20.43 Johns et al. (2001)
Fishing (residents) Southeast FL 2.62 3.42 3.02 For maintaining reefs, per user day on artificial reefs
CV 2000 3.84 Johns et al. (2001)
Fishing Southeast FL 1.8 38.59 14.57 Annual CS for new artificial reef site TC 1985 29.59 Milon (1988)
Notes: 1
Mean catch/trip/angler is 3.55 redfish and spotted seatrout. * Incl. small sharks, sea bass, kingfish, black drum, snapper, grouper, mullet, toadfish, sheepshead, pinfish and others). Southeastern US = NC to LA
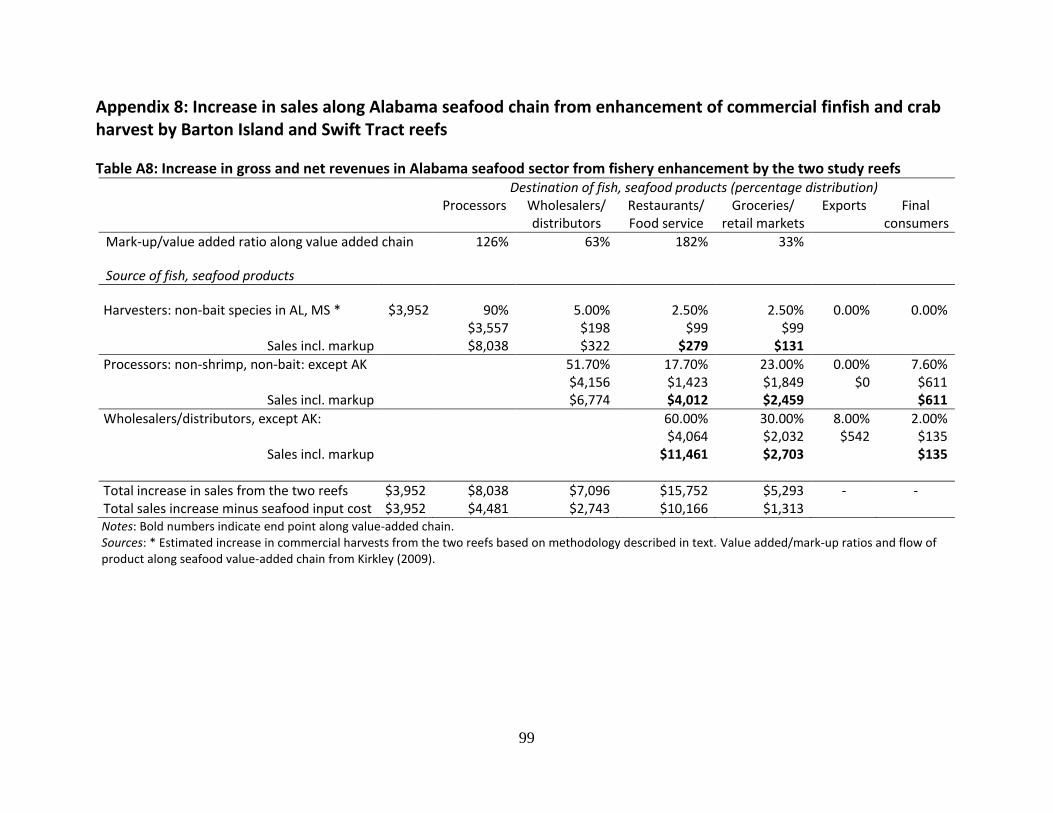
99
Appendix 8: Increase in sales along Alabama seafood chain from enhancement of commercial finfish and crab harvest by Barton Island and Swift Tract reefs
Table A8: Increase in gross and net revenues in Alabama seafood sector from fishery enhancement by the two study reefs Destination of fish, seafood products (percentage distribution) Processors Wholesalers/ Restaurants/ Groceries/ Exports Final distributors Food service retail markets consumers
Mark-up/value added ratio along value added chain 126% 63% 182% 33%
Source of fish, seafood products
Harvesters: non-bait species in AL, MS * $3,952 90% 5.00% 2.50% 2.50% 0.00% 0.00% $3,557 $198 $99 $99
Sales incl. markup $8,038 $322 $279 $131
Processors: non-shrimp, non-bait: except AK 51.70% 17.70% 23.00% 0.00% 7.60% $4,156 $1,423 $1,849 $0 $611
Sales incl. markup $6,774 $4,012 $2,459 $611
Wholesalers/distributors, except AK: 60.00% 30.00% 8.00% 2.00% $4,064 $2,032 $542 $135
Sales incl. markup $11,461 $2,703 $135
Total increase in sales from the two reefs $3,952 $8,038 $7,096 $15,752 $5,293 - - Total sales increase minus seafood input cost $3,952 $4,481 $2,743 $10,166 $1,313 Notes: Bold numbers indicate end point along value-added chain. Sources: * Estimated increase in commercial harvests from the two reefs based on methodology described in text. Value added/mark-up ratios and flow of product along seafood value-added chain from Kirkley (2009).
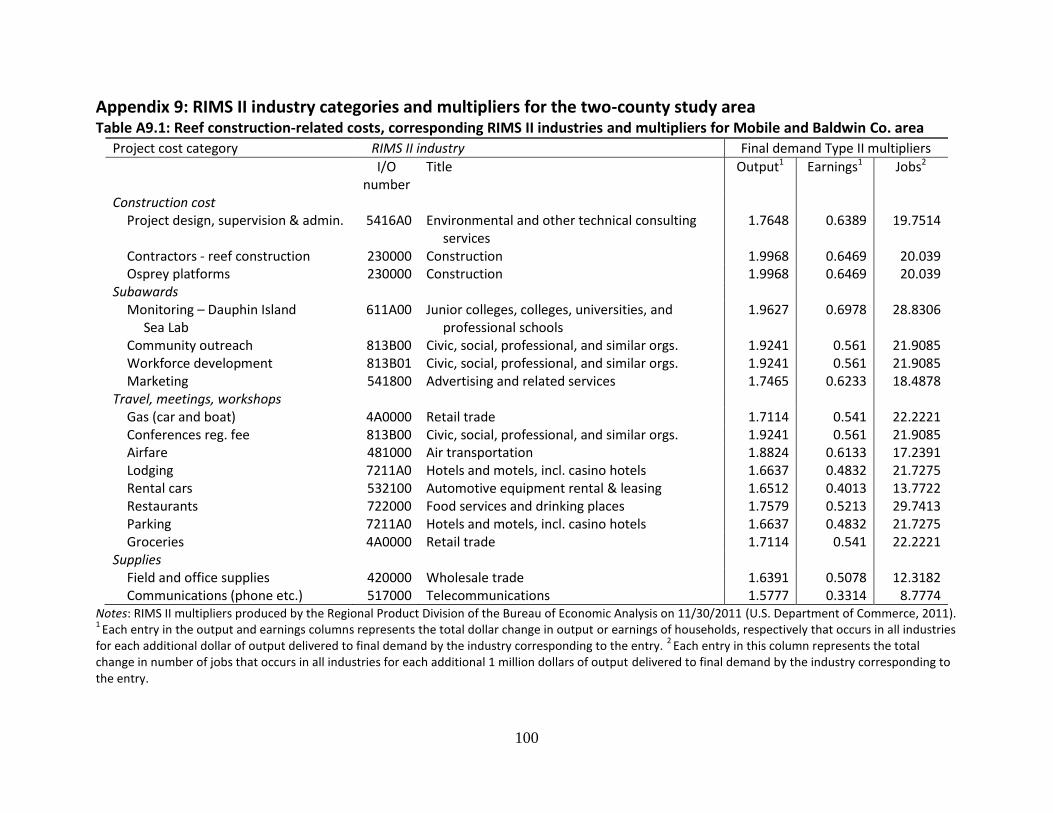
100
Appendix 9: RIMS II industry categories and multipliers for the two-county study area Table A9.1: Reef construction-related costs, corresponding RIMS II industries and multipliers for Mobile and Baldwin Co. area
Project cost category RIMS II industry Final demand Type II multipliers
I/O number
Title Output1 Earnings1 Jobs2
Construction cost Project design, supervision & admin. 5416A0
Environmental and other technical consulting
services 1.7648 0.6389 19.7514
Contractors - reef construction 230000 Construction 1.9968 0.6469 20.039 Osprey platforms 230000 Construction 1.9968 0.6469 20.039
Subawards Monitoring – Dauphin Island Sea Lab
611A00
Junior colleges, colleges, universities, and professional schools
1.9627 0.6978 28.8306
Community outreach 813B00 Civic, social, professional, and similar orgs. 1.9241 0.561 21.9085 Workforce development 813B01 Civic, social, professional, and similar orgs. 1.9241 0.561 21.9085 Marketing 541800 Advertising and related services 1.7465 0.6233 18.4878
Travel, meetings, workshops Gas (car and boat) 4A0000 Retail trade 1.7114 0.541 22.2221 Conferences reg. fee 813B00 Civic, social, professional, and similar orgs. 1.9241 0.561 21.9085 Airfare 481000 Air transportation 1.8824 0.6133 17.2391 Lodging 7211A0 Hotels and motels, incl. casino hotels 1.6637 0.4832 21.7275 Rental cars 532100 Automotive equipment rental & leasing 1.6512 0.4013 13.7722 Restaurants 722000 Food services and drinking places 1.7579 0.5213 29.7413 Parking 7211A0 Hotels and motels, incl. casino hotels 1.6637 0.4832 21.7275 Groceries 4A0000 Retail trade 1.7114 0.541 22.2221
Supplies Field and office supplies 420000 Wholesale trade 1.6391 0.5078 12.3182 Communications (phone etc.) 517000 Telecommunications 1.5777 0.3314 8.7774
Notes: RIMS II multipliers produced by the Regional Product Division of the Bureau of Economic Analysis on 11/30/2011 (U.S. Department of Commerce, 2011). 1
Each entry in the output and earnings columns represents the total dollar change in output or earnings of households, respectively that occurs in all industries for each additional dollar of output delivered to final demand by the industry corresponding to the entry.
2 Each entry in this column represents the total
change in number of jobs that occurs in all industries for each additional 1 million dollars of output delivered to final demand by the industry corresponding to the entry.
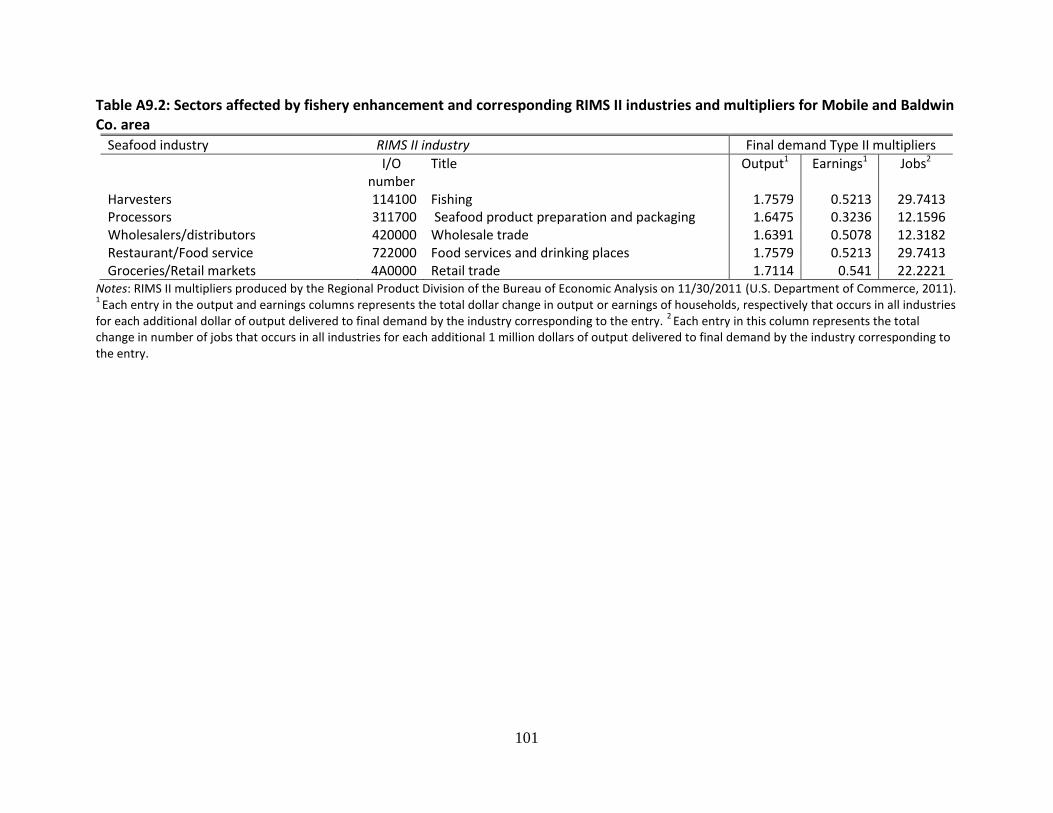
101
Table A9.2: Sectors affected by fishery enhancement and corresponding RIMS II industries and multipliers for Mobile and Baldwin Co. area
Seafood industry RIMS II industry Final demand Type II multipliers
I/O number
Title Output1 Earnings1 Jobs2
Harvesters 114100 Fishing 1.7579 0.5213 29.7413 Processors 311700 Seafood product preparation and packaging 1.6475 0.3236 12.1596 Wholesalers/distributors 420000 Wholesale trade 1.6391 0.5078 12.3182 Restaurant/Food service 722000 Food services and drinking places 1.7579 0.5213 29.7413 Groceries/Retail markets 4A0000 Retail trade 1.7114 0.541 22.2221
Notes: RIMS II multipliers produced by the Regional Product Division of the Bureau of Economic Analysis on 11/30/2011 (U.S. Department of Commerce, 2011). 1
Each entry in the output and earnings columns represents the total dollar change in output or earnings of households, respectively that occurs in all industries for each additional dollar of output delivered to final demand by the industry corresponding to the entry.
2 Each entry in this column represents the total
change in number of jobs that occurs in all industries for each additional 1 million dollars of output delivered to final demand by the industry corresponding to the entry.