Embed Size (px)
Citation preview

Economic Benefit Analysis of the Navajo Generating Station to the Central Arizona Water Conservation District and Its Customers
January 2018
Prepared by:
ENERGY VENTURES ANALYSIS
ENER
GY
VEN
TUR
ES A
NA
LYSI
S JA
NU
AR
Y 2
01
8
1901 N. Moore Street 703-276-8900 Suite 1200 www.evainc.com Arlington, VA 22209-1706 © 2018 Energy Ventures Analysis

ANALYSIS OF NAVAJO GENERATING STATION JANUARY 2018
© 2018 ENERGY VENTURES ANALYSIS 2
Key EVA Study Findings The Central Arizona Water Conservation District (CAWCD) has saved almost $900 million by purchasing
power from the Navajo Generating Station (NGS) since 2001;
NGS will save $370 million in future CAWCD power costs through 2030;
NGS has driven down Central Arizona Project (CAP) M&I water rates by as much as 45% since 2001;
Without NGS, CAP water rates to M&I customers will increase an average of 30% over the next 10 years;
NGS decommissioning costs would range from $109 million to $151 million over three years in addition to
CAWCD’s remaining debt repayment obligation estimated at $1.1 billion through 2044; and
If NGS is prematurely retired, full replacement capacity is estimated at nearly $2 billion.
Executive Summary The Navajo Generating Station (NGS) was sanctioned by the U.S. Congress in the late 1960s to provide a stable, long-
term power source for the Central Arizona Project (CAP) and bring jobs and revenues to tribal communities in northern Arizona. CAP is a massive federal infrastructure project developed to move water across the central and southern parts of the state to sustain and grow the economy.
Power from NGS pumps CAP water uphill through a complex system of canals that deliver the state’s share of Colorado River water to metropolitan areas including Phoenix, Casa Grande and Tucson. The CAP spans over 335 miles and is the state’s largest power user.
In 1968, President Lyndon Johnson authorized construction of the CAP, and the following year, the U.S. Secretary of the Interior determined that the most economical plan to supply the electric power needed for the CAP was by building a thermal power plant on tribal lands using tribally-owned coal. In 1971, the Central Arizona Water Conservation District (CAWCD) was formed to manage the CAP and to create one single entity to pay back the federal loan to the U.S. Bureau of Reclamation (BOR). In 1974, the first NGS unit came online.
For decades, NGS has been one of the most economic electric generating resources in the Desert Southwest Power Pool (DSW), delivering enormous savings to the CAWCD. By purchasing electricity from NGS rather than on the open market, Energy Ventures Analysis (EVA) estimates that CAWCD has saved almost $900 million over the 16-year period ending in 2016, or approximately $50 million each year.
EVA projects that continued operation of NGS will yield an additional $370 million in cost savings to CAWCD if it continues to purchase electricity from NGS through 2030.
The competitiveness of NGS has kept CAP water rates to municipal and industrial (M&I) customers as much as 45 percent lower than if CAWCD had purchased its power on the open market over the last 16 years. According to EVA’s analysis, water rates to CAWCD’s M&I customers would increase by more than 30 percent on average over the next ten years, should NGS close at the end of 2019.
ANALYSIS OF NAVAJO GENERATING STATION JANUARY 2018
© 2018 ENERGY VENTURES ANALYSIS 3
For the last 16 years, NGS’s capacity utilization rate has averaged just under 85 percent, well above the U.S. fleet average of 62 percent. Because the plant uses locally-sourced coal from the nearby Kayenta Mine, EVA believes that it has been and will continue to be one of the lowest-cost and most competitive baseload resources in the DSW region.
Based on rising natural gas prices and a tightening supply-demand balance, EVA forecasts that NGS will remain competitive in the DSW market with a utilization rate in the low- to mid-80 percent range through 2030.
Beyond the savings that CAWCD realizes by purchasing electricity from NGS, the significant financial obligations that CAWCD has to the U.S. Bureau of Reclamation related to the plant’s construction and decommissioning costs must also be considered. According to CAWCD documents presented at their November 16, 2017 board meeting, the decommissioning costs are projected to range from $109 million to $151 million, likely spread out over three years following the retirement in 2019. CAWCD’s repayment obligation is estimated at $1.1 billion over the next 28 years or annual payments of $50 million to $60 million. CAWCD’s customers would see significant increases in water rates and additional taxes to recover the decommissioning costs and any lost revenue from NGS that was used for the debt repayment obligation, should NGS retire at the end of 2019.
EVA’s analysis concludes that if NGS were to retire prematurely, incremental capacity would be needed in the region in the 2020s as reserve margins dwindle to below reliable levels. This capacity would likely come in the form of a gas-fired combined cycle plant, which EVA estimates will cost more than $700 million for 850 MW of capacity in 2025. If NGS were replaced with combined cycle gas turbine capacity on a 1:1 basis, the cost would be nearly $2 billion.
Conclusion Allowing NGS to be retired 20 years early would result in an increased cost of power for the CAWCD, higher water
rates to CAWCD customers and unnecessary capital costs for constructing replacement capacity.
NGS has proven to be a reliable and cost-effective source of electricity. This report demonstrates that the plant will continue to be very cost-effective for years to come.
This study was commissioned by Peabody.

ANALYSIS OF NAVAJO GENERATING STATION JANUARY 2018
© 2018 ENERGY VENTURES ANALYSIS 4
Table of Contents
Overview ................................................................................................................................................................ 5
Navajo Generating Station ............................................................................................................................................... 5
Central Arizona Project .................................................................................................................................................... 5
CAWCD Financial Obligation to the U.S. Bureau of Reclamation .................................................................................... 6
Debt Repayment .......................................................................................................................................................... 6
Operation and Maintenance of Navajo Generating Station ........................................................................................ 6
Historical Cost & Performance of NGS and its Benefit to CAWCD .............................................................................. 7
Current Versus Future Market Conditions Affecting NGS ........................................................................................ 11
Appendix .............................................................................................................................................................. 18
Methodology .................................................................................................................................................................. 18
Key Price Inputs .............................................................................................................................................................. 18
List of Exhibits EXHIBIT 1: CURRENT NGS OWNERSHIP SHARE BY COMPANY ............................................................................................. 5
EXHIBIT 2: CAWCD DEBT REPAYMENT SCHEDULE TO THE U.S. BOR ................................................................................... 6
EXHIBIT 3: CAWCD’S HISTORICAL NGS PURCHASES AND ENERGY RATE ............................................................................. 7
EXHIBIT 4: HISTORICAL PERFORMANCE OF NAVAJO GENERATING STATION ...................................................................... 8
EXHIBIT 5: HISTORICAL PALO VERDE AND SOCAL BORDER PRICES ..................................................................................... 9
EXHIBIT 6: HISTORICAL COMPARISON OF DAILY PALO VERDE PRICE AND NGS COST......................................................... 9
EXHIBIT 7: TOTAL COST TO CAWCD FOR PUMPING WATER AND DEBT REPAYMENT ....................................................... 10
EXHIBIT 8: CUMULATIVE COST SAVINGS CAWCD HAS REALIZED BY PURCHASING ELECTRICITY FROM NGS ................... 11
EXHIBIT 9: NGS HISTORICAL AND FORECASTED OPERATION PROFILE .............................................................................. 12
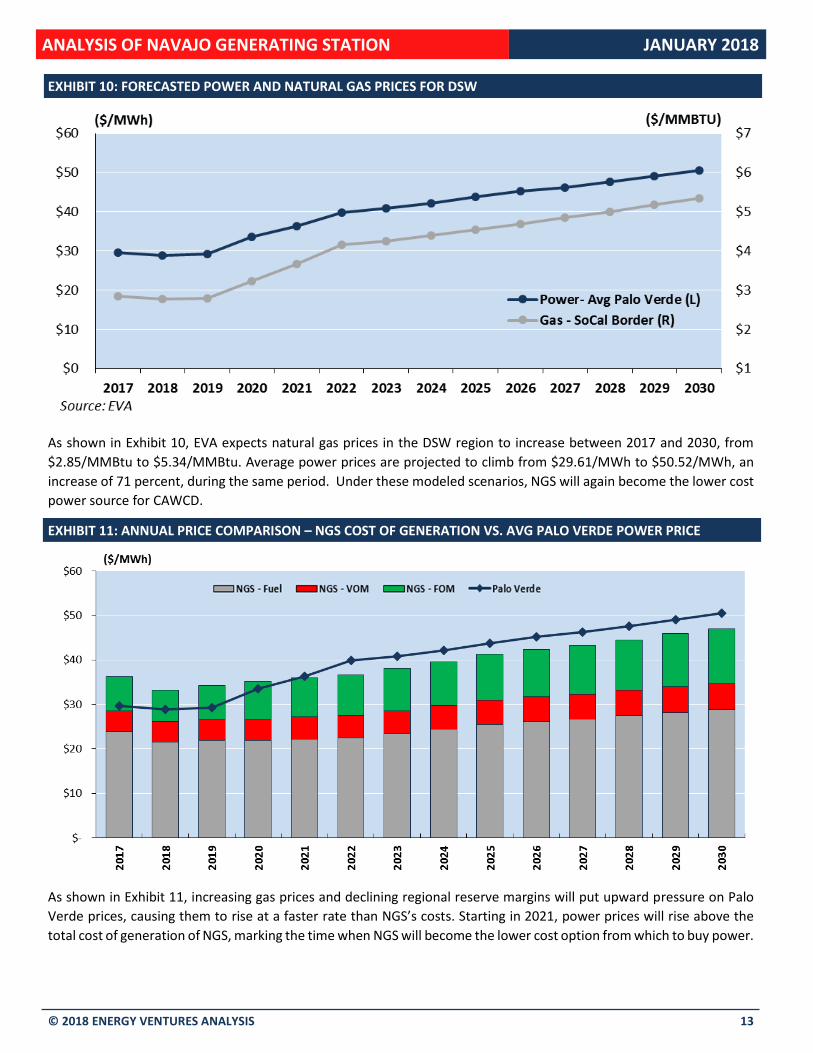
EXHIBIT 10: FORECASTED POWER AND NATURAL GAS PRICES FOR DSW ......................................................................... 13
EXHIBIT 11: ANNUAL PRICE COMPARISON – NGS COST OF GENERATION VS. PALO VERDE POWER PRICE ..................... 13
EXHIBIT 12: TOTAL COST TO CAWCD WITH CONTINUED NGS OPERATION VS. NGS RETIREMENT ................................... 14
EXHIBIT 13: ENERGY RATE + ADDITIONAL CAPITAL CHARGES TO CAWCD M&I CUSTOMERS........................................... 15
EXHIBIT 14: CUMULATIVE SAVINGS OF CONTINUED NGS OPERATION VS. RETIREMENT ................................................. 16
EXHIBIT 15: DSW RESERVE MARGIN PROJECTIONS WITH NGS RETIREMENT ................................................................... 17
EXHIBIT 16: PRICE INPUTS FOR CAWCD FINANCIAL MODEL FOR SELECT YEARS .............................................................. 18

ANALYSIS OF NAVAJO GENERATING STATION JANUARY 2018
© 2018 ENERGY VENTURES ANALYSIS 5
Overview
Responding to recent changes in market conditions in the Desert Southwest Power Pool, Navajo Generating Station
(NGS) plant owners have called into question the economic viability of NGS and recently have announced plans to
prematurely retire NGS at the end of 2019. This is more than two decades before the end of the plant’s economic useful
life in 2044. According to NGS owners and the Central Arizona Water Conservation District (CAWCD), the managing
entity of the Central Arizona Project (CAP), the significant decline in natural gas prices over the last several years and
the resulting decline in regional power prices will make market purchases seem more attractive than purchasing energy
from NGS. This report illustrates why this position is short-sighted and not in the best interests of many stakeholders.
Navajo Generating Station The NGS is a coal-fueled electric power plant located on Navajo Nation lands near Page, Arizona. The plant began
commercial operations in 1974 and is comprised of three 750-MW generating units, which are owned jointly by the U.S.
Bureau of Reclamation (BOR), the Salt River Project (SRP), Arizona Public Service Company (APS), NV Energy, and Tucson
Electric Power (TEP). The current ownership share by company is provided in Exhibit 1.
EXHIBIT 1: CURRENT NGS OWNERSHIP SHARE BY COMPANY
Central Arizona Project The 1968 Colorado River Basin Project Act aimed to bring economic prosperity to Arizona citizens and its tribal
communities by pumping water of the Colorado river uphill to the Phoenix, Casa Grande, and Tucson areas. In 1969, the
U.S. Secretary of the Interior determined that the most economical plan to supply the electric power needed for CAP
was to build a thermal power plant located on tribal lands using tribal coal. In 1974, the first NGS unit came online.
Besides providing the greater Phoenix, Casa Grande, and Tucson areas with much-needed water for irrigation, municipal,
and industrial purposes, NGS also provided a critical electricity supply in response to growing electricity demand in
Arizona, Nevada, and Southern California for the last 40-plus years.
CAWCD’s annual electric requirements have averaged just under 2,900 GWh over the past decade, the majority of which
has been provided by NGS. Between 2007 and 2015, NGS accounted for 82.5 percent of CAWCD’s electric needs. In
2016, however, CAWCD purchased more power from the open market, and NGS’s share of total energy purchases by
CAWCD declined to 49 percent.
% MW
U.S. Bureau of Reclamation 24.3% 547
Salt River Project 42.9% 965
Arizona Public Service 14.0% 315
NV Energy 11.3% 254
Tucson Electric Power 7.5% 169
TOTAL 100.0% 2,250
OwnershipCompany

ANALYSIS OF NAVAJO GENERATING STATION JANUARY 2018
© 2018 ENERGY VENTURES ANALYSIS 6
CAWCD Financial Obligation to the U.S. Bureau of Reclamation
Debt Repayment In 1971, at the request of the U.S. Secretary of the Interior, CAWCD was created to manage the CAP and to provide a
single entity to repay the federal government for the reimbursable costs of construction and contract for the delivery
of CAWCD water. By far the most significant cost items were the construction and operation of NGS and the CAWCD
water pumping system from the Colorado River. The initial total CAWCD Repayment Obligation was settled at $1.6
billion. CAWCD’s remaining repayment obligation to the Bureau of Reclamation from 2017 through 2044 is $1.1 billion.
The debt repayment schedule from 2008 until 2030 is shown in Exhibit 2.
EXHIBIT 2: CAWCD DEBT REPAYMENT SCHEDULE TO THE U.S. BOR
Operation and Maintenance of Navajo Generating Station The BOR charges CAWCD the full fixed cost for operating and maintaining the BOR’s share of NGS annually, regardless
of the amount of energy purchased for water pumping needs. Therefore, the energy rates for NGS to CAWCD consist of
~24 percent of NGS’s fixed costs plus the variable cost (fuel and consumables) of power generation for the amount
purchased by CAWCD for pumping needs. As a result, CAWCD’s power rates for electricity bought from NGS are inversely
related to the amount of energy purchased.

ANALYSIS OF NAVAJO GENERATING STATION JANUARY 2018
© 2018 ENERGY VENTURES ANALYSIS 7
EXHIBIT 3: CAWCD’S HISTORICAL NGS PURCHASES AND ENERGY RATE
As shown in Exhibit 3, the amount of electricity that CAWCD purchased from NGS, as well as the power rate, were
roughly flat between 2007 and 2015. In 2016, as CAWCD energy purchases from NGS dropped from 88 percent in 2015
to 49 percent in 2016, the corresponding power rate spiked 42 percent, from $37/MWh to more than $52/MWh, due
to the inclusion of NGS’s fixed costs. Therefore, the more energy CAWCD purchases from NGS to cover their energy
needs to pump the water, the more economic NGS becomes.
Historical Cost & Performance of NGS and its Benefit to CAWCD For decades, NGS has been one of the most economic electric generating resources in the Desert Southwest Power Pool
(DSW). Over the last 16 years, NGS’s capacity utilization rate has averaged just under 85 percent, as shown in Exhibit 4,
which compares to the DSW fleet capacity factor of 75 percent.

ANALYSIS OF NAVAJO GENERATING STATION JANUARY 2018
© 2018 ENERGY VENTURES ANALYSIS 8
EXHIBIT 4: HISTORICAL PERFORMANCE OF NAVAJO GENERATING STATION
The plant’s high capacity utilization rate indicates that NGS is the most economical option for the CAWCD and the other
plant utility owners. Even when power prices (and CAWCD energy purchases from NGS) dropped to historically low
levels in 2016, NGS’s capacity factor remained well above 60 percent and will likely rebound to 70 percent this year.
The primary driver of CAWCD’s decision to increase its energy purchases from the open market in 2016 at the expense
of NGS was the decline in wholesale power prices driven by lower natural gas prices. Exhibit 5 shows annual average
power prices for the past sixteen years at the Palo Verde hub, the most liquid trading point in the region, as well as
regional natural gas prices. The chart shows how annual power prices have declined from a high of $64/MWh in 2001
to a low of $24/MWh in 2016, following the same trend as natural gas. During this time, the cost CAWCD paid to NGS
for electricity drifted upward from less than $20/MWh in 2001 to $32/MWh in 2014 before jumping sharply to
$52/MWh in 2016, though this number is inflated due to much-reduced energy purchases from the plant.

ANALYSIS OF NAVAJO GENERATING STATION JANUARY 2018
© 2018 ENERGY VENTURES ANALYSIS 9
EXHIBIT 5: HISTORICAL PALO VERDE AND SOCAL BORDER PRICES
Exhibit 6 contains historical daily prices for the last decade at the Palo Verde hub alongside historical prices for NGS.
The data indicate that between 2001 and 2017, daily average prices at Palo Verde were more expensive than the cost
to dispatch NGS on 3,519 days, or 86.3 percent of the time (note that only trading days are being considered - ~66
percent of total number of days).
EXHIBIT 6: HISTORICAL COMPARISON OF DAILY PALO VERDE PRICE AND NGS COST
In addition to the energy cost savings that CAWCD realized by purchasing from NGS, it also received a benefit from
incremental revenues earned through selling surplus power from NGS into the open market. These revenues help offset
the debt repayment that CAWCD makes to the U.S. Bureau of Reclamation and further improve the economics of NGS

ANALYSIS OF NAVAJO GENERATING STATION JANUARY 2018
© 2018 ENERGY VENTURES ANALYSIS 10
as an option. Exhibit 7 shows the total cost to the CAWCD for its energy needs for pumping water and its debt repayment
to the BOR, with and without the cumulative benefits of NGS.
EXHIBIT 7: TOTAL COST TO CAWCD FOR PUMPING WATER AND DEBT REPAYMENT
As shown in Exhibit 7, CAWCD has saved an average of more than $50 million per year over the last sixteen years (2001-
2016) by purchasing most of their energy needs from NGS, while also taking advantage of other NGS-related revenue
streams. Due to historically low wholesale power prices and CAWCD’s decision to only purchase 49 percent of its energy
needs from NGS, 2016 marks the only year in which CAWCD would have saved money by satisfying all of its energy
requirements through the regional electricity market rather than through NGS. Exhibit 8 shows the cumulative savings
to CAWCD over the past sixteen years by purchasing electricity from NGS rather than from the open market.
ANALYSIS OF NAVAJO GENERATING STATION JANUARY 2018
© 2018 ENERGY VENTURES ANALYSIS 11
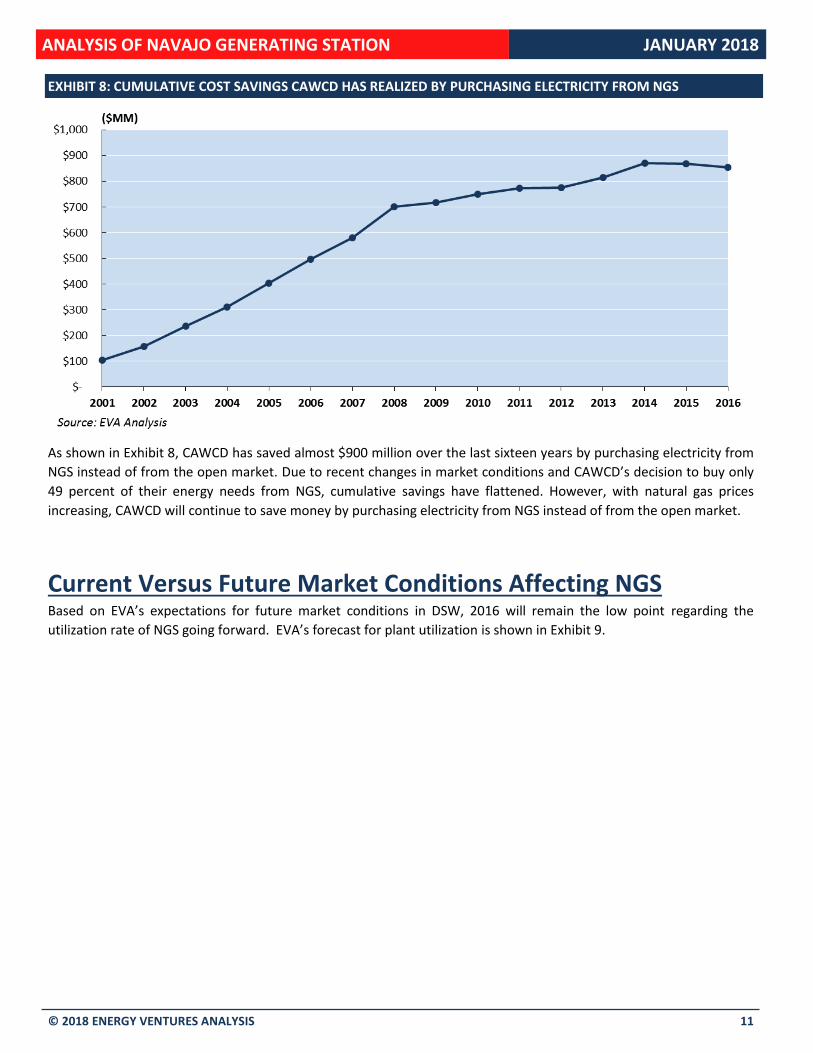
EXHIBIT 8: CUMULATIVE COST SAVINGS CAWCD HAS REALIZED BY PURCHASING ELECTRICITY FROM NGS
As shown in Exhibit 8, CAWCD has saved almost $900 million over the last sixteen years by purchasing electricity from
NGS instead of from the open market. Due to recent changes in market conditions and CAWCD’s decision to buy only
49 percent of their energy needs from NGS, cumulative savings have flattened. However, with natural gas prices
increasing, CAWCD will continue to save money by purchasing electricity from NGS instead of from the open market.
Current Versus Future Market Conditions Affecting NGS Based on EVA’s expectations for future market conditions in DSW, 2016 will remain the low point regarding the
utilization rate of NGS going forward. EVA’s forecast for plant utilization is shown in Exhibit 9.

ANALYSIS OF NAVAJO GENERATING STATION JANUARY 2018
© 2018 ENERGY VENTURES ANALYSIS 12
EXHIBIT 9: NGS HISTORICAL AND FORECASTED OPERATION PROFILE
With the scenario of the retirement of NGS unit 1 at the end of 2019, total plant generation will drop by 25 percent.
However, with increasing natural gas prices, NGS’s capacity factor will quickly return to historical levels and remain in
the low- to mid-80 percent range throughout the forecast period. Because the plant uses locally sourced coal from the
nearby Kayenta Mine, it has consistently been and will continue to be one of the lowest-cost and most competitive
resources in the DSW region.
EVA’s commodity price forecasts for DSW indicate that the market conditions that drove power prices to historic-lows
in 2016 will not continue. EVA forecasts power market operations using Aurora, an hourly electric dispatch model that
incorporates fuel prices, electricity demand, and existing electric supply to project plant-level performance and
wholesale power prices, among other things.
ANALYSIS OF NAVAJO GENERATING STATION JANUARY 2018
© 2018 ENERGY VENTURES ANALYSIS 13
EXHIBIT 10: FORECASTED POWER AND NATURAL GAS PRICES FOR DSW
As shown in Exhibit 10, EVA expects natural gas prices in the DSW region to increase between 2017 and 2030, from
$2.85/MMBtu to $5.34/MMBtu. Average power prices are projected to climb from $29.61/MWh to $50.52/MWh, an
increase of 71 percent, during the same period. Under these modeled scenarios, NGS will again become the lower cost
power source for CAWCD.
EXHIBIT 11: ANNUAL PRICE COMPARISON – NGS COST OF GENERATION VS. AVG PALO VERDE POWER PRICE
As shown in Exhibit 11, increasing gas prices and declining regional reserve margins will put upward pressure on Palo
Verde prices, causing them to rise at a faster rate than NGS’s costs. Starting in 2021, power prices will rise above the
total cost of generation of NGS, marking the time when NGS will become the lower cost option from which to buy power.

ANALYSIS OF NAVAJO GENERATING STATION JANUARY 2018
© 2018 ENERGY VENTURES ANALYSIS 14
Going forward, the BOR will have to decide what to do with its share in NGS. This decision will largely depend on
CAWCD’s decision on where it will source its future power. If NGS retires, CAWCD will be responsible for the BOR’s
share of the plant’s decommissioning costs. According to CAWCD documents, the decommissioning costs are projected
to be $109 million to $151 million, likely spread out over three years following the retirement in 2019. Accounting for
the decommissioning costs and the improving market conditions for NGS, continued operations of NGS versus its full
retirement should be the preferred alternative for CAWCD.
EXHIBIT 12: TOTAL COST TO CAWCD WITH CONTINUED NGS OPERATION VS. NGS RETIREMENT
As shown in Exhibit 12, CAWCD is projected to save an average of $26 million per year between 2023 and 2030 when
compared to the retirement and decommissioning of all three units at NGS.
Should NGS retire at the end of 2019, any and all potential savings will be more than offset by the loss of NGS-related
revenue that is being used for debt repayment to the BOR. Currently, the only possibility to recoup these lost NGS-
related debt repayment revenues is through increases in capital charges for CAWCD’s municipal and industrial (M&I)
customers. The historical and projected energy rate to CAWCD’s M&I customers and the additional capital charges to
recoup the lost revenue is shown in Exhibit 13.

ANALYSIS OF NAVAJO GENERATING STATION JANUARY 2018
© 2018 ENERGY VENTURES ANALYSIS 15
EXHIBIT 13: ENERGY RATE + ADDITIONAL CAPITAL CHARGES TO CAWCD M&I CUSTOMERS
As shown in Exhibit 13, without NGS and its related revenues to repay the debt to the BOR, CAWCD’s M&I customers
would have seen water charges on average almost double over actual rates since 2001. And since M&I customers would
carry the sole responsibility to cover the lost revenues related to the operation of NGS if NGS is prematurely retired at
the end of 2019, water charges to CAWCD M&I customers would be higher by more than 30 percent for the next ten
years.
Since CAWCD is charged the full BOR share of fixed costs of NGS regardless of how much electricity they purchase, the
annual and cumulative savings are substantially dependent on the percentage of its energy requirements that CAWCD
purchases from NGS, as shown in Exhibit 14.

ANALYSIS OF NAVAJO GENERATING STATION JANUARY 2018
© 2018 ENERGY VENTURES ANALYSIS 16
EXHIBIT 14: CUMULATIVE SAVINGS OF CONTINUED NGS OPERATION VS. RETIREMENT
It is more financially advantageous for CAWCD and its customers to procure a higher amount of electricity from NGS, as
shown in Exhibit 14. The higher the amount of energy purchases from NGS, the higher the savings to CAWCD. Should
CAWCD decide to return to pre-2016 purchase levels, when approximately 90 percent of its energy needs were sourced
from NGS, CAWCD customers will save almost $370 million through 2030. On the other hand, should CAWCD continue
to purchase only 50 percent of its energy needs from NGS, as it did in 2016, these cumulative savings are less than $40
million through 2030.
Further, if NGS were to retire, incremental capacity would eventually be needed in the region as reserve margins
continue to dwindle. Expected reserve margins for DSW are shown in Exhibit 15 and indicate that in the absence of new
builds, the region could experience a capacity shortfall by 2023. Higher peak demand growth could accelerate this
timeframe. NGS’s replacement capacity would likely come in the form of a combined cycle gas turbine (CCGT) with
dispatch costs above those of NGS. EVA estimates that a new CCGT would cost roughly $700 million in the mid-2020s.
Because gas prices are expected to approach $4/MMBtu during that time, the plant’s dispatch cost would likely be close
to $30/MWh, well above that of NGS.

ANALYSIS OF NAVAJO GENERATING STATION JANUARY 2018
© 2018 ENERGY VENTURES ANALYSIS 17
EXHIBIT 15: DSW RESERVE MARGIN PROJECTIONS WITH NGS RETIREMENT
Historically, CAWCD was able to buy from the open market with the knowledge that it had NGS as a fallback resource.
If NGS retires, CAWCD would likely be forced to enter into another agreement to ensure sufficient generating capacity
is available to cover its baseload energy needs. Depending on the type of resources are available, the new agreement
may be more expensive than CAWCD’s existing one with NGS.
-5%
0%
5%
10%
15%
20%
25%
30%
35%
2018 2019 2020 2021 2022 2023 2024 2025 2026 2027 2028 2029 2030
Existing Capacity Existing + New Capacity
DSW Reserve Margin - Retire Case
Source: EVA

ANALYSIS OF NAVAJO GENERATING STATION JANUARY 2018
© 2018 ENERGY VENTURES ANALYSIS 18
Appendix Methodology To estimate the cost components to the Central Arizona Water Conservation District (CAWCD) that are affected by the
operation of the Navajo Generating Station (NGS), EVA used the following formulas:
CAWCD Cost = CAWCD Energy Cost + CAWCD BOR Payment
CAWCD Cost only refers to costs that CAWCD incurs in connection with NGS. It does not include any admin costs, O&M
costs for the pumping facilities, etc.
CAWCD Energy Cost can be defined as follows:
CAWCD Energy Cost = CAWCD Energy Purchases + CAWCD Energy Rates
As shown above, CAWCD Energy Cost depends on the amount of energy purchased and the prevailing energy rates for
the different energy sources available to CAWCD. These include NGS, Hoover Dam, and market purchases from the
regional energy market.
CAWCD BOR Payment can be defined as follows:
CAWCD BOR Payment = Debt Payment + NGS Operating & Maintenance Cost – (NGS-related Revenues + non-NGS-related Revenues)
Debt Payment includes the principal and interest payments from CAWCD to the BOR for the construction of NGS and
the pumping system. The outstanding debt in 2017 was $1.109 billion. NGS Operating & Maintenance Cost includes all
costs related to the operation of NGS, including fixed, variable, and fuel cost. NGS-related Revenues include revenues
from the SRP power purchase agreement, surplus energy sales through the Western Area Power Administration, and
other miscellaneous NGS revenues. Non-NGS related Revenues refer to revenues independent of the operation and
existence of NGS, including transmission revenues, transmission line-loss revenue, and land-related revenues.
Key Price Inputs Exhibit 15 shows some of the key price inputs into the financial analysis of CAWCD cost and the source for each data
series.
EXHIBIT 16: PRICE INPUTS FOR CAWCD FINANCIAL MODEL FOR SELECT YEARS
Also, please note that ALL cost and prices figures presented in this report are in nominal dollars.
Unit Source 2020 2025 2030
SoCal Border Natural Gas Price $/MMBtu EVA - Natural Gas Model 3.02$ 4.54$ 5.34$
Avg. Palo Verde Power Price - w/NGS $/MWh EVA - Electric Power Dispatch Model 32.95$ 42.89$ 49.27$
Avg. Palo Verde Power Price - w/o NGS $/MWh EVA - Electric Power Dispatch Model 33.55$ 43.79$ 50.52$
NGS Cost of Generation
Fuel Cost $/MMBtu Peabody Energy 2.10$ 2.45$ 2.77$
Variable Cost $/MWh FERC Form-1 4.88$ 5.38$ 5.94$
Fixed Cost $/kW-yr FERC Form-1 59.75$ 71.86$ 83.97$
Note: all prices are shown in nominal $
Category