Embed Size (px)
Citation preview

Economic Assessment of IPM Programs
Scott M. Swinton
Dept. of Agricultural Economics
Michigan State University
4th National IPM Symposium, Indianapolis, Apr. 8-10, 2003
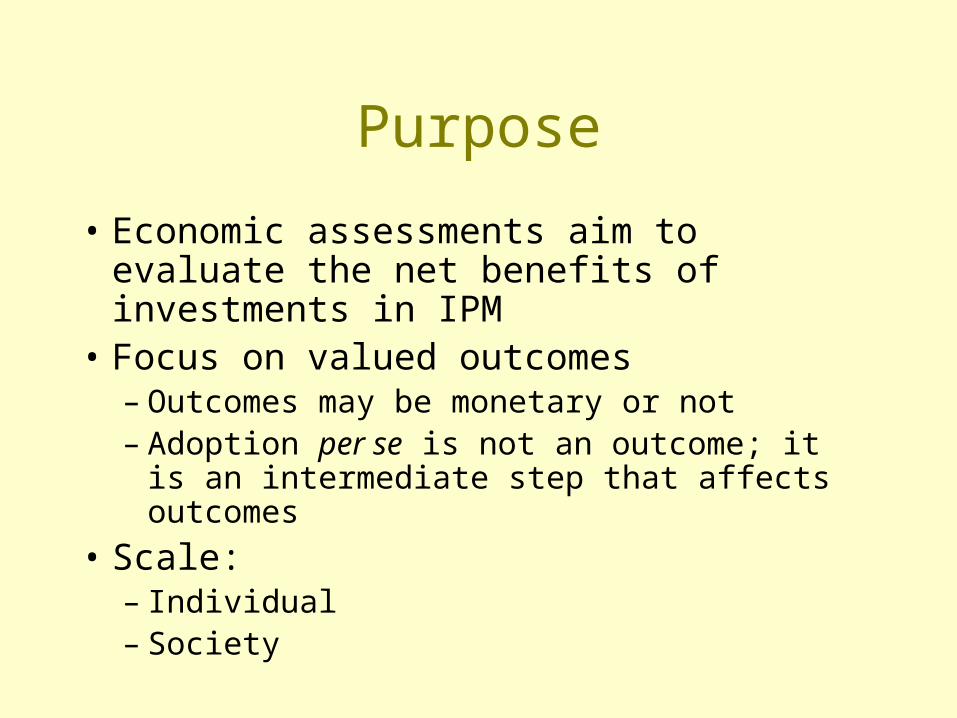
Purpose
• Economic assessments aim to evaluate the net benefits of investments in IPM
• Focus on valued outcomes– Outcomes may be monetary or not– Adoption per se is not an outcome; it is an
intermediate step that affects outcomes
• Scale:– Individual– Society
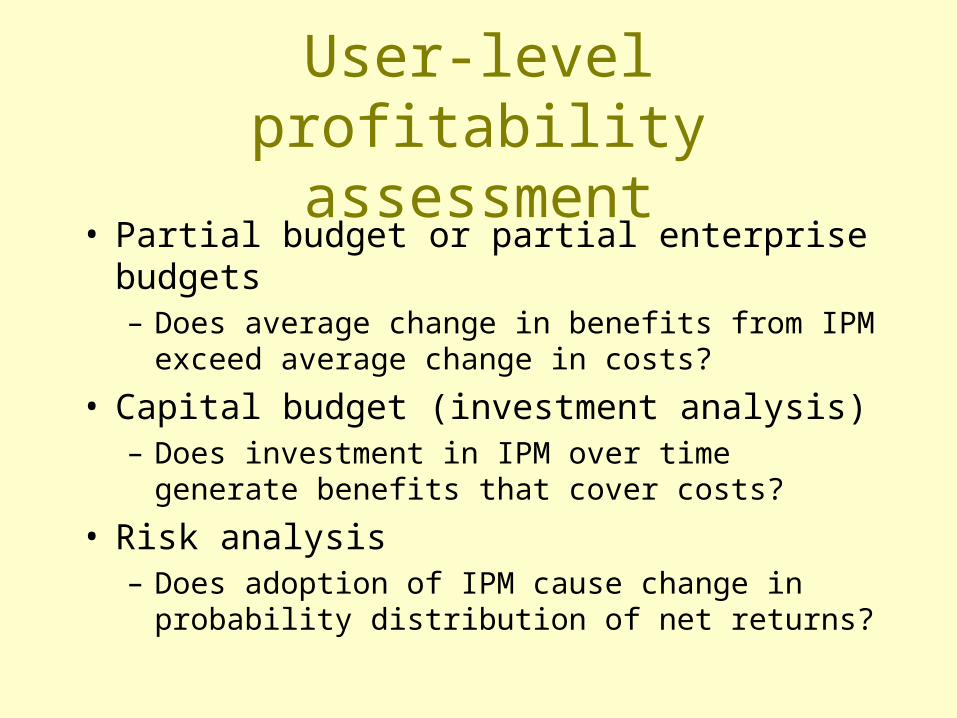
User-level profitability assessment
• Partial budget or partial enterprise budgets– Does average change in benefits from IPM exceed
average change in costs?
• Capital budget (investment analysis)– Does investment in IPM over time generate
benefits that cover costs?
• Risk analysis– Does adoption of IPM cause change in probability
distribution of net returns?
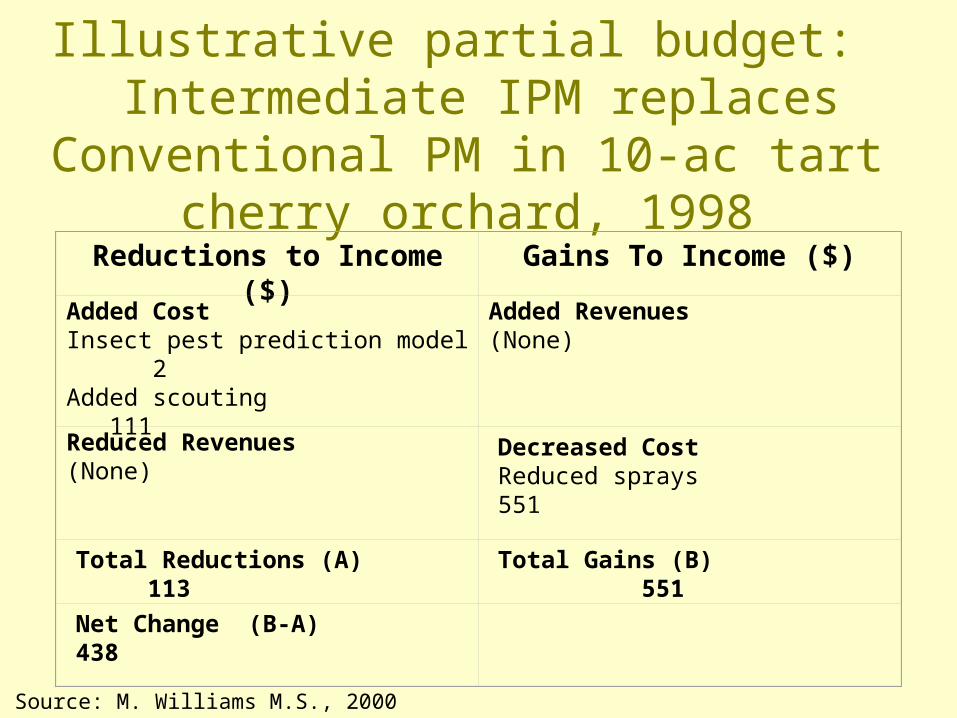
Illustrative partial budget: Intermediate IPM replaces Conventional
PM in 10-ac tart cherry orchard, 1998Reductions to Income ($) Gains To Income ($)
Added CostInsect pest prediction model 2Added scouting 111
Added Revenues(None)
Reduced Revenues(None)
Decreased CostReduced sprays 551
Total Reductions (A) 113 Total Gains (B) 551
Net Change (B-A) 438
Source: M. Williams M.S., 2000
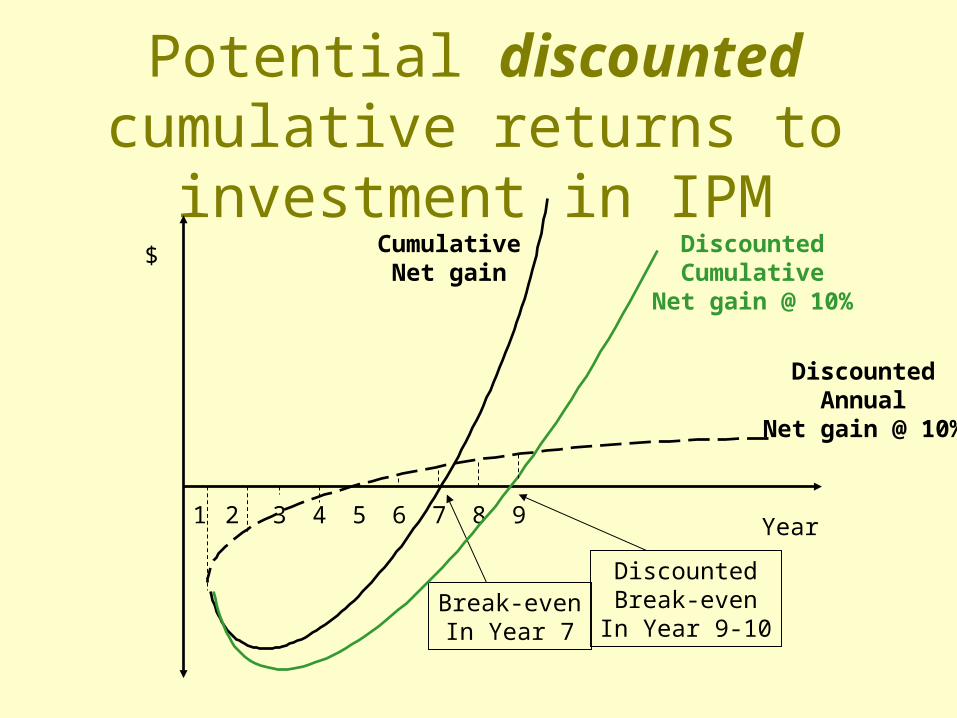
Potential discounted cumulative returns to investment in IPM
$
Year
DiscountedAnnual
Net gain @ 10%
1 2 3 4 5 6 7 8
CumulativeNet gain
Break-evenIn Year 7
DiscountedCumulative
Net gain @ 10%
DiscountedBreak-evenIn Year 9-10
9
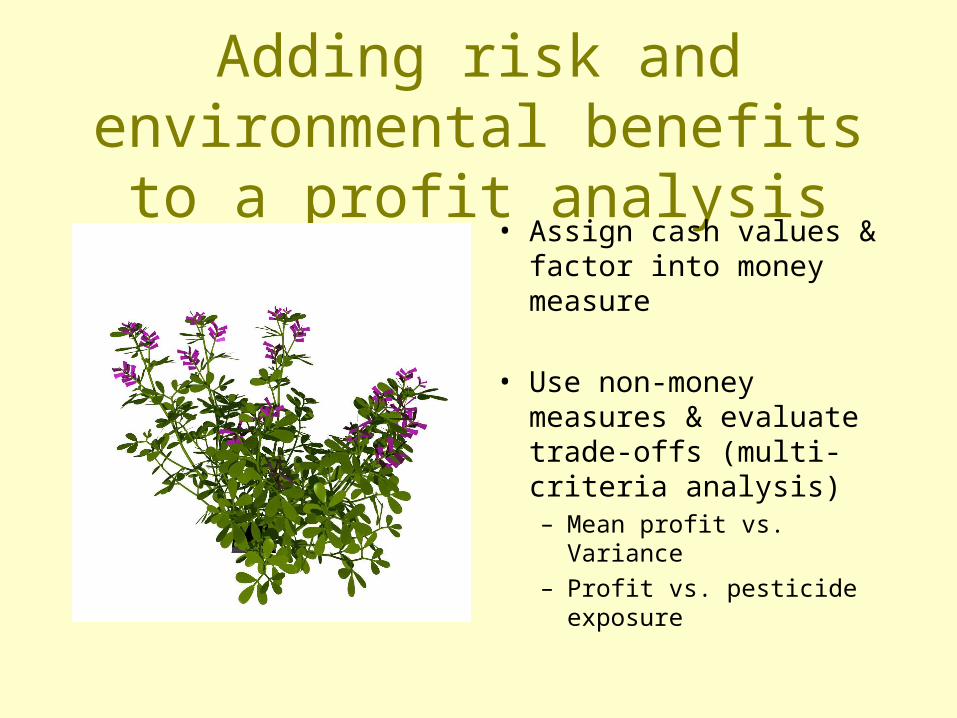
Adding risk and environmental benefits to a profit analysis
• Assign cash values & factor into money measure
• Use non-money measures & evaluate trade-offs (multi-criteria analysis)– Mean profit vs. Variance– Profit vs. pesticide exposure
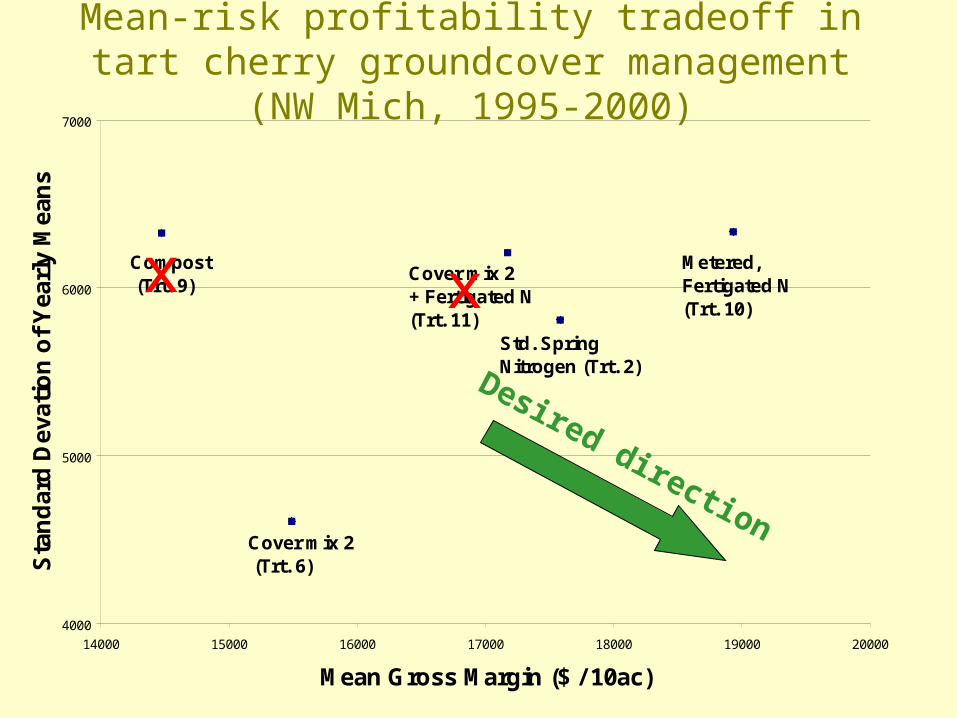
4000
5000
6000
7000
14000 15000 16000 17000 18000 19000 20000
Mean Gross Margin ($ / 10ac)
Sta
nd
ard
Dev
atio
n o
f Y
earl
y M
ean
s
Std. Spring Nitrogen (Trt. 2)
Cover mix 2 (Trt. 6)
Compost (Trt. 9)
Cover mix 2 + Fertigated N(Trt. 11)
Metered, Fertigated N(Trt. 10)
Mean-risk profitability tradeoff in tart cherry groundcover management (NW Mich, 1995-2000)
x x
Desired direction
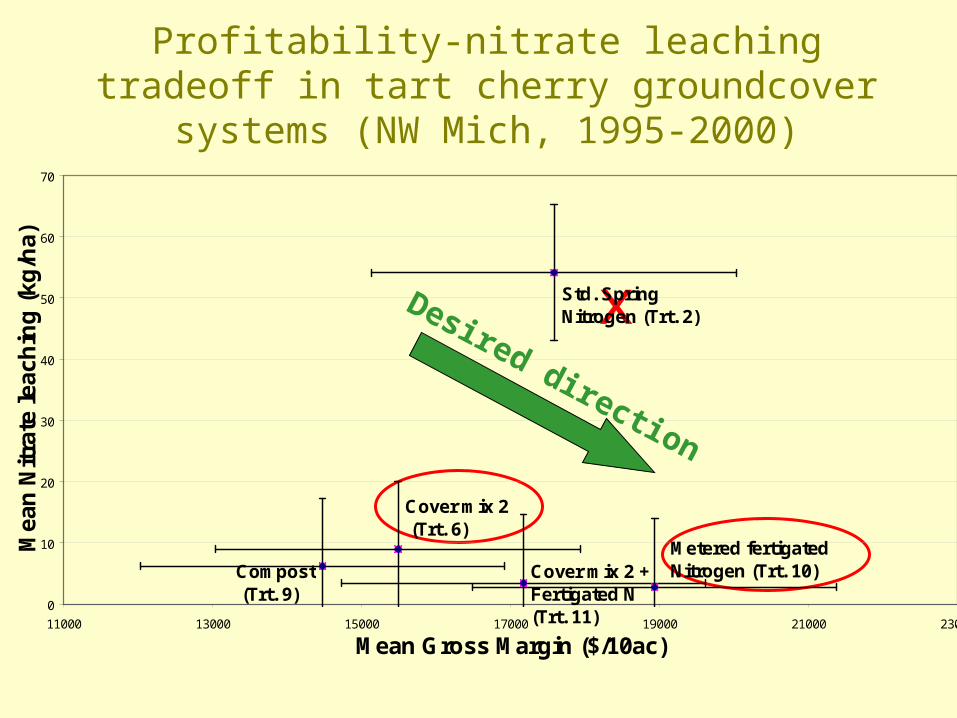
Profitability-nitrate leaching tradeoff in tart cherry groundcover systems (NW Mich, 1995-2000)
x
0
10
20
30
40
50
60
70
11000 13000 15000 17000 19000 21000 23000
Mean Gross Margin ($/10ac)
Mea
n N
itra
te l
each
ing
(kg
/ha)
Std. Spring Nitrogen (Trt. 2)
Metered fertigated Nitrogen (Trt. 10)Cover mix 2 +
Fertigated N (Trt. 11)
Compost (Trt. 9)
Cover mix 2 (Trt. 6)
Desired direction
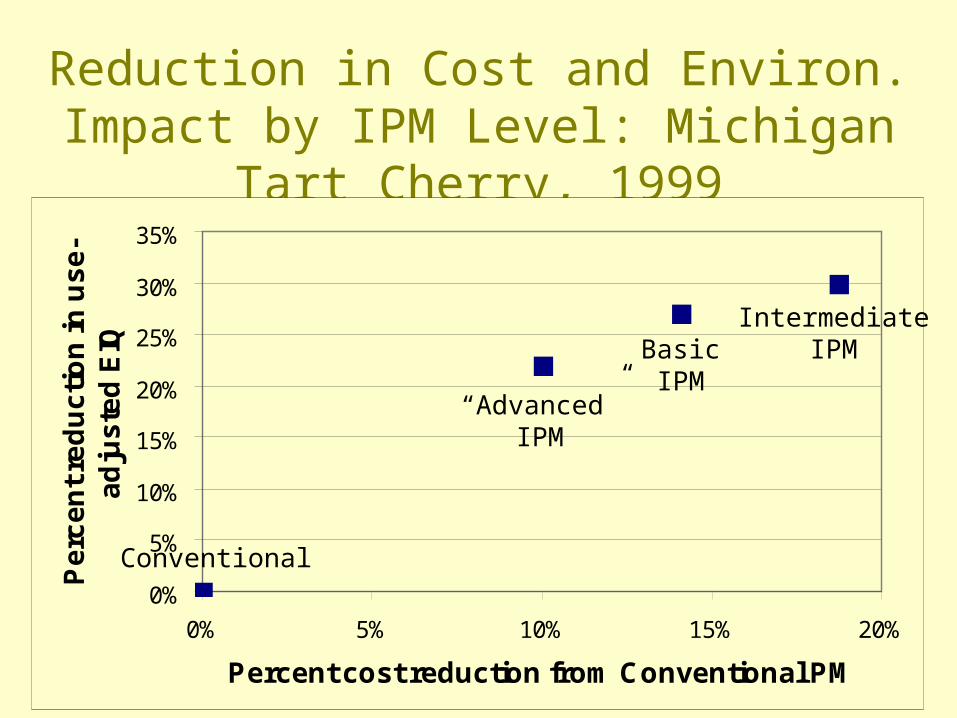
Reduction in Cost and Environ. Impact by IPM Level: Michigan Tart Cherry, 1999
0%
5%
10%
15%
20%
25%
30%
35%
0% 5% 10% 15% 20%
Percent cost reduction from Conventional PM
Pe
rce
nt
red
uc
tio
n in
us
e-
ad
jus
ted
EIQ
Conventional
BasicIPM
IntermediateIPM
“Advanced”IPM
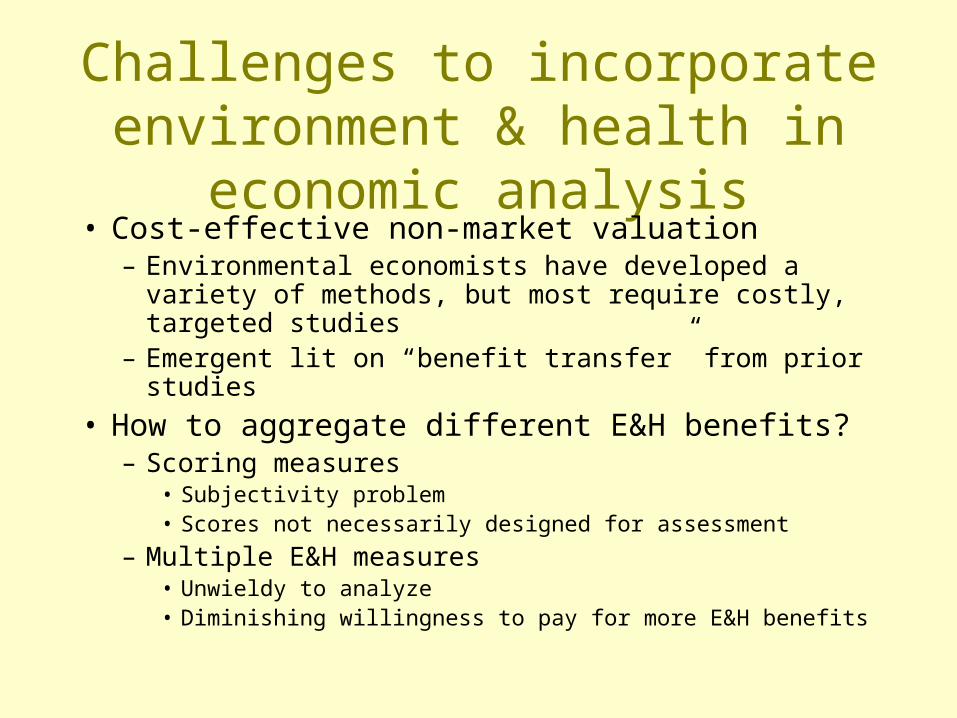
Challenges to incorporate environment & health in economic analysis
• Cost-effective non-market valuation– Environmental economists have developed a variety
of methods, but most require costly, targeted studies– Emergent lit on “benefit transfer” from prior studies
• How to aggregate different E&H benefits?– Scoring measures
• Subjectivity problem • Scores not necessarily designed for assessment
– Multiple E&H measures• Unwieldy to analyze• Diminishing willingness to pay for more E&H benefits
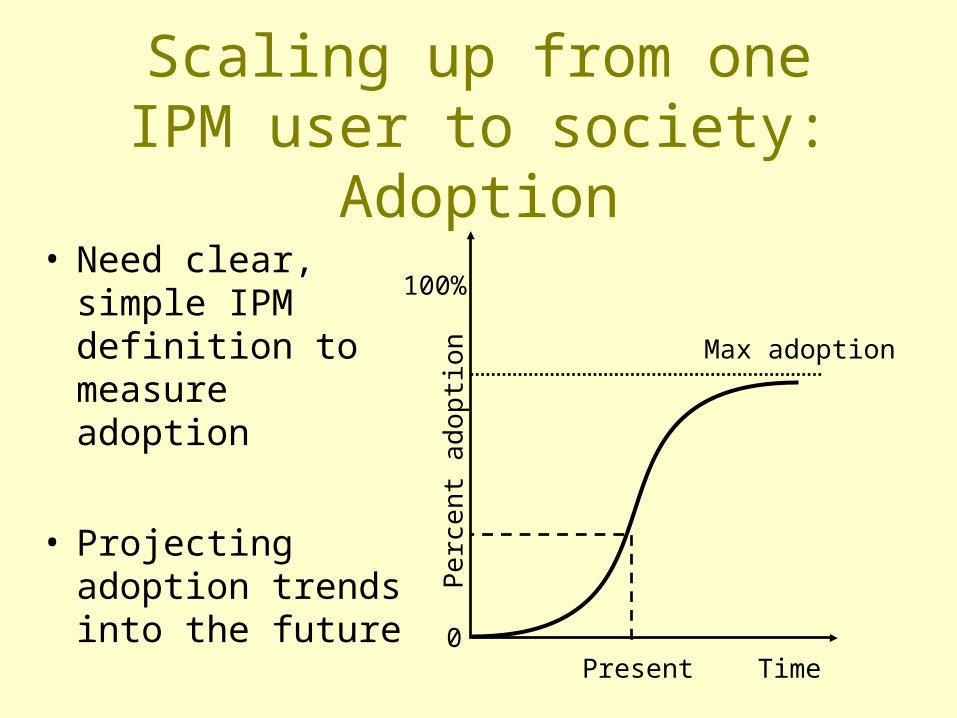
Scaling up from one IPM user to society: Adoption
• Need clear, simple IPM definition to measure adoption
• Projecting adoption trends into the future
Time
Pe
rce
nt a
dop
tion
0
100%
Max adoption
Present
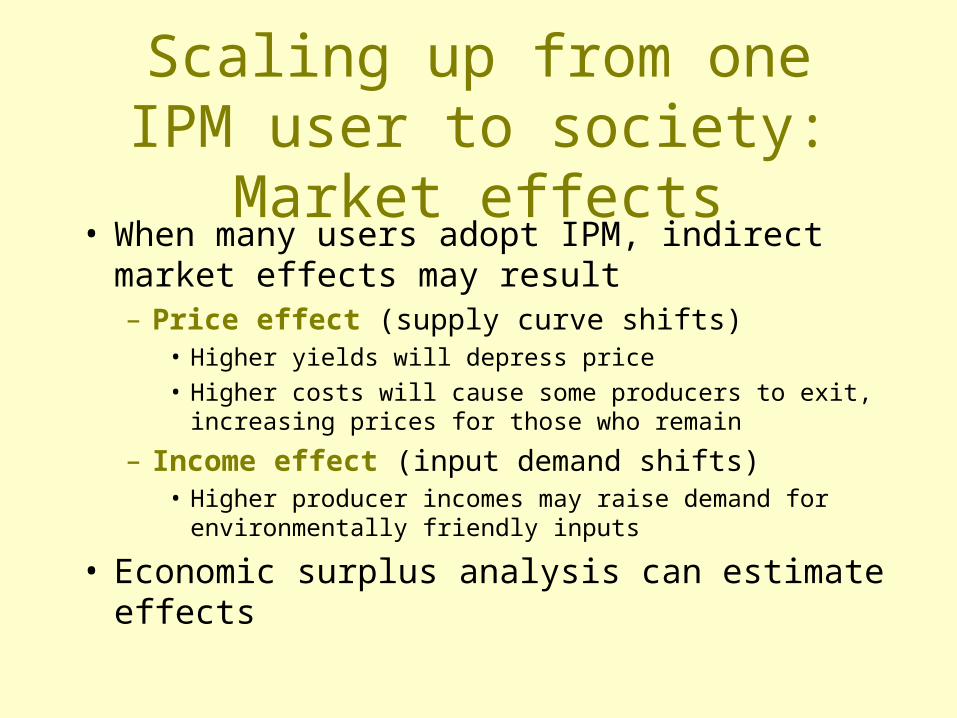
Scaling up from one IPM user to society: Market effects
• When many users adopt IPM, indirect market effects may result– Price effect (supply curve shifts)
• Higher yields will depress price• Higher costs will cause some producers to exit, increasing
prices for those who remain
– Income effect (input demand shifts)• Higher producer incomes may raise demand for
environmentally friendly inputs
• Economic surplus analysis can estimate effects
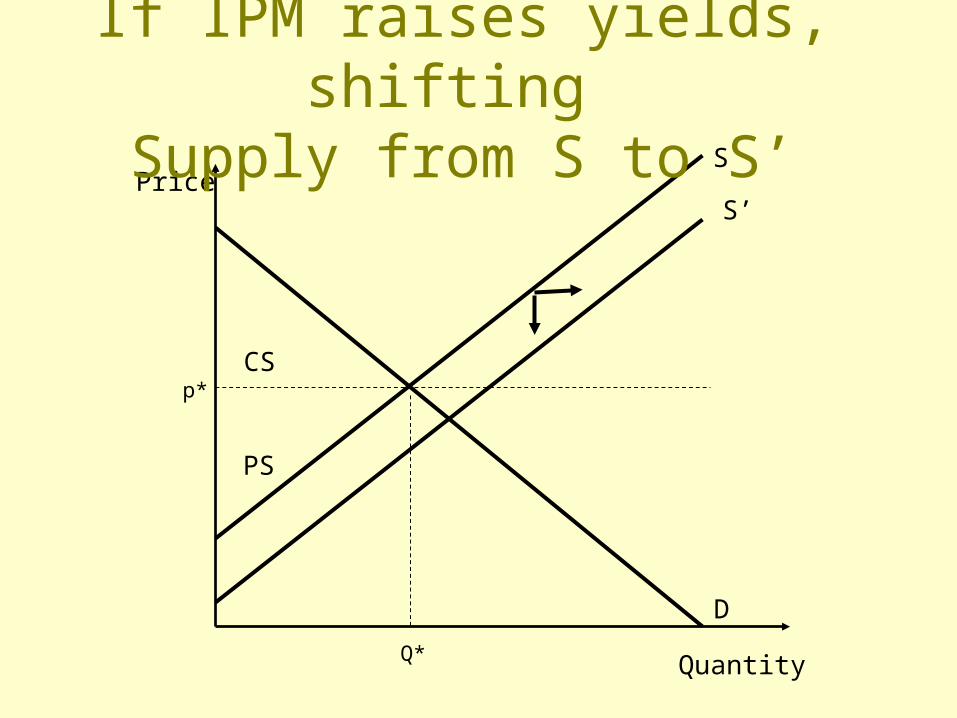
p*
D
Quantity
PriceS
PS
CS
S’
Q*
If IPM raises yields, shifting Supply from S to S’
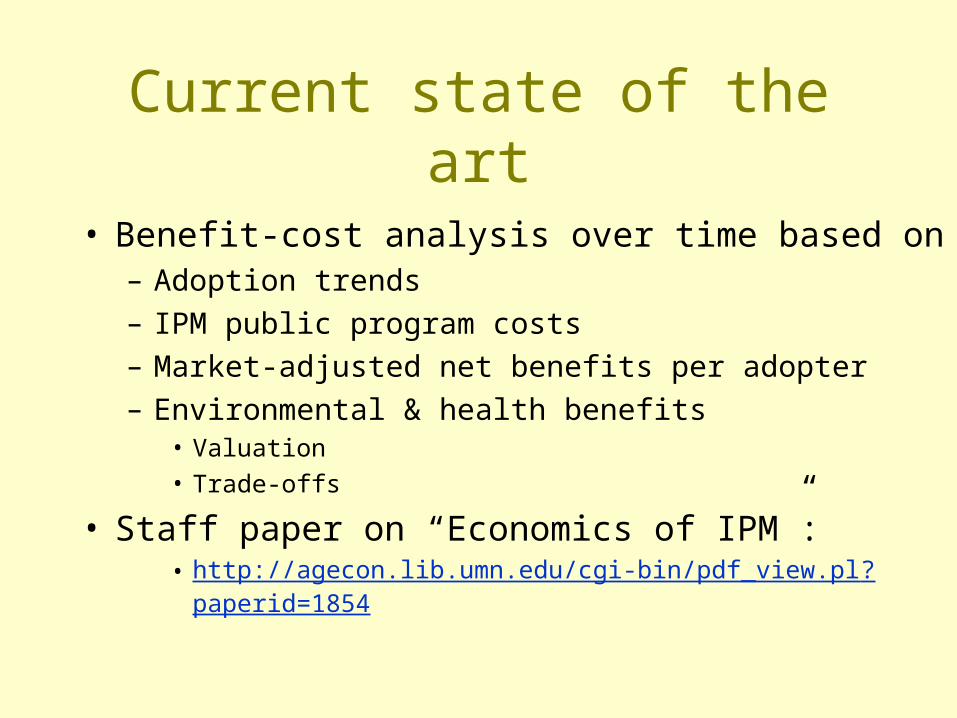
Current state of the art
• Benefit-cost analysis over time based on– Adoption trends– IPM public program costs– Market-adjusted net benefits per adopter– Environmental & health benefits
• Valuation• Trade-offs
• Staff paper on “Economics of IPM”:• http://agecon.lib.umn.edu/cgi-bin/pdf_view.pl?paperid=1854

Challenges ahead:Cost-effective assessments
• Excellent impact assessments are costly– Expert opinion is cheap; can lead to error & bias– Surveys are costly, but cooperation with NASS can
cut costs & strengthen data quality– Benefit transfer research is developing new tools for
adapting prior E&H valuation results to new settings
• Scaling up economic assessment to multiple programs at national or international level not easy– Spillovers – Diminishing marginal benefits
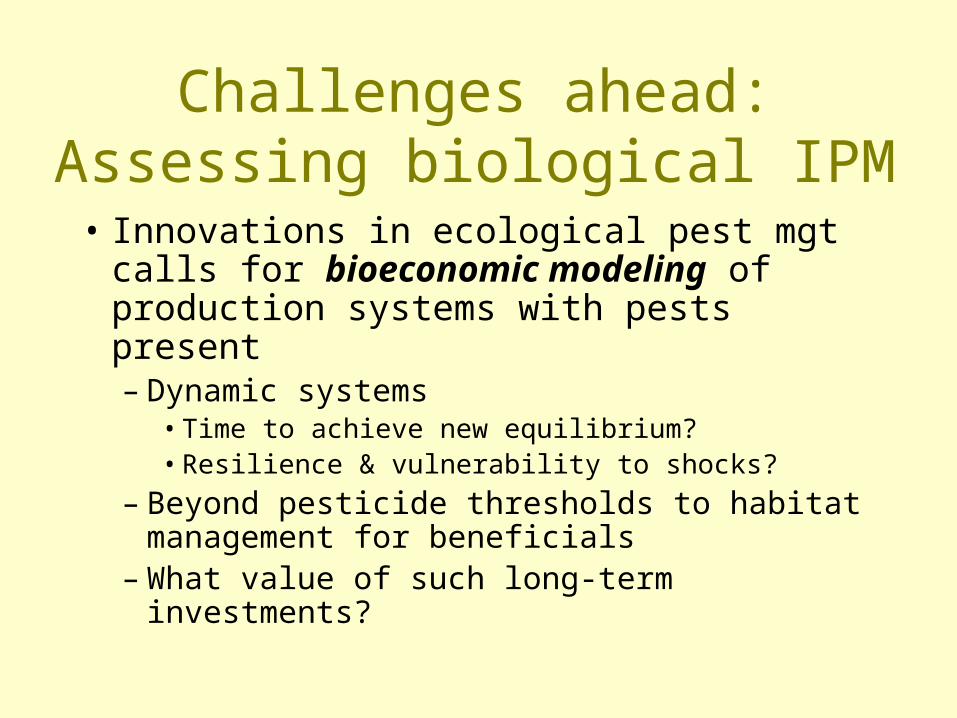
Challenges ahead:Assessing biological IPM
• Innovations in ecological pest mgt calls for bioeconomic modeling of production systems with pests present– Dynamic systems
• Time to achieve new equilibrium?• Resilience & vulnerability to shocks?
– Beyond pesticide thresholds to habitat management for beneficials
– What value of such long-term investments?

Biological control of the pesky Michigan wolverinebug

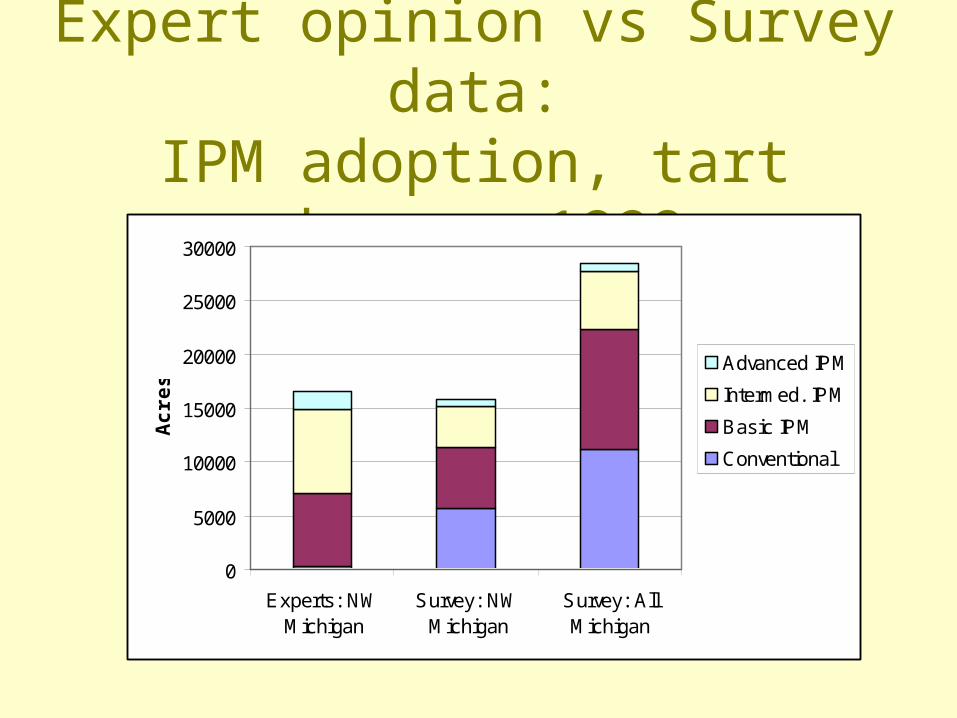
Expert opinion vs Survey data:IPM adoption, tart cherry, 1999
0
5000
10000
15000
20000
25000
30000
Experts: NWMichigan
Survey: NWMichigan
Survey: AllMichigan
Acr
es
Advanced IPM
Intermed. IPM
Basic IPM
Conventional
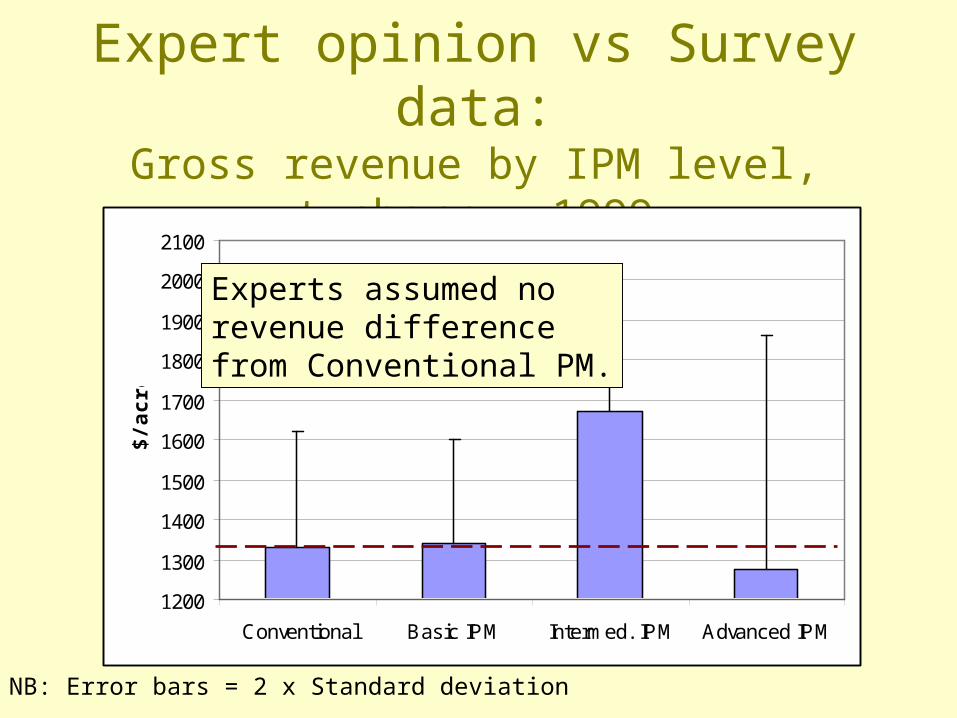
Expert opinion vs Survey data:Gross revenue by IPM level, t.cherry, 1999
1200
1300
1400
1500
1600
1700
1800
1900
2000
2100
Conventional Basic IPM Intermed. IPM Advanced IPM
$/ac
re
NB: Error bars = 2 x Standard deviation
Experts assumed norevenue differencefrom Conventional PM.