Embed Size (px)
Citation preview

DFID Human Development Resource Centre Cambridge Education, Murdoch House
Station Road, Cambridge, CB1 2RS
T: +44 (0) 1223 463 816 F: +44 (0) 1223 461 007 E: [email protected]
W: www.camb-ed.com
Economic Appraisal - Expansion of the County Education Centres Project For DFID South Sudan Hamish Colquhoun
November 2011
Expansion of the County Education Centres Project
DFID Human Development Resource Centre 300516 rev 1 a i
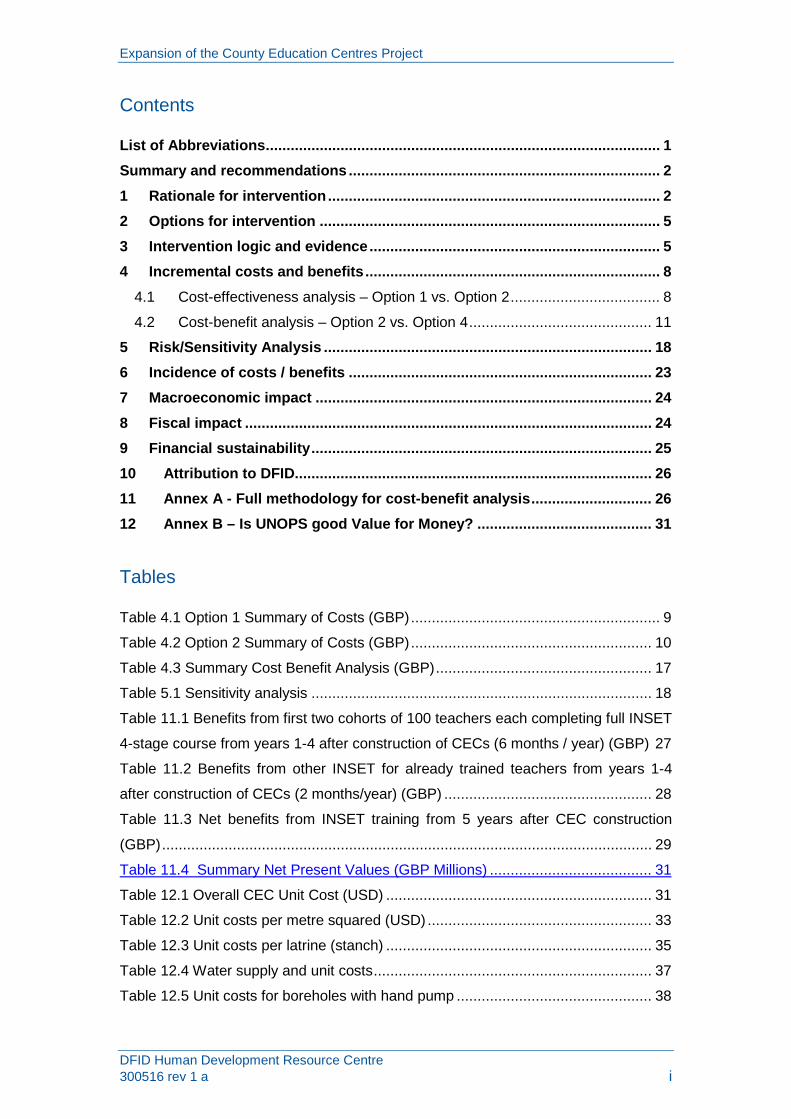
Contents List of Abbreviations ............................................................................................... 1
Summary and recommendations ........................................................................... 2
1 Rationale for intervention ................................................................................ 2
2 Options for intervention .................................................................................. 5
3 Intervention logic and evidence ...................................................................... 5
4 Incremental costs and benefits ....................................................................... 8
4.1 Cost-effectiveness analysis – Option 1 vs. Option 2 .................................... 8
4.2 Cost-benefit analysis – Option 2 vs. Option 4 ............................................ 11
5 Risk/Sensitivity Analysis ............................................................................... 18
6 Incidence of costs / benefits ......................................................................... 23
7 Macroeconomic impact ................................................................................. 24
8 Fiscal impact .................................................................................................. 24
9 Financial sustainability .................................................................................. 25
10 Attribution to DFID ...................................................................................... 26
11 Annex A - Full methodology for cost-benefit analysis ............................. 26
12 Annex B – Is UNOPS good Value for Money? .......................................... 31
Tables Table 4.1 Option 1 Summary of Costs (GBP) ............................................................ 9
Table 4.2 Option 2 Summary of Costs (GBP) .......................................................... 10
Table 4.3 Summary Cost Benefit Analysis (GBP) .................................................... 17
Table 5.1 Sensitivity analysis .................................................................................. 18
Table 11.1 Benefits from first two cohorts of 100 teachers each completing full INSET
4-stage course from years 1-4 after construction of CECs (6 months / year) (GBP) 27
Table 11.2 Benefits from other INSET for already trained teachers from years 1-4
after construction of CECs (2 months/year) (GBP) .................................................. 28
Table 11.3 Net benefits from INSET training from 5 years after CEC construction
(GBP) ...................................................................................................................... 29
Table 11.4 Summary Net Present Values (GBP Millions) ....................................... 31
Table 12.1 Overall CEC Unit Cost (USD) ................................................................ 31
Table 12.2 Unit costs per metre squared (USD) ...................................................... 33
Table 12.3 Unit costs per latrine (stanch) ................................................................ 35
Table 12.4 Water supply and unit costs ................................................................... 37
Table 12.5 Unit costs for boreholes with hand pump ............................................... 38

Expansion of the County Education Centres Project
DFID Human Development Resource Centre 300516 rev 1 a ii
Table 12.6 Unit cost for boreholes with electric pump .............................................. 39
Table 12.7 Unit cost for rainwater harvesting .......................................................... 40
Table 12.8 Lifecycle costs of solar panels vs. diesel 25kVA generator .................... 42
Table 12.9 Unit costs for furniture ............................................................................ 44

Expansion of the County Education Centres Project
DFID Human Development Resource Centre ERW001P00AD66 1
List of Abbreviations
BSF Basic Services Fund
CEC County Education Centre
CBR Cost benefit ratio
ECS Episcopal Church Sudan
EFA-FTI Education for All – Fast Track Initiative (now Global Partnership for
Education)
FTE Full time equivalent
GBP Great British Pound (Sterling)
GDP Gross Domestic Product
GoSS Government of South Sudan
GMR Global Monitoring Report
INSET In-service training
IRR Internal rate of return
MDTF Multi-donor trust fund
M&E Monitoring and Evaluation
MOE Ministry of Education
MoU Memorandum of Understanding
NGO Non-governmental organisation
NPV Net present value
PRESET Pre-service training
PTA Parent-teacher association
SSP South Sudanese Pound
TIMSS Trends in International Mathematics and Science Study
TPDI Teacher Professional Development and Infrastructure Program
TTI Teacher training institute
UNHCR (The Office of the) United Nations High Commissioner for Refugees
USAID United States Agency for International Development
USD United States Dollar
Expansion of the County Education Centres Project
DFID Human Development Resource Centre ERW001P00AD66 2
Summary and recommendations
• Option 2 – USAID managing the project with UNOPS managing the construction – is the most cost-effective option for achieving the project’s impact.
• This option has a positive net present value which is somewhat augmented by significant unquantifiable benefits which cannot be monetised. The economic case would be stronger if negotiations with UNOPS managed to lower construction costs, as strongly recommended by this appraisal’s annex.
• Project benefits are threatened by many risks - particularly low CEC utilisation, high teacher attrition and low quality training. These risks will mostly need to be addressed by other projects, but a clear strategy for risk mitigation must be developed by this project, which should in turn inform the development of other DFID projects. This project must not be considered in isolation from other DFID and USAID interventions in South Sudan and should not go ahead if the ability to manage and mitigate risks is judged unrealistic.
• Possible options for risk mitigation by this project specifically include decreasing the number of CECs constructed and considering a cost-sharing arrangement with the government to ensure their commitment to the full utilisation of the centres.
• The sustainability of the project’s benefits is dependent on increased GoSS expenditure to cover CEC operational costs and increased salaries for trained teachers. This is a major uncertainty for the project, particularly as rapid expansion of the education sector more generally will increasingly put government resources under strain. Realistically, development partner involvement in South Sudan may need to continue into the longer term to ensure this sustainability.
1 Rationale for intervention
What is intervention?
The proposed intervention is to finalise construction of 14 County Education Centres
(CECs) such that they become operational. The CECs will predominantly be used
for the in-service training of teachers, although they will eventually also be used for

Expansion of the County Education Centres Project
DFID Human Development Resource Centre ERW001P00AD66 3
government training for other sectors, such as health and agriculture. They will also
potentially be used by County Education Departments as resource hubs and
examination centres.
Why is it needed?
Development Partners and the Government of South Sudan have together
recognised that teacher training is an urgent priority for developing the education
sector. The international consensus is that teachers are the most critical resource in
education reconstruction and that strategies to improve quality should be considered
from the outset. If quality is neglected early on as access expands, it is believed to
become far more difficult to address at a later stage.1
More generally teachers are considered the fundamental factor in any education
system’s quality (Barber et al. 2007 – “The quality of an education system cannot
exceed the quality of its teachers”). This is just as relevant to South Sudan as any
other country since 77% of the education budget is spent on teacher salaries.
2
Furthermore a focus on quality rather than just access is vital since the presumed
benefits from education are believed more dependent on what is actually learnt
rather than simply the amount of schooling that is received.3
The quality of teachers in South Sudan is extremely low. In primary schools 46% of
teachers have only primary school education themselves, 96% have no formal
qualification and 63% have no teacher training at all.
4 This lack of quality is reflected
in indicators for student learning. A Service Delivery Study conducting sampled and
internationally comparable learning assessments in South Sudan found students in
Grade 6 scoring an average of only 29% in mathematics and 35% in language.5 By
comparison, as the tests were multiple choice, a purely random selection of answers
would score 25% and Grade 4 students in Singapore score above 80%. Poor
learning is also demonstrated by very high repetition and drop-out rates (15% and
34% respectively).6 The drop-out rate for girls is particularly alarming at 48%.7
Market and government failure
1 Education and Post Conflict Reconstruction: Reshaping the Future (World Bank 2005). Sudan Multi-Donor Education Rehabilitation Project, Project Proposal (2006). 2 Page 91, Education and Post Conflict Reconstruction: Reshaping the Future (World Bank 2005). 3 Hanushek & Woessmann (2008), “The role of cognitive skills in economic development”, Journal of Economic Literature, 46:3 4 Education in South Sudan: Status and Challenges for a New System (World Bank 2011). The Status of Teacher Professional Development in Southern Sudan (USAID 2009). 5 Education in South Sudan: Status and Challenges for a New System (World Bank 2011). 6 National Baseline and Household Survey (2009). Social and Human Development Pillar (2011). 7 Social and Human Development Pillar (2011).

Expansion of the County Education Centres Project
DFID Human Development Resource Centre ERW001P00AD66 4
There are many reasons why the private sector will not provide this intervention.
Principally these are because of externalities from teacher training that they wouldn’t
be able to fully capture in fees (such as the social benefits from having better
educated teachers – see later discussion) and an imperfect capital market that
makes it difficult to invest in projects with high start-up costs and more distant long-
term benefits.
The government will not construct these education centres as political realities mean
its resources are prioritised on more immediate term issues away from investments
with longer term benefits. In 2009, 97% of the government’s education budget went
on recurrent spending.8
The counterfactual to this project is that these 14 CECs would not be made
operational within the foreseeable future, and as such no training would occur at
these centres. It is not believed that any other development partner would construct
these centres if DFID did not finance this intervention. In addition, given the very
limited number of existing venues for teacher training, it is assumed that training at
the CECs will not simply displace training that would have taken place anyway
elsewhere.
Without development partner support almost no capital
investment would take place in the education sector.
9 In the counterfactual the teachers who would have been trained at the
CECs will instead remain untrained and provide a poorer quality of education to their
students.10 There are also some planned linkages between USAID’s Teacher
Professional Development and Infrastructure Program and this project since USAID’s
project envisages DFID to construct the training centres while USAID provides the
training. Since the TPDI project will likely commence before DFID finalises
construction of the CECs, not all USAID funded training will be able to take place at
these CECs.11
8 From 2009 budget - Education in South Sudan: Status and Challenges for a New System (World Bank 2011).
Nevertheless, given the joint DFID-USAID planning of this program,
failing to complete the CECs may lead to a breakdown in DFID-USAID coordination
in South Sudan with further reaching consequences.
9 The 2009 USAID study on Teacher Professional Development in Southern Sudan found that only 9 of a possible 158 CECs were operational. 10 The risk/sensitivity analysis explores the possibility of a different counterfactual such that some of the training at CECs in fact displaces training that would have taken place anyway. This may be the case if the true constraint to expanding teacher training is resources rather than venues. 11 USAID planning for this is ongoing. As they have no budget for accommodation, one option being explored is that they will initially only train teachers in close vicinity of the CECs until DFID construction of dormitory facilities is finalised.

Expansion of the County Education Centres Project
DFID Human Development Resource Centre ERW001P00AD66 5
2 Options for intervention
1. DFID manage project through direct MoU with UNOPS who carry out
construction
2. Money channelled to USAID who manage project with UNOPS carrying out
construction
3. Money channelled to Government of South Sudan who organise construction
4. No intervention
The different options are about the modalities for carrying out the construction
project. A further option of tendering the project to open competition was rejected
since experience in South Sudan has shown that this would entail higher costs,
higher risk (particularly in terms of timeframe and whether construction is even
completed at all) and would exclude UNOPS from the process (since they are not
allowed to bid for competitive tenders). The annex to this appraisal compares
UNOPS construction costs to previous costs for education construction projects in
South Sudan. This comparative analysis will be used to ensure that the UNOPS
costs provide value for money.
Option 3 is also rejected due to weak government public financial management
systems, and hence, there are high fiduciary risk and transparency and accountability
concerns: the risk of money being spent ineffectively and construction being delayed
is considered too high. The remainder of the appraisal will compare Options 1 and 2
against the counterfactual (Option 4).
3 Intervention logic and evidence
The key assumptions underpinning the intervention are:
• Project resources will be effective in completing construction at 14 CECs such
that each becomes operational
• Once completed CECs will be used for teacher training
• Teacher training does not simply displace equivalent quality training that
would have taken place anyway at alternative venues
• Teacher training will improve teacher quality, which in turn will improve
education quality and as such boost students’ welfare and entail benefits for
South Sudan as a whole
The UNOPS track-record in South Sudan suggests that the first assumption will hold
and construction of sufficient quality will be completed on time. UNOPS estimates
Expansion of the County Education Centres Project
DFID Human Development Resource Centre ERW001P00AD66 6
start-up, design and tendering to last for 5 months and construction to take between
9 and 14 months. As such the construction would be expected to be finalised within
two years from the start of the project. The second assumption is ultimately
dependent on the Government of South Sudan, since they will be responsible for
running the CECs once completed – they will fund the ongoing recurrent costs.
While the government seems committed to the importance of teacher training, the
key risk is in terms of sufficient resources being made available for it. Nevertheless,
in the short-term there is likely to be enough funding from development partners for
full use of the CECs to be made.
For example, USAID’s TPDI program plans to provide 4,000 teachers with In-Service
Training, while DFID is also planning its own teacher training project. There are
about 27,000 primary and secondary teachers in South Sudan, the vast majority of
whom are untrained.12
The evidence for the third assumption is mixed. While it is clear that adequate
facilities are not the only constraint to expanding teacher training, they appear to be
very relevant given the serious lack of usable venues. The 2009 USAID study on
Teacher Professional Development in Southern Sudan found that only 9 of a possible
158 CECs were operational. This would suggest that a lack of facilities is indeed a
major constraint to the expansion of teacher training. Although some training could
also potentially be hosted at other venues, such as schools during holidays, it seems
unlikely that the scale of in-service training which is targeted in the near future would
be able to be accommodated without operational CECs. As highlighted in the
rationale for this intervention, 96% of primary teachers have no formal qualification
and 63% have no training at all. There are about 25,000 primary and 1,700
secondary teachers in South Sudan.
Current GoSS guidelines for in-service training are for four
stages of three months each (completed over 4 years). Realistically each CEC could
host two different cohorts of teachers each year. With a capacity for 100 teachers at
any one time, this implies that the completed CECs could host at most 2,800
teachers over the next four years for the full INSET programme. As such, the
evidence that CECs will actually be used in the short to medium term is strong.
13
Nevertheless, until now some training has indeed been hosted at venues other than
CECs, implying that a lack of CECs is not a complete constraint on expanding
Without a reasonable number of CECs it
seems unlikely that anywhere near this number could be trained simply by finding
alternative venues.
12 Education in South Sudan: Status and Challenges for a New System (World Bank 2011) 13 Page 110, - Education in South Sudan: Status and Challenges for a New System (World Bank 2011)
Expansion of the County Education Centres Project
DFID Human Development Resource Centre ERW001P00AD66 7
teacher training. As such, it is certainly possible that some training at CECs will
displace training that would have occurred anyway at other venues.
For this reason the risk/sensitivity analysis will consider an alternative counterfactual
such that CEC training has displaced training that would have occurred elsewhere.
The impact of this possibility is considered to be reduced since the quality of training
relative to cost at CECs should be higher than for the counterfactual. Evidence
explicitly capturing this difference is not available14 - although it seems certain that a
quality differential will exist, the extent of the differential can only be assumed.15The
evidence for the fourth assumption is very strong. Many studies show that students
with better trained teachers achieve higher test scores.16 Furthermore this effect is
both cumulative and residual, such that a student with a better teacher in one
particular year still gets better test scores in later years.17 Better test scores have
been linked with greater returns to education. For example, Aslam et al. (2010) show
that for India a one standard deviation gain in test scores results in an 18%
improvement in annual earnings.18
There is also clear evidence showing that better teachers attract more students to go
to school, and so increase enrolment and reduce drop-out. For example, Lloyd et al.
(1998) find that the quality of teaching increases demand for education in Kenya, and
the effect is stronger for girls than boys.
Strong evidence already referenced (Hanushek &
Woessmann 2008) also suggests that all the private and social benefits of education
are based on the quality of education received rather than simply the quantity. Better
quality of education should also imply lower repetition rates, entailing major cost
savings for both government and students.
19
Finally there is clear evidence that other investments in the education sector are
dependent on teacher training. For example, for an improved curriculum to have any
effect on students’ results, alterations have to be followed by in-service training for
This is particularly relevant to South
Sudan where the drop-out rate for girls is 48%.
14 But would be a worthy target for teacher training projects’ M&E 15 See Annex 10 of DFID Education Portfolio Review 2009. Assuming equivalent resources made available to facilities of different quality, the quality of learning will be higher in the better quality facility. 16 Verspoor (2003), “Breaking the mold: Teacher development for pedagogical renewal”, Ch7 from “The Challenge of Learning: Improving the quality of basic education in sub Saharan Africa”, Discussion Paper for ADEA Biennial Meeting, Dec 2003 17 Ibid 18 Aslam, Kingdon, Kumar (2010), “Economic returns to schooling and skills – An analysis of India and Pakistan”, RECOUP working paper no.38 19 Lloyd et al. (1998) “The effects of primary school quality on the educational participation and attainment of Kenyan girls and boys”, Population council working paper 116

Expansion of the County Education Centres Project
DFID Human Development Resource Centre ERW001P00AD66 8
teachers.20 Similarly, a study by Woessmann based on TIMSS data shows that
“increasing school resources will not succeed in raising student achievement unless
these resources are used efficiently by teachers”.21
4 Incremental costs and benefits
4.1 Cost-effectiveness analysis – Option 1 vs. Option 2
Options 1 and 2 are assumed to achieve the same outcome and so yield the same
benefits. As such selection between the two options is on the basis of which is more
cost-effective.
Option 1:
20 Nilsson (2003: page 8) “Education for All: Teacher Demand and Supply in Africa”, Education international working papers no12
The direct costs for Option 1 are principally the UNOPS costs, which
incorporate design, actual construction, monitoring and evaluation, capacity building
and a 7% management fee. In addition, DFID would incur its own management,
monitoring and evaluation and auditing costs.
21 DFID Education Portfolio Review 2009, page 62
Expansion of the County Education Centres Project
DFID Human Development Resource Centre ERW001P00AD66 9
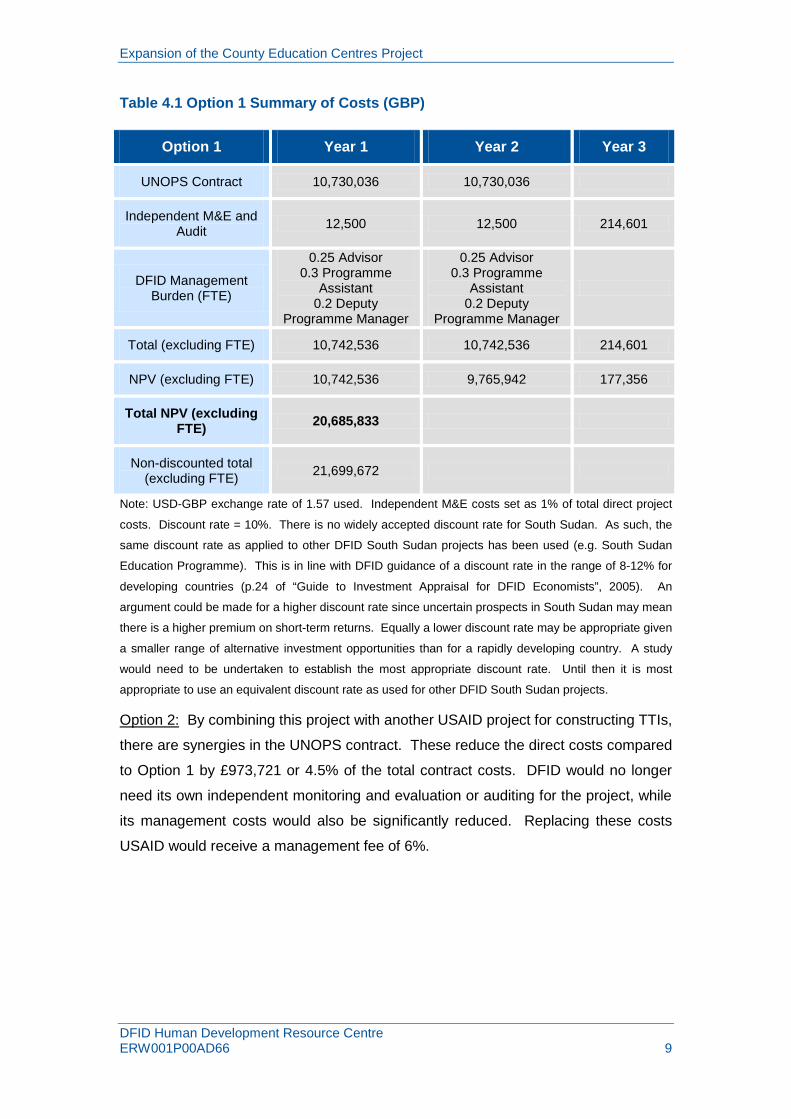
Table 4.1 Option 1 Summary of Costs (GBP)
Option 1 Year 1 Year 2 Year 3
UNOPS Contract 10,730,036 10,730,036
Independent M&E and Audit 12,500 12,500 214,601
DFID Management Burden (FTE)
0.25 Advisor 0.3 Programme
Assistant 0.2 Deputy
Programme Manager
0.25 Advisor 0.3 Programme
Assistant 0.2 Deputy
Programme Manager
Total (excluding FTE) 10,742,536 10,742,536 214,601
NPV (excluding FTE) 10,742,536 9,765,942 177,356
Total NPV (excluding FTE) 20,685,833
Non-discounted total (excluding FTE) 21,699,672
Note: USD-GBP exchange rate of 1.57 used. Independent M&E costs set as 1% of total direct project
costs. Discount rate = 10%. There is no widely accepted discount rate for South Sudan. As such, the
same discount rate as applied to other DFID South Sudan projects has been used (e.g. South Sudan
Education Programme). This is in line with DFID guidance of a discount rate in the range of 8-12% for
developing countries (p.24 of “Guide to Investment Appraisal for DFID Economists”, 2005). An
argument could be made for a higher discount rate since uncertain prospects in South Sudan may mean
there is a higher premium on short-term returns. Equally a lower discount rate may be appropriate given
a smaller range of alternative investment opportunities than for a rapidly developing country. A study
would need to be undertaken to establish the most appropriate discount rate. Until then it is most
appropriate to use an equivalent discount rate as used for other DFID South Sudan projects.
Option 2: By combining this project with another USAID project for constructing TTIs,
there are synergies in the UNOPS contract. These reduce the direct costs compared
to Option 1 by £973,721 or 4.5% of the total contract costs. DFID would no longer
need its own independent monitoring and evaluation or auditing for the project, while
its management costs would also be significantly reduced. Replacing these costs
USAID would receive a management fee of 6%.

Expansion of the County Education Centres Project
DFID Human Development Resource Centre ERW001P00AD66 10
Table 4.2 Option 2 Summary of Costs (GBP)
Option 1 Year 1 Year 2 Year 3
UNOPS Contract 10,243,175 10,243,175
Independent M&E and Audit 614,591 614,591
DFID Management Burden (FTE)
0.2 Deputy Programme Manager
0.2 Deputy Programme Manager
Total (excluding FTE) 10,857,766 10,857,766
NPV (excluding FTE) 10,857,766 9,870,696
Total NPV (excluding FTE) 20,728,462
Non-discounted total (excluding FTE) 21,715,531
Note: USD-GBP exchange rate of 1.57 used. Discount rate = 10%.
The total discounted costs for Option 2 are very marginally higher than for Option 1,
£42,629. However, these do not include DFID’s non-monetised management
burden. The annual difference in FTE is 0.25 of an advisor’s time and 0.3 of a
programme assistant’s time. When considering the overall costs to DFID of these
staff members (total gross salary, living allowance, flights allowance, insurance and
security etc.) this would probably be valued greater than the monetised discounted
cost difference between the options.
In summary, Option 2 is likely to be marginally more cost-effective than Option 1. In
addition, while the project’s impact is assumed equivalent between the two options,
Option 2 has a very large but unquantifiable broader benefit in terms of improving
donor coordination and cooperation in South Sudan. Many studies have emphasised
the value of donor coordination in terms of reduced transaction costs for government
from dealing with multiple partners, avoiding duplication of donor efforts and most
critically ensuring donor interventions are complementary to one another to maximise
their overall impact.22
22 OECD (2003) “Harmonising donor practices for effective aid delivery”, A DAC reference document
South Sudan’s donor community at present is considerably
fragmented and so the benefits from fostering greater coordination between two of
the principal donors is likely to be considerable. For this reason Option 2 is the
preferred choice.

Expansion of the County Education Centres Project
DFID Human Development Resource Centre ERW001P00AD66 11
The remainder of this section will discuss whether Option 2 is better value than the
counter-factual of doing nothing (Option 4 – assumed to have zero costs and
benefits, but frees up money to be used on other interventions), and as such whether
the project should go ahead or not.
4.2 Cost-benefit analysis – Option 2 vs. Option 4
The benefits from making the CECs operational are in terms of how the CECs will be
used. The plan is for in-service teacher training to be conducted at the centres. As
such this section will focus on attempting to quantify the economic costs and benefits
from the teacher training that will take place. These net benefits will be calculated
from the perspective of the Government of South Sudan.
Option 2’s Incremental Net Benefits
Principally two types of in-service training will take place at the CECs. The first is the
full four-stage INSET course proposed by the government, to be equivalent to the 2-
year pre-service diploma. This will involve 400 hours of training per stage taking
place over 12 weeks, as well as some follow-up of teachers in classrooms following
the training (1-2 hours per day for five weeks). It is assumed that for the first four
years following construction of the CECs two full cohorts of teachers will follow this
INSET course. This means that this training will utilise the CECs for 6 months per
year, and after four years 2,800 teachers will have become qualified.
The other type of in-service training will be continual upgrading of skills for teachers.
Planned trainings include English language training, Maths and Science training,
HIV/AIDS awareness training, head-teacher and school management training.
Closely related will be other trainings at CECs such as PTA training, school inspector
training, data and statistics training for regional officers. Indeed the government is
planning to use the CECs for training for other sectors such as health and agriculture.
To capture the benefits from these trainings it is assumed that they will take place for
two months a year for the first four years of the CEC and then 4 months a year from
five years after the CEC is completed. Given the wide range of different trainings
planned by both GoSS and development partners, this seems a conservative
estimate. Indeed, it is likely that there will still need to be at least one cohort enrolling
on the full 4-stage INSET course beyond year 5, given the vast number of untrained
teachers who need to be trained and the lack of other facilities within which to train
them. For simplicity this 4 months per year figure will be assumed to incorporate
both training as part of the full 4-stage INSET course, and other training, with each
assumed to have the same pro rata unit cost and returns.
Expansion of the County Education Centres Project
DFID Human Development Resource Centre ERW001P00AD66 12
There is significant scope for much greater than 4 months training per year.
Nevertheless, since GoSS will be responsible for the costs of training in the longer
term, and both its ability and commitment to this cannot be guaranteed, it seems
sensible to make a relatively conservative projection of usage beyond five years after
CEC construction.
Training costs:
The unit cost for in-service training is set as £900 for one teacher completing one
stage of the full INSET course - this is based on what the Episcopal Church Sudan
estimates such training presently costs in South Sudan. This is a conservatively high
cost estimate. Average equivalent BSF training costs (from 7 different providers) is
£669. In addition, this training cost should prove to be lower once the CECs become
operational.23 However, the £900 figure will be used as a conservative cost estimate
which should ensure that all training costs are incorporated (including, for example,
maintenance which may not have been factored into the ECS or BSF costs).24
In calculating the economic cost for in-service training it is also necessary to include
the opportunity cost to teachers from training. Ideally training should occur during
holidays, so term-time teaching is not disrupted. Even though training is initially
targeted to take place 6 months per year, this should be possible since holiday dates
are not uniform across schools and term dates could be adapted to allow for training.
Nevertheless, by being at training teachers may also be foregoing other income that
they could have earned outside of teaching. Additionally, being realistic, there may
be some clash between training and term-time teaching, such that teaching is
disrupted. The opportunity cost will be assumed to be equivalent to the teacher’s
salary for the period in which they attend training. 75% of this cost will be assumed
to fall on teachers themselves, since almost all training will be targeted to take place
outside of term-time. The remaining 25% opportunity cost will be assumed to fall on
the government, given the possibility that some term-time teaching will be disrupted
because of training.
23 Presently the trainings are often at ad-hoc venues with consequent spending inefficiencies. For example, expenses for food are likely higher without kitchen facilities than they will be when training is hosted at CECs with kitchen facilities. 24 If maintenance costs are set as 1.5% of construction costs (DFID Guideline from Bonner et al. 2010 “Delivering Cost Effective and Sustainable School Infrastructure”, p.14), then per CEC the annual cost is £15,405 (1.5% of £14.4m divided by 14), which per teacher trained for three months is £39 (£15,405 divided by 100 divided by 4).

Expansion of the County Education Centres Project
DFID Human Development Resource Centre ERW001P00AD66 13
Other private costs to teachers are assumed to be zero, since their food,
accommodation, transport and materials are provided free-of-charge. Their private
cost could in fact be argued to be negative since if they were not at the training they
would need to pay for food. So setting these costs to zero seems reasonable. The
implicit rental value for the CECs is also assumed to be zero, since realistically they
could not be used for any other marketable purpose in the foreseeable future.
Following completion of training there will be a cost to the government in terms of
rewarding trained teachers with higher salaries. The extra salary that the
government pays a teacher following completion of the 4-year INSET will be the
same as the extra salary paid to a teacher with a 2-year PRESET diploma, since
these two courses are supposed to be equivalent.
The average monthly salary for a non-trained teacher is SSP387. The monthly
salary for a newly trained teacher is SSP913. These salaries are equivalent to
£1,003 and £2,364 per year. These figures include cost of living allowances (which
are higher for trained teachers), and pension contributions (8% of all income). They
do not include income tax, which is 10% of income above SSP300 per month.
Payment of this tax is not assumed to be a cost to the government.
Comparative data from other developing countries suggest that this salary increase
may in fact be quite high. For example, Mulkeen (2010) compares qualified and
unqualified teachers in 4 sub-Saharan African countries, showing that only in The
Gambia is the salary increase comparable, while in Lesotho, Liberia and Uganda the
increase is very significantly less.25
It should be noted that while increased salaries are a cost to the government they are
also a benefit to teachers. The present cost-benefit analysis will be from the
perspective of GoSS, in which sense they are treated as simply a cost. If the
benefits for South Sudan as a whole were considered then the higher salaries would
not be a net cost.
Nevertheless, providing sufficiently higher
salaries for trained teachers seems vital to prevent teachers simply leaving the
profession after completing their training. As such the GoSS salary scale cost
estimate will be used.
Training benefits:
Increased productivity of teachers
25 Mulkeen (2010), page 141, “Teachers in Anglophone Africa: Issues in Teacher Supply, Training, and Management”, World Bank

Expansion of the County Education Centres Project
DFID Human Development Resource Centre ERW001P00AD66 14
The principal benefits from training are in terms of increasing the marginal
productivity of teachers. This is extremely difficult to quantify. No robust evidence
yet exists that can be used to quantify how much teacher productivity increases (in
monetisable terms) as a result of training. However, theoretically it could be
measured, and this should be a goal for the monitoring and evaluation of the teacher
training projects that follow this construction project. For example, it can be
measured how much repetition and drop-out rates fall, how much test scores
increase and how much enrolment increases at schools with more trained rather than
untrained teachers. All of these gains can be monetised.26While evidence is not
common for what this rate of return for teacher training should be, it can be
compared to international evidence on the rate of return for general education.
Psacharopoulos & Patrinos (2002) summarise a wide range of studies to show the
average rate of return to investing in an extra year of general education in sub-
Saharan Africa is 18.4% at the secondary level.27 Bennell (1996) breaks down this
information into lower and upper secondary, corrects some reporting errors and
shows that (for those studies where a breakdown is possible) the average rate of
return to lower secondary is 22.4%, while the average rate of return for upper
secondary is 33.4%.28
There are a number of reasons why the rate of return for teacher training should be
higher than that for general education. First, teachers have guaranteed employment
post-training, whereas general rate of return estimates are lowered by the proportion
of students who do not find employment. Second, there is no lag between
completing teacher training and then actually teaching in the classroom, so there is
no delay to the realisation of productivity benefits (indeed teachers continue to teach
while training is actually going on). In general education there is a delay between
completing a particular year of school and then leaving school and eventually finding
employment. Third, teacher training courses are focussed specifically on what skills
the teacher needs for the classroom, whereas skills developed in general education
will arguably only be partially relevant to the job that a student ends up doing.
This breakdown is informative since the 4-stage INSET
course is most closely equivalent to upper secondary education.
26 Decreasing repetition and drop-out reduces the costs for educating a child in a particular cycle of education by cutting the average number of years required to complete that cycle of education. Studies are starting to give estimates of the rate of return for increasing student test scores in terms of increased salaries in later life (see e.g. Aslam et al. (2010)). Attracting more children to actually attend school has an already commonly measured value in terms of the benefits these children then get from going to school. 27 Psacharopoulos & Patrinos (2002), “Returns to investment in education: A further update”, World Bank 28 Bennell (1996) “Rates of return to education: Does the conventional pattern prevail in sub-Saharan Africa?”, World Development, Vol24, No1
Expansion of the County Education Centres Project
DFID Human Development Resource Centre ERW001P00AD66 15
For these reasons the present analysis will assume that teacher productivity
increases by 35% as a result of training, marginally higher than the average rate of
return for general upper secondary education found by Bennell (33.4%). This return
seems realistic and quite possibly underestimates the benefits from increasing
teacher skills. Nevertheless a more accurate estimate will only be possible with
robust monitoring and evaluation of any teacher training projects that follow this
construction project.
Social returns from training teachers
There are also broader benefits from training teachers which are even harder to
monetise, but to neglect them would imply significantly underestimating the overall
returns from teacher training. The first of these are equivalent to the external
benefits of general education, including benefits from better public health, lower
crime rates, greater political stability and environmental benefits. McMahon (2004)
brings together a number of studies to calculate that incorporating these broader
social benefits from education would more than double conventional rate of return
figures. For example, he shows that Psacharopoulos & Patrinos’ rate of return
figures for secondary education in sub-Saharan Africa would increase from 18.4% to
39.7%.29
Spillover benefits to other teachers
There is considerable uncertainty in estimating these benefits, meaning
these estimates can only be applied cautiously. For this reason the present analysis
will assume the social returns from teacher education to be 10%. This is equivalent
to assuming that the teacher productivity return increases from 35% to 45% when
incorporating the social returns. In addition the analysis will only calculate these
returns for the time when teachers remain in the profession. This likely
underestimates the returns since the social benefits from better educated teachers
are likely to persist beyond their teaching career.
The second broader benefit from teacher training is in terms of spillover benefits to
other teachers through peer learning. Jackson & Bruegmann (2009) find that a
teacher’s students score better if the teacher has more effective colleagues, and this
effect is strongest for the least experienced teachers.30
29 McMahon (2004), “The Social and External Benefits of Education” from International Handbook on the Economics of Education
They show that on average a
one standard deviation increase in a teacher’s quality is associated with a 0.04
standard deviation increase in maths scores and a 0.03 standard deviation increase
30 Jackson & Bruegmann (2009), “Teaching students and teaching each other: The importance of peer learning for teachers”, American Economic Journal: Applied Economics, Vol1, No4, 85-104

Expansion of the County Education Centres Project
DFID Human Development Resource Centre ERW001P00AD66 16
in reading scores for students taught by that teacher’s colleague. Given that the
average teacher has three peers, this implies that for a given increase in teacher
quality, there is an additional collective increase in their colleagues’ quality by 10.5%
of that increase.
They also show that this effect is cumulative over time, such that a one-off increase
in a teacher’s quality results in a collective increase in colleagues’ quality over three
years by an additional third of the original teacher’s quality increase. However, given
that there are not many studies to counterbalance this evidence, to keep the present
analysis conservative only the contemporaneous effect will be considered. As such,
in the monetised analysis, in addition to the measured teacher productivity increase
of 35%, an additional 10.5% of this increase will be calculated as the peer learning
gains for fellow teachers.
Non-quantified benefits from training teachers:
Peace benefits: By providing residential teacher training that brings together
teachers of different tribes into the same place, there are potential benefits in terms
of encouraging unity between tribes. More generally there is also strong evidence
emerging that the provision of decent quality education is an important investment in
building peace in post-conflict states.31
Education as a human right: Many would argue that providing education of a
reasonable quality is an unquantifiable human right. This would imply that even if an
education project is not profitable for all the other factors outlined already, it might still
be considered worthwhile simply in terms of the extra number of children who get
access to a basic quality of education.
Other non-quantified benefits from constructing CECs
While it is clear that the principal goal of CECs is to be used as education centres,
they will also be used for a number of reasons beyond training teachers, the benefits
from which are necessarily excluded from the monetised analysis. First, the
government also plans to use CECs for training in sectors outside of education such
as health and agriculture. This training may well get similar returns to those for
teacher training, but to be conservative they have been excluded from the analysis.
CECs will also be used as resource hubs and examination centres for schools. This
would potentially entail significant benefits and would be unlikely to divert much time
away from CEC usage for training. The CECs could as well be used by local
31 GMR 2011
Expansion of the County Education Centres Project
DFID Human Development Resource Centre ERW001P00AD66 17
communities, for example, as a venue for meetings. This would only constitute a
minor usage of CECs, the main purpose of which being to give the local community
some kind of a stake in the centres such that they might support its maintenance and
security.
Finally the utilisation of CECs could be significantly greater than what is assumed for
the cost-benefit analysis. For example, CECs could be used as a venue for evening
classes for training teachers from nearby schools at the same time as being used
during the day for residential courses. Such evening classes are currently conducted
in South Sudan by the Windle Trust for English language training.
Full details on the calculations are presented in the annex. The following table gives
the key summary figures.
Monetised Cost-Benefit Analysis
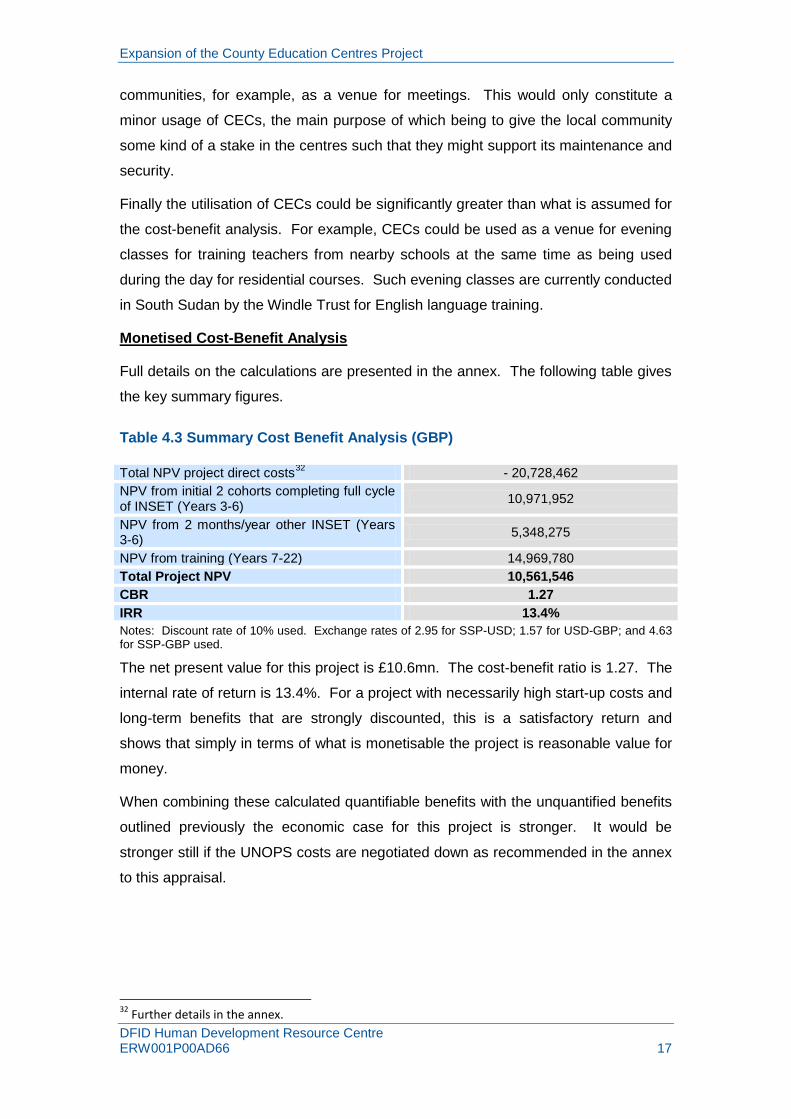
Table 4.3 Summary Cost Benefit Analysis (GBP)
Total NPV project direct costs32 - 20,728,462 NPV from initial 2 cohorts completing full cycle of INSET (Years 3-6) 10,971,952
NPV from 2 months/year other INSET (Years 3-6) 5,348,275
NPV from training (Years 7-22) 14,969,780 Total Project NPV 10,561,546 CBR 1.27 IRR 13.4% Notes: Discount rate of 10% used. Exchange rates of 2.95 for SSP-USD; 1.57 for USD-GBP; and 4.63 for SSP-GBP used.
The net present value for this project is £10.6mn. The cost-benefit ratio is 1.27. The
internal rate of return is 13.4%. For a project with necessarily high start-up costs and
long-term benefits that are strongly discounted, this is a satisfactory return and
shows that simply in terms of what is monetisable the project is reasonable value for
money.
When combining these calculated quantifiable benefits with the unquantified benefits
outlined previously the economic case for this project is stronger. It would be
stronger still if the UNOPS costs are negotiated down as recommended in the annex
to this appraisal.
32 Further details in the annex.

Expansion of the County Education Centres Project
DFID Human Development Resource Centre ERW001P00AD66 18
5 Risk/Sensitivity Analysis
Table 5.1 Sensitivity analysis
What if: IRR (%)
Only 3 months utilisation per year 8.4 9 months utilisation per year 17.4 1-year delay in construction 12.4 2-year delay in construction 11.6 10% decrease in training rate of return 10.9 20% decrease in training rate of return 7.9 Teacher retention decreased to 6 years 10.6 Teacher retention increased to 20 years 15.3 CEC lifespan decreased to 10 years 11.8 CEC lifespan increased to 30 years 14.3 USD – GBP exchange rate 1.45 12.6 USD – GBP exchange rate 1.70 14.3
This table shows the impact on the internal rate of return by changing some of the
assumptions underpinning the cost-benefit analysis:
Not full utilisation of resource
If CECs are only used for three months training per year then the IRR falls to 8.4%.
This emphasises that the benefits from constructing CECs are completely dependent
on the actual utilisation of CECs. In the short term this is not believed to be a major
risk, since there seems sufficient donor interest alone in teacher training to make use
of the CECs. For example, USAID’s planned TPDI program aims to train a cohort of
4,000 teachers, while DFID is planning its own teacher training project. If each CEC
was used to full capacity (100 students at a time) for two cohorts per year (i.e. across
six months) then this would be a total of 2,800 teachers being trained over 4 years.
In the longer term this risk is more significant since ultimately it is the government
who will be responsible for providing all training. Overall GoSS financing for
education has been reasonable since 2005, with between 6% and 8% of the total
budget allocated to education. However, there are significant concerns about the
sustainability of GoSS’s overall revenue (which is 98% from oil sources due to run
out in 20-30 years). Furthermore, continuing expansion of the education sector
requires significant, sustained resources to be allocated and disbursed to the
education sector.33
33 Enrolment quadrupled between 2006 and 2009, and is targetted to continue to expand rapidly (even in 2009 the Net Enrolment Rate was only 46%, implying that more than half the children of school age do not actually go to school) (Social & Human Development Pillar 2011).
In addition, recent budget commitments to teacher training have
not been honoured, with evidence from 2010 showing only 11% execution of the

Expansion of the County Education Centres Project
DFID Human Development Resource Centre ERW001P00AD66 19
allocated budget for teacher training.34
Low quality training
While it should be recognised that this is only
preliminary data and the reasons for this low execution rate might be justifiable (e.g.
delayed disbursement rather than re-allocated resources), this is still significant
cause for concern. It seems most likely that the risk of insufficient CEC utilisation in
the longer term is the greatest risk to project benefits. The flip-side of this risk is that
there is significant scope for CECs to be used much more intensively than the
utilisation assumed for the cost-benefit analysis. If used for 9 months per year then
the IRR climbs to 17.4%. If used for evening classes as well as day classes, then
again project benefits would be even further increased.
The extent of the benefits from teacher training is dependent on the quality of training
that is given in relation to the costs. If the quality of training is lower than assumed
then the rate of return to training will be lower, which means project benefits will
decrease. For example, if the rate of return (for both the productivity increase and
social returns) is 10% lower than assumed, then the IRR falls to 10.9%. If the rate of
return is 20% lower then the IRR falls to 7.9%. The rate of return assumed for the
cost-benefit analysis has been estimated relatively conservatively and as argued
previously in reality it may well be higher. Nevertheless, the monitoring and
evaluation of development partner teacher training projects should be focussed on
ensuring the returns to training are sufficiently high.
Another reason why the rate of return to teaching might be lower is if teachers are
not provided with sufficient complementary resources (e.g. textbooks, adequate
infrastructure etc.) once back in the classroom. This is a risk if GoSS does not
provide sufficient financing for education inputs in general, which is quite possible
given the general expansion of access to education putting ever greater pressure on
limited government resources.
Construction delays
If there are delays in construction then CECs will not be operational until later than
necessary and project benefits will be delayed. As benefits are discounted by 10%
annually (reflecting both social time preference for benefits received sooner as well
as the opportunity cost of capital) delays in construction reduce the project’s NPV. If
construction is delayed by one year then the IRR falls to 12.4%, if delayed by 2 years
the IRR falls to 11.6%.
34 Draft presentation, “South Sudan: Teacher Supply and Demand - Initial Analyses”, Goldsmith (2011). Note the content of presentation is a work in progress at time of writing.

Expansion of the County Education Centres Project
DFID Human Development Resource Centre ERW001P00AD66 20
At the time of this appraisal only three of the CECs had been visited. From these
visits it has been assumed that only minor touch-up work is required on the existing
facilities. If in fact more than minor rehabilitation work is required at other CECs then
this could delay the construction process. Nevertheless, UNOPS track record for
completing construction projects on time would suggest this is not a major risk.
Decreased teacher retention
Project benefits are dependent on teachers staying on as teachers after training for
an average of 10 years. If the average retention falls to 6 years then the IRR falls to
10.6%. Although, outside of the directly monetised benefits, not all the economic
benefits of training will be lost if teachers become employed elsewhere since some of
their extra skills will be equally relevant in other sectors. However, this is a major risk
for the project’s success in terms of addressing the need for intervention – a severe
shortage of qualified teachers in South Sudan resulting in poor quality education for
South Sudan’s students.
There are two ways in which training may impact on teacher retention. The first is
that by increasing teachers’ skills they have greater alternative employment
opportunities. This risk should be mitigated by ensuring that better trained teachers
are given adequate remuneration by the government. The second impact of training,
however, should in fact increase retention since studies show that teachers with
proper training get more satisfaction from their work and as such are more likely to
stay in the profession than those without training.35
Decreased lifespan of CECs
If teacher retention was in fact
increased to 20 years then the IRR becomes an impressive 15.3%.
The expected lifespan of CECs should be more than 25 years. Conservatively the
cost-benefit analysis calculated benefits for just the first 15 years. If the lifespan of
CECs is reduced to 10 years then the project IRR will reduce to 11.8%. Conversely,
if the lifespan of CECs increases to 30 years then the project’s NPV becomes 14.3%.
Two key factors could reduce the lifespan of CECs. The first is if a return to conflict
disrupts the use of CECs or destroys the facility itself. This is somewhat beyond the
control of this project, although it does highlight the complementarity between this
project and other DFID investments in South Sudan for peace and stability.
The second factor is if there is insufficient maintenance of CECs. Repeated studies
have shown how incredibly cost-effective maintenance is compared to allowing a 35 Nilsson (2003: page 10) “Education for All: Teacher demand and supply in Africa”, Education International Working Papers no 12
Expansion of the County Education Centres Project
DFID Human Development Resource Centre ERW001P00AD66 21
building to decay completely and then need to be rebuilt.36 The government has
stated that an operational budget will be allocated to CECs that will include an
allowance for maintenance. However, this may not be realistic, since until now the
budget transferred by the Ministry to the states for schools’ recurrent costs is almost
exclusively reserved for salaries.37
An alternative approach to promote maintenance may be to encourage local
communities to have a stake in the CECs. Part of the initial construction budget will
be allocated to trying to promote this. In addition, by allowing local communities to
make some use of the CECs (e.g. for meetings etc.) this may also increase their
interest in ensuring the facilities are maintained. However, it is unlikely that they will
ever consider themselves having as big an interest as they would with a primary
school where they send their children, and so ultimately the responsibility for
maintenance must fall on the government.
Despite rhetoric suggesting the arrangement will
be different for CECs, it is not clear in reality why it will be.
A third factor may also reduce the lifespan of CECs, which is if the quality of
construction is low. Given UNOPS strong track record in ensuring decent quality
construction this risk seems small.
Exchange rate volatility
UNOPS cost figures are in US dollars. A USD-GBP exchange rate of 1.57 has been
used for the monetised analysis. If the pound depreciated relative to the dollar then
construction costs would increase. If the exchange rate fell to 1.45 then the IRR falls
to 12.6%. Conversely if the exchange rate appreciates to 1.70 then the IRR
increases to 14.3%.
This suggests that project benefits are not excessively sensitive to the exchange
rate, which in any case is out of the control of the project until negotiations with
UNOPS are finalised. Nevertheless, this risk could be shifted to UNOPS once a
contract agreement is reached by setting a fixed exchange rate for the duration of the
contract.
CECs displace training that would have taken place anyway
If training that takes place at CECs simply displaces training that would have taken
place anyway at different venues, then project benefits become less compared to the
36 “Maintenance is the single most cost-effective investment a country can make. ... Of the estimated $6 billion annual price tag for EFA construction, $4 billion is to replace classrooms that are literally falling down.” Education for All: Building the Schools (2003), Education Notes, World Bank. 37 Page 92, Education in South Sudan: Status and Challenges for a New System (World Bank 2011)

Expansion of the County Education Centres Project
DFID Human Development Resource Centre ERW001P00AD66 22
counterfactual. For example, if half of the training that takes place at CECs would
have been undertaken anyway in the counterfactual, and the training would have
been of equivalent quality, then the project NPV becomes negative (-£5mn) and the
IRR falls to 7.7%. Given the severe shortage of usable venues for teacher training
and the very high amount of training required, as argued previously, this level of
displacement seems unlikely.
Furthermore, any training displaced by the CECs would probably have been of a
lower quality (or equivalently same quality for a higher cost) than what can be
achieved in purpose-built training centres. If the counterfactual assumes that half the
training at CECs would have taken place anyway, but the quality of the CEC training
is 20% better than for the counterfactual (productivity gain falls from 35% to 28% and
social returns from 10% to 8%), then the project NPV falls to £3mn but remains
positive.
Evidence on how much this quality differential would be is not available. However, it
seems implausible that the quality of training relative to cost will not be significantly
greater at CECs than if hosted at venues with more limited and less appropriate
facilities. Indeed if the quality differential is a little more than 20% then the project’s
NPV would actually increase compared to a counterfactual with half the training
taking place at alternative venues, since the counterfactual would itself have a
negative NPV.
Additionally the unquantified peace benefit from residential training courses bringing
different tribes together would still be lost in the counterfactual where training would
likely make use of disparate accommodation facilities rather than keeping all students
together. Evidently, the unquantified benefits from other uses of CECs (e.g. as
resource and examination centres) would also still be absent in the counterfactual.
Conclusions from risk and sensitivity analysis
Given the significant potential negative impact on project returns from all the above risks it is essential that a comprehensive risk mitigation strategy is adopted. Given that many of the risks to the project’s benefits are outwith the scope of this construction project, they must be directly considered when developing other DFID projects. This project should not go ahead if the ability to manage and mitigate these risks is believed unrealistic.
One method to decrease project risk may be to construct fewer CECs and focus on ensuring that the CECs which are constructed are fully utilised with high quality training which does not displace training that would have taken

Expansion of the County Education Centres Project
DFID Human Development Resource Centre ERW001P00AD66 23
place anyway. In this regard it is worth noting that even the Government’s very ambitious Social and Human Development Pillar only targets the construction of 10 CECs between 2011 and 2013.
An additional risk mitigation method worth exploring is to consider a cost-sharing
arrangement with the government for constructing the CECs. This would be an
effective means to increase the probability of full government buy-in and commitment
to using the CECs once constructed.
6 Incidence of costs / benefits
The project construction costs will fall entirely on DFID. The direct costs of training
will ultimately fall on GoSS. However, in the short term it is likely that a significant
share of training costs will fall on development partners (including DFID). The
majority of the indirect costs of training (in terms of the opportunity cost of teachers’
time) will fall on teachers themselves (75%), although some of the training will
potentially disrupt term-time teaching, implying a cost to GoSS and in turn the
teachers’ students (25%).
There is also a significant cost burden for GoSS from having to pay higher salaries
for trained teachers. As shown below this cost will be partly if not fully offset by the
increased effectiveness of teachers which reduces other education costs for
government (see below).
The benefits from teacher training are enjoyed by:
• Students (who get better quality education)
• Society at large (which gets social benefits from both teachers’ and students’
education such as for health, environment, political stability etc.)
• GoSS (as teachers become more effective by lowering repetition, drop-out,
making better use of complementary inputs such as textbooks, teaching
bigger classes for same quality etc.; and as better quality teachers improve
the effectiveness of other teachers)
• Teachers (who get higher salaries as teachers, increased earnings potential if
leave teaching, and increased benefits outside of work)
It is extremely difficult to estimate the exact incidence of the benefits. However, the
biggest beneficiaries ultimately are likely to be the children who get a better quality
education from having better quality teachers.

Expansion of the County Education Centres Project
DFID Human Development Resource Centre ERW001P00AD66 24
6 Macroeconomic impact
The project would be expected to have a very positive macroeconomic impact. Much
evidence shows the link between improving the quality of education and increasing
economic growth. Indeed there is emerging evidence that the benefits of education
for economic growth come entirely through education quality rather than education
quantity. A recent cross-country study finds that a one standard deviation
improvement in student test scores is associated with a 2% higher annual growth
rate.38
In addition the potential project impact for peace and stability (through residential
courses bringing different tribes together and through the provision of adequate
quality education services more generally) would in turn be extremely beneficial to
South Sudan’s overall economic development.
39
7 Fiscal impact
This aspect may ultimately prove to
be the project’s greatest beneficial impact for the people of South Sudan.
Factors increasing GoSS spending:
• Operational costs of CECs, including conducting training (in short-term likely
to be covered partly by development partners, in longer-term is the
responsibility of GoSS)
• Increased salaries and pension contributions required to reward trained
teachers40
• GoSS increased commitment to education relative to other sectors
Factors decreasing GoSS spending / increasing GoSS revenue:
• Decreased costs to GoSS from better quality teachers lowering repetition and
drop-out rates; making better use of complementary inputs such as textbooks;
teaching larger class sizes for the same quality etc.
• Decreased costs to GoSS from better quality teachers improving the quality of
other teachers, which in turn further lowers repetition, drop-out rates etc.
38 Hanushek & Woessmann (2008), “The role of cognitive skills in economic development”, Journal of Economic Literature, 46:3 39 Simply in economic terms Collier & Hoeffler (2007) estimate that the typical civil war (lasting 7 years) for a poor country costs (in discounted present value) $65 billion in terms of lost GDP, health costs, extra military expenditure and similar costs for neighbouring countries. This does not include the massive social and psychological costs of war, nor the global costs in terms of increased risk of terrorism etc. Pages 725-30 of “Civil War” (2007) in Handbook of Defense Economics, Volume 2, Sandler & Hartley (eds). 40 Note that pension contributions are 8% of teacher salaries, and so are incorporated into salary costs
Expansion of the County Education Centres Project
DFID Human Development Resource Centre ERW001P00AD66 25
• Increased tax revenue, eventually, from more and better educated kids
getting higher incomes
• Savings from other sectors through the broader social benefits of education,
particularly in terms of better public health, decreased crime and reduced
political instability
Overall it is likely in the short to medium term the fiscal burden on GoSS is
significantly negative. In the longer term as the benefits of providing better quality
education are experienced, the overall fiscal impact would most probably become
significantly positive.
8 Financial sustainability
The long-term sustainability of this project’s benefits is dependent on the government
taking full responsibility for the running of CECs as well as paying teacher salaries
such that teacher attrition does not increase.
This is a major risk for the project. GoSS contributions to education have fluctuated
between 6% and 8% of the total government budget since 2006.41 This is well below
the EFA-FTI benchmark of 20% - of the total recurrent budget. However, given the
post-conflict context demanding significant resources for defence and peace-building
and the fact that the overall GoSS budget is actually relatively large compared to
most post-conflict countries42
More worrying is that 98% of government revenues come from oil.
the current contribution to education is not too
discouraging.
43 This makes
budgetary revenue both unpredictable (volatility in oil prices and external shocks can
cause budgetary crises as in 2009) and unsustainable since oil reserves are
predicted to be declining within 5 years and exhausted within 20-30 years.44
Continuing expansion of the education sector requires significant, sustained
resources to be allocated and disbursed to the education sector.45
Hence, development partner involvement in South Sudan’s education sector will
almost certainly need to continue into the longer term for the benefits from this
project (and other initiatives) to be financially sustainable.
41 Page 90, Education in South Sudan: Status and Challenges for a New System (World Bank 2011) 42 Page 11, World Bank (2009), “Sudan: The road toward sustainable and broad based growth”, Country Economic Memorandum 43 Page 31, Education in South Sudan: Status and Challenges for a New System (World Bank 2011) 44 Page 8, World Bank (2009), “Sudan: The road toward sustainable and broad based growth” 45 Enrolment quadrupled between 2006 and 2009, and is targetted to continue to expand rapidly (even in 2009 the Net Enrolment Rate was only 46%, implying that more than half the children of school age do not actually go to school) (Social & Human Development Pillar 2011).
Expansion of the County Education Centres Project
DFID Human Development Resource Centre ERW001P00AD66 26
9 Attribution to DFID
The attribution of this project’s benefits to DFID is assumed to be 56%. This is the
pro rata share of total inputs which are funded by DFID. The direct inputs are the
construction costs. The indirect inputs are the costs of running teacher training. If
some of the teacher training ends up being funded by DFID this will be additionally
attributable to DFID. It could be argued that this is a conservative estimate since
without DFID completing the construction it is likely that no consequent training would
take place at the CECs.
When considering only DFID’s input costs and the percentage of benefits attributed
to DFID, the Net Present Value becomes £5.9mnand the Internal Rate of Return
12.6%.
10 Annex A - Full methodology for cost-benefit analysis
To calculate the overall economic costs and benefits of the project a number of
assumptions are required:
• First four years following construction two separate cohorts enrolled on full
INSET stages of three months each. This implies a total of 200 teachers
being trained at each CEC, utilising CECs for 6 months each year
CEC utilisation:
• In addition for first four years following construction two months of other
training is conducted at CECs
• From years 5-15 following construction CECs are utilised 4 months each year
for teacher (or equivalent) training
• Following completion of training teachers are assumed to continue as
teachers for an average of 10 years. This average figure accounts for some
who will leave sooner and others who will hopefully continue for more than 20
years.
Teacher retention:
Expansion of the County Education Centres Project
DFID Human Development Resource Centre ERW001P00AD66 27
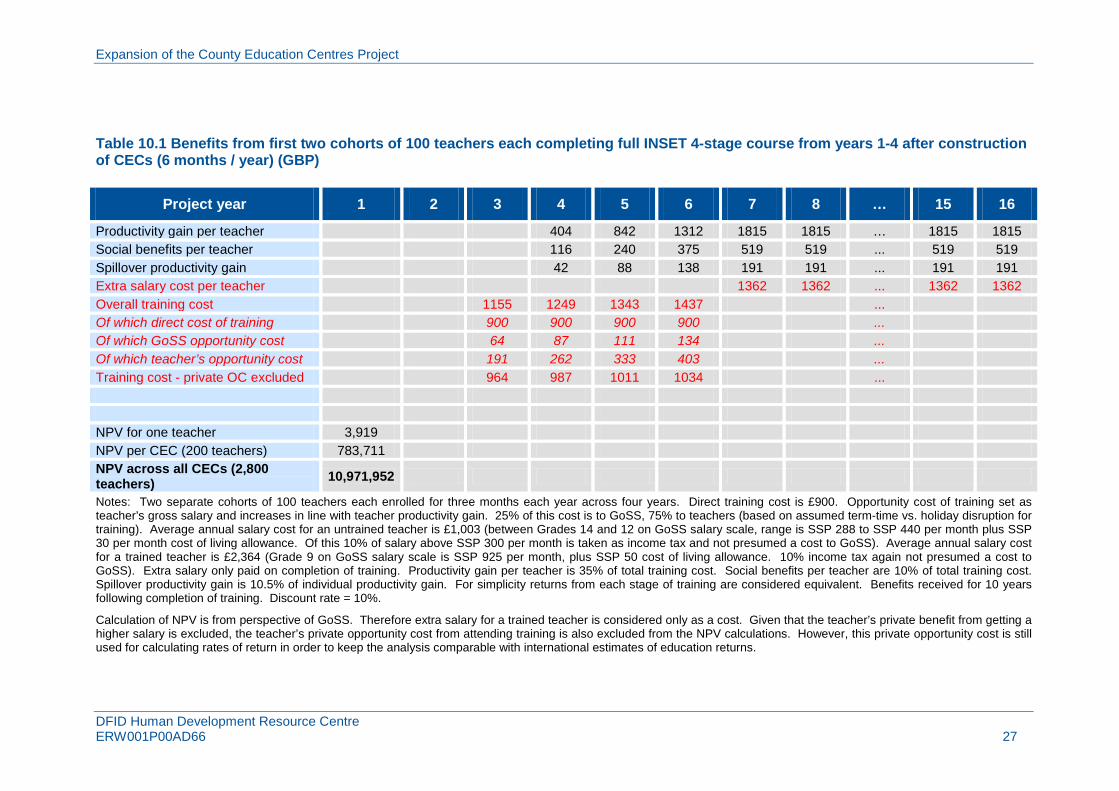
Table 10.1 Benefits from first two cohorts of 100 teachers each completing full INSET 4-stage course from years 1-4 after construction of CECs (6 months / year) (GBP)
Project year 1 2 3 4 5 6 7 8 … 15 16
Productivity gain per teacher 404 842 1312 1815 1815 … 1815 1815 Social benefits per teacher 116 240 375 519 519 ... 519 519 Spillover productivity gain 42 88 138 191 191 ... 191 191 Extra salary cost per teacher 1362 1362 ... 1362 1362 Overall training cost 1155 1249 1343 1437 ... Of which direct cost of training 900 900 900 900 ... Of which GoSS opportunity cost 64 87 111 134 ... Of which teacher’s opportunity cost 191 262 333 403 ... Training cost - private OC excluded 964 987 1011 1034 ... NPV for one teacher 3,919 NPV per CEC (200 teachers) 783,711 NPV across all CECs (2,800 teachers) 10,971,952
Notes: Two separate cohorts of 100 teachers each enrolled for three months each year across four years. Direct training cost is £900. Opportunity cost of training set as teacher’s gross salary and increases in line with teacher productivity gain. 25% of this cost is to GoSS, 75% to teachers (based on assumed term-time vs. holiday disruption for training). Average annual salary cost for an untrained teacher is £1,003 (between Grades 14 and 12 on GoSS salary scale, range is SSP 288 to SSP 440 per month plus SSP 30 per month cost of living allowance. Of this 10% of salary above SSP 300 per month is taken as income tax and not presumed a cost to GoSS). Average annual salary cost for a trained teacher is £2,364 (Grade 9 on GoSS salary scale is SSP 925 per month, plus SSP 50 cost of living allowance. 10% income tax again not presumed a cost to GoSS). Extra salary only paid on completion of training. Productivity gain per teacher is 35% of total training cost. Social benefits per teacher are 10% of total training cost. Spillover productivity gain is 10.5% of individual productivity gain. For simplicity returns from each stage of training are considered equivalent. Benefits received for 10 years following completion of training. Discount rate = 10%.
Calculation of NPV is from perspective of GoSS. Therefore extra salary for a trained teacher is considered only as a cost. Given that the teacher’s private benefit from getting a higher salary is excluded, the teacher’s private opportunity cost from attending training is also excluded from the NPV calculations. However, this private opportunity cost is still used for calculating rates of return in order to keep the analysis comparable with international estimates of education returns.
Expansion of the County Education Centres Project
DFID Human Development Resource Centre ERW001P00AD66 28
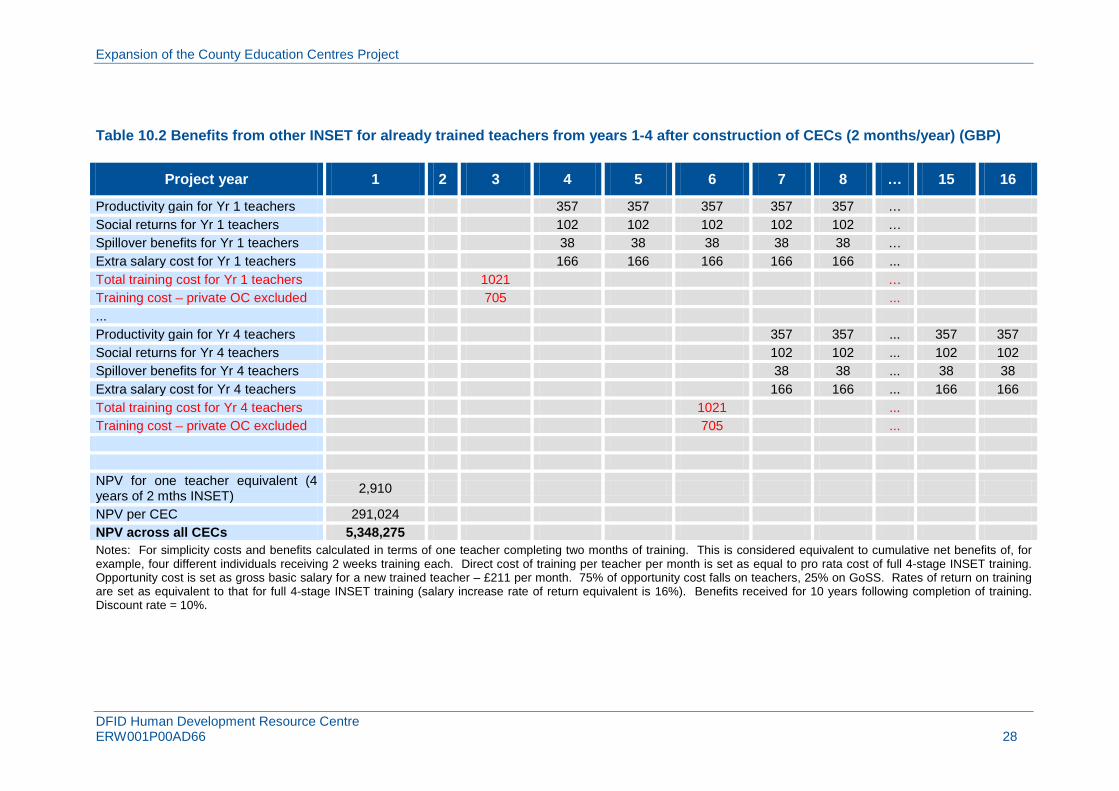
Table 10.2 Benefits from other INSET for already trained teachers from years 1-4 after construction of CECs (2 months/year) (GBP)
Project year 1 2 3 4 5 6 7 8 … 15 16
Productivity gain for Yr 1 teachers 357 357 357 357 357 … Social returns for Yr 1 teachers 102 102 102 102 102 … Spillover benefits for Yr 1 teachers 38 38 38 38 38 … Extra salary cost for Yr 1 teachers 166 166 166 166 166 ... Total training cost for Yr 1 teachers 1021 … Training cost – private OC excluded 705 ... ... Productivity gain for Yr 4 teachers 357 357 ... 357 357 Social returns for Yr 4 teachers 102 102 ... 102 102 Spillover benefits for Yr 4 teachers 38 38 ... 38 38 Extra salary cost for Yr 4 teachers 166 166 ... 166 166 Total training cost for Yr 4 teachers 1021 ... Training cost – private OC excluded 705 ... NPV for one teacher equivalent (4 years of 2 mths INSET) 2,910
NPV per CEC 291,024 NPV across all CECs 5,348,275 Notes: For simplicity costs and benefits calculated in terms of one teacher completing two months of training. This is considered equivalent to cumulative net benefits of, for example, four different individuals receiving 2 weeks training each. Direct cost of training per teacher per month is set as equal to pro rata cost of full 4-stage INSET training. Opportunity cost is set as gross basic salary for a new trained teacher – £211 per month. 75% of opportunity cost falls on teachers, 25% on GoSS. Rates of return on training are set as equivalent to that for full 4-stage INSET training (salary increase rate of return equivalent is 16%). Benefits received for 10 years following completion of training. Discount rate = 10%.

Expansion of the County Education Centres Project
DFID Human Development Resource Centre ERW001P00AD66 29
Table 10.3 Net benefits from INSET training from 5 years after CEC construction (GBP)
Project year 1 2 … 7 8 9 … 17 … 26 27
Productivity gain for Yr 5 teachers … 715 715 … 715 … 0 0 Social returns for Yr 5 teachers ... 204 204 ... 204 ... 0 0 Spillover benefits for Yr 5 teachers ... 75 75 ... 75 ... 0 0 Extra salary cost for Yr 5 teachers ... 333 333 ... 333 ... 0 0 Total training cost for Yr 5 teachers ... 2,042 ... ... Training cost – private OC excluded ... 1,411 ... ... ... Productivity gain for Yr 15 teachers ... ... 0 ... 715 715 Social returns for Yr 15 teachers ... ... 0 ... 204 204 Spillover benefits for Yr 15 teachers ... ... 0 ... 75 75 Extra salary cost for Yr 15 teachers ... ... 0 ... 333 333 Total training cost for Yr 15 teachers ... ... 2,042 ... Training cost – private OC excluded ... ... 1,411 ... NPV for one teacher equivalent trained (11 years for 6 months each year)
10,693
NPV per CEC 1,069,270 NPV across all CECs 14,969,780 Notes: Training assumed to continue until 15 years after CEC construction for four months per year. For simplicity costs and benefits calculated in terms of one teacher completing four months of training. This is considered equivalent to cumulative net benefits of, for example, four different individuals receiving one month training each. Direct cost of training per teacher per month is set as equal to pro rata cost of full 4-stage INSET training. Opportunity cost is set as gross basic salary for a new trained teacher – £211 per month. 75% of opportunity cost falls on teachers, 25% on GoSS. Rates of return on training are set as equivalent to that for full 4-stage INSET training (salary increase rate of return equivalent is 16%). Benefits received for 10 years following completion of training. Discount rate = 10%.

Expansion of the County Education Centres Project
DFID Human Development Resource Centre ERW001P00AD66 30
Table 10.4 Summary Net Present Values (GBP Millions)
Summary NPVs GBP Millions DFID direct project costs 20.7 Teacher productivity gains 57.8 Social returns 16.5 Spillover benefits to other teachers 6.1 Extra salary cost 30.2 Direct training cost 16.5 GoSS training opportunity cost 2.4 Teacher private opportunity cost 7.2 Total project NPV (from GoSS perspective) 10.6 Total project NPV from South Sudan perspective 33.6 Notes: Net Present Value is calculated from perspective of GoSS. This means extra teacher salaries are simply a cost (and not a corresponding benefit to the teachers that receive them), while the private opportunity cost to teachers of attending training is not considered a cost. If the overall NPV was calculated such that teachers’ private costs and benefits were taken into consideration then it would in fact be considerably higher at £33.6 million (and this figure still excludes private benefits to teachers who leave the teaching profession but have higher productivity in other sectors because part of the skills developed in training can equally be applied to other jobs).

Expansion of the County Education Centres Project
DFID Human Development Resource Centre ERW001P00AD66 31
11 Annex B – Is UNOPS good Value for Money?
Given the choice to contract UNOPS to manage the construction of the CECs, it is vital to ensure that they are providing good value for money.
This section breaks down the significant cost components of the UNOPS construction budget to assess whether their estimates represent good
value for money compared to other construction projects in South Sudan.
The CECs already have 4 classrooms, an administration block, and 8 latrines. This phase of construction is to build 2 dormitory blocks (for 50
students each); a kitchen, dining area and food store; 2 four-door pit-latrine blocks for the dormitories; a 2-bedroomed house for the CEC
principal; an 8-bedroomed house for other CEC staff; 2 two-door pit-latrine blocks outdoors for the staff accommodation; fencing and gates
around compound with small guard house; water supply and electricity generation.
The unit cost for completion of each CEC ranges from $1,363,860 to $2,073,690 depending on the location. The average unit cost is
$1,612,376 or £1,026,991.
Table 11.1 Overall CEC Unit Cost (USD)
Average Eastern Equatoria
Lakes Upper Nile Northern Bahr-El-Ghazal
Central Equatoria
Western Equatoria
Warrap
$1,612,376 $1,486,290 $1,567,930 $2,073,690 $1,778,000 $1,363,860 $1,363,860 $1,653,000
1.
Much of the construction can be broken down into a unit cost per square metre (this is true for the dormitories, kitchen, dining hall, store room,
principal’s, staff and guard houses). This varies from $710/m2 in Western and Central Equatoria to $1,215 in Upper Nile. This cost is extremely
Unit cost per square metre

Expansion of the County Education Centres Project
DFID Human Development Resource Centre ERW001P00AD66 32
high when compared to DFID’s international benchmarks for education construction projects. However, they are more reasonable when
considered in line with the South Sudan context, which has extremely high costs of importing raw materials because of poor transport
infrastructure.

Expansion of the County Education Centres Project
DFID Human Development Resource Centre ERW001P00AD66 33
Table 11.2 Unit costs per metre squared (USD)
USD/Metre squared Average Eastern Equatoria Lakes Upper
Nile Northern Bahr-
El-Ghazal Central
Equatoria Western
Equatoria Warrap
CEC Phase 2 886 815 855 1215 1000 710 710 900
Previous UNOPS in same states
(2010-11) 787 677 712 1010 947 589 589 988
DFID community schools
construction project (UNOPS 2011)a 629 580 - 665 644 - - 627
BSF unit costs (2010-11)b 620 736c 587 628 379 970 393 648d
CEC Phase 1 2007e 600
MDTF primary schools 2009e 450
Regional Benchmarksf
International competitive bidding 270
National/local competitive bidding 180
Community managed programmes 100
a = These are unit costs for classroom construction. Unit costs for kitchen and store room were lower at $540 and $500 respectively.
b = BSF costs generally inflated by including office blocks as well as classrooms in total cost figure but only dividing by classroom size for unit cost.
c = Unit cost inflated by borehole and latrine not separated from costs.
d = Unit cost figure from 2009/10 because latest available. All other BSF figures from 2010/11.
e = Estimates from Ministry of Education.
f = From DFID Guidance Note July 2010, “Delivering cost effective and sustainable school infrastructure” by Bonner, Das, Kalra, Leathes and Wakeham
Expansion of the County Education Centres Project
DFID Human Development Resource Centre ERW001P00AD66 34
As can be seen in Table B2 the proposed unit costs for this construction project are at the top of the range. These costs are based on previous
UNOPS experience in the same states in the past year (average unit cost $787). An increment of 20% has been added to these costs (for all
states except Northern Bahr-El-Ghazal and Warrap), 8% of which for the more sophisticated design required (partition walls, tiling, electrical
points etc.) and 12% for inflationary increases in construction materials.
These costs seem too high for two reasons. First, the UNOPS construction projects which are used as a baseline to which the increment is
being added to are already more expensive than other comparable construction projects. The average unit cost for both DFID’s community
school construction project (also implemented by UNOPS) and for BSF’s various school construction projects46
Ministry of Education estimates for construction from phase 1 of CEC construction (2007) and MDTF primary school construction (2009) are less
up-to-date than the other comparator figures, but still give further weight to the evidence that the proposed CEC phase 2 construction costs are
too high.
are $629 and $620 respectively,
considerably lower than the average UNOPS baseline cost of $787. Indeed the BSF unit costs are somewhat inflated as they fail to strip out
non-classroom costs such as offices and in one case a borehole and latrines.
The second reason these costs seem too high is that the 20% increment is likely excessive. The necessity of a more sophisticated design (e.g.
tiling) across all the CEC construction should be carefully considered. If deemed surplus to requirements a lower unit cost should be negotiated.
In addition, different unit costs for different parts of the construction should be requested. For example, perhaps the more sophisticated design
is more relevant to staff housing than for the kitchen, dining area and store room. In the DFID-funded UNOPS Community School Construction
project, unit costs for kitchens and store rooms are notably lower than those for classrooms (an average of $520 rather than $629).
46 The Basic Services Fund is a DFID project which has constructed a number of schools in South Sudan. Construction is generally implemented by a range of different NGOs.

Expansion of the County Education Centres Project
DFID Human Development Resource Centre ERW001P00AD66 35
Furthermore, the inflationary factors driving up unit costs are likely short-term, and should be closely monitored until negotiations are finalised.
The North-South border will not be closed indefinitely, and equally the Government is starting to make strong efforts towards closing down illegal
customs points. If progress is made while negotiations are ongoing with UNOPS, then lower costs should be negotiated.
Summary recommendations on $/m2 unit costs:
• Baseline unit costs from BSF experience should be targeted
• Different unit costs for different parts of the construction should be requested based on each part’s relative need for more sophisticated design
• Short term cost factors driving up unit costs should be carefully monitored until contract is finalised
2.
Table 11.3 Unit costs per latrine (stanch)
Unit costs for latrines
USD / Latrine (stanch) Average Eastern Equatoria Lakes Upper
Nile Northern Bahr-
El-Ghazal Central
Equatoria Western
Equatoria Warrap
CEC Phase 2 5,036 4,250 5,000 6,250 5,750 4,250 4,250 5,500
Previous UNOPS (2010-11) 6,445 6,445 - - - - - -
DFID community schools
construction project (UNOPS 2011) 2,250 1,500 - 3,000 2,400 - - 2,100
BSF (2009/10)a 1,426 1,471 - 2,206 1,426 1,904 823 724
MOE estimate 3,000
DFID regional benchmark 1,250
a = Overall average for BSF 2010/11 is $1,485, but state breakdown not available from data.
Expansion of the County Education Centres Project
DFID Human Development Resource Centre ERW001P00AD66 36
The average unit cost for latrines is $5,036. This compares to a unit cost of $2,250 per latrine for the UNOPS implemented DFID Community
School Construction project and a cost of just $1,426 for BSF funded latrines. There is no apparent justification for the extra cost at CECs, so it
seems clear this unit cost needs to be reduced.
A further recommendation would be for the latrines at one of the dormitories to be separated into two separate two door latrines, rather than one
block of four. This would allow for girls’ latrines to be located separately from boys’ latrines. In the reasonable future the majority of teachers at
the CECs will be male since only 12% of teachers are female.47
The unit cost for two two-door latrines will be marginally higher than for one four-door latrine. The present UNOPS estimates suggest an
average increase of $300 per latrine. This would seem good value-for-money if it attracts more female teachers, which is a major goal of the
overall Teacher Professional Development Initiative.
As such it is impractical for one dormitory to be dedicated to women, and one to
men (although this should be an eventual goal as gender equality in the teaching workforce is achieved). One of the dormitories will need to be
used by both men and women, and to make the facility more attractive for female teachers, it would be appropriate to ensure they have separate
sanitary facilities.
Summary recommendations on latrine unit costs:
• Latrine unit costs must be reduced
• One dormitory should have separate latrines to allow for both boys and girls in same dormitory block
47 Page 110 of “Education in South Sudan: Status and Challenges for a New System (World Bank 2011)

Expansion of the County Education Centres Project
DFID Human Development Resource Centre ERW001P00AD66 37
3.
Table 11.4 Water supply and unit costs
Unit cost for water supply
USD / Water source Average Eastern
Equatoria Lakes Upper
Nile
Northern Bahr-El-Ghazal
Central Equatoria
Western Equatoria
Warrap
CEC Water Supply 1 (borehole with hand pump) 16,000 13,000 15,000 23,000 18,000 13,000 13,000 17,000
CEC Water Supply 2 (borehole with electric
pump)a 50,429 45,000 50,000 60,000 55,000 45,000 45,000 53,000
CEC Water Supply 3 (rainwater harvesting)b 10,429 8,000 10,000 15,000 12,000 8,000 8,000 12,000
Total CEC Water Supply Cost 76,857
Regional benchmark for school water supply cost 7,500
a = Borehole with submersible pump and 10,000 litre elevated steel water tank
b = Rainwater harvesting with 20,000 litre plastishell tank
The average unit cost for a borehole fitted with a hand pump is $16,000; for a borehole with electric submersible pump and elevated 10,000 litre
water tank is $50,429; and for rainwater harvesting with 20,000 litre tank is $10,429. The overall unit cost for water supply to the CEC is
$76,857.
The DFID international benchmark for providing a school with a water source is $7,500.48
48 Bonner et al. (2010), “Delivering cost effective and sustainable school infrastructure”, DFID Guidance Note
This is seemingly based on one source of water
supply. As such the key question is whether all three sources with such a high storage capacity are necessary. The main water supply will be

Expansion of the County Education Centres Project
DFID Human Development Resource Centre ERW001P00AD66 38
the borehole with electric pump. Rainwater harvesting cannot be relied on as a year-round water source, while the borehole with hand pump is
designed as a backup for when the electric pump is not working.
A recommendation would be to explore the possibility of putting both the hand pump and electric pump at the same borehole, rather than
needing to construct two separate boreholes. This is possible as long as the casing is large enough to accommodate both pumps. However, in
South Sudan the standard casing is only 4-inch, which is not large enough. As such it seems important to investigate how feasible it would be to
source a different casing size.
Table 11.5 Unit costs for boreholes with hand pump
USD / Borehole with hand pump Average Eastern
Equatoria Lakes Upper Nile
Northern Bahr-El-Ghazal
Central Equatoria
Western Equatoria Warrap
CEC Water Supply 1 (borehole with
hand pump) 16,000 13,000 15,000 23,000 18,000 13,000 13,000 17,000
Previous UNOPS (2010/11) 10,500 10,500
DFID Community Schools
Construction Project (UNOPS 2011) 20,500 12,000 - 30,000 20,000 - - 20,000
BSF (2009/10)a 14,210 14,475 12,560 13,345 12,993 12,414 19,383 14,301
BSF Boreholes in Sediment 13,208b
BSF Boreholes in Basement 15,548b
a = BSF cost data for 2010/11 not yet finalised, as costs may increase due to possibility of dry boreholes.
b = Average across all BSF states, not only the 7 states considered here.
Comparing the individual water source unit costs, the borehole with hand pump cost is actually lower than DFID’s Community Schools
Construction Project, but higher than the previous UNOPS experience example given from one of the same states, and higher than costs from
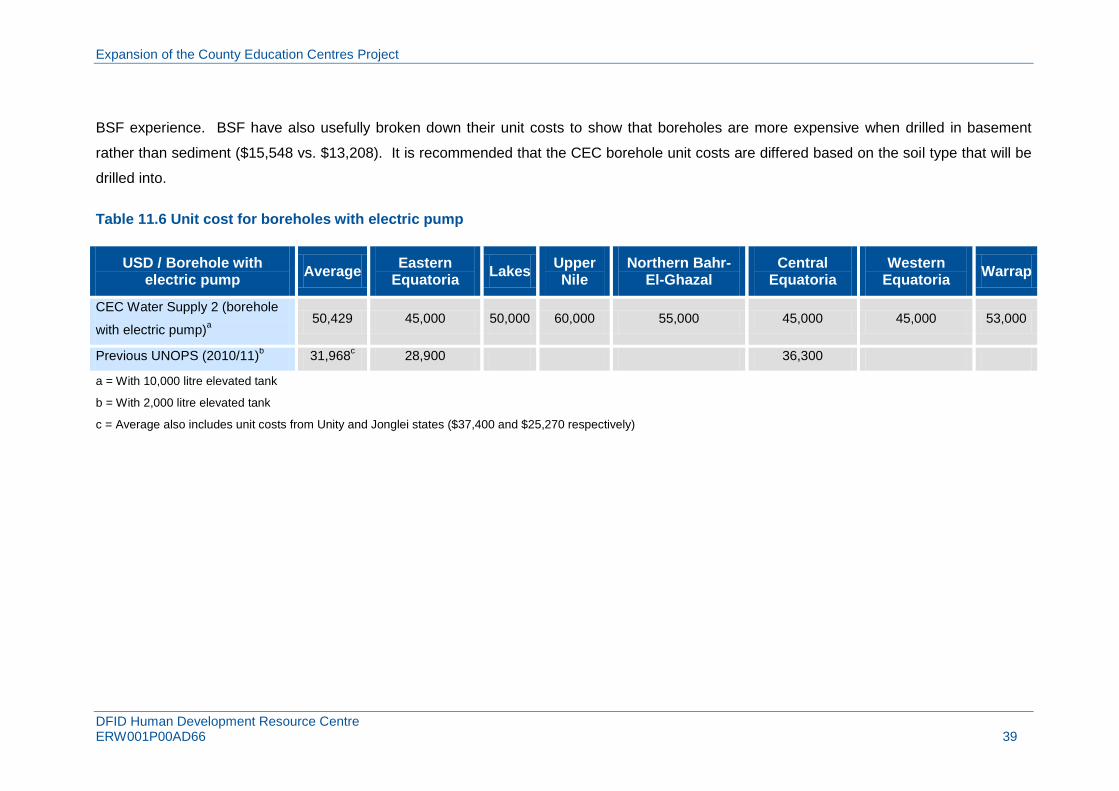
Expansion of the County Education Centres Project
DFID Human Development Resource Centre ERW001P00AD66 39
BSF experience. BSF have also usefully broken down their unit costs to show that boreholes are more expensive when drilled in basement
rather than sediment ($15,548 vs. $13,208). It is recommended that the CEC borehole unit costs are differed based on the soil type that will be
drilled into.
Table 11.6 Unit cost for boreholes with electric pump
USD / Borehole with electric pump
Average Eastern Equatoria Lakes Upper
Nile Northern Bahr-
El-Ghazal Central
Equatoria Western
Equatoria Warrap
CEC Water Supply 2 (borehole
with electric pump)a 50,429 45,000 50,000 60,000 55,000 45,000 45,000 53,000
Previous UNOPS (2010/11)b 31,968c 28,900 36,300
a = With 10,000 litre elevated tank
b = With 2,000 litre elevated tank
c = Average also includes unit costs from Unity and Jonglei states ($37,400 and $25,270 respectively)

Expansion of the County Education Centres Project
DFID Human Development Resource Centre ERW001P00AD66 40
Table 11.7 Unit cost for rainwater harvesting
USD / Rainwater harvesting Average Eastern Equatoria Lakes Upper
Nile Northern Bahr-
El-Ghazal Central
Equatoria Western
Equatoria Warrap
CEC Water Supply 3 (rainwater
harvesting)a 10,429 8,000 10,000 15,000 12,000 8,000 8,000 12,000
Previous UNOPS (2010/11)b 3,100 3,100
DFID Community Schools
Construction project (UNOPS 2011)c 2,200 1,500 - 2,800 2,000 - - 2,500
Unit cost per litre
CECs 0.52 0.40 0.50 0.75 0.60 0.40 0.40 0.60
Previous UNOPS 1.55 1.55
DFID Community Schools
Construction Project 2.20 1.50 2.80 2.00 2.50
a = With 20,000 litre capacity
b = With 2,000 litre capacity
c = With 1,000 litre capacity
The unit cost of the borehole with electric pump is higher than other UNOPS experience, although this is likely partly explained by having a
10,000 litre tank rather than a 2,000 litre tank. The unit cost for rainwater harvesting is most appropriately considered in unit cost per litre
capacity. Previous UNOPS projects have installed rainwater harvesting with a capacity of just 1,000 or 2,000 litres. The CECs will have a
capacity of 20,000 litres and as such they have a considerably lower unit cost per litre.
Expansion of the County Education Centres Project
DFID Human Development Resource Centre ERW001P00AD66 41
Summary recommendations on water supply unit costs:
• Feasibility of combining both hand and electric pumps at same borehole should be investigated
• Borehole with hand pump unit cost should be reduced in line with BSF costs
• Borehole unit costs should be differentiated based on soil types
4.
The principal power source for the CECs will be solar panels. In South Sudan there have not been many construction projects of an equivalent
scale that have involved solar panels, so it has not been possible to get a benchmark cost figure.
Electricity generation
49
There will also be a back-up 25kVA generator at each CEC. The unit cost of the generator in terms of its Juba price is $19,000.
The average cost of solar panels per CEC is
$135,429. In terms of solar panels per metre squared the average unit cost is $128. If more information becomes available on the costs of solar
panels in South Sudan, these unit costs will be useful benchmark comparators.
50
It has been possible to compare the lifecycle costs of having solar panels rather than a generator. This analysis strongly supports the choice of
solar panels as the principal power source for CECs.
This is in line
with the unit cost from a private sector quote from Ezentus for a 20kVA generator of $14,935 and for a 30kVA generator of $24,650.
49 ESP International, a private construction company with experience of installing solar panels in Juba was contacted. They offered to provide a quote but needed full design specifications for the CECs including projected power usage. This could be taken further as design negotiations continue, but was beyond the scope of the present economic appraisal. 50 This cost is then marked up for each state to include a 30-40% delivery cost and $11,500 for housing, cabling and connection.

Expansion of the County Education Centres Project
DFID Human Development Resource Centre ERW001P00AD66 42
Table 11.8 Lifecycle costs of solar panels vs. diesel 25kVA generator
Solar Panels 25kVA Generator
Installation cost per CEC $135,429 (incurred anyway for back-up)
Fuel Cost & Maintenance per year $2,000 $23,200
Saving per year $21,200
Time to pay off investment 6.4 years
Savings if 25 year life cycle $394,571
Life cycle savings for 14 CECs $5.5 million
A 25kVA generator would cost about $23,200 per year to run in terms of fuel costs and maintenance.51
As such the investment in solar panels rather than reliance on a generator would seem excellent value for money. There are also significant
benefits to the environment from using solar panels rather than high-carbon producing generators which should be added to the direct monetary
savings. Together these present a very strong justification for the choice of solar panels.
Solar panels would require significantly
less maintenance costs and no fuel costs. The unit cost for solar panels per CEC is $135,429. Assuming 50% maintenance costs for solar
panels compared to a generator, it would take less than 6 and a half years for the solar panels to justify their extra investment. Assuming a
minimum 25-year lifespan for the CECs, this would imply a saving of $394,571 for each CEC compared to using a generator. This is a saving of
$5.5million across all 14 CECs.
51 Assuming consumption of 4.5 litres per hour, 8 hours per day, 22 days per month and 12 months per year. Maintenance is estimated at $4,000 per year.
Expansion of the County Education Centres Project
DFID Human Development Resource Centre ERW001P00AD66 43
A risk that will have to be carefully monitored, however, is that there is not sufficient technical capacity within South Sudan to repair solar panels
should there be any troubles. This could mean that should the solar panels have any problems, CECs may simply use their back-up generators
instead anyway.
Summary recommendations on electricity generation unit costs:
• Installation of solar panels is sensible based on lifecycle cost comparison vs. generators
• Technical capacity within South Sudan for repairing solar panels should be investigated
• Appropriate cost of solar panels should be independently verified by an engineer or through a full private sector quote

Expansion of the County Education Centres Project
DFID Human Development Resource Centre ERW001P00AD66 44
5.
Table 11.9 Unit costs for furniture
Furniture
USD / unit cost per classroom Average Eastern Equatoria Lakes Upper
Nile Northern Bahr-
El-Ghazal Central
Equatoria Western
Equatoria Warrap
CECsa 9,036 7,500 8,750 11,250 10,000 7,500 7,500 10,750
DFID Community School
Construction project Primary
Schoolsb
2,500
DFID Community School
Construction project Secondary
Schoolsb
6,250
UNHCR - TTIsc ?
Regional benchmarkd 2,000
a = Total cost is for furnishing four classrooms as well as offices. Unit cost calculated by dividing by 4, so likely overestimating costs per classroom since also includes furnishing for offices
b = Current guidelines are for $20,000 per primary school and $50,000 per secondary school (with 8 classrooms per school). Furnishing has not yet been done, so these are indicative costs only
c = Data not yet made available by UNHCR
d = Cost for furnishing a classroom for 60 students. Bonner et al. (2010), “Delivering cost effective and sustainable school infrastructure”
The average unit cost for furnishing a CEC’s classrooms and offices is set at $36,143. This is equivalent to a unit cost per classroom of $9,036
(although note that this figure is inflated by furnishing the offices). This unit cost per classroom is higher than the amount budgeted for by the
DFID Community School Construction project ($2,500 and $6,250 for a primary and secondary classroom respectively) and more than 4 times

Expansion of the County Education Centres Project
DFID Human Development Resource Centre ERW001P00AD66 45
higher than DFID’s regional benchmark cost for furnishing a classroom. As such there would seem to be clear scope for cost reductions,
although this should be based on a careful analysis of exactly what is planned to be included in the furnishings.
The Japanese government funded the furnishing of a TTI, which was implemented by UNHCR. They have not yet made cost figures available;
however, this would also be a useful cost comparison if the data could be found.
The cost of furnishing the rest of the CECs is on average $115,429. This is to cover all furniture and appliances for the two dormitory blocks,
two staff houses, the kitchen and dining hall. Given this high cost, it will be necessary to investigate the inventory item by item to see if
everything included is necessary and whether the cost is justifiable.
Summary recommendations on furniture unit costs:
• Costs per classroom seem high and should probably be reduced
• Costs for furnishing the rest of CECs are very high and need to be investigated in close detail item by item to see if any cost reductions are appropriate
In general the costings presented by UNOPS are not completely unreasonable but they do seem higher than necessary. DFID and/or USAID should push hard to lower these costs as negotiations move forward. The possibility of contracting other management agents should not be dismissed, since without this risk of losing business UNOPS do not have any major incentive to lower their costs.
Overall summary and recommendations on UNOPS costs
If another management agent were to be contracted then the cost-savings from combining this project with USAID’s TTI construction project would be lost. However, the savings from lowering unit costs (e.g. to BSF levels) could potentially outweigh this, implying that this option should not be completely ruled out.

Expansion of the County Education Centres Project
DFID Human Development Resource Centre Cambridge Education, Murdoch House
Station Road, Cambridge, CB1 2RS
T: +44 (0) 1223 463 816 F: +44 (0) 1223 461 007 E: [email protected]
W: www.camb-ed.com
Disclaimer
The DFID Human Development Resource Centre (HDRC) provides technical assistance and information to the British Government’s Department for International Development (DFID) and its partners in support of pro-poor programmes in education and health including nutrition and AIDS. The HDRC services are provided by three organisations: HLSP, Cambridge Education (both part of Mott MacDonald Group) and the Institute of Development Studies.
This document has been prepared by the HDRC on behalf of DFID for the titled project or named part thereof and should not be relied upon or used for any other project without an independent check being carried out as to its suitability and prior written authority of Mott MacDonald being obtained. Mott MacDonald accepts no responsibility or liability for the consequences of this document being used for a purpose other than the purposes for which it was commissioned. Any person using or relying on the document for such other purpose agrees, and will by such use or reliance be taken to confirm his agreement, to indemnify Mott MacDonald for all loss or damage resulting there from. Mott MacDonald accepts no responsibility or liability for this document to any party other than the person by whom it was commissioned.
To the extent that this report is based on information supplied by other parties, Mott MacDonald accepts no liability for any loss or damage suffered by the client, whether contractual or tortious, stemming from any conclusions based on data supplied by parties other than Mott MacDonald and used by Mott MacDonald in preparing this report.