Embed Size (px)
Citation preview

Economic and Social Urban Economic and Social Urban Indicators: A Spatial Decision Indicators: A Spatial Decision Support System for Chicago Support System for Chicago Area Transportation PlanningArea Transportation Planning
Piyushimita Thakuriah (Vonu), P.S. Sriraj, Paul Metaxatos, Inshu Minocha & Tanushri Swarup
University of Illinois at Chicago
Presentation in AAG 2008, Boston
SDSS Development: Learning from Real World Experiences
Outline of Presentation
Description of the Chicago-Area Spatial Decision Support System (SDSS)
What institutional factors have affected the evolution of the SDSS?
What are the major challenges to the SDSS? Speculations on pathways to integrate into
practice Conclusions
What does the Spatial Decision Support System do?
Tool to support variety of transportation decision problems
Strongly integrates transportation applications with housing, economic development, community development and physical planning
Enables decision-makers to “look at data” in maps
Enables use of data for decision-support problems including prioritization of areas and communities for investments of different kinds
Current SDSS
Base data with indicators GIS environment – allows
mapping/visualization of spatial distribution of indicators
Limited web-based functionality at this time Statistical modeling of relationships between
variables MCDM Module: Analytic Hierarchy Process
(AHP) and Analytic Network Process (ANP) MCDM models
Current SDSS - Examples of Indicators Basic Indices including
Affordable housing index School quality index Crime rate index etc Health quality indices Land-use diversity index Various sociodemographic indices
Composite Data Indices (out of models) Small-area employment estimates based on forecasted job
openings and actual jobs Regional employment accessibility estimates by auto and
public transportation Transit availability index Pedestrian Friendliness index

SDSS
SDSS Environment
GIS MCDM
Survey
Mapping/visualization of spatial distribution of urban indicators
Sort & rank census tracts on each of the above criteria
Statistical studies linking indicators to transportation system
De
cisi
on
-su
pp
ort f
unct
ions
GIS
+ E
xper
t Op
inio
n o
r C
lien
t/Use
r P
refe
renc
es

Process Data Collection Tools Initial structured interview phase – identify issues,
main concerns, problem situation Soft Systems Methodology meeting phase – to
incorporate input from stakeholders, restructure ill-defined complex problem situation, develop rich picture of problem situation.
Develop indicators for problem situation accordingly AHP/ANP survey implementation to capture
stakeholder preferences Final decision – rank, prioritize geographical units for
various types of planning decisions

Examples of Major Applications to Date
Development of Public Transportation Information System involving public transportation agencies and DOT’s
Job Accessibility Study involving transportation, housing, economic development and health and human services stakeholders
Housing Relocation Analysis involving low-income Latino workers
Transit Oriented Development (TOD) - Labor Shed Spatial Analysis using Employment Accessibility and Transit Availability Index

Location of Low-Income Families & Entry-Level Jobs in Chicago Metro Area
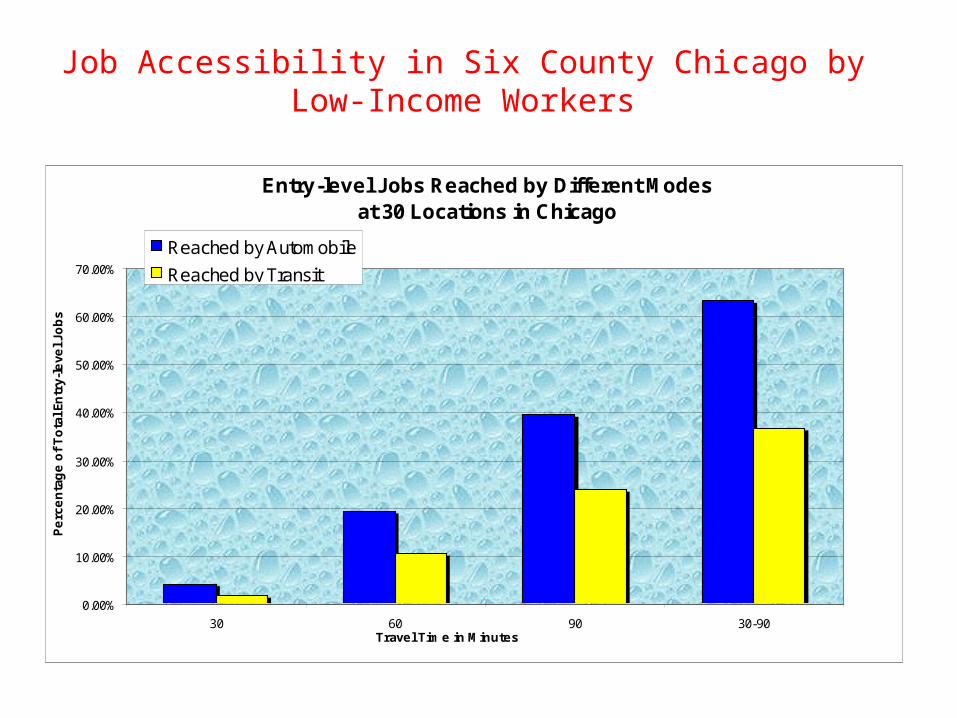
Job Accessibility in Six County Chicago by Low-Income Workers
Entry-level Jobs Reached by Different Modes at 30 Locations in Chicago
0.00%
10.00%
20.00%
30.00%
40.00%
50.00%
60.00%
70.00%
30 60 90 30-90Travel Time in Minutes
Pe
rce
nta
ge
of
To
tal E
ntr
y-le
vel J
ob
s
Reached by Automobile
Reached by Transit

Auto Destination accessibility in the six-
county Chicago Metro area
Four distinct areasPolicies for enhancing
economic opportunities may be quite different in the 4 areas
Updates of this type of analysis will potentially be possible on a
continuous basis with LEHD data
1
2
3
4
Evanston
CBD
Zion
UniversityPark
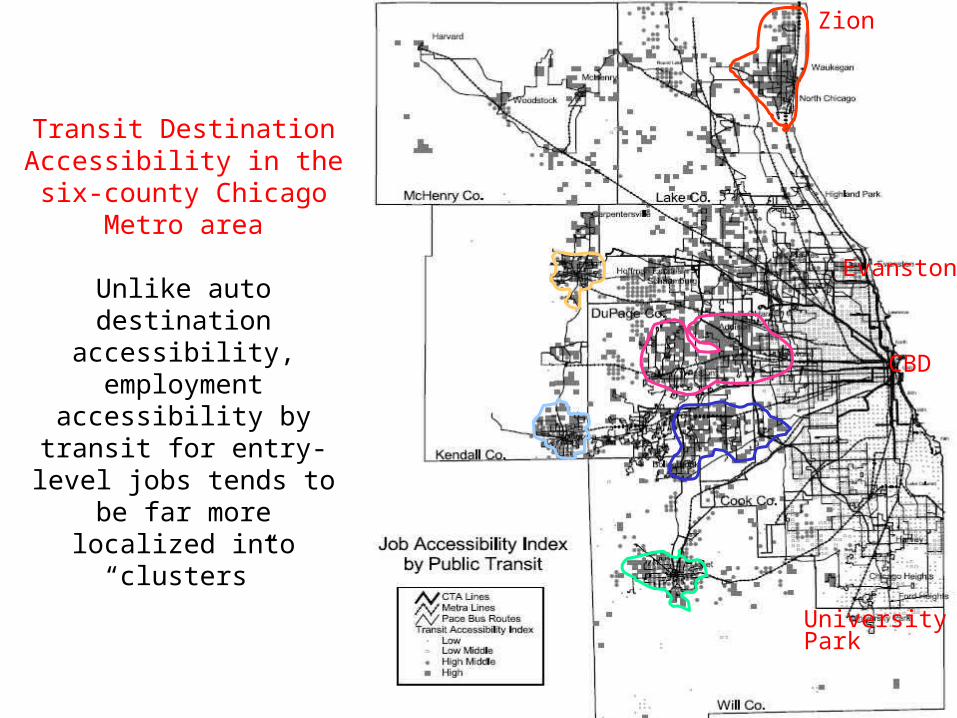
Transit Destination Accessibility in the six-
county Chicago Metro area
Unlike auto destination accessibility, employment accessibility by transit for
entry-level jobs tends to be far more localized into
“clusters”
1
2
3
4
Evanston
CBD
Zion
UniversityPark
Zion
Evanston
CBD
UniversityPark

Transit Availability Index
TAI decreases gradually from CBD to region periphery
TAI highest in majority of Cook and immediate tracts neighboring Cook
Also, high along Metra Corridors Low at fringes of Region

What are the institutional factors that have affected the evolution of the Spatial Decision
Support System?
Evolution of Spatial Decision Support System
Rapid changes in the field regarding types of information needed
Evolution of transportation planning agencies and perspectives
Evolution of nature of stakeholders involved in transportation planning and operations
Technological changes “Unstructured” data collection to “structured”
data collection

Changing Information Needs
Rapid changes in the field regarding types of information needed and in overarching policy drivers
Impacts on housing, air quality, low-income population, land-use etc needed due to various federal and state legislations
Traditional travel demand models cannot provide many of these – can serve as input into creation of indicators for some of these impacts
Example – Evaluations of Transportation Improvement Program and Long-range Transportation Plan, Environmental Justice compliance requirements, Area Wide Job Access and Reverse Commute Transportation Plan, now Human Services Transportation Plan.

Evolution of Relationship to Public
Called upon to involve communities and the public to a far greater extent than 15 years ago
Much greater focus on visioning and scenario development
Input from communities is sought and knowledge of public priorities is highly desirable
Examples – Chicago Metropolitan Agency for Planning (CMAP) Common Ground Process, Context Sensitive Solutions initiatives
Changes in Stakeholders Involved
Stakeholders involved in transportation planning and operations have changed over time (either because they are legally required to or there is potential of match)
Many of these stakeholders are interested in measures and impacts that go beyond the traditional measures of Vehicle Miles Traveled (VMT) etc
Example – Chicago Metropolitan Agency for Planning (CMAP) Indicators project
Technological Changes/Development/Use Habits
Rapid increase in the level of web use in the form of blogs, listservs, trip planners and traveler information systems, online comments posted in response to news articles
Public and stakeholders more used to geographic/map-based information than ever before
Easier interface between outputs of travel demand models and SDSS

Adaptations in Data Collection
Household travel surveys that feed regional transportation models are expensive – the current CMAP household travel survey cost well over $2 million
Data collected in 1956, 1970, 1990 and 2007 (otherwise depend on CTPP and now, increasingly on LEHD)
No cheap alternative to this type of data – however, pooling together available data into indicators can be a cost-effective solution
Result of previous points – traditional transportation professionals more willing to consider the use of “hybrid” data
What are the major difficulties in the systematic adoption of SDSS for transportation
planning?

Main Difficulties Historically, the adaptation of new planning
technologies in transportation has been somewhat slow – for example, many agencies continue the 4-step process instituted in 1962, the CORSIM traffic simulation package supported by FHWA
A variety of administrative functions, university education programs, private industry products and expensive data programs develops around a particular technology – inertia sets in
Organizational mindset is changing but barriers still exist regarding perceived lack of transparency and difficulty of use

Main Difficulties However, SDSS is not an alternative to the traditional
planning models. This, in turn, can make it difficult to get people to understand and to see the value added by the MCDM
Data sharing agreements and significant IP issues associated with some data sources
Funding – “if we are giving the data, then it should be free to us” Sustainability becomes a problem Keeping the data current becomes difficult Training and outreach is needed Major marketing effort is needed

Potential Pathways Forward Needs greater visibility Much greater presence needed in the larger transportation
conferences – but not only in the technical sessions Greater number of writings/publications in practitioner-
oriented journals and magazines Curriculum changes to incorporate SDSS – take advantage
of impending turnover in older workforce Need industry support With the support of administrative, political and academic
champions, recommend use for specific governmental programs – “bottom-up” approach
Enabling legislation might be needed mandating use as a part of regulatory compliance – “top-down” approach

Conclusions SDSS can play an important role in current transportation
planning processes Has led to the involvement of a wide variety of stakeholders not
typically within the transportation planning process Enabled impact assessment of a wide variety of economic and
social indicators Over time, organizational mindset is changing and the public is
becoming more tech-savvy - but barriers still exist regarding perceived lack of transparency and difficulty of use
Continuing exposure and outreach efforts will be necessary for such systems to be tightly coupled with transportation planning applications
More importantly, the widespread use of these systems needs the support of public policy to reach the extent of diffusion that transportation planning models did