Embed Size (px)
Citation preview

Economic and Social Survey of Asia and the Pacific 2017
Governance and Fiscal Management
Jakarta, Indonesia 9 May 2017

Main messages
• Economic growth is relatively modest but steady, and a mild economic expansion is expected ahead.
• Countries in the region should strengthen domestic and regional drivers of economic growth, given prolonged weakness in external demand and rising protectionist measures
• Effective fiscal management, backed by improved governance, can improve long-term economic prospects and help address social and environmental concerns.
• Given the increasing demands on fiscal policy, how governance affects the mobilization and allocation of fiscal resources warrants greater attention.
• Enhancing transparency and accountability in public fiscal administration is fundamental to improving the quality of governance and achieving better fiscal management.

Economic Outlook and
Quality of Growth

Asia-Pacific economies lead global economic growth at a less rapid, though steady, pace
Growth differential vis-à-vis developed economies is narrowing
Share of developing Asia-Pacific economies is increasing
0
10
20
30
40
50
60
2000
2001
2002
2003
2004
2005
2006
2007
2008
2009
2010
2011
2012
2013
2014
2015
2016
Per
cent
age
shar
e of
glo
bal o
utpu
t
Developing Asia-Pacific regionDeveloped global economies
0
1
2
3
4
5
6
7
8
2000s 2010-16 2017-18Baselineprojection
2017-18Alternativescenario
Aver
age
annu
al g
row
th (p
erce
ntag
e)
Developing Asia-Pacific regionDeveloped global economiesGrowth differential (percentage points)

A firm rebound in exports seem unlikely and private investment needs to rise
Export growth has returned to positive territory but remains well below pre-crisis 2008 average
With few exceptions, private investment is not forthcoming
-50
-40
-30
-20
-10
0
10
20
30
Jan-2014 Jan-2015 Jan-2016 Jan-2017
Per
cent
age
China IndiaIndonesia ThailandRussian Federation Average 2000-2007
-5
0
5
10
15
20
25
Per
cent
age
2005-20072013-2015Regional average in 2005-2007Regional average in 2013-2015
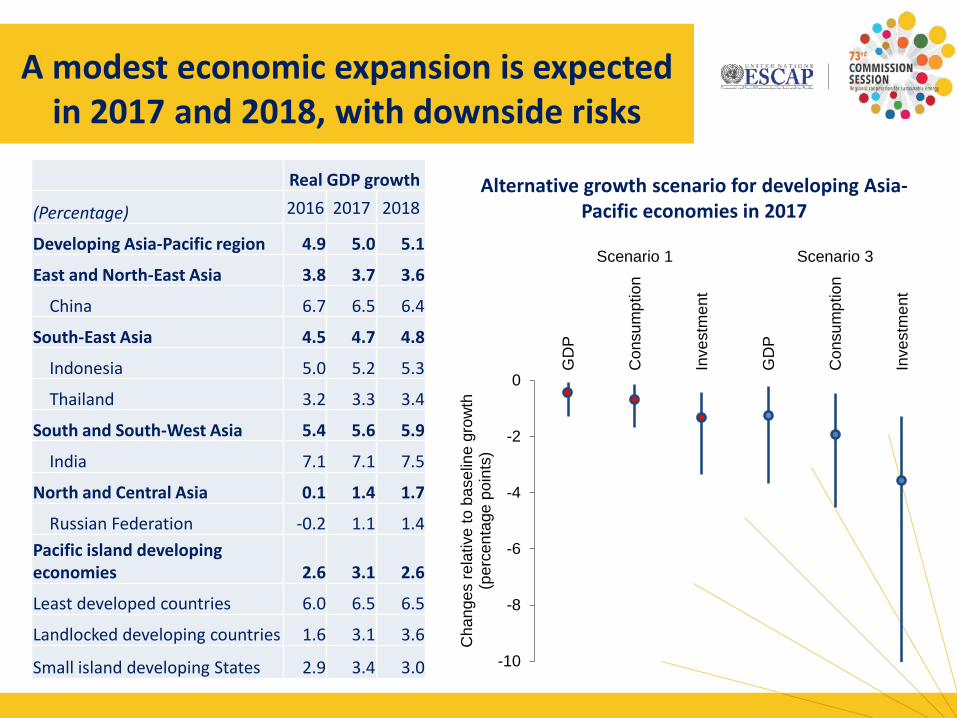
A modest economic expansion is expected in 2017 and 2018, with downside risks
Real GDP growth
(Percentage) 2016 2017 2018
Developing Asia-Pacific region 4.9 5.0 5.1
East and North-East Asia 3.8 3.7 3.6
China 6.7 6.5 6.4
South-East Asia 4.5 4.7 4.8
Indonesia 5.0 5.2 5.3
Thailand 3.2 3.3 3.4
South and South-West Asia 5.4 5.6 5.9
India 7.1 7.1 7.5
North and Central Asia 0.1 1.4 1.7
Russian Federation -0.2 1.1 1.4 Pacific island developing economies 2.6 3.1 2.6
Least developed countries 6.0 6.5 6.5
Landlocked developing countries 1.6 3.1 3.6
Small island developing States 2.9 3.4 3.0 -10
-8
-6
-4
-2
0
GD
P
Con
sum
ptio
n
Inve
stm
ent
GD
P
Con
sum
ptio
n
Inve
stm
ent
Scenario 1 Scenario 3
Cha
nges
rela
tive
to b
asel
ine
grow
th
(per
cent
age
poin
ts)
Alternative growth scenario for developing Asia-Pacific economies in 2017

South-East Asia: Economic growth and inflation are likely to pick up slightly
0
2
4
6
8
10
12
2006
2007
2008
2009
2010
2011
2012
2013
2014
2015
2016
2017
2018
Real GDP growth (%)
South-East Asia Developing Asia-Pacific region
0
2
4
6
8
10
2006
2007
2008
2009
2010
2011
2012
2013
2014
2015
2016
2017
2018
Consumer inflation (%)
South-East Asia Developing Asia-Pacific region
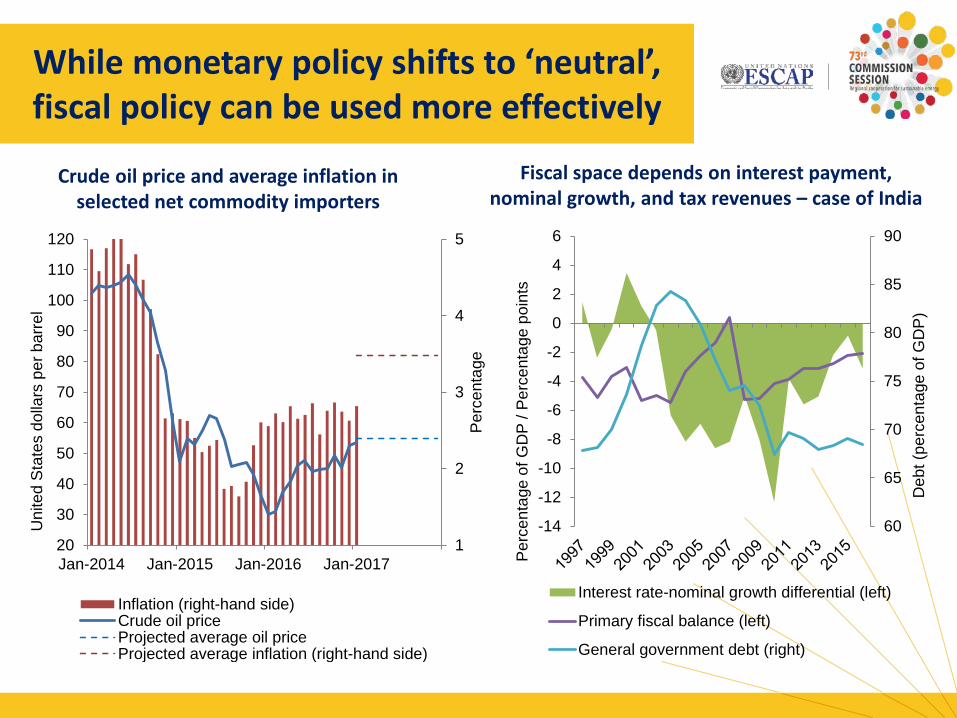
While monetary policy shifts to ‘neutral’, fiscal policy can be used more effectively
Crude oil price and average inflation in selected net commodity importers
Fiscal space depends on interest payment, nominal growth, and tax revenues – case of India
60
65
70
75
80
85
90
-14
-12
-10
-8
-6
-4
-2
0
2
4
6
Deb
t (pe
rcen
tage
of G
DP
)
Per
cent
age
of G
DP
/ Per
cent
age
poin
ts
Interest rate-nominal growth differential (left)
Primary fiscal balance (left)
General government debt (right)
1
2
3
4
5
20
30
40
50
60
70
80
90
100
110
120
Jan-2014 Jan-2015 Jan-2016 Jan-2017
Per
cent
age
Uni
ted
Sta
tes
dolla
rs p
er b
arre
l
Inflation (right-hand side)Crude oil priceProjected average oil priceProjected average inflation (right-hand side)
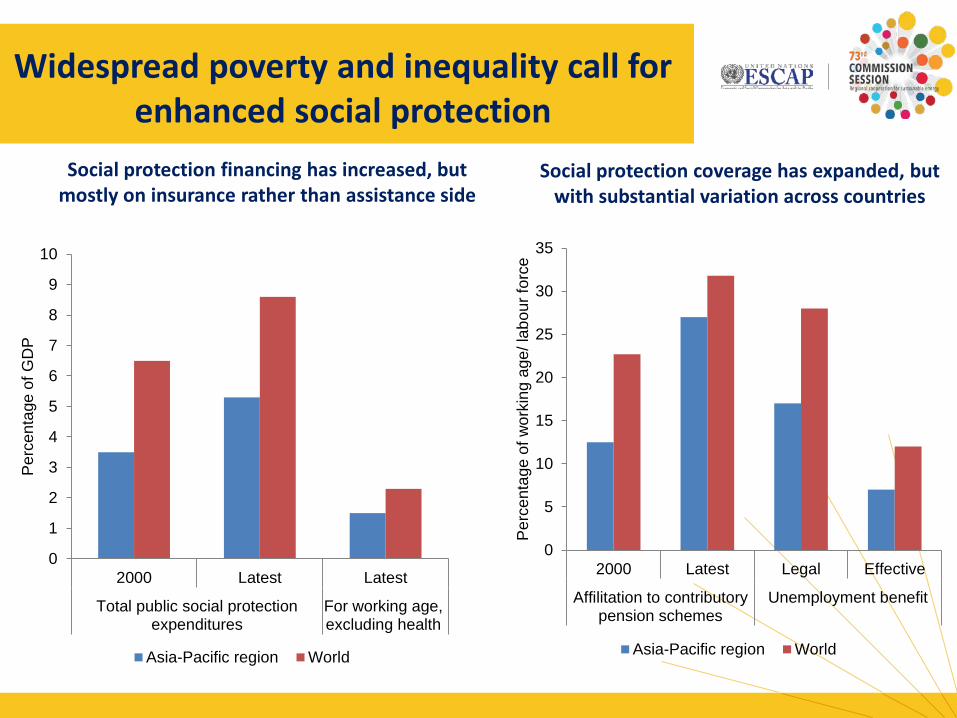
Widespread poverty and inequality call for enhanced social protection
Social protection financing has increased, but mostly on insurance rather than assistance side
Social protection coverage has expanded, but with substantial variation across countries
0
1
2
3
4
5
6
7
8
9
10
2000 Latest Latest
Total public social protectionexpenditures
For working age,excluding health
Per
cent
age
of G
DP
Asia-Pacific region World
0
5
10
15
20
25
30
35
2000 Latest Legal Effective
Affilitation to contributorypension schemes
Unemployment benefit
Per
cent
age
of w
orki
ng a
ge/ l
abou
r for
ce
Asia-Pacific region World

Environmental costs of production can be internalized through various policy instruments
Energy intensity remains high especially among oil producers and in China
Carbon emissions intensity has declined, but emissions per capita remained high
120
130
140
150
160
170
180
190
2000
2001
2002
2003
2004
2005
2006
2007
2008
2009
2010
2011
2012
2013
Kg
of o
il eq
uiva
lent
per
1,0
00 d
olla
rs G
DP
(201
1 P
PP
)
Asia-Pacific region World
0.0
0.5
1.0
1.5
2.0
2.5
3.0
2000
2001
2002
2003
2004
2005
2006
2007
2008
2009
2010
2011
2012
Met
ric to
ns o
f car
bon
diox
ide
equi
vale
nt p
er
$100
0 G
DP
Asia-Pacific region World

#CS73
Governance and Fiscal
Management
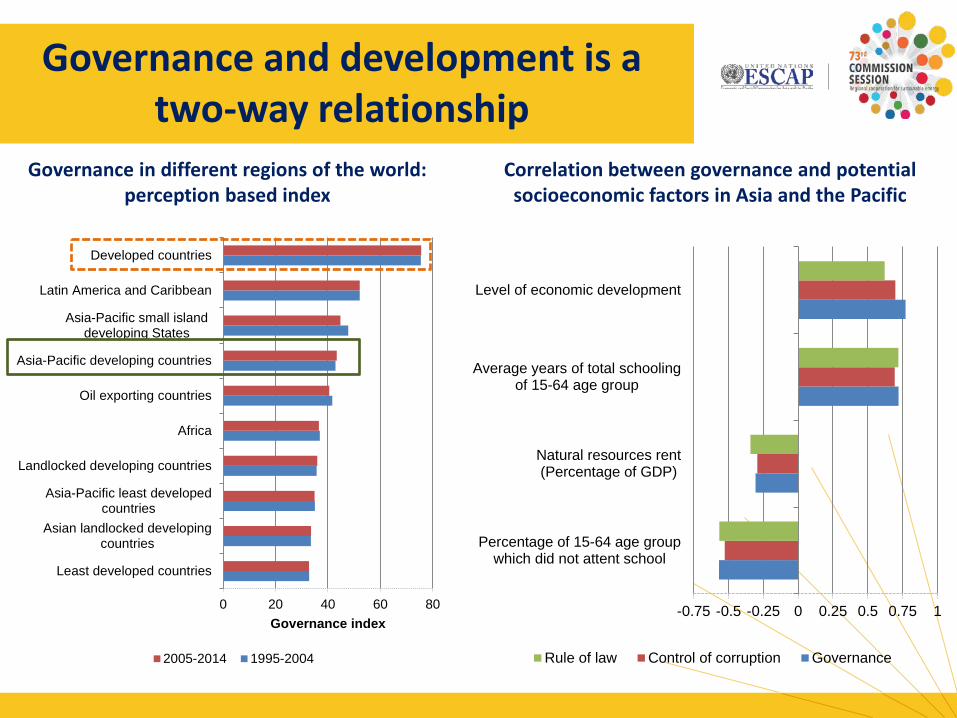
Governance and development is a two-way relationship
-0.75 -0.5 -0.25 0 0.25 0.5 0.75 1
Percentage of 15-64 age groupwhich did not attent school
Natural resources rent(Percentage of GDP)
Average years of total schoolingof 15-64 age group
Level of economic development
Rule of law Control of corruption Governance
0 20 40 60 80
Least developed countries
Asian landlocked developingcountries
Asia-Pacific least developedcountries
Landlocked developing countries
Africa
Oil exporting countries
Asia-Pacific developing countries
Asia-Pacific small islanddeveloping States
Latin America and Caribbean
Developed countries
Governance index
2005-2014 1995-2004
Governance in different regions of the world: perception based index
Correlation between governance and potential socioeconomic factors in Asia and the Pacific

Governance affects both the allocation and efficiency of public expenditures
0.00
0.02
0.04
0.06
0.08
0.10
0.12
20 40 60 80 100
Defen
se ex
pend
iture
s (p
erce
ntage
of to
tal ex
pend
iture
)
Control of corruption
Estimated impact of governance on public sector efficiency in the health sector
Level of governance and structure of public expenditures
-60 -40 -20 0 20 40 60 80
Kyrgyzstan
Thailand
Maldives
Iran (Islamic Republic of)
Mongolia
Malaysia
Sri Lanka
China
Brunei Darussalam
Turkey
Indonesia
Vanuatu
Armenia
Kazakhstan
Georgia
Estimated efficiency change

Better governance is associated with higher levels of tax revenues
0
5
10
15
20
25
30
35
40
15 25 35 45 55 65 75 85 95
Tax
reve
nue
(per
cent
age
of G
DP)
Governance
Tax revenues and governance in Asia and the Pacific, 2010-2014

Improving governance through transparency and accountability
75
80
85
90
95
100
0 20 40 60 80
Pub
lic s
ecto
r effi
cien
cy in
hea
lth
Financial disclosure (percentage of assessed measures)
Financial disclosure and public expenditure efficiency
0
5
10
15
20
25
30
0 0.2 0.4 0.6 0.8 1
Tax
reve
nue
(per
cent
age
of G
DP
)
e-Government Development Index
E-government and tax revenues

Enhanced transparency and accountability are key to better governance and fiscal management
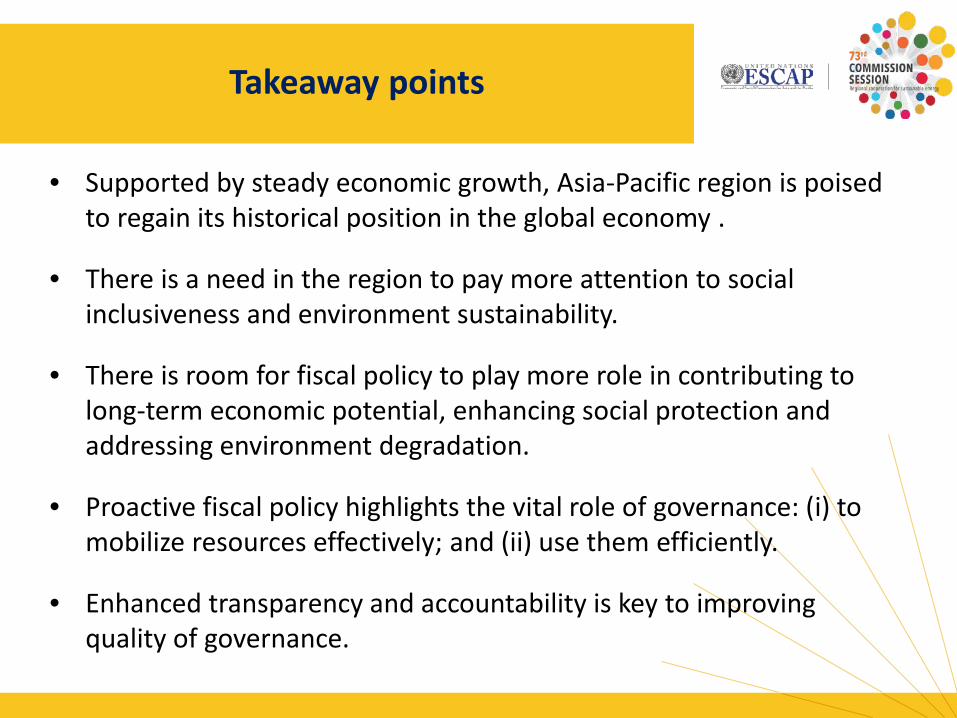
Takeaway points
• Supported by steady economic growth, Asia-Pacific region is poised to regain its historical position in the global economy .
• There is a need in the region to pay more attention to social inclusiveness and environment sustainability.
• There is room for fiscal policy to play more role in contributing to long-term economic potential, enhancing social protection and addressing environment degradation.
• Proactive fiscal policy highlights the vital role of governance: (i) to mobilize resources effectively; and (ii) use them efficiently.
• Enhanced transparency and accountability is key to improving quality of governance.

Thank you
www.unescap.org/publications/economic-and-social-survey-asia-and-pacific-2017
18


![Asia economic systems.ppt [autosaved]](https://img.pdfslide.us/doc/110x75/58f0cee41a28abd5408b4581/asia-economic-systemsppt-autosaved.jpg)