Embed Size (px)
Citation preview
Economic and Social Factors
Driving the Third Wave of Democratization∗
Elias Papaioannou Gregorios SiourounisDartmouth College University of Peloponnese
Economics Department Department of Economics
February 2008
* Correspondence: Elias Papaioannou, Dartmouth College, Economics Department, 6106Rockefeller Hall, Hanover, NH 03755. [email protected] http://www.dartmouth.edu/~elias.
This paper draws on our Ph.D. Thesis at the London Business School. We thank Daron Ace-moglu, Daniel Berkowitz (the Editor), Francesco Caselli, Simon Commander, Wouter Denhaan,Dimitri Georgarakos, Christos Genakos, Enrico Perotti, Richard Portes, Morten Ravn, AndrewScott, and two anonymous referees of this Journal, for valuable suggestions. We also want to ex-press our gratitude to Antonio Ciccone and to Andrei Shleifer for their feedback and big support.
Economic and Social Factors
Driving the Third Wave of Democratization
February 2008
ABSTRACT
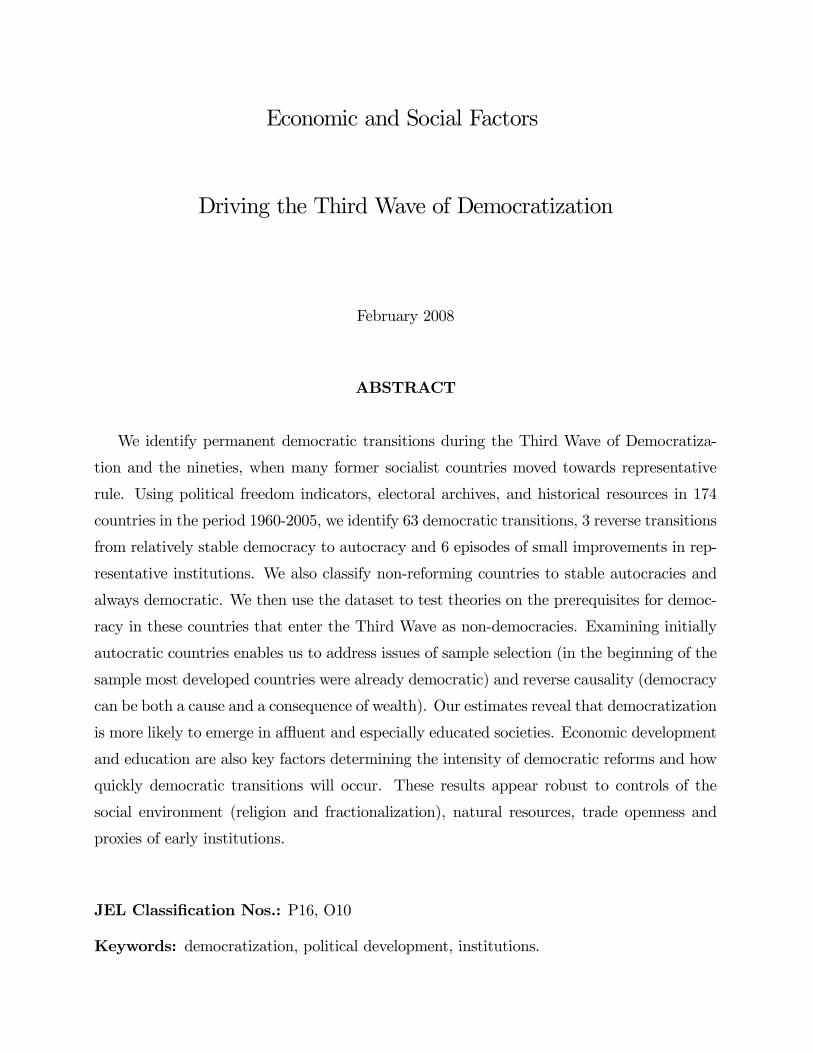
We identify permanent democratic transitions during the Third Wave of Democratiza-
tion and the nineties, when many former socialist countries moved towards representative
rule. Using political freedom indicators, electoral archives, and historical resources in 174
countries in the period 1960-2005, we identify 63 democratic transitions, 3 reverse transitions
from relatively stable democracy to autocracy and 6 episodes of small improvements in rep-
resentative institutions. We also classify non-reforming countries to stable autocracies and
always democratic. We then use the dataset to test theories on the prerequisites for democ-
racy in these countries that enter the Third Wave as non-democracies. Examining initially
autocratic countries enables us to address issues of sample selection (in the beginning of the
sample most developed countries were already democratic) and reverse causality (democracy
can be both a cause and a consequence of wealth). Our estimates reveal that democratization
is more likely to emerge in affluent and especially educated societies. Economic development
and education are also key factors determining the intensity of democratic reforms and how
quickly democratic transitions will occur. These results appear robust to controls of the
social environment (religion and fractionalization), natural resources, trade openness and
proxies of early institutions.
JEL Classification Nos.: P16, O10
Keywords: democratization, political development, institutions.
1 Introduction
A vast literature that dates back to Aristotle has tried to understand the determinants of
political freedom. According to the modernization hypothesis, democracy is more likely to
emerge and consolidate in educated and affluent societies (Lipset 1959, 1994). In contrast,
Max Weber (1930) and Samuel Huntington (1993) have emphasized the role of the social
environment. Religion, culture and fractionalization rather than income are the key deter-
minants of political freedom. Following this presumption many express skepticism on the
success of the recent steps towards democracy in many parts of the world. Yet, others argue
that oil and natural resource abundance, rather than income or social norms, is the key im-
pediment to democracy in the Middle East and Africa. Moreover, liberal economists, such
as Milton Friedman (1962), believed that economic liberalism is the key underlying factor
leading to political freedom.
Building on these influential conjectures and the early contribution of Martin Seymour
Lipset (1959) on the economic and social preconditions of democracy, many empirical stud-
ies have tried to detect the significant correlates of democracy.1 Recently, the empirical
literature has tried to move away from correlations and identify causal relationships (e.g.
Acemoglu, Johnson, Robinson, and Yared, 2007; Glaeser, La Porta, Lopez-de-Silanes, and
Shleifer, 2004; Lopez-Cordova and Meissner, 2005). The efforts to advance on causality have,
however, sidelined important issues of measuring and identifying properly political regimes.
For example, most empirical studies on the determinants (or the growth effects) of democ-
racy employ mechanically one of the available political freedom indicators neglecting how
these proxies are compiled. Yet, using mismeasured dependent variable weakens the power of
the statistical model and may produce biased estimates, since the error does not necessarily
take the classical form (Munck and Verkuilen, 2002).2
1See, among others, Barro (1999), Bollen and Jackman (1985, 1995), Boix and Stokes (2003), Muller(1995), and Epstein, Bates, Goldstone, Kristensen, and O’ Halloran (2006).
2Addressing measurement error is important for many reasons. First, democracy is correlated withother features of institutional development, such as regulatory efficiency, corruption, legal quality (see LaPorta et al., 1999). Measuring, thus, carefully democracy is needed if one is to investigate the causes andconsequences of each feature of the institutional environment. Second, political freedom indicators aggregatevarious institutional features, not necessarily related to democracy and electoral norms. Third, testingdemocratization theories requires the identification of regime switches. Yet, most indicators measure thelevel of political freedom and do not identify regime transitions. For example, the Polity and the FreedomHouse indicators by construction do not aim to distinguish democratic from autocratic regimes and thusare not well-suited to study political transitions. Fourth, addressing measurement error is important whenone investigates the effect of democratic transitions on economic performance, since using mismeasuredexplanatory variables yields biased estimates (e.g. Papaioannou and Siourounis, forthcoming).
1
In this paper we aim to contribute to this literature on both the measurement and the
causality front. To do so, we first construct a new dataset of political regimes and transi-
tions during the recent "Third Wave of Democratization" (Huntington, 1993; henceforth 3rd
Wave) and the nineties, when many former socialist countries switched to democracy (some,
alongside independence).3 To address most of the conceptual, measurement and aggregation
problems we exploit many measures of political freedom, numerous historical resources, and
electoral archives.
Second, we use the newly constructed dataset to test the main theories of democratization
in those countries that entered the 3rd Wave as non-democratic. This approach stands in
contrast to previous work that pools in the estimation always democratic, always autocratic,
and transition countries. Pooling contaminates the estimates by reverse causation, since it is
not clear if income or education for example causes or is the consequence of democracy. This
concern is magnified since the distribution of political regimes at the beginning of the sample
is not random. For example, the richest and more educated countries in the 1950s and the
1960s were all democracies.4 Studying initially non-democratic countries appears useful to
isolate the one-way effect of income, education, and other factors on democratization. While
using predetermined values and focusing on non-democratically governed countries does not
fully resolve endogeneity (since there might be long-term trends), this approach is concep-
tually appealing, since most democratization theories and models examine the conditions of
democratic transition in oligarchic societies.
In our analysis we distinguish between five broad theories on the determinants of democ-
racy. Some theories emphasize development-education (e.g. Lipset, 1959; Bourguignon and
Verdier, 2000; Glaeser, Ponzetto, and Shleifer, 2007), fractionalization (Aghion, Alesina,
and Trebbi, 2005), religion (e.g. Huntington, 1993), natural resources (Ross, 1999), eco-
nomic liberalism (e.g. Friedman, 1962), and early institutions (Acemoglu et al., 2007) as
the key determinants of representative government. Our estimates reveal that democracy is
more likely to emerge and consolidate in developed and especially educated societies. Human
3According to Huntington (1993) ".. the first wave began in America in the early nineteenth century andculminated at the end of World War I with about thirty countries having democratic regimes. Mussolini’smarch in Rome in 1922 began a reverse wave, and in 1942 there were only twelve democracies left in theworld. The Allied Victory in World War II and decolonization started a second movement towards democracy,which, however, pattered by the early 1960’s when about thirty-six countries had democratic regimes....TheThird wave began....on Thursday, April 25, 1974 in Lisbon, Portugal."
4Boix and Stokes (2003) make an analogous critique. They address sample-selection using data coveringthe entire nineteenth and twentieth centuries. Their long-horizon analysis suggests that income is stronglyassociated with both the likelihood of democratic transition and the consolidation of democracy.
2
capital rich nations also experience deeper political reforms. In addition, in these countries
democratization tends to occur earlier. In contrast to the parallel studies of Acemoglu et al.
(2005, 2007) the significant effect of education in predicting subsequent democratic transi-
tions retains significance when we control for religion, fractionalization, natural resources,
openness, and early institutional proxy measures. Our analysis also shows that natural
resource abundance and some religious norms block democratization. We also find some
weaker evidence that extractive early institutions were significant impediments to democra-
tization during the 3rd Wave. Our estimates further suggest that trade openness was not
systematically linked to democratization over the past decades.
The paper is structured as follows. In the next Section we detail our methodology in
constructing the data-set of political regimes and transitions. In Section 3 we lay down the
main democratization theories and present descriptive statistics on the main correlates of
the 3rd Wave. In Section 4 we estimate multivariate cross-sectional probabilistic models on
the likelihood of democracy in countries that entered the 3rd Wave as non-democracies. In
the last Section we summarize.
2 Methodology
2.1 Definition and criteria
Coming up with a definition of democracy is not straightforward. Dahl (2000) notes that
"democracy has meant different things to different people in different periods"; likewise Prze-
worski et al. (1996) argue that measuring political freedom is "just too interesting to be
resolved by a definitional fiat." Thus, in our methodology we do not impose a particular defi-
nition, but building on recent work in conceptualizing and measuring democracy (e.g. Munck
and Verkuilen, 2002), we try to capture four key aspects of representative government.
The first rule is "free, competitive and fair" elections. The conduct of elections appears
in almost all definitions of democracy we came along. Schumpeter (1942), for example,
describes democracy as "...the institutional arrangement for arriving at political decisions
in which individuals acquire the power to decide by means of competitive struggle for the
people’s vote." Similarly, choice of leaders is a key ingredient in Lipset’s (1960) definition
of democracy "as the political system which supplies regular constitutional opportunities for
changing the governing officials, and a social mechanism which permits the largest possible
3
part of the population to influence major decisions by choosing among contenders for political
office". We went over many sources to identify relatively fair and impartial elections. This
was crucial since in many countries, that all agree are non-democratic, elections do take place
but are either marked by fraud or are monopolized by the party in power (Golder, 2005).
Second, we require that there is an actual transfer of power resulting from the elections.
As Mainwaring et al. (2000) write "elected authorities must have the real governing power,
as opposed to a situation that in which elected officials are overshadowed by the military or by
a non-elected shadow figure." Thus, we identify permanent democratization episodes when
there is a de facto transfer of power to a democratically elected government. In Bolivia,
for example, the military did not recognize the outcome of the relatively free and impartial
elections of 1980. The elections were recognized two years later when the brutal regimes of
García Meza and Celso Torrelio ended. So, 1982 (rather than 1980) marks the transition
year to democracy.
Third, we require that there are no sizable parts of the population excluded from the
franchise. Using information from Vanhaanen (2003) on electoral participation, we require
that at least a third of the population should be eligible for vote. Consequently, South Africa
during the apartheid era is classified as non-democracy.
The fourth rule is regime stability. Huntington (1991) writes "...Stability is a central
dimension in the analysis of any political system." Thus, we exclude transition episodes
where democracy was short-lived. Imposing the stability requirement is in line with most
theories of political organization that focus on the determinants and/or the aftermath of
permanent regimes (see also Glaeser et al., 2004).
2.2 Sample
We begin with all the 208 "countries" from World Bank’s World Development Indicators
Database. We drop (34) non-independent territories and small states, namely: Andorra,
Aruba, Netherlands Antilles, American Samoa, Bermuda, Channel Islands, Faeroe Islands,
Greenland, Guam, Hong Kong, Isle of Man, Liechtenstein, Macao, Maldives, Monaco, San
Marino, Northern Marianna Islands, Mayotte, New Caledonia, Puerto Rico, French Polyne-
sia, Timor-Leste, West Bank and Gaza, Virgin Islands, Cayman Islands, Marshall Islands,
Palau, Samoa, the Solomon Islands, Micronesia, Vanuatu, St. Vincent and the Grenadines,
4
St. Lucia, St. Kitts and Nevis. Our sample, thus, includes 174 countries.
An open question was how to treat the newly established countries that emerged after
the fall of the Iron Curtin. These 22 countries are: Armenia, Azerbaijan, Belarus, Bosnia
and Herzegovina, Croatia, Czech Republic, Estonia, Georgia, Kazakhstan, Kyrgyz Republic,
Latvia, Lithuania, Former Yugoslavian Republic of Macedonia (FYROM), Moldova, Russia,
Serbia and Montenegro, Slovak Republic, Slovenia, Tajikistan, Turkmenistan, Ukraine, and
Uzbekistan. Since the Soviet Union, Yugoslavia and Czechoslovakia were classified as non-
democracies, we include in the democratization sample those nations that managed to con-
solidate representative government (the Baltic republics, for example). The new independent
states that have not established representative institutions are classified as non-democracies
(e.g. Belarus, Uzbekistan; see Table 1 Panel B).
A related issue was how to handle some African countries, which in the early indepen-
dence years (in the sixties) had democratic constitutions, but quickly turned non-democratic.
Benin, for example, was classified according to most sources as democracy during 1960-1962,
but after the 1963 military coup that ousted President Hubet Maga moved to autocratic
status; similar examples include Congo, Kenya, Uganda, and Nigeria. Since in most of these
countries no elections were held, we classify them as non-democracies from the onset.
2.3 Algorithm
2.3.1 Democracy Indicators
We start by analyzing the evolution of the most widely used and with the broadest coverage
democracy indicators: the Polity democracy index, the Freedom House political rights and
civil rights indicators, and the Przeworski et al. (1996, 2000) regime classification.
The Center for International Development and Conflict Management at the University
of Maryland produces various quantitative measures of political institutions in its Polity
project. This database is described in Marshall and Jaggers (2004) and is based on work by
Ted Robert Gurr (Gurr, 1974; Gurr, Jaggers, and Moore, 1990). We focus on the composite
democracy index. The index ranges from −10 to +10 with higher values indicating higherlevels of political freedom. It reflects the degree of competitiveness in political participation,
the openness in the selection of the legislature, and the constitutional constraints on the
executive. It also incorporates subjective information on checks and balances to executive
5
powers, the degree of restrictions in electoral participation, and the extent to which the po-
litical participation is regulated. Among the available measures, the Polity index is probably
the most comprehensive, capturing key aspects of democratic rule in a clear and transparent
way. It’s main limitation, from our viewpoint, is that this index by construction does not
aim to classify political regimes, since it measures the level of political freedom. In addition
the Polity index is not available for some small countries.5
Based on Raymond Gastil’s (1978) work the Freedom House (FH) project reports a score
of political rights and a score of civil liberties protection. Both measures range from 1 to 7
with lower values indicating a higher level of protection. Data are reported on an annual basis
since 1972−1973. FH also designates to each country a trichotomous polity characterization.Countries whose average score of political rights and civil liberties is less than 2.5 are assigned
"free", while those with a greater score than 5.5 are designated as "not free"; countries with
an average rating between 2.5 and 5.5 are designated "partly free". Recent studies in political
science (e.g. Munck and Verkuilen, 2002; Mainwaring et al. 2000) show that the FH method
is biased against socialist regimes, left-wing governments, and closed to international trade
countries. FH also tends to assign lower democracy scores to non-US aligned countries. The
FH index is quite broad ("maximalistic"), reflecting besides democratic rule, corruption,
openness, freedom of the press, and bureaucratic efficiency. Thus, its usefulness in studying
democratic rule is questionable since it blends many institutional features, not necessarily
related to political freedom.
Przeworski et al. (1996, 2000) construct a binary regime classification index that is a
priori more appropriate for studying transitions. The index, however, stops in 1990 and
does not cover the democratizations that occurred in the nineties.6 Przeworski et al. apply
a minimalist definition of democracy mainly requiring the conduct of contested elections,
without however investigating their quality. The Dominican Republic, for example, is clas-
sified as democratic in the sixties and seventies, since elections were held in 1970 and 1974.
In both elections, however, President’s Joaquin Balaguer power was not seriously contested,
since "the only viable, broad-based opposition party, boycotted both elections to safeguard the
well-being of those who would have been their candidates" (US Library of Congress Coun-
try Reports). Likewise, Brazil’s transition to democracy is recorded in 1979, even "though
5Participation is not always a key part of the available democracy indicators. For example, the PolityProject classifies South Africa as democratic before 1994.
6Golder (2005) updates the Przeworski et al. index up to 2000. Recently Przeworski has updated theseries up to 2002 (data available from: http://politics.as.nyu.edu/object/przeworskilinks.html).
6
the head of state was chosen by the state and ratified by an electoral college designed to
ensure subservience to the military’s choice" (Mainwaring, et al. 2000). Przeworski et al.
also require that a political party can not be in power forever for a country to be classified
as democratic. As Acemoglu and Robinson (2006) note, however, this requirement puts
some widely accepted democratic countries, such as Botswana and Japan, in the group of
autocratic nations.
After reviewing carefully all indicators, we identify a sudden jump/drop on either of
them when: (1) The Polity index jumps from a negative to a positive value and vice versa.
(2) The FH regime status characterization changes. (3) The Przeworski et al. classification
moves from democratic to autocratic status and vice versa. To avoid capturing instability we
require that the indicators remain in the new status for five years.7 We also went over other
democracy datasets, such as the Vanhaanen (2003) "polyarchy" project that besides data on
electoral participation reports a democracy index based mainly on electoral contestability
and the Mainwaring, et al. (2000) detailed coding of transitions in Latin America.
2.3.2 Historical sources
Next we delved into historical resources to document the events that lead to the changes
in the democracy indicators. This helps us understand the nature of each event and spot
transitions not reflected in the aforementioned indicators. Our main resources were: (1)
The Freedom House and Polity Project country reports. (2) The Country Studies/Area
Handbook of the Federal Research Division of the United States Library of Congress. (3) The
Central Intelligence AgencyWorld Factbook. (4) The U.S. Department of State "Background
Country Notes". (4) Zarate’s "Political Collection." (5) For some countries where these
sources did not have adequate coverage, we used other country-specific sources.
2.3.3 Electoral Archives
We then went over electoral datasets to identify the exact timing of legislative and presi-
dential elections. Specifically, we utilized (1) Adam Carr’s "Psephos" Election archive, (2)
the "Elections around the World" database, (3) the "Election Results Archive" produced by
the Center on Democratic Performance at Binghamton University, and (4) the "Database of7Examples of brief spikes in the two democracy indicators that do not represent the institutionalization
of representative rule, include Nigeria (in the early eighties), Burkina Faso (in 1978-1979), and Argentina (inthe early seventies). Changing the requirement to three, four, six or seven years yields a similar chronology.
7
Political Institutions" (Beck, Clarke, Groff, Keefer, and Walsh, 2001) that reports data on
the competitiveness and the timing of elections.
In most cases jointly with the elections there is also an adoption of a constitution that
institutionalizes the change of power. The adoption of the new constitution and the elections
either coincide or differ by one (two) year(s). In this case we use the latter date. In South
Korea, for example, internationally deemed "free and fair" elections were held on December
1987. The new democratic constitution that established a multi-party democracy came into
effect the following year. We therefore use 1988 as the democratization year.
2.3.4 Intensity of democratic reforms
Besides identifying countries that move in and out of autocratic rule, we further categorize
democratic transitions based on the intensity of reforms into "full" and "partial" democrati-
zations.8 To classify a country as experiencing a "full" democratization, we require that both
the FH status designation is "free" and the Polity score is greater than +7. (We applied this
strict criterion to minimize self-selection concerns). Examples of "full" democratization in-
clude Spain after Franco’s death or Chile after Pinochet’s fall. In "partial" democratization
countries, although representative institutions have been established, the level of political
liberties and civil rights has not reached that of "fully" democratized countries. We also
identify six borderline cases of democratic transitions, namely Comoros (1990), Iran (1997),
Nepal (1991), Niger (1999), Pakistan (1988)9, and the Central African Republic (1993). In
these countries in spite of some progress, political participation and civil freedoms are still
at a very low level.
2.4 Democratization dataset
Our algorithm yields 63 permanent democratization episodes in the period 1960-2005. From
those, 39 incidents are classified as "full" and 24 as "partial" democratizations. We also
identified 3 countries, namely Gambia, Lebanon, and Zimbabwe, that experienced a political
set-back, moving from a relatively stable democracy to autocratic status (one could also add
Pakistan in this list). Non-transition countries are split into three groups: Stable democracies
8Huntington (1993), who favors a binary distinction for political regimes, explicitly allows for a trichoto-mous classification.
9Pakistan is probably the most difficult country to classify, since it experienced a democratic transitionin 1985, but after 1998 it reversed back to autocracy.
8
are throughout the sample period democratic (e.g. the United States, Sweden, and Japan).
Stable autocracies - always authoritarian countries are throughout the sample period non-
democratically governed (e.g. Afghanistan, Saudi Arabia, and Uganda). Stable intermediate
are countries with far from perfect democratic institutions that did not experience, however,
neither a significant move towards democracy nor towards autocracy. This group includes
Malaysia and Tonga (one could add Turkey and Papua New Guinea.) Table 1 lists the
classification. In the Supplementary Appendix we report a description of the transition for
each reforming country. We also give details on the evolution of the Polity, the FH, and the
Przeworski et al. classification around the transition. The Supplementary Appendix Table
1 also compares our classification with the Przeworski et al. (1996, 2000) categorization, the
Freedom House trichotomous regime split, and the Polity measure when we use the median
value of the index (i.e. zero) to distinguish democratic and autocratic regimes.
Look-ahead bias Imposing the stability criterion and categorizing countries based on the
intensity of reforms raises concerns of look-ahead bias. We have constructed the dataset
after observing whether countries reverted back to autocracy. In addition, we assign a
"full" democratization status to countries that have managed to reach a perfect level of
representative institutions throughout the past 30 years, while at the time of the transition
it was far from clear whether this would be the case. For example, we assigned a "full"
democratization status to Spain, having observed ex post that the transition was relatively
smooth. Yet, in the years following General Franco’s death it was not clear whether Spain
will transit to democracy and quickly reach a perfect level of political freedom. While look-
ahead bias can not be ruled out, it is most likely of minor importance to our empirical
analysis that explores the cross-sectional variation.
3 Initial Conditions and the Third Wave
In this Section we discuss the main theories on the determinants of democracy and quantify
differences in the main variables stressed as key determinants of democratization using values
before the 3rd Wave (mid seventies, when the first transitions occurred). Table 2 reports
means and standard deviations for countries that have remained autocratic throughout the
sample period ("always authoritarian" - column (1)), the group of countries that democ-
ratized during the Third Wave ("democratization" - column (2)), and countries that were
9
already democratic before the 3rd Wave ("always democratic" - column (3)). In columns
(4) and (5) we report descriptive statistics for democratization countries that implemented
sizable reforms ("full Democratization") and countries that democratized before the nineties
("early Democratization"). This distinction enables us to investigate whether initial condi-
tions also correlate with the intensity and the speed of reforms. Table 2 also reports a test
of mean equality comparing the "always authoritarian" with the other groups.10
3.1 Modernization Theory
The modernization hypothesis asserts that economic development and education are the
key prerequisites for democracy (Lipset, 1959, 1994). Wealth and education may affect the
likelihood of democratization through many channels. First, industrialized and bourgeoisie
societies are complex and difficult to govern under a centrally planned system. Second, the
ruling class may benefit from democracy and thus will not oppose reforms. Bourguignon
and Verdier (2000) build a model where it is in the interest of the elite to promote education
and democracy, since democracy fosters human capital accumulation, which in turn spurs
growth and minimizes the likelihood of expropriation. Third, education may lead the elite
to initiate, rather than oppose, democratization. Lipset (1959) referred to opinion polls that
concluded "...the single most important factor differentiating those giving pro-democracy
responses to others has been education." Fourth, Glaeser, Ponzetto and Shleifer (2007) build
a model where education fosters democracy through socialization and by shaping group
incentives. In their set-up democracy requires a wide popular base, but offers weak incentives
for its supporters. Oligarchy offers stronger incentives, albeit to a smaller fraction of the
population. Since education reduces the costs of political participation it assures that an
adequate fraction of the population is engaged in the political process, which in turn promotes
democracy. Glaeser, Ponzetto and Shleifer also present survey evidence linking education
level and social activities.
• Reduced Form Hypothesis [H1]: Other things being equal, democratization is more
likely to occur and stabilize in developed and especially educated societies.
10We exclude from our empirical analysis the new independent states that emerged after the fall ofCzechoslovakia, Soviet Union, and Yugoslavia (listed in Section 2.2), since these countries were non-existentin the 1970s. The results are similar if we were to include these new countries in the analysis. We also exclude"borderline democratization" countries and nations that experienced a reverse transition from the empiricalanalysis. The results are similar if we include borderline democratization countries in the authoritarian orthe democratization group.
10
There is a significant correlation between the level of education and democracy across
countries. In Figure 1 countries are grouped into five categories of roughly equal number of
observations depending on the education level in 1975. Figure 1 illustrates that among the
non-democratic countries with more than four years of schooling, all but Singapore moved to
democratic government. In contrast, of the fourteen non-democratic countries with less than
one year of schooling, only three (Mali, Benin and Mozambique) implemented democratic
reforms. This hints that education was a key driving force behind the 3rd Wave.
In Table 2-Panel A we quantify differences in the main variables stressed by the mod-
ernization theory as key determinants of democratization. The test of means in column (2)
shows that initially autocratic countries that moved to democracy had more than 50% higher
GDP p.c. than countries that remained autocratic. Differences in education are even more
pronounced. While countries that have remained autocratic over the past three decades had
1.72 average years of schooling in 1975, countries that managed to opt out from autocracy
had on average 3.59 years of schooling. These differences are magnified when we compare
the "always authoritarian" group of countries (in column (1)) with the sub-samples of "full"
(column (4)) and "early" (column (5)) democratizations. This hints that education may
not only affect the likelihood of democratization, but also how fast and deep democratic
reforms will be. In Panel A we also tabulate differences in life expectancy across the various
group of countries. Using life expectancy accounts for the unavailability of education and
income for many countries. In line with the modernization hypothesis, life expectancy was
significantly higher in countries that democratized during the 3rd Wave than in countries
that have remained autocratic (on average by 6.2 years).
3.2 Social Structure
3.2.1 Fragmentation
Influential scholars have emphasized the role of the ethnic and religious composition of
the society in political development. Aristotle, for example, argued that democracy is the
ideal regime for a society with many ethnic groups, since it is the polity that can best
safeguard their liberties. Yet, ethnic diversity can block democratization if it is associated
with a polarization of political life (Dahl, 2000). Aghion, Alesina and Trebbi (2005) formally
model the trade-off between delegation of power and "policy insulation" (ex post control of
politicians). Their model yields an ambiguous effect of polarization on insulation.
11
• Reduced Form Hypothesis [HF2 ]: Ethnic and religious diversity have an ambiguous effect
on democratization.
Table 2-Panel B tabulates differences in the ethnic and religious fragmentation of the
various groups of countries. The two fragmentation indicators are retrieved from Alesina
et al. (2003) and reflect the probability that two randomly selected individuals do not
belong to the same ethnicity and religion. Countries that democratized during the 3rd
Wave are somewhat less fragmented than countries that have remained autocratic. The
ethnic (religious) fragmentation index is 55% (40.7%) for the "always authoritarian" group,
while 47% (39.5%) for democratization countries. Yet, these differences are statistically
insignificant hinting that fragmentation had a small effect during the 3rd Wave.11
3.2.2 Religion
Many commentators advocate the importance of religious norms in political development.
Democratization may be blocked by religions that have a strong hierarchical structure and
dogmas characterized by an unchallenged hierarchy. In addition, close links between clergy
and the state may impede democratization. Huntington (1993) argues that traditionally
strong ties between religious leaders and the State were present in Catholic, Orthodox,
Muslim and Confucian countries. These religions tend also to be hierarchical and resistant
to change. Huntington also argues that while the Catholic Church decided to abandon its
traditional prejudices against representative rule in the mid-seventies, the Muslim clergy
decided to re-emphasize its focus on tradition.
• Reduced Form Hypothesis [HR2 ]: Other things being equal, democratization is less likely
in countries where close links between clergy and state exist.
In Table 2-Panel B we tabulate differences in the religious composition. In line with
previous studies (e.g. Barro, 1999), there is a significant negative correlation between Muslim
11We also explored differences in the societal composition across "always authoritarian", "democratiza-tion", and "always democratic" countries employing the Montalvo and Reynal-Querol (2005) polarizationindicators. The difference of the polarization with the fragmentation measures is that while the latter in-crease monotonically with the share of small groups, the former measures the distance from a bimodaldistribution of groups (the polarization index reaches a maximum when there are two groups of equal sizein a country). The descriptive statistics reveal differences in religious, but not ethnic polarization between"always autocratic" and "democratization" countries. On average, religious polarization in countries thathave remained autocratic is 63%, while the average score in the democratization group is 50%. Yet, once wecontrol for income or education this difference turns statistically insignificant.
12
share and the likelihood that a non-democratic country will democratize. The difference in
the Confucian share between always autocratic and democratization countries is small (4.6%)
and statistically insignificant.
3.3 Natural Resource Abundance
Many argue that the real impediment to democratization in the Middle East or Africa is not
religion or the lack of development, but their oil-rich soil. Natural resources enable the ruling
class to buy foreign and domestic support blocking political reforms. Acemoglu, Robinson
and Verdier (2004) formalize this intuition and provide illustrative descriptions of Mobutu’s
and Trujillo’s "kleptocratic" practices in Congo and the Dominican Republic respectively.
Similarly a vast literature in political science has emphasized the negative impact of natural
resources (oil, gold and diamonds in particular) on democracy (e.g. Ross, 2001; see also
Caselli, 2006).
• Reduced Form Hypothesis [H3]: Democratization is less likely in oil-rich and natural-
resource abundant countries.
In Panel C we investigate differences in natural resources using a binary indicator that
takes on the value one when the country is a main oil exporter and zero otherwise. Thir-
teen of the fifty-one "always autocratic" countries are classified as major oil exporters, while
only Indonesia and Nigeria among the forty-nine countries that democratized during the
3rd Wave are major oil-producing countries. This hints that natural-resource abundance
played a significant role during the 3rd Wave. We also examine the importance of diamond
production in blocking political reform using an indicator variable that takes on the value
one for countries that produce more that 1% of global output. Roughly 11% (6 out of 51) of
"always authoritarian" countries are major diamond producers. Yet, there are no significant
differences with countries that democratized during the 3rd Wave (column (2)) or "always
democratic" countries (column (3)). Although, diamonds have helped financing autocratic
regimes and civil wars in Sierra Leone, Liberia, and Congo, many diamond producing coun-
tries are democratic (e.g. Namibia, Botswana) or have moved to representative rule during
the 3rd Wave (e.g. Ghana, South Africa). We also experimented with gold production
without detecting significant differences among the various groups of countries.
13
3.4 The Liberal Hypothesis
Liberal economists advocate the importance of economic openness in fostering democracy.
Friedman (1962) argued that "economic freedom is also an indispensable means toward the
achievement of political freedom", while Landes (1998) writes "...if the gains from trade in
commodities are substantial, they are small compared to trade in ideas." Besides the diffusion
of liberal norms, trade may also proxy for middle class’ role. During the Renaissance and the
Enlightenment, for example, trade expansion empowered the bourgeoisie to exert pressure
on European Monarchs to expand political rights (see De Long and Shleifer, 1993).
• Reduced Form Hypothesis [H4]: Other things equal, democracy is more likely to occur
and consolidate in open to international trade countries.
In Panel D we explore differences in trade openness among "always authoritarian", "de-
mocratization", and "always democratic" countries using the share of exports and imports
to GDP (data taken from the Penn World Tables 6.1 Edition) and a dummy variable that
takes on the value one if a country has low tariffs and low quotas (taken from Wacziarg and
Welch, 2003). The test of means in column (3) suggests that "always democratic" coun-
tries had significantly more open trading systems than the "always autocratic" group. Yet,
when we compare non-democratic countries before the 3rd Wave (columns (1) and (2)) we
do not get clear results, since the difference in trade openness between "always autocratic"
and "democratization" group of countries is small (4%) and statistically insignificant. In
addition, when we use the share of exports and imports to GDP "always autocratic" rather
than "democratization" countries appear to be more open.
3.5 Early Institution Theories
Acemoglu, Johnson, and Robinson (2001, 2002) argue that due to institutional persistence
colonial institutions had a large effect on contemporary economic development. In parallel
work Acemoglu, Johnson, Robinson, and Yared (2007) apply early institution theories in
the context of political development, arguing that colonization and early institutions around
independence had long-lasting repercussions also in political development. Their main idea
is that countries where colonizers established despotic political institutions found it hard
to move towards democracy after independence. In contrast, democracy was more likely to
14
emerge and consolidate in countries with more liberal political systems around colonization
and independence.
• Reduced Form Hypothesis [H5]: Democracy is less likely in countries where Europeans
set up extractive institutions and in countries with low levels of property rights pro-
tection around independence.
It is, however, non-trivial to empirically test this conjecture since it is difficult to measure
accurately institutional performance in the 17th, 18th and 19th century. Moreover, in re-
gions where Europeans migrated massively, besides establishing sound institutions they also
brought their human (and maybe their social) capital (Glaeser et al. 2004). Thus, a signifi-
cant correlation between colonial features and contemporary political development does not
necessarily imply that colonization’s impact works (only) through early institutions.
Acknowledging these caveats, in Table 2-Panel E we report summary statistics for four
different proxies of early institutions. We, first, tabulate differences in property rights protec-
tion around independence, using data on executive constraints from the Polity database (that
goes back to 1800). Compared to the "always autocratic" group of countries (in (1)), "always
democratic" nations (in (3)) have on average better property rights protection around inde-
pendence. Yet, there are no significant differences when we compare democratized countries
with those that entered the 3rd Wave as non-democratic. The standardized 0 − 1 execu-tive constraints at independence index is on average 0.26 in "always autocratic" countries
(column (1)) and 0.28 in countries that democratized (column (2)).
Second, we exploit the CIA Fact-book and construct an index of country-age (normalized
to 0 − 1). Acemoglu et al. argue that country age may affect the democratization path,because former colonies that became independent in the 18th and 19th century had more time
to modify extractive colonial institutions than countries that became independent during
the 20th century. In line with this idea, the descriptives show that "always democratic" and
"democratization" countries are on average older countries than "always autocratic" nations.
Third, we tabulate differences in the mortality rates that European colonizers faced in
the 18th-19th century. Acemoglu et al. (2001) argue that settler mortality proxies colonial
institutions, because in regions where settler mortality was high, Europeans set extractive
institutions to transfer resources back to the homeland. In contrast, in regions with favorable
conditions, the colonizers migrated massively and transplanted the good institutions of the
15
motherland.12 While compared to "always autocratic" nations (column (1)) settler mortality
was significantly lower in "always democratic" countries (column (3)), the descriptives show
that settler mortality rates are on average quite similar between "always autocratic" nations
and countries that democratized during the 3rd Wave (column (2)).
Fourth, we examine differences in urbanization rates around 1500. Acemoglu et al. (2002)
argue that European colonizers established repressive institutions in densely populated re-
gions to better control indigenous population. Their hypothesis is that population density
before colonization should be negatively correlated with democracy. The descriptive statis-
tics show that countries that are autocratic were significantly more densely populated before
colonization than countries that democratized during the 3rd Wave (column (2)) or during
the previous waves (column (3)).
4 Cross-Sectional Estimates with Initial Values
To formally test the five main theories we estimate variants of the following cross-sectional
probabilistic model:
P (Di = 1 | Xi,1975, Zi) = G(a+ xi,1975β1 + ziβ2) (1)
The probability that an initially non-democratic country i will experience a successful
democratic transition (Di) in the 1975 − 2000 period is a non-linear function of initial (in1975) time-varying factors (Xi,t), such as education and trade openness, and time-invariant
characteristics (Zi), such as religion and fractionalization. We assume that G(.) is the normal
c.d.f. and estimate the (probit) model with maximum likelihood.13 Following Barro (1999),
Przeworski et al. (2000), Glaeser et al. (2004), and Acemoglu et al. (2005, 2007) we employ
the modernization theory at the core of our analysis. Thus, in all specifications we control
for a proxy measure of development. Yet, for many countries we lack data on education and
income. Schooling, which is theoretically the most appealing variable, is unfortunately not
available for many (especially non-democratic) countries. GDP p.c. in 1975 is also missing
12Albouy (2006) has challenged the settler mortality data. He went back to the original sources andchecked for misclassification, inconsistencies, and other issues. Using the new series Albouy shows that therelationship between settler mortality and contemporary institutions weakens. We also experimented usingAlbouy’s series to find quite similar (insignificant) results.13The results are similar if we estimate linear probability models or if we perform logit estimation.
16
for more than thirty non-democratic countries. Thus, to expand the sample and address
selectivity issues, we also estimate models using life expectancy as a proxy for human capital
and development.14 In Tables 3−5 we therefore report three otherwise identical specificationsusing the natural logarithm of real per capita GDP, average years of schooling and life
expectancy to proxy the stage of development (indexed (a), (b) and (c) respectively).
4.1 Probit estimates
In Table 3 we test the modernization hypothesis against theories that emphasize the im-
portance of religion (HR2 ; in models (1a)-(1c)), fragmentation (H
F2 ; in models (2a)-(2c)),
natural resource abundance (H3; in models (3a − 3c), and trade openness (H4; in models
(4a−4c)) in democratization. Since probit coefficients are not easily interpretable, the Tablereports marginal effects that measure the impact on the probability of a successful demo-
cratic transition of a small change in the explanatory variables at the average value of all
the controls; p-values based on heteroskedasticity-adjusted standard errors are reported in
parenthesis below the estimates.
Models 1a − 1c examine the effect of development conditional on fractionalization. Inline with the descriptive evidence ethnic and religious fragmentation have an insignificant
effect on democratization. This pattern prevails when we add in the specification the two
fragmentation measures one by one or when we use the Montalvo and Reynal-Querol (2005)
polarization indicators (results not reported). The coefficients, however, on all three devel-
opment proxies are positive, supporting the modernization theory. Income is a significant
correlate of future democratization at the 10% confidence level. The impact of education
is higher than that of income both statistically and economically. Schooling enters with a
coefficient that is at least three standard errors greater than zero. This hints that the pos-
itive impact of development on democratization mainly works through human capital. The
marginal effect implies that a one standard deviation increase in average schooling in 1975
(1.8 years) raises the probability of a successful democratic transition in non-democratic
countries by almost 40% (0.217 ∗ 1.8).15 In model 1c we use life expectancy to proxy humancapital. This allows us to examine the development-democratization link in an enlarged
14See for a similar approach, Barro and McCleary (2006).15This is just an approximation, since the marginal effects measure the change in the probability of
democratization of an infinitesimal change in education, evaluated at the mean value of the other explanatoryvariables. The analogous calculations for model’s 1b linear specification imply that a 1.8 increase in schoolingis associated with an increased likelihood of democratization of approximately 28%.
17
sample of 106 countries. The results with life expectancy are also supportive to H1.
In models 2a − 2c we condition on religion. The results suggest that democratizationis less likely to emerge and stabilize in Muslim countries. The estimates imply that a 20%
increase in the share of the population following Islam (approximately from Cameroon where
the share is 22% to the Ivory Coast with 39%) is associated with a 6%− 9% decline in the
probability that this country will permanently switch to democracy.16 Turning now to H1
the effect of income in predicting future democratic transitions weakens once we control for
religion. The coefficient on income in model 2a becomes marginally insignificant (with a
p-value of 0.11). Yet, education continues to exert a large and highly significant impact on
democratization. The estimate on initial education continues to be significantly different
than zero at the 1% confidence level, implying also a large economic effect. The estimates
in model 2c also support the modernization theory, showing that life expectancy correlates
significantly with subsequent democratization.
In columns 3a − 3c we control for natural resources adding in the specification an oilindicator that takes on the value one when the country is a major oil exporter and zero
otherwise. Our estimates suggest that the likelihood of a successful democratization in an
oil-producing country is 45% lower than in a non oil-abundant country (at approximately the
mean value of the other controls). The probit results continue to support (and if anything
strengthen) the modernization hypothesis. Once we control for oil production, the coefficient
on income increases and turns significant at the 1% level. Education and life expectancy
continue to enter with positive and significant estimates.
To test for the liberal hypothesis in models 4a − 4c we augment the specification withthe share of imports and exports to GPD in 1975. The marginal effect of trade openness
is small and statistically indistinguishable from zero. We obtained similar (insignificant)
results when we use the binary openness index (results not reported). This result is in line
with Rigobon and Rodrik (2005), who using an identification through heteroskedasticity
method and examining all countries, document also an insignificant (and if anything nega-
tive) correlation between democracy and trade.17 While not supportive to H4 the estimates
16These countries have similar (albeit somewhat lower than the mean value) life expectancy rates andincome levels and a zero share of Confucian-Buddhist population. In addition, in these countries the shareof the population that follows Islam is close to the mean value (34%).17De Long and Shleifer (1993) present evidence of a reverse effect of political freedom on trade. Using
historical data on urbanization they show that during the period 1050-1800 European regions with oppressiverulers experienced slower city growth.
18
are in line with the modernization hypothesis. The coefficients on initial GDP, education
and life expectancy in predicting subsequent democratic transitions retain their statistical
and economic significance.
In Table 4 we test the modernization hypothesis against theories that stress the im-
portance of early institutions on democratization [H5]. Given the conceptual challenges in
measuring institutions in the 17th-19th century, we present results with all four early in-
stitutions proxies proposed by Acemoglu et al. (2007). In models 1a − 1c we use a directproxy of early institutions, executive constraints around independence. This has little im-
pact in our results. Income, education and life expectancy continue to enter with positive
and significant coefficients. In contrast, political institutions around independence have no
significant effect in predicting democratic transitions during the 3rd Wave (once we control
for economic development). In model 2 we add in the specification the standardized 0 − 1years-since-independence measure. The results show that among the initially non-democratic
countries older nations had a higher likelihood to transit to democracy. Once we control for
country age, the coefficient on GDP turns insignificant. Initial education continues to be a
significant (at the 1% confidence level) predictor of subsequent transitions. The estimates in
the enlarged sample (in 2c) show that life expectancy in 1975 is also a significant correlate
of democratization. Thus, controlling for institutions around independence and country age
does not seem to attenuate the impact of education on democracy.
In Table 4 models 3a − 3c we use the log of settler mortality to proxy for colonial in-stitutions. The sample drops considerably since the variable is mainly available for former
colonies. While the coefficient on settler mortality is unstable, all three development proxies
enter with positive estimates. The marginal effect on income is marginally insignificant (p-
value 0.13), whereas the estimates on education and life expectancy continue to be positive
and significant at the 1% level. In columns 4a− 4c we use the log of population density in1500 to proxy for colonial institutions. Urbanization in 1500 enters with a negative coeffi-
cient, offering some support to the Acemoglu et al. (2007) idea that early institutions have
played an important role in political development. Controlling for historical variables has
little impact on the empirical validity of the modernization theory. In line with H1 education
continues to be a highly significant predictor of democratic transitions. Not only the estimate
on education is significantly positive at the 1% confidence level, but the implied economic
effect is similar to our previous estimates. The modernization hypothesis is also supported
with the results in 4c that show a significantly positive impact of initial life expectancy in
19
democratic transitions during the 3rd Wave.
In Table 5 columns (1a)-(1c), we test jointly the main democratization theories control-
ling simultaneously for (ethnic and religious) fractionalization, religion, natural resources,
trade openness, and institutions around independence. The estimate on income is positive,
but statistically indistinguishable from zero. Yet education retains its statistical significance
at the 1% level. The economic magnitude of education continues to be quantitatively large
and similar to the previous estimates. The modernization theory is further supported by
the estimates in the enlarged sample in column 1c. Life expectancy in 1975 is a significant
predictor of subsequent democratization, even when we control for all the other possible
correlates of political development. The results thus hint that the positive effect of develop-
ment on democratization works mainly through education and human capital. This is in line
with Lipset’s (1959, 1960) emphasis on the human capital channel and the recent models of
Bourguignon and Verdier (2000) and Glaeser, Ponzetto and Shleifer (2007) that stress the
importance of education in political development. Turning now to the other theories, the
estimates imply that the share of Muslims in the population and executive constraints at
independence had also an impact on the recent democratization wave. In line with the pre-
vious results trade openness and fractionalization have not played a significant role during
the 3rd Wave.
4.2 Ordered analysis based on the intensity of reforms
The 3rd Wave did not bring the same level of political freedom in all transition countries.
Some countries implemented large reforms, while in many democratization countries the
level of civil liberties and political rights protection has not reached a perfect level. It is,
thus, intriguing to test the main theories using an ordered model, utilizing the variability in
the intensity of democratic reforms. Table 5, columns (2a)-(2c), reports ordered probit coef-
ficients testing simultaneously all democratization theories. The dependent variable equals
zero for "always autocratic" countries, equals one for "partial democratization" countries,
and takes on the value of two for "full democratization" countries.
The ordered probit results strengthen the modernization theory. While income was an
insignificant correlate of democratic transitions in the analogous binary model in 1a (and in
some other specifications in Tables 3− 4), GDP p.c. in 1975 enters now with a statisticallypositive coefficient. In addition education and life expectancy continue to exert a significant
20
(at the 1% level) effect on future democratization. This result is in line with the parallel work
of Epstein, Bates, Goldstone, Kristensen, and O’ Halloran (2006), who using different tech-
niques and pooling all countries together (democratic, autocratic, and transition) also show
that employing a trichotomous separation of political regimes strengthens the modernization
hypothesis.
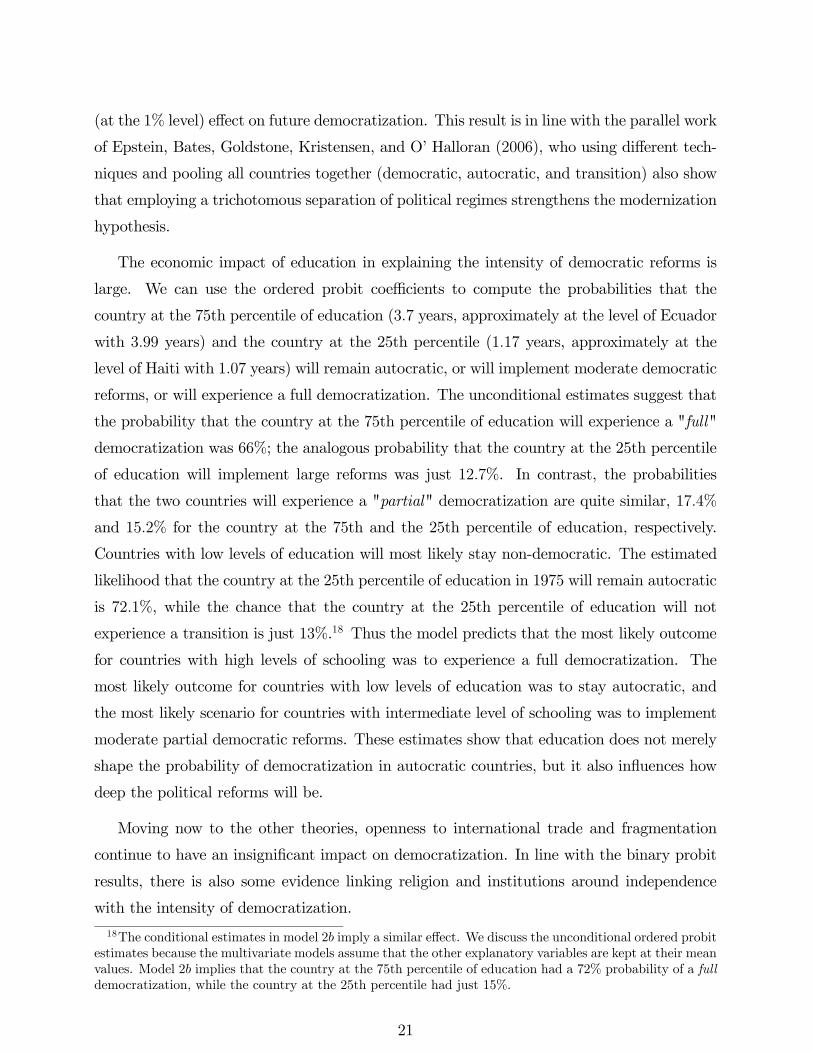
The economic impact of education in explaining the intensity of democratic reforms is
large. We can use the ordered probit coefficients to compute the probabilities that the
country at the 75th percentile of education (3.7 years, approximately at the level of Ecuador
with 3.99 years) and the country at the 25th percentile (1.17 years, approximately at the
level of Haiti with 1.07 years) will remain autocratic, or will implement moderate democratic
reforms, or will experience a full democratization. The unconditional estimates suggest that
the probability that the country at the 75th percentile of education will experience a "full"
democratization was 66%; the analogous probability that the country at the 25th percentile
of education will implement large reforms was just 12.7%. In contrast, the probabilities
that the two countries will experience a "partial" democratization are quite similar, 17.4%
and 15.2% for the country at the 75th and the 25th percentile of education, respectively.
Countries with low levels of education will most likely stay non-democratic. The estimated
likelihood that the country at the 25th percentile of education in 1975 will remain autocratic
is 72.1%, while the chance that the country at the 25th percentile of education will not
experience a transition is just 13%.18 Thus the model predicts that the most likely outcome
for countries with high levels of schooling was to experience a full democratization. The
most likely outcome for countries with low levels of education was to stay autocratic, and
the most likely scenario for countries with intermediate level of schooling was to implement
moderate partial democratic reforms. These estimates show that education does not merely
shape the probability of democratization in autocratic countries, but it also influences how
deep the political reforms will be.
Moving now to the other theories, openness to international trade and fragmentation
continue to have an insignificant impact on democratization. In line with the binary probit
results, there is also some evidence linking religion and institutions around independence
with the intensity of democratization.
18The conditional estimates in model 2b imply a similar effect. We discuss the unconditional ordered probitestimates because the multivariate models assume that the other explanatory variables are kept at their meanvalues. Model 2b implies that the country at the 75th percentile of education had a 72% probability of a fulldemocratization, while the country at the 25th percentile had just 15%.
21
4.3 Ordered analysis based on the timing of reforms
Besides the intensity of reforms, the timing of democratization differed during the 3rd Wave.
Spain, Greece and Portugal, abandoned autocracy in the mid-seventies, most Latin America
countries transit to democracy in the eighties, while many other countries democratized in
the nineties. We explore these differences by examining how development, religion, openness,
natural resources and early institutions affected the timing of transitions. Table 5, columns
(3a)-(3c), reports ordered probit coefficients, where the dependent variable equals two for
countries that democratized before 1990 (early democratizations), equals one for countries
that democratized in the nineties (late democratizations) and zero for countries that have
remained autocratic throughout the period 1975−2000. We use the 1990 as a cut-off betweenlate and early transitions, because the fall of communism had an effect in many country’s
political path (either because Soviet-supported regimes collapsed or because of spillover
effects). The results further support the modernization theory. In all model permutations the
coefficient on the variable proposed byH1 is positive and statistically significant. This implies
that income and especially human capital are not only correlates of future democratization,
but also useful in explaining how quickly these transitions will occur.
5 Conclusion
Few questions have received so much debate as to which economic and social factors deter-
mine democratic rule. In this paper we first construct a new dataset of political regimes
and transitions during the 3rd Wave of Democratization and the nineties, trying to address
many of the measurement challenges that such an effort entails. To do so we exploit many
political freedom indicators, numerous electoral and political archives, as well as many other
historical sources. Studying 174 countries in the period 1960−2005, we identify 63 incidentsof successful democratic transitions and 3 reverse transitions from democratic to autocratic
rule. We further classify transition countries to "full" and "partial" democratizations and
also identify 6 episodes of "borderline" democratizations that one could add in the democra-
tized sample of countries under a loose criterion. We classify the non-reforming countries to
stable autocracies and always democratic. In addition we assign 2 non-reforming countries
in an intermediate group.
Second, we identify the correlates of successful democratic transitions during the 3rd
22
Wave. To assuage reverse causation concerns we focus on countries that entered the 3rd
Wave as non-democratic and examine which conditions explain why only half of the initially
non-democratic countries managed to participate in the democratization wave. Employing
descriptive analysis and various probabilistic models we show that democracy is more likely
to emerge and consolidate in educated countries. Education is also a significant predictor
of the intensity and the timing of political transitions. While this correlation may still be
driven by an omitted or hard-to-account-for country feature, we show that the strong impact
of education in predicting subsequent democratic transitions retains significance when we
control for religion, fractionalization, trade openness, historical factors, and proxy measures
of colonial institutions. We also find some evidence that religion and political institutions
around independence were important drivers of the recent democratization wave. In contrast,
trade openness and fragmentation do not systematically correlate with democratization in
the period 1975− 2000.
We believe that while income, education, religion, and history shape the probabilities for
a successful democratic transition, these factors do not mechanically determine the political
equilibrium. No single factor can fully explain the development of democratic institutions in
all countries and all periods. Democratization in each region and country has emerged from
a combination of economic, social, and political causes. Besides the driving factors identified
in our analysis, time-varying country-specific factors, such as leadership, civil conflict, and
economic crises, can play also a key role. We believe that future research should explore
these issues.
23
A Appendix: Variable Definitions and Sources
Diamond: Indicator variable that equals one for countries that are major producers of
diamonds (more than 1% of global diamond value production in 2005). These (17) coun-
tries are: Angola, Australia, Botswana, Brazil, Central African Republic, China, Congo
Democratic Republic, Ghana, Guinea, Liberia, Namibia, Russian Federation, Sierra Leone,
South Africa, Tanzania, Venezuela, Zimbabwe. We also experiment with another indica-
tor variable that also adds ten countries that also produce diamonds. These (10) countries
are: Canada, Congo Republic, Gabon, Guyana, India, Indonesia, Côte d’Ivoire, Lesotho,
Swaziland, United States. Source: Janse (2005).
Executive Constraints at Independence: Average value during the first ten post-
independence years. If data for the first 10 years after independence is missing, we average
over the first ten years of available data. The measure is normalized to lie between 0 and 1;
the measure is constructed similarly to Acemoglu et al. (2007). Source: Polity IV.
Fragmentation Ethnic/Religious : Index of ethnic/religious heterogeneity, constructed
as one minus the Herfindahl index of the share of the largest ethnic/religious groups. It re-
flects the probability that two randomly selected individuals follow different ethnic/religious
beliefs. Source: Alesina et al. (2003).
Income: Real GDP per capita based on purchasing power parity (PPP) in 1975. Source:
Penn World Table 6.1 Edition.
Independence: Years since independence in 1975, normalized between 0−1. For coun-tries that became independent before 1800, we use the 1800 as independence date. The date
of independence for Zimbabwe was changed to 1964 and for Iran to 1935. The measure is
constructed similarly to Acemoglu et al. (2007). Source: CIA Factbook, 2004 edition.
Life Expectancy: Number of years a newborn infant would live if prevailing patterns
of mortality at the time of its birth were to stay the same in 1975. Source: WB-WDI 2005.
Oil Producer: Indicator variable that equals one for countries that are either members
of the OPEC (Organization of the Petroleum Exporting Countries) or classified by the IMF
as fuel exporting countries. It takes on the value of one in the following countries: Angola,
24
United Arab Emirates, Bahrain, Brunei, Congo, Rep., Algeria, Gabon, Iran, Iraq, Libya,
Nigeria, Oman, Qatar, Saudi Arabia, Turkmenistan, Trinidad and Tobago, Venezuela (IMF
fuel exporting countries) and the United Arab Emirates, Algeria, Indonesia, Iran, Iraq,
Kuwait, Libya, Nigeria, Qatar, Saudi Arabia, Venezuela (OPEC member countries).
Population Density in 1500. Indigenous population divided by arable land around
1500. Source: Acemoglu, Johnson, and Robinson (2002).
Religion (Muslim, Confucian/Buddhist): Share of each religious group in total
population. Source: Alesina et al. (2003).
Schooling: Average years of schooling in the population aged 25 and above in 1975.
Source: Barro and Lee (2001).
Settler Mortality: Mortality rates faced by European settlers around 1800-1900. Source:
Acemoglu, Johnson, and Robinson (2001).
Trade Openness: A zero-one variable for trade openness based on five individual dum-
mies for specific trade-related policies. A country was classified as closed if it displayed at
least one of the following characteristics: 1) Average tariff rates of 40% or more; 2) Non-tariff
barriers covering 40% or more of trade; 3) A black market exchange rate that is depreciated
by 20% or more relative to the official exchange rate, on average, during the 1970s or 1980s;
4) A state monopoly on major export; 5) A socialist economic system. Source: Wacziarg
and Welch (2003).
Trade Share: The sum of exports and imports of goods and services measured as a
share of gross domestic product. Source: Penn World Tables, 6.1. Edition.
25
References
[1] Acemoglu, Daron, Simon Johnson, and James A. Robinson. 2001. "The Colo-
nial Origins of Comparative Development: An Empirical Investigation." American Eco-
nomic Review, 91 (5): 1369-1401.
[2] Acemoglu, Daron, Simon Johnson, and James A. Robinson. 2002. "Reversal
of Fortune: Geography and Institutions in the Making of the Modern World Income
Distribution." Quarterly Journal of Economics, 17 (4): 1231-1294.
[3] Acemoglu, Daron, Simon Johnson, James A. Robinson, and Pierre Yared.
2005. "From Education to Democracy?" American Economic Review Papers and Pro-
ceedings, 95 (2): 44-49.
[4] Acemoglu, Daron, Simon Johnson, James A. Robinson, and Pierre Yared.
2007. "Income and Democracy." forthcoming American Economic Review.
[5] Acemoglu, Daron, and James A. Robinson. Economic Origins of Dictatorship
and Democracy. New York and Cambridge: Cambridge University Press, 2006.
[6] Acemoglu, Daron, James A. Robinson, and Thierry Verdier. 2004. "Klep-
tocracy and Divide-and-Rule: A Model of Personal Rule." Journal of The European
Economic Association, 2 (2-3): 162-193.
[7] Aghion, Philippe, Alberto Alesina, and Francesco Trebbi. 2004. "Endogenous
Political Institutions." Quarterly Journal of Economics, 119 (2): 565-613.
[8] Albouy, David. 2006. "The Colonial Origins of Comparative Development: An Inves-
tigation of the Settler Mortality Data." mimeo, University of Michigan at Ann Arbor.
available from: http://www-personal.umich.edu/~albouy/index.html
[9] Alesina, Alberto, Arnaud Devleeschauer, William Easterly, Sergio Kurlat,
and RomainWacziarg. 2003. "Fractionalization." Journal of Economic Growth, 8 (2):
155-194.
[10] Aristotle. Politics. Translated by H. Rackman. Cambridge, MA, Harvard University
Press, 1992.
26
[11] Barro, Robert J. 1999. "Determinants of Democracy." Journal of Political Economy,
107 (6): 1-27.
[12] Barro, Robert J., and Jong Wha Lee. 2001. "International Data on Educational
Attainment: Updates and Implications." Oxford Economic Papers, 53 (3): 541-563.
[13] Barro, Robert J., and Rachel M. McCleary. 2005. "Which Countries Have State
Religions?" Quarterly Journal of Economics, 120 (4): 1331—1370.
[14] Beck, Thorsten, George Clarke, Alberto Groff, Philip Keefer, and Patrick
Walsh. 2001. "New tools in comparative political economy: The Database of Political
Institutions." World Bank Economic Review, 15:1:165-176.; updated version available
at: http://econ.worldbank.org/WBSITE/EXTERNAL/EXTDEC/EXTRESEARCH/
[15] Boix, Carles and Stokes, Susan. 2003. "Endogenous Democratization."World Pol-
itics, 55 (2): 517-49.
[16] Bollen, Kenneth A. and Jackman, Robert W. 1985. "Political Democracy and
the Size Distribution of Income," American Sociological Review, 50 (4): 438-457.
[17] Bollen, Kenneth A. and Jackman, Robert W. 1995. "Income Inequality and
Democratization Revised: Comment on Muller." American Sociological Review, 60 (6):
983-989.
[18] Bollen, Kenneth, A., and Pamela Paxton. 2000. "Subjective Measures of Liberal
Democracy." Comparative Political Studies, 33 (1): 58-86.
[19] Bourguignon, François, and Thierry Verdier. 2000. "Oligarchy, Democracy, In-
equality and Growth." Journal of Development Economics, 62 (2): 285-313.
[20] Carr, Adam. Psephos, Australian Elections Archive. downloadable from
http://psephos.adam-carr.net
[21] Caselli, Francesco. 2006. "Power Struggles and the Natural-Resource Curse" mimeo
LSE, available at: http://personal.lse.ac.uk/casellif/
[22] Center on Democratic Performance. Election Results Archive. Binghamton Uni-
versity. downloadable from http://cdp.binghamton.edu/era
27
[23] Central Intelligence Agency. The World Fact-Book. 2003 edition. downloadable from
www.cia.gov/cia/publications/factbook/index.html
[24] Dahl, Robert Alan. On Democracy. New Heaven, MA: Yale University Press, 2000.
[25] De Long, Bradford J. and Andrei Shleifer. 1993. "Princes and Merchants: Euro-
pean City Growth before the Industrial Revolution," Journal of Law and Economics,
36 (2): 671-702.
[26] Epstein, David L.; Robert Bates, Jack Goldstone, Ida Kristensen, and
Sharyn O’Halloran. 2006. "Democratic Transitions." American Journal of Political
Science, 50 (3).
[27] Freedom House. 2006. Freedom in the World: Political Rights and Liberties 1972-
2005. New York: Freedom House. Dataset available at: www.freedomhouse.org/ratings.
[28] Friedman, Milton. Capitalism and Freedom. Chicago, ILL, University of Chicago
Press, 1962.
[29] Gastil Raymond D. 1978. Freedom in the World: Political and Civil Liberties. Free-
dom House, New York.
[30] Glaeser, Edward L., Giacomo Ponzetto, and Andrei Shleifer. 2007. "Why Does
Democracy Need Education?" Journal of Economic Growth, 12 (2): 77-99
[31] Glaeser, Edward L., Rafael La Porta, Florencio Lopez-de-Silanes, and Andrei
Shleifer. 2004. "Do Institutions Cause Growth?" Journal of Economic Growth, 9 (1):
271-303.
[32] Golder Matt. 2005. “Democratic Electoral Systems around the World, 1946-2000.”
Electoral Studies , 24 (1): 103-121.
[33] Gurr, Ted Robert. 1974. "Persistence and Change in Political Systems 1800-1971."
American Political Science Review, 68 (4): 1482-1504.
[34] Gurr, Ted Robert,Keith Jaggers andWill H. Moore. 1990. "The Transformation
of the Western State: The Growth of Democracy, Autocracy, and State Power Since
1800." Studies in Comparative International Development, 25 (1): 73-108.
28
[35] Heston, Alan, Robert Summers and Bettina Aten. Penn World Table Version
6.1. Center for International Comparisons at the University of Pennsylvania (CICUP),
2002.
[36] Huntington, Samuel P. 1991. "How Countries Democratize." Political Science Quar-
terly, 106 (4): 579-616.
[37] Huntington, Samuel P. 1993. The Third Wave: Democratization in the Late Twen-
tieth Century. Oklahoma: University of Oklahoma Press.
[38] Janse, "Bram" A.J.A. 2005. "Global Rough Diamond Production from 1870 to
2005." Gems and Gemology, Fall.
[39] Landes, David S. The Wealth and Poverty of Nations: Why Some Are so Rich and
Some So Poor. New York, NY, W.W. Norton & Company, 1998.
[40] La Porta, Rafael, Florencio Lopez-de-Silanes, Andrei Shleifer, and Robert
Vishny. 1999. "The Quality of Government." Journal of Law, Economics, and Orga-
nization, 15 (1): 222-279.
[41] Lipset, Martin Seymour. 1959. "Some Social Requisites of Democracy: Economic
Development and Political Legitimacy." American Political Science Review, 53 (1): 69-
105.
[42] Lipset, Martin Seymour. Political Man: The Social Bases of Politics. Doubleday,
Garden City, New York, 1960.
[43] Lipset, Martin Seymour. 1994. "The Social Requisites of Democracy Revisited."
American Sociological Review, February 1994, 59 (1): 1-22.
[44] Lopez-Cordova, Ernesto J. and Christopher Meissner. 2005. "Globalization and
Democracy, 1870-2000." National Bureau of Economic Research (Cambridge, MA),
Working Paper No. 11117.
[45] Mainwaring, Scott; Daniel Brinks, and Aníbal Pérez-Liñán.
2000. "Classifying Political Regimes in Latin America, 1945-1999." Kel-
logg Institute for International Studies Working Paper 280; available at:
http://kellogg.nd.edu/publications/workingpapers/WPS/280.pdf
29
[46] Marshall, Monty G., and Keith J. Jaeggers. 2004. "Polity IV Project: Political
Regime Characteristics and Transitions, 1800-2004 Dataset Users’ Manual." Center for
Global Policy School of Public Policy, George Mason University, Arlington, VA. Dataset
available at: http://www.cidcm.umd.edu/polity.
[47] Montalvo, Jose G., and Marta Reynal-Querol. 2005. "Ethnic Polarization, Po-
tential Conflict and Civil Wars." American Economic Review, 95 (3): 796-816.
[48] Muller, Edward N. "Economic Determinants of Democracy." 1995. American Socio-
logical Review, 60 (6): 966-982.
[49] Munck, Gerardo L., and Jay Verkuilen. 2002. "Conceptualizing And Measuring
Democracy: Evaluating Alternative Indices." Comparative Political Studies, 35 (1): 5-
34.
[50] Papaioannou, Elias and Gregorios Siourounis. "Democratization and Growth."
London Business School Economics Department (London, UK) Discussion Paper No.
22, May 2004.updated version, October 2007, forthcoming Economic Journal
[51] Przeworski, Adam; Michael E. Alvarez; Jose Antonio Cheibub, and Fer-
nando Limongi. 1996. "Classifying Political Regimes." Studies in Comparative Inter-
national Development, 31 (2): 1-37.
[52] Przeworski, Adam, Michael E. Alvarez, Jose Antonio Cheibub, and Fernando
Limongi.Democracy and Development. Cambridge: Cambridge University Press, 2000.
[53] Rigobon, Roberto and Dani Rodrik. 2005. "Rule of Law, Democracy, Openness,
and Income: Estimating the Interrelationships." Economics of Transition, 13 (3): 533-
64.
[54] Ross, Michael L. 2001. "Does Oil Hinder Democracy?" World Politics. 53 (1): 225-
361.
[55] Schumpeter Joseph A. Capitalism, Socialism and Democracy. New York: Harper
and Row 1970. (Orig. publ. in 1942).
[56] United States Department of State. County Background Notes. Publications Office,
Washington, DC. 2003.
30
[57] United States Federal Research Division Library of Congress. Country Studies.
2006. available at: http://lcweb2.loc.gov/frd/cs/
[58] Vanhaanen, Tatu. Democratization: A Comparative Analysis of 170 Countries Ro-
tledge (New York and London), 2003.
[59] Wacziarg, Romain, and Karen Horn Welch. 2003. "Trade Liberalization and
Growth: New Evidence." National Bureau of Economic Research Working Paper 10152.
[60] Weber, Max. The Protestant Ethic and the Spirit of Capitalism. New York, NYHarper
Collins, 1930.
[61] Wikipedia. "Elections Around the World" online database. downloadable from
http://www.electionworld.org
[62] World Bank. 2005. World Development Indicators. Washington DC: World Bank.
[63] Zarate, Roberto Ortiz. Zarate’s Political Collections. 2006.
.
31
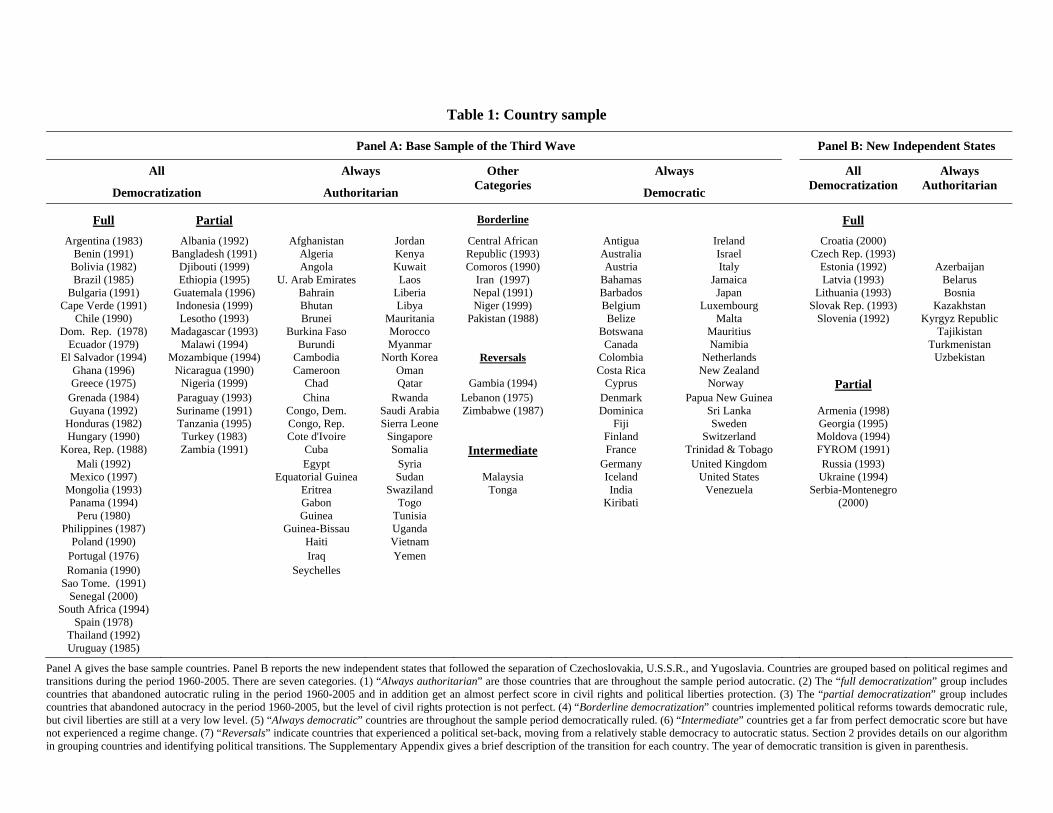
Table 1: Country sample
Panel A: Base Sample of the Third Wave Panel B: New Independent States
All
Democratization
Always
Authoritarian
Other Categories
Always
Democratic
All Democratization
Always Authoritarian
Full Partial Borderline Full
Argentina (1983) Albania (1992) Afghanistan Jordan Central African Antigua Ireland Croatia (2000) Benin (1991) Bangladesh (1991) Algeria Kenya Republic (1993) Australia Israel Czech Rep. (1993)
Bolivia (1982) Djibouti (1999) Angola Kuwait Comoros (1990) Austria Italy Estonia (1992) Azerbaijan Brazil (1985) Ethiopia (1995) U. Arab Emirates Laos Iran (1997) Bahamas Jamaica Latvia (1993) Belarus
Bulgaria (1991) Guatemala (1996) Bahrain Liberia Nepal (1991) Barbados Japan Lithuania (1993) Bosnia
Cape Verde (1991) Indonesia (1999) Bhutan Libya Niger (1999) Belgium Luxembourg Slovak Rep. (1993) Kazakhstan Chile (1990) Lesotho (1993) Brunei Mauritania Pakistan (1988) Belize Malta Slovenia (1992) Kyrgyz Republic
Dom. Rep. (1978) Madagascar (1993) Burkina Faso Morocco Botswana Mauritius Tajikistan Ecuador (1979) Malawi (1994) Burundi Myanmar Canada Namibia Turkmenistan
El Salvador (1994) Mozambique (1994) Cambodia North Korea Reversals Colombia Netherlands Uzbekistan Ghana (1996) Nicaragua (1990) Cameroon Oman Costa Rica New Zealand Greece (1975) Nigeria (1999) Chad Qatar Gambia (1994) Cyprus Norway Partial
Grenada (1984) Paraguay (1993) China Rwanda Lebanon (1975) Denmark Papua New Guinea Guyana (1992) Suriname (1991) Congo, Dem. Saudi Arabia Zimbabwe (1987) Dominica Sri Lanka Armenia (1998)
Honduras (1982) Tanzania (1995) Congo, Rep. Sierra Leone Fiji Sweden Georgia (1995) Hungary (1990) Turkey (1983) Cote d'Ivoire Singapore Finland Switzerland Moldova (1994)
Korea, Rep. (1988) Zambia (1991) Cuba Somalia Intermediate France Trinidad & Tobago FYROM (1991) Mali (1992) Egypt Syria Germany United Kingdom Russia (1993)
Mexico (1997) Equatorial Guinea Sudan Malaysia Iceland United States Ukraine (1994) Mongolia (1993) Eritrea Swaziland Tonga India Venezuela Serbia-Montenegro Panama (1994) Gabon Togo Kiribati (2000)
Peru (1980) Guinea Tunisia Philippines (1987) Guinea-Bissau Uganda
Poland (1990) Haiti Vietnam Portugal (1976) Iraq Yemen Romania (1990) Seychelles
Sao Tome. (1991) Senegal (2000)
South Africa (1994) Spain (1978)
Thailand (1992) Uruguay (1985)
Panel A gives the base sample countries. Panel B reports the new independent states that followed the separation of Czechoslovakia, U.S.S.R., and Yugoslavia. Countries are grouped based on political regimes and transitions during the period 1960-2005. There are seven categories. (1) “Always authoritarian” are those countries that are throughout the sample period autocratic. (2) The “full democratization” group includes countries that abandoned autocratic ruling in the period 1960-2005 and in addition get an almost perfect score in civil rights and political liberties protection. (3) The “partial democratization” group includes countries that abandoned autocracy in the period 1960-2005, but the level of civil rights protection is not perfect. (4) “Borderline democratization” countries implemented political reforms towards democratic rule, but civil liberties are still at a very low level. (5) “Always democratic” countries are throughout the sample period democratically ruled. (6) “Intermediate” countries get a far from perfect democratic score but have not experienced a regime change. (7) “Reversals” indicate countries that experienced a political set-back, moving from a relatively stable democracy to autocratic status. Section 2 provides details on our algorithm in grouping countries and identifying political transitions. The Supplementary Appendix gives a brief description of the transition for each country. The year of democratic transition is given in parenthesis.
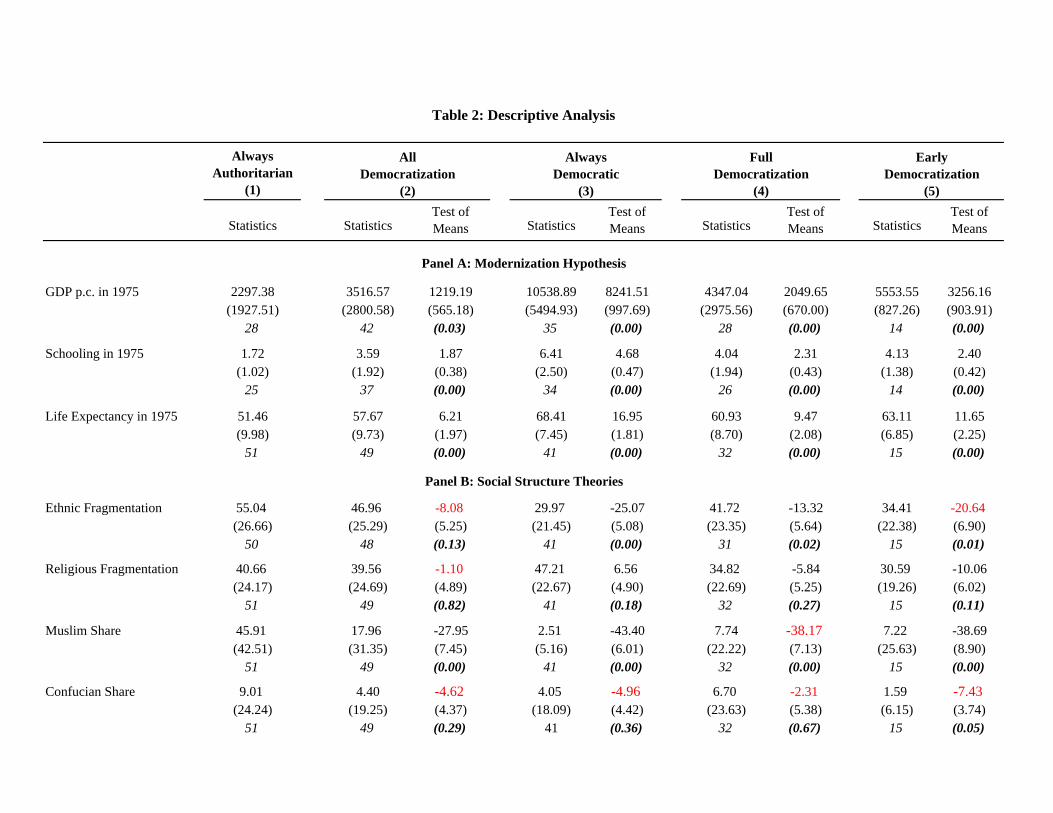
Always Authoritarian
(1)
Statistics StatisticsTest of Means Statistics
Test of Means Statistics
Test of Means Statistics
Test of Means
GDP p.c. in 1975 2297.38 3516.57 1219.19 10538.89 8241.51 4347.04 2049.65 5553.55 3256.16(1927.51) (2800.58) (565.18) (5494.93) (997.69) (2975.56) (670.00) (827.26) (903.91)
28 42 (0.03) 35 (0.00) 28 (0.00) 14 (0.00)
Schooling in 1975 1.72 3.59 1.87 6.41 4.68 4.04 2.31 4.13 2.40(1.02) (1.92) (0.38) (2.50) (0.47) (1.94) (0.43) (1.38) (0.42)
25 37 (0.00) 34 (0.00) 26 (0.00) 14 (0.00)
Life Expectancy in 1975 51.46 57.67 6.21 68.41 16.95 60.93 9.47 63.11 11.65(9.98) (9.73) (1.97) (7.45) (1.81) (8.70) (2.08) (6.85) (2.25)
51 49 (0.00) 41 (0.00) 32 (0.00) 15 (0.00)
Ethnic Fragmentation 55.04 46.96 -8.08 29.97 -25.07 41.72 -13.32 34.41 -20.64 (26.66) (25.29) (5.25) (21.45) (5.08) (23.35) (5.64) (22.38) (6.90)
50 48 (0.13) 41 (0.00) 31 (0.02) 15 (0.01)
Religious Fragmentation 40.66 39.56 -1.10 47.21 6.56 34.82 -5.84 30.59 -10.06(24.17) (24.69) (4.89) (22.67) (4.90) (22.69) (5.25) (19.26) (6.02)
51 49 (0.82) 41 (0.18) 32 (0.27) 15 (0.11)
Muslim Share 45.91 17.96 -27.95 2.51 -43.40 7.74 -38.17 7.22 -38.69(42.51) (31.35) (7.45) (5.16) (6.01) (22.22) (7.13) (25.63) (8.90)
51 49 (0.00) 41 (0.00) 32 (0.00) 15 (0.00)
Confucian Share 9.01 4.40 -4.62 4.05 -4.96 6.70 -2.31 1.59 -7.43 (24.24) (19.25) (4.37) (18.09) (4.42) (23.63) (5.38) (6.15) (3.74)
51 49 (0.29) 41 (0.36) 32 (0.67) 15 (0.05)
Table 2: Descriptive Analysis
Panel A: Modernization Hypothesis
Panel B: Social Structure Theories
All Democratization
(2)
Full Democratization
(4)
Early Democratization
(5)
Always Democratic
(3)
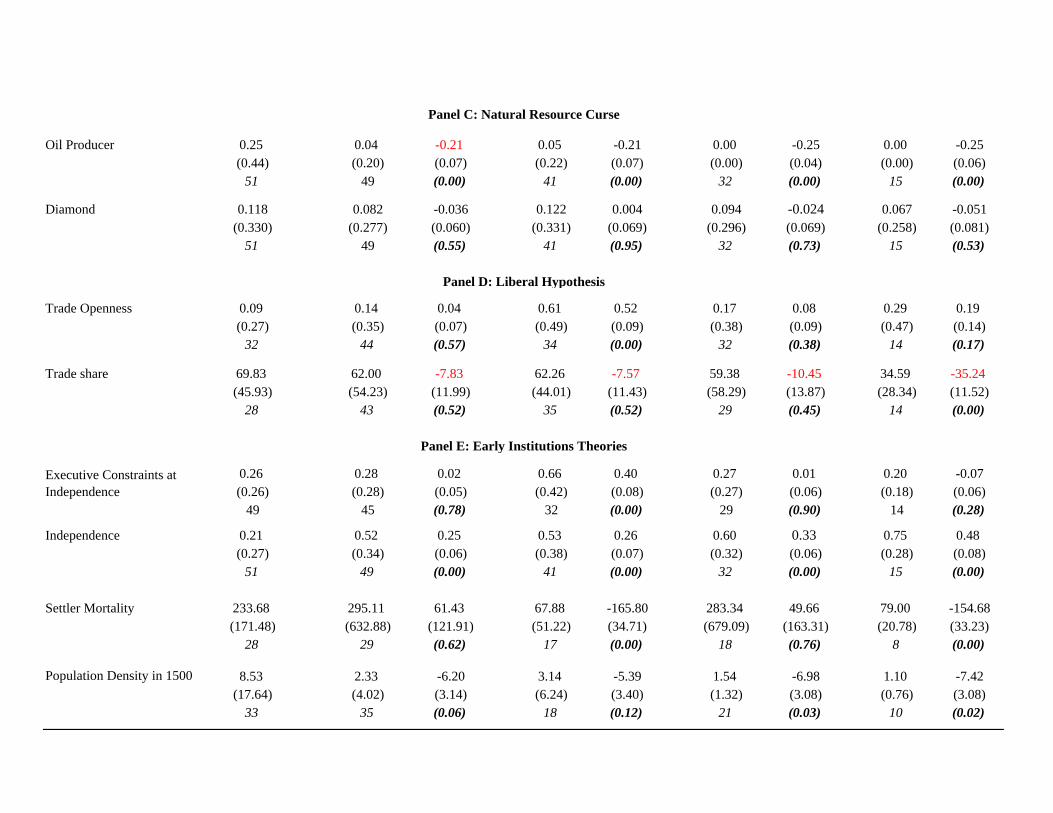
Oil Producer 0.25 0.04 -0.21 0.05 -0.21 0.00 -0.25 0.00 -0.25(0.44) (0.20) (0.07) (0.22) (0.07) (0.00) (0.04) (0.00) (0.06)
51 49 (0.00) 41 (0.00) 32 (0.00) 15 (0.00)
Diamond 0.118 0.082 -0.036 0.122 0.004 0.094 -0.024 0.067 -0.051(0.330) (0.277) (0.060) (0.331) (0.069) (0.296) (0.069) (0.258) (0.081)
51 49 (0.55) 41 (0.95) 32 (0.73) 15 (0.53)
Trade Openness 0.09 0.14 0.04 0.61 0.52 0.17 0.08 0.29 0.19(0.27) (0.35) (0.07) (0.49) (0.09) (0.38) (0.09) (0.47) (0.14)
32 44 (0.57) 34 (0.00) 32 (0.38) 14 (0.17)
Trade share 69.83 62.00 -7.83 62.26 -7.57 59.38 -10.45 34.59 -35.24 (45.93) (54.23) (11.99) (44.01) (11.43) (58.29) (13.87) (28.34) (11.52)
28 43 (0.52) 35 (0.52) 29 (0.45) 14 (0.00)
0.26 0.28 0.02 0.66 0.40 0.27 0.01 0.20 -0.07(0.26) (0.28) (0.05) (0.42) (0.08) (0.27) (0.06) (0.18) (0.06)
49 45 (0.78) 32 (0.00) 29 (0.90) 14 (0.28)
Independence 0.21 0.52 0.25 0.53 0.26 0.60 0.33 0.75 0.48(0.27) (0.34) (0.06) (0.38) (0.07) (0.32) (0.06) (0.28) (0.08)
51 49 (0.00) 41 (0.00) 32 (0.00) 15 (0.00)
Settler Mortality 233.68 295.11 61.43 67.88 -165.80 283.34 49.66 79.00 -154.68(171.48) (632.88) (121.91) (51.22) (34.71) (679.09) (163.31) (20.78) (33.23)
28 29 (0.62) 17 (0.00) 18 (0.76) 8 (0.00)
Population Density in 1500 8.53 2.33 -6.20 3.14 -5.39 1.54 -6.98 1.10 -7.42(17.64) (4.02) (3.14) (6.24) (3.40) (1.32) (3.08) (0.76) (3.08)
33 35 (0.06) 18 (0.12) 21 (0.03) 10 (0.02)
Panel C: Natural Resource Curse
Panel D: Liberal Hypothesis
Panel E: Early Institutions Theories
Executive Constraints at Independence
Table 2 Notes
The Table reports summary statistics and test of means for the main variables proposed by the Modernization Hypothesis (Panel A), Social Structure Theories (Panel B), Natural Resource Curse Theories (Panel C), the Liberal Hypothesis (Panel D), and Early Institutions Theories (Panel E) as major determinants of democratic transitions. All time-varying values correspond to 1975 (before the Third Wave of Democratization). Column (1) reports descriptive statistics in the “always authoritarian ” group (i.e. countries that remained throughout the sample period autocratic). Column (2) reports descriptive statistics in the "democratization " group of countries (i.e. countries that experienced a successful democratic transition in the period 1960-2005). Column (3) reports descriptive statistics in the “always democratic ” group (i.e. countries that have been democratically ruled throughout the 1960-2005 period). Column (4) reports descriptive statistics in democratization countries that experienced a full consolidation of democratic institutions in the period 1960-2005 (“Full Democratizations ”). Column (5) reports descriptive statistics in the democratization group of countries that democratized before 1990 (“Early Democratizations ”). New independent countries that emerged after the collapse of Czechoslovakia, U.S.S.R., and Yugoslavia are excluded from the analysis, since these countries were non-existent in the mi 1970s (these countries are reported in Table 1; Panel B).Mean values, standard deviations in parenthesis and the number of observations in italics are reported for each group of countries. The Table also reports tests of mean equality comparing the "always autocratic" with the other four groups. The Table reports the difference, the standard error (in parenthesis) and the p-value of difference significance (in bold italics). Table 1 reports the country classification. The Democratization Appendix gives a brief description of the democratic transition for each reforming country. The Data Appendix reports detailed variable definitions and sources.
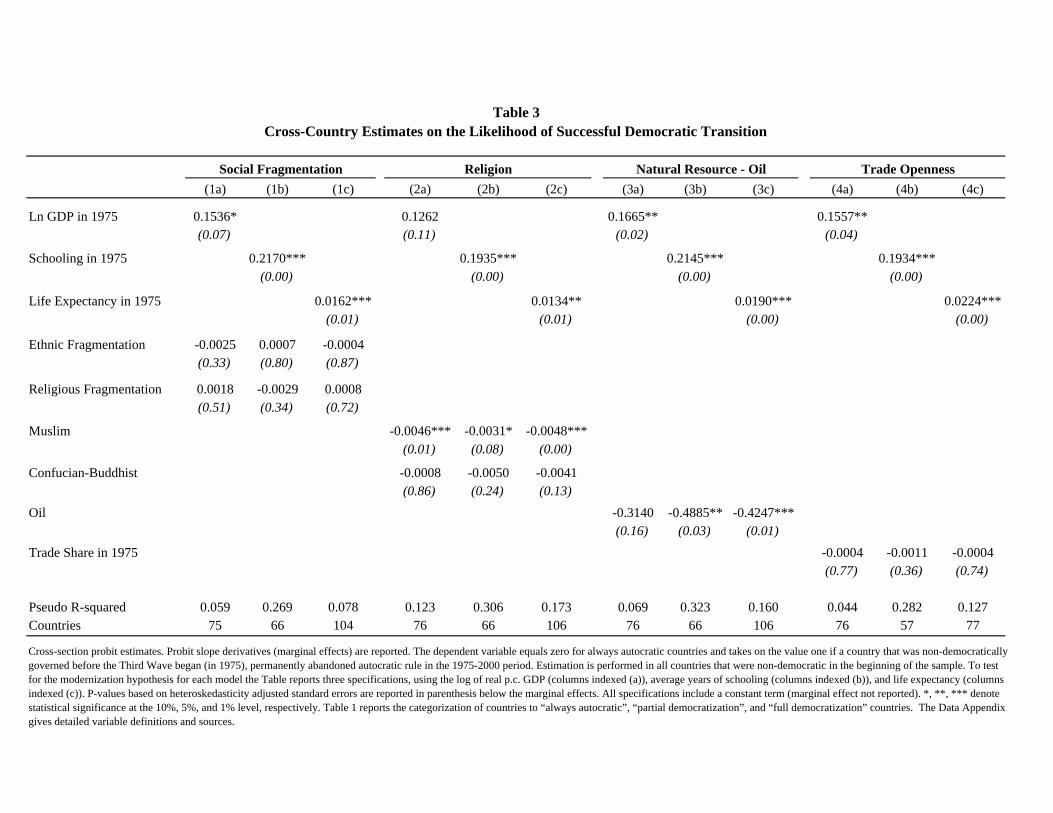
(1a) (1b) (1c) (2a) (2b) (2c) (3a) (3b) (3c) (4a) (4b) (4c)
Ln GDP in 1975 0.1536* 0.1262 0.1665** 0.1557**(0.07) (0.11) (0.02) (0.04)
Schooling in 1975 0.2170*** 0.1935*** 0.2145*** 0.1934***(0.00) (0.00) (0.00) (0.00)
Life Expectancy in 1975 0.0162*** 0.0134** 0.0190*** 0.0224***(0.01) (0.01) (0.00) (0.00)
Ethnic Fragmentation -0.0025 0.0007 -0.0004(0.33) (0.80) (0.87)
Religious Fragmentation 0.0018 -0.0029 0.0008(0.51) (0.34) (0.72)
Muslim -0.0046*** -0.0031* -0.0048***(0.01) (0.08) (0.00)
Confucian-Buddhist -0.0008 -0.0050 -0.0041(0.86) (0.24) (0.13)
Oil -0.3140 -0.4885** -0.4247***(0.16) (0.03) (0.01)
Trade Share in 1975 -0.0004 -0.0011 -0.0004(0.77) (0.36) (0.74)
Pseudo R-squared 0.059 0.269 0.078 0.123 0.306 0.173 0.069 0.323 0.160 0.044 0.282 0.127Countries 75 66 104 76 66 106 76 66 106 76 57 77
Table 3Cross-Country Estimates on the Likelihood of Successful Democratic Transition
Trade Openness
Cross-section probit estimates. Probit slope derivatives (marginal effects) are reported. The dependent variable equals zero for always autocratic countries and takes on the value one if a country that was non-democratically governed before the Third Wave began (in 1975), permanently abandoned autocratic rule in the 1975-2000 period. Estimation is performed in all countries that were non-democratic in the beginning of the sample. To test for the modernization hypothesis for each model the Table reports three specifications, using the log of real p.c. GDP (columns indexed (a)), average years of schooling (columns indexed (b)), and life expectancy (columns indexed (c)). P-values based on heteroskedasticity adjusted standard errors are reported in parenthesis below the marginal effects. All specifications include a constant term (marginal effect not reported). *, **, *** denote statistical significance at the 10%, 5%, and 1% level, respectively. Table 1 reports the categorization of countries to “always autocratic”, “partial democratization”, and “full democratization” countries. The Data Appendix gives detailed variable definitions and sources.
Social Fragmentation Religion Natural Resource - Oil
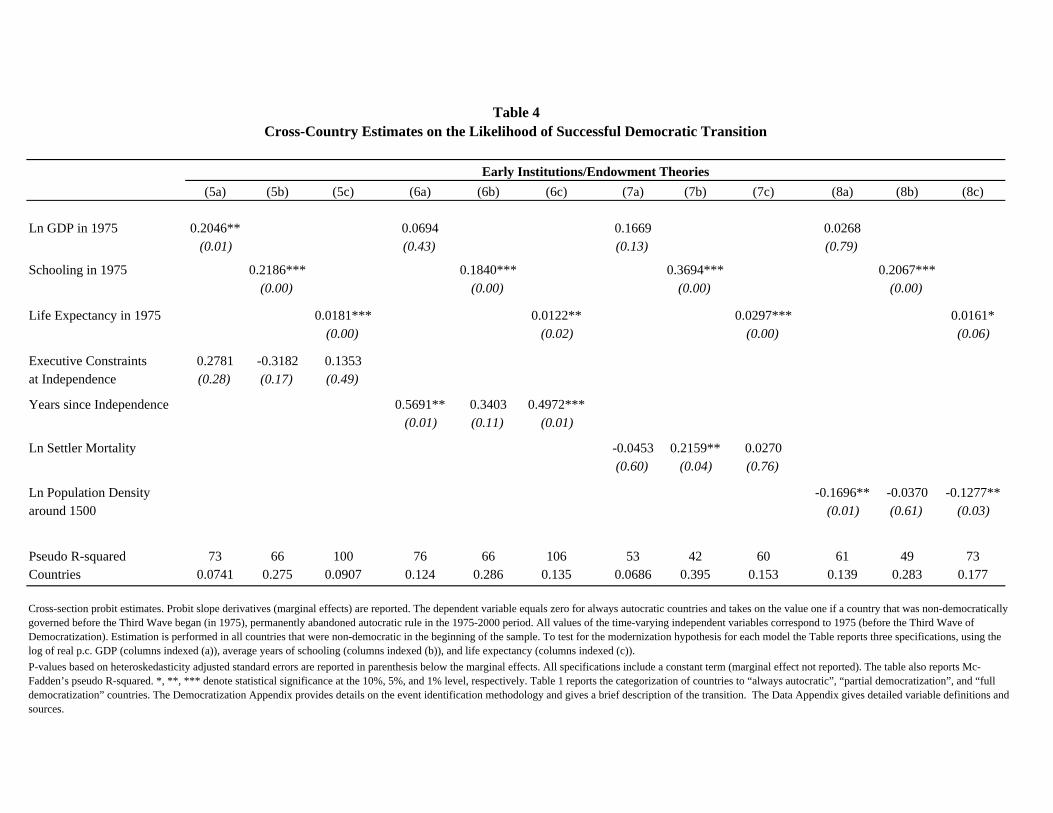
(5a) (5b) (5c) (6a) (6b) (6c) (7a) (7b) (7c) (8a) (8b) (8c)
Ln GDP in 1975 0.2046** 0.0694 0.1669 0.0268 (0.01) (0.43) (0.13) (0.79)
Schooling in 1975 0.2186*** 0.1840*** 0.3694*** 0.2067***(0.00) (0.00) (0.00) (0.00)
Life Expectancy in 1975 0.0181*** 0.0122** 0.0297*** 0.0161*(0.00) (0.02) (0.00) (0.06)
Executive Constraints 0.2781 -0.3182 0.1353at Independence (0.28) (0.17) (0.49)
Years since Independence 0.5691** 0.3403 0.4972*** (0.01) (0.11) (0.01)
Ln Settler Mortality -0.0453 0.2159** 0.0270(0.60) (0.04) (0.76)
Ln Population Density -0.1696** -0.0370 -0.1277**around 1500 (0.01) (0.61) (0.03)
Pseudo R-squared 73 66 100 76 66 106 53 42 60 61 49 73Countries 0.0741 0.275 0.0907 0.124 0.286 0.135 0.0686 0.395 0.153 0.139 0.283 0.177
Table 4
Cross-section probit estimates. Probit slope derivatives (marginal effects) are reported. The dependent variable equals zero for always autocratic countries and takes on the value one if a country that was non-democratically governed before the Third Wave began (in 1975), permanently abandoned autocratic rule in the 1975-2000 period. All values of the time-varying independent variables correspond to 1975 (before the Third Wave of Democratization). Estimation is performed in all countries that were non-democratic in the beginning of the sample. To test for the modernization hypothesis for each model the Table reports three specifications, using the log of real p.c. GDP (columns indexed (a)), average years of schooling (columns indexed (b)), and life expectancy (columns indexed (c)).
Early Institutions/Endowment Theories
Cross-Country Estimates on the Likelihood of Successful Democratic Transition
P-values based on heteroskedasticity adjusted standard errors are reported in parenthesis below the marginal effects. All specifications include a constant term (marginal effect not reported). The table also reports Mc-Fadden’s pseudo R-squared. *, **, *** denote statistical significance at the 10%, 5%, and 1% level, respectively. Table 1 reports the categorization of countries to “always autocratic”, “partial democratization”, and “full democratization” countries. The Democratization Appendix provides details on the event identification methodology and gives a brief description of the transition. The Data Appendix gives detailed variable definitions and sources.
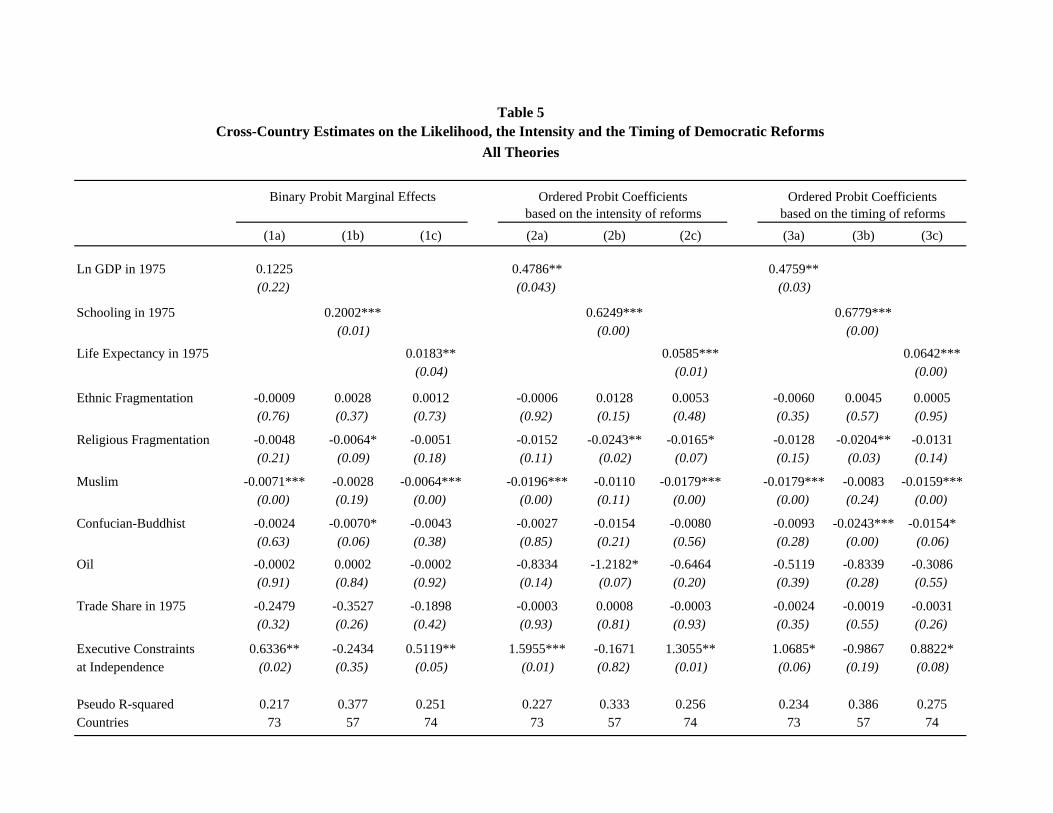
(1a) (1b) (1c) (2a) (2b) (2c) (3a) (3b) (3c)
Ln GDP in 1975 0.1225 0.4786** 0.4759**(0.22) (0.043) (0.03)
Schooling in 1975 0.2002*** 0.6249*** 0.6779*** (0.01) (0.00) (0.00)
Life Expectancy in 1975 0.0183** 0.0585*** 0.0642*** (0.04) (0.01) (0.00)
Ethnic Fragmentation -0.0009 0.0028 0.0012 -0.0006 0.0128 0.0053 -0.0060 0.0045 0.0005(0.76) (0.37) (0.73) (0.92) (0.15) (0.48) (0.35) (0.57) (0.95)
Religious Fragmentation -0.0048 -0.0064* -0.0051 -0.0152 -0.0243** -0.0165* -0.0128 -0.0204** -0.0131(0.21) (0.09) (0.18) (0.11) (0.02) (0.07) (0.15) (0.03) (0.14)
Muslim -0.0071*** -0.0028 -0.0064*** -0.0196*** -0.0110 -0.0179*** -0.0179*** -0.0083 -0.0159***(0.00) (0.19) (0.00) (0.00) (0.11) (0.00) (0.00) (0.24) (0.00)
Confucian-Buddhist -0.0024 -0.0070* -0.0043 -0.0027 -0.0154 -0.0080 -0.0093 -0.0243*** -0.0154*(0.63) (0.06) (0.38) (0.85) (0.21) (0.56) (0.28) (0.00) (0.06)
Oil -0.0002 0.0002 -0.0002 -0.8334 -1.2182* -0.6464 -0.5119 -0.8339 -0.3086(0.91) (0.84) (0.92) (0.14) (0.07) (0.20) (0.39) (0.28) (0.55)
Trade Share in 1975 -0.2479 -0.3527 -0.1898 -0.0003 0.0008 -0.0003 -0.0024 -0.0019 -0.0031(0.32) (0.26) (0.42) (0.93) (0.81) (0.93) (0.35) (0.55) (0.26)
Executive Constraints 0.6336** -0.2434 0.5119** 1.5955*** -0.1671 1.3055** 1.0685* -0.9867 0.8822*at Independence (0.02) (0.35) (0.05) (0.01) (0.82) (0.01) (0.06) (0.19) (0.08)
Pseudo R-squared 0.217 0.377 0.251 0.227 0.333 0.256 0.234 0.386 0.275Countries 73 57 74 73 57 74 73 57 74
Ordered Probit Coefficientsbased on the timing of reforms
Table 5Cross-Country Estimates on the Likelihood, the Intensity and the Timing of Democratic Reforms
All Theories
Binary Probit Marginal Effects Ordered Probit Coefficientsbased on the intensity of reforms
Table 5 Notes
P-values based on heteroskedasticity adjusted standard errors are reported in parenthesis below the marginal effects (in (1)) and below the coefficients (in (2)-(3)). All specifications include a constant term. The table also reports Mc-Fadden’s pseudo R-squared. *, **, *** denote statistical significance at the 10%, 5%, and 1% level, respectively. Table 1 reports the categorization of countries to “always autocratic”, “partial democratization”, and “full democratization” countries. The Democratization Appendix provides details on the event identification methodology and gives a brief description of the transition. The Data Appendix gives detailed variable definitions and sources.
Columns (1a), (1b) and (1c) report cross-section probit marginal effects on the likelihood of democratization. The dependent variable equals zero for always autocratic countries and takes on the value one if a country that was non-democratically governed before the Third Wave began (in 1975), permanently abandoned autocratic rule in the 1975-2000 period. Columns (2a), (2b) and (2c) report cross-section ordered probit coefficients on the likelihood of democratization and the intensity of reforms. The dependent variable equals zero for “always autocratic” countries; it takes on the value one for “partial democratization” countries and the value two for “full democratization” countries. Columns (3a), (3b) and (3c) report cross-section ordered probit coefficients on the likelihood of democratization and the timing of democratic reforms. The dependent variable equals zero for always autocratic countries; it takes on the value one for countries that democratized in the nineties (“Late Democratizations”) and takes the value two for countries that democratized in the1975-1989 period (“Early Democratizations”).
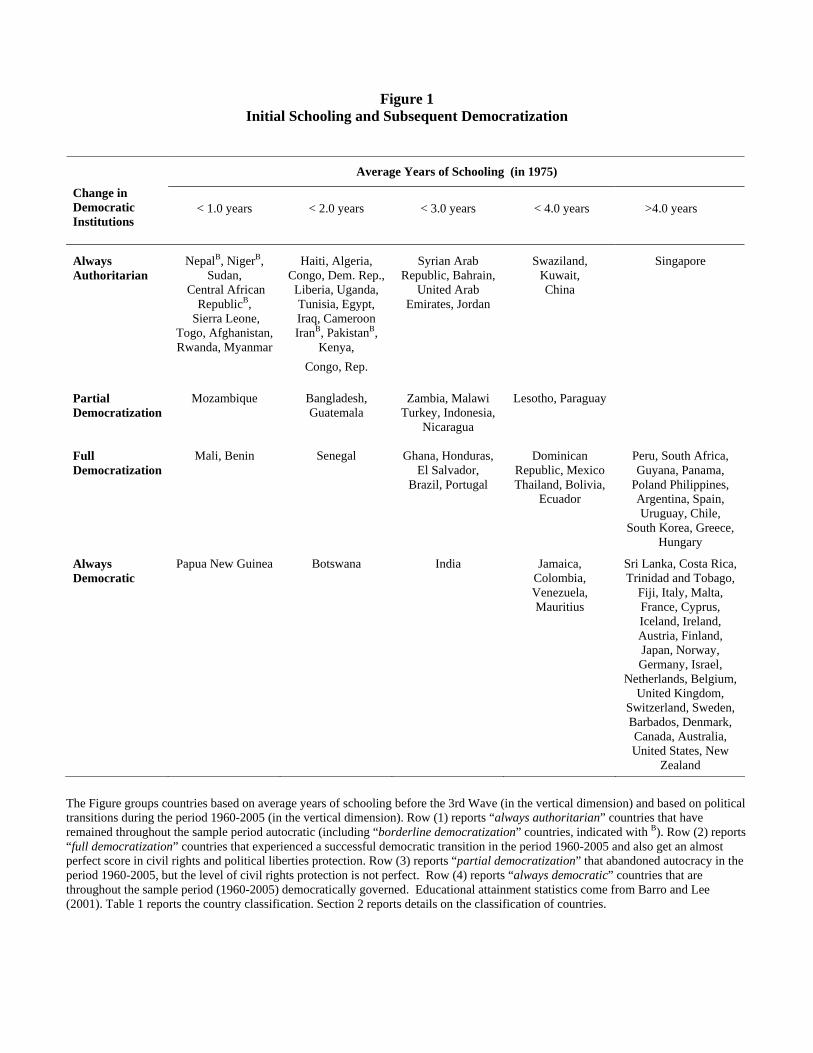
Figure 1 Initial Schooling and Subsequent Democratization
Average Years of Schooling (in 1975) Change in Democratic Institutions
< 1.0 years
< 2.0 years
< 3.0 years
< 4.0 years
>4.0 years
Always Authoritarian
NepalB, NigerB, Sudan,
Central African RepublicB,
Sierra Leone, Togo, Afghanistan, Rwanda, Myanmar
Haiti, Algeria, Congo, Dem. Rep., Liberia, Uganda, Tunisia, Egypt, Iraq, Cameroon IranB, PakistanB,
Kenya, Congo, Rep.
Syrian Arab Republic, Bahrain,
United Arab Emirates, Jordan
Swaziland, Kuwait, China
Singapore
Partial Democratization
Mozambique
Bangladesh, Guatemala
Zambia, Malawi Turkey, Indonesia,
Nicaragua
Lesotho, Paraguay
Full Democratization
Mali, Benin Senegal Ghana, Honduras, El Salvador,
Brazil, Portugal
Dominican Republic, Mexico Thailand, Bolivia,
Ecuador
Peru, South Africa, Guyana, Panama,
Poland Philippines, Argentina, Spain, Uruguay, Chile,
South Korea, Greece, Hungary
Always Democratic
Papua New Guinea
Botswana India Jamaica, Colombia, Venezuela, Mauritius
Sri Lanka, Costa Rica, Trinidad and Tobago,
Fiji, Italy, Malta, France, Cyprus, Iceland, Ireland, Austria, Finland, Japan, Norway, Germany, Israel,
Netherlands, Belgium, United Kingdom,
Switzerland, Sweden, Barbados, Denmark, Canada, Australia, United States, New
Zealand
The Figure groups countries based on average years of schooling before the 3rd Wave (in the vertical dimension) and based on political transitions during the period 1960-2005 (in the vertical dimension). Row (1) reports “always authoritarian” countries that have remained throughout the sample period autocratic (including “borderline democratization” countries, indicated with B). Row (2) reports “full democratization” countries that experienced a successful democratic transition in the period 1960-2005 and also get an almost perfect score in civil rights and political liberties protection. Row (3) reports “partial democratization” that abandoned autocracy in the period 1960-2005, but the level of civil rights protection is not perfect. Row (4) reports “always democratic” countries that are throughout the sample period (1960-2005) democratically governed. Educational attainment statistics come from Barro and Lee (2001). Table 1 reports the country classification. Section 2 reports details on the classification of countries.