Embed Size (px)
Citation preview

Economic and social benefits of new forage technologies in Mindanao, Philippines
and Tuyen Quang, Vietnam.
R. H. Bosma, R. L. Roothaert, P. Asis, J. Saguinhon, L.H. Binh, and V.H. Yen
Centro Internacional de Agricultura Tropical (CIAT) in collaboration with
Cagayan de Oro City Veterinary OfficeMalitbog Municipal Agricultural Office
National institute of Animal Husbandry, HanoiTuyen Quang Province Department of Agriculture and Rural Development
2003
CIAT Working Document No. 191

1
Editorial support: J. Edwards Correct citation: R. H. Bosma, R. L. Roothaert, P. Asis, J. Saguinhon, L.H. Binh, and V.H. Yen, 2003. Economic and social benefits of new forage technologies in Mindanao, Philippines and Tuyen Quang, Vietnam. CIAT Working Document No. 191. Centro Internacional de Agricultura Tropical, Los Baños, Philippines, 92 pages.

2
Acknowledgements FSP was funded by AusAID from 1995 to 1999 and by the Asian Development Bank from 2000 to 2002. The project was coordinated in Southeast Asia by the Centro Internacional de Agricultura Tropical (CIAT). In Mindanao, Philippines it was implemented by the Philippine Council for Agriculture, Forestry, and Natural Resources Research and Development (PCARRD); the Department of Agriculture Region 10; the City Veterinary Office in Cagayan de Oro; and the Municipal Agricultural Office of Malitbog. In Tuyen Quang Province, Vietnam the project was implemented by the National Institute of Animal Husbandry, and the Department of Agriculture and Rural Development. Special thanks go to all of the farmers who participated in the study. We are grateful to the Hon. Osmundo dela Rosa, Mayor of the Municipality Malitbog, and Dr Hildegardo M. Dagondon, Chief of the City Veterinary Department of Cagayan de Oro City, for their support and organization in the Philippines. The work could not have been realised without the assistance of the following fieldworkers: Gaspar Velasco, Miriam Alfeche, Willie Nacalaban and June Paderog in Malitbog; and Bibieng, Elvin Elorde, Rey Dapanas, Edward Paasa, Eveslyn Payla, Fernando Lavictoria and the students from Xavier University in Cagayan de Oro. In Vietnam our thanks go to Dr M. Khoa and Dr Vu Do, Director and Vice Director of the Provincial Department of Agriculture and Rural Development; and Mrs Vu Thi Huang, fieldworker in Yen Son district. The excellent translation skills of Ms Vu Thi Phuong were invaluable for focus group discussions and household surveys.

3
Summary This study assesses the impact of the Forages for Smallholders Project (FSP) in the Philippines and Vietnam from 1995 to 2002. FSP was convened by Centro Internacional de Agricultura Tropical (CIAT), and implemented by national partners in several countries in southeast Asia. The use of participatory processes in FSP resulted in the widespread adoption of improved forage and pasture technologies. This report looks at the financial and social benefits of the improved forage systems developed at two project sites: Mindanao, southern Philippines; and Tuyen Quang province, northern Vietnam. Participatory evaluation tools together with conventional survey techniques were used to collect data from a total of 124 households. Both social and economic parameters were used to compare the livestock production systems of early and recent forage adopters. The difference in the financial status of the two groups was attributed to the prolonged use of forages. The evaluation and comparison of income per labour day in the various systems made accurate assessments possible. Results were stratified by wealth categories and other important cultural factors. Meetings to validate results and record farmer feedback along with farmer training sessions were conducted toward the end of the study. Livelihood at all sites consisted of a variety of crops, a variety of animals and several sources of off-farm income. Fish production was only practiced in Vietnam. Farm size ranged from 1.1 hectares in Vietnam to 4.5 hectares in the Philippines. The average number of large ruminants per farm was 0.8 in Vietnam and 4.2 in the Philippines. Livestock activities comprised 10% of the total livelihood for recent adopters, 20% for early adopters, and 30% for dairy cattle farmers in the Philippines. Farmers in the Philippines owning large livestock made 25% of their livelihood from livestock, whereas farmers with just small livestock made only 15%. In Vietnam, the contribution of livestock to livelihood was stratified by wealth class and ranged from 39% in the poorest group to 32% in the wealthiest. In the Philippines, improved forage species increased animal production, improved soil conservation and saved farmers time. Net yearly income per household from animal production increased from1 $54 to $157 in the farming community at Malitbog, and from $68 to $503 in Cagayan de Oro. The average net income from animal production increased from $0.44 to $1.06 per day of labour in Malitbog, and from $0.40 to $1.34 in Cagayan de Oro. Planting forages in contour lines increased crop production slightly and contributed another $22.50 to yearly income. The reduction in labour requirements allowed households to make $36 per year from other activities. The drop in labour time enabled households with low labour and land availability to acquire animals, and other more lucrative farmers to increase their herd size or extend their crop activities. The introduction of new forages had a gender effect in the Philippines: the involvement of women and children in tasks like herding and cutting diminished, and men were responsible for more livestock tasks. A large increase in the number of animals owned by early adopters resulted in the need for greater labour input. This created labour in rural areas and reduced labour migration by young people. The introduction of cutting and carrying reduced the destruction of crops by grazing animals and affected social life in villages where herding was previously conducted on communal rangelands. In Vietnam, improved forage systems also had a pronounced effect on income levels and welfare. Net income from ruminant-fish production systems increased from $99 to $199 per year. Converted to net income per day of labour spent in the systems, the rates increased from $0.33 to $1.13 for the ruminant system and from $ 0.80 to 2.33 for the fish system. Saved time also allowed households to increase their income from other, mainly agricultural, activities. This contributed to an additional yearly income of $52 per household. Overall, the financial situation improved due to increased income from investments in tree crops, but the percentage contribution 1 All $ = US dollars

4
of livestock to total livelihood actually decreased. Forages increased net income per household from pig production, but not the return from labour. Positive gender effects were more significant in Vietnam. Women and children benefited most from the reduction in time spent cutting, carrying and herding. They used this extra time for educational and cultural activities. Poorer farmers who depended more on livestock due to small land area, benefited most from the improved forages. Improved forages allowed them to keep large ruminants—increasing their income from livestock— and intensify their production systems. Other positive effects on rural development included a reduction in the number of farming conflicts, rehabilitation of barren land and reduced use of pesticides. The adoption of new forage was highly dependent upon the livestock dispersal and credit programs in Mindanao, affecting further adoption and scaling-out negatively in one municipality. In Tuyen Quang province, the scaling-out of improved forage technologies was not influenced by livestock distribution schemes. The many advantages and favourable socio-economic conditions associated with the adoption of Panicum maximum systems, enhanced an autonomous farmer-to-farmer process of scaling-out. However, the introduction of other species and accessions still needs a structured extension system. Several recommendations are made on the basis of this study. All farmers cultivating forages need training on ruminant nutrition and the importance of consistent feeding practices. The causes of high mortality in goat kids requires more research. Further study is needed to produce more accurate girth–liveweight tables for local livestock species. The traditional alima system, whereby animals are given in trust, is an obstacle to equal income distribution and ought be revised to increase the share of benefits going to caretakers. People without long term rights to land use could not profit from forage systems: there is an urgent need to provide land rights to the landless. The project should work with farmers owning small livestock, as an alternative to working with farmers who receive large livestock through dispersal and credit schemes. There is scope for better market orientation for smallholder livestock producers, particularly in the Philippines.

5
Table of Contents Acknowledgements 2 Summary 3 Table of Contents 5 1 Introduction 7 2 Methods 11
2.1 Indicators and variables 11 2.2 Sample size and composition 12
2.2.1 Philippines 12 2.2.2 Vietnam 13
2.3 Data collection 13 2.3.1 Participatory research tools 13 2.3.2 Relative income 14 2.3.3 Labour for forage collection 16
2.4 Data analysis and Economic Assessment 16 2.4.1 Value of manure 18 2.4.2 Value of land 18 2.4.3 Insurance value 19 2.4.4 Value of fodder 19
3 Results and Discussion from the Philippines 21 3.1 Farm household characteristics in Cagayan de Oro 21
3.1.1 Livestock Resources in Cagayan de Oro 21 3.1.2 Livestock activities in Cagayan de Oro 23 3.1.3 Livelihood resources in Cagayan de Oro 24
3.2 Farm household characteristics in Malitbog 27 3.2.1 Livestock resources in Malitbog 27 3.2.2 Livestock activities in Malitbog 29 3.2.3 Livelihood resources in Malitbog 30
3.3 Effects of forages on production systems and livelihood 32 3.4 Financial benefits 34 3.5 Social and gender effects 39 3.6 Dispersal schemes 41 3.7 Contribution to poverty reduction 42 3.8 Feed quality, quantity and cost 43 3.9 Other factors affecting economic benefits 43

6
4 Results and Discussion from Vietnam 45 4.1 Farm household characteristics 45
4.1.1 Livestock resources 45 4.1.2 Livestock activities 48 4.1.3 Livelihood resources 49
4.2 Effects of forages on production systems and livelihood 50 4.3 Financial benefits 52
4.3.1 Buffalo and cattle production systems 52 4.3.2 Fish production systems 54 4.3.3 Swine production systems 56
4.4 Social and gender effects 57 4.5 Contribution to poverty reduction 59 4.6 Feed quality, quantity and cost 62
5 Training 65 5.1 Philippines 65 5.2 Vietnam 66
6 Conclusions and Recommendations 67 7 References 69 8 Annexes 70
Annex A. Calendar of activities R. Bosma (consultant) 70 Annex B. Guidelines for general meetings 73 Annex C. Guidelines for general focus group discussions stratified by wealth 75 Annex D. Guidelines for women group discussions 77 Annex E. Household interview sheet. 79 Annex F. Specific questions for early adopters in Tuyen Quang 85 Annex H. Table for conversion of heart girth into live body weight 89 Annex I. Guide for body condition scoring 91 Annex J. Guide for scoring of gut fill 92

7
1 Introduction Livestock are an important component of smallholder farming systems throughout Southeast Asia. Direct benefits include: income from the production of offspring, meat, milk or eggs; transport; and sources of dietary protein for the family. Livestock can also plays a less obvious role; as readily available draught power when fields need to be ploughed quickly between the first rains that wet the soil, and the second rains that feed the new crops. Even less visible are the significant benefits to crop production from the application of manure to fields. Another often overlooked advantage of owning livestock is their role as a form of medical insurance or as absence of interest on a loan. Unfortunately animal feed resources are often scarce and unless farmers grow their own forages, animals can suffer from lack of feed or malnutrition. Forage crops are important assets for animal productivity. The Forages for Smallholders Project (FSP) began in 1995 with funding from AusAID. The Asian Development Bank provided funds for the second phase (FSP-II) from 2000 to 2002. The goal of the project was to improve the livelihood of resource-poor farmers in the upland systems of Asia. This was to be achieved by developing sustainable forage technologies, increasing livestock production, conserving soil and enhancing nutrient management. The project was co-ordinated by the Centro International de Agricultura Tropical (CIAT), and operated in six countries: PR China, Indonesia, Lao PDR, Philippines, Thailand and Vietnam. Much has been written about tropical forages but little is based on work with smallholder farmers. FSP stands out because of its success in stimulating widespread forage adoption. Initially more than 500 improved forage species and accessions were screened for their adaptability to different climates and soil types, and disease resistance. Soon after, farmers were involved to ensure the development of forage systems suited to the environment, management practices, traditions, and uses, specific to local farms. The close involvement of farmers in every step of the project resulted in widespread spontaneous adoption of the new forage systems. Research on forage technologies for the tropics has generally been limited to finding intermediate solutions to problems. For instance, a wealth of papers examining forage yields in a multitude of experimental designs, and animal responses in forage feeding trials, have been published. However, the effect of improved forages on animal productivity in smallholder farms has received little attention. Even less is known about the impact of these improved forages on peoples' livelihood. Hence, the decision to conduct a series of socio-economic impact studies in Indonesia, Philippines and Vietnam, where significant numbers of farmers were involved in FSP and actively cultivating improved forages: 740, 1200, and 1700, respectively in June 2002 (Roothaert and Kaaria, unpub). The study in Indonesia has been reported by Bosma et al. (2001). Benefits of new forage systems reported in this study included: a 20% reduction in the time needed for collecting and managing forages; a doubling of farm household income from livestock; and greater farmer involvement in the market economy. Saved time was spent increasing livestock production or engaging in off-farm employment. In Indonesia, the improvements in the livestock sector were generally gender neutral. Increased manure availability improved soil fertility and reduced costs for farmers.

8
This study aimed to measure the economic and social benefits of forage technologies developed through participatory research with FSP in northern Mindanao, Philippines, and in Tuyen Quang province, Vietnam. In the Philippines, FSP was implemented by the City Veterinary Office in Cagayan de Oro City, and by the Municipal Agricultural Office in Malitbog municipality. Activities at these project sites began at the end of 1995 with participatory diagnostics and experiments. Demonstration plots were established in the barangays2 of Pangalungan and Lumbia, Cagayan de Oro City and in Kaluluwayan, a sitio3 of barangay San Luis, Malitbog municipality. Initially only fodder banks were established. Malitbog and Cagayan de Oro City are very different farming communities. The municipality of Malitbog is located in old forest concessions, clear-felled by loggers between 1960 and 1980. Soils are poor and acidify quickly after slashing and burning. Cagayan de Oro City includes a vast rural area comprising several communities and the density of settlement is much higher. In both provinces farmers sometimes crop slopes steeper than 50%. In Cagayan de Oro, most farmers used new forages by cutting and carrying from fodder banks while other farmers established pastures, border lines and contour lines. In Malitbog, the establishment of contour lines became more frequent after the pilot project. After adopting new forage species, farmers expanded their use to contour lines or cover crops and new livestock production systems developed. However, no reliable data on the socio-economic benefits of the forages were available. FSP was implemented at two sites in Vietnam: Daklak province, in the centre of the country and Tuyen Quang province, in the north. This impact study was conducted in the province of Tuyen Quang, where the implementing agency was the Provincial Department of Agriculture and Rural Development. The situation in Tuyen Quang province was particular, as all communal land had been allocated to individual farmers in 1992; reducing the possibilities for free grazing and creating a situation conducive to change. Participatory diagnostics and experiments with 12 new forage species by the Vietnam Sweden Mountain Rural Development Programme began in 1997. Demonstration plots and farmer experiments were established in six communes, including: Phu Lam; My Bang in the district of Yen Son; and Duc Ninh in the district of Ham Yen. These three communes continued experimentation into 1998, then in 1999 the program expanded to the district level in these areas and also to three other districts. In 2000, more than 400 farmers in the three original communes were using new forage species (Bui The Hung, 2001) and more than a total of 600 FSP participants were registered. Since the introduction of new forage species for fodder-banks, farmers had also begun using the forages for intercropping with food crops, as contour lines along slopes, and as cover crops under fruit trees and cash crops. A benchmark survey including almost every household participating in the project in the Philippines and Vietnam was conducted in 1999. It comprised detailed household information
2 Barangay is the local term for the division within a municipality, equivalent to a township. 3 Sitio is a sub-barangay division, best equated to a small village.

9
as well as information on livelihoods, livestock and the forages being cultivated. The present study attempted to link information from the benchmark survey to current data, and to analyse the changes that had occurred in the households common to both. The goals of this study were:
• To assess the financial and social benefits of forage technologies developed through participatory research with FSP;
• To calculate the costs of actual feeding practices and to compare them with theoretical feed requirements;
• To train farmers and field workers in the use of i) girth tape measures (cattle) and spring balances (goats) for live-weight assessment and growth, and ii) body condition scoring;
• To assess the effects of forage contour rows on crop production (Malitbog, Philippines).
11
2 Methods The study was conducted on the island of Mindanao, Philippines, from April 25 to May 22, and in Tuyen Quang, northern Vietnam, from May 25 to June 22, 2002 (Annexe A). The methods used to assess the social and financial effects of the introduction of new forages are described in the following sub-sections.
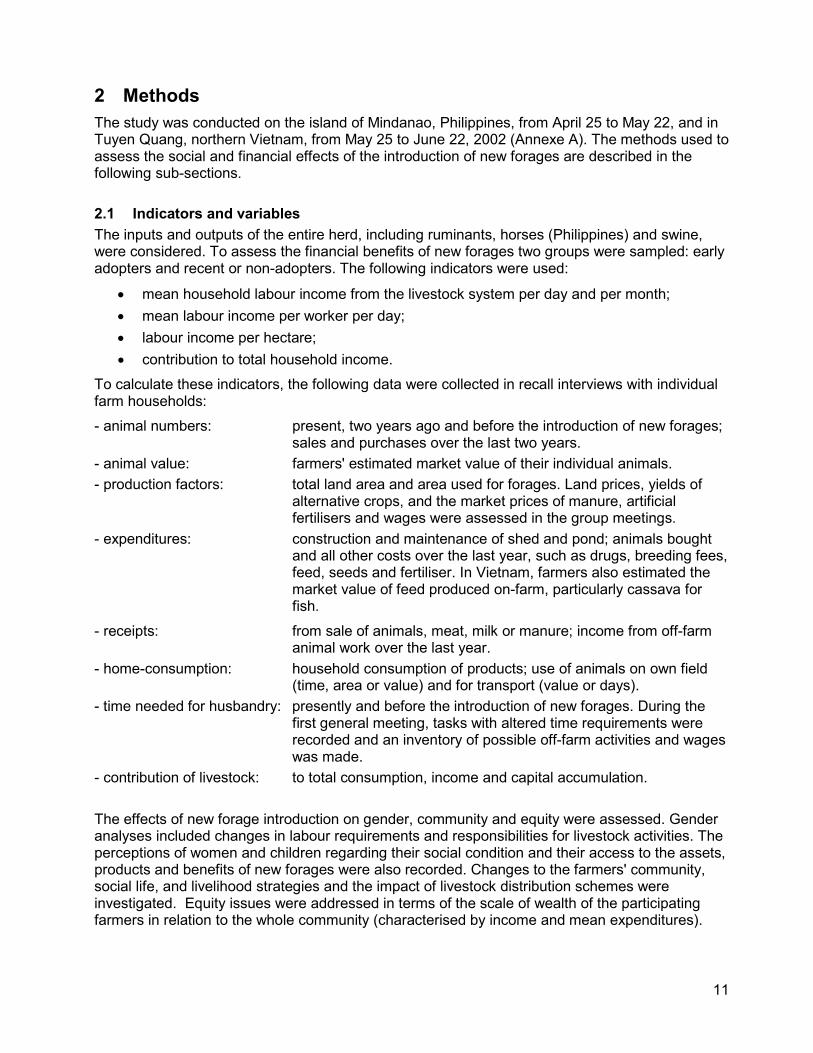
2.1 Indicators and variables The inputs and outputs of the entire herd, including ruminants, horses (Philippines) and swine, were considered. To assess the financial benefits of new forages two groups were sampled: early adopters and recent or non-adopters. The following indicators were used:
• mean household labour income from the livestock system per day and per month; • mean labour income per worker per day; • labour income per hectare; • contribution to total household income.
To calculate these indicators, the following data were collected in recall interviews with individual farm households: - animal numbers: present, two years ago and before the introduction of new forages;
sales and purchases over the last two years. - animal value: farmers' estimated market value of their individual animals. - production factors: total land area and area used for forages. Land prices, yields of
alternative crops, and the market prices of manure, artificial fertilisers and wages were assessed in the group meetings.
- expenditures: construction and maintenance of shed and pond; animals bought and all other costs over the last year, such as drugs, breeding fees, feed, seeds and fertiliser. In Vietnam, farmers also estimated the market value of feed produced on-farm, particularly cassava for fish.
- receipts: from sale of animals, meat, milk or manure; income from off-farm animal work over the last year.
- home-consumption: household consumption of products; use of animals on own field (time, area or value) and for transport (value or days).
- time needed for husbandry: presently and before the introduction of new forages. During the first general meeting, tasks with altered time requirements were recorded and an inventory of possible off-farm activities and wages was made.
- contribution of livestock: to total consumption, income and capital accumulation. The effects of new forage introduction on gender, community and equity were assessed. Gender analyses included changes in labour requirements and responsibilities for livestock activities. The perceptions of women and children regarding their social condition and their access to the assets, products and benefits of new forages were also recorded. Changes to the farmers' community, social life, and livelihood strategies and the impact of livestock distribution schemes were investigated. Equity issues were addressed in terms of the scale of wealth of the participating farmers in relation to the whole community (characterised by income and mean expenditures).

12
2.2 Sample size and composition The FSP socio-economic study in East Kalimantan (Bosma et al., 2001) showed that the effect of improved forages could be assessed through comparing two groups of farmers within a community: early and recent adopters. The effect of improved forage technologies was determined by the difference of income between the two groups; early adopters had time to reap the benefits of their investments, while late adopters had invested but not yet experienced significant financial benefits. In the Philippines, goat owners that adopted forages before 2001, and cattle and buffaloes owners that adopted forages before 2000 were classed as early adopters. In Vietnam, all farmers who adopted new forages in 1999 or earlier were classed as early adopters and farmers who did not use new forages until 2000 or beyond were classed as recent adopters. 2.2.1 Philippines In Malitbog, a total of 27 farm households were interviewed: 17 early adopters and 10 recent or non-adopters. The number of benchmark survey participants included in these two groups was four and five, respectively. All interviewed farmers used in the analysis owned at least one herbivore (cattle, buffalo, horse or goat). The assessment in Malitbog started with a farmers’ group meeting in the sitio Kaluluwayan, of San Luis barangay. FSP farmers represented in the benchmark survey from other sitios in San Louis barangay (sitios Lake and San Migara), and Silo-O barangay and were also invited. According to the fieldworkers, these villages were representative of Malitbog communities participating in FSP. Women were present at the meeting. At the end of the general farmer meeting, appointments were made for focus groups discussions in four villages and for three individual household interviews. The validation meeting was held in the meeting room of the new Municipal Hall of Malitbog. All but three interviewed farmers were present. San Migara was also represented by delegates of the church and by the landowner. Only women represented Silo-O, whilst other barangays were represented by both genders. In Cagayan de Oro, a total of 26 household surveys were conducted: 15 early adopters and 11 recent or non-adopters. The number of benchmark survey participants included was six and one, respectively. Four barangays were included in the study at Cagayan de Oro: Tagpagni, Pagalungan, Lumbia, and Dansolihun. In Cagayan de Oro, the study began with a general group meeting in the barangays of Tagpagni, Pagalungan and Dansolihun. Some farmers from the barangay Lumbia were invited to the Pagalungan meeting. Pagalungan had the highest representation in the study because most farmers here were also participating in other ongoing monitoring and evaluation studies of FSP, and had participated in the previous benchmark survey. According to the fieldworkers, Lumbia and Pagalungan were representative of communities involved in FSP, but they only included a few recent adopters. Tagpangi and Dansilohun, more recently involved in FSP activities, were selected to obtain a more representative sample of farmers having recently adopted new forages. The numbers of women and men present, respectively, in the three villages were: Tagpagni, 20 and 10; Pagalungan, 16 and18; Dansolihun, 11 and 11. At the end of the first general meeting participants were assigned to focus groups according to their wealth and period of adoption of forages. Sometimes a focus group discussion was held on the same day. Size of focus groups in the Philippines varied from 6 to 30 persons per group. During the validation meeting, some farmers of the barangay San Simon also attended. At the validation meeting in the new training centre of the co-operative in Lumbia, 10, 6, 8,12 and 4

13
farmers (about half being women), represented Lumbia, Tagpagni, Pagalungan, Dansolihun and San Simon, respectively. 2.2.2 Vietnam In Duc Ninh, a total of 30 farm households were interviewed: 20 early adopters and 10 recent adopters. The numbers of farmers represented in the benchmark surveys were nine and two, respectively. One of the recent adopters' interviews was not used because the farmer did not previously market fish, and had only recently acquired buffaloes. In Phu Lam, six early adopters and one recent adopter were interviewed. The numbers of farmers represented in the benchmark survey were three and zero, respectively. Twenty household surveys from Thang Quan contributed to data collection for the sample of recent adopters. A total number of 14 households from Duc Ninh, Phu Lam and Thang Quan were interviewed about their pig production system (annex H). The numbers of men and women, respectively, present at general meetings were as follows: Thang Quang - 28 and 4; Duc Ninh - 26 and 6; and in Phu Lam - 12 and 4. The number of people attending in Phu Lam was limited due to heavy rains. In Duc Ninh 12 women, and in Phu Lam 8 women discussed the effects of new forages in focus groups. Focus group discussions were held with between 8 (Duc Ninh) to18 farmers (Thang Quan).
2.3 Data collection 2.3.1 Participatory research tools Several participatory research tools (Table 1) were used to collect the data in three stages: 1) meetings with large group of farmers; 2) farmer focus groups; 3) household surveys and 4) validation meeting. All farmer groups were convened twice. The main aim of the first general farmer meeting was to establish a relationship of confidence with the farmers and increase their availability to provide expenditures and income data (Annex B). All general meetings lasted between 2.5 and three hours and included a break. Focus group discussions lasted between one and two hours, after which some time was needed for sampling and to make appointments for interviews. For focus groups open to both genders and sorted according to class of wealth, the facilitator guided discussion using a prepared list of questions (Annex C). A female fieldworker facilitated the women-only focus groups using prepared guidelines to stimulate discussion (Annex D, Photograph 1). Structured interviews (Annex E) were used to collect data on labour needs, finances, feeding practices and labour distribution by gender from individual households Market and saving objectives and land issues were addressed during group meetings. Interest, insurance and inflation rates were collected from literature or key informants. Wealth ranking, relative contribution to livelihood and feed resources were measured according to methods proposed by Cramb and Purcell (2000). The exception was in Cagayan de Oro, where the criteria for wealth ranking were proposed, discussed and decided upon by farmers in the general meetings. Feed resources were ranked for wet and dry season during the group meetings.

14
Table 1 Participatory tools used for the assessment of financial and social impact Research Objective Research Tool Participants Livestock production system Destination of earnings from livestock Livestock productivity before and after adoption
Resource flux diagram Open ended questions Open ended questions
Gender division of livestock activities Feed resources and changes due to new forages.
Seasonal calendar and open-ended questions
Livelihood strategies Possible off-farm income
Resource flux diagram
Sample allocation Wealth ranking and adoption benchmark survey
General farmer group
Relative importance of livelihood activities for consumption and income
Proportional ranking
Time taken and gender labour division for livelihood activities, before and after adoption
Seasonal activity calendar of all livelihood activities
Changes due to new forage introduction - causes and effects (why late adoption?)
Open ended questions
Stratified farmer groups & gender focus groups
Productivity of most important crops Feed resources Feeding practices and diet composition
Open ended questions, scoring and ranking
Time taken and gender labour division for livestock activities, before and after adoption Labour conflicts and use of saved labour
Semi-structured interviews
Financial data on capital, income and labour Structured interviews
Farm households
Feedback of results to community and incorporation of farmers’ interpretation.
Validation meeting: presentations of study results and open discussion
All farmers
2.3.2 Relative income In the Philippines, the importance of livestock in relation to household livelihood strategy was assessed during group meetings. Participatory ranking with grains was used to measure the relative contribution of all livelihood activities to household consumption, and income and capital accumulation (Photograph 2). Data on the mean monthly income and mean monthly food and non-food expenditures in the province were collected from government services (NSO, 2001). These quantitative data were combined with wealth ranking criteria from the different barangays and with the ranking of the relative importance of livestock for livelihood. In Vietnam, the contribution of new forages to poverty reduction was estimated by comparing the income of the sample participants with standard income data for the community from the local government services. The total income of farm households was calculated with the estimated contribution of livestock to livelihood. Ranking of the relative contribution of livestock to livelihood and the contribution of improved forages to general feed resources was carried out according to methods proposed by Cramb and Purcell (2000). The contribution of livestock to household livelihood strategy was assessed during focus group meetings where participants were asked to rank the relative contribution of all livelihood activities to household consumption, and income and capital accumulation, using a total of 100 grains of seed.

15
Photograph 1: Women ranking the contribution of household livelihood activities to consumption, and income and capital accumulation in Thang Quan. Photograph 2. Participatory ranking of the contribution of household livelihood activities to consumption, and income and capital accumulation (Photo from Dr. Perla Asis).

16
2.3.3 Labour for forage collection The time needed to collect fodder for ruminants and fish was recorded for both the dry and wet seasons: November to February and March to October, respectively. It was difficult for farmers to distinguish shorter periods required for fish fodder collection alone. Moreover, farmers mostly cut fodder for fish and ruminants at the same time. Ranking using a total of 20 grains allowed farmers to divide the time spent, and fodder used, for the two production systems (Table 2). This method also allowed estimation of the cost of the land cropped with forages for the two systems. The value of concentrated feeds produced on-farm was accounted for at the market value estimated by the farmers. Table 2 Table used for weighting the contribution of different feed resources to animals’ diet.
Rainy season Dry season
Cattle & buffalo Fish
Feed resource Cattle & buffalo Fish
cut & carry planted forage
cut & carry natural forage
various crop by-products
concentrates
herding/tethering
2.4 Data analysis and Economic Assessment The data from the focus group discussions were compared to the data from earlier participatory assessments, i.e. the benchmark survey. Data collected from the structured household surveys were entered in an Excel spreadsheet to calculate the individual budget for each farm household. Statistical comparisons of the two groups were performed using the two-sided T-test for samples with different variance. The budget shows the benefits from the livestock system. Total income was calculated by summing:
1. the present household income from livestock 2. the positive difference in labour input between the new forage system and the system prior
to new forage introduction (effective time spared) accounted for at the wage rate of alternative off-farm activities. Households with a higher labour input in the new system due to an increased number of livestock, were not included in the total income value, but were included for calculation of the mean
3. the supplementary income from soil conservation due to new forage introduction in contour lines, estimated by individual farmers (Philippines only).
Total production from livestock systems includes: direct income from animals; home-consumption of products; benefits from manure and labour to farmer's fields; transport for the household; and benefits from the insurance and financing of animals. Direct income from the sales of trust animals was adjusted according to the share held. Animals received either through dispersal schemes, credit or trust, were valued at the market price. Returns from trust animals and products used for home-consumption were also accounted for at the farmers’ estimate of market value. Evolution of the monetary value of livestock was taken into account. Farmers were asked to estimate the market value of their current animals and those present in the first half of 2000 (end of the dry season). This value was checked according to the age category. The derived value

17
accounted for breed and three categories of age: kid, young and adult. Old buffaloes (carabao) were devalued. The value of labour from animals was accounted for in real amounts earned and time worked on own farm was accounted for at market rate. According to the methods proposed for production systems with restricted markets for land, capital and labour, the costs of these three production factors are presented as returns from land, capital and labour, after calculation of the net value of output (Bosman et al, 1997). Total production minus total cost gives the net value of output from livestock production, i.e. the amount farm households consider as their income from their livestock production. Net value of output was separated in returns from land, capital and labour. Return from labour was calculated as net value of output minus returns to land used for forage and fishpond, minus returns from capital value of the livestock. Returns from land represents the cost of land, which in conventional financial methods is considered part of total cost. Similarly, return from capital represents capital cost. These variables are presented in the following formulas:
Net value of output = total value output - total cost Return from land = area * market value * real interest rate Return from livestock capital = market value of livestock * interest rate on savings Return from labour = total value output – total cost – return from land –
return from capital. The cost of land for forage was not taken into account for recent adopters. For early adopters, only the parts planted with new forages were accounted for as returns from land. The cost of other fodder resources was hard to evaluate for both early and recent adopters because most other fodder came from barren land or in the form of products that had a low value when not recycled by animals. Not considering them for both was the acceptable solution, as it did not distort the comparison. One exception was the cassava produced from farmers' own land and this was accounted for by using market value as cost. Areas of forages in border and contour lines were assumed to have a width of 1 m, and in interlines with tea, for example, 0.5 m. Soil coverage of forages in mixed cropping with fruit trees was assumed to be 70%. Daily household income from livestock production system was calculated by dividing the return from labour by the total estimated number of workdays for livestock husbandry. The total number of labour days for recent adopters did not include activities for new forage; instead the estimated time needed for livestock activities before new forage adoption was used. In the Philippines and in Vietnam, a labour day was assumed to contain eight hours4. Vietnamese farmers estimated that they often worked only seven hours but when labour was hired the work day was eight hours. Income from livestock, per ha of area needed for fodder, was estimated using farmers’ proportional ranking of feeds contributing to animal diet. Relative contribution was determined using a ranking method with a fixed number of grains to cover both the wet and the dry seasons. In Vietnam, the area planted with new forages was divided between ruminants and fish according to the proportion of new forages used for each species. These correction factors were derived from the farmers’ estimation of the relative contribution of resources to the feed provision of ruminants and fish.
4 Farmers in the Philippines estimated their labour day to be shorter, especially in wet season, however the question was not always well understood and some farmers included only time spent on crop related activities.

18
2.4.1 Value of manure Philippines Manure not used for forages, was accounted for as fertiliser replacement through its components nitrogen (N), phosphorus (P) and potassium (K). Farmers were asked to estimate the partitioning between crops, forage and marketing. The quantity of available manure was adjusted for the time animals were tethered and herded. The value of manure was estimated at 0.15 Pesos per kilogram of dry matter (DM) after detailed analysis of cost and composition factors.6 Dung excretion by individual cattle was estimated at 1,000 kilogram per year7,. For buffaloes, mostly fed on low quality fodder, a value of 1,200 kilograms per year was applied. Dung excretion by individual goats was estimated at 100 kilograms per year8. And for pigs, dung excretion was estimated at 55 kilograms per year per animal. When manure was collected and used as fertiliser it was assumed to represent 14/24 part of total excreta. No difference was made between zero-grazing and tethered animals. Vietnam The manure not used for forages was accounted for using market prices. Dung excretion by individual cattle was estimated at 1000 kilograms per year9. For buffaloes, mostly fed on low quality fodder, a value of 1,200 kilograms per year was applied. To calculate the quantity of manure collected on a farm, a percentage proportional to the grazing time outside of the farm was deducted. Dung excreted during herding on a farmer's own land was assumed to contribute to crop production. 2.4.2 Value of land In the provinces of the Philippines, land was a tradable good, so the benefit from land used for new forage was accounted for at the real interest rate. The real interest rate was considered to be 6.0%—the difference between the inflation rate and the interest rate on loans10. In Vietnam, the return from the land used for forage production was accounted for using the real interest rate and compared to the lost benefits of alternative crops. The difference between the
5 At the time of the study the approximate exchange value was: 50 Philippines Peso = 1 US $, and 15,000 Vietnamese Dong = 1 US $ 6 Urea fertiliser containing 26% N, cost 400 Pesos6 per sack or eight Pesos per kilogram. NP-fertiliser (10/46) cost 500 Pesos per sack or 10 Pesos per kilogram. The deduced value of N from urea was 2 Peso/kg. The deduced value of P was 4.6 kilograms?. The N content of manure was evaluated from excretion of non-digested N and endogenous N. As in most studies, endogenous N was assumed to be of the same level as non-digested N. Supposing digestion coefficients for DM and protein of 60% and 65%, respectively, and a protein content of 125 g/kgDMI (N=20 g/kg), non-digested N was estimated at 17.5 g/kgDM. Faeces were assumed to be 3.5% N, 1% P and 4% K. The price of K from fertiliser was not known. The value of manure solely based on N was 0.07 Peso/kg, and on P, 0.05 Peso/kg. 7 Using a digestibility value of 60% of dry matter ingested (DMI), ingestion value of three kilograms per 100 kilograms of body weight (BW) and a mean BW of 225 kilograms per animal in herd. 8 Using a digestibility of 60% of DMI, ingestion of 3,5 kg/100kgBW and a mean BW of 20 kg per animal in herd. 9 Using a digestibility value of 60% of dry matter ingested (DMI), ingestion value of three kilograms per 100 kilograms of body weight and a mean body weight of 225 kg per animal in herd. 10 The inflation rate, according to region, varied from 6.6 to 7.5% (ADB, 2001 and ICLARM, unpub.); but was substantially higher for non-food than food, the latter being only 2% (ADB, 2001). In Mindanao, the inflation rate over 1999 was only 6.0%, and the general tendency was a lower inflation rate than Luzon and Manila. Official interest rates on loans was 10.9% in 2001 (ADB, 2001), but for private loans the rate in Mindanao was 12% when borrowing from a co-operative and at least double the official rate when borrowing from commercial banks.

19
inflation rate and interest rate on loans11 was used to determine a real interest rate of 10%. For land with a restricted or disturbed market, the production per hectare was compared to the lost benefits of crops previously planted on the forage area. The production of these crops was estimated in farmers’ focus group discussions. 2.4.3 Insurance value Insurance benefits from the herd and return from capital were based on the farmers’ estimate of the market value of the animals. In the Philippines, the degree of ownership, and the destination of benefits, was taken into account for the calculation of benefits of financing, insurance value and return from animal capital value. Accordingly, the benefits of financing from livestock were calculated using an interest rate of 12%. The benefits were based on income from livestock marketed for half a year only, as marketing cannot be delayed too long without detrimental effects. Mean interest rate on savings in 2001 was 7.4% (ADB, 2001), but according to financial overviews of Mindanao newspapers it varied from 4% to 7%. Hence, the return on capital for livestock, i.e. benefit of saving, was calculated using an interest rate of 6%. The benefits of livestock for medical insurance were based on the value of livestock in the herd for the equivalent rate of a representative health insurance—4% was assumed, as 3.2% was common for life insurance. In Vietnam, the destination of income from livestock was taken into account for the calculation of benefits of financing, insurance value and return from animal capital value. The benefits of financing from livestock were calculated using an interest rate of 10.8% (the interest rate value on short-term loans). As in the Philippines, benefits of livestock for financing were based on the income from livestock marketed for half a year only. The return on capital of livestock was calculated using an interest rate of 6%. Interest rates on deposits for savings in Tuyen Quang were 6% at the Post Office and 7.2 % at the State-owned banks. The benefits of livestock for medical insurance were based on the value of livestock in the herd for the equivalent rate of representative health insurance. Health insurance in Vietnam is collective and workers contribute 3% of their salary: this rate was applied. 2.4.4 Value of fodder The cost of fodder was calculated using the current market value and production cost was estimated by accounting for the cost of land and for labour input. A dry matter (DM) content of 20% was assumed for all forages. A mean production level was derived from the literature (Table 3). Production levels used for calculations were: 10 tons DM per hectare for pastures and badly fertilised fodder bank used for cutting; and 30 tons DM per hectare for good fertilised fodder bank grasses for cutting. A yield of 5.6 tons per hectare had recently been measured in contour lines with a mixed composition (Genio-Samson, 2002). Contour lines with grasses or legumes and areas with cover crops were assumed to yield six tons per hectare. Cover crops were assumed to cover 50% of the area.
11 The official inflation rate in Vietnam and in Tuyen Quang, during 2001 was - 0.7% (State Bank of Vietnam). Interest rates on loans in Tuyen Quang varied from 7.2 to 11.4%, a mean of 9.3%.

20
Table 3 Quality and production data for some of the forages grown in Mindanao Species N % DM digestibility Yield (t DM/ ha)
Brachiaria humidicola 0.6 – 1.0 50 – 70 in vitro 7 – 33
Pennisetum purpureum 2 – 4 55 - 70 6 – 10 unfertilised 6 – 40 fertilised
Setaria sphacelata 1 – 3 19 - 31
Panicum maximum 1.4 – 3.6 50 – 65 5 – 35
Stylosanthes guianensis 1.5 – 3.0 40 - 70 10 maximum
Centrosema pubescens 2.4 – 2.7 3 (mixed pasture) 12 (max. sole stand)
Gliricidia sepium 3 – 5 48 – 77 9 – 16 (Var. Retalhuleo: 25 tDM/ha)
Arachis pintoi 2.5 – 3 60 – 76 3 - 20
Source: ‘t Mannetje and Jones, 1992

21
3 Results and Discussion from the Philippines
3.1 Farm household characteristics in Cagayan de Oro The characteristics of the early adopter households and the recent adopter households differed greatly; particularly in terms of the numbers of households owning or sharing various species of livestock (Table 4). The numbers of cattle, horses and goats differed significantly in Malitbog (p=0.02, 0.06 and 0.09 respectively). Numbers of cattle and buffaloes differed significantly in Cagayan de Oro (p=0.1, 0.04 respectively). The variation in numbers and species was reflected in the number of labour days invested in livestock. New forages were not frequently fed to swine and poultry. An increase in poultry system production was described in just one case. Table 4 Mean and standard deviation (sd) for some characteristics of the sample of farm
households in Mindanao, and the number of farm households without particular species (column labelled ‘none’).
Malitbog Cagayan de Oro Early adop. (17) Recent adop. (10) Early adop. (15) Recent adop. (11) mean sd none mean sd none mean sd none mean sd noneHousehold size 5.5 1.4 6.1 2.3 5.4 2.2 6.7 3.5 Available labour 2.2 0.7 2.3 2.0 2.5 1.1 2.2 0.9 Farm size (ha) 4.5 4.7 3.9 3.4 4.7 4.7 2.8 2.2 New forages (ha) 0.4 0.5 0.6 0.9 Number of cattle 1.5 1.2 5 0.4 0.7 7 3.3 3.7 4 1.9 1.3 1 Number buffaloes 0.2 0.5 14 0.4 0.5 6 0.8 1.0 9 0.2 0.4 8 Number of goats 3.2 5.0 7 1.3 1.7 4 2.7 3.5 8 3.1 3.4 5 Number of pigs 1.3 2.4 11 2.1 2.2 3 1.9 3.5 7 1.1 2.0 5 Number horses 0.1 0.0 16 0.5 0.5 5 0 0 15 0 0 11
3.1.1 Livestock Resources in Cagayan de Oro Animals that benefited from the new forages included: cattle, buffaloes, horses, pigs, goat, rabbit, guinea pigs and chickens (Figure 1). Poultry fed only on Arachis pintoi. Of the smaller animals, guinea pigs were kept as pets; rabbits and chickens were for home-consumption and marketing; and goats were usually for grown for market sale. Pigs were home slaughtered and meat that was not used for home-consumption was sold in the neighbourhood or exchanged for staple food. Cattle, buffaloes and horses were only sold when urgent needs arose or when they needed to be replaced. If badly injured, these large animals were home butchered and meat that was not used for eaten by the household was either sold in the neighbourhood or to a trader, or was exchanged for staple food. The milk from cattle, buffaloes and goat was either consumed by the household or sold. Large livestock owners trusted part of their animals to farm households that wanted to begin animal husbandry or increase their herd size. The traditional trust or alima system had several ways of partitioning benefits—most common was the splitting of half of the offspring and other benefits (milk, increased animal value). If the animal was reproductively mature, the first offspring went to the owner, but when the animal was trusted at a younger age, the first offspring went to the farmer with the animal in trust.

22
The off-farm work of buffaloes and cattle was paid for at a rate of 75 Pesos per day. If a man was also hired, for ploughing or hauling, the price was 140 to 150 Pesos per day. For transport (hauling) with buffaloes or cattle of smaller portions, Farmers could make 10 to 30 Pesos per sack, depending on the distance, for hauling using buffaloes or cattle. Animals could transport two to four sacks without support, up to six on a sledge and ten on a wheel cart. Farmers had to pay for the mating of their female buffaloes, cattle, horses and pigs. For large animals it cost 500 Pesos for a successful mating with an improved breed and 200-250 Pesos if the male was of the native breed. If mating by a boar was successful, the boar's owner had the first choice of one of the resulting piglets. The most important expenses for livestock were concentrates (bran of corn or rice, or residues from root crops), salt, rope and troughs. Drugs and vitamins were provided and administered by government agents for free.
Income from livestock was used for several purposes (Figure 1). Most important were human medical cost and savings. In Dansolihun, some farmers still needed to buy food from their livestock income. The only investment mentioned was in small stores or trade. Local alternative income resources were limited, but some temporary work in construction or driving was available to some households (Figure 2, see section 3.2.3). In nearby cities and Manila, girls could easily obtain short and long term domestic jobs. Farm labourers were paid between 75 and 120 Pesos per day or 10 Pesos per hour. Local wages for youngsters varied between 30 and 35 Pesos per day. Agricultural land was marketed at 10,000 Pesos per hectare if
water giving, milking, housing a.o.
ploughing & hauling
Herbivores poultry & pigs
Crops &vegetables
new forageplanting etc.
manure
Farm household
Market
livestock, meat & milk
young livestock
fodder
labour
cash income for: school, medical staple food, house construction &
clothing, small store, wedding social drinking & smoking,
contribution & land meat & hauling
Figure 1: Livestock resource diagram, Cagayan de Oro.
N-fixation, leaves, and soil protection
by-products (straw & bran)
Herding, tethering & other feed activities
ploughing
urea, salt/mineralfeeds, rope a.o.

23
it had user only rights and 150,000 Pesos per hectare when it had a title. Only manure from commercial poultry units was traded—at 60 Pesos per sack. The market value of animals varied over the year (Table 5). Buffaloes were expensive from August to December. The prices of other livestock were low from March to July, due to increased sales at the end and the start of the school year when farmers needed to pay school fees (school vacation was May to June). Upgraded or high valued breeds obtained higher prices, for example, young piglets from the breed Large White could yield 1,500 Pesos, dairy buffaloes 150,000 Pesos and dairy crossbreds 30,000 to 60,000 Pesos. Milk prices were constant over the year—20 Pesos per kilogram for buffalo milk and five Pesos per kilogram for cow's milk. Table 5 Farmers’ estimate of market prices of animals in Pesos according to age category
and period, and the mean price accounted for in the financial analysis. Estimated market prices of animals
low price period high price period Mean prices accounted for Livestock species young adult young adult kid young old Native cattle 3,500 9,000 5,000 12,000 4,250 10,500Buffaloes 8,000 12,000 10,000 16,000 9,000 14,000Goat 600 1,200 800 1,500 400 700 1,350Swine 500 30/kg 800 45/kg 650 -
Among the early adopters, nine out of 15 farmers had fodder banks plus border lines or contour lines, three had only fodder banks, and three had only lines. Of the nine recent adopters, one had just a fodder bank, five had only contour or border lines and three had established both. Plots for grazing were rare. Some of the recent adopters in Dansolihun appeared to have integrated forages into their livestock production during the demonstration phase but then deserted them as the maintenance requirements of giant Napier became too high. They had rejoined FSP in the second phase. 3.1.2 Livestock activities in Cagayan de Oro Two types of grazing were used: tigway—tethering close to the homestead—and bakero—herding mostly on distant range lands (Table 6). Bakero was only practised in the short dry season. Before the introduction of new forages, tethering was the most important means of providing forage to animals. Some farmers had planted Napier and local Guinea grass on contour lines and cut and carried on days when rainfall limited the grazing time of animals. Manure was usually only applied on forage when leaves were yellow or growth was limited. Farmers did not market manure because they did not have enough for their own fields. In some villages, crop residues from rice and maize were harvested to feed animals, while in others tethered ruminants grazed upon them. When forage was lacking in the dry season, farmers chopped banana trunk and mixed it with various grasses. This practice was generally abandoned after the new forages were available in sufficient quantities.

24
Table 6 Calendar of labour inputs for livestock husbandry in Tagpagni, Cagayan de Oro.
Task months of the year (January to December) Time * Water giving (mixed with salt) 35 min/dayFeeding concentrates (pigs) 25 min/dayCutting and carrying forage 60 min/dayFeeding straw or banana-trunk 1.5 hr/dayTethering animals (tigway) 1.5 - 1 hr/dayHerding animals on range (bakero) 4 -2 hr/dayBathing buffaloes and pigs 20 min/dayBathing cattle and horses hr/weekCleaning animal house (shed) 60 min/dayBuilding and maintaining shed 4 day/yrMilking 50 min/dayBreeding and health care day/yrClearing and ploughing land 15 day/yrPlanting forage 9 day/yrWeeding and applying manure 25 day/yrWatering (seedlings) 30 day/yr* Difference in time between before and after new forage introduction.
Every day Some villages Intensive during period When needed 3.1.3 Livelihood resources in Cagayan de Oro The major causes of differences in livelihood between the four barangays were: proximity to town, the size of land holding, the time one participated in FSP intervention, and dispersal benefits. Among the interviewed farmers one was a tenant, one rented land and one used land over which someone else claimed ownership. All other farmers participating in FSP activities were landowners, most having profited from the Agrarian Reform.
crop- land
animals, meat & milk
farmers' house-
hold
market
cash
meat & skin
Figure 2: Livelihood resources diagram, Cagayan de Oro. livestock: carabao, cattle, horse,
goat, pig, poultry
Off-farm income : · agricultural labourer . small trading . driver · domestic worker · construc tion labourer
cash
ploughing& hauling
corn, rootcrops, banana,vegetables, coconut (wine),
fruits, bamboo, & (fire) wood
manure & ploughing
communal- land
forage
newforage

25
Wealth ranking during the group meetings proved difficult as farmers tended to want to define the ranking criteria in such a way that all farmers present were of the same class: in Tagpagni, “tabagonom”; in Pagalungan, “regular” and in Dansolihun, "pobre" (Table 7). Some criteria were stretched to cover the group, for example, a land area of five hectares was the most obvious limit between normal and rich, but to include all farmers present, the partition was set at 10 hectares. In order to have data from different wealth strata, researchers had to assign the focus group composition according to village, earliness of adoption and the ownership or user-rights over cattle or buffaloes. Criteria such as ownership of appliances or means of transport were not functional. The poor only owned a radio and the middle class could only afford one appliance, which could be anything between a radio and a washing machine. The poor sometimes could not afford to pay for transport, while the middle class either had enough money to pay for transport, or owned a cart or even a motorbike. Household size did not provide a clear distinction either, accept in the case of the rich who had less children. Due to the relative uniformity of farmers' focus groups in Lumbia and Dansolihun, the weighting of the importance of livestock for consumption and capital accumulation did not provide a lot of information. More farmers than had attended the general meeting showed up for the day of focus group discussions in Tagpagni. The total group of farmers was split into those owning cattle or buffaloes (20 farmers) and those owning only chickens, goats or pigs (30) before weighting the relative importance of livelihood resources. In Pagalungan, the group was split into those owning cattle or buffaloes and those having these animals in alima (Table 7). Table 7 Classes of wealth for three barangays, with estimated representation
according to criteria defined by farmers in Cagayan de Oro. Rich Normal Poor
Tagpagni hayahay: 10 % arang arang: 20 % tabagonom: 70 %Pagalungan dato: 5 % regular: 80 % pobre: 15 %Dansolihun hamogaway: 1% pobre: 70 % kabus/timawa : 29 %
Food eats 3x/day plus snacks eats 3x/day eats 2x/day Land owns > 5 ha land owns 1-5 ha is tenant or landless Education has professional
occupation elementary school and sometimes college
only elementary school, or did not finish
Livestock plenty cattle & buffaloes, but does not take care
cattle and/or buffaloes & owns poultry and pigs
owns poultry and pigs
Housing in concrete GI sheets & good lumber indigenous materials New forage adoption
not, as he does not take care of animals.
adopts forage if landholder, sometimes for contour line and for sale.
The first estimation of the relative contribution of livestock to livelihood in Lumbia, a barangay involved in FSP since 1996, was 37.5%. This was close to the 35% estimated in Dansolihun, where FSP started in 2000. These figures were much higher than those obtained in the benchmark survey of 1999. That survey grouped all livestock together in one category while for this survey farmers proposed a partitioning of livestock into three categories, which might have led to an overestimation. A check among the interviewed farmers present at the validation meeting showed much lower figures and these are presented in Table 8.

26
Table 8 Weighting of the contribution of livelihood resources to consumption (Con) and
income and capital accumulation (I & C), by interviewed farmers only. Lumbia Pagalungan Tagpagni Dansolihun Livelihood activities
Con I & C Con I & C Con I & C Con I & C Maize 6 8 6 10 4 12 6 Root crops 4 4 6 4 4 2 Banana 6 16 2 8 6 6 10 Coconut and wine 2 4 4 8 4 10 2 10 Vegetables 4 10 4 6 2 8 2 4 Fruits 2 8 4 8 2 6 2 10 Animals 2 20 2 6 2 6 2 10 Firewood and bamboo 2 8 2 6 2 8 2 6 Other on-farm 2 2 4 6 2 6 2 1 Non-farm and off-farm 6 8 10 4 Contribution livestock 22% 8% 8% 12% There was probably a correlation between a higher degree of ownership of livestock and a decreased number of livelihood activities (Table 9). The effect of a particular livestock species on income was also relevant. In Tagpagni, farmers without cattle or buffaloes only made 10% of their total livelihood from small livestock, while this figure was 24% for owners of cattle or buffalo. The large livestock owners estimated that all livestock (small and large) contributed 32% to consumption, income and capital accumulation. In Pagalungan, owners of large ruminants and those having them in trust, derived 30% and 12% respectively, of their consumption, and income and capital accumulation from livestock. The differences in the contribution of livestock to livelihood between villages were probably related to goat, cattle and buffalo dispersal to the FSP program. In Dansolihun, there was goat dispersal and the farmers had profited from several years from a very flexile and elastic payment schedule from NGO credit programs for livestock. This explained the relatively high contribution of livestock to livelihood for this barangay where FSP activities were only recent. After cattle dispersal, Lumbia and Pagalungan profited from dairy dispersal programs from the National Dairy Authority and the Philippines Carabao Centre from the Department of Agriculture (DA). In Tagpagni, dispersal programs had only started recently. Participants in FSP confirmed the relationship between the contribution of livestock to livelihood and the adoption of new forages. According to them, the majority of farmers not having ruminant livestock would not adopt forages, however, some participated in the FSP program with the hope of acquiring an animal through a dispersal program. The figures were higher than those from the benchmark surveys, this could be due to the fact that all categories of livestock were weighted separately (cattle and buffaloes, swine, goats and poultry). In the benchmark survey, all species were grouped under one category. The mean contribution in the benchmark survey was 6% for all farmers and 18% for those owning livestock. For the farmers from the benchmark survey also present in this study, these figures were 7% and 14 %, respectively. Discussion with the interviewed farmers present at the validation meeting again provided much lower figures (Table 9). Four farmers also present from San Simon, estimated the contribution of livestock at 18%. For further analysis, the figures of 10% for recent and non-adopters, 20% for early adopters and 30% for dairy cattle farmers, were used.

27
Table 9 Weighting of the contribution of livelihood resources to consumption, and to income
and capital accumulation (I&C), in Tagpagni for farm households with and without cattle/carabao, and in Pagalungan for livestock owners and the recipients of alima.
Tagpagni Pagalungan Consumption I & C Consumption I & C
Livelihood activities
with without with without with alima with alima Banana 2 2 5 3 2 3 5 3 Coconut and/or wine 1 1 3 4 2 1 4 2 Mais 3 7 1 1 4 5 5 1 Coffee 1 2 Rootcrops 1 1 3 1 Vegetables 1 1 1 4 2 3 4 3 Fruits 1 1 2 3 2 2 4 3 Poultry, pigs and goats *
3 1 9 4 2 1 6 3 Buffaloes and cattle* 4 1 2 6 3 Firewood and bamboo 2 3 5 6 2 3 Off-farm labour 2 5 3 Buy and sell 4 3 Contribution of livestock
6% 2% 26% 8% 6% 2% 24% 10%
* Original ranking by farmers contained four separate categories: poultry, swine, goats and cattle and buffaloes.
3.2 Farm household characteristics in Malitbog 3.2.1 Livestock resources in Malitbog Cattle, buffaloes, horses, pigs, goats and poultry, all benefited from the new forages. Poultry, for home-consumption and marketing, grazed Arachis Pintoi. Goats were mainly for marketing. Pigs were home slaughtered and the meat not consumed by the household was sold locally or exchanged for staple food. Cattle, buffaloes and horses were sold only if an urgent need arose or when they needed replacement. In the case of accidents, these large animals were home butchered and the meat that was not eaten by the family was sold or exchanged for staple food. Buffalo milk was either consumed by the household or sold. Ruminants, horses and swine could be shared in alima. The animal was trusted to a recipient who usually received half of the animal's offspring and other outputs. Sometimes children received an animal in alima from their parents. This situation provided a social support mechanism for the parents, whose labour availability decreased after their children married. In most villages, the off-farm work of buffaloes and cattle cost 75 Pesos per day. If a man was also hired, the price rose to 150 Pesos per day. In Silo-O, hiring a draught animal was more expensive, 100 to 120 Pesos per day, because access by cars was difficult. For transport with buffaloes or cattle, farmers could make 10 to 30 Pesos per sack depending on the distance travelled. Animals could transport two to four sacks without support, up to six on a sledge and ten on a wheel cart. Farmers paid for the mating of their female buffaloes, cattle, horses and pigs. For the large animals, the price varied from 500 to 1,000 Pesos for a successful mating with an improved breed and from 250 to 500 Pesos if the male was of the native breed. If mating was successful the boar's owner had the first choice of one of the resulting piglets. In a minority of villages farmers paid 25 Pesos for the mating of their goat.

28
The most important expenditures for livestock were concentrates (bran of corn or rice, or residues from root crops), salt, rope and troughs. Drugs and vitamins were provided and administered by government agents for free. A large variety of crop and fruit residues, such as sweet potato and cassava leaves, banana trunk, rice and corn straw, and residues of coconut, pineapple and local sugarcane, were periodically fed to animals. The income from livestock was used for several purposes (Figure 3). Of particular interest for the financial analysis were human medical costs and investment in motorbikes to perform hired transport. Some farmers still needed to buy food from their livestock income. Land for agriculture was mostly bartered against large livestock. Irrigated land could cost up to 300,000 Pesos per hectare. In some cases farmers could trade a standing crop in the land, or the right to cultivate a crop on a their land. Prices for this were 10,000 Peso/ha and 2,000 Peso/ha respectively.
Local alternative forms of income were limited to farm jobs and handicrafts. Young females could easily obtain short and long term domestic jobs in the nearby cities and in Manila. Adult farm labourers were paid day rates of 70 to 75 Pesos without meals, or 50 Pesos with meals or by the hour at 10 Pesos per hour. Local wages for youngsters below 15 years varied from 35 to 40 Pesos per day and for those older than 15 it was usually 50 Pesos per day. The market value of animals varied over the year (Table 10). All animals yielded higher prices from November to January, due to Christian feasts. Livestock prices were low from March to July, when farmers needed to increase their number of sales in order to pay school fees. The prices of upgraded or highly valued breeds were greater, for example, young piglets from Large White crosses cost 1,000 Pesos each.
water giving, washing, milking,
housing, a.o. ploughing & hauling
ducks chicken,
herbivores & pigs
Crop land
new forage planting etc.
manure
Farm household
Market
livestock, meat & milk
young livestock
fodder
labour
cash income for: school, staple food, house construction &
motorbike for taxi-riding, wedding party and social
meat & hauling
Figure 3: Livestock resource diagram, Malitbog.
S oil protection
by-products & residues)
Herding, tethering & other feed activities
ploughing
concentrates, salt/mineral,
rope a.o.
barter for land

29
Table 10 Malitbog farmers’ estimates of market prices of animals in Pesos, according to age
category and period, and the mean price accounted for in the financial analysis. Estimated market prices of animals
Low price period High price period Default prices accounted for Livestock species young adult young adult kid young old Native cattle 3,500 7,500 5,000 10,000 2500 4,250 9,000 Buffaloes 6,000 8,000 10,000 15,000 5000 9,000 12,000 Goat 350 1,000 600 1,500 250 600 1,2500 Swine 500-1000 40/kg 800 50/kg 600 2500 -
Ten out of 17 of the early adopters interviewed had fodder banks plus border or contour lines, two had only fodder banks, and three just lines. At least one farmer used plots of paspalum and setaria for grazing. 3.2.2 Livestock activities in Malitbog The distribution of livestock production activities varied between families. Children were more often involved during the school holidays. Table 11 Calendar of labour inputs for livestock husbandry in Malitbog. Task months of the year (January to December) Time difference *Giving water (mixed with salt) 30 min/day
pigs 15 min/dayFeeding concentrates with salt and water other animals 30 min/dayCutting and carrying new forage 70 min/dayChop, mix and feed crop/fruit residues 55 min/dayTethering animals (tigway) 45 min/dayHerding animals (bakero) 1.3-0.5 hr/day Bathing buffaloes and pigs 40 min/dayCleaning animal shed 25 min/dayBuilding and maintaining sheds 4 day/yr Health care Breeding and marketing Clearing and ploughing land 12 day/yr Planting new forage 2 day/yr Weeding 40 day/yr Manuring 6 day/yr * Difference between time needed before and after new forage introduction Every day Occasionally Intensive during period When needed Two types of grazing were distinguished: tigway, or tethering close to the homestead; and bakero, herding mostly on distant range lands (Table 11). Bakero was only practiced in the short dry season. Before the introduction of new forages by FSP, tethering was the most important means of providing forage to animals. Some farmers did cut and carry native grasses when fodder on tigway or bakero was limited or grazing time was restricted by excessive rains. According to farmers, the decrease in herding time was more significant than the increase in work for forage cropping and cutting (see section 3.5). The increased time required for forage cropping occurred in another time period (Table 11) but according to farmers, time management prevented labour demand conflicts from arising in the cropping season.

30
Some farmers harvested crop residues from rice and maize to feed animals, while others let their tethered ruminants graze upon them. In the dry season, when forage was not available farmers chopped many kinds of residues and mixed them with salt. The concentrate for swine was also mixed with water. Some farmers boiled residues from root crops before giving them to their animals. During a short period in the rainy season other animal types also profited from this type of feed. 3.2.3 Livelihood resources in Malitbog During the general meeting, the wealth ranking criteria used in the bench mark survey of 2000 (Cramb and Purcell, 2001) were presented to the farmers. Using this as their guide, the farmers present concluded that 70, 90, 95 and 50% of the populations of Kaluluwayan, Silo-O, Lake and San Migara, respectively, were poor. The sitios that had the first contact with FSP, Kaluluwayan and San Migara, were thought to have less poor farmers at the time of this study than prior to FSP activities. The major criterion used to define the poor was the absence of livestock. Focus groups with poor farmers were conducted in Silo-O and Lake. Focus groups with women only and with FSP non-participants were conducted in Kaluluwayan.
The focus groups in Kaluluwayan and San Migara were almost entirely comprised people who owned or used cattle or buffaloes. In San Migara only one farmer without large ruminants was present. In Lake and Silo-O the focus groups were split into those owning cattle or buffaloes and those owning only chickens, goats or pigs: the second category was twice as large as the first in Lake, whilst both were equally represented in Silo-O.
meat,milk& animals
farmers' house-
hold
marketcash
meat & hauling
Figure 4: Livelihood resources diagram, Malitbog.
livestock: carabao, cattle, horse,goat, pig, poultry
Off-farmincome:
· farm labourer. driver
cash
ploughing& hauling
corn, rootcrops, banana, fruits,vegetables, coconut (wine),
bamboo & (fire)wood
barterof land
manure &ploughing
crop-land
new forage
communal-land
forage

31
Table 12 Weighting of the contribution of livelihood resources to consumption, and to income
and capital accumulation (I &C), for farm households with or without large ruminants in Lake and Silo-O.
Lake Silo-O Consumption I & C Consumption I & C
Livelihood activities
with without with without with without with withoutMaize 8 12 6 6 5 5 1 1 Banana 2 2 2 4 2 1 4 4 Rice 5 5 0 1 Rootcrops 4 3 5 4 2 3 1 Coconut and toddy 1 1 2 3 Vegetables 2 2 2 2 3 3 1 1 Fruits 2 2 1 3 3 3 1 1 Poultry 3 2 3 1 2 1 3 2 Goats & pigs 1 1 3 2 4 2 5 4 Buffaloes & cattle 5 2 Off-farm labour 4 3 1 4 Craft 3 2 1 1 2 3 Contribution livestock 18 % 13 % 32 % 11 % 21 % 12 % 43 % 24 % The relative contribution of livestock to livelihood varied between the villages and in relation to the ownership of large ruminants (Table 12). The contribution of off-farm labour, craft and small trading was more important for farm households without large ruminants. For those who had cattle or buffaloes in Kaluluwayan, San Migara, Lake and Silo-O the relative contribution of livestock had a mean close to 25%. This figure for farmers without large ruminants was just 15%. In Kaluluwayan and San Migara the relative contributions of livestock to consumption were 9% and 17%, respectively, and to income and capital 21% and 29% (Table 13). The mean contributions to livelihood in Kaluluwayan and San Migara were 15% and 23%, respectively. These figures did not confirm the wealthier status of Kaluluwayan, probably because wealth there was due to easier access to resources like rice and perhaps coconut and bamboo. Table 13 Weighting of the contribution of livelihood resources to consumption, and income
and capital accumulation, for farm households in Kaluluwayan and San Migara. Consumption Income and capital accumulation
Livelihood activities Kaluluwayan San Migara Kaluluwayan San Migara Maize 5 10 7 4 Banana 2 4 6 6 Rice 7 3 Rootcrops 4 4 6 8 Coco-nut & -wine 3 6 Vegetables 4 6 6 6 Fruits 3 6 2 Poultry 1 2 3 2 Goats & pigs 2 4 5 10 Buffaloes & cattle 0 4 6 Off-farm labourer 0 5 8 (Fire) wood & bamboo 1 7 10 Contribution of livestock 9 % 17 % 21 % 29 %

32
The figures were much higher than the 10% published by Cramb and Purcell in 2001. They considered all livestock together and the partitioning of livestock into three categories in this study might have led to an overestimation. In the benchmark survey the mean contribution for all farmers was 13% and for those who owned livestock it was 19%. For the farmers from the benchmark survey who also participated in this survey the figures were 14% and 20%, respectively. Discussion among the farmers present at the validation meeting also indicated much lower figures (Table 14). For further calculations, the figure of 15% was used for non-owners of large ruminants (including the poor as well as recent adopters) and for those with cattle or buffaloes, the mean contribution of livestock to livelihood was kept at 20%.
Table 14 Weighting of the contribution of livelihood resources to consumption (Con), and
tincome and capital accumulation (I & C), by interviewed farmers only. Lake Silo-O Kaluluwayan San Migara Livelihood activities
Con I & C Con I & C Con I & C Con I & C Maize 8 6 4 2 5 3 8 2 Rootcrops 8 10 2 2 3 4 2 4 Banana 5 4 2 6 2 4 3 1 Rice 4 2 4 2 3 1 Vegetables 3 4 3 4 4 1 3 2 Fruits 4 3 2 5 1 4 3 Animals 5 8 1 5 1 3 2 4 Other on-farm 2 5 1 3 1 4 Non-farm & off-farm 7 4 1 2 2 3 4 Contribution of livestock
17 % 11 % 8 % 12 %
3.3 Effects of forages on production systems and livelihood Some farmers in Cagayan de Oro already cultivated forages such as Napier and a local variety of Panicum maximum (Guinea grass) for soil protection and animal feeding. Most of these farmers were early adopters. The first available varieties of Napier were steadily replaced by the dwarf variety that was more vigorous, needed less maintenance and produced more. The majority of farmers indicated that Dwarf Napier was also preferred by their animals: they consumed dwarf stem but refused to eat stems of the older varieties. However one farmer said his cattle do not appreciate the new Napier as much as the old ones. Several farmers in San Migara, Malitbog, used a local variety of Gliricidia and other species to feed their animals prior to FSP. Farmers mentioned the following benefits of new forage introduction: improved body condition and overall health of animals; increased length and quality of work by draught animals; greater pig and poultry production; larger amounts of available manure due to reduced herding-time and more animals; control of soil and water erosion; production of firewood; a reduction in the number of conflicts over livestock; and increased income due to various factors, such as time saving through reduced herding. N-fixation was sometimes mentioned. Some farmers without animals planted new forages just to control erosion in contour lines (Photograph 3). Farmers cropped maize, root crops and several high value vegetables between contour lines. Banana was sometimes integrated into contour lines and Leucaena was intercropped with cassava. Reduced soil and nutrient erosion was estimated to increase crop production by 10 to 25%. The variation was due to the slope of the land—the steeper the land, the higher the gain.

33
Photograph 3. Contour lines of forages in the landscape of Malitbog, Bukidnon province.
In Lumbia, areas planted with maize decreased, due to rat infestation and poor local soil fertility. Farmers estimated that they could make more money from dairy production and reduced the area planted with maize so that production just covered household needs. The exchange of the maize-planted areas for dairy production had positive economic trade-offs through farm diversification and the use of market for the exchange of goods. Not all interviewed farmers in Malitbog collected manure. Some farmers practising zero grazing at their homestead, just swept the manure under their flowers where it washed away during the heavy rains. In Lake, all farmers cropping vegetables applied manure. Without manure application the soil became acidic within two years. If farmers did not have enough manure from their own animals, they bought poultry manure in 30 kilogram sacks at 75 Pesos each. They applied 40 sacks per hectare to maize and 80 sacks per hectare to tomatoes. This investment could not be valued unless contour lines were used. The extra labour input was estimated at 10 days per hectare and the yield increase at 200%. However, results depended strongly upon the fluctuating price of tomatoes at market. The improvement in animal feed quality and quantity was very important. Before the introduction of new forages, no cutting and carrying was practised. Animals were tethered on roadsides or fields, or herded on hillside rangelands and fed with residue. They usually suffered from insufficient feed;, due to low quality in the dry season and to high water content and limited grazing time in the rainy season. . Often several species of livestock fed upon Arachis pintoi, but most farmers used the new grasses for cutting and carrying. The majority of farmers that adopted new forages did not own cattle, buffaloes or goats.. Most farmers acquired cattle through government dispersal systems or alima. Goats were generally paid for in cash but several villages also had government goat dispersal systems. The effect of new forages upon the reproduction of cattle or buffaloes was impossible for these farmers to estimate, as they had no pre-forage comparison. Also, various factors affected the interval between calving, for example, the temporary unavailability of the veterinarian for artificial insemination. Farmers in Kaluluwayan and San Migara observed increased numbers of offspring and shortened anoestrus after parturition: from three to one month in goats; one year to three months in cattle; and 10 to four months in buffaloes.

34
A farmer in Lake who planted Arachis pintoi to feed her chickens, estimated that chick production increased from seven up to 10–14; a mean increase of 70%. Poultry also fed on various grass species. Farmers in Cagayan de Oro did not observe an increase in pig production but sometimes used easily accessible forages as a complement to the expensive concentrates or to keep the pigs calm. According to farmers in Malitbog, the growth of their swine increased when they fed them upon Arachis pintoi or Setaria splendida. Before farmers bought animals or increased their herd size, the new forage technologies saved them time. In San Migara, time spared was estimated at 2 hours per day during one to two months of the dry season and in general, farmers said life was more relaxed as it was easier to plan activities when animals were not grazing. The reduction in time needed in the wet season was limited as the forage for cutting and carrying was often a long way from the village. However, In some villages time was saved all year round. In Silo-O, the mean time spared was estimated at 30 minutes per day. This time was used for the extension of other farm activities, such as tending to vegetables and fishponds, off-farm trading, and roadside food selling. Farmers could also make themselves and an animal available for hire for off-farm work or use the time to attend meetings and pursue administrative problems. More time and energy was available for social activities inside the household and in the community. The reduction or disappearance of tethering and herding affected livelihood by increasing time availability and reducing the destruction of crops. Consequently the production of maize, banana and vegetables, and the income from animals’ work outside the farm, increased. Most farm households that had ruminants prior to forage adoption increased their herd size after joining FSP. More labour input was required due to the increase in livestock numbers and as a consequence the time available for non-farm work decreased. The increased need for on-farm labour had a negative trade-off on the income from firewood as farmers did not have time to cut in nearby forests. However, this was a positive change for the environment. The income from livestock sales and milk marketing increased, as did the production of most crops. At the initial meeting in Cagayan de Oro some farmers mentioned the production of banana had decreased. At the validation meeting it was concluded that this was not due to new forage technologies but to a new type of banana suffering from fungal infestation in the hot, humid climate. In Malitbog, the reduction in tethering and herding meant less animals escaped and caused destruction of crops or trees and therefore conflicts and damages bills were also reduced. The planting of banana, coconut and maize had increased since forage adoption. Altogether this increased the resources available to households. The positive effect of new forages upon livelihood resulted in more farmers adopting them and greater areas being planted. To ensure FSP's self-supported progress, new farmers received a small amount of planting material or two seedlings or cuttings of trees for free. In most villages an alliance organised the new forage distribution. Members of farmer groups helped the alliance with land preparation and planting. In San Migara 100% of the farmers adopted forages but some only had fodder banks. The farmers gave 10% to the church. The high adoption level was due to encouragement by the landowner (the local religious leader) and the availability of goats and cattle from his own sharing system and the government dispersal program.
3.4 Financial benefits According to farmers, their working time was quite short: five hours in the wet season and seven in the dry season. They worked for eight hours only on days when labour was hired. For the calculation of the cost of building sheds and the number of people working in livestock, a working-day length of seven hours was used. For the calculation of labour days needed and labour income per worker, eight hours was considered to be the working-day length.

35
In Cagayan de Oro, the increase in the number of animals used up any spare time generated by growing forages. The effect on soil conservation was not accounted for. Farmers mentioned that manure had a positive impact on the output from vegetables and crops. This was accounted for by using the equivalent price of fertilizer, 0.15 Pesos per kilogram DM. None of the farmers marketed manure but some bought it. Neighbours in Malitbog bought poultry manure for 75 Peso per 30 kilogram sack. For an estimated DM content of 80% this equates to a value of 3 Pesos per kilogram DM for retained manure. In San Migara (Malitbog), interviews were held with six farmers that adopted forages early in FSP. Several of these farmers did not use the technology to its full advantage. Among them was the tragic case of a woman whose alima goats were not fertile for three years, and who only received 100 Peso when the owner replaced the animals. Other factors, like lack of manure use, influenced the financial results of the farmers in San Migara negatively. Five out of the six interviewed farmers in San Migara were among the lower 50% percentile of labour income per household of Malitbog. In Malitbog, farm households that did not increase their animal numbers saved a mean of 30 minutes per day. When this was accounted for using an equivalent labour wage of 10 Pesos per hour, the income increase was estimated at 1825 Pesos per household per year. The estimated income per labour day, of household livestock production systems, increased significantly after involvement in FSP (Table 15). The average income from livestock of early adopters was about 60% of the wage for one day of agricultural labour12, however, for recent adopters it was only 20% of the adult labour wage. The level of standard deviation showed that some farmers do much better. In Malitbog, the nine highest income earners had a mean household income from livestock of 77 Pesos per day (sd=46). Their labour income per worker was equal to the agricultural wage for an adult. In Cagayan de Oro the top seven made 89 Pesos per day (sd=49), an income higher than the daily wage. The farm households that specialised in dairy earned 72 Pesos per day (sd=65), almost equal to the daily wage. In Malitbog, 13 early adopters had contour lines. At least two farmers used the area for grazing and one had established new pasture species. Some farmers had only recently established contour lines and could not yet tell if they had affected productivity. Only eight of the 17 farmers had harvested crops after the establishment of contour lines, usually a rotation of maize and root crops. To assess the effect of contour lines farmers were asked to estimate: the quantity of crop harvested before and after their use; the quantity of artificial fertiliser used before and after; and the relative change in area covered. The mean area covered with contour lines and crop was 0.43 hectares. The net increase in yield for the eight farmers alone was 1210 Pesos, equivalent to 220 kilograms of maize, and an increase of 500 kilograms per hectare. Income per labour day increased for these farmers. Their net increase was divided by the number of days needed for maintenance, plus one fifth of the days invested in the establishment, of the new forages. The resulting cumulative labour income of 59 Pesos per labour day (sd=61) was intermediate between the wages for adults and youngsters (Table 16).
12 Wage of a casual labourer was 75 pesos per day, for a youngster on average 50 pesos per day.
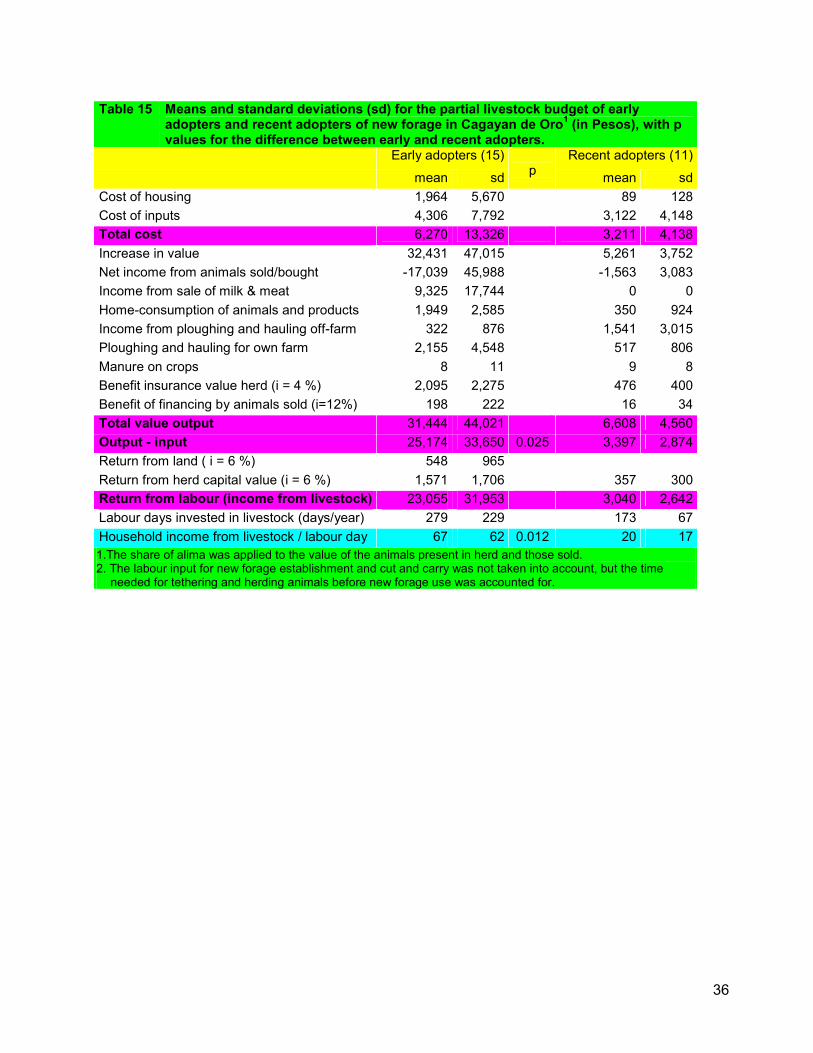
36
Table 15 Means and standard deviations (sd) for the partial livestock budget of early
adopters and recent adopters of new forage in Cagayan de Oro1 (in Pesos), with p values for the difference between early and recent adopters.
Early adopters (15) Recent adopters (11)mean sd
p mean sd
Cost of housing 1,964 5,670 89 128Cost of inputs 4,306 7,792 3,122 4,148Total cost 6,270 13,326 3,211 4,138Increase in value 32,431 47,015 5,261 3,752Net income from animals sold/bought -17,039 45,988 -1,563 3,083Income from sale of milk & meat 9,325 17,744 0 0Home-consumption of animals and products 1,949 2,585 350 924Income from ploughing and hauling off-farm 322 876 1,541 3,015Ploughing and hauling for own farm 2,155 4,548 517 806Manure on crops 8 11 9 8Benefit insurance value herd (i = 4 %) 2,095 2,275 476 400Benefit of financing by animals sold (i=12%) 198 222 16 34Total value output 31,444 44,021 6,608 4,560Output - input 25,174 33,650 0.025 3,397 2,874Return from land ( i = 6 %) 548 965 Return from herd capital value (i = 6 %) 1,571 1,706 357 300Return from labour (income from livestock) 23,055 31,953 3,040 2,642Labour days invested in livestock (days/year) 279 229 173 67Household income from livestock / labour day 67 62 0.012 20 171.The share of alima was applied to the value of the animals present in herd and those sold. 2. The labour input for new forage establishment and cut and carry was not taken into account, but the time
needed for tethering and herding animals before new forage use was accounted for.

37
Table 16 Means and standard deviations (sd) for the partial livestock budget of early adopters
and recent adopters of new forage farm in Malitbog1 (in Pesos), with p values for the difference between early and recent adopters.
Early adopters (n=17) Recent adopters 2 (n=10) mean sd
p mean sd
Cost of housing 375 943 383 722Cost of inputs 2,617 3,856 2,405 2,906Total cost 2,992 3,831 2,788 3,087Increase of value 3,259 4,431 1,958 1,974Net income from animals sold/bought 1,631 4,441 53 814Income from sale of milk & meat 0 0 160 320Home-consumption of animals and products 1,147 2,221 693 1,200Income from ploughing and hauling off-farm 2,211 4,400 360 1,080Ploughing and hauling for own farm 1,894 4,165 2,000 3,192Manure on crops 209 319 60 98Benefit insurance value herd (i = 4 %) 386 224 208 174Benefit of financing by animals sold (i=12%) 103 126 19 22Total value output 10,853 11,068 5,510 3,632Output - input 7,861 10,262 0.032 2,722 1,152Return from land ( i = 6 %) 221 289 Return from herd capital value (i = 6 %) 241 140 130 109Return from labour (income from livestock) 7,398 10,134 2,591 1,080Labour days invested in livestock (days/year) 164 84 138 45Household income from livestock / labour day 53 56 0.028 22 15Labour income including benefit contour lines 59 61 0.017 1.The share of alima was applied to the value of the animals present in herd and those sold. 2. The labour input for new forage establishment and cut and carry was not taken into account, but the time needed
for tethering and herding animals before new forage use was accounted for. The sharing of animals reduced the positive effects of new forage, particularly in Malitbog. When considering the system without alima, the labour output of the early adopters increased by 20% (compare Tables 16 and 18). The total productivity of livestock per labour day after new forage adoption in Malitbog almost reached the level of the labour wage: 68 Pesos per day (sd=57) (Table 18). The comparable labour income from livestock, including the part going to the owner, was the same in Cagayan de Oro and Malitbog (Tables 17 and 18). However, the total benefit of improved forages in Malitbog was higher due to saved time and the contribution of contour lines to the control of soil erosion. These changes yielded 1,825 Pesos per year and 1,125 Pesos per year, respectively. The mean improvement was 3 Pesos per day per household for both effects. The lower labour needs for the establishment and maintenance of forage in cropped land also contributed to a comparable income, regardless of the lack of specialisation and the lower prices of livestock. This was also reflected in the labour productivity per hectare of forage. Though the proportion of farmers having fodder banks was about equal at the two sites, the area covered was much larger in Cagayan, 0.58 hectares on average, than in Malitbog, where it was only 0.34 hectares. The larger amounts of feed in Malitbog were due to the ease of establishment and maintenance of contour lines. The mean contribution of new forages to animal feed provisions was estimated at 66% in Malitbog and 68% in Cagayan (see section 3.9). After new forage adoption, the total net income from livestock production in Malitbog was estimated at 311 Pesos per hectare (sd=448), without

38
accounting for the positive effect of contour lines on crop productivity and saved time. In Cagayan, early adopters estimated total labour productivity of land needed for fodder to be 292 Pesos per hectare per day (sd=418). For the six farms specialising in dairy production the figure was slightly higher at 368 Pesos per hectare per labour day (sd=338). The comparative mean net income from maize (with two crops a year) varied from 40 to 80 Pesos per hectare per day, without and with fertilizer13, respectively. The highest estimated yield of maize was 200 Pesos per hectare per day for two crops. Only when maize has three crops per year so that the land is in use all year, like the land for forages, will it attain the mean level of livestock land use efficiency. The land use efficiency of dairy farmers is even higher than three crops of maize.
Table 17 Adjusted total livestock productivity, not considering share for owner in alima system, in Cagayan de Oro (Pesos).
Early adopters (17) Recent adopters (10)
mean std
p mean std
Total value output 31,664 43,935 6,921 4,387Return from herd capital value (i = 6 %) 1,627 1,690 387 284Return from labour (income from livestock) 23,219 31,892 3,324 2,620Household income from livestock / labour day 68 62 0.014 22 18
Table 18 Adjusted total livestock productivity, not considering share for owner in alima system,
in Malitbog (Pesos). Early adopters (17) Recent adopters (10)
mean std
p mean std
Total value output 13,352 11,177 6,087 4,364Return from herd capital value (i = 6 %) 319 156 179 169Return from labour (income from livestock) 9,820 10,510 3,120 1,818Household income from livestock / labour day 68 57 0.006 25 17
Compared to East Kalimantan, the benefits of new forages for farmers were low. The positive effects could increase if farmers make better use of animal manure. In East Kalimantan, mean income from livestock systems with new forages was 14,500 Rupia per day, an equivalent of 1.5 US$ per day, while for Mindanao it was closer to 1 US$.
13 Farmers estimate of one harvest of maize on regularly cropped land varies from 350 to 2,400 kg/ha without fertiliser and 2,800 to 4,900 kg/ha with artificial fertiliser, whilst household labour was estimated at 60 and 70 days respectively. Some estimations were made in sacks containing 60 to 70 kg or in cans with 7 kg. Investment of the first was estimated at 5,000 Peso and of the second at 10,000 to 15,000 Pesos, including hired labour. The officers and statistics of the Department of Agriculture confirmed these data. Mean yields of the 2 provinces for two harvests: 3,075 and 1,395 kg/ha/yr, respectively for yellow and white maize, i.e. a general mean of 2,235 kg/ha/yr. Price of maize varies from 4 to 7 Peso/kg, as most farmers need to sell early, a price 4.5 Peso/kg was assumed. For yields 1,375 and 3,400 kg and mean cost, mean benefits are 1,188 and 2,800 Peso/ha. For two crops, this yields between 40 and 80 Peso/ha/day. Maximum was close to 200 Peso/ha/day.

39
3.5 Social and gender effects The reduction or absence of tethering and herding had neutral and positive social effects. In some villages herders would meet on distant communal grazing areas. The adoption of forage cutting and carrying reduced social contact between opposite sexes; reducing temptations and the suspicions of partners. The number of early marriages of youngsters decreased. Young people would instead meet at their house, in the church or during other social activities. Less tethering and herding, reduced the number of animals escaping and causing destruction of crops or trees and thus the number of farmer conflicts. Children's nutrition improved due to the increased availability of milk, increased vegetable and fruit production and improved income from livestock. In some households the increased availability of milk contributed to the reduction of malnutrition. Farmers were able to meet more frequently and organise activities so the entire community benefited from greater social interaction. Environmental benefits included reduced firewood cutting, control of soil erosion and improved fallow. According to farmers the attitude and approach of fieldworkers had changed. In the past the fieldworkers were only concerned with animal health, after FSP began they became more interested in animal feeding and breeding. Extension services were more readily available and more reliable. Farmers received more training and were involved in workshops more often. Previously, only selected farmers from a region were invited for meetings or training in an often distant village. However, because of FSP, meetings were held in more villages enabling more farmers to attend. Fieldworkers had contact with more farmers as they visited the FSP participants and went to the fields to demonstrate the work. FSP provided a technology that lasted and ongoing benefits to farmers. FSP agents also taught farmers about soil conservation and crop rotation and made them aware of new technologies in other fields through cross projects visits. Only some of the villages in Malitbog had participated in other projects before FSP but recently ICRAF14 and other organisations had started to work with them. In Cagayan, all of the villages had been in contact with other projects, mostly from government services such as the Departments of Agrarian Reform (DAR), Agriculture (DA) and Environment and Natural Resources (DENR). Funds from DAR and DA were mostly directed to infrastructure reinforcement and DENR was most interested in reforestation. None of the other projects applied a participatory method like FSP and the FSP approach was more tailored for the individual farmer. The participatory monitoring of innovations was highly appreciated as these methods motivated farmers and allowed them to learn more from each other. Some farmers incorporated preference ranking in their way of thinking during the process of family decision making and in their seasonal crop rotation. Farmers in Lumbia claimed their awareness and confidence had increased. They now dared speak to higher authorities and asked for legal contracts. In the words of a female farmer in Lumbia (now studying to become a teacher), "they lost their complex of inferiority." The need to organise the distribution of plants and seeds, as well as the monitoring and evaluation, made them aware of the strength of co-operation. Most villages had formed an alliance for forage planting and land preparing. This reinforced community relations and women stated that they had made new friends. Farmers said that their vision had changed, "we now have a common goal instead of many individual goals with a lot of quarrels." They realised that social unity re-enforced the individual. This process ended in the creation of a co-operative. The co-operatives did well and thus the entry fee for new members increased, as they had to pay shares. The most expensive entry fee, 2000 Peso did not seem excessive to farmers, although this was equivalent
14 International Centre for Research in Agroforestry

40
to the price of 2 adult goats. Working together in alliances to complete forage activities had a negative trade-off for adoption by non-members. For example, in Kaluluwayan, one non-member of the farmers' alliance for FSP activities was considered a non-adopter because he would not join group activities. However, he used the fodder bank that his father had established since 1998 and planned to make contour lines. For some farmers less comfortable with group activities it prevented their access to the technology. Farmers said the attitude and approach of state agents changed as a result of the FSP method: they listened to farmers more; taught farmers to monitor and evaluate; encouraged farmers; and asked farmers to make decisions. Field trips and cross-visits were highly appreciated as they allowed farmers to learn from each other and to see other innovations. As they listened to farmers, the fieldworkers also learned valuable information. For example, fieldworkers learned about planting according to the moon and tide calendar and the use of rocks for erosion barriers. Table 19 Percentage involvement of men, women and children in the livestock tasks of farm
households in Mindanao. after adoption before adoption young men women young men women Cagayan de Oro 30 43 27 28 47 25 Malitbog 25 47 29 39 26 34
Women's focus groups acknowledged all of the positive effects previously mentioned but those in Kaluluwayan also said that they particularly benefited from the increased availability of firewood from Leucaena. The women saved time from reduced tethering and herding. In Malitbog, the introduction of new forages reduced the involvement of young and women in tasks like herding and cutting and men executed more livestock tasks than before (Table 19). In Cagayan de Oro the men, women and children all profited from the saved time as they had all been involved to the same degree. The saved time was invested in work in alliances for forage cropping, manure collection and cutting and carrying. Residual time saved was spent on their preferred activities: cropping and selling of vegetables; making brooms and mats; and various trade and roadside food selling activities. The increased working time of draught animals, saved time and the availability of extra income, were judged to be more positive to men. According to women, they had a say on the financial benefits received from livestock. Women represented in the survey sample were owners of all animal species. In general, husband and wife partnerships managed household resources in common agreement. Early adopter women in Pagalungan were confident about their decisive power. A common statement by men expresses this, “I asked my wife for permission to accompany you this evening, and explained to her the reason for my request.” Increased labour productivity on farms, prevented young men and women migrating to the cities to seek an income. Increased labour needs due to animal care and milking had created permanent on-farm jobs. This change was apparent at the family level: the eldest children still went to town to make money but the youngest stayed on the farm once there were cows to take care of. The small group of adolescents interviewed had continuous earnings from milk as they were given 2000 Pesos per month for their labour input (case: Dionisio Lyonon, Lumbia). A neighbouring boy could earn 200 Pesos per day, from cooking bananas, however, this was not a continuous income. Direct control by youngsters of part of the household resources was not a general custom or practice, but according to key-informants, depended upon the availability of livelihood resources. When a farm household had enough resources, adolescents would be given some to prepare for their future. Tenants or caretakers and people that did not own land were not likely to adopt new forages unless they had an area available for their own annual crops and a good contract. Generally, caretakers had no interest in medium term investments such as grass for cattle. Tenants often

41
owed 25 to 75% of their products to the land owner and needed to do off-farm work to provide for their family. As a result, they had no time to invest in contouring and planting. A supplementary labour investment with shareholders was not efficient due to the law of diminished returns. For every supplementary labour day invested the larger part goes to the owner. Doing off-farm work better rewarded their labour.
3.6 Dispersal schemes Unfortunately, the adoption of new forage depended highly upon the dispersal and credit schemes being used for goats, cattle and dairy buffaloes. These distribution schemes could not keep up with the rapidly growing program of new forages for feeding ruminants. An easy to manage dispersal system with an avalanche effect is required to keep pace with the expanding FSP program. Enthusiastic farmers that expected to receive an animal were disappointed by the unavailability of ruminants, and as a result would often stop maintaining their new forage crop. Participation in FSP was sometimes viewed by farmers as a strategy for gaining access to an animal dispersal program or a source of easy credit. The encouragement of such strategies could prevent adoption and discourage other farmers from testing new forages. The large time investment required of farmers to rear livestock is an important factor in considering livestock dispersal programmes. If farmers cannot use resources efficiently, the change in livelihood through receipt of animals will often be negative. A strategy that can be used to ensure farmers’ time availability is described here: a women keeping pigs and chickens, said that one year after planting Arachis pintoi, she would be able to sell enough chickens to buy a goat. This demonstrates the ideal step-by-step strategy for farmers to obtain ruminants through FSP without the support of a dispersal program. If a farmer: (1) plants Arachis pintoi, some grasses and leguminous fodder trees in contour lines for poultry in the first year; (2) plants more contour lines in the second year; they can then (3) sell some chickens to buy a goat. Five full-grown goats can buy a calf within a period of three years. Another five years later, the farmer has a cow that is able to work and reproduce. A dispersal program of improved cockerels could provide an intermediate step, which improves income from poultry husbandry and accelerates access to goats. The use of these short cycle species reduced the time needed by farmers to obtain positive returns from their investments. FSP could support this strategy further by preferentially purchasing planting material and seeds for such farmers as the program extends. The traditional animal trust system (alima) affected the impact of FSP negatively. In most alima systems half of the offspring and income from products were returned to the owner. However, the current production level from livestock (partly due to deficient feeding causing low reproduction rate) was too low for recipients in the alima system to generate enough money to buy their own animal in the short term. The low return for their labour investment did not motivate them to improve their land quality and animal reproduction through new forage adoption. Performing off-farm work provided greater returns for their labour. The exception was when parents placed an alima animal in trust for their married children. This situation provided a social support system for the parents, whose labour availability decreased after their children’s marriage. However, young married couples that received an alima cow, often had to sell the first animal that they owned (their first share was the second calf) to pay the school fees of their eldest child. Such systems did not contribute to sustainable improvements in the production system and livelihood of farm households. When farmers cropping new forages receive animals in alima they should have the right to ask for the first calf as their share to build their own productive resources. In addition, the Veterinarian Department could disperse goats to farmers that succeed in increasing their income from poultry and are able to contribute financially to the acquisition. If the management of a financial contribution caused administrative constraints, then instead of providing money to receive an animal, farmers could also be required to invest in an animal house and manure pit, made to well defined standards (for example, photographs 7 and 8 in section 5.1). Those farm households that obtained high reproduction and survival rates with goats could

42
be given access to cattle dispersal schemes. Again they could be required to show their ability to invest in a shed and could also be asked to contribute a doe and a buck for the extension of the goat dispersal program. However, this should not replace the initial reimbursement of a first doe to the dispersal or trust fund.
3.7 Contribution to poverty reduction Discussions revealed four major reasons for farmers not adopting the new forage systems: (1) they had no animals, (2) they had no land, (3) they were tenants or caretakers, or (4) they did not know about forages. Some farmers mentioned a drought but was considered a bad excuse by other farmers. Some farmers were simply not motivated to obtain a higher income, for example: large land owners receiving plenty of income via tenancy rights and alima shares; elderly childless people who made enough to meet their needs; or people who received sufficient allowances to survive adequately. Farmers that did not own a goat or large ruminant, or only had an animal in trust, would generally not adopt new forages even if the effect on soil erosion control was claimed to make it worth while. The rate of adoption of FSP technology was very dependent on the government program of livestock dispersal. This system of dispersal, where repayment of the first and the second offspring resulted in the continuous spreading of livestock ownership, was a prerequisite for increasing income and manure availability. However, the number of animals available was limited and decisions on dispersal were not always transparent. Farmers that did not own land, or used land as a tenant or caretaker, had less interest in making investments that provided medium term returns. Lake is an old forest concession; farmers here said they borrowed government land from the holder, who left the land devastated, and that land security was not assured. Tenants of rice lowlands were particularly hesitant to decide on crops to plant. Only tenants having an area available for growing annual crops or a fishpond would consider adopting grasses and non-tree leguminous forage species. When the landowner also had a ruminant in trust, like the church in San Migara, farm households showed increased interest in forage cropping, but the advantages seemed to be greater for the owner than for the recipients (see section 3.5). Table 20 Comparison of 2001 mean expenditures and the income per household for different
categories (Pesos/year). Income per active household worker
early adopters-dairy all early adopters recent adopters
Mean expenditures per household, 2001* alima total alima total
alima total
Bukidnon Province 80,125 20,800 27,100 10,600 12,300 Misamis Oriental Prov. 70,989 56,500 61,200 41,200 46,100 15,100 18,200 * Source: National Statistical Office of Region X, Cagayan de Oro. To evaluate the contribution of FSP to poverty reduction, the estimated total income per active household worker was compared with the mean provincial expenditures of 2001 (Table 20). The total income was estimated from the output-input (farmers' perception of income) and the relative contribution of livestock to the livelihood system. Relative contributions for recent and early adopters in Malitbog (Bukidnon province) were 15% and 20% and in Cagayan de Oro (Misamis Oriental Province) 10% and 20 %, respectively. For dairy farmers in Cagayan de Oro the contribution was assumed to be 30%. FSP played an important role in poverty reduction. In Malitbog, the income of recent adopters was far below mean expenditures. The estimated income from traditional systems was about 15% of mean expenditures, and was below the poverty limit of 1 US$ per day or 18,250 Pesos per year. Income from early adopters was about double mean expenditures and slightly above the poverty
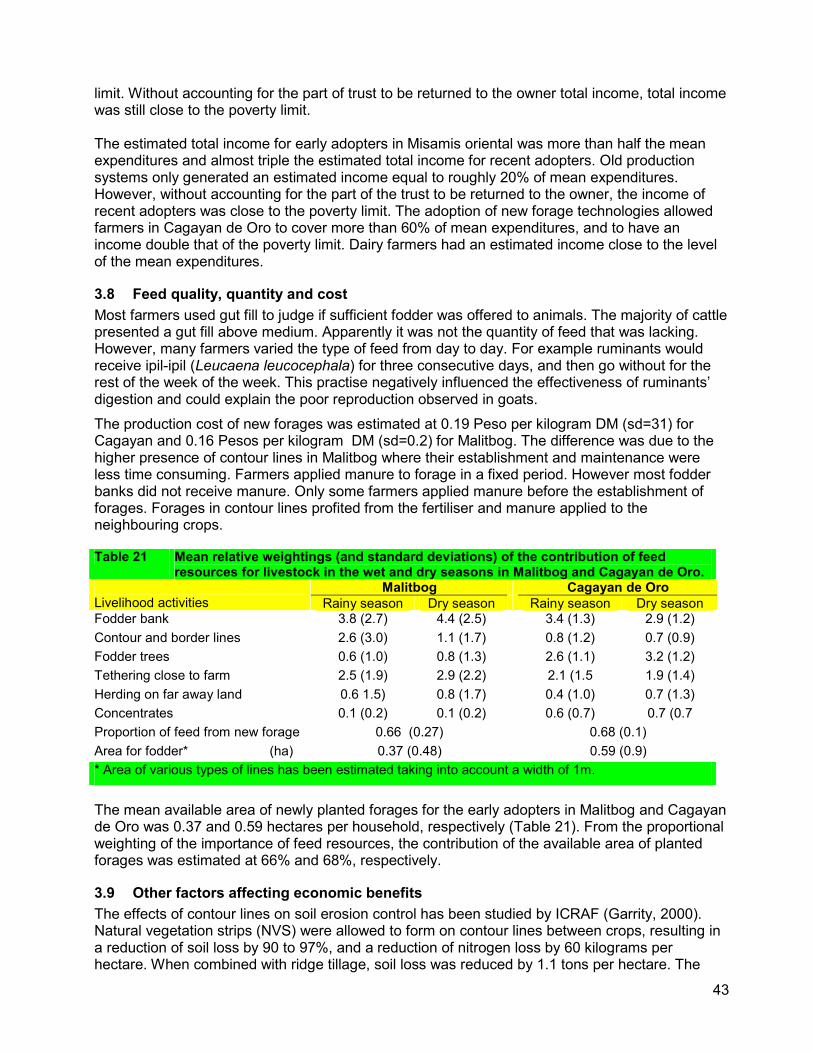
43
limit. Without accounting for the part of trust to be returned to the owner total income, total income was still close to the poverty limit. The estimated total income for early adopters in Misamis oriental was more than half the mean expenditures and almost triple the estimated total income for recent adopters. Old production systems only generated an estimated income equal to roughly 20% of mean expenditures. However, without accounting for the part of the trust to be returned to the owner, the income of recent adopters was close to the poverty limit. The adoption of new forage technologies allowed farmers in Cagayan de Oro to cover more than 60% of mean expenditures, and to have an income double that of the poverty limit. Dairy farmers had an estimated income close to the level of the mean expenditures.
3.8 Feed quality, quantity and cost Most farmers used gut fill to judge if sufficient fodder was offered to animals. The majority of cattle presented a gut fill above medium. Apparently it was not the quantity of feed that was lacking. However, many farmers varied the type of feed from day to day. For example ruminants would receive ipil-ipil (Leucaena leucocephala) for three consecutive days, and then go without for the rest of the week of the week. This practise negatively influenced the effectiveness of ruminants’ digestion and could explain the poor reproduction observed in goats. The production cost of new forages was estimated at 0.19 Peso per kilogram DM (sd=31) for Cagayan and 0.16 Pesos per kilogram DM (sd=0.2) for Malitbog. The difference was due to the higher presence of contour lines in Malitbog where their establishment and maintenance were less time consuming. Farmers applied manure to forage in a fixed period. However most fodder banks did not receive manure. Only some farmers applied manure before the establishment of forages. Forages in contour lines profited from the fertiliser and manure applied to the neighbouring crops.
Table 21 Mean relative weightings (and standard deviations) of the contribution of feed resources for livestock in the wet and dry seasons in Malitbog and Cagayan de Oro.
Malitbog Cagayan de Oro Livelihood activities Rainy season Dry season Rainy season Dry season Fodder bank 3.8 (2.7) 4.4 (2.5) 3.4 (1.3) 2.9 (1.2) Contour and border lines 2.6 (3.0) 1.1 (1.7) 0.8 (1.2) 0.7 (0.9) Fodder trees 0.6 (1.0) 0.8 (1.3) 2.6 (1.1) 3.2 (1.2) Tethering close to farm 2.5 (1.9) 2.9 (2.2) 2.1 (1.5 1.9 (1.4) Herding on far away land 0.6 1.5) 0.8 (1.7) 0.4 (1.0) 0.7 (1.3) Concentrates 0.1 (0.2) 0.1 (0.2) 0.6 (0.7) 0.7 (0.7 Proportion of feed from new forage 0.66 (0.27) 0.68 (0.1) Area for fodder* (ha) 0.37 (0.48) 0.59 (0.9) * Area of various types of lines has been estimated taking into account a width of 1m.
The mean available area of newly planted forages for the early adopters in Malitbog and Cagayan de Oro was 0.37 and 0.59 hectares per household, respectively (Table 21). From the proportional weighting of the importance of feed resources, the contribution of the available area of planted forages was estimated at 66% and 68%, respectively.
3.9 Other factors affecting economic benefits The effects of contour lines on soil erosion control has been studied by ICRAF (Garrity, 2000). Natural vegetation strips (NVS) were allowed to form on contour lines between crops, resulting in a reduction of soil loss by 90 to 97%, and a reduction of nitrogen loss by 60 kilograms per hectare. When combined with ridge tillage, soil loss was reduced by 1.1 tons per hectare. The

44
reduction in area of crop planted on a slope of 24% due to contour lines varied from 6 to 20% depending upon the species. Initially maize yield was between 1 and 2 tons per hectare but after the use of NVS it increased, and stabilised at 0.5 tons per hectare after 15 years. A recent study by Genio-Samson (2002) showed that strips of P. purpureum, S. sphacelata and P. maximum reduced soil loss by 70% on such slopes and resulted in a maize yield increase from 2.2 to 3.4 tons per hectare. The eight farmers with contour lines surveyed in this study estimated their maize yield increase at 2400 Pesos per hectare or 450 kilograms per hectare, somewhat lower than the figure given by Genio-Samson (2002). The disadvantage of vegetative barriers was not so much the reduction in crop area planted but the increase in the labour needed to maintain them. For example, the pruning of Leucaena increased the labour input of the maize area by 90% (Garrity, 2000). The production increase from wood and maize alone did not compensate for the extra effort required. The only way to exploit this investment and to stimulate farmers to maintain the vegetative barriers was through a multiple effect. If the barriers could also be used to provide feed for ruminants, these animals would in turn provide manure that the farmer could use to further increase production. Although manure was the key to the sustainable high yield of various crops, its use was low. Slashing and burning of crops was frequently practiced in the municipality of Malitbog. Manure application could lead to major improvements in production systems on soils by reducing water erosion and acidification, and the subsequent loss of arable area. We recommend the expansion of participatory training/workshops to include effective methods of dung and urine collection and ways to maximise the production of high quality organic manure. About half of the farms did little animal management. Together with low market prices, this resulted in low financial benefits. Local goats produced only one kid per pregnancy and usually only once a year. Healthy animals of this breed should produce at least six kids in two years. In this situation the use of technologies, like artificial insemination (with high capital and labour cost) are not feasible. The number of farmers able to attain a good level of management with cattle or buffaloes was also too low for an artificial insemination program to be cost efficient. Artificial insemination can only be efficient when the reproductive capacity of available animals is maximised. In the present situation, the scarce human and financial resources could more effectively be used to train farmers in the management of feeds, animals and manure. In Cagayan de Oro, some farmers mentioned that their cows were not pregnant after more than a year. This was partly due to the unavailability of fieldworkers from the Veterinarian Department to do artificial insemination. Some expensive upgraded dairy cows had already stopped lactating and had not had a confirmed gestation. The delay of a new gestation until after the drying of the cow strongly affected the productivity of the dairy system and also endangered the continuation of the dairy dispersal program. If artificial insemination is the only breeding method being used by farmers with dispersal cows, it should not be left to government agents. Some upgraded cows showed signs of heat stress. This had a negative impact on animal welfare and production efficiency. In humid and hot climates an upgrading of more than 50% generally affects productivity as a result of increased health costs and low reproductive performance. Farmers should be advised to backcross with local Zebu breeds and to strive for crossbreeds with less than 50% exotic blood. With the projected increase in livestock numbers, it would be hard for the DA to satisfy all farmers' demands for drugs and health care. The DA did not have the capacity to service all farmers and private veterinarians were not available. Some farmers in Malitbog said that buying anthelminthics was very difficult because they were often out of stock. In one village, DA field workers spent their time treating only the livestock from dispersal programs, and in other villages, animals died because not enough agents were available for health care. The privatisation of veterinarian services would be advantageous.

45
4 Results and Discussion from Vietnam
4.1 Farm household characteristics Most farm household characteristics of early and recent adopters were not significantly different (Table 22), however, the area planted with new forages was higher for early adopters. After one or two years, recent adopters still had less than half the area of new forage of early adopters. This difference partly explained the lower financial benefits recorded by recent adopters. The herd size of recent adopters at the time of this study was only slightly smaller than that of early adopters, but the recent adopters had increased their herd size in the last two years from 1.7 (sd=1.3) to 2.1 (sd=1.5) ruminants. The herd size of early adopters was quite stable:2.35 to 2.45 (sd=1.3 for both). Table 22 Mean and standard deviation (sd) for some characteristics of the sample of farm
households in Vietnam, and the number of households without particular species (column labelled ‘none’).
Early adopters (26) Recent adopters (30)
mean sd none mean sd none Household size 4.8 1.2 4.4 1.3 Available labour 2.7 1.0 2.5 0.8 Farm size (ha) 1.3 1.1 1.1 0.8 Fodder bank area (sq m) 700 626 6 268 162 10 Forage area under trees (sq m) 853 519 14 381 229 15 Interlines (m) 100 100 24 250 0 29 Number of cattle 0.7 1.6 20 0.4 1.0 25 Number buffaloes 1.1 0.9 8 1.4 0.9 4 Number of pigs 3.8 2.2 3 3.4 2.8 7 Area fishpond (sq m) 1,241 1,206 1 1,159 966 3
4.1.1 Livestock resources Farmers fed the improved forages to cattle, buffaloes, fish, rabbits pigs and poultry (Figure 5). Some farmers planted fodder for fish and swine. The most commonly planted new species were Napier (Pennisetum purpureum), Guinea grass (Panicum maximum), Paspalum atratum, Brachiaria decumbens and ruziziensis and Setaria sphacelata.

46
Before the introduction of new forages by FSP, farmers planted several kinds of feed for swine: sweet potatoes for leaves and roots; bamboo grass (Arundinaria pusilla); Cá võng; Bohemia nivea (Lá gai); or used residues from banana and maize. Several new forages were used, but Stylosanthes and Trichantera gigantea were specially planted for swine. Young pigs did not eat the improved grasses. According to the farmers, the quantity of forages they gave to their swine was too small to be estimated. Almost every farmer fed green fodder to their pigs because they knew they would improve the animals’ health and digestion. Chickens and moskovy ducks fed on the improved forages but farmers did not plant or cut these just for poultry. Before the introduction of new forages, poultry fed on the naturally occurring species. Poultry preferred the new forages and did not eat natural forages after adoption. Farmers were not aware of an increase in poultry production, however, they mentioned several positive effects of new forages: healthier animals (apparent through their better feather cloth); heavier animals and eggs; improved colour of egg yolk; higher quality of eggshell and reduced cannibalism. Almost every farm household had a fishpond (91% in the survey sample). Seven of the 51 fishpond owners only produced fish for household consumption. None of the farmers produced fish purely for marketing. The survey sample contained two fingerling producers. Fish could be marketed all year round. Strongly market-oriented farmers emptied their fishponds once a year, usually in January, just before the Vietnamese New Year (Tet). Most of these farmers bought new fingerlings after one to three months but others bought bigger fish later. Some farmers had several fishponds and produced and fed fish all year round. Fodder for fingerlings was chopped during the first month (Photograph on cover). Natural grasses as well as new forages produced large quantities of feed from July to mid-September. After this, farmers had to take time to complement feed with bamboo leaves, cassava leaves and chopped banana trunk. Some farmers planted bamboo grass on plots beside the pond for the dry season. Ground cassava was
build & clean animal house, washing,
, a.o.
ploughing & transport
buffalo, cattle, fish, poultry, pig
& rabbit
Crop land
new forage planting etc.
manure
Farm household
Market
adult livestock, piglet & chicken
young animals
fodder
labour
cash income for: school, equipment, house medical costs, wedding, saving, productive
fish, poultry & transport
Figure 5: Livestock resource diagram, Duc Ninh.
S oil protection
by-products & residues)
Herding, tethering & other feed activities
ploughing
drugs, feeds, salt, fish pond, and equipment

47
gradually introduced for the final fattening. Most cassava was produced on farmers' own land. Before cassava was fed to fish it was chopped, dried and ground. In Phu Lam farmers paid 15,000 to 20,000 Dong for the natural insemination of buffalo and 25,000 to 40,000 Dong for cattle, as soon as gestation was confirmed. In Duc Ninh buffalo breeding was free and cattle insemination only cost between14,000 and 15,000 Dong. Artificial insemination of sows from local breeds with improved sires was common, at a cost of 10,000 to 15,000 Dong. The demand for manure was high but in most villages it was not readily available. Consequently prices were high, especially close to town or factories, like in Phu Lam. In Phu Lam all manure was marketed for 150 Dong per kilogram. In Duc Ninh and Thang Quan manure from chickens and pigs cost 100 Dong per kilogram and manure from cattle and buffaloes cost 50 Dong per kilogram. Buffaloes were mostly used for ploughing and hauling. Sometimes cattle were also used for hauling and for ploughing dry land. Farmers who did not have buffalo or cattle could hire a buffalo and operator for 40,000 Dong per sao18 or, if available, a machine for 30,000 Dong per sao. Table 23 Farmers’ estimate of market prices for cattle and buffaloes in Tuyen
Quang according to age category (in millions of Dong). 1 year 2 year adult old
Native yellow cattle 1.5 2.5 1.3
Crossbred cattle 2.5 3.5 1.5
Buffalo male 4 6 1.0
Buffalo female 3 4 1.0
The prices of cattle and buffalo did not fluctuate over the year (Table 23). Prices for poultry and pigs were low in July and August and high between September and February. The price for cattle and buffalo had increased exceptionally during the previous two years due to increased demand and reduced availability. The market price for tea increased in 1999 and many farmers sold ruminants to invest in tea plantations. This caused low ruminant prices in the year 2000 but by 2002 prices had improved greatly. Crossbred cattle were mostly the result of artificial insemination with Red Sindhi. Fish prices per kilogram were as follows: fingerlings – 30,000 Dong; young fish weighing <0.1 kg – 20,000 Dong; and fish weighing >0.2 kg/fish – 9,000 to12,000 Dong depending on the period. The best fish prices were paid between November and February. In the commune of recent adopters, staple foods, clothing, fertilisers and government taxes were also paid for using the income from livestock. In all three communes, the income from livestock was used for productive investments, for example, in rice threshing machines.
18 1 Sao = unit of land measurement of 360 m2, equal to 0.035 hectares (or 1hectare = 28 sao).

48
4.1.2 Livestock activities The livestock activity calendar of the Vietnamese communes studied, clearly shows the practice of forage cropping for swine (table 24). Cropping of forages for cattle and buffaloes was an innovation, as farmers had only cultivated forages to feed fish previously. Only some villages irrigated the newly planted forages. Tethering was not very frequent probably because grass cover was too restricted. Vaccination was performed twice a year and was sometimes free. Other animal drugs and health care had to be paid for. Table 24 Calendar of labour inputs for livestock husbandry in Thang Quan, Vietnam.
Task Months of the year (January to December) Time * Processing of cassava for ruminants 15 min/dayFeeding ruminants 7 min/dayCut & carry new forage ruminants 25 min/dayCut & carry natural grass ruminants 2.3 - 1 hr/dayPlanting local forages for pig 23 day/yrHerding animals 4.5 - 2 hr/dayBreeding and health care Bathing buffalo 35 min/dayBuilding and maintaining shed 3 day/yrCleaning animal house (shed) 30 min/dayMaintaining fish pond 5.7 day/yrAcquiring new fingerlings Processing feed for fish 30 min/dayCut & carry new forage fish 20 min/dayCut & carry natural grass fish 2.3 - 1 hr/dayFeeding fish 9 min/dayHarvesting fish Planting & maintaining forage 15 day/yrIrrigating newly planted forage * x – y = time before and after new forage introduction, respectively
Every day Short intensive activity Some farmers and when d d
Time was a well-developed concept in Tuyen Quang. All of the households visited had a clock and several had specific television programs they liked to watch. Time estimation could be considered reliable, although short time spans sometimes seemed to be underestimated. The number of days estimated for the cropping of new forages as well as for sweet potatoes varied greatly.
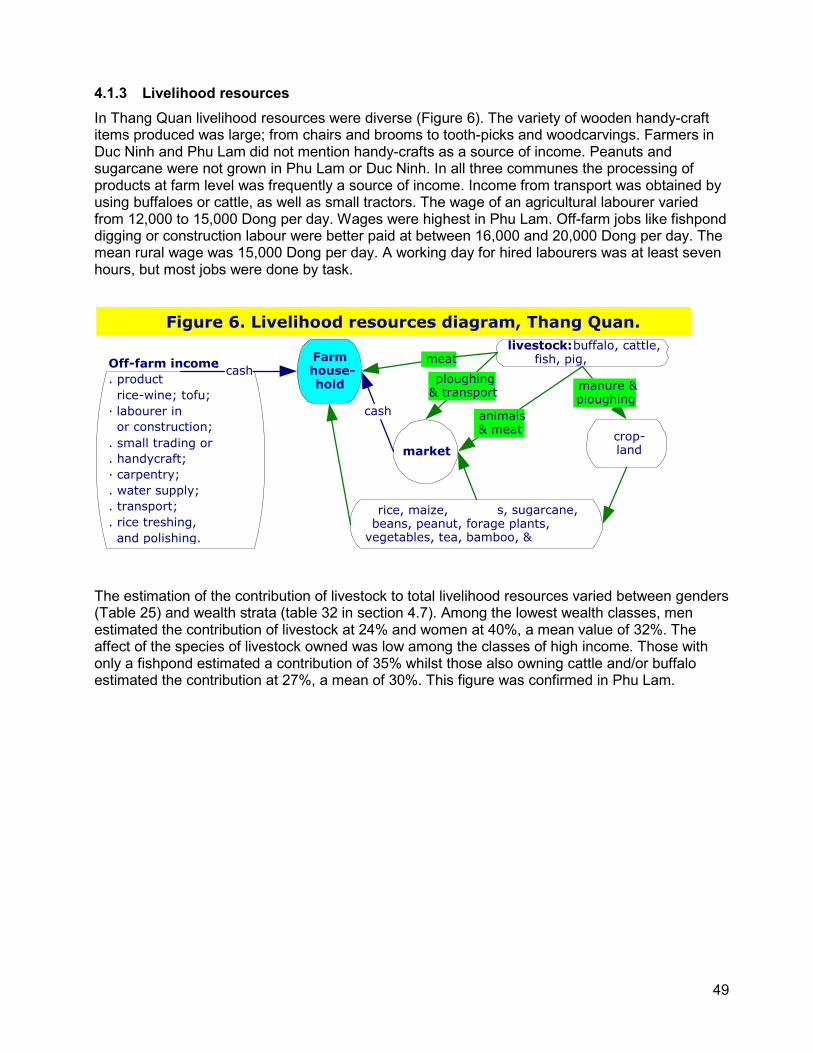
49
4.1.3 Livelihood resources In Thang Quan livelihood resources were diverse (Figure 6). The variety of wooden handy-craft items produced was large; from chairs and brooms to tooth-picks and woodcarvings. Farmers in Duc Ninh and Phu Lam did not mention handy-crafts as a source of income. Peanuts and sugarcane were not grown in Phu Lam or Duc Ninh. In all three communes the processing of products at farm level was frequently a source of income. Income from transport was obtained by using buffaloes or cattle, as well as small tractors. The wage of an agricultural labourer varied from 12,000 to 15,000 Dong per day. Wages were highest in Phu Lam. Off-farm jobs like fishpond digging or construction labour were better paid at between 16,000 and 20,000 Dong per day. The mean rural wage was 15,000 Dong per day. A working day for hired labourers was at least seven hours, but most jobs were done by task.
The estimation of the contribution of livestock to total livelihood resources varied between genders (Table 25) and wealth strata (table 32 in section 4.7). Among the lowest wealth classes, men estimated the contribution of livestock at 24% and women at 40%, a mean value of 32%. The affect of the species of livestock owned was low among the classes of high income. Those with only a fishpond estimated a contribution of 35% whilst those also owning cattle and/or buffalo estimated the contribution at 27%, a mean of 30%. This figure was confirmed in Phu Lam.
crop- land
animals& meat
Farm house-
hold
market
cash
meat
Figure 6. Livelihood resources diagram, Thang Quan. livestock: buffalo, cattle,
fish, pig, Off-farm income : . product rice-wine; tofu; · labourer in or construction;. small trading or . handycraft; · carpentry; . water supply; . transport; . rice treshing, and polishing.
cash ploughing& transport
rice, maize, s, sugarcane, beans, peanut, forage plants,
vegetables, tea, bamboo, &
manure & ploughing

50
Table 25 Weighting of the contribution of livelihood resources to consumption (Con) and income and
capital accumulation (I & C), for two wealth classes of Thang Quan farm households according to type of livestock owned or gender.
Income > 200,000 DONG Income < 200,000 DONG
only fish pond plus cattle/buffalo men women
Livelihood activities
Con I & CA Con I & CA Con I & CA Con I & CA
Rice 13 1 5 15 18 6 15 5 Upland crops 3 7 4 15 4 13 5 14 Wood 2 5 3 4 6 2 Fruits 1 1 1 10 3 6 5 1 Cattle/buffalo, fish 4 16 2 10 3 6 5 25 Forage plants & feed 2 4 3 2 Vegetables 1 5 3 1 3 Processing, transport & trading 4 5 Off-farm labour 4 Handy craft 33 2 7 2 Other livestock 5 10 6 9 5 10 2 8
4.2 Effects of forages on production systems and livelihood The benefits of new forages mentioned by farmers included: • faster growth of fish, cattle and buffalo; • higher price received at marketing due to increased body fat; • better body condition and hence working capacity for cattle and buffaloes; • higher yield than natural grasses; • low fertiliser and pesticide requirements compared to other crops; • better use of barren land or land with low soil fertility; • control of soil erosion • direct income from forage products; • up-scaling of animal production; • increased availability of manure; • saved time from cut and carry for fish and from herding for ruminants. The labour of all farm household members was better used and livestock production could be up-scaled. Crop production also improved and households acquired more income from their small land areas. Some species of forages provided an excellent living fence. The effects at the household and commune level were important (see section 4.6). The high yields of new forages allowed farmers to keep animals and to improve their livelihood. Most farmers had to reduce their herd after the allocation of communal land, while others sold animals when their children had to go to secondary school and no labour for herding was available. The new forage technology allowed them to keep animals in zero grazing. Improved forages enabled other farmers to keep animals as they were able to produce sufficient fodder from their small plots. Within five years of acquiring an initial animal in trust or on credit, several

51
farmers had been able to repay the debt, sell at least one animal and grow their herd to at least four cattle. The productivity of fish farming increased. According to one farmer, the period until marketing was also reduced from 11 months to nine months due to the availability of new forages.
Photograph 4: Area close to fishpond traditionally used for production of forages Most farmers planted the forages close to their fishpond or animal shed to reduce labour time. Planting on the fishpond border was becoming common and allowed farmers to use a previously useless area. Other previously unused land (of low fertility or steep slope) was also planted with forages, allowing farmers to make better use of their small plots (Table 26). Fodder banks were mostly situated on the edges of ponds. Other large areas were mixed with fruit trees. Improved forages often replaced beans or cassava as intercrops between tea plants. Cassava hampered tea culture and farmers were glad to have a replacement crop, particularly one that required very little investment and maintenance, and helped to conserve soil on the slopes where tea was usually planted. When new forages were cropped on an area previously cropped with a staple food, cash crop, vegetables or cassava for animal feed, the original crops were planted in areas further from the pond or shed, for example, cassava was planted on forest land.
Table 26 Productivity of crops previously planted on area newly occupied by forages Unit Cassava Sugar cane Banana Black &
Yellow bean Yield Dong/sao 193,000 507,000 40,000 * 120,000Cost of inputs Dong/sao 56,000 248,000 25,000 22,000Labour needed days 14 24 9 10Labour productivity Dong/day 9,800 10,800 1,670 9,800Return to land Dong/sao/yr 137,000 259,000 98,000 Dong/ha/yr 3,7 million 7,0 million 2,65 millionLegend: * plus animal feed from trunk and leaves

52
The net yield of the original crops (replaced by forages) was low (table 6). Furthermore, they required pesticides and were replanted each year, so seeds and fertiliser had to be purchased . All of the replaced crops had a labour productivity lower than two thirds of the agricultural wage. In Thang Quan, farmers mentioned sugarcane yields of 190 Dong per kilogram, whilst tillers and cuttings of new forages were sold for 2,000 Dong per kilogram. One interviewed farmer irrigated his fodder bank and another used humid land to ensure green fodder all year round.
4.3 Financial benefits The market for forest land was restricted in Tuyen Quang. Crop land, fishpond and homestead (with an owner certificate—red book) could be traded but forest land (green book) could not. Prices of land varied according to its productivity and location, for example, proximity to main road increased value19. The market price of non-irrigated agricultural land was close to 10 x106 Dong per hectare. Land suitable for two rice crops and for fishponds was valued at 40.5 x10⁶ Dong per hectare (1.5 x10⁶ Dong per sao). For the calculation of the financial benefit of saved time, the number of days per year saved was multiplied by the mean income per labour day. Mean income per labour day was determined to be 12,000 Dong per day by considering the labour productivity of rice, maize, cassava, sugar cane and beans and the wage of 15,000 Dong per day. 4.3.1 Buffalo and cattle production systems The financial benefits of applying manure from cattle and buffalo to crops was calculated at 20 Dong per kilogram DM. The work of buffaloes or cattle on a farmers’ own fields was accounted for using the price of the best alternative: hiring a machine for 30,000 Dong per sao. Not all farmers recalled the cost of building their shed. The investment and maintenance costs of sheds were estimated to be 366,000 and 30,400 Dong per animal, respectively, using available data on cost and labour time. Saved time was an important benefit for most farmers keeping ruminants. This was not the case for those who had increased their number of animals, or had just started keeping buffalo or cattle, since the introduction of new forages. The number of labour days per year required for large ruminants by early adopters was much lower than the figure for farmers without forages (ie recent adopters prior to planting forages): 149 versus 258, respectively (Table 27). The mean number of saved days for all early adopters rearing ruminants was 120 days per year; using the mean labour day income as the multiplier this corresponds to a gain of 1.44 x 10⁶ Dong per year. Only 50% of the saved time was enjoyed by adults (Table 31), and only two-thirds of adults’ saved time was used for productive farm activities. Family members used the remaining saved time for leisure, training and study. Therefore the financial benefit of saved time per household was estimated at 480,000 Dong per year . Without accounting for saved time, the labour income from the ruminant systems of early adopters is significantly higher than that of recent adopters, due to increased labour efficiency (Table 27). 19 The Government fixed land prices and taxes on land according to six classes and market prices were generally double this amount. Land was classified into six groups for taxation purpose and the factors 5.6, 4.8, 4.2, 3.6, 2.8 or 0.6 kilograms per 100 m² were multiplied by the price of rice to determine the tax rate. The market price of rice at the time of the study was 1,500 Dong per kilogram. Land suitable for two rice crops and for fishponds was taxed annually at 3.6*1,500*100= 540,000 Dong per hectare. Land for natural fodder for grazing and cutting and carrying was taxed at the lowest rate, using a multiplier of 2.8, and forage land was considered to be taxed at the same rate.

53
The labour income from livestock before adoption was one third of the mean agricultural wage in the province (15,000 Dong per day), but after adoption it was higher.
Table 27 Means and standard deviations (sd) for the partial budget of the ruminant production
systems of early and recent adopters of new forage in Tuyen Quang (in 1000 Dong), with p values for the difference between early and recent adopters.
Early adopters (20) Recent adopters (26) *
mean sd
p mean sd
Cost of housing 67 35 65 53Cost of inputs 170 129 238 187Total cost 239 161 297 213Increase in value 670 1,399 980 1,217Net income from animals sold/bought 1,180 1,053 367 1,118Income from ploughing and hauling off-farm 61 261 18 90Home-consumption ploughing and hauling 396 368 450 282Manure on crops 23 11 8 14Benefit insurance value herd (i = 3 %) 180 80 132 65Benefit of financing by animals sold (10.8%) 82 82 45 60Total value output 2,922 1,349 2,458 1,729Output - input 2,683 2,161 Return from land ( i = 10 %) 45 28 33 18Return from herd capital value (i = 6 %) 361 160 264 130Return to labour 1,949 1,178 1,401 1,277Labour days invested in livestock (days/year) 149 112 0.001 258 60Household income from livestock / labour day 17 15 0.004 5 4* Labour input for new forage establishment and cutting & carrying was not taken into account, but the time
needed for feeding livestock before planting new forage was accounted for.
Income from the sale of animals plus the income from off-farm labour of ruminants was significantly higher for early adopters than for recent adopters: 1,571 Dong per year (sd=1479) compared to 843 Dong per year (sd=1,144), respectively (p<0.1). However, the herd value increased more for the recent adopters. The greater increase in herd value for early adopters was entirely due to the improved market value of ruminants. The net value of output from the ruminant production system (farm households' cash income) was not significantly different between groups, probably because of the small sample size. After correction for the increase of herd value of early adopters, the net value of output for early adopters was approximately 13% higher. It is likely that recent adopters had already profited from the new forages. However, this was not clear from the financial results. Labour income from the crops previously planted on forage area was higher than income from livestock for recent adopters (Tables 26 and 27). The labour income after adoption of new forages doubled. Not accounting for the increased value of the herd nor returns to land, the productivity of land for ruminant production was estimated to be 12.3 million Dong per hectare (sd=15.6). This was almost twice as much as the estimated productivity of paddy (Table 28).

54
Table 28 Productivity of the staple crops, rice and maize, in Tuyen Quang. unit Rice (paddy) Maize (corn) Yield 1,000 Dong/sao/yr 850 600Cost of inputs 1,000 Dong/sao/yr 340 335Opportunity cost of animal labour 1,000 Dong/sao/yr 240 180Labour needed days/yr 22 14Labour productivity * 1,000 Dong/day/yr 13 7.2Productivity of land per sao* 1,000 Dong/sao/yr 290 100Productivity of land per hectare * 1,000 Dong/ha/yr 7,800 2,700* No cost for land was subtracted, except for the taxes included in the inputs for the rate of 3.6 and 2.8 for rice
and maize respectively.
4.3.2 Fish production systems The return from fishponds was based on the market price of land. Most fishponds could also be used for rice cropping and so the market price of rice growing land, 40.5 million Dong per hectare, was used. Not all farmers recalled the construction cost of the fishpond so the mean cost was estimated to be 2,900 Dong per square meter using available data on material costs and labour time. Only land price was accounted for in the returns from fishpond. Maintenance of fishponds was performed regularly. Commercial producers cleaned their ponds each year. Small producers, including those only growing fish for home-consumption, cleaned their ponds once every two or three years. Some farmers hired labourers or machines to do the job. Pond banks were repaired more often: 43 out of 52 fishpond owners spent time repairing pond banks in 2001. The maintenance cost of fishponds was calculated using the labour cost of 18,000 Dong per day for all farmers. Labour time spent on fish production by early adopters was slightly less than half the labour time needed by recent adopters before they planted forage, a difference of 71 days per year. The mean number of saved days for all early adopters is 30 days per year; this corresponds to approximately 40 minutes per day. Almost 80% of this was attributed to adult labour (Table 31) and this saved adult time was used to supplement household income with 25,000 Dong per month (5,000 Dong per month per household member). Only data from farm households marketing fish were considered for the financial assessment. Estimates of production for household consumption did not appear very reliable. Three fish producers, one early and two recent adopters, experienced lowered yields due to fish diseases. The total value of output (farm households' cash income) was not significantly different between early and recent adopters. The claim of some farmers that they could harvest within nine months instead of 11, corresponds to a 20% higher return to labour. Variation in this small sample was far to high to show this as a significant improvement. The net value of output from the fish production systems of early adopters was 18% higher than for recent adopters (Table 29). As with the ruminant production system, the principal reason for the increase in efficiency was the reduction in labour time (Table 29). Before the adoption of new forages, return to labour from fish production was close to the highest rural labour wage of 12,000 Dong per day. The income per labour day for fish production with new forages was almost triple that amount and 2.5 times the labour productivity of paddy: 32,000 Dong per day. Not accounting for returns to land, the yearly productivity of land used for the fish production, including pond area, was 6.9 x 10⁶ Dong per hectare (sd=5.3), close to the productivity of paddy (Table 28). However, the production of rice needs more inputs, particularly labour.

55
Photograph 5: Planting of improved forage, mostly Brachiaria ruziziensis, on the pond bank was a labour saving technology, also contributing to stabilizing the pond bank and reducing the maintenance cost of the fishpond. Table 29 Means and standard deviations (sd) for the partial budget of the fish production
system of early and recent adopters of new forage in Tuyen Quang (in 1000 Dong), with p values for the difference between early and recent adopters.
Early adopters (22) Recent adopters (18) *
mean sd
p mean std
Maintenance cost of fishpond 629 595 609 464Cost of inputs 689 477 750 785Total cost 1,318 943 1,359 1,156Income from marketed fish 2,465 1,936 2,237 2,060Home-consumption of fish 725 511 602 265Total value output 3,190 2,097 2,839 2,155Net value output (cash income) 1,871 1,481 1,580 1,778Return from fishpond (i = 10 %) 519 493 495 389Return from forage land ( i = 10 %) 54 77 Return to labour 1,298 1,257 1,084 1,761Labour days invested in livestock (d / )
53 41 124 73Household income from fish per labour day 32 27 0.008 12 15* Labour input for new forage establishment and cutting & carrying was not taken into account, but the time needed
for feeding livestock before planting new forage was accounted for. Data on the last harvest without new forages were also considered.

56
4.3.3 Swine production systems The swine production systems were well organized. The five interviewed farmers with sows all used artificial insemination. Two of them raised piglets but did not fatten them. Their sow, of a fertile local breed, was inseminated with a sire of a lean European breed, for example, Yorkshire, Large White or Duroc. The piglets were either all sold or the farmers just sold the surplus that they could not fatten themselves. The farmers fattened four to 14 piglets a year in two rounds of five or six months. Housing was always on a closed concreted floor. Compartments were constructed either from bamboo or concrete and the roof was usually made from leaves but sometimes tiles were also used. The cost of construction and maintenance of the pig houses varied according to the materials used.
Swine were fed with bran from rice and maize and with various feeds available from the market, such as cassava starch, soybean, fish meal and concentrates. Most farmers also cropped sweet potatoes in the rainy season and a large variety of herbs and grasses in the dry season. The sweet potato leaves could either be cooked together with their roots, the bran and the starch or fed directly to the pigs. Some farmers used new forages instead of sweet potatoes but most only used these if there was a shortage of sweet potato. They stated that the advantage of sweet potato was its double use: fresh (leaves) and cooked (leaves and roots). Not all farmers cropped forages for their swine.
Text block 1: Effect on swine production: the case of Lê Vân Báo, Duc Ninh.
The household of Lê Vân Báo and Dang Thi Loan has four pigs and a buffalo. In 2000 they planted Setaria and Brachiaria on one sao of land previously cropped with sweet potatoes. The leaves of the sweet potato were used to feed their swine. The cutting of grass instead of collecting leaves saved them 10 minutes twice a week, a total of 2.5 labour days per year. The planting and maintenance of new forage took them a total of 5 days each year. The only cost after the initial investment was for manure. The planting and maintenance of sweet potatoes cost them 3 days per year (likely that this was underestimated: mean labour time estimated by 12 farmers was 30 days) and 45,000 Dong for fertilisers, seedlings and 100 kilograms of pig manure. The net benefit was only 0.5 day and 45,000 Dong per year However, they also fed their buffalo in zero grazing with the fodder from the same one sao of land. Before planting new forages one of the children herded the buffalo for 4 hours every afternoon. When it rained they had to cut natural grass and this also took 4 hours. At the time of the study, they were cutting grass in less than 30 minutes, a net benefit of 3.5 hours per day or 125 days of child labour saved per year! Furthermore, the new tasks associated with forages were performed by adults, so freeing the children for household tasks and study.

57
Table 30 Mean and standard deviation (sd) of yearly return to labour of two rounds of
swine fattening by farm households in Duc Ninh and Thang Quan ( in 1000 Dong). Not using new forages (n=6) Using new forages (n=6) mean sd mean sd Total cost * 2,977 1,446 4,120 1,138Total value output 4,688 1,706 6,883 1,488Return from forage land ** 1 1 2 2Return from capital 117 47 158 35Output - input 1,593 2,603 Return from labour 1,644 757 2,719 1,296Total days of labour 123 55 187 77Days of labour per pig 35 30 39 14Income per labour day 19 17 16 7* The cost of housing was standardised to reduce variability in the small sample.
** Real interest rate of 4% and land value of 1,000,000 Dong/ha.
According to farmers who replaced sweet potatoes with improved forages, the use of forages, allowed them to save time (example in text block 1). This was not confirmed by a small sample of 12 pig fatteners that included six farmers who also used new forages (Table 30). The estimation of labour days needed for the sweet potatoes varied from four to 150 days per sao, with a mean of 30. The number of labour days per pig for forage cropping was slightly higher for the farmers using newly introduced forages; 39 compared to 35. The group of farmers not using new forage species contained two farmers who did not use forages at all; the workload of these farmers was substantially less. Replacing sweet potatoes with new forages increased the need for manufactured feeds, as roots were not available, thus increasing cost. Farmers did not observe any change in production when they replaced other green fodder with new forages. This was confirmed by the small sample (Table 30). The farmers also using new forages probably fattened their animals more intensively. Mean income per labour day for swine production was 18,000 Dong (sd=12,000); high compared to traditional ruminant and fish production.
4.4 Social and gender effects Most positive gender and social effects resulted from the reduced time needed for cutting and herding. According to the female focus groups in Duc Ninh, the effects of new forages were even more positive for women and children than for men. Mostly women and children (after school) were in charge of herding (Table 31). Prior to new forage introduction women in Phu Lam did not often herd and their men did most of the forage cutting for fish. Forage cutting for ruminants was limited to the period around calving. Farmers estimated saved time to be equal. Children were able to study, rest and help with other household tasks more. Farmers in Phu Lam suggested that increased rest improved their children's health. The reduction in time spent herding reduced exposure to the sunlight, which may have positive effects on skin cancer, but was more directly appreciated by women, as their skin stayed clear. A clear, non-tanned skin is very important to women in Vietnam. Women were often also responsible for the cutting of natural grasses for fish and swine and the time needed for this task decreased. Adults, rather than children, usually did the new tasks of planting and maintaining forages. Furthermore, the 15 days per sao needed for these tasks each year was small compared to the mean saving of one hour per day for cutting and two hours per day for herding.
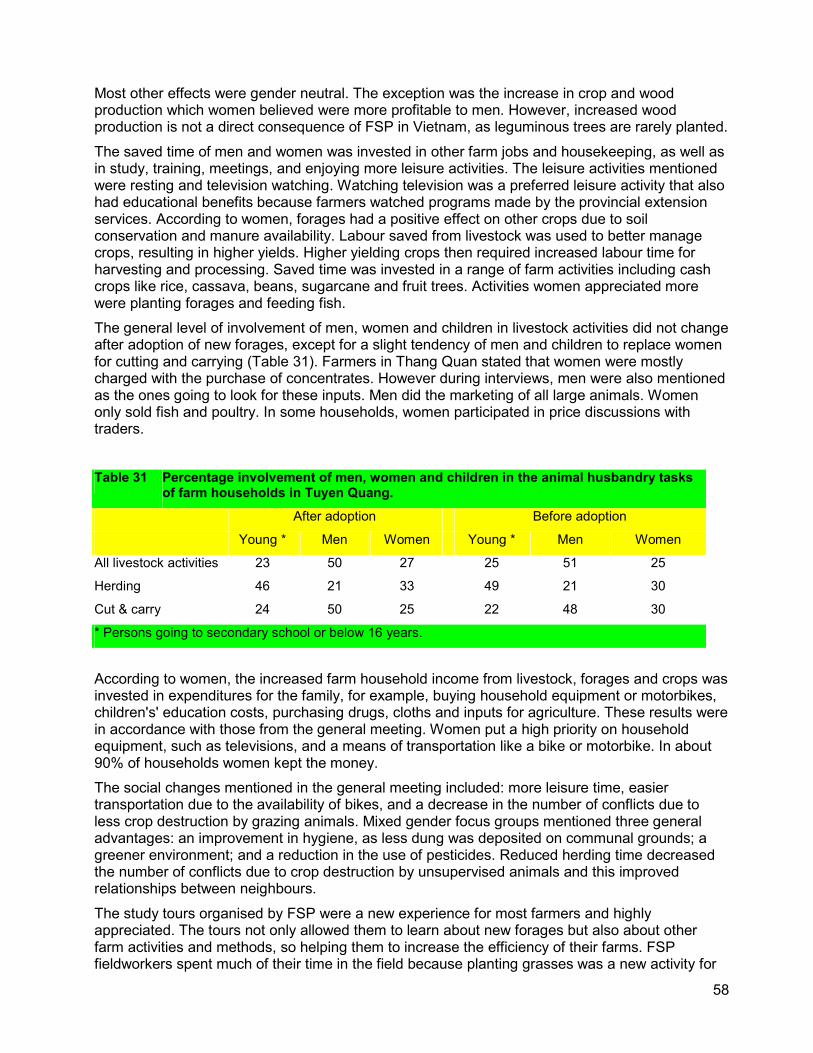
58
Most other effects were gender neutral. The exception was the increase in crop and wood production which women believed were more profitable to men. However, increased wood production is not a direct consequence of FSP in Vietnam, as leguminous trees are rarely planted. The saved time of men and women was invested in other farm jobs and housekeeping, as well as in study, training, meetings, and enjoying more leisure activities. The leisure activities mentioned were resting and television watching. Watching television was a preferred leisure activity that also had educational benefits because farmers watched programs made by the provincial extension services. According to women, forages had a positive effect on other crops due to soil conservation and manure availability. Labour saved from livestock was used to better manage crops, resulting in higher yields. Higher yielding crops then required increased labour time for harvesting and processing. Saved time was invested in a range of farm activities including cash crops like rice, cassava, beans, sugarcane and fruit trees. Activities women appreciated more were planting forages and feeding fish. The general level of involvement of men, women and children in livestock activities did not change after adoption of new forages, except for a slight tendency of men and children to replace women for cutting and carrying (Table 31). Farmers in Thang Quan stated that women were mostly charged with the purchase of concentrates. However during interviews, men were also mentioned as the ones going to look for these inputs. Men did the marketing of all large animals. Women only sold fish and poultry. In some households, women participated in price discussions with traders. Table 31 Percentage involvement of men, women and children in the animal husbandry tasks
of farm households in Tuyen Quang. After adoption Before adoption
Young * Men Women Young * Men Women
All livestock activities 23 50 27 25 51 25
Herding 46 21 33 49 21 30
Cut & carry 24 50 25 22 48 30
* Persons going to secondary school or below 16 years.
According to women, the increased farm household income from livestock, forages and crops was invested in expenditures for the family, for example, buying household equipment or motorbikes, children's' education costs, purchasing drugs, cloths and inputs for agriculture. These results were in accordance with those from the general meeting. Women put a high priority on household equipment, such as televisions, and a means of transportation like a bike or motorbike. In about 90% of households women kept the money. The social changes mentioned in the general meeting included: more leisure time, easier transportation due to the availability of bikes, and a decrease in the number of conflicts due to less crop destruction by grazing animals. Mixed gender focus groups mentioned three general advantages: an improvement in hygiene, as less dung was deposited on communal grounds; a greener environment; and a reduction in the use of pesticides. Reduced herding time decreased the number of conflicts due to crop destruction by unsupervised animals and this improved relationships between neighbours. The study tours organised by FSP were a new experience for most farmers and highly appreciated. The tours not only allowed them to learn about new forages but also about other farm activities and methods, so helping them to increase the efficiency of their farms. FSP fieldworkers spent much of their time in the field because planting grasses was a new activity for
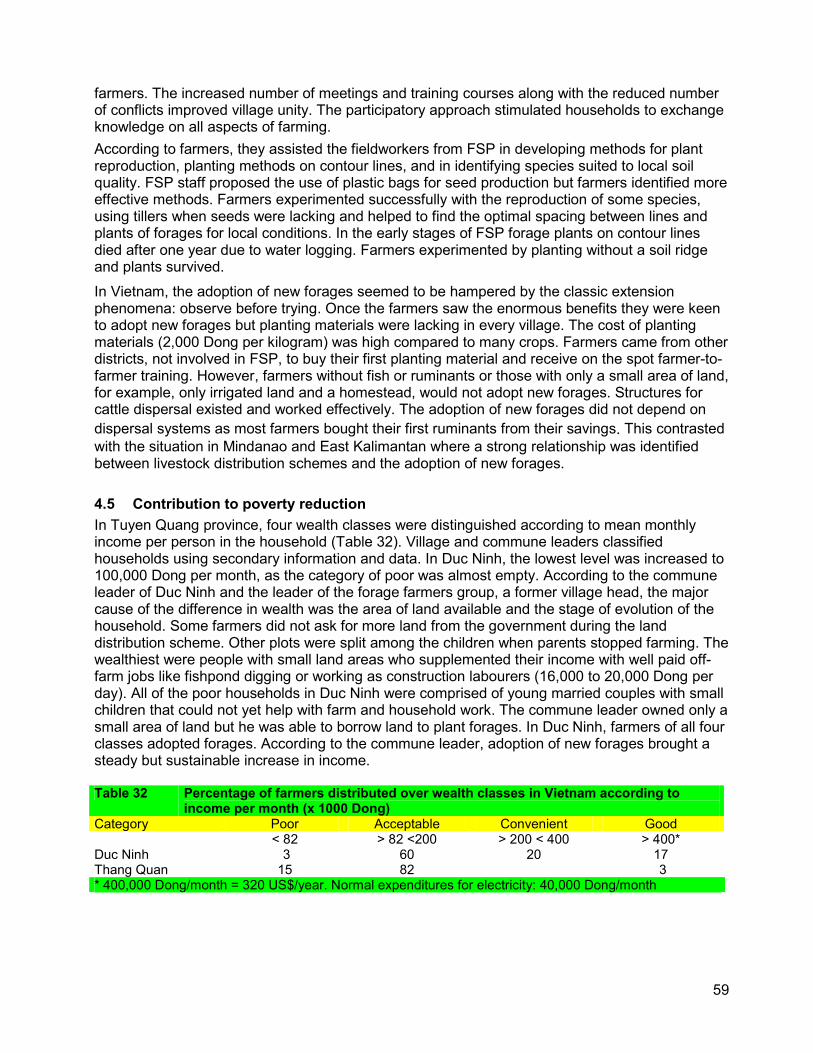
59
farmers. The increased number of meetings and training courses along with the reduced number of conflicts improved village unity. The participatory approach stimulated households to exchange knowledge on all aspects of farming. According to farmers, they assisted the fieldworkers from FSP in developing methods for plant reproduction, planting methods on contour lines, and in identifying species suited to local soil quality. FSP staff proposed the use of plastic bags for seed production but farmers identified more effective methods. Farmers experimented successfully with the reproduction of some species, using tillers when seeds were lacking and helped to find the optimal spacing between lines and plants of forages for local conditions. In the early stages of FSP forage plants on contour lines died after one year due to water logging. Farmers experimented by planting without a soil ridge and plants survived. In Vietnam, the adoption of new forages seemed to be hampered by the classic extension phenomena: observe before trying. Once the farmers saw the enormous benefits they were keen to adopt new forages but planting materials were lacking in every village. The cost of planting materials (2,000 Dong per kilogram) was high compared to many crops. Farmers came from other districts, not involved in FSP, to buy their first planting material and receive on the spot farmer-to-farmer training. However, farmers without fish or ruminants or those with only a small area of land, for example, only irrigated land and a homestead, would not adopt new forages. Structures for cattle dispersal existed and worked effectively. The adoption of new forages did not depend on dispersal systems as most farmers bought their first ruminants from their savings. This contrasted with the situation in Mindanao and East Kalimantan where a strong relationship was identified between livestock distribution schemes and the adoption of new forages.
4.5 Contribution to poverty reduction In Tuyen Quang province, four wealth classes were distinguished according to mean monthly income per person in the household (Table 32). Village and commune leaders classified households using secondary information and data. In Duc Ninh, the lowest level was increased to 100,000 Dong per month, as the category of poor was almost empty. According to the commune leader of Duc Ninh and the leader of the forage farmers group, a former village head, the major cause of the difference in wealth was the area of land available and the stage of evolution of the household. Some farmers did not ask for more land from the government during the land distribution scheme. Other plots were split among the children when parents stopped farming. The wealthiest were people with small land areas who supplemented their income with well paid off-farm jobs like fishpond digging or working as construction labourers (16,000 to 20,000 Dong per day). All of the poor households in Duc Ninh were comprised of young married couples with small children that could not yet help with farm and household work. The commune leader owned only a small area of land but he was able to borrow land to plant forages. In Duc Ninh, farmers of all four classes adopted forages. According to the commune leader, adoption of new forages brought a steady but sustainable increase in income. Table 32 Percentage of farmers distributed over wealth classes in Vietnam according to
income per month (x 1000 Dong) Category Poor Acceptable Convenient Good < 82 > 82 <200 > 200 < 400 > 400* Duc Ninh 3 60 20 17 Thang Quan 15 82 3 * 400,000 Dong/month = 320 US$/year. Normal expenditures for electricity: 40,000 Dong/month

60
Welfare in Duc Ninh had increased in the previous three years and the poor represented only 4% of the village. Most people had made good progress financially as investments in fruit trees, and timber trees in the forest area and on old fallow land, started to make returns20. This tendency was confirmed by the leader of the forage farmers group in Phu Lam, where production from livestock acquired through saving, credit or trust schemes also increased. Most people saved money from cash crops and small livestock. In Phu Lam, a minority of people had an income below 200,000 Dong per month; most of them did not have a fishpond or large livestock and did not need to plant forages. In Phu Lam, the poorest group did not crop forages; it seemed they lacked the initiative to improve their livelihood21. The contribution of livestock to livelihood was negatively correlated to wealth (Table 33). This corresponded with the farmers' belief that differences in land area explained the income disparity between farmers. People were better off with a larger area of land that allowed them to get more income from upland crops and wood. The rich consumed and acquired more income from poultry and swine and their total livestock contribution was estimated at 32%. The large middle class acquired more income from fish, cattle and buffalo. They estimated overall contribution at 34% but seemed to have underestimated the contribution of other livestock. The lower class, mostly recently married couples and/or recent adopters, estimated the contribution of livestock at 39%, the larger part coming from livestock not using new planted forages. The contribution in Phu Lam was estimated at 30%. The mean in the adoption benchmark survey for the 13 farmers also present in this survey was much higher at 55 ± 10, as was the overall mean for Tuyen Quang: 49%. Table 33 Weighting of the contribution of livelihood resources to consumption (Con) and
income and capital accumulation (I & C), in Duc Ninh farm households grouped according to class of wealth (Dong/month).
< 100 000 100 000 – 200 000 > 200 000
Livelihood activities Con I & C Con I & C Con I & C
Rice 20 10 11 8 9 5 Upland crops 15 5 6 25 10 21 Wood 1 4 2 6 Fruits 5 2 1 2 2 3 Cattle/buffalo, fish 10 5 7 25 3 13 Forage plants & feed 2 4 Vegetables 5 3 1 1 3 1 Processing, transport & trading 1 2 Off-farm labour 2 Handy craft 1 Other livestock 18 6 1 1 4 12 Total contribution of livestock 39 34 32 The increase in income due to new forages was calculated using two methods. We cannot simply add the figures from table 27 and table 29, as not all households kept both fish and ruminant systems. In the first method we used the data derived from individual interviews. For the households in the study that kept both ruminants and fish, the monthly net income for early and
20 Until 1989 Vietnam had a collective economy; the Doi Moi of 1989 had its first effect through increased rice production allowing investments in other productive activities. 21 Also mentioned were low levels of knowledge as well as capacity to organise and to analyse and lack of courage for work.

61
recent adopters was 249,000 (sd = 129,000) and 124,000 (sd = 85,000) Dong , respectively. The difference, 125,000 Dong, is considered financial benefits from improved forage systems. There was no indication that income from livestock before the introduction of new forages was higher in Duc Ninh compared to Thang Quan or that the sample choice would have distorted the comparison between early and recent adopters. The estimated increase in income per household from adults’ saved time for fish and ruminant production systems was 25,000 and 40,000 Dong per month, respectively, making a total of 65.000 Dong per month per household. The total estimated increase due to new forages, including saved labour, was therefore 190,000 Dong per month per household (125,000 + 65,000); equivalent to $152 per year or $30 per year per household member. Table 34 Contribution of activities to livelihood for four farmers from the benchmark survey. Ha Van Phung
(1522) Ha Hi Hao
(1544) Tran Van Hung
(1561) Nguyen Van Chinh (1511)
Con I & C Con I & C Con I & C Con I & C
Livestock – that eat forage 20 16 10 15 20 10
Other livestock 4 16 10 5 14 6 45 25
Rice 2 14 0 20 0 20 0 30
Products gathered off-farm 2 2 5 10
Tree crops 20 0
Root crops 0 2
Other 5 5 5 10
Upland crops – other
The second method of calculating the increase in income after new forage introduction was through estimation of the total income for livelihood, based on the participatory assessment of the contribution of the various activities to the livelihood system. The present study obtained estimations from group consensus. Data from the benchmark survey were obtained from individual interviews. The present participatory assessment, using 11 categories of activities, resulted in a mean contribution from livestock of 35%. The baseline study using only eight categories, and for some individual farmers only two categories, gave a mean of 49% (Table 34). The study in Mindanao showed that splitting livestock into four categories increased the estimated contribution of livestock to livelihood. In the benchmark survey in Tuyen Quang, where livestock represented a quarter of the resources, their contribution was overestimated. However, in the present survey in Vietnam where more alternative products were mentioned, the importance of livestock was underestimated. According to farmers, their income had increased in the previous three years due to the production of tea, bamboo and trees for fruit and wood. For those that adopted new forages, income from livestock also increased gradually. This indicated that the overall contribution of livestock had decreased compared to the benchmark survey. A value between that obtained in the benchmark survey and in the present study (42%) was used. Total net income per household member was estimated at 123,000 and 79,000 Dong per month, for early and recent adopters, respectively. Therefore, since the introduction of new forages total income increased by 44,000 Dong per month per member, i.e. an improvement of 55 %. As estimated earlier, the total increase due to new forages was 180.000 Dong per month per household or about 38.000 Dong

62
per month per member; therefore new forage introduction accounted for 85% of the total increase in income. An income of 400,000 Dong per month per person corresponds to US$320 in a year, which in most international statistics on income, is considered to be the poverty limit. Estimated income per household member is still below the international poverty limit. However, adoption of new forages contributed to a 50 % increase of income within three years of adoption. The poor, in particular, benefited financially from the introduction of new forage.
4.6 Feed quality, quantity and cost The prices of fresh natural forage at markets in the major cities of Vietnam varied from 150 to 200 Dong per kilogram. The Government offered 100 Dong per kilogram for fresh Napier and 150 Dong per kilogram for other fresh species: Guinea grass, Paspalum and Brachiaria. Fodder had to be delivered to the quarantine station for imported dairy heifers. In Tuyen Quang, planting material for new forages was sold at 2,000 Dong per kilogram fresh weight. The production cost was calculated by including the following expenses: labour for forage cropping, returns to land, taxes on land at the lowest rate, manure, fertiliser and planting material. Planting material was paid for by only 6% of the farmers. The cost of forage was relatively low, because less than the recommended quantity of manure was applied. According to farmers, the recommended rate before planting was 300 kilograms per sao and the real applied quantity was just 110 kilograms per year (sd=124). Labour was accounted for at 14,000 Dong per day. According to local experts the annual yield of green fresh fodder in Tuyen Quang varied from 110 to 300 tons per hectare. Napier obtained the highest yield. Fresh Guinea grass usually yielded 150 tons per hectare, corresponding to 30 tons DM per hectare with a DM content of 20%, or 20 tons DM per hectare with a DM content of 30%. Most fodder banks received some fertiliser, manure, urine or fishpond mud each year so production of 30 tons per hectare was possible. For a fresh yield of 150 tons per hectare, the production cost of new forages was estimated at 120 Dong per kilogram fresh weight. According to the individual farmer interviews, the mean number of labour days required for new forage cropping each year was 14.6 days per sao (sd=9.3) for early adopters and the number of days estimated by recent adopters was 30.7 (sd=34.9). This was verified at the group validation meeting where farmers said that the labour needed per sao was 10 days for land preparing, manure application and planting, and 11 days for fertiliser application and weeding. The new forage species used were replanted every two to three years. When accounting for the 10 days of planting over 2.5 years, four days are needed for planting each year. So the total estimated time needed each year was 11 + 4=15, close to the 14.6 days per sao. Table 35 Mean relative contribution (%) of feed resources to animals’ diet for early
adopters raising ruminants and fish (sd), n=19 Summer Winter
Cattle & buffalo Fish Feed resource
Cattle & buffalo Fish 34 (4.8) 19 (1.6) cut & carry planted forage 21 (2.6) 11 (1.2) 2 (0.9) 9 (2.1) cut & carry natural forage 2 (0.7) 5 (1.3) 3 (1.0) 5 (1.2) concentrates 8 (1.5) 14 (2.1) 8 (1.4) 4 (1.1) various crop by-products 16 (1.8) 7 (1.9) 16 (2.8) herding / tethering 14 (2.6)

63
The average estimated contribution of new forages to animals’ diets was 22% for ruminants and 25% for fish (Table 35). For both species, the contribution of improved forages was much higher in summer. In winter, leaves and stems of cassava were an important source of fish feed. Generally cutting and carrying of natural forages was more frequent for fish. The importance of crop by-products for ruminants was underestimated as part of the herding was in rice fields and thus was also based on crop by-products. Farm households having only fish tended to mainly feed their fish on improved forages (Table 36). For cattle and buffalo, grazing remained important as long as households had labour available to do the herding. Farmers estimated the quantity of forage cut but the values appeared to be low. Estimating the quantity cut was difficult as farmers transported the forage in a variety of ways (baskets, bags etc) or threw it directly into the fishpond or the trough. In contrast, in Kalimantan, weighing showed that farmer’s estimate was 50 to 100% too high. Observations showed that the gut fill of animals of adopters in Vietnam was generally good. There was little reason to doubt the sufficiency of feeds offered to the animals at the start of the rainy season. Farmers not having enough new forage in the dry season still used cassava and concentrates, especially for the draught animals. Most farmers were adopting Guinea grass. It would be useful for farmers to experiment with Brachiaria spp. because they produce more in the dry winter. However, these grasses can create a weed hazard if intercropped because of their stoloniferous growth form. Guinea grass has an ideal growth form for intercropping in tea and coffee. Frequent replacement limits the effect on soil conservation. Table 36 Mean relative contribution (%) of feed resources to animals’ diet for early
adopters raising only ruminants or only fish (sd). Fish (n=6) Cattle & buffalo (n=3)
Summer Winter Feed resource
Summer Winter 85 (2.3) 54 (6.1) cut & carry planted forage 58 (5.9) 38 (3.1) 10 (2.6) 7 (2.2) cut & carry natural forage 0 (0.0) 0 (0.0) 5 (1.5) 15 (2.5) concentrates 7 (1.9) 12 (2.1) 0 (0.0) 24 (7.1) various crop by-products 0 (0.0) 18 (3.3)
herding/tethering 35 (5.4) 32 (4.5)
In the short dry season the availability of fresh fodder was still low. Rice straw was of low quality and the other feeds available had low protein contents. Farmers mainly planted high yielding varieties on their small areas of good soil. However, they still could not produce enough in the dry season of Tuyen Quang. When this small area was occupied they started planting on previously barren land to ensure they had enough fodder. Once farmers had planted enough forage for the wet season they could plant drought resistant grasses and leguminous trees for dry season feeding. There is scope for much more participatory experimentation on fodder trees.
65
5 Training
5.1 Philippines Training focused on the importance of a consistent diet for ruminants (annex H) and estimating an animal’s body weight by heart girth measurement. Farmers' perceptions of body condition and gut fill were discussed. Farmers used gut fill to judge if the fodder offered to the animals was sufficient. A judging schedule with several criteria for scoring gut fill was presented during the training (annex I). The body shapes of cattle in Mindanao are extremely variable due to the presence of various crossbreeds and improved breeds originating from Bos indicus and from Bos taurus. Locally, three formulas for the conversion of body measure to weight were known for cattle; two of them needed measurement of heart girth and length. The formula used by fieldworkers in Malitbog and Cagayan de Oro was: BW= (HG)2 x BL /300 However, when this formula was used on an animal of known live weight before transportation the derived weight were 20 kilogram lower. This difference may have been partly due to weight loss during transport from the breeding centre to the recipient farmer. A formula with two unknown variables is complicated and instead a table with a simple conversion from centimeters to kilograms should be developed. The linear relationship available in Cagayan Oro was: y = - 466 + 4.7 * (x) where x is the heart girth measure in centimetres. However, this formula was for Brahman cattle and less suitable for other breeds. A field study could be conducted to adapt the heart girth to weight conversion tables for swine and goats to local breeds. Students from the Xavier University could execute this, with modest financial support from FSP. The following data for cattle and pigs were collected in the slaughterhouse of Cagayan de Oro: breed, sex, heart girth and carcass weight. For cattle the body condition was also scored. These results were compared to the industrial heart girth tape of Europe and a table based on data on Bali cattle in Kalimantan. The live body weight was deducted from carcass weight assuming a carcass percentage of 55, 54 and 53% for body condition grades of 3, 2 and 1, respectively. Derived body weights appeared to correspond well. However, the carcass percentages of cattle with low body condition were probably lower than 54 and 53%, and therefore, the weight overestimated with the tape measure conversion method. For cattle, a conversion table was composed with the data from a European weight measuring tape for cattle with a medium body condition score, equal to 3 (annex F). The guidelines for body condition scoring are also available (annex I). Several breeds of swine were also present. Native breeds had been upgraded with Duroc and Large White. Weight data on live animals were limited and data from the slaughterhouse were mainly from pigs with a carcass weight above 70 kg. The carcass percentage of 84, derived from measurement with a European measuring tape seems high but locally pigskin and paws were also consumed (annex F). A conversion table was derived from the European measuring tape and presented to farmers. Most goats were of the native breed, but some Anglo-Nubian were imported. There were not enough available data to compose conversion tables for goats. The conversion table composed in Kalimantan was presented (annex F). The housing system recommended to recipients of government dispersal animals was not uniform. Some goat houses still needed daily cleaning as the floor was closed. One farmer constructed an innovative goat house that facilitating easier manure collection under the half open stair-like bamboo floor (Photographs 7 and 8). Several farmers experienced high rates of kid mortality. The causes should be studied; they probably include intestinal infections and/or pneumonia due to chilling, or high ammonia

66
concentrations. Kids huddled against the walls for conduction heat and could be wet by sudden rains and then experience chilling.
Photographs 7 and 8. The innovative goat house in Lumbia: the stair-like or tribune construction of the half open floor allowed for easy dung collection.
5.2 Vietnam The subject for the training sessions was mutually decided upon by the FSP coordinator of Vietnam and the head of the farmers’ forage group in Duc Ninh. The household survey showed that farmers did not provide a consistent diet for cattle and buffalo. To complement rice straw they fed cassava roots some days and various green leaves on other days. The training emphasised the importance of a consistent diet for ruminants with reference to dry season feeding and fattening (annex H). The ruminant diet needed to be of the same quality and composition each day and to contain enough protein for maintenance and growth as well as enough energy for fattening. The farmers’ choice of chopped cassava roots, banana trunk or sugarcane tops to complement rice straw in dry season was not ideal as those feeds were not high in protein. The small quantity of new forages available in the dry season, when vegetative growth was restricted, did not contain enough protein either. The training insisted upon the use of leguminous trees of which Calliandra seemed most suited for Tuyen Quang.
Photographs 9 and 10: Guinea grass as an intercrop with tea; replacing cassava which hampers tea culture, and other crops that need pesticides.
67
6 Conclusions and Recommendations The improved forage species introduced by FSP in northern Mindanao, Philippines, increased animal production, improved soil conservation and saved farmers time. Net yearly income per household from animal production increased from22 $54 to $157 in the farming community at Malitbog, and from $68 to $503 in Cagayan de Oro. These differences only represent changes in income. Early adopters had more livestock; to attribute the positive effect to forage adoption it is more accurate to factor labour into the calculation of income. The differences between the two sites are reduced when labour is accounted for: animal production increased from $0.44 to $1.06 per day of labour in Malitbog, and from $0.40 to $1.34 in Cagayan de Oro. Saved labour was equivalent to an additional $36 per year. The reduction in labour time enabled households with little available labour to acquire animals, and allowed farmers with existing herds to increase their animal numbers. The use of forage contour lines on steep slopes in Malitbog increased maize yield, resulting in additional income of $22.50 per year, and enabled the establishment of sustainable production systems. These changes resulted in a significantly higher household income from livestock per labour day for the adopters of new forages, and had a positive effect on the overall livelihood of the farm household. The net income of livestock production per hectare of new forage was at least twice the income generated from two crops of maize. The introduction of new forages had some gender-specific effects, particularly in Malitbog: the involvement of women and children in tasks like herding and cutting diminished and men were responsible for more livestock tasks than before. In Cagayan de Oro, men, women and children all profited from saved time due to the need for less labour input. Saved time was generally invested in increasing animal numbers or extending crop activities. The large increase in the number of animals farmed by early adopters in Cagayan de Oro resulted in an increase in labour input. This created jobs in rural areas and reduced labour migration by young people. The increased use of the cut and carry system reduced the destruction of crops and frequency of conflicts caused by grazing animals. The participatory approach of FSP changed the attitudes of fieldworkers and increased the number of farmers interested in training and cross project visits. This extended the impact of FSP to farmers’ knowledge of soil conservation, crop rotation and inter-cropping. Farmers also began to use participatory tools to facilitate decision making in their own activities. In Tuyen Quang, northern Vietnam, the overall effect of new forages upon the welfare of farm households was also significant. Net yearly income per household from ruminant production systems increased from $144 to $179 after using improved forages for two to four years. For Fish systems it increased from $99 to $125 per year per household. Converted to net income per day of labour spent in the systems, the rates increased from $0.33 to $1.13 for the ruminant system and from $ 0.80 to 2.33 for the fish system. Saved time also allowed households to increase their income from other, mainly agricultural, activities. Due to the increased income from investments in tree crops, overall income improved but the contribution of livestock to total livelihood decreased. If the effects of saved labour were included, forage adoption was estimated to account for an additional yearly increase of $32 and $20 per household for the ruminant and fish systems, respectively. For those households that had both systems in place, which was the majority, income from livestock, including saved labour, increased by $152 per year per household. Farmers using improved forages for pigs had a higher net benefit measured in two fattening cycles; $174 versus $106 for those who didn’t use improved forages, however, the sample size for the pig farmers was small. The income per labour day was similar for both groups.
22 All $ = US dollars

68
The adoption of new forage species had very positive social and gender effects in Vietnam. New forages reduced the time children and women spent herding, and cutting and carrying for animals. Children were able to spend more time studying and women also enjoyed educational and cultural advantages. The very poor farmers with small farms in Tuyen Quang benefited most from the improved forages: they were able to keep large ruminants, increase their income from livestock, and intensify their production systems. Other positive effects on rural development included: a reduced number of farming conflicts over grazing animals, the rehabilitation of barren land and reduced pesticide usage. Unfortunately the adoption of new forages was highly dependent upon the livestock dispersal and credit programs in Mindanao. These systems resulted in a large number of opportunistic participants in FSP activities. In Tuyen Quang province, the scaling out of improved forage technologies did not depend on livestock distribution schemes. The many advantages and favourable socio-economic conditions associated with the adoption of Guinea grass systems, enhanced an autonomous process of scaling out. However, the introduction of other species and accessions still needs the support of a structured extension system. The study led to several recommendations:
• Care should be taken not to subdivide categories too much during participatory matrix ranking. The number of categories used affected the participatory weighting of the relative contribution of various resources to the livelihood for consumption, and income and capital accumulation. Separating livestock into different animal species lead to an overestimation of their contribution.
• Training on ruminant feeding and the importance of a diet composition and consistency, should be conducted for all farmers who cultivate improved forages. Farmers in both countries lacked knowledge on these topics.
• The problem of high mortality among young goats in Mindanao needs further study, as is the case in Indonesia. It may be related to chilling due to draft in sheds and open floors.
• The traditional alima system should be revised because it is an obstacle to equal income distribution. The share of benefits for caretakers should be increased. For households owning animals, improved forage adoption made an important contribution to poverty reduction. Farmers with animals in trust through the local alima system in Mindanao did not experience significant increases in income.
• Provide land rights to the landless. People who didn’t have long-term rights to land use could not profit from supplementary labour investments. There is an urgent need for change.
• FSP should increasingly work with farmers owning small livestock because livestock dispersal schemes will never be able to supply cattle and buffaloes to all the people needing them. Goats and chickens have shorter productive cycles; reducing the time needed to attain positive returns from labour investments.
• Farm communities in the project would benefit from increased livestock marketing awareness and orientation. Although prices of livestock fluctuated in Mindanao, farmers did not take advantage of the phenomenon by strategically fattening and selling animals. Similar observations were made in an earlier study in Indonesia.

69
7 References ADB, 2001. Key Indicators 2001 of Developing Asian and Pacific Countries, vol. XXXII. Growth and Change in Asia and the Pacific. Oxford University Press for Asian Development Bank, New York, pp. 500. Bosma, R.H., Roothaert , R.L., Ibrahim, 2001. Economic and social benefits of new forage technologies in East Kalimantan, Indonesia. CIAT Working Document No. 190. Centro Internacional de Agricultura Tropical, Cali, pp. 65. Bosman, H.G., Moll, H.A.J., Udo, H.M.J., 1997. Measuring and interpreting the benefits of goat keeping in tropical farm systems. Agricultural Systems. 53: 349-372. Bui The Hung, 2001. On-farm testing of forage crops in the project area 1996 - 2001. Vietnam Sweden Mountain Rural Development Programme, Ministry of Agriculture and Rural Development, Hanoi, pp. 50. Cramb, R., Purcell, T., 2001. How to Monitor and Evaluate Impacts of Participatory Research Projects: A Case Study of the Forages for Smallholders Project. CIAT Working Document No. 185. Centro Internacional de Agricultura Tropical, Cali, pp. 55. Garrity, D.P., 2000. Contour farming based on natural vegetation strips: Expanding scope for increased food crop production on sloping lands in Asia. Environmental Day and Sustainability: 323-336. Genio-Genio-Samson, J.N., 2002. Participatory Interactive Research on the Evaluation of Soil Conservation Options in San Migara, Malitbog, Bukidnon, Philippines. MSc-University of the Philippines Los Banos, Los Banos. Khanh, T. T. and Yen, V. H., 2002. The Impact of the Forage for Smallholders Project on People, Livestock and the Environment in Vietnam. Proc. of the third annual regional; programme meeting of the Forages for Smallholders Project. Luang Phabang, Lao PDR, 28 January to 2 February 2002, CIAT, Los Banos. Mannetje, L.’t, Jones, R.M., 1992. Plant Resources of South-East Asia, vol. 4. Forages. Prosea, Bogor, Indonesia, pp. 300. NSO, 2001. Mean income and expenditures for Region X, per province. National Statistical Office of Region X, Cagayan de Oro, Philippines.

70
8 Annexes
Annex A. Calendar of activities R. Bosma (consultant) Sat 04-20 Arrival at Los Baños, Philippines. Sun 04-21 Reception by Dr. Ralph Roothaert, coordinator CIAT/FSP. Mon 04-22 Discussion of terms of reference and exploration of Adoption Tree, Benchmark
Survey and reference farmer databases. Identification of farmers present in all three.
Tue 04-23 Collection of data on farmers present in all three data bases from Cagayan de Oro, Mindanao. Implementation schedule adjusted to available data. Farmers selected from databases to be complemented to a total of twenty in the field after available farmers are ranked by wealth. Preparation of guides for first general farmer meeting.
Wed 04-24 AM: Travel to Mindanao, southern Philippines; reception at airport by Dr. Perla Asis and some of her team members. PM: 1) presentation of the mission objectives to the Chief of City Veterinarian Department Dr Hildegardo M. Dagundo; 2) discussion on the implementation schedule with Dr Asis and the fieldworkers: choice of villages and meeting dates.
Thu 04-25 Travel to Malitbog with the Municipal Agricultural Officer, Mrs. Judith Saguinhon. In the morning: 1) presentation of mission objectives to Municipal Mayor: Hon. Osmundo de la Rosa; 2) discussion of implementation schedule with Mrs Judith and fieldworkers: choice of villages and first meeting dates; 3) visit at the Muncipal Health Centre; 4) lunch with Mayor and team; 5) arrangements for stay in Malitbog during the study.
Fri 04-26 Farmer meeting at the barangay Tagpagni, Cagayan de Oro. Sat 04-27 Data entered. Database checked for livestock species in barangays of Cagayan de
Oro; Preparation of guides for focus group discussion and interview tables; checking conversion girth width to weight.
Mon 04-29 Group meeting at barangay Pagalungan with participants from the barangay Lumbia. Focus group meeting with farmers from Lumbia.
Tue 04-30 Group meeting and focus group meeting at barangay Dansolihun. Preparation of weighing session at the slaughterhouse.
Wed 05-01 Labour day. Data entry and preliminary report writing. Thur 05-02 Four individual household interviews in Dansolihun. Fri 05-03 Focus group discussions and four individual household interviews in Tagpagni. Sat 05-04 Participation in field trip of FSP farmers to the ICRAF project located at MOSCAT
Agricultural College in the district of Claveria, Misamis Oriental and 2 interviews of households from Dansolihun.
Sun 05-05 Inventory of data to be specified or completed. Analyses of available data for conversion of girth tape measurements.
Mon05-06 Household interviews in Lumbia and Tagpagni. Tue 05-07 Household interviews in Pagalungan

71
Wed 05-08 Household interviews in Pagalungan. Social meeting with FSP team of Cagayan de Oro.
Thu 05-09 Travel to Malitbog and meet with farmers from the barangay of San Louis and Silo-O in the sitio Kaluluwayan.
Fri 05-10 Four household interviews in San Migara. Sat 05-11 Travel to Cagayan de Oro, database development and data entry. Mon 05-13 Collection of secondary data at the National Statistical Office of region X and of the
Statistical Office of the Department of Agriculture in Cagayan de Oro. Visit farmers’ field day in San Simon and travel to Malitbog. Tue 05-14 Focus group discussion and interviews in Kaluluwayan. Wed 05-15 Focus group discussion and interviews in Lake. Thu 05-16 Focus group discussion and interviews in San Migara. Fri 05-17 Focus group discussion and interviews in Silo-O Sat 05-18 Data entry and travel to Cagayan de Oro. Mon 05-20 Presentation of preliminary results to the Mayor of Malitbog. Validation with
interviewed farmers and training on ruminant digestion and diet composition and on heart girth measurement and conversion to weight.
Tue 05-21 Validation meeting with farmers. Training on ruminant digestion and diet composition and on heart girth measurement and conversion to weight in Lumbia, for the farmers interviewed in Cagayan de Oro.
Wed 05-22 Presentation of preliminary results to the Chief Veterinarian Officer of Cagayan de Oro. Travel to Los Baños.
Thur 05-23 Discussion of preliminary results with Dr Roothaert at CIAT- Los Baños. Fri 05-24 Preparation of mission to Vietnam with Dr Roothaert at CIAT- Los Baños. Sat 05-25 Travel to Hanoi, Vietnam. Reception by Dr. Le Hoa Binh. Mon 05-27 Travel to Tuyen Quang. Reception by Ms. Yen. Tue 05-28 Presentation to the Vice Director of the Provincial Department of Agriculture and
Rural Development, Vu Do, in the presence of Mr Thanh, Head of the Agro-technology Department.
Discussion of wealth classes and causes in the commune of Duc Ninh (district Ham Yen) with the community leader Ha Xuan Khanh and village leader Le Xuan Binh.
Wed 5-29 Presentation to the translator, Ms Phuong. Discussion in Phu Lam with leader of FSP workgroup Ms Doan Thi Lan and planning with Ms Yen.
General meeting with early adopters in the commune Duc Ninh. Thu 05-30 Visit of quarantine centers for Friesian cattle imported from Australia, together with
Vietnamese experts from the Châu Son plateau. Then, to forget my sadness about the suffering cattle and the problems to come for farmers and fieldworkers: a visit to the hot spring resort of Phu Lam.
General meeting with early adopters in the commune Than Quan.

72
Frid 05-31 Focus group discussion with farmers of medium wealth, women’s focus group discussion and three household interviews in Duc Nin. The women’s' focus group discussion was lead by Ms Hoang alone, as Ms Phuong and also Ms Yen were suddenly unable to attend.
Sat 06-01 Focus group discussion with wealthy farmers and five household interviews in Than Quan.
Sun 06-02 Return of M. Le Hoa Binh to Hanoi. Focus group discussion with farmers of low wealth and five household interviews in Than Quan.
Mon 06-03 Focus group discussion with wealthy farmers and four household interviews in Duc Ninh.
Tue 06-04 Focus group discussion with poor farmers and household interviews in Duc Ninh and data entry.
Wed 6-05 Database development, data entry. Thu 06-06 Report writing. 06- 7 to 9 Household interviews in Duc Nin. Mon 06 10 Data entry. 06-11 and 12 Household interviews in Than Quan. Thu 06-13 General meeting and household interviews in Phu Lam Fri 06-14 Women’s' and general focus group discussion and household interviews in Phu
Lam. Sat 06-15 Data entry and report writing. Sun 06-16 Report writing. Mon 06-17 Report writing and preparation of validation and training. Tue 06-18 Validation and training in Duc Ninh. Wed 6-19 Validation and training in Thang Quan and presentation of executive summary and
conclusions of the mission to the Director of ARD, M Khoa. Thu 06-20 Travel to Hanoi. Sat 06-22 Travel to Los Baños, Regional Office of CIAT.

73
Annex B. Guidelines for general meetings 1. Assessment of livestock system To make an economic and social assessment we need to see what the livestock are used for and what activities you need to do for the animals to reproduce and grow. To discover this together we will make a resource flow diagram and calendars. Which animals do you feed the new forages? Cattle, buffaloes , goats, pigs. 1. We would like to focus on these livestock species and make a resource flow diagram.
The facilitators make the first draft of the herd/flock, and ask for the products and services the animals provide. Put together the lines going to the: fields household (family) market Think of products like: household consumption, ploughing, manure marketing and work with cattle for money or services in return. purchased feed, materials, drugs and services, by-products of upland fields, lowland and homegarden, kitchen residues, household members, (hired) labour
Discuss: Why they sell livestock? (What is the money used for?) Had things change since the new forage introduction? At what age do female animals have their first young and what is the period between successive births? 2. Calendar of livestock activities We would like to know how much work you do for each species. To make it easier for us to understand we ask you to make a calendar and fill in the work you do and inputs you use. We can also use the calendar to see if prices of products vary over the year.
1. What are the activities you need to do for the animals? 2. Put them all activities (tasks) related to cattle/buffalo /goat production on the left side of
a paper. And for each task ask: a) in which period are they done?
b) are they kept in the same way all year round? c) Do they use hired labour, if yes for which tasks? d) Which of them changed since the introduction of new forage
3. Are the animals bought or marketed in specific periods? 4. Are the animals sold at specific ages? and if fattened: when is fattening? 5. Do market prices of feed and other inputs vary and do and animal prices vary according
to ages?

74
3. Assessment of livelihood system We talked about animals this morning and saw links with other parts of the household livelihood. We would like to know, what other activities contribute to your subsistence. The facilitators can start the resource flow diagram, with the household as central part and the herd as one of the contributors at one side (yesterday the herd was the central part). Then ask the farmers to complete with all activities or income sources that contribute to their livelihood. Help them think of:
fields: upland fields, lowland, home garden products. craftmanship, trade, off-farm work (other farms, town). do they use hired labour, if yes, for which tasks?
When ready, ask: did any any changes occur after the introduction of new forage? did time needed or available for some things increase? did some things produce more or bring more money? or can they work more days off-farm?
4. Discussion with village head on wealth ranking (usually done before meeting). Are there differences between the well-being of the farms in your commune/barangay? How many classes of well-being can be distinguished in this commune/ barangay? Which are well-off farms, worse-off farms and in between? What are the causes (indicators) of these differences? Are the groups equally represented? If not:
Which groups are most represented amongst the farmers of this commune/barangay? Which groups are less represented amongst the farmers of this commune/barangay?
Do people of all groups cultivate forage? Why not? 5. Sampling of households for interviews We would like to talk to some farmers, from each of these groups, about the productivity of the herd and on activities related to the herd. For this study we also want to distinguish farmers:
who adopted long ago and those who adopted this year or last year.
For both early and recent adopters we would like to speak with 10 farmers representing every wealth class/production goals/animal species; so in total at least 20 farmers in the municipality. To make interviews shorter we prefer to include those farmers who have contributed to the benchmark survey several years ago. We check the wealth level of those, and:
select other farmers to make the total number per group up to 10 write down names and make appointment for date and time.
We would also like to speak with some wives of farmers who have adopted forages.

75
Annex C. Guidelines for general focus group discussions stratified by wealth • What are the benefits of the improved (new) forages?
• What other changes have occurred since FSP started? • at household level? • at community level?
• Why or how did changes happen?
• What effects did these changes have on people’s lives?
• What changes have occurred in the methods used by the extension workers?
• Do you think extension workers learned something from farmers?
• What are the problems with forages, why do some farmers not adopt them?
• Which other projects work in this community?
• How is this FSP project different from other projects?
Yield estimation of two most important crops that could be planted on forage area name of crop
market value of production Dong/sao
inputs needed in Dong/sao
labour in days/sao
What are prices of : manure? . . . . . . . . and artificial fertilisers? . . . . . . agriculture labourer -adult?………./day ………./hr youngster?………./day ………./hr
for breeding for meat animal market prices young adult old young adult old cattle
buffalo
fish per kg

76
Do the proportional weighting on the relative importance of livelihood activities for consumption, and income & capital accumulation with 100 grains.
Weighting Farm and non-farm activities Consumption Income and
capital
Rice
Upland crops (cassava, maize, tea, sugarcane)
Wood
Fruits
Livestock (including transportation)
Forage (plants and feed)
Vegetables
Crop processing, transport, trading
Off-farm labour
Handy craft

77
Annex D. Guidelines for women group discussions Women only focus groups will be facilitated by women and notes takes by another woman or tape recorder used. These groups shall be composed of women from households where the male household head has been using new forages for several years. 1/ a/ According to them which are the benefits from new forages?
when mentionned by the women, answer 1 (yes) in first colum b/ do they think it is positive for the family? c/ is it more positive for the man or for the women, or is it equal (-)?
generally mentionned benefits yes= 1 no=0
positive =1 negative = 0
woman = 1 man = 0
higher production of animals
good body condition of animals.
availability of extra income;
soil and water erosion control,
yield planted forage higher then old forages
increase of crop production,
better use of fallow land
time saved
access to or upscaling of livestock
2/ a/ Amongst their activities are there changes since the introduction of new forages?
b/ Can they mention new activities or activities for which the workload increased? - can they estimate the supplementary time needed per day and period?
c/ Can they mention activities for which the workload diminished? - can they estimate the time spared per day and period?
new or increased activities work-
load activities with reduced time time
spared

78
3/ Some claim the new forages and cutting and carrying save time, what did they do with this saved time (when applicable)?
4/ Amongst all the things they do in the year which livelihood or leisure activities do they
prefer? 5/ Which animal species do they own or can they own themselves? When they are owner can they decide themselves what to do with the money? When the animal belongs to the family…..?
do they have a say on the benefits (the money they receive after work or sale
species do or can they own (yes= 1 & no=0)
do they take care of the animal?
when owner?
when family animal?
when husband’s animal?
cattle buffalo horse pigs goats chicken
6/ Do they perceive any change in the social lives due to FSP, new forages or spared time (if there’s any)?
description of social change perception (positive = 1 & negative = 0)

79
Annex E. Household interview sheet. Identification FSP farm ID: . . . . Date: . . . . – . . - 2002
Pangalan (Farmer Name) First Name: . . . . . . . . . . . . Last Name: . . . . . . . . . . . .
Pinuy-anan (Location) Sitio: . . . . . . . . . . . . Barangay: . . . . . . . . . . . .
When they start growing FSP forages? . . . .
Did they grow other forages before (yes=1 or no=0)? .
When yes, which species … … … … … … … … … … … … … … … … … grazed or cut & carry
Household description How many people are living in the household? How many people work on the farm? (if part-time briefly describe details).
Pila ang nagtrabaho sa uma
Number working on farm
Gidaghanon sa sakop sa bubong
Number of people Full-time Part-time Part-time details
Dagko/Hamtong
Adults
Bata (Hangtod 12 anyos)
Children (< 12 years)
Sinuhulan (pila ka adlaw / tuig) Hired labour
Livestock Types (Philippines) Type, number and ownership contract of livestock.
Hayop Pila Do they give Pagpanagiya Kasabutan
Animal type 2002 before new forage (1 or 0) Ownership * Contract type **
cattle
carabao
horse
goat
pig
rabbit
* yes = 1 ; no =0 ** one offspring to owner = 1 two offspring = 2 10 %= 3 25% = 4 50/50 = 5 half of earning & offspring = 6

80
Land use land area (ha) fodder trees (m or plants)
own hired
cost of land (Pesos/year) contour (m) border (m)
forages fodder bank (ha) under trees (ha) interline (m & n) contour (m & n) border (m)
Change in crop production due to new forage planting * maize root crops Area decrease or increase (0, + or - )
Total farm production decrease or increase (fill in number of sacks, cans or kg )
How was fertiliser used before and after?
* Malitbog only Feeding Get the farmer to list the types of feed used according to period, and the amount fed to the animals, in both the wet and dry season. Include supplements used (e.g. corn bran) and cutting and carrying and tethering on both native pasture and forages (list the species of grasses, legumes and fodder trees used). Do weight ranking, for seasons.
Ranking Ruminants feed resources wet dry
How many hours/day does the animal graze? or,
is it tethered outside their own farm? wet season? . . . . . . . dry season? . . . . .
How many hours per day do they usually work for their livelihood activities?
wet season? . . . . . . . . . . . . . . . . . dry season? . . . . . . . . . . . . . . . . . . . . . .

81
Labour Use who: child = 1, man = 2, woman = 3, relative = 4, hired = 5
water giving cattle carabao horses goats pigs
hours/day
number of people
who
bathing carabao pigs bathing cattle horses
hours/day hours/week
number of people number of people
who who
herding on Bakero cattle carabao horses goats
actually hours/day
month/year
number of people
who
tethering/grazing cattle carabao horses goats pigs actually hours/day
month/year
number of people
who
feeding concentrates & mixing water & salt
cattle carabao horses goats pigs
actually hours/day
month/year
number of people
who
harvest & feeding rice & corn straw
cattle carabao horses goats pigs
actually hours/day
month/year
number of people

82
who
chopping & mixing various crop residues
cattle carabao horses goats pigs
actually hours/day
month/year
number of people
who
breeding cattle carabao horses goats pigs hours or days/year
number of people
who
shed construction cattle carabao horses goats pigs year of construction
days of work
number of people
who
shed maintenance cattle carabao horses goats pigs
day/year
number of people
who
cleaning animals place or shed
cattle carabao horses goats pigs
hours/day
number of people
who
milking carabao cattle hours/day
number of people
who
• including time needed for marketing
• only for Cagayan de Oro

83
New forage cropping land clearing ploughing planting weeding watering manuring
days/year
hours/day
number of people
who
cut & carry forage cattle carabao horses goats pigs actually hours/day
month/year
number of people who
Investments in livestock and record costs and prices of transactions.
mention livestock species using forage
Costs last year inputs (april-march)
kg cost (P) kg cost (P) kg cost (P)
Concentrates
Minerals
Breeding
Shed
Rope
Bucket, basins & other
numbers, price, date of animals bought last 2 yrs
mention livestock species using forage
Income from livestock products for last year
Price /unit
Total received
Price /unit
Total received Price /unit
Total received
Breeding
Meat
Milk
Ploughing
Pangkarga
numbers, date and price of animals sold last 2 years

84
Manure use on crops in own fields on forages for market
Rank with 10 grains
Costs last year inputs for new forage (april-march)
kg or sacks cost (P)
plants/seeds
fertiliser
mention livestock species using forage Home consumption of products last year number estimated
price number estimated
price number estimated
price
meat (kg)
milk (ltrs)
ploughing (ha)
transport (sacs)
Other changes in herd composition over last two year
livestock species using forage 2000 2001 2000 2001 2000 2001
Off-spring
Other entries
Deaths
Other removals
Actual estimated value of livestock species present according to age category
age No value age No value age No value
Estimated value of livestock species present according to age category, start 2000
age No value age No value age No value

85
Annex F. Specific questions for early adopters in Tuyen Quang
How many animals? Do they give How obtained Livestock
2002 at start new forage new forage* (1 or 0) first animal? **
cattle
buffalo
pig
rabbit
fish (sq.m.)
* yes = 1 ; no =0 ** heritage=3 ; cash payment = 2 ; credit = 1 ; trust = 0 ;
traditional planting period other months How many hr/day do they save by using improved forages for their pig?
fodder bank interlinesWhat did they plant before on the area now covered with forage?
rainy season dry season What is the grazing time for cattle & buffalo?
(hrs /day) How much time do they graze outside their own farm?
Contribution of feed to gut fill of animals: do weight ranking of feeds mentioned for wet and dry season with 20 grains in total, respectively.
rainy season dry season Feed resources cattle & buffalo fish cattle & buffalo fish
cut & carry planted forage
cut & carry natural forage
various crop by-products
concentrates
herding/tethering

86
Costs inputs for new forage (Dong) at the first planting during last year
plants/seeds
fertiliser and manure bought
Manure use on crops in own fields on forages for market
Rank with 10 grains?
For next questions consider the whole of the previous year (from Tet to Tet = March to February)
kg price/kg cost (Dong) fish bought last year
kg amount received (Dong) fish sold last year
year/month cost (Dong) year/month cost (Dong) cattle & buffalo bought in the past 2 years
year/month amount year/month amount i d
cattle & buffalo sold in the past 2 years
Income from cattle & buffalo products for last year
number Total received (Dong)
Insemination
Ploughing (sao)
Transport (days)
Manure

87
Annex G. Interview swine production and benefits from new forages, Tuyen Quang. Identification village: . . . . . . . . . . . . Commune: . . . . . . . . . . . . FSP farm household ID: . . . . Date: . . . . – . . - 2002 Name husband: . . . . . . . . . . . . Name wife: . . . . . . . . . . . . When did they start growing new forages from FSP? . . . . Forages used before: Area planted Time needed for planting and weeding these: Cost of fertiliser and other inputs Time needed to cut traditional forages Area planted with new forage for pigs Time needed for planting and weeding new forages Cost of fertiliser and other inputs for new forages Time needed to cut new forages
traditional planting period other months How many hr/day do they save by using improved forage for their pig? Consider for next questions the past whole year (from start rainy season until now)
swine pig bought last year market Costs inputs last year quantity cost (Dong) number total cost (Dong) Concentrates, incl. Salt Veterinary services pig sold last year. Insemination number total received (DONG) house Rope, collar trough & other small fire-wood for feed Other changes in herd composition over last year (numbers)
Off-spring Other entries Deaths Other removals
Home consumption past year number estimated market price swine
Income from swine products for past year number Total received (Dong) Insemination
Manure

88
Estimated value of swine present according to age category
Actually One (1) year ago
age number value age number value
animal house building maintenance
cost and year it was built
days
hours/day
number of people
activity time/day days/week number of people
feed processing
feeding animals
cleaning pig house
washing pigs

89
Annex H. Table for conversion of heart girth into live body weight
Table for conversion of heart girth (cm) into live body weight (kg)
for cattle in normal body condition en with normal gut fill. cm kg cm kg cm kg
40 29 100 96 160 34045 30 102 101 161 24650 31 104 106 162 35255 33 106 111 163 35960 36 108 116 164 36665 40 110 121 165 37370 45 112 127 166 38075 51 114 133 167 38780 58 116 140 168 39485 66 118 147 169 40290 75 120 154 170 41095 85 122 162 171 418
100 96 124 170 172 426105 108 126 178 173 434110 121 128 187 174 442115 136 130 196 175 450120 154 132 205 176 458125 174 134 214 177 466130 196 136 223 178 474135 218 138 232 179 482140 241 140 241 180 490145 264 142 250 181 498150 288 144 259 182 506155 313 146 268 183 514160 340 148 278 184 521165 373 150 288 185 528170 410 152 298 186 535175 458 154 308 187 542180 490 156 318 188 549185 528 158 329 189 556190 565 160 340 190 565

90
Table for conversion of heart girth (cm) in live body weight (kg) for goat (KANDING) in normal body condition en with normal gut fill.
cm kg cm kg
30 4 60 20 35 5 61 21 38 6 62 22 40 7 63 23 43 8 64 24 45 9 65 25 47 10 66 26.5 49 11 67 28 51 12 68 30 52 13 69 31.5 54 14 70 33 55 15 71 35 56 16 72 37 57 17 73 39 58 18 74 41 59 19 75 43
Table for conversion of heart girth (cm) in live body weight (kg) for swine (BABOY) in normal body condition en with normal gut fill.
cm kg cm kg cm kg 60 29 80 56.5 100 94 61 30 81 57 101 96 62 31 82 58.5 102 98 63 32 83 60 103 100 64 33 84 62 104 102 65 35 85 64 105 104 66 36 86 66 106 106 67 37 87 68 107 108 68 38.5 88 70 108 110 69 40 89 72 109 112 70 41.5 90 74 110 114 71 42 91 76 111 116 72 43.5 92 78 112 118 73 45 93 80 113 120 74 46.5 94 82 114 122.5 75 48 95 84 115 125 76 49.5 96 86 116 127.5 77 51 97 88 117 130 78 52.5 98 90 118 132.5 79 54 99 92 119 135

91
Annex I. Guide for body condition scoring
0
Lean animals without palatable subcutaneous fat.
Vertebral spines are sharp when palpated
1
The lumbar vertebra are covered with some fat.
Vertebral spines are less sharp and covered with some fat
2
Ribs are individually apparent
Vertebral spines are still pointed when palpated
3
Not all ribs are individually apparent
Vertebral spines feel round.
4
The lumbar vertebra are covered with fat and the hip joint looks round.
Vertebral spines are only felt with the open hand when pushed hard.
5
The animal is massif and all round and filled with fat.
Even when pushed hard one cannot feel the vertebral spines

92
Annex J. Guide for scoring of gut fill The gut fill in cattle is observed from the back left
hand side in five classes. 1. The flank is deeply fallen in and:
• from the lumbar vertebra, the skin folds deep inside before descending;
• below the hipbone a vertical skin fold is visible; • the gut bowl is about a hand’s breadth large; • seen from the side, the flank shows a rectangle.
2. The flank shows a triangle seen from the side and
• from the lumbar vertebra, the skin bows slightly inside;
• the skin fold from the hipbone joins the rib bow; • the gut bowl is less then a hand’s breadth large.
3. The flank shows hardly any shadows, only: • the gut bowl shows slightly behind the last rib
bow; • from the lumbar vertebra the skin descends at
first vertically and lower down slightly inside; • below the hipbone no skin fold is visible.
4. The flank shows no shadows, and: • from the lumbar vertebra, the skin bows
outwards; • no gut bowl is visible behind the last rib.
5. The flank is round and filled, and: • the points of the lumbar vertebra are not visible
as the belly is round and full; • there’s no apparent distinction between ribs
and flank.
Source: D. Zaaijer, W.D.J. Kempen and J.P.T.M. Noordhuizen.