Embed Size (px)
Citation preview

Economic and real estate overview 19 June 2019

Economic and real estate overview
Mike Straneva
Partner
US National Director of Transaction Real Estate
Ernst & Young LLP

How can we have so much uncertainty and the Goldilocks economy?
Mueller

Where are we in the cycle? Late
Source: Green Street Advisors
M-RevPAF Growth Slowing
(Expansion) Material rent growth
Rising/stable occupancy
New construction
M-RevPAF Growth Negative
(Oversupply/
Obsolescence) Rents failing
Occupancy failing
M-RevPAF Growth
Accelerating
(Recovery) Low/modest rent growth
Rising occupancy
Little new construction
M-RevPAF Growth Flat
(Bottoming) Rents and occupancy stabilizing
Little to no new construction
Community centers
Power centers
Low productivity malls
Neighborhood centers
High productivity malls
Office
Lodging
Self storage
Apartments
Student
Senior Housing
Man. Home
Industrial
Most property types will see
fundamentals progress on this chart in a
clockwise manner. That said, burgeoning
influences – like ecommerce in the case
of lower-quality retail – could actually
cause progression in a counter-clockwise
motion (i.e., deterioration in growth
without ever experiencing an expansion
on oversupply).

Today’s economy: the glass is half full
► REIT NAV very different by
sector
► Interest rates and inflation are
reaching historic norms
► Unprecedented selective
demand from domestic and
foreign investors
► Wave of private capital
► US experiencing accelerating
growth, outpacing others
► Full employment/increasing
participation
► Real estate priced to
perfection but appreciation
rates for the future may be
lower
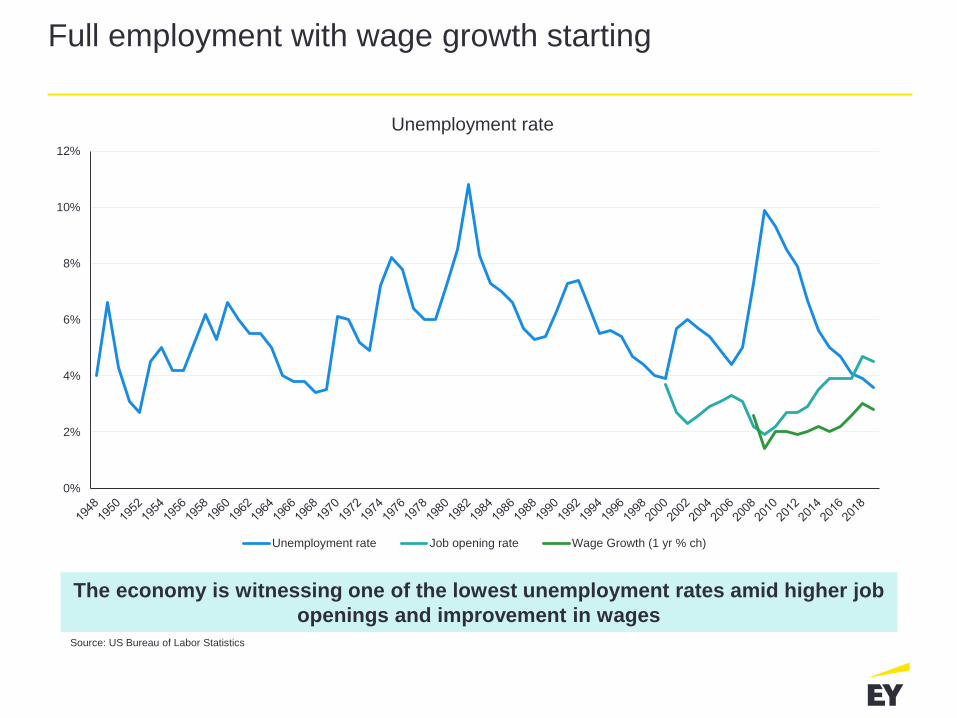
Full employment with wage growth starting
The economy is witnessing one of the lowest unemployment rates amid higher job
openings and improvement in wages Source: US Bureau of Labor Statistics
0%
2%
4%
6%
8%
10%
12%
Unemployment rate
Unemployment rate Job opening rate Wage Growth (1 yr % ch)

This is what full employment looks like – minorities and less educated starting to benefit
Source: US Bureau of Labor Statistics
0
2
4
6
8
10
12
14
16
18
2000
2001
2002
2003
2004
2005
2006
2007
2008
2009
2010
2011
2012
2013
2014
2015
2016
2017
2018
Ap
r-1
9
US Unemployment rate (%) by race
Total White Black Asian Latino
0
2
4
6
8
10
12
14
16
18
20
00
20
01
20
02
20
03
20
04
20
05
20
06
20
07
20
08
20
09
20
10
20
11
20
12
20
13
20
14
20
15
20
16
20
17
20
18
Apr-
19
US Unemployment rate (%) by education level
Total No HS HS No College
Some Collegeor Assoc. Deg
College +

But the labor participation rate is historically low
Reasons for low participation
► Increase in global trade – especially China
► Automation
► Higher federal disability benefits
► Higher minimum wage
► More men in jail
Source: Bureau of labor Statistics, Market Watch
60
61
62
63
64
65
66
67
68
2000 2001 2002 2003 2004 2005 2006 2007 2008 2009 2010 2011 2012 2013 2014 2015 2016 2017 2018 Apr-19
Labor force participation rate (%)

The US yield curve inverted in Q1 2019: a harbinger of recession?
► Is an inverted yield curve a harbinger of recession?
► Third quarter growth is strong and is at Fed target.
► The speed and extent to which rates rise will have a serious effect on commercial
real estate over the coming years – both on cap rates and for property valuations.
Source: US Treasury
0.0%
0.5%
1.0%
1.5%
2.0%
2.5%
3.0%
3.5%
Jan-1
2
Apr-
12
Jul-1
2
Oct-
12
Jan-1
3
Apr-
13
Jul-1
3
Oct-
13
Jan-1
4
Apr-
14
Jul-1
4
Oct-
14
Jan-1
5
Apr-
15
Jul-1
5
Oct-
15
Jan-1
6
Apr-
16
Jul-1
6
Oct-
16
Jan-1
7
Apr-
17
Jul-1
7
Oct-
17
Jan-1
8
Apr-
18
Jul-1
8
Oct-
18
Jan-1
9
Apr-
19
10 Yr 5 Yr 2 Yr

The dollar rebound has coincided with Fed Fund rate increases
Pros:
► A strong dollar makes foreign goods more
affordable for consumers.
► For large multinationals a strong dollar means
greater ability to buy foreign companies.
► A strong dollar cools inflation and economic
growth, which may be overheating.
► A stronger dollar signals that investors believe
economic growth will accelerate in the longer
term.
Cons:
► American exports are more expensive abroad.
► Less domestic demand for US-produced
goods because of cheaper foreign goods.
► Reduced demand for American-made
products will place downward pressure on US
employment.
Source: The Wall Street Journal, US Federal Reserve
0
0.5
1
1.5
2
2.5
3
88
90
92
94
96
98
100
102
104
106
US dollar index vs Fed Funds Rate
US Dollar Index Fed Funds Rate
Source: The Wall Street Journal, US Federal Reserve Bank of St. Louis

Oil prices have recovered to near $60 per barrel
$20
$30
$40
$50
$60
$70
$80
$90
$100
$110
$120
Jan-1
3A
pr-
13
Jul-1
3O
ct-
13
Jan-1
4A
pr-
14
Jul-1
4O
ct-
14
Jan-1
5A
pr-
15
Jul-1
5O
ct-
15
Jan-1
6A
pr-
16
Jul-1
6O
ct-
16
Jan-1
7A
pr-
17
Jul-1
7O
ct-
17
Jan-1
8A
pr-
18
Jul-1
8O
ct-
18
Jan-1
9A
pr-
19
WTI spot price ($ per barrel)
0%
1%
1%
2%
2%
3%
3%
0
100
200
300
400
500
600
700
800
900
1000
Jan-1
3A
pr-
13
Jul-1
3O
ct-
13
Jan-1
4A
pr-
14
Jul-1
4O
ct-
14
Jan-1
5A
pr-
15
Jul-1
5O
ct-
15
Jan-1
6A
pr-
16
Jul-1
6O
ct-
16
Jan-1
7A
pr-
17
Jul-1
7O
ct-
17
Jan-1
8A
pr-
18
Jul-1
8O
ct-
18
Jan-1
9A
pr-
19
Texas employment vs. rig count
Texas rig count (L)
Texas non-farm employment YOY % Ch (R)
Source: Bureau of Labor Statistics, Baker Hughes

0.1%
0.5%
1.1%
1.1%
1.2%
1.4%
1.4%
1.5%
1.7%
2.1%
2.2%
2.6%
5.0%
6.3%
7.0%
Italy
Japan
Canada
Germany
Brazil
France
Mexico
United Kingdom
Russia
South Korea
Australia
United States
Indonesia
China
India
2019 GDP Growth Forecast (%)
Revenge of the developed economies?
Source: Oxford Economics
Emerging markets Developed markets
Source: Oxford Economics

Real estate funds are sitting on a record amount of dry powder
Largest holders of dry powder
Rank Firm name
Dry powder
($USm)
1 Blackstone Group $ 31,938.85
2 Lone Star Funds $ 16,844.80
3 Brookfield Asset Management $ 15,435.83
4 Starwood Capital Group $ 7,396.31
5 The Goldman Sachs Group $ 6,517.43
6 GLP $ 6,061.12
7 Carlyle Group $ 5,176.04
8 Rockpoint Group $ 4,424.92
9 Cerberus Capital Management $ 4,322.16
10 LaSalle Investment Management $ 3,645.12
Source: Preqin
$-
$50
$100
$150
$200
$250
$300
$350
Dry powder: closed-end private real estate funds by geographic focus ($USb)
North America Europe Asia ROW

2018 volumes decreased, spreads continue to tighten
► 2019 volume through mid
May is on pace with 2018
volumes.
► Tight spreads in
issuances are causing
CMBS to be competitive
with banks.
► Market has adjusted to
risk retention rules and
interest rate volatility.
Source: Commercial RE Finance Council, Morgan Stanley, EY
$45
$82 $90
$95
$37
$47
$77
$24
2012 2013 2014 2015 2016 2017 2018 2019 (asof 19May)
US CMBS Issuance $USb
Source: Commercial RE Finance Council
Source: Commercial RE Finance Council, JP Morgan, EY
0
100
200
300
400
500
600
700
800
900
4/13/2012 4/13/2013 4/13/2014 4/13/2015 4/13/2016 4/13/2017 4/13/2018 4/13/2019
CMBS spreads over treasuries
10-year Treasurys Aaa/AAA Aa2/AA A2/A Baa3/BBB-

… but new rules for HVCRE loans may have reduced overbuilding
► The 2015 HVCRE rule effectively raised the capital reserve
requirement for qualifying acquisition, development and construction
loans from 8% of the value of the loans to 12% or a 150% risk
weighting.
► At the end of 2017, construction loans accounted for just 1.94% of the
industry’s total assets, down from nearly 5% a decade ago.
► The Economic Growth, Regulatory Relief and Consumer Protection
Act of 2017 reduces the burden on smaller lenders from some of the
toughest requirements of the Dodd-Frank Act, such as the Volcker
Rule.
► It clarifies the widely criticized High Volatility Commercial Real Estate
(HVCRE) rule, which was first introduced as part of Basel III
regulations.

US economy: the glass is half empty
► Will Goldilocks economy end?
► Stocks are trading at 30.1x earnings,
which is above long-term historic
multiples 17.2x
► Is there a bubble in tech?
► Effect of tax policy still uncertain
► Emerging market growth moderate
► Real wage/income inequality
► Interest rate increases could
destabilize stock and real estate
pricing
► Geopolitical instability and war
► Student debt crisis
► 2020 Election

Frothy market multiples need increased earnings
Source: SNL Financial Source: ThomsonOne
30.1
17.2
0
5
10
15
20
25
30
35
40
45
50
1/1
/18
72
1/1
/18
78
1/1
/18
84
1/1
/18
90
1/1
/18
96
Jan
-02
Jan
-08
Jan
-14
Jan
-20
Jan
-26
Jan
-32
Jan
-38
Jan
-44
Jan
-50
Jan
-56
Jan
-62
Jan
-68
Jan
-74
Jan
-80
Jan
-86
Jan
-92
Jan
-98
Jan
-04
Jan
-10
Jan
-16
Jan
-19
Shiller PE Ratio
PE Ratio Long term average
-10
0
10
20
30
40
50
60
70
Broad market indices – price change (%)
DJIA S&P 500 NASDAQ

Advantages of globalization overshadowed by negative consequences …
10 years after crisis –
repercussions are still
present in many countries
Labor market threats –
outsourcing and modern
tech
Volatility of stock markets,
oil prices and currencies $ Migration issues in Europe
and the US
Fragile security – cyber
crime and terrorism
Increase of wealth inequality
despite global growth

China the Seller
Source: US Treasury, Real Capital Analytics
RE deal value
2017 – decline of 64% y-o-y
2018 – increase of 7% y-o-y
$0
$200
$400
$600
$800
$1,000
$1,200
$1,400
$0
$5
$10
$15
$20
$25
2010 2011 2012 2013 2014 2015 2016 2017 2018 2019 1Q
China investment in the US real estate and treasuries
RE deal value - $Usb 12 mo avg treasuries holdings - $USt (RHS)

Trade war is escalating …
The US trade war with China continues.
Source: Oxford Economics
Jan-18 Apr-18 Jul-18 Oct-18 Jan-19 Apr-19
Trump imposes tariffs on washing
machines and solar panels
Trump orders tariffs on steel and
aluminum imports
Trump plans for 25% tariffs on $50b of Chinese imports
China plans retaliatory tariffs on $50b of US imports
US sets date for 25% tariffs on $34b of Chinese imports. China responds
Trump threatens tariffs on $267b more of Chinese imports
US implements 10% tariffs on $200bn of Chinese imports. China responds.
US and China agree on a 90 day halt to new
tariffs
Trump extends the 1 March deadline,
leaving tariffs on $200b of Chinese goods at
10%
Trump tweets that he intends to raise tariffs on $200b of Chinese
goods to 25%
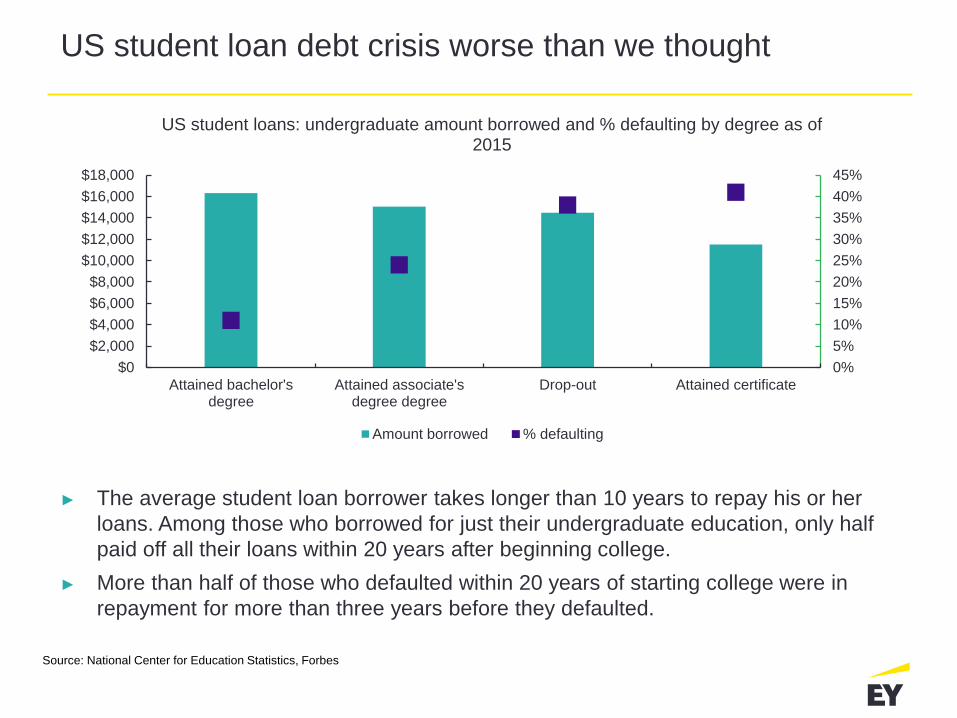
US student loan debt crisis worse than we thought
► The average student loan borrower takes longer than 10 years to repay his or her
loans. Among those who borrowed for just their undergraduate education, only half
paid off all their loans within 20 years after beginning college.
► More than half of those who defaulted within 20 years of starting college were in
repayment for more than three years before they defaulted. Source: National Center for Education Statistics, Forbes
0%
5%
10%
15%
20%
25%
30%
35%
40%
45%
$0
$2,000
$4,000
$6,000
$8,000
$10,000
$12,000
$14,000
$16,000
$18,000
Attained bachelor'sdegree
Attained associate'sdegree degree
Drop-out Attained certificate
US student loans: undergraduate amount borrowed and % defaulting by degree as of 2015
Amount borrowed % defaulting
Source: National Center for Education Statistics, Forbes

Are higher interest rates and affordability affecting existing home sales?
Source: National Association of Realtors
4.0
4.2
4.4
4.6
4.8
5.0
5.2
5.4
5.6
5.8
Ja
n-1
2
Apr-
12
Ju
l-1
2
Oct-
12
Ja
n-1
3
Apr-
13
Ju
l-1
3
Oct-
13
Ja
n-1
4
Apr-
14
Ju
l-1
4
Oct-
14
Ja
n-1
5
Apr-
15
Ju
l-1
5
Oct-
15
Ja
n-1
6
Apr-
16
Ju
l-1
6
Oct-
16
Ja
n-1
7
Apr-
17
Ju
l-1
7
Oct-
17
Ja
n-1
8
Apr-
18
Ju
l-1
8
Oct-
18
Ja
n-1
9
Apr-
19
Annualized existing single family home sales (seasonally adjusted in millions)

Lack of inventory in some markets has negatively affected home sales
► Due to
relatively
limited
housing
supply, home
prices are on
the rise.
► US inventory
has inched up
to 5.9 months
in April 2019
from low of 4.0
in January
2013.
Source: US Federal Reserve, Redfin
0.0
1.0
2.0
3.0
4.0
5.0
6.0
7.0
8.0
Jan
-12
Ap
r-12
Jul-
12
Oct-
12
Jan
-13
Ap
r-13
Jul-
13
Oct-
13
Jan
-14
Ap
r-14
Jul-
14
Oct-
14
Jan
-15
Ap
r-15
Jul-
15
Oct-
15
Jan
-16
Ap
r-16
Jul-
16
Oct-
16
Jan
-17
Ap
r-17
Jul-
17
Oct-
17
Jan
-18
Ap
r-18
Jul-
18
Oct-
18
Jan
-19
Ap
r-19
US single family housing supply (in months)
US LA Phoenix SF

Price growth has slowed, but housing still isn’t cheap
Source: S&P Dow Jones Indices LLC.
-25%
-20%
-15%
-10%
-5%
0%
5%
10%
15%
20%
Ja
n-0
8A
pr-
08
Ju
l-0
8O
ct-
08
Ja
n-0
9A
pr-
09
Ju
l-0
9O
ct-
09
Jan-1
0A
pr-
10
Ju
l-1
0O
ct-
10
Ja
n-1
1A
pr-
11
Ju
l-1
1O
ct-
11
Ja
n-1
2A
pr-
12
Ju
l-1
2O
ct-
12
Ja
n-1
3A
pr-
13
Ju
l-1
3O
ct-
13
Ja
n-1
4A
pr-
14
Jul-14
Oct-
14
Ja
n-1
5A
pr-
15
Ju
l-1
5O
ct-
15
Ja
n-1
6A
pr-
16
Ju
l-1
6O
ct-
16
Ja
n-1
7A
pr-
17
Ju
l-1
7O
ct-
17
Ja
n-1
8A
pr-
18
Ju
l-1
8O
ct-
18
Ja
n-1
9
Case Shiller Home Price Indices YOY % change
10 City Composite Intex 20 City Composite Index

Will baby boomers define real estate market dynamics?
32 million Total homes owned
by BBs
Key facts
Constitutes 40% of total homes
in the country
US$13.4
trillion in value (includes
14 million homes of
silent generation)
Scenario 1
Baby boomers stick to their old
homes
► Housing shortage, triggering price
increases
► Demand for home improvement
products and services
► Demand for new technology in terms
of media, flex rooms-libraries
Scenario 2
Baby boomers sell their homes
and move to smaller homes or
relocate to other cities
► High inventory creating oversupply
► Millennials’ low appetite for homes may
impact prices negatively in some
markets
► Trigger-health issues and death
► As per Fannie Mae, 10.5m owners will
sell during 2016 to 2026. 13.1m owners
will sell during 2026 to 2036
Source: CBS News.com, Washington Post .

Real estate priced to perfection … or beyond
-50%
-40%
-30%
-20%
-10%
0%
10%
20%
30%
40%
40
50
60
70
80
90
100
110
120
130
140
Jan-0
7
Ma
y-0
7
Sep-0
7
Jan-0
8
Ma
y-0
8
Sep-0
8
Jan-0
9
Ma
y-0
9
Sep-0
9
Jan-1
0
Ma
y-1
0
Sep-1
0
Jan-1
1
Ma
y-1
1
Sep-1
1
Jan-1
2
Ma
y-1
2
Sep-1
2
Jan-1
3
Ma
y-1
3
Sep-1
3
Jan-1
4
Ma
y-1
4
Sep-1
4
Jan-1
5
Ma
y-1
5
Sep-1
5
Jan-1
6
Ma
y-1
6
Sep-1
6
Jan-1
7
Ma
y-1
7
Sep-1
7
Jan-1
8
Ma
y-1
8
Sep-1
8
Jan-1
9
Green Street Advisors Commercial Property Price Index vs Premium/Discount to NAV Jan 07- Apr 19
GSA CPPI (L)
GSA Premium/Discount to NAV (R)
Green Street Advisors Commercial Property Price Index is indexed to 100 in August 2007.

But there are stark contrasts in REIT share values across property types
Revenge of the Denominator: Since 2012, the link between sector risk and broader
market trends has broken down. Instead, REITs have become hypersensitive to interest
rates. Sectors that have long lease lives have been the riskiest, even as the most
economically sensitive sector – lodging – has been a safe haven.
Source: Green Street Advisors
-40%
-30%
-20%
-10%
0%
10%
20%
30%
40%
Premium/discount to NAV by property type
Apartment Industrial Mall Office Health Care

RE outperforming broad markets
Source: NAREIT
13.50%
10.35%
18.70%
15.48%
-10%
-5%
0%
5%
10%
15%
20%
25%
30%
35%
40%
45%
Performance: Real Estate vs. Broader Markets Annual % Change
S&P 500 Dow Jones FTSE/NAREIT All REIT NASDAQ

What’s next?

Average current and target allocations to real estate by investor type
Source: Preqin
9.8%
8.2% 7.8%
7.0%
5.9%
6.7%
10.4% 10.4%
12.4%
8.7%
7.8%
8.9%
Public PensionFund
Private SectorPension Fund
SovereignWealth Fund
EndowmentPlan
Foundation InsuranceCompany
Institutional investors’ mean current and target allocations to real estate by investor type
Current Allocation Target Allocation

“Haves” “Rising Markets” “Obsolete”
► Redevelopment
opportunities in the top
15 markets
► 90%+ leased with
limited roll over next
three years
► Assets with good
“current yield”
► Trophy assets
► “Core” investments
► A & B+ quality assets
► Strong development
sites
► Strong value-add play
opportunities
► Infill projects that need
development
► Strong economic drivers
or growth potential
► Diverse business base
► B+ & C quality assets
► Secondary markets
► Attractive risk-adjusted
returns
► Price and yield
advantages
► Development in all
product categories
► Significant rollover or
lease up over next two
years
► Mixed use development
► Tertiary markets
► Certain types of
buildings are becoming
functionally obsolete
► Poor quality assets with
no foreseeable
turnaround
► Shallow tenant pool
► B malls
► Large suburban office
campuses
► Under 25’ ceiling height
industrial
► Big box retail
► Apparel retail
Source: Eastdil Secured; REIS; CBRE;CCIM
Is there more risk in core assets than rising assets?

Property sector fundamentals: office
Top markets by rent increases: office
1Q 19 vacancy rate
1Q 19 vacancy rate
change y-o-y (bps)
1Q 19 rent
change y-o-y
Tampa-St. Petersburg 17.1% 20 3.8%
Raleigh-Durham 14.8% -20 3.7%
Austin 13.2% 40 3.6%
Orange County 16.3% 80 3.6%
Portland 13.2% 50 3.5%
Seattle 10.2% -40 3.2%
Nashville 13.6% 40 3.2%
San Jose 17.7% 20 2.9%
Denver 16.8% -70 2.9%
Colorado Springs 20.6% 50 2.9%
US 16.6% 10 2.2%
Source: Reis
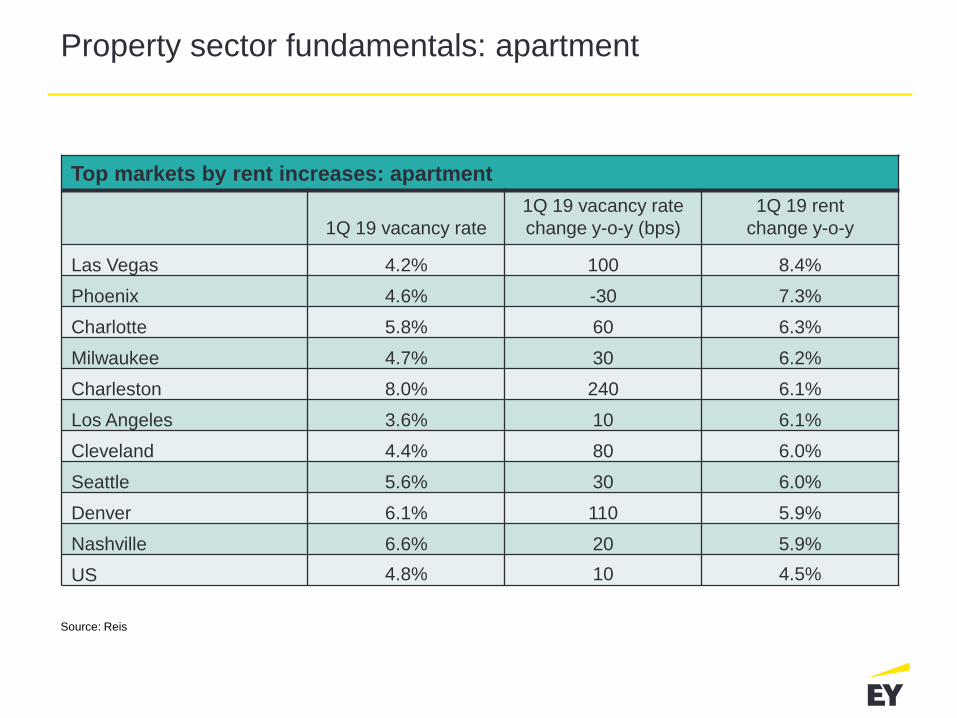
Property sector fundamentals: apartment
Top markets by rent increases: apartment
1Q 19 vacancy rate
1Q 19 vacancy rate
change y-o-y (bps)
1Q 19 rent
change y-o-y
Las Vegas 4.2% 100 8.4%
Phoenix 4.6% -30 7.3%
Charlotte 5.8% 60 6.3%
Milwaukee 4.7% 30 6.2%
Charleston 8.0% 240 6.1%
Los Angeles 3.6% 10 6.1%
Cleveland 4.4% 80 6.0%
Seattle 5.6% 30 6.0%
Denver 6.1% 110 5.9%
Nashville 6.6% 20 5.9%
US 4.8% 10 4.5%
Source: Reis

Property sector fundamentals: retail
Top markets by rent increases: retail
1Q 19 vacancy rate
1Q 19 vacancy rate
change y-o-y (bps)
1Q 19 rent
change y-o-y
Tacoma 14.0% -100 4.2%
Raleigh-Durham 7.4% -40 3.8%
San Francisco 3.5% 30 3.7%
San Jose 5.5% 30 3.6%
Austin 7.3% 130 3.4%
Orlando 9.6% -100 3.3%
Houston 11.8% 40 2.9%
Columbia 11.5% 120 2.5%
Greensboro/Winston-Salem 10.1% 10 2.4%
Miami 5.9% 10 2.4%
United States 10.2% 20 1.6%
Source: Reis

Although retail continues to grow steadily, not everyone is winning …

Retail is driven by e-commerce and generational change
Source: Euromonitor
Internet retail as % of total
3
1
8
5 4 4
3
0
7
14 13
9 8
7 6
3
11
22
18
15
12 11
8 7
World China UK US Germany Japan Australia India
2010 2015 2020

Retail is changing and getting more complicated
► Alibaba.com
► Asos
► Amazon
► Ocado
► Flipkart
Internet
pure players
► Aldi
► Dollar General
► Dollar Tree
► F21 Red
► Lidl
► Primark
► TJ Maxx
Discount and
off-price
retailers
► Gillette
► Nespresso
► Nike
► P&G
► Unilever
Manufacturers
reaching
directly
to consumers

Disruption is accelerating
Source: Press clippings
Amazon
First online sale
Amazon
One-Click
purchasing
Alibaba Amazon
Prime
1995 1997 1999 2000 2003 2005 2007 2009 2011 2013 2015 2017 2019
Amazon
Prime Air Amazon
Same Day
delivery
Trunk delivery
Prime Day
Dash Button
Brick & Mortar
book store
Asos
Ocado
Zalando AliPay
Amazon Fresh Lidl to open 150
stores the US
Singles Day
Bonobos
Dollar Shave Club
The Honest Co.
P&G e-store
Circuit City
KB Toys
Mammouth
Pay N Save
Entrance
Exit
Amazon
Kiva
Tower
Records
Stern’s
WebVan
Pets.com
Great Mills
Boo.com
Levitz
Friedman’s
Sunflower Market
Franks
Nursery
Walden Books
Virgin
megastores
HMV
Blockbuster
David Morgan
Hancock Fabrics
Sports Authority
BHS
Amazon Go
Crazy Eddie
Schlecker
Comet JJB
Sports
FAO Schwarz
Bottom Dollar Foods
Deb Shop
A&P
Fresh & Easy
Radioshack
Macintosh Retail Group
Sears
Nine West
Mattress Firm
David’s Bridal
Brookstone
Rockport
Claires
Payless
Toys R Us
Diesel
Gymboree

► Use of digital to increase basket size
► Growing proportion of mobile-based digital orders
► Growth of “online” as primary shopping channel
1:1 customer
relationships
Store as theatre
Home not shelf
Solution and product
Blurring physical
and digital
Going forward retail revolution offers business opportunities for the ones able to adapt keep
Themes Trends Leaders
► Innovation among retailers to win customers
► Increasing own brand penetration
► Greater interaction between retailers and
CP companies
► Shift in fulfillment
► Growth of independent shipping services to
homes
► Shifting towards experiential
selling/complimentary services
► Pop-up stores positioning their activity around
holiday/events
► Trend toward a “segment of one”
► Growth of 3D printing
► Differentiation in offerings to high-value/
loyal customers
► Carrefour
► Walmart
► Amazon
► Trader’s Joe
► Nespresso
► Instacart
► Ikea
► Burberry
► Lidl ski pop-up
► Stitch Fix
► Shoes of Prey
► Nordstrom

Property sector fundamentals: industrial
Top markets by rent increases: industrial
1Q 19 vacancy rate
1Q 19 vacancy rate
change y-o-y (bps)
1Q 19 rent
change y-o-y
Sacramento 6.4% -70 4.2%
Portland 4.8% -140 3.7%
Orlando 7.6% 90 3.7%
Fort Worth 7.4% -160 3.6%
Dallas 10.0% -20 3.6%
Phoenix 6.8% -160 3.6%
Denver 5.1% -60 3.5%
Chicago 7.5% -50 3.5%
San
Bernardino/Riverside 4.8% -110 3.5%
Orange County 1.9% 30 3.3%
US 6.8% -30 2.9%
Source: Reis
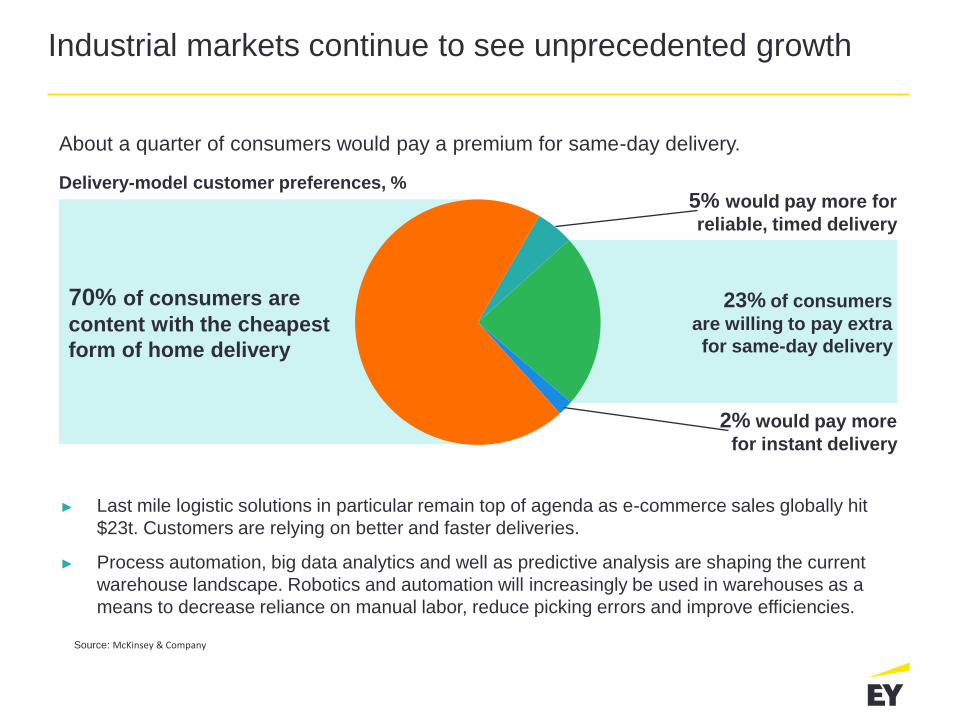
Industrial markets continue to see unprecedented growth
► Last mile logistic solutions in particular remain top of agenda as e-commerce sales globally hit
$23t. Customers are relying on better and faster deliveries.
► Process automation, big data analytics and well as predictive analysis are shaping the current
warehouse landscape. Robotics and automation will increasingly be used in warehouses as a
means to decrease reliance on manual labor, reduce picking errors and improve efficiencies.
About a quarter of consumers would pay a premium for same-day delivery.
Delivery-model customer preferences, %
23% of consumers
are willing to pay extra
for same-day delivery
70% of consumers are
content with the cheapest
form of home delivery
5% would pay more for
reliable, timed delivery
2% would pay more
for instant delivery
Source: McKinsey & Company

Hotels at a glance
Source: Green Street Advisors, Company Reports
1Q, 22%
2Q, 27% 3Q, 26%
4Q, 24%
Revenue seasonality
1.8%
1.1%
1.8%
4.3%
-1.0%
4.3%
1.3%
1.9%
H MAR HLT SHO HST PEB RLJ
1Q 19 YOY RevPAR Growth
C-Corps REITs Average

New lease accounting rules may impact corporate real estate strategy
► In February 2016, The Financial Accounting Standards Board issued final
guidance that will require lessees to put most leases on their balance sheets
but recognize expenses on their income statements in a manner similar to
today’s accounting.
► The new standard should be a catalyst for organizations to revisit their
corporate real estate strategy.
$-
$1,000
$2,000
$3,000
$4,000
$5,000
$6,000
$7,000
$8,000
$9,000
2010 2011 2012 2013 2014 2015 2016 2017 2018 2019 (31May)
Single tenant, owner occupied trransactions ($M)

Will WeWork’s IPO change real estate?
► Only four IPOs in 2018 – three are non-traditional.
► Only the traditional REIT is trading below issue price.
Source: SNL Financial
75
100
125
150
175
200
225
1 71
31
92
53
13
74
34
95
56
16
77
37
98
59
19
71
03
109
115
121
127
133
139
145
151
157
163
169
175
181
187
193
199
205
211
217
223
229
235
241
247
253
259
265
271
277
283
289
295
301
307
313
319
325
331
337
343
349
Number of trading days since IPO
2018-19 US REIT IPO Performance
Inustrial Logistics Properties (trad.) Americold (non-trad.)
Vici Properties (non-trad.) Essential Properties Realty Trust (non-trad.)

Nontraditional REITs have grown rapidly
► New frontier of nontraditional REITs is in small cell and fiber optic REITs.
► Recent conversions and spin-offs include Windstream (telco), MGM Resorts (gaming/lodging),
Gaming and Leisure Properties (gaming and lodging), Iron Mountain (document storage) and
CBS Outdoor (billboards), Four Corners Property Trust (restaurants)
► Hudson’s Bay entered into a JV partnership with Simon Properties that involved a sale-
leaseback.
► As part of the deal, the Bob Evans restaurant chain entered a similar sale-leaseback deal with
non-traded REIT Broadstone Net Lease. Source: SNL Financial
$-
$100
$200
$300
$400
$500
$600
2010 2011 2012 2013 2014 2015 2016 2017 2018 2019
Market Cap (US$b) Golf Course
Land
Energy Infrastructure
Prison
Student Housing
Specialty
Advertising
Casino
Single Family
Manufactured Home
Timber
Self-Storage
Data Center
Health Care
Communications
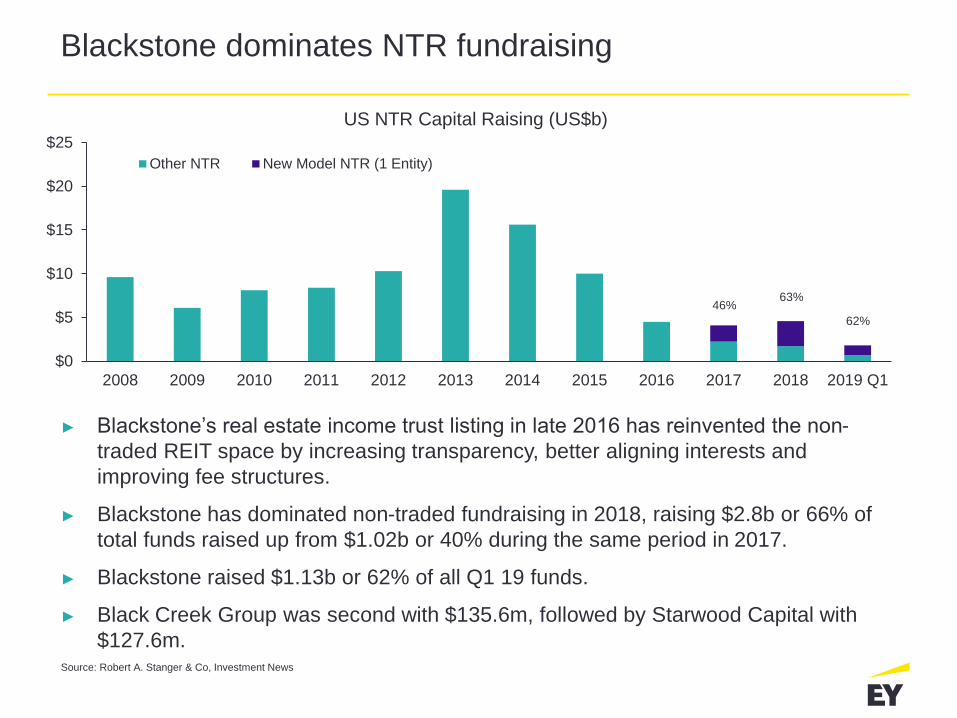
Blackstone dominates NTR fundraising
► Blackstone’s real estate income trust listing in late 2016 has reinvented the non-
traded REIT space by increasing transparency, better aligning interests and
improving fee structures.
► Blackstone has dominated non-traded fundraising in 2018, raising $2.8b or 66% of
total funds raised up from $1.02b or 40% during the same period in 2017.
► Blackstone raised $1.13b or 62% of all Q1 19 funds.
► Black Creek Group was second with $135.6m, followed by Starwood Capital with
$127.6m.
Source: Robert A. Stanger & Co, Investment News
46% 63%
62%
$0
$5
$10
$15
$20
$25
2008 2009 2010 2011 2012 2013 2014 2015 2016 2017 2018 2019 Q1
US NTR Capital Raising (US$b)
Other NTR New Model NTR (1 Entity)

The road ahead – real estate is priced to perfection
► Will this Goldilocks economy end?
► Be prepared for inflation, and how do we measure inflation?
► Has the inverted yield curve foretold an upcoming recession? How
much will gas prices negatively impact the economy?
► Multifamily will continue to grow.
► Single family housing has limited new supply leading to lower sales
leading to a good environment for homebuilders.
► RE looks like a safe position compared to S&P and NASDAQ.
► Technology companies look overpriced.

Questions

Disclaimer
• EY refers to the global organization, and may refer to one or more, of the member firms of
Ernst & Young Global Limited, each of which is a separate legal entity. Ernst & Young LLP is a client-
serving member firm of Ernst & Young Global Limited operating in the U.S.
• This presentation is © 2019 Ernst & Young LLP. All rights reserved. No part of this document may be
reproduced, transmitted or otherwise distributed in any form or by any means, electronic or
mechanical, including by photocopying, facsimile transmission, recording, rekeying, or using any
information storage and retrieval system, without written permission from Ernst & Young LLP. Any
reproduction, transmission or distribution of this form or any of the material herein is prohibited and is
in violation of US and international law. Ernst & Young LLP expressly disclaims any liability in
connection with use of this presentation or its contents by any third party.
• Views expressed in this presentation are those of the speakers and do not necessarily represent the
views of Ernst & Young LLP.
• This presentation is provided solely for the purpose of enhancing knowledge on tax matters. It does
not provide tax advice to any taxpayer because it does not take into account any specific taxpayer’s
facts and circumstances.
• These slides are for educational purposes only and are not intended, and should not be relied upon,
as accounting advice.

EY | Assurance | Tax | Transactions | Advisory
About EY
EY is a global leader in assurance, tax, transaction and advisory
services. The insights and quality services we deliver help build trust
and confidence in the capital markets and in economies the world
over. We develop outstanding leaders who team to deliver on our
promises to all of our stakeholders. In so doing, we play a critical role
in building a better working world for our people, for our clients and
for our communities.
EY refers to the global organization, and may refer to one
or more, of the member firms of Ernst & Young Global Limited,
each of which is a separate legal entity. Ernst & Young
Global Limited, a UK company limited by guarantee, does not
provide services to clients. For more information about our
organization, please visit ey.com.
Ernst & Young LLP is a client-serving member firm of
Ernst & Young Global Limited operating in the US.
© 2019 Ernst & Young LLP.
All Rights Reserved.
Score: 04426-181US
ED None
This material has been prepared for general informational purposes
only and is not intended to be relied upon as accounting, tax or other
professional advice. Please refer to your advisors for specific advice.
ey.com