Embed Size (px)
Citation preview
Economic and Policy Issues in LivestockService Delivery to the Poor
Background paper for the FAO project memorandum “Pro-Poor Livestock PolicyInitiative: Fostering the Policy Dialogue in Support of Equitable, Safe and Clean
Livestock Farming”.
Vinod Ahuja*
Elizabeth Redmond
May 2001
* Vinod Ahuja is a faculty member at the Centre for Management in Agriculture, Indian Institute ofManagement, Ahmedabad. Elizabeth Redmond is a consultant at the Livestock Information, SectorAnalysis and Policy Branch, FAO, Rome. This paper was prepared during Vinod Ahuja’s visit to FAO inApril-May 2001. We sincerely acknowledge the inputs received from Henning Steinfeld and JoachimOtte on the previous draft of this paper.
Address for correspondence: (i) Prof. Vinod Ahuja, Centre for Management in Agriculture, IndianInstitute of Management, Vastrapur, Ahmedabad. Tel: +91-79-6324856 (O): +91-79-6305457, +91-79-6325006 (H); Email: [email protected] , (ii) Elizabeth Redmond, Consultant, Food andAgriculture Organization of the United Nations, Rome, Italy, email: [email protected]
1
Economic and Policy Issues in Livestock ServiceDelivery to the Poor
Introduction
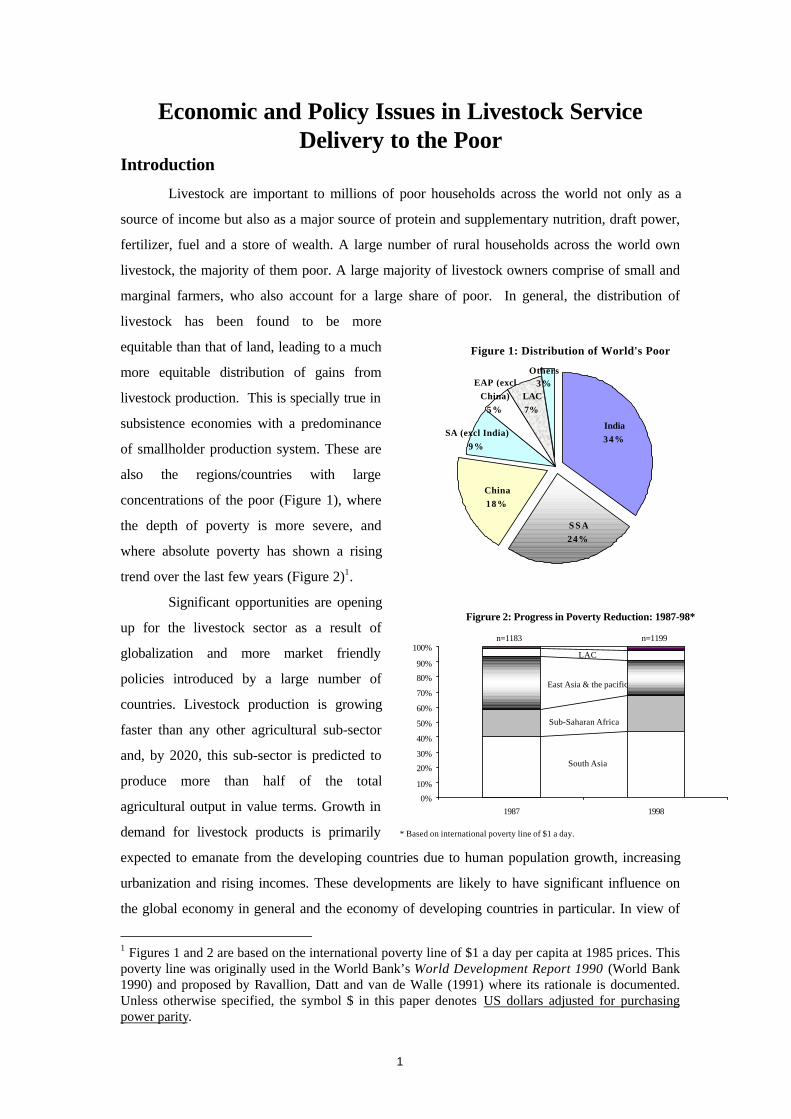
Livestock are important to millions of poor households across the world not only as a
source of income but also as a major source of protein and supplementary nutrition, draft power,
fertilizer, fuel and a store of wealth. A large number of rural households across the world own
livestock, the majority of them poor. A large majority of livestock owners comprise of small and
marginal farmers, who also account for a large share of poor. In general, the distribution of
livestock has been found to be more
equitable than that of land, leading to a much
more equitable distribution of gains from
livestock production. This is specially true in
subsistence economies with a predominance
of smallholder production system. These are
also the regions/countries with large
concentrations of the poor (Figure 1), where
the depth of poverty is more severe, and
where absolute poverty has shown a rising
trend over the last few years (Figure 2)1.
Significant opportunities are opening
up for the livestock sector as a result of
globalization and more market friendly
policies introduced by a large number of
countries. Livestock production is growing
faster than any other agricultural sub-sector
and, by 2020, this sub-sector is predicted to
produce more than half of the total
agricultural output in value terms. Growth in
demand for livestock products is primarily
expected to emanate from the developing countries due to human population growth, increasing
urbanization and rising incomes. These developments are likely to have significant influence on
the global economy in general and the economy of developing countries in particular. In view of
1 Figures 1 and 2 are based on the international poverty line of $1 a day per capita at 1985 prices. Thispoverty line was originally used in the World Bank’s World Development Report 1990 (World Bank1990) and proposed by Ravallion, Datt and van de Walle (1991) where its rationale is documented.Unless otherwise specified, the symbol $ in this paper denotes US dollars adjusted for purchasingpower parity.
Figure 1: Distribution of World's Poor
India34%
S S A24%
China18%
SA (excl India)9%
EAP (excl China)
5%LAC7%
Others3%
0%
10%
20%
30%
40%
50%
60%
70%
80%
90%
100%
1987 1998
South Asia
Sub-Saharan Africa
East Asia & the pacific
LAC
n=1183 n=1199
Figrure 2: Progress in Poverty Reduction: 1987-98*
* Based on international poverty line of $1 a day.
2
these developments, the process has been described as the ‘livestock revolution’ (Delgado et al,
1999).
These developments present enormous opportunity for developing countries to boost
rural incomes and accelerate the pace of poverty reduction. However, this requires a policy
regime that facilitates growth in productivity at the farm level as well as in the processing sector.
The productive potential of animals depends crucially on the quality of nutrition, genetic material
and health status, and these in a large number of developing countries continue to be poor.
While the unfolding of the livestock revolution is likely to result in a rapid increase in the
demand for quality livestock services, the policies and institutions in a number of countries are
not geared up to meeting that challenge. There are no mechanisms in place to identify the
constraints to livestock production, the service needs of poor livestock keepers and the ways and
means to deliver them at minimum cost. The policy priorities and directions for service delivery
often get determined by the biases and beliefs of the decision makers. While those trained in
veterinary science argue that it is poor animal health which is the main constraint to livestock
production, the nutritionists point to the poor availability of feed and fodder, and the breeders to
poor genetics.
There is a whole range of services that are needed to enhance the capacity of poor
households to exploit the full potential of livestock production. These include health and
production services such as clinical care, preventive health and provision of pharmaceutical
supplies, feed and fodder supply, artificial insemination, livestock research and extension, and
other market services such as credit, livestock insurance, delivery of market information, output
marketing and milk collection (see Appendix 2 for a classification of livestock services). Good
support services are critical for enhancing livestock productivity and for enabling the poor to gain
access to expanding markets (see Boxes 1 and 2). This paper reviews the economic framework
and the context for livestock service delivery and raises some issues for efficient delivery of these
services to the poor.
The economic framework
Farmers make economic decisions. The first principles of economics must therefore be
the point of departure in thinking about the most efficient way of organising livestock service
delivery. The first fundamental theorem of welfare economics states that ‘if (i)

3
Box 1: Market information has an empowering role
I always sell eggs to middlemen. Before, whatever prices they offered I accepted becauseI had no idea of the going prices. Last week the middleman came and wanted to pay me 12 taka fora hali (four units). Keeping him waiting, I rushed to check the prices on the village phone—a haliwas selling for 14 takas in nearby market. I came back and refused to sell, and after some hagglingwe agreed on 13 taka a hali.
Kalima Khatuun, village woman, Bangladesh
Source: Narayan and Shah, 2000.
4
there are no externalities, (ii) both buyers and sellers have symmetric information, (iii) there are
no increasing returns to production, (iv) all buyers and sellers take prices as given (that is, no one
has any market power), and (v) there are no transaction costs, then the competitive equilibrium is
pareto-efficient2. This result significantly influenced early thinking on the delivery of livestock
health services (Umali et al, 1992; FAO, 1998) which, in turn, drove the policy for delivery of
veterinary services in many countries around the world in the eighties and the nineties.
The first fundamental theorem is a useful starting point when thinking about the
2 It is important to understand the assumptions underlying this theorem to appreciate its strengths andlimitations. A more detailed explanation of the concepts such as externalities, asymmetric information,
Box 2: Extension for poultry and small ruminants has a large pay-off
“Backyard” poultry comprising of small flocks of birds which are reared inside the familyhousehold, as scavengers either for the family needs of eggs and meat, or generation of smallcash income are important for poor in many parts of the world. Despite their important role inegg and meat production, they have not received adequate attention. These birds seldom receiveproper feed, and health coverage against infectious diseases, which results in huge economiclosses. Kelly et al (1994) reported 25% mortality in rural household chickens kept inChitungwiza, an urban centre in Zimbabwe. Shakir et al (1999) found a mortality rate of(13.5±15%) in Pakistan. One of the reasons for lower production, poor management, and healthcoverage and severe losses could be poor know-how and lack of health and extension services tothe farmers.
Recognising the need to increase rural household chicken production as one of the means ofalleviating poverty, a team of Female Livestock Extension Workers (FLEWs) was formed andequipped with skills in various disciplines of livestock production activities to help the poor andsubsistence female farmers in North West Frontier Province of Pakistan (NWFP). The primaryaim of this initiative was to enable the farmers to increase their household income throughincreased livestock productivity. These extension workers provided training to female farmersregarding backyard chicken production, breeding, care of the newly hatched chicks, housing,feeding, disease prevention, hygienic measures, control of external and internal parasites, eggselection and storage, hatchability of eggs, selection and culling of birds, provision of vaccinesand other medicines and development of linkages with the agencies and Livestock and Dairydevelopment Department of the Government of NWFP. The FLEWs were trained to work forvertical expansion of the backyard chicken system taking account of the limited resources of thefarmers. For example in the case of the farmers who were buying broken rice from the market fornewly hatched chicks, it was suggested they should buy chick starter feed in amounts equivalent incost to what was paid for broken rice, so as to ensure better growth and development of thechicks. However, for those farmers who wished to make more drastic changes to improveproduction then they were guided as to appropriate inputs. No extra inputs were provided in termsof birds.
An impact assessment study undertaken to evaluate the effectiveness of farmer training found asignificant increase in the flock size maintained by the households who participated in the trainingprogram. Training also had a positive effect on egg production, hatchability, reduction inmorbidity and mortality.
Source: Farooq, et al, 2000.

5
framework. However, if any of its conditions are violated, ‘market failure’ occurs resulting in
efficiency loss. In that case a set of mechanisms is needed to correct the market failure or to find
alternative models for organising the activity. The literature on livestock health services has
recognised the sources of market failure – specially public goods and externalities, and moral
hazard. Umali, Feder and de Haan (1994), for example, categorically stated that, “In determining
the appropriate channel for delivery of services, it is necessary to classify each service on the
basis of its public and private good character, while taking into account any externalities, moral
hazard problems, or free rider problems that may accompany the production or consumption of
the service”. Based on these characteristics, they suggested the classification and sectoral delivery
of livestock health and production services as given in Appendix 3. The table classifies clinical
diagnosis and treatment, production and distribution of vaccines and other veterinary supplies as
pure private goods which do not involve any externalities or moral hazard problems. These can,
therefore, most efficiently be supplied by the private sector. Services such as veterinary
surveillance, research and extension, on the other hand, have a significant public good component
and should remain the responsibility of public sector. Using the same principles, FAO (1998)
suggested the following responsibility of public and private sector for delivery of animal health
services
Public sector: ensuring the health of the national herd including disease surveillance, compliancemonitoring, quarantine, quality control of remedies and vaccines, planning for emergencies andreporting to international bodies and neighbouring countries; oversight of food safety, import andexport inspection and certification according to international standards; regulation, monitoring andsupport of other partners in the animal health care system; accreditation of personnel; creation ofan enabling environment for the private sector; and general formulation of livestock developmentpolicy.
Private sector: clinical diagnosis and treatment; production and distribution of remedies andvaccines; artificial insemination; management of herd health and production programmes;marketing livestock and products; and others.
Shared responsibility: disease diagnosis and reporting; compulsory testing; accreditation; tickand tsetse fly control; food hygiene and inspection; continuing education and training; diagnosticsupport; animal welfare; notifiable disease control; disease emergency response; zoonosis control;research; and advice and extension. Market efficiency and information: The first fundamental theorem requires that both buyers and
sellers know and do not know the same things. This assumption is obviously violated in the case
of a number of livestock services. The service provider has significantly more information than
the user and there are incentives to exploit the rents to that information.
Asymmetry of information can lead to two types of market failures—moral hazard, and
adverse selection. Although Umali et al (1994) and others recognized the problem of moral
and pareto-efficiency is given in Appendix 1.
6
hazard, according to them this problem was likely to be limited to functions such as food
hygiene/inspection and drug quality control. It appears, however, that the problem of information
asymmetry is much more general than perceived by them.
Both moral hazard and adverse selection can be analyzed within the ‘principal agent
framework’. The principal-agent framework deals with the problem in which one party (the
principal) hires another party (the agent) to accomplish a certain task but the agent has some
informational advantage. In the patient-doctor relationship, for example, the patient (the principal)
hires the doctor (the agent) to cure an ailment but has no mechanism to monitor whether the
doctor is acting in the best interest of the patient. A moral hazard problem can arise if the doctor
exploits the informational advantage for his own benefit. For example, if the patient can not
distinguish between an active and inactive vaccine, the doctor can easily administer the inactive
vaccine3. Similarly, the doctor could easily over provide the medical service in order to maximise
his own income4. A number of principal-agent relationships can be identified in livestock service
delivery, and it is the poor who are often at an information disadvantage. The adverse selection
problem arises when the agent can not distinguish between a high and low quality service
provider. In this case poor quality agents drive out the better quality agents and the market
achieves the equilibrium in which there is predominance of low quality agents/service providers.
The principal agent problem can be solved in many ways—optimal contract design5,
repeated interaction between principal and the agent, sanctioning systems, social and moral
norms, and so on. More importantly, however, the problem of information asymmetry underlines
the importance of strong institutional mechanisms for regulating behaviour, enforcement of
ethics, and regular dissemination of information to minimise the information asymmetry. In the
case of livestock health services, for example, Ly (2000) observes that “If left alone, the market
for veterinary services in Senegal would evolve toward a typical lemons market where only low
quality services would be demanded6. This would create a sub-optimal situation for herders,
providers and society (p.229).” He further notes, “the challenge faced by the privatization of
veterinary services delivery systems in Senegal is in the urgency of strengthening the
3 Indeed, a recent study of drug supply in Kenya found that nine out of 21 anthelmintics, obtained fromlocal pharmacies and merchants, did not contain any active ingredient (Monteiro, AM et al 1998;quoted in Schillhorn van Veen, 1999).
4 This problem has been studied under what has come to be known as physician inducement theory.
5 Contract theory provides useful insights regarding which type of contracts would be appropriate undervarious types of asymmetries and institutional environments. Discussion on various contract types ishowever not within the scope of this paper.
6 Akerlof (1970) introduced the term ‘lemon market’ in his seminal paper on quality uncertainty andmarket failure. He used the example of used car market to make the point that since sellers of usedcars have significantly more information and since it is difficult for an average buyer to distinguish
7
transformation process in the subsector so that livestock production and productivity is higher
and veterinary inputs marketing systems are more efficient. Among the prerequisites are the
creation of more suitable and workable organisational arrangements, leading to a new shape of
veterinary input and service delivery with respect to structure, form, quality, and prices (p.259)”.
These arrangements/institutions can take several forms—the producer and consumer
organisation, veterinary associations, etc. All these institutions have the crucial role of educating
service users about service quality and enforcing professional ethics. This also points towards the
need for an effective regulatory and legal framework, and an effective extension service. These
are the public goods that governments will need to provide for proper functioning of the market.
Subcontracting: For the services which must remain the responsibility of governments, it has
been suggested that the efficiency of these services can be significantly enhanced by sub-
contracting the service delivery to private agents. While sub-contracting does have the potential
of yielding some cost savings by circumventing the rigidities and perverse incentives that often
characterise the government delivery systems, there is also the need to ensure that contractual
obligations will be met.
One critical issue in this context is how to ensure public accountability. This can entail
significant costs and there can be real trade-offs between transactions costs to ensure
accountability and the possible gains in efficiency. This is once again a principal-agent problem in
the sense that the government is hiring a private agent to accomplish a certain task. There is
plenty of scope for opportunistic behaviour on the part of the agents.
The problem of opportunism can be minimised through contract design and
administration. That would, however, require defining the quantity and quality of the service as
well as specifying the conditions under which the service will be delivered. And then there is the
issue of contract monitoring and enforcement and the costs associated with this function. It is
much easier to write contracts for services with tangible outputs. Thus, whether the government
chooses to supply the service itself or to sub-contract the delivery would also depend on its
ability to resolve the principal-agent problem which, once again, is a function of the availability of
public goods such as legal framework, institutional structure, and the organisational arrangements.
Competition and market efficiency: The market efficiency argument also rests on the
assumption that both buyers and sellers take prices as given which, in turn, is based on the
assumption of many buyers and sellers in the market. Again, the markets for livestock services
are likely to violate this condition especially in poor remote areas. Whereas it is feasible to
generate some competition among the service providers in high potential high density areas, the
between good and bad cars, only poor quality cars (or the lemons) will be traded in the market.
8
effective aggregate demand in poor marginal areas is often not adequate to support many
providers leading to monopoly situations. In cases where private service providers are contracted
for providing these services in poor areas this problem could be even more serious. While
competitive bidding at short intervals can dissipate the monopoly advantage conferred by
contracts (Leonard 2000), this takes us back to the principal agent problem mentioned earlier
and the role of state in establishing transparent processes and institutional structures to facilitate
efficient functioning of the market.
Given the political economy in many developing countries and the poor record of the
states in providing public goods, it may appear then that the scope for delivering services through
efficient market mechanisms is also limited. The point of the preceding discussion however is to
illustrate that efficient market functioning requires strong institutions and workable organisational
arrangements, and it is therefore not very useful to discuss the economic issues in isolation from
the larger political economy and the issues related to governance. This is one of the areas where
future thinking in livestock service delivery will need to focus.
The equity dimension
The first fundamental theorem of welfare economics is a pure efficiency result. It
completely side-steps the notions of fairness, distribution and equity, and is obviously silent about
the welfare of those who are excluded from the market.
Due to the importance of livestock in supporting the livelihoods of poor farmers
throughout the developing world, and the assumption that the market will exclude poor livestock
keepers due to poor paying capacity, the governments in a large number of countries chose to
build and heavily subsidise large systems and networks for delivering even those services that
could be most efficiently provided through the market. A large number of African and Asian
countries opted for that route. While the deterioration in the fiscal condition of many African
states, as well as deterioration in efficiency due to resource misallocation, forced many African
states to shift the delivery of curative and clinical veterinary services to the private sector, a
number of countries in South Asia continue with the model of state provision of these services.
Recent studies, however, cast doubt on the belief that the poor are not willing or able to
pay for services (See Appendix 1 and Box 3 for a conceptual explanation of the willingness to
pay). In a recent study in Kenya, for example, Heffernan and Misturelli (2000) state that “the
finding indicates that far from being passive recipients, the poor are consumers with the ability to
discern the quality of service offered”. They further add, “It appears that the ability and
willingness to pay for veterinary services is not the primary inhibiting factor to animal healthcare
seeking”. In the context of human health in Africa, Leonard (2001) notes, “...non-governmental

9
organisation (NGO) health services have always provided, and continue to provide, health
services in Africa. Since NGOs charge significant fees and their success is widespread, the failure
of private markets cannot be attributed to a lack of demand”. Similar evidence has recently
become available from other poor regions of the world. Based on a contingent valuation survey
in three states of India, Ahuja et al (2000) concluded that there is significant willingness to pay
for animal health services by all income groups. Indeed, there are cases of successful private
delivery of livestock health and breeding services in some very poor areas of India (Box 4).
A number of studies have also examined the structure of demand for these services
across income groups. In general, these studies do not find the structure to be much different
across poor and non-poor. In a study of the demand for animal health services in Uganda, Koma
(2000) notes that “the effects of herder income and wealth on the demand for animal health
services are so weak as to lack statistical significance in a sample of reasonable size”. Similarly,
Ahuja et al (2000) report from India, “While price of veterinary services does turn out to be
statistically significant, the magnitude of this effect is quite small. Price elasticity is very low and
does not vary across income groups”. Similar results are reported in the case of human health
care. For example, Ndesao Atanga (2000) finds only modest differences in the structure of
demand between top and bottom income quartiles in Cameroon.
10
In light of the economic logic presented in section 2, and the recent research on the
nature and pattern of demand for these services, there is a fair degree of consensus that the
animal health functions such as clinical diagnosis and treatment, drug production and distribution,
and breeding services such as artificial insemination, can be delegated to the private sector, but
the institutions and mechanisms to minimise market failure must be put in place. Any subsidies
must be targeted towards those who genuinely can not afford to pay the market prices. Due to
the strong public good component and externalities, however, it is generally agreed that
services such as preventive health, disease surveillance, etc. should remain in the public domain,
although there are sufficient opportunities for healthy partnerships between public and private
Box 3: Willingness and ability to pay
Estimates of the ‘Willingness to Pay’ (WTP) for goods and services are often used to assess thedemand for those goods and services which are not traded in the market. These estimates arederived from either the direct survey methods such as ‘Contingent Valuation’ or methods whichare based on the observed behavior of the buyers in related markets.
Some authors have recently questioned the use of WTP estimates for policy purposes on thegrounds that it is the ability and not willingness which should form the basis of social policy.Some examples are given below;
• “There is a strong case for resisting the doctrinaire application of principles such as‘willingness to pay’ that may not take into account the problems connected with the abilityto pay” (Anonymous, 2000).
• “...the majority of previous studies focus on the willingness to pay of producers.Conversely, the intention of the affordability parameter is to assess the ability of poorhouseholds to pay for animal health care” (Heffernan and Misturelli, 2000).
• “It is implicitly assumed by proponents of user-fees that if individuals express a willingnessto pay for social services, they must be able to pay. In other words, there is a presumptionthat expressed preferences and needs can be translated into effective demand. This is animplausible leap of faith” (Watkins, 1997).
This distinction between willingness and ability is artificial at best. In the strict economic sense,WTP actually describes the demand curve which, in turn, is conditioned on tastes andpreferences, availability of substitutes and complements, and the disposable income of theindividual. WTP is therefore not a simple expression of ‘wants’. It indeed combines thepreference structure, market structure, and the ability to pay.
This distinction between ability and willingness is not just artificial but also counterproductive.It has taken years of field research to establish that poor do demand quality services and are notaverse to paying for it. ‘Underpricing’ the services, which is intended to bring them within thereach of the poor, actually hurts them because underpricing also limits supply and leads tohigher waiting times. Access is then determined by other factors such as connections, politicalpatronage, and so on, and it is the rich who have more connections and political clout than thepoor.
Box 4: The business of service delivery: Two success stories
1. Bihar, the second most populous state of India (comprising a little more than 10 per cent of thecountry’s population), fares worst among all the states of India on indicators of social andeconomic development. It has the highest poverty head count ratio, lowest per capita income,lowest literacy rate, and a very high child mortality rate. Although over 80 percent of Bihar’spopulation lives in rural areas and depends on agriculture sector for its livelihood, there is very poordevelopment of infrastructure like irrigation and power, non-availability of modern inputs, low valueof credit and poor extension services.
The Patna Development Private Limited (PADP) was established in 1991-92 in Patna, the statecapital. The company has emerged as a large scale provider of AI, frozen semen straw and the liquidnitrogen to self-employed AI practitioners. Since 1994, the company has started provided trainingin AI at Rs.1000 per trainee for a four month training course.
The AI network is spread over 48 districts in the state through 405 outlets. 63 percent of thepractitioners have set-up their practice in urban areas and 37 percent in rural areas. In 1992-93, atotal of 10,948 doses were sold which rose to 1,59,281 doses in 1997-98—annual growth rate ofover 70 percent. The price charged per dose is Rs.10. The delivered price of liquid nitrogen isRs.45 per litre.
The most established AI practitioners perform between 1500-2000 inseminations per year. Thecharge is Rs.50/- per AI but can go up to Rs.100/- depending upon the distance. All practitioners usebicycles/mopeds for mobility and cover the area within the radius of 5-6 kms.
2. Dr. D.C.Mahajan provides veterinary clinical services in indapur Taluka of Pune district. 8technicians work with him. In the year 1997 they performed 18,000 inseminations.
For each insemination, the price is Rs.50 if the call is from within 10 kms and Rs.80 if it is over 10kms. If the farmer desires to have his animal inseminated with proven bull semen, the charge isRs.150.
Each AI technician owns a motor bike and including the AI equipment he has invested aroundRs.50,000/-. The average monthly net earning of the AI technician is Rs.8000-10,000.
For treatment of non-operative clinical cases, he charges Rs.50.00 for service. In addition, thefarmer bears the entire cost of drugs and medicines. His primary clients comprise of landlesslivestock keepers and small and marginal farmers. He attributes his success to the regularity andcontinuity of the service.
Source: Mittal, S.P. 2000.
11
sector (including NGOs, co-operatives and other self help groups). Indeed, various innovative
models are already beginning to emerge. In agricultural extension, for example, Ecuadorian
farmers sharecrop with extension agents for a profit (Van Crowder, 1991). Costa Rica has
experimented with vouchers that promote private technical assistance to small and medium scale
producers (Kenyan, Olin, and Dinar, 1997). Chile publicly finances 70 per cent of the costs of
private technology transfer firms, which contract with small-scale producers (Picciotto and
Anderson, 1997). Many more such models can be identified where NGOs, producer associations,
co-operatives, community based organisations, and paraprofessionals are actively involved in
delivering services to farmers.
It is important to recognise however that the purpose of these alternative models is to
overcome the failures of the market or the state. These should not crowd out the private market
and should be subject to the same level of scrutiny as the market or the state model. Although no
systematic studies are available comparing the cost efficiency of service delivery for various
provider types, there is some anecdotal evidence to suggest that some of the non-government
service providers suffer from the same weaknesses as the state. This is specially true of larger
non-government organisations with centralised governance structures.
This section can be summarised with the observation that the commonly held notion of
the poor not willing and able to pay for these services is unfounded. The livelihoods of the poor
are critically linked to availability of good support services. Field research has shown that poor
livestock owners value these services tremendously and are not averse to paying for them.
Studies have also shown that the structure of demand for these services is not significantly
different across poor and non-poor groups. Governments therefore have a responsibility to create
a conducive environment for the emergence of a vibrant private sector in livestock service
delivery. It is important to recognise, however, that the efficiency of private market is contingent
on the ability of the state in providing public goods, such as an effective legal framework,
transparent organisational process and strong institutions. In the absence of these public goods,
private markets may also not perform as well as predicted by the economic theory. It is therefore
important to integrate the larger political economy and governance issues in the economic debate
on livestock service delivery.
The context
While economic theory shapes the conceptual framework, it is the context of farming
systems, market infrastructure, agro-ecological conditions, and the socio-economic, political and
cultural environment, that would shape the actual model of service delivery. As pointed out in the
previous section, a number of innovative models and approaches are already beginning to
emerge. Some of these models have emerged as a means to solve the principal-agent problem,
12
some to minimise the transactions costs, and some to overcome other failures of the state and the
market. Given the diversity of contexts across the world, it is natural that there will be a myriad
of models of service delivery. However, at the same time it must be ensured that the
fundamentals of economic efficiency and fairness, presented in the previous section, are
respected. As has been documented by several field studies in a number of countries, it is the
poor who are most likely to suffer if these principles are violated.
This paper deliberately avoids discussion on appropriate service delivery models for
various contexts. The knowledge base to identify options and approaches for various contexts of
service delivery is weak and much more analysis is needed on their merits and limitations.
Nonetheless, an examination of the broad parameters in various contexts can help accelerate the
process of identifying these options. In that spirit, this section provides a brief description of
three regions—South Asia, East Asia and the Pacific, and Sub-Saharan Africa. These regions
together account for 90 percent of the world’s poor.
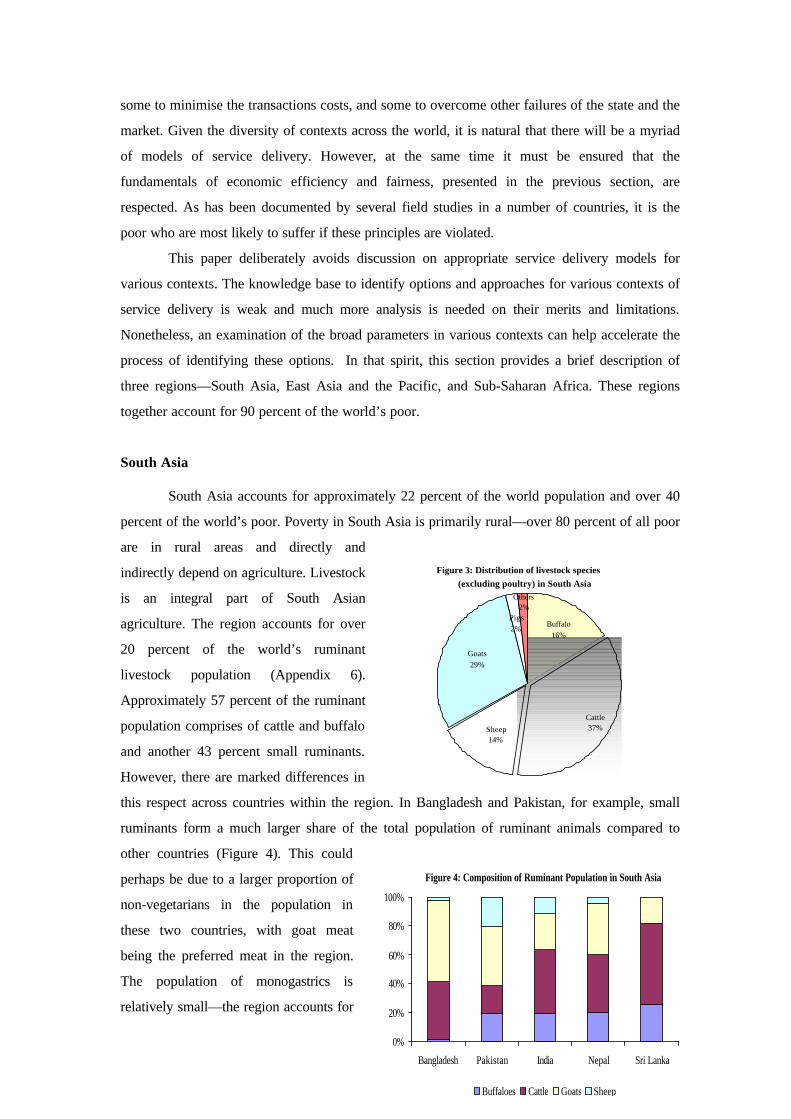
South Asia South Asia accounts for approximately 22 percent of the world population and over 40
percent of the world’s poor. Poverty in South Asia is primarily rural—over 80 percent of all poor
are in rural areas and directly and
indirectly depend on agriculture. Livestock
is an integral part of South Asian
agriculture. The region accounts for over
20 percent of the world’s ruminant
livestock population (Appendix 6).
Approximately 57 percent of the ruminant
population comprises of cattle and buffalo
and another 43 percent small ruminants.
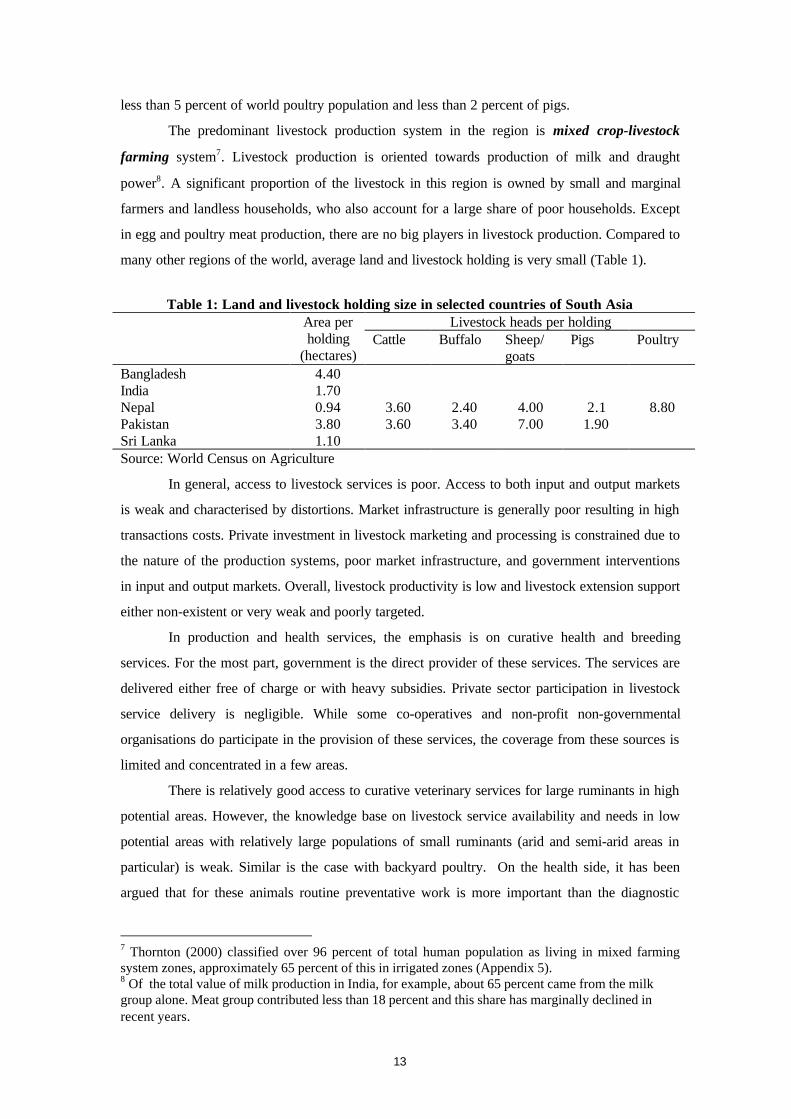
However, there are marked differences in
this respect across countries within the region. In Bangladesh and Pakistan, for example, small
ruminants form a much larger share of the total population of ruminant animals compared to
other countries (Figure 4). This could
perhaps be due to a larger proportion of
non-vegetarians in the population in
these two countries, with goat meat
being the preferred meat in the region.
The population of monogastrics is
relatively small—the region accounts for
Figure 4: Composition of Ruminant Population in South Asia
0%
20%
40%
60%
80%
100%
Bangladesh Pakistan India Nepal Sri Lanka
Buffaloes Cattle Goats Sheep
Figure 3: Distribution of livestock species (excluding poultry) in South Asia
Sheep14%
Others2%
Pigs2%
Goats29%
Buffalo16%
Cattle37%
Figure 3: Distribution of livestock species(excluding poultry) in South Asia
Sheep14%
Others2%
Pigs2%
Goats29%
Buffalo16%
Cattle37%
13
less than 5 percent of world poultry population and less than 2 percent of pigs.
The predominant livestock production system in the region is mixed crop-livestock
farming system7. Livestock production is oriented towards production of milk and draught
power8. A significant proportion of the livestock in this region is owned by small and marginal
farmers and landless households, who also account for a large share of poor households. Except
in egg and poultry meat production, there are no big players in livestock production. Compared to
many other regions of the world, average land and livestock holding is very small (Table 1).
Table 1: Land and livestock holding size in selected countries of South Asia
Livestock heads per holding Area perholding
(hectares) Cattle Buffalo Sheep/
goats Pigs Poultry
Bangladesh 4.40 India 1.70 Nepal 0.94 3.60 2.40 4.00 2.1 8.80 Pakistan 3.80 3.60 3.40 7.00 1.90 Sri Lanka 1.10 Source: World Census on Agriculture
In general, access to livestock services is poor. Access to both input and output markets
is weak and characterised by distortions. Market infrastructure is generally poor resulting in high
transactions costs. Private investment in livestock marketing and processing is constrained due to
the nature of the production systems, poor market infrastructure, and government interventions
in input and output markets. Overall, livestock productivity is low and livestock extension support
either non-existent or very weak and poorly targeted.
In production and health services, the emphasis is on curative health and breeding
services. For the most part, government is the direct provider of these services. The services are
delivered either free of charge or with heavy subsidies. Private sector participation in livestock
service delivery is negligible. While some co-operatives and non-profit non-governmental
organisations do participate in the provision of these services, the coverage from these sources is
limited and concentrated in a few areas.
There is relatively good access to curative veterinary services for large ruminants in high
potential areas. However, the knowledge base on livestock service availability and needs in low
potential areas with relatively large populations of small ruminants (arid and semi-arid areas in
particular) is weak. Similar is the case with backyard poultry. On the health side, it has been
argued that for these animals routine preventative work is more important than the diagnostic
7 Thornton (2000) classified over 96 percent of total human population as living in mixed farmingsystem zones, approximately 65 percent of this in irrigated zones (Appendix 5).8 Of the total value of milk production in India, for example, about 65 percent came from the milkgroup alone. Meat group contributed less than 18 percent and this share has marginally declined inrecent years.
14
services, but very little effort has gone into developing appropriate delivery channels and
institutions for this purpose.
Ability of the state to target subsidies and to manage the delivery systems is weak and
there are significant leakages. A recent study in three states of India documented that a large part
of the subsidy in the delivery of veterinary and AI services does not reach the service users
(Ahuja et al, 2000), and whatever does reach them does not necessarily benefit the poor.
Due to fiscal pressures and concerns about service delivery efficiency, there is an
ongoing debate on greater participation of the private sector in livestock service provision. India,
which accounts for over 75 percent of regional population, 82 percent of region’s poor and about
70 percent of livestock population of the region (excluding poultry), initiated market oriented
economic reforms in 1991. However, the pace of reform in the agriculture and livestock sectors
has been slow. Despite some recent evidence that there is sufficient demand for these services,
and that the service users, including the poor, are willing to pay for these services, there has been
no serious attempt to create an environment that would support the emergence of the private
sector in livestock services. High transaction costs due to poor market infrastructure, subsidised
delivery of health services resulting in unfair competition, absence of appropriate institutions for
market regulation, vested interests in policy circles, and the populist nature of the state resulting
in market distortions and inefficiencies are some of the main constraints affecting the efficiency
and equity of livestock service delivery in this region.
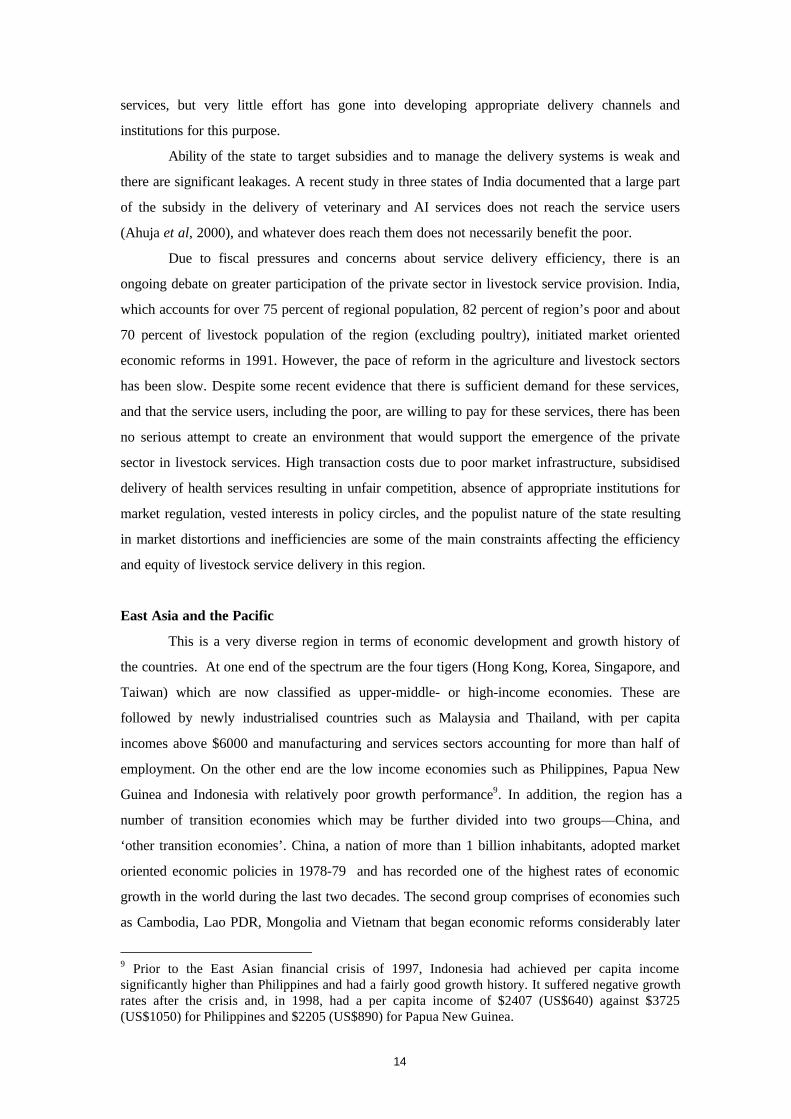
East Asia and the Pacific
This is a very diverse region in terms of economic development and growth history of
the countries. At one end of the spectrum are the four tigers (Hong Kong, Korea, Singapore, and
Taiwan) which are now classified as upper-middle- or high-income economies. These are
followed by newly industrialised countries such as Malaysia and Thailand, with per capita
incomes above $6000 and manufacturing and services sectors accounting for more than half of
employment. On the other end are the low income economies such as Philippines, Papua New
Guinea and Indonesia with relatively poor growth performance9. In addition, the region has a
number of transition economies which may be further divided into two groups—China, and
‘other transition economies’. China, a nation of more than 1 billion inhabitants, adopted market
oriented economic policies in 1978-79 and has recorded one of the highest rates of economic
growth in the world during the last two decades. The second group comprises of economies such
as Cambodia, Lao PDR, Mongolia and Vietnam that began economic reforms considerably later
9 Prior to the East Asian financial crisis of 1997, Indonesia had achieved per capita incomesignificantly higher than Philippines and had a fairly good growth history. It suffered negative growthrates after the crisis and, in 1998, had a per capita income of $2407 (US$640) against $3725(US$1050) for Philippines and $2205 (US$890) for Papua New Guinea.

15
than China. These countries have relatively lower income levels, a high incidence of poverty, and
more than 70 percent of their populations dependent on agriculture.
Apart from Mongolia and Philippines, however, economic growth in this region, has
continued at a remarkable pace and become geographically widespread. Furthermore, the nature
of this growth has been highly inclusive, leading to a rapid reduction in the number of absolute
poor. Indeed, the number of absolute poor was halved within a short span of two decades (1975-
95). Despite spectacular economic achievements, however, poverty remains a problem. A little
less than a quarter of world’s poor still live in this region. China, being the largest country in this
region, accounts for more than 75 percent of the region’s poor10.
Livestock plays a very important role in the economy of this region. Large ruminants
(cattle and buffaloes) are raised for meat, milk and draught power for farming and rural
transportation. The region accounts for 23 percent of world livestock population (excluding
poultry) (Appendix 6). Nearly half the livestock population in this region comprises of pigs
(Figure 5). Another 31 percent are small ruminants (sheep and goats). Swine and poultry
production have emerged as important commercial activities. In China, for example, swine and
poultry raising was encouraged as a means to solve the surplus grain problem in the mid 1980s to
late 1990s. Currently, the region
accounts for more than half of
world’s pig population and 37
percent of poultry. Comparable
figures for China alone are 46 and
25 percent respectively.
The diversity in economic
transformation has also resulted in
similar diversity in the structure of
agriculture and livestock production.
Some countries in the region have
and continue to experience sharp intensification and industrialisation of livestock production and
processing. Rapid growth in demand accompanied by technological changes are creating capital
intensive integrated production units for poultry meat, eggs, pork and dairy products. These units
employ/contract professional service providers for their service needs.
On the other hand there are also a large number of small scale producers whose
livelihoods are critically linked to livestock. In China, for example, over 90 percent of pig
production units are comprised of holdings of between 1 and 5 head, and their share in total pig
slaughter in 1996 was about 60 percent. Another quarter of the pork production was contributed
10 See Ahuja et al 1997 for in-depth analysis of poverty and inequality in east Asian countries.
Figure 5: Distribution of livestock species (excluding poultry) in East and Southeast Asia
Sheep15%
Others1%
Pigs48%
Goats17%
Buffalo4%
Cattle15%
Figure 5: Distribution of livestock species(excluding poultry) in East Asia & the Pacific
Sheep15%
Others1%
Pigs48%
Goats17%
Buffalo4%
Cattle15%

16
by units/households raising between 6 and 30 head. In the case of poultry, on the other hand,
about 57 percent of the production came from the units with over 1000 birds. At the same time,
backyard poultry also seems common. Over 95 percent of all units have less than 50 birds,
contributing a little over a quarter of the total poultry production in China (Table 2).
Table 2: Structure of livestock production in China: 1996
Holding size Holders (million) Units Slaughtered (million)Pigs
1-5 heads 110.1 (92.6) 205.20 (59.4)6-10 heads 5.51 (4.6) 40.66 (11.8)11-30 heads 2.93 (2.5) 44.80 (13.0)31-50 heads 0.18 (0.15) 7.02 (2.03)51-200 heads 0.14 (0.12) 13.09 (3.79)201-1000 heads 0.02 (0.02) 9.41 (2.72)Above 1000 heads 0.006 (0.01) 25.25 (7.31)Total 118.92 (100.0) 345.41 (100.0)
Poultry1-50 birds 101 (96.8) 835 (27.0)51-200 birds 2.399 (2.3) 220 (7.11)201-1000 birds 0.59 (0.6) 283 (9.14)1001-10000 birds 0.291 (0.28) 968 (31.3)above 10000 birds 0.032 (0.03) 789 (25.5)Total 104.3 (100.0) 3095 (100.0)
Beef cattle1-5 heads 10.43 (96.9) 14.043 (72.2)6-10 heads 0.195 (1.8) 1.493 (7.68)11-100 heads 0.113 (1.1) 2.314 (11.9)Above 100 heads 0.03 (0.3) 1.60 (8.23)Total 10.77 19.45
Dairy cattle1-5 heads 0.71 (86.7) 1.41 (41.63)6-10 heads 0.07 (8.50) 0.52 (15.52)11-100 heads 0.04 (4.65) 0.78 (22.95)Above 100 heads 0.002 (0.20) 0.67 (19.90)Total 0.824 (100.0) 3.38 (100.0)Note: Figures in parentheses are percentages to total. In case of dairy cattle, the number in the last column are numberof units held by the respective holding size group. Source: Bingsheng, 2001. Systematic documentation on various models of livestock service delivery in the
countries of this region is relatively scarce. It appears that while relatively higher income
countries have moved ahead in privatising/commercialising services such as clinical veterinary
services, abattoir management, vaccine production, artificial insemination, milk collection and so
on, the government still plays a more direct role in service provision in other countries such as
Cambodia, Vietnam, and Philippines. However, not much is known about the efficiency of
service delivery, access by the poor, service quality, market regulation, and so on. Focused
studies to document/analyse these aspects in a cross-section of countries would be very useful
for advancing the thinking on livestock service delivery in this region.
17
Sub-Saharan Africa With about 45 percent of the population in sub-Saharan Africa living below the
international poverty line of $1 a day, this is the poorest region of the world. Within sub-Saharan
Africa, poverty is more widespread in West Africa compared to the countries in east and
southern Africa. In Nigeria, which accounts for 44 percent of total population in West Africa, the
poverty incidence at $1 a day poverty line was estimated to be over 70 percent in 1998
(Appendix 7). Other countries with a very high poverty incidence (poverty incidence greater than
60 percent) include Burkina Faso, Central African Republic, Gambia, Mali, Niger, Sierra Leone,
Madagascar, and Zambia. A large number of countries in this region have suffered declining per
capita income during the last two decades.
Over 65 percent of the total regional population lives in mixed crop-livestock production
systems. Again, the proportion is higher in West Africa (about 80 percent) compared to east and
southern Africa (about 50 percent). Availability of irrigation is extremely poor, with only about 2
percent of those in the mixed farming zone being classified as living in mixed-irrigated production
zones.
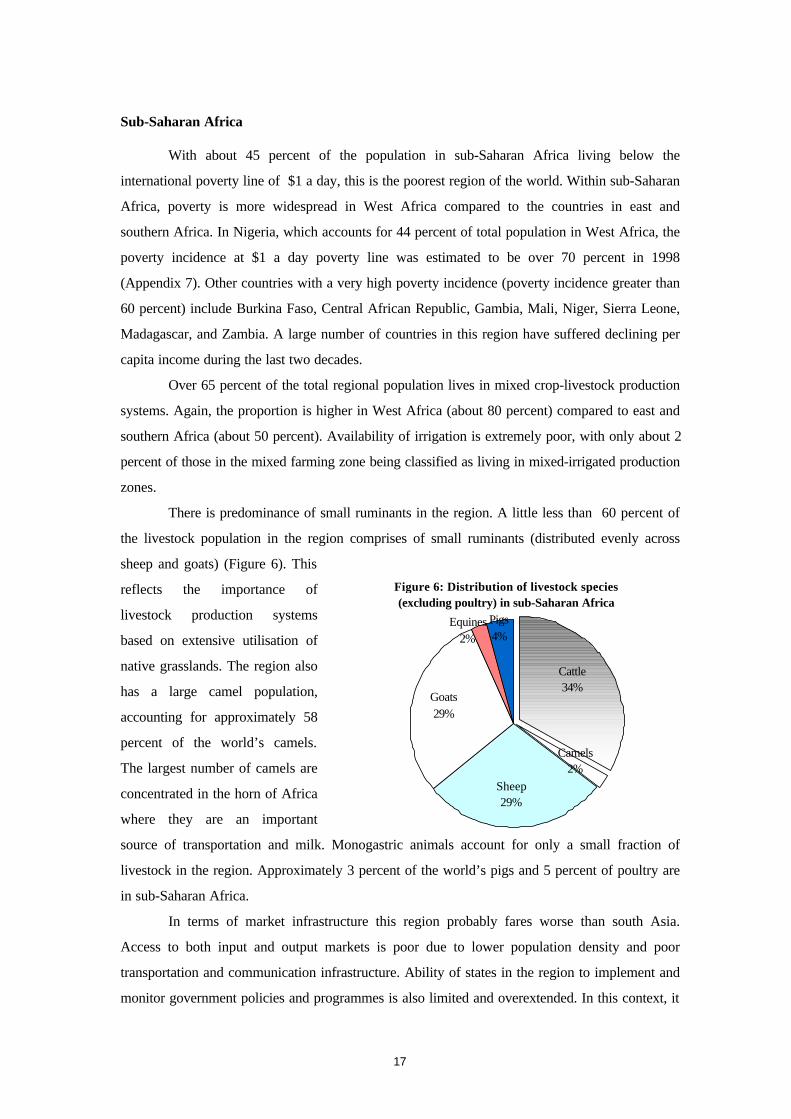
There is predominance of small ruminants in the region. A little less than 60 percent of
the livestock population in the region comprises of small ruminants (distributed evenly across
sheep and goats) (Figure 6). This
reflects the importance of
livestock production systems
based on extensive utilisation of
native grasslands. The region also
has a large camel population,
accounting for approximately 58
percent of the world’s camels.
The largest number of camels are
concentrated in the horn of Africa
where they are an important
source of transportation and milk. Monogastric animals account for only a small fraction of
livestock in the region. Approximately 3 percent of the world’s pigs and 5 percent of poultry are
in sub-Saharan Africa.
In terms of market infrastructure this region probably fares worse than south Asia.
Access to both input and output markets is poor due to lower population density and poor
transportation and communication infrastructure. Ability of states in the region to implement and
monitor government policies and programmes is also limited and overextended. In this context, it
Figure 6: Distribution of livestock species (excluding poultry) in sub-Saharan Africa
Camels2%
Equines2%
Pigs4%
Goats29%
Sheep29%
Cattle34%
18
is instructive to quote Leonard (2000), “The larger number of African states are confronted with
most of the following: corruption (Gould 1980; Gould and Amaora-Reyes 1983; Klitgaard 1990);
patronage (Joseph, 1987); inflated public payrolls; severe fiscal scarcity and a consequent
‘budgeting by cash-flow’(Caiden and Wildavsky 1975); constant shortages of critical inputs
(Moris 1977), weak performance rewards for public servants, due both to erosion of their value
by inflation and the failure to use them to support organisational objectives (Montgomery 1987);
and political authorities who are insecure, indecisive, arbitrary, and interventionist (Moris 1977;
Jackson and Rosberg 1982)”.
Despite poor market infrastructure, poor ability of the state to regulate the market, and
absence of appropriate institutions, many countries in this region privatised the delivery of
veterinary services during the 1980s. This was done under donor pressure to relieve the fiscal
constraints of the states in the wake of the great African depression. Systematic impact
evaluations of privatization of these services are not available. However, some of the experts
maintain that while private markets may not have produced any miracles, they have certainly
helped in improving the efficiency and access to these services by all livestock keepers including
the poor. This may seem to corroborate the conjectures of some of the early economists, that
even imperfect markets might outperform the state simply because of the incentives private
agents have in reducing costs. While that question does have some academic appeal, from the
policy point of view what is needed at this stage is a systematic analyses of various experiences
within this region, with the objective of identifying appropriate institutions and processes for
improving the efficiency of service delivery and access to these services.
The foregoing discussion, though useful for understanding broad differences across
regions, is nevertheless inadequate for identification of appropriate interventions in the context of
livestock service markets. That requires a much deeper understanding of the microeconomic
environment within which the households function and make decisions. These questions need to
be answered with the help of qualitative and quantitative field surveys.
Several national and international agencies routinely carry out field surveys which might
contain the data necessary to test some of the behavioral hypotheses, in order to understand
household behavior. For example, the “Living Standards Measurement Study” established by the
World Bank in 1980 has already completed household surveys in over two dozen countries at
various points in time (see Box 5). Similarly, FAO works with several national governments to
carry out household surveys in the agriculture sector. It would be worthwhile to explore the
possibility of using these surveys for understanding the profile of livestock dependent poor and
household behavior in response to changes in the policy environment.

19
The role of FAO in support of livestock service delivery to the poor FAO has a unique role to perform in supporting the development of effective systems of
livestock service delivery, by encouraging appropriate policies and transferring appropriate
knowledge. These functions cannot easily be shifted to other existing institutions or market
Box 5: The Living Standard Measurement Surveys
The World Bank established the living standard measurement study in 1980 to explore ways of improvingthe type and quality of household data collected by government statistical offices in developing countries. Theobjectives were to develop new methods for monitoring progress in living standards, to assess the impact ofgovernment policies on households, and to improve communications between survey statisticians, analysts, andpolicymakers. As of 1997 the household surveys had been conducted in about two dozen countries.
Although the format of these surveys varies somewhat from country to country, most of these surveyscollect comprehensive data on various production and consumption activities, employment, health, education,nutrition, migration, etc of the sample households. The data is usually collected with the help of three different typesof questionnaire—the household questionnaire, the village/community questionnaire, and the price questionnaire.Sample size varies from country to country and also sometimes within countries from year to year, but most of thesesurveys retain the characteristic of being nationally representative in nature. The table below gives the countries andyears for which the survey data are already available.
Table: Coverage of LSMS SurveysCountries for which surveys areavailable
Survey Years and Sample Size
AfricaTanzania 1993 (5200)Ghana 1987-88 (3200), 1988-89 (3200), 1991-92 (4565), 1998-99 (5998)Cote d’Ivoire 1985 (1588), 1986 (1600), 1987 (1600), 1988 (1600)South Africa 1993 (9000)
East and South AsiaNepal 1996 (3373)Pakistan 1991 (4800)Papua New Guinea 1996 (1396)Vietnam 1992-93 (4800), 1997-98 (5994)
Latin America and the CaribbeanEcuador 1994 (4500), 1995 (5500)Guyana 1992-93 (5340)Jamaica 1988-98 annual (2000-7300)Nicaragua 1993 (4209), 1998 (4209)Panama 1997 (4945)Peru 1985 (5120), 1991 (2200), 1994 (3500)
Eastern Europe and Central AsiaAlbania 1996 (4290)Armenia 1996 (4920)Azerbaijan 1995 (2016)Bulgaria 1995 (2500)Kazakhstan 1996 (1996)Kyrgyz Republic 1993 (2000)Romania 1994-95 (36,000)Russia 1992 (6,500)Tajikistan 1999 (2000)
Middle East and North AfricaMorocco 1991 (3323)Note: Figures in parentheses are sample sizes.
20
mechanisms.
Objective knowledge generated by scientific field research is a prerequisite for objective
policy formulation. Despite strong economic logic many governments are reluctant to introduce
significant changes in the policy regime. This, in part, is due to lack of field level evidence on the
impact of various policy options. In the context of veterinary services, for example, Holden,
Ashley and Bazeley (1996) note that, “while there has been no shortage of vigorous advocates
for privatisation, there have been very little hard data and analyses to guide policy makers. A
cursory review of the World Bank Development Report on investing in human health suggests
that, in contrast to the veterinary sector, the reform of public health services has been guided by
quantifiable indicators of the relative merits of different types of delivery...Faced with such
information, rational policy choices can be made; in its absence policy makers are left with
conflicting ideologies and poorly understood economic theories.” Issues in the delivery of
livestock services to the poor are very complex and require careful analysis and assessment.
Policy making is, however, more complex than the simple application of economic logic.
It often requires balancing various interests and someone to champion the agenda. While neutral
dialogue is necessary, it does not always lead to rational choices. "Rules of the game" are often
biased against those who are not represented in the rule setting corridors. The poor are often
excluded from policy making tables, and government departments, international development
agencies and research institutions have not made adequate efforts to elicit the participation of the
poor in identifying their own needs and policy priorities. The role of organisations such as FAO
therefore goes much beyond the simple provision of tools and techniques for policy analysis, or
the creation of a forum for neutral policy dialogue. It involves giving a voice to those who are not
represented on the tables where the rules are designed.
Under the umbrella of a “Pro-Poor Livestock Policy Initiative”, FAO has proposed to
establish public policy networks in which governments, national and international organisations,
civil society organisations and the private sector can collaborate on selective issues to achieve
consensus, as an effective means to address this gap. These networks could serve as a forum for
(i) informing the national and international policies that determine poor-people’s livestock related
livelihoods, (ii) discussion and dialogue on policy issues in order to enhance the effectiveness of
livestock services for the poor, reduce transactions costs for making the services more accessible,
and mitigate information asymmetry; (iii) creating a conducive environment for policy change
involving credible local institutions, (iv) identifying the research gaps and sponsoring well
focussed studies to examine them, and (v) creating local databases, information and knowledge
banks. The success of these networks will, however, depend on the mechanisms and processes
that will be used in operationalizing their formation and functioning. Success, in this case, should
be measured by how well these networks are able to make an impact on accelerating the poverty
21
reduction process. It is therefore important that functioning of these networks is carefully
monitored and their impact on the ground rigorously evaluated.
Summary
This paper has reviewed the economic framework for delivery of livestock services to
the poor. It is argued that the "livestock revolution" is likely to result in a rapid increase in
demand for these services. The ability of the poor to participate in this revolution is linked
critically to the availability of good services both on the input and output side. Governments
therefore have a responsibility to supply the necessary public goods (including the institutions and
legal framework) and the market infrastructure for facilitating the emergence of efficient markets
for livestock services. The paper further argues that public policy dynamics in developing
countries are much more complex than the simple application of economic logic. It is the larger
political economy that often dictates policy choices. It is therefore important to integrate political
economy and governance issues in the economic debate on livestock service delivery.
The paper also reviews the context in which the markets for livestock services will need
to function. Different countries are facing very different sets of issues, and identification of
possible interventions in livestock service markets would require careful field research and
analysis. The paper identifies some broad issues in the three regions—South Asia, East Asia and
the Pacific, and Sub-Saharan Africa—which should be part of the research agenda for the next
few years.
22
References
Ahuja, Vinod; Bidani, B; Ferreira, F. and Walton, M. 1997. Everyone's Miracle: Revisiting
Poverty and Inequality in East Asia, The World Bank, Washington DC. Ahuja, Vinod (Ed). 1999. Workshop on Commercialization of Livestock Health and Breeding
Services in India: Papers and Proceedings, IIM, Ahmedabad; The World Bank,Washington DC; and SDC, Bern.
Ahuja, Vinod et al. 2000. Agricultural Services and the Poor: Case of Livestock Health and
Breeding Services in India, IIM, Ahmedabad; The World Bank, Washington DC; andSDC, Bern.
Akerlof, George. 1970. “The Market for ‘Lemons’: Quality Uncertainty and the Market
Mechanism”, Quarterly Journal of Economics, Anonymous. 2000. “Reform of Veterinary Services: A Policy Framework”, (unpublished paper). Binshgeng, 2001. “Perspectives and Strategies for the Asian Livestock Sector in the next three
decades”, report prepared for FAO. Caiden, N. and A. Wildavsky. 1975. Planning and Budgeting in Poor Countries, Wiley, New
York Delgado, C., Rosegrant, M., Steinfeld, H., Ehui, S., Courbois, C. 1999. Livestock to 2020: The
Next Food Revolution”, Food, Agriculture and Environment Discussion Paper 28,IFPRI/FAO/ILRI, IFPRI, Washington DC.
FAO. 1998. “Principles for Rational Delivery Public and Private Veterinary Services with
reference to Africa Farooq, M. et al. 2000. “Impact of Female Livestock Extension Workers on Rural Household
Chicken Production”, Livestock Research for Rural Development, 12(4). Gould, D.J. 1980. Bureaucratic Corruption in the Third World: The Administration of
Underdevelopment in Zaire, Pergamon-Maxwell, New York. Gould, D.J. and Amaora-Reyes, J.A. 1983. “The Effect of Corruption on Academic
Performance: Illustrations from Developing Countries”, Staff Working Paper 580, TheWorld Bank, Washington DC
Heffernan, Claire and Federica Mitsurelli. 2000. The Delivery of Veterinary Services to the
Poor: Preliminary Findings from Kenya, Veterinary Epidemiology and EconomicsResearch Unit, Department of Agriculture, University of Reading, UK.
Holden, S., Ashley S. and Bazeley P. 1996. Improving the Delivery of Animal Health Services
in Developing Countries: A literature Review, Livestock in Development, Somerset,UK.
Jackson, R. and Rosberg, C. 1982. Personal Rule in Black Africa: Prince, Autocrat, Prophet,
Tyrant, University of California Press, Berkeley.
23
Joseph, R. A. 1987. Democracy and Prebendal Politics in Nigeria: The Rise and Fall ofSecond Republic, Cambridge University Press, Cambridge.
Kelly, P.J. et al. 1994. “Diseases and Management of Backyard Chicken Flocks in
Chitungwiza, Zimbabwe”, Avian Diseases, 38(3):626-29.
Kenyan, Gabriel; Olin, Manuel; and Dinar, Ariel. (1997), “Co-financed Public Extension inNicaragua”, World Bank Research Observer, 12(2), pp. 225-47.
Khan M. et al. 1991. NGO Interactions with the Public Sector: The Experience of Proshika’s
Livestock and Social Forestry Programme, Agricultural Research and ExtensionNetwork Paper No 26, London:ODI.
Klitgaard, R. 1990. Tropical Gangsters, Basic Books, New York.
Koma, Lee M.P.K. 2000. “Can Private Veterinarians Survive in Uganda?”, in David Leonard
(Ed.), Africa’s Changing Markets for Health and Veterinary Services: The NewInstitutional Issues, Macmillan Press Ltd, London and St.Martin’s Press Inc, NewYork.
Leonard, David (Ed). 2000. Africa’s Changing Markets for Health and Veterinary Services:
The New Institutional Issues, Macmillan Press Ltd, London and St.Martin’s Press Inc,New York.
Leonard, Kenneth L. 2001. “When Both States and Markets Fail: Asymmetric Information and
the Role of NGOs in African Health Care”, Department of Economics, ColumbiaUniversity, New York.
Ly, Cheikh. 2000. “Management and the Impact of Auxiliaries on Pastoral Production and
Veterinary Services Delivery in Senegal”, in David Leonard (Ed.), Africa’s ChangingMarkets for Health and Veterinary Services: The New Institutional Issues, MacmillanPress Ltd, London and St.Martin’s Press Inc, New York.
Mittal, S.P. 2000. Communication in the Electronic Conference on the Delivery of Livestock
Health and Breeding Services: Focus on India. Monteiro, A.M. et. al.. 1998. “Pharmaceutical quality of anthelmintics sold in Kenya”, Vet Rec,
142:396-398.
Montgomery, J.D. 1987. ‘Probing Managerial Behavior: Image and Reality in Southern Africa’,World Development, 15(7):911-29.
Moris, J. 1977. ‘The Transferability of Western Management Concepts and Programs, an EastAfrican Perspective’, in L.D. Stifel, J.S.Coleman, and J.E.Black (eds). Education andTraining for Public Sector Management in Developing Countries”, The RockafellerFoundation, New York.
Narayan, Deepa and Talat Shah. 2000. "Connecting the Local to the Global: Voices of the Poor",Framework paper prepared for the Workshop on Local to Global Connectivity forVoices of the Poor, December 11-13, 2000, The World Bank, Washington DC.
Ndesao-Atenga, Sylvester. 2000. “Health Care Quality and the Choice of Care Providers:
Cameroon II”, in David Leonard (Ed.), Africa’s Changing Markets for Health and
24
Veterinary Services: The New Institutional Issues, Macmillan Press Ltd, London andSt.Martin’s Press Inc, New York.
Picciotto, Robert and Anderson, Jock R. 1997. “Reconsidering Agricultural Extension, World
Bank Research Observer, 12(2), pp. 249-59. Ravallion, Martin; Gaurav Datt and Dominique van de Walle. 1991. “Quantifying Absolute
Poverty in the Developing World”, Review of Income and Wealth, 37:345-61. Schillhorn van Veen, T.W. 1999. “Agricultural Policy and Sustainable Livestock Development”,
International Journal for Parasitology, 29: 7-15. Shakir, K. M A Mian and M Farooq. 1999. “Contribution of backyard chicken to rural
household economy in Chitral”, M.Sc. Thesis, NWFP Agricultural University,Peshawar.
Thornton, P.K, Randolph, T.F, Kristjanson, P.M., Omamo, W.S, Odero, A N, Ryan J G. 2000."Priority Assessment for the International Livestock Research Institute 2000-2010",ILRI Impact Assessment Series No.6.
Umali, D. , Gershon Feder and Cornelis de Haan. 1994. “Public and Private Sector Roles in theDelivery of Livestock Services”, in Public and Private Sector Roles in the Provision ofAgricultural Support Services: Proceedings of the International Symposium, San Jose,Costa Rica, May 17-19, 1993.
Umali, D., Feder, G. &and de Haan, C., 1992:. The balance between public and private sector
activities in the delivery of livestock services,. World Bank Discussion Papers #1No. 63,.The World Bank, Washington, D.C., World Bank.
Van Crowder, L. 1991. “Extension for Profit: Agents and Sharecropping in the Highlands ofEcuador”. Human Organization, 50, pp. 39-40.
Watkins, Kevin. 1997. “Cost Recovery and Equity in the Health Sector: Issues for Developing
Countries”, paper prepared for WIDER project on Provision and Financing of PublicGoods in Developing Countries, Helsinki: World Institute for Development EconomicsResearch.
World Bank. 1990. World Development Report: Poverty, Oxford University Press, New York. World Bank. 2001. World Development Indicators, World Bank, Washington DC.
25
Appendix 1
Some commonly used economic terms in the literature on livestock service delivery
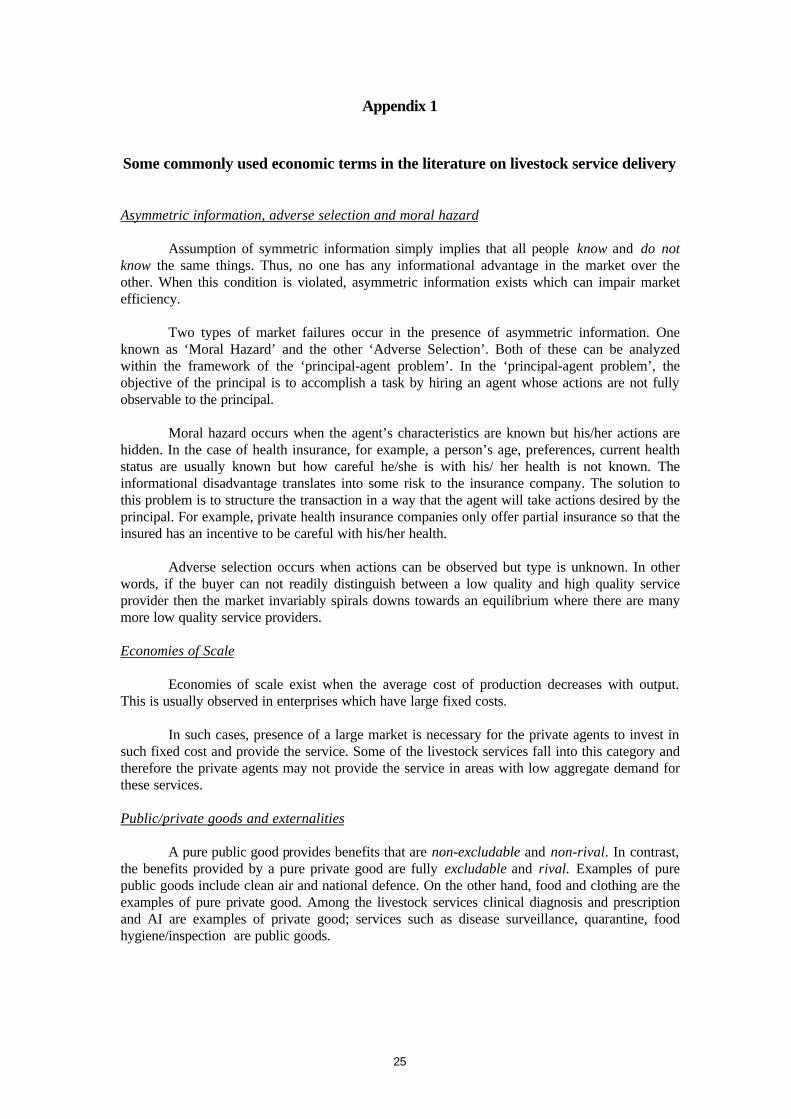
Asymmetric information, adverse selection and moral hazard
Assumption of symmetric information simply implies that all people know and do notknow the same things. Thus, no one has any informational advantage in the market over theother. When this condition is violated, asymmetric information exists which can impair marketefficiency.
Two types of market failures occur in the presence of asymmetric information. Oneknown as ‘Moral Hazard’ and the other ‘Adverse Selection’. Both of these can be analyzedwithin the framework of the ‘principal-agent problem’. In the ‘principal-agent problem’, theobjective of the principal is to accomplish a task by hiring an agent whose actions are not fullyobservable to the principal.
Moral hazard occurs when the agent’s characteristics are known but his/her actions arehidden. In the case of health insurance, for example, a person’s age, preferences, current healthstatus are usually known but how careful he/she is with his/ her health is not known. Theinformational disadvantage translates into some risk to the insurance company. The solution tothis problem is to structure the transaction in a way that the agent will take actions desired by theprincipal. For example, private health insurance companies only offer partial insurance so that theinsured has an incentive to be careful with his/her health.
Adverse selection occurs when actions can be observed but type is unknown. In otherwords, if the buyer can not readily distinguish between a low quality and high quality serviceprovider then the market invariably spirals downs towards an equilibrium where there are manymore low quality service providers.
Economies of Scale
Economies of scale exist when the average cost of production decreases with output.This is usually observed in enterprises which have large fixed costs.
In such cases, presence of a large market is necessary for the private agents to invest insuch fixed cost and provide the service. Some of the livestock services fall into this category andtherefore the private agents may not provide the service in areas with low aggregate demand forthese services.
Public/private goods and externalities
A pure public good provides benefits that are non-excludable and non-rival. In contrast,the benefits provided by a pure private good are fully excludable and rival. Examples of purepublic goods include clean air and national defence. On the other hand, food and clothing are theexamples of pure private good. Among the livestock services clinical diagnosis and prescriptionand AI are examples of private good; services such as disease surveillance, quarantine, foodhygiene/inspection are public goods.

26
Due to the characteristics of non-rivalry and non-excludability, the free market tends tounder-provide public goods since the providers can not appropriate full profits. Thus, it becomesthe responsibility of the state to provide these goods and services. Private goods, on the otherhand, are provided by the private agents at a socially optimal level if there are no externalities.Between the two extremes of pure public and private goods lies a whole continuum based on thedegree of excludability and rivalry.
An externality occurs when the action of one economic agent affects the consumption orproduction of other economic agents in a way that is not reflected in the market. For example, inthe case of industrial pollution when a factory pollutes air or water, it may lead to adverse healtheffects on consumers and these will not be reflected in the market. Externality also provides arationale for intervention in the market.
Economic efficiency
The most widely used notion of economic efficiency was given by the Italian economistVilfredo Pareto. He defined the state of an economy as efficient in which no one can be madebetter off without someone else being made worse off. This notion, commonly known as Pareto-efficiency, combined two types of efficiency—productive and allocative. The productiveefficiency implies that the production of an economic good can not be increased without reducingthe production of some other good. In other words, all the production inputs are optimallyemployed. Allocative efficiency (or the exchange efficiency), on the other hand, requires that allgains from trade be exhausted. In other words, given the consumer tastes and preferences,resource endowments, and technology, it is not possible to make anybody better off withoutmaking someone else worse-off.
Willingness to pay
Willingness to pay refers to the maximum amount someone would be willing to pay for agood or service rather than go without it. The difference between the price someone actuallypays and the willingness to pay is known as the consumer surplus. There are two approaches toassessing the willingness to pay. One is to exploit the observations on prices and quantities toestimate the demand curve, and from there infer the willingness to pay. The second approach iscontingent valuation, a more direct assessment of willingness to pay which uses responses tohypothetical questions to infer preferences and the willingness to pay (Box 3).
Nonexcludability and nonrivalry
Benefits of a good or service that are available to all, once provided, are called nonexcludable. Inother words, if the benefits can not be appropriated by the provider or the owner, then benefits arenonexcludable -- others can not be excluded from benefiting from the good or service. Nonrivalry,on the other hand, implies that one person can consume the good or the service without reducingthe consumption of same good or service by others. Examples of non-excludable goods includepollution control and national defence. Once the air is cleaned up in an area, no one, irrespectiveof whether they contributed to the clean up, can be excluded to benefit from it. Clean air alsopresents the case of nonrival consumption. That is, breathing of clean air by one person does notmake it less available to others.
27
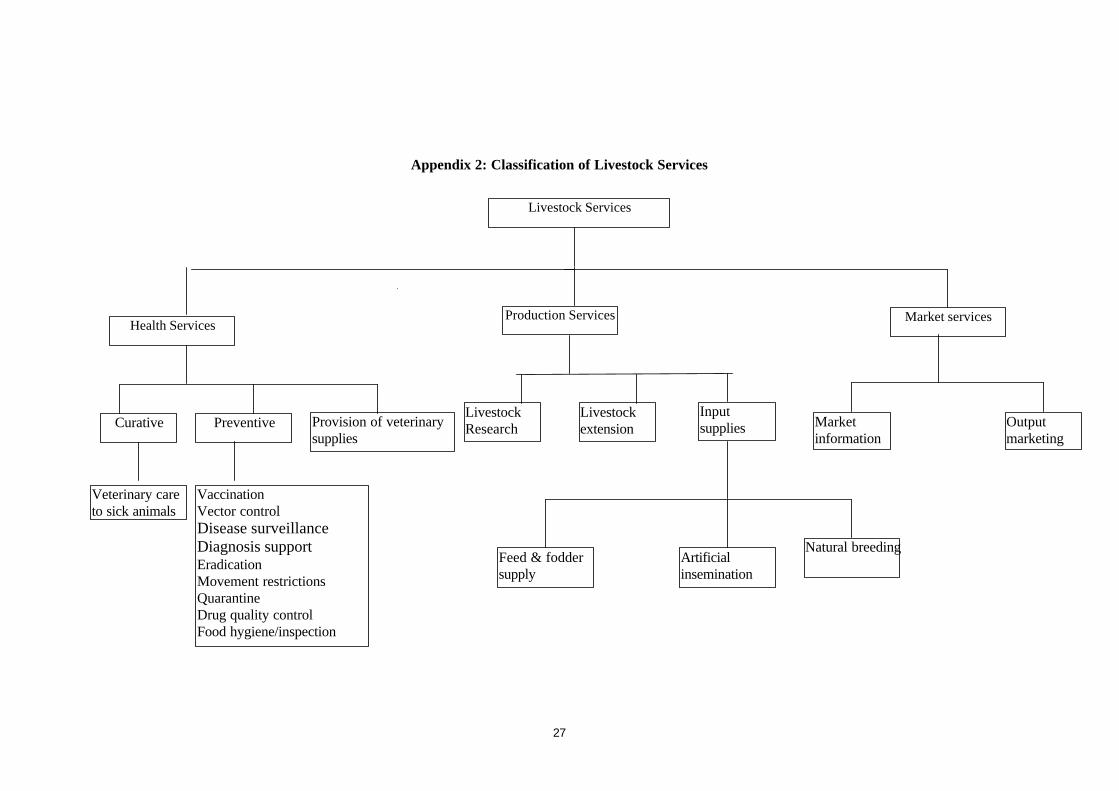
Appendix 2: Classification of Livestock Services
Livestock Services
Health ServicesProduction Services
LivestockResearch
LivestockextensionCurative Preventive Provision of veterinary
supplies
Veterinary careto sick animals
VaccinationVector controlDisease surveillanceDiagnosis supportEradicationMovement restrictionsQuarantineDrug quality controlFood hygiene/inspection
Market services
Inputsupplies Market
informationOutputmarketing
Feed & foddersupply
Artificialinsemination
Natural breeding

28
Appendix 3: Nature of livestock services and appropriate sectoral deliverymechanismType of
economic goodMeasures to
correctSectoral delivery
Public Private Externality
MoralHazard
Public Private
Health servicesClinical intervention
Diagnosis x* YYTreatment x** YY
PreventiveVaccination x* Y YYVaccine production x* YYVector control
Tick control x* Y YYTsetse fly control x Y YY
Veterinary surveillance x YYDiagnosis support x* Y YYQuarantine x YYDrug quality control x YYFood/hygiene inspection x YYVeterinary research x x YY YYVeterinary extension x x YY YY
Provision of vet suppliesProduction x YYDistribution x YY
Production servicesAI – semen production x YYAI – insemination x YYResearch x x YY YExtension x x YY Y* - private good with consumption externalities; ** - private goods with consumption externalitiesonly in case of infectious diseases; YY – economically justified; Y—economically justified underspecial circumstances.
Source: Umali, Feder and de Haan, 1994.

29
Appendix 4: Distribution of human population across major regions of the world
(‘000)REGION Total Population Agricultural Population(1) (2) (3)South & East Africa 369,234 (71.2)* 249,651(67.6)West Africa 241,691 (61.3) 129,620 (53.6)China 1,262,817 (67.0) 854,536 (68.0)East Asia & Pacific (excl China) 580,729 (60.0) 273,884 (47.2)India 982,223 (72.2) 548,794 (55.9)South Asia (excl India) 337,600 (73.5) 194,845 (57.7)Eastern Europe & Central Asia 475,350 (32.5) 87,960 (18.5)High Income 780,810 (22.8) 30,901 (4.0)Latin America – Central & Caribbean 165,354 (34.0) 45,766 (27.7)Latin America – South 336,997 (21.2) 64,580 (19.2)Middle East 216,556 (31.1) 56,661 (26.2)North Africa 204,711 (50.0) 70,692 (34.5)World Total 5,954,072 2,607,890* Figures in parentheses in column 2 are the percent of total population in rural areas whereas incolumn 3 these are percent of agricultural to total population.Source: FAO Statistical Database.
Appendix 5 : Human Population in Livestock Production Systems
(‘000)Region Livestock
GrasslandMixed
RainfedMixed
IntensiveOther
South & East Africa 130,366 153,039 4,617 7,473West Africa 42,920 188,551 0 3,257China 263,681 312,958 590,946 7,864East Asia & Pacific (excl China) 2,310 112,612 415,900 6,712India 6,842 418,454 454,324 21,865South Asia (excl India) 0 0 322,141 8,664Eastern Europe & Central Asia 0 58,368 0 1,230High Income 4,084 2,769 21,679 388Latin America - Central & Caribbean 18,937 88,186 43,728 2,873Latin America - South 113,828 175,121 16,773 5,243Middle East 30,103 16,820 84,233 5,925North Africa 4,877 61,064 54,844 6,749World Total 617,948 1,587,942 2,009,185 78,243Source; Thornton et al, ILRI, 2000

30
Appendix 6: Distribution of Livestock Population Across Regions of the World
(‘000)Region Buffalo Cattle Camels Sheep Goats Equines Other
CamelidsPigs Poultry
South & East Africa 0.03 155,103 11,139 126,820 115,135 10,873 0 8,155 409,253West Africa 0 59,579 2,615 60,958 73,940 4,895 0 18,529 383,385China 22,545 99,212 350 120,956 134,801 23,246 400,348 3,677,000East Asia & Pacific (excl China) 16,825 48,412 355 23,091 36,857 4,261 0 68,779 1,749,958India 90,909 212,121 1,030 57,100 121,362 2,190 0 16,005 375,000South Asia (excl India) 26,264 51,983 1,465 47,649 92,041 6,521 0 917 411,078Eastern Europe & Central Asia 557 96,259 271 104,055 17,949 8,697 0 79,015 1,076,513High Income 169 221,933 251 292,801 15,706 9,242 0 203,031 3,444,461Latin America - Central & Caribbean 0 50,116 0 7,261 12,427 15,961 0 22,397 593,248Latin America - South 1,706 296,897 0 81,368 25,906 23,053 5,777 50,492 1,520,741Middle East 1,013 21,623 1,082 142,942 64,739 4,955 0 61 724,562North Africa 6,299 11,497 768 54,550 18,742 8,506 0 77 497,713World Total 166,287 1,324,735 19,327 1,119,552 729,605 122,400 5,777 867,805 14,862,912Source: FAO Statistical Database
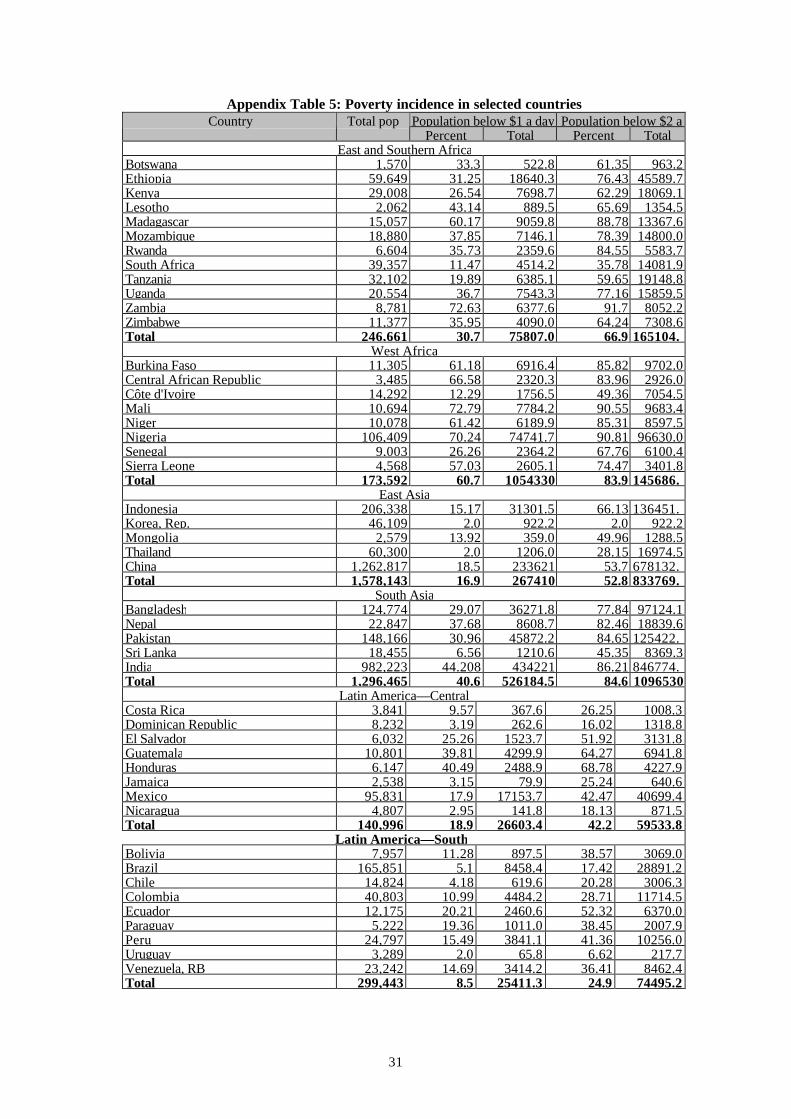
31
Appendix Table 5: Poverty incidence in selected countriesPopulation below $1 a day Population below $2 aCountry Total pop
Percent Total Percent TotalEast and Southern Africa
Botswana 1,570 33.3 522.8 61.35 963.2Ethiopia 59,649 31.25 18640.3 76.43 45589.7Kenya 29,008 26.54 7698.7 62.29 18069.1Lesotho 2,062 43.14 889.5 65.69 1354.5Madagascar 15,057 60.17 9059.8 88.78 13367.6Mozambique 18,880 37.85 7146.1 78.39 14800.0Rwanda 6,604 35.73 2359.6 84.55 5583.7South Africa 39,357 11.47 4514.2 35.78 14081.9Tanzania 32,102 19.89 6385.1 59.65 19148.8Uganda 20,554 36.7 7543.3 77.16 15859.5Zambia 8,781 72.63 6377.6 91.7 8052.2Zimbabwe 11,377 35.95 4090.0 64.24 7308.6Total 246,661 30.7 75807.0 66.9 165104.
West AfricaBurkina Faso 11,305 61.18 6916.4 85.82 9702.0Central African Republic 3,485 66.58 2320.3 83.96 2926.0Côte d'Ivoire 14,292 12.29 1756.5 49.36 7054.5Mali 10,694 72.79 7784.2 90.55 9683.4Niger 10,078 61.42 6189.9 85.31 8597.5Nigeria 106,409 70.24 74741.7 90.81 96630.0Senegal 9,003 26.26 2364.2 67.76 6100.4Sierra Leone 4,568 57.03 2605.1 74.47 3401.8Total 173,592 60.7 1054330 83.9 145686.
East AsiaIndonesia 206,338 15.17 31301.5 66.13 136451.Korea, Rep. 46,109 2.0 922.2 2.0 922.2Mongolia 2,579 13.92 359.0 49.96 1288.5Thailand 60,300 2.0 1206.0 28.15 16974.5China 1,262,817 18.5 233621 53.7 678132.Total 1,578,143 16.9 267410 52.8 833769.
South AsiaBangladesh 124,774 29.07 36271.8 77.84 97124.1Nepal 22,847 37.68 8608.7 82.46 18839.6Pakistan 148,166 30.96 45872.2 84.65 125422.Sri Lanka 18,455 6.56 1210.6 45.35 8369.3India 982,223 44.208 434221 86.21 846774.Total 1,296,465 40.6 526184.5 84.6 1096530
Latin America—CentralCosta Rica 3,841 9.57 367.6 26.25 1008.3Dominican Republic 8,232 3.19 262.6 16.02 1318.8El Salvador 6,032 25.26 1523.7 51.92 3131.8Guatemala 10,801 39.81 4299.9 64.27 6941.8Honduras 6,147 40.49 2488.9 68.78 4227.9Jamaica 2,538 3.15 79.9 25.24 640.6Mexico 95,831 17.9 17153.7 42.47 40699.4Nicaragua 4,807 2.95 141.8 18.13 871.5Total 140,996 18.9 26603.4 42.2 59533.8
Latin America—SouthBolivia 7,957 11.28 897.5 38.57 3069.0Brazil 165,851 5.1 8458.4 17.42 28891.2Chile 14,824 4.18 619.6 20.28 3006.3Colombia 40,803 10.99 4484.2 28.71 11714.5Ecuador 12,175 20.21 2460.6 52.32 6370.0Paraguay 5,222 19.36 1011.0 38.45 2007.9Peru 24,797 15.49 3841.1 41.36 10256.0Uruguay 3,289 2.0 65.8 6.62 217.7Venezuela, RB 23,242 14.69 3414.2 36.41 8462.4Total 299,443 8.5 25411.3 24.9 74495.2