Embed Size (px)
Citation preview

Economic and Market Report
EU Automobile Industry
September 2015 | Q2 2015
ACEA Document – 11/09/2015 1
CONTENTS EU Economic Outlook ................................................................................................................... 2
Passenger cars ............................................................................................................................... 4
Registrations ............................................................................................................................. 4
World ..................................................................................................................................... 4
The European Union .............................................................................................................. 6
Production ................................................................................................................................. 8
World ..................................................................................................................................... 8
The European Union ............................................................................................................ 10
Trade ........................................................................................................................................ 11
Imports ................................................................................................................................. 11
Exports ................................................................................................................................. 13
Commercial vehicles .................................................................................................................... 14
Registrations in the EU ............................................................................................................ 14
Global production outlook ....................................................................................................... 19
Trade ....................................................................................................................................... 20
Imports ................................................................................................................................ 21
Exports ................................................................................................................................ 22
ACEA Document – 11/09/2015 2
EU ECONOMIC OUTLOOK
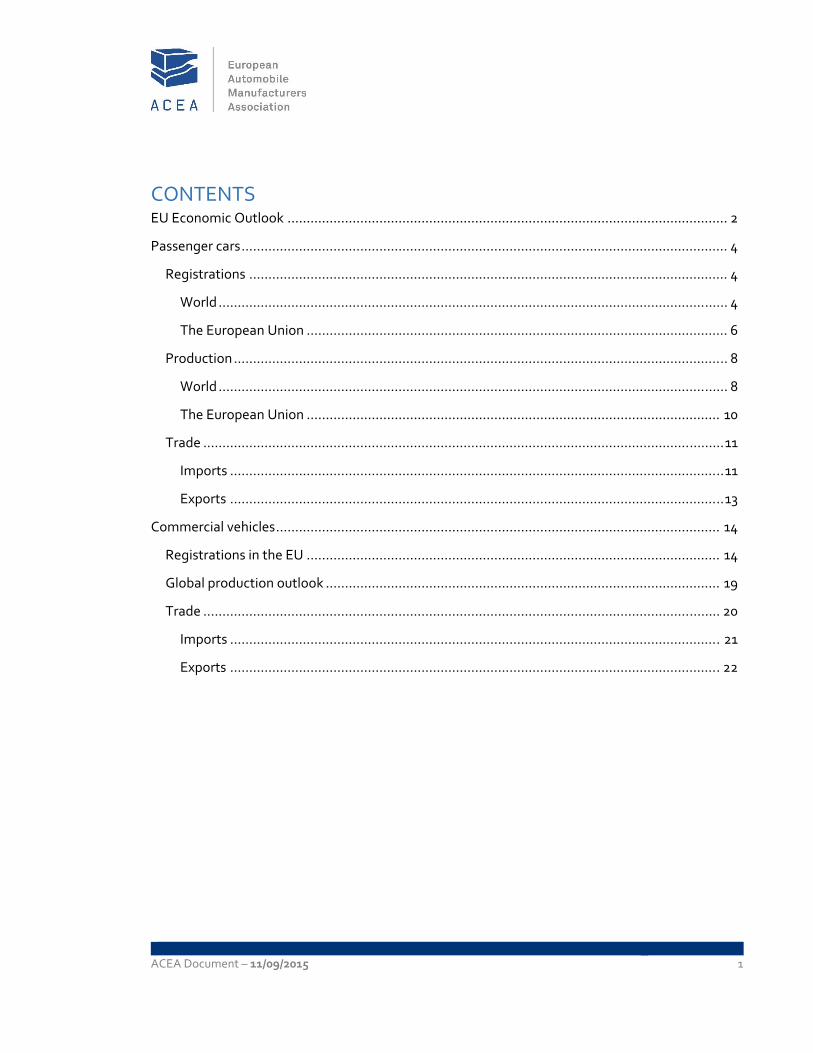
Seasonally adjusted GDP rose by 0.4% in both the euro area and the EU during the second quarter
of 2015 compared with the previous quarter, according to Eurostat.
Household final consumption expenditure had a positive contribution to GDP growth both in the
euro area and the EU, while businesses remain reluctant to invest despite the European Central
Bank's quantitative easing programme.
Real GDP in 2015 is expected to rise by 1.8% in the EU and by 1.5% in the euro area, according to
the European Commission's 2015 Spring Economic Forecast.
Figure 1: EU, euro area and US GDP growth rates | % change over the previous quarter
Source: Eurostat news releases 152/2015 ‐ 8 September 2015
ACEA Document – 11/09/2015 3
The euro area’s annual inflation is expected to be 0.2% in August 2015 compared with July,
according to Eurostat estimates. Eurozone consumer prices also rose slightly in May, following six
months of deflation. This inflation rate also reflects weak demand, a reminder that the EU’s recent
recovery is still far from robust and is now threatened by China’s growth deceleration.
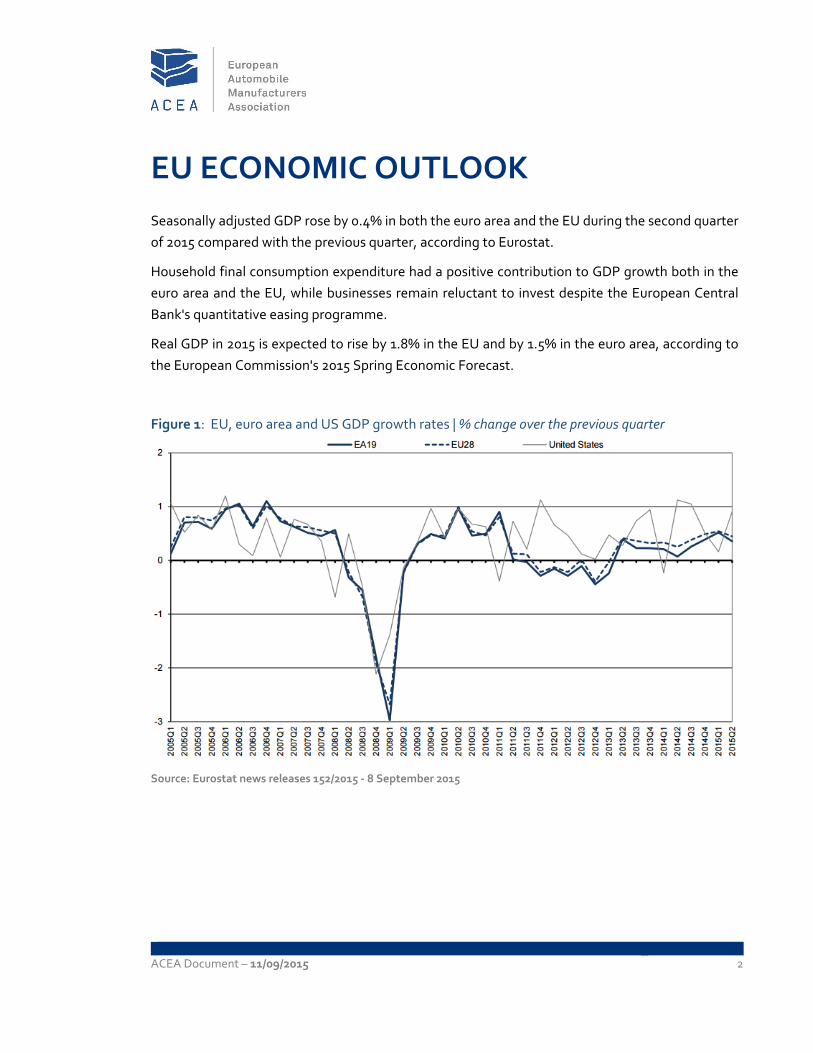
The EU unemployment rate was 9.5% in July 2015, down from 9.6% in June 2015 and 10.2% in July
2014. This is the lowest rate recorded in the EU since June 2011, according to Eurostat. Among the
member states, the lowest unemployment rates in July 2015 were seen in Germany (4.7%), the
Czech Republic and Malta (both 5.1%). The highest rates were in Greece (25.0% in May 2015) and
Spain (22.2%).
Based on European Commission’s latest Economic Forecast, unemployment in the EU and in the
euro area is expected to fall to respectively 9.6% and 11.0% this year.
Figure 2: Unemployment rates in July 2015, seasonally adjusted
Source: Eurostat news releases 147/2015 ‐ 1 September 2015
ACEA Document – 11/09/2015 4
PASSENGER CARS
REGISTRATIONS
WORLD
Through the first half of the year, global new passenger car demand rose (+1.4%), reaching 36.1
million units. This rise was mainly driven by China (+6.3%), which represented more than one
quarter of total car sales. The Triad countries displayed diverse outcomes so far in 2015, with the
EU (+8.2%) and the US (+3.3%) posting growth, while the Japanese market (‐12.3%) performed less
well than in the same period last year.
In the first half of 2015, around 8.6 million passenger cars were registered in Europe1 (+2.3%).
European passenger car registrations currently represent 23.8% of the global market. Substantial
growth posted by EU member states contributed significantly to the positive global picture. Six
months into the year, the Russian market was down (‐36.6%) with Ukraine mirroring this trend with
a double‐digit decline (‐70.8%). The situation in Russia is still far from being solved and the
underlying macroeconomic environment remains highly challenging. Only Turkey is on a recovery
path (+45.2%), essentially rebounding from last year’s credit crisis.
Looking at the other mature markets, Japanese sales amounted to 2.2 million units in the first half
of 2015 (‐12.3%). This is mainly due to the Japanese government decision to increase consumption
tax to 8% in April 2014. In the US, first‐half sales reached 7.1 million units, accounting for 19.7% of
the global market.
China’s stock market is in the middle of a sharp correction that will have some limited impact on
consumer spending and enterprise investment. Notwithstanding, Chinese sales continued to grow
(+6.3%) in the first half of 2015. Looking at the other emerging markets, South Korea (+2.4%) and
India (+6.0%) also posted growth during this period, supported by lower inflation and lower oil
prices.
1 Includes Belarus, Bosnia‐Herzegovina, Kazakhstan, Macedonia, Russia, Serbia, Turkey, Ukraine and
Uzbekistan
ACEA Document – 11/09/2015 5
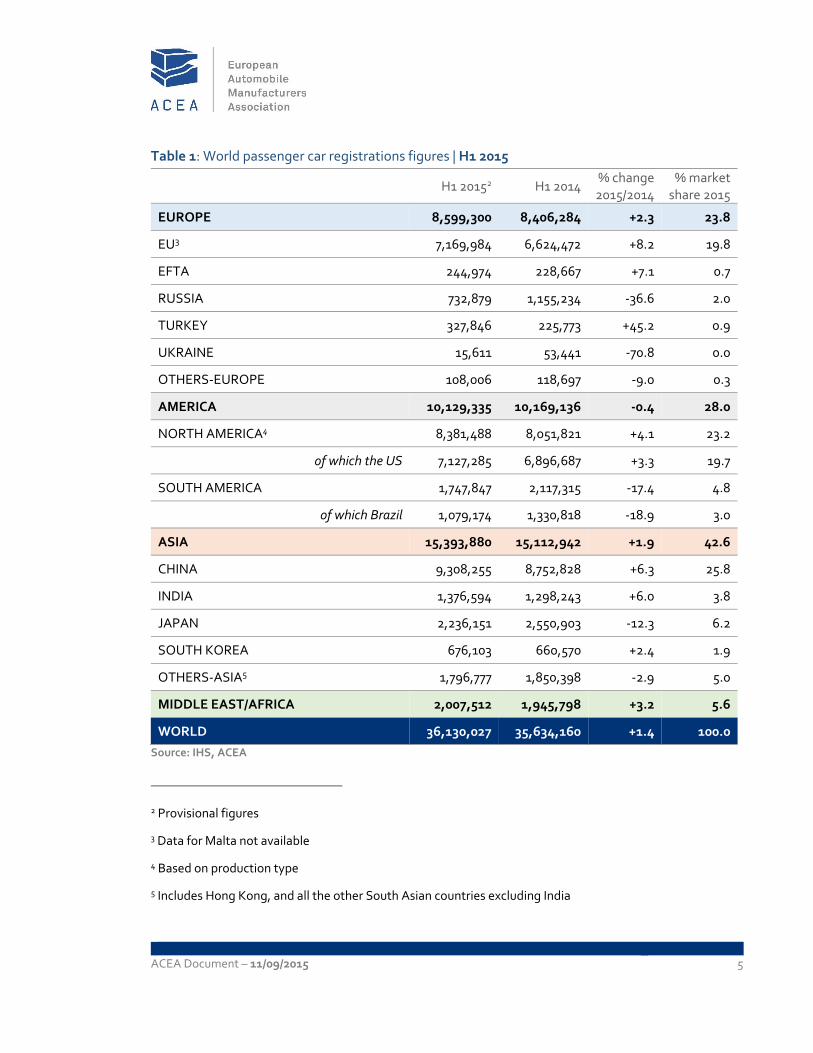
Table 1: World passenger car registrations figures | H1 2015
H1 20152 H1 2014 % change 2015/2014
% market share 2015
EUROPE 8,599,300 8,406,284 +2.3 23.8
EU3 7,169,984 6,624,472 +8.2 19.8
EFTA 244,974 228,667 +7.1 0.7
RUSSIA 732,879 1,155,234 ‐36.6 2.0
TURKEY 327,846 225,773 +45.2 0.9
UKRAINE 15,611 53,441 ‐70.8 0.0
OTHERS‐EUROPE 108,006 118,697 ‐9.0 0.3
AMERICA 10,129,335 10,169,136 ‐0.4 28.0
NORTH AMERICA4 8,381,488 8,051,821 +4.1 23.2
of which the US 7,127,285 6,896,687 +3.3 19.7
SOUTH AMERICA 1,747,847 2,117,315 ‐17.4 4.8
of which Brazil 1,079,174 1,330,818 ‐18.9 3.0
ASIA 15,393,880 15,112,942 +1.9 42.6
CHINA 9,308,255 8,752,828 +6.3 25.8
INDIA 1,376,594 1,298,243 +6.0 3.8
JAPAN 2,236,151 2,550,903 ‐12.3 6.2
SOUTH KOREA 676,103 660,570 +2.4 1.9
OTHERS‐ASIA5 1,796,777 1,850,398 ‐2.9 5.0
MIDDLE EAST/AFRICA 2,007,512 1,945,798 +3.2 5.6
WORLD 36,130,027 35,634,160 +1.4 100.0
Source: IHS, ACEA
2 Provisional figures
3 Data for Malta not available
4 Based on production type
5 Includes Hong Kong, and all the other South Asian countries excluding India
ACEA Document – 11/09/2015 6
THE EUROPEAN UNION
In the first half of 2015, new passenger car registrations increased (+8.2%), surpassing 7 million
units (7,169,984). All major markets posted growth, contributing to the overall upturn of the EU
market over the period. Registrations in Spain (+22.0%), Italy (+15.2%), the UK (+7.0%), France
(+6.1%) and Germany (+5.2%) increased compared to the same period one year ago.
This confirms the good start to 2015 and marks an acceleration of the recovery that started in the
second half of 2014. The low base of comparison helps, and the EU sales still need to recover from
the losses registered in the recent past, otherwise the vehicle fleet would gradually age.
Nevertheless, the market is still far from robust. Current growth is largely derived from supporting
practices, such as the Spanish scrapping scheme or support coming from manufacturers through a
range of channels (eg rental and dealer cars as well as self‐registrations).
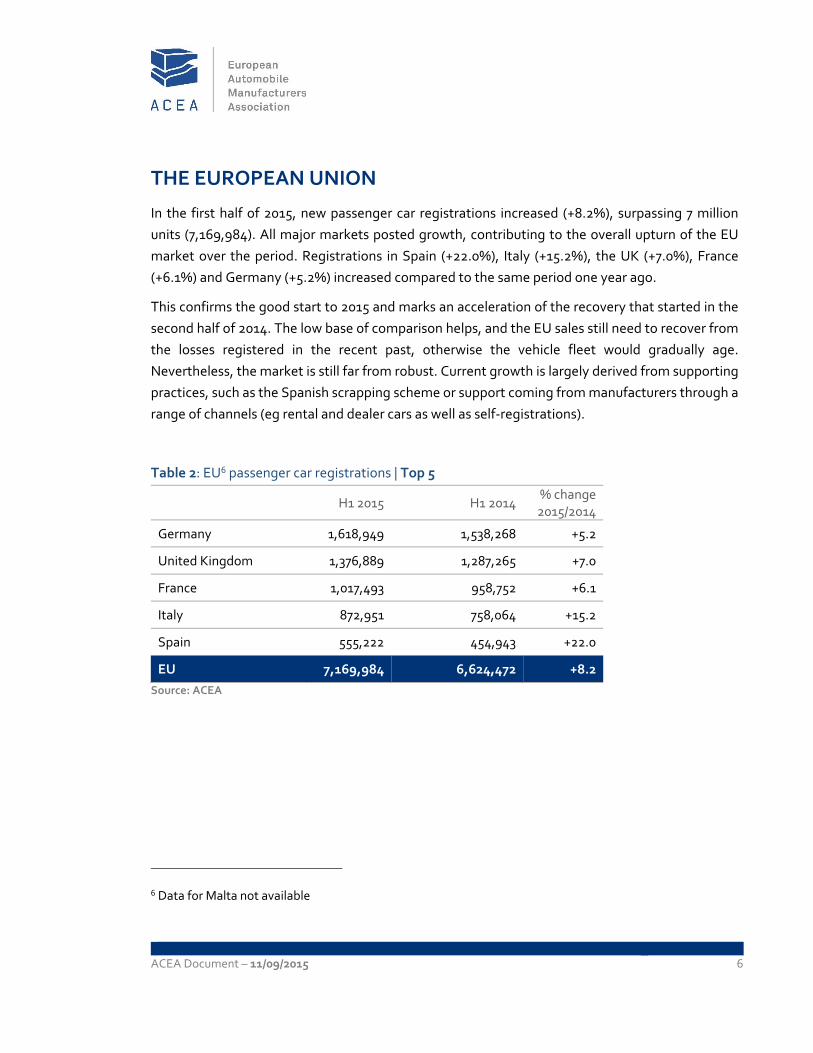
Table 2: EU6 passenger car registrations | Top 5
H1 2015 H1 2014 % change 2015/2014
Germany 1,618,949 1,538,268 +5.2
United Kingdom 1,376,889 1,287,265 +7.0
France 1,017,493 958,752 +6.1
Italy 872,951 758,064 +15.2
Spain 555,222 454,943 +22.0
EU 7,169,984 6,624,472 +8.2
Source: ACEA
6 Data for Malta not available
ACEA Document – 11/09/2015 7
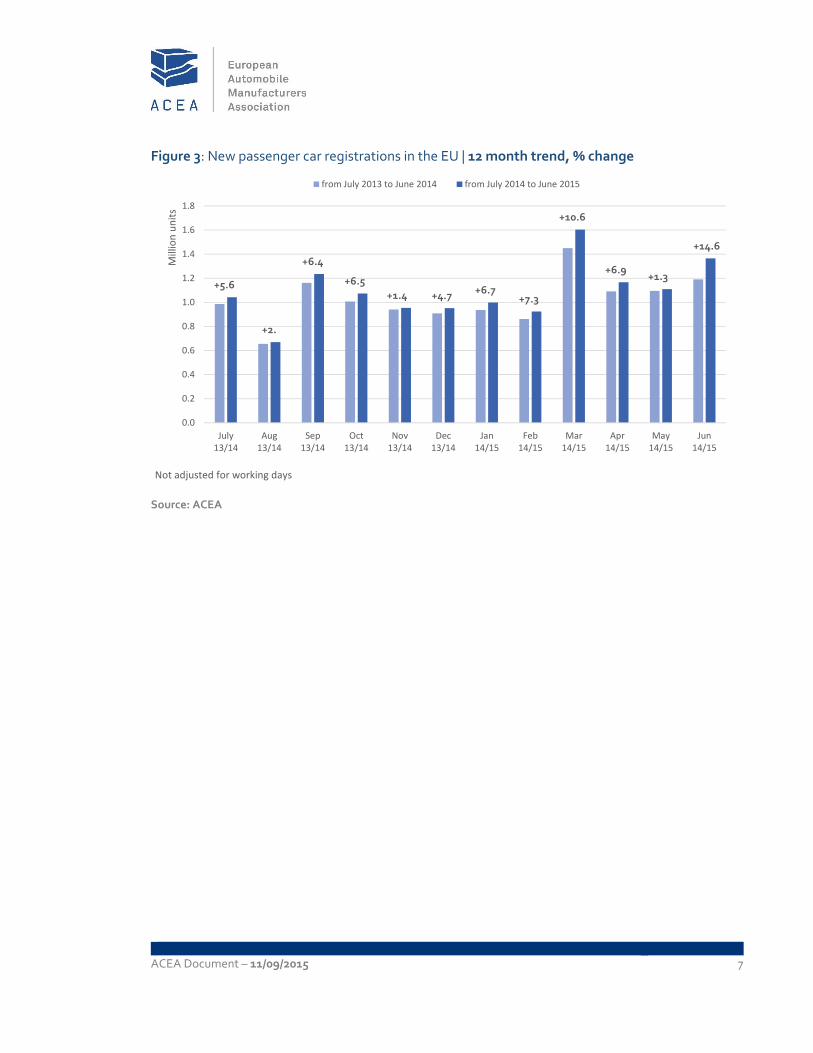
Figure 3: New passenger car registrations in the EU | 12 month trend, % change
Source: ACEA
+5.6
+2.
+6.4
+6.5
+1.4 +4.7+6.7
+7.3
+10.6
+6.9+1.3
+14.6
0.0
0.2
0.4
0.6
0.8
1.0
1.2
1.4
1.6
1.8
July13/14
Aug13/14
Sep13/14
Oct13/14
Nov13/14
Dec13/14
Jan14/15
Feb14/15
Mar14/15
Apr14/15
May14/15
Jun14/15
Million units
Not adjusted for working days
from July 2013 to June 2014 from July 2014 to June 2015
ACEA Document – 11/09/2015 8
PRODUCTION
WORLD
The European market showed contrasting signs in the first half of 2015. Within the EU perimeter
(+5.8%) and in Turkey (+5.9%) production increased during the first six months of the year, but it
decreased in Russia (‐28.2%), Ukraine (‐94.5) and in the other Commonwealth of Independent
States because of the Russian market’s collapse.
North American passenger car production continued to expand over the first six months of 2015.
US output increased (+3.8%) to 4.7 million units in the first half, based on the continuing strength
of its domestic demand. On the other hand, passenger car production dramatically dropped in
South America (‐16.1%) compared with the same period in 2014. Brazil is struggling with recession
and rising inflation, and the car sector has suffered. Output during the first six months of 2015 fell
(‐15.9%) to 1 million units.
So far in 2015, Japanese passenger car production dropped (‐8.7%) to 3.9 million units, mainly
because of gradually decreasing domestic sales after consumption tax increase from 5% to 8% in
April 2014. Over the period, South Korean production also shrank (‐0.7%) due to Chevrolet’s
withdrawal from Europe.
Chinese passenger car production continued to expand in the first half (+9.6%), reaching 9.2 million
units. Looking at other markets, production in India increased (+7.5%) to 1.6 million passenger cars
thanks to the strong domestic sales, while Indonesia’s production decreased
(‐15.9%) affected by a slowdown in the economic growth.
ACEA Document – 11/09/2015 9
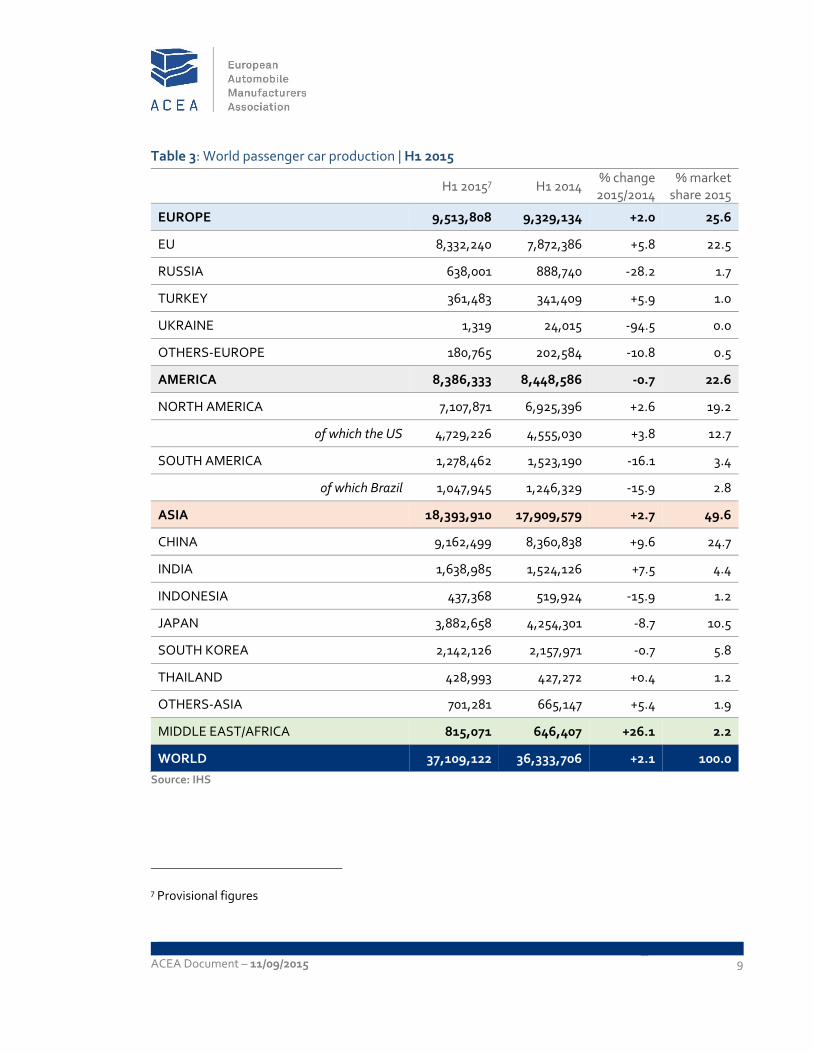
Table 3: World passenger car production | H1 2015
H1 20157 H1 2014 % change 2015/2014
% market share 2015
EUROPE 9,513,808 9,329,134 +2.0 25.6
EU 8,332,240 7,872,386 +5.8 22.5
RUSSIA 638,001 888,740 ‐28.2 1.7
TURKEY 361,483 341,409 +5.9 1.0
UKRAINE 1,319 24,015 ‐94.5 0.0
OTHERS‐EUROPE 180,765 202,584 ‐10.8 0.5
AMERICA 8,386,333 8,448,586 ‐0.7 22.6
NORTH AMERICA 7,107,871 6,925,396 +2.6 19.2
of which the US 4,729,226 4,555,030 +3.8 12.7
SOUTH AMERICA 1,278,462 1,523,190 ‐16.1 3.4
of which Brazil 1,047,945 1,246,329 ‐15.9 2.8
ASIA 18,393,910 17,909,579 +2.7 49.6
CHINA 9,162,499 8,360,838 +9.6 24.7
INDIA 1,638,985 1,524,126 +7.5 4.4
INDONESIA 437,368 519,924 ‐15.9 1.2
JAPAN 3,882,658 4,254,301 ‐8.7 10.5
SOUTH KOREA 2,142,126 2,157,971 ‐0.7 5.8
THAILAND 428,993 427,272 +0.4 1.2
OTHERS‐ASIA 701,281 665,147 +5.4 1.9
MIDDLE EAST/AFRICA 815,071 646,407 +26.1 2.2
WORLD 37,109,122 36,333,706 +2.1 100.0
Source: IHS
7 Provisional figures
ACEA Document – 11/09/2015 10
THE EUROPEAN UNION
EU passenger car production is growing, with 8.3 million units produced in the first half, an increase
(+5.8%) compared to the same period last year, confirming the EU’s position as the second largest
passenger car world producer after China.
Results were diverse among countries. Among the main production countries of Western Europe,
Germany (‐0.4%) France (‐1.1%) and the United Kingdom (+0.3) remained stable, while Spain
(+19.7%) and Italy (+58.5%) posted double‐digit growth. In Central Europe, all markets posted
growth, especially Czech Republic (+10.9%), Poland (+24.1%) and Hungary (+14.0), which
significantly contributed to the positive outcome of the EU perimeter.
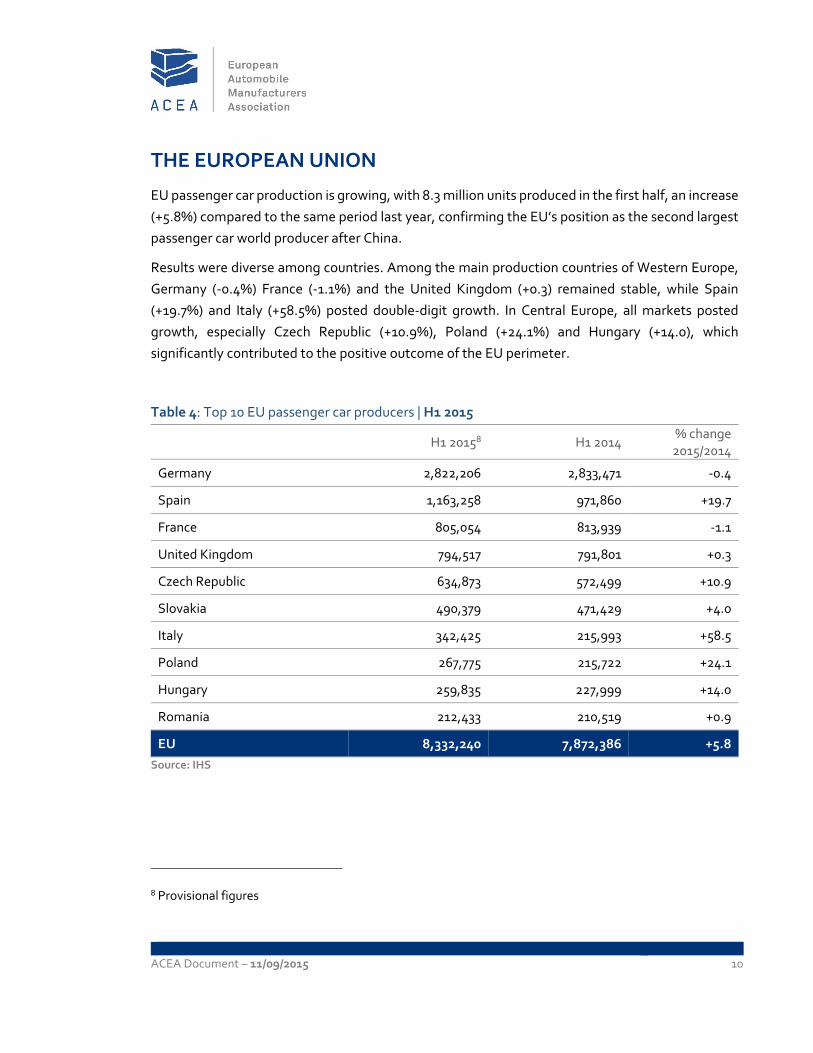
Table 4: Top 10 EU passenger car producers | H1 2015
H1 20158 H1 2014 % change 2015/2014
Germany 2,822,206 2,833,471 ‐0.4
Spain 1,163,258 971,860 +19.7
France 805,054 813,939 ‐1.1
United Kingdom 794,517 791,801 +0.3
Czech Republic 634,873 572,499 +10.9
Slovakia 490,379 471,429 +4.0
Italy 342,425 215,993 +58.5
Poland 267,775 215,722 +24.1
Hungary 259,835 227,999 +14.0
Romania 212,433 210,519 +0.9
EU 8,332,240 7,872,386 +5.8
Source: IHS
8 Provisional figures
ACEA Document – 11/09/2015 11
TRADE
In the first half of 2015, the EU exported 2.9 million passenger cars worth €63.5 billion. Imports in
that same period amounted to roughly a quarter of that value (€15.2 billion), resulting in an EU
trade surplus of €48.2 billion, up (+7.6%) compared with the same period in 2014.
The value of EU imports of passenger cars increased (+29.1%) over the first half of the year. During
the same period, EU exports grew at a slower pace (+12.1%).
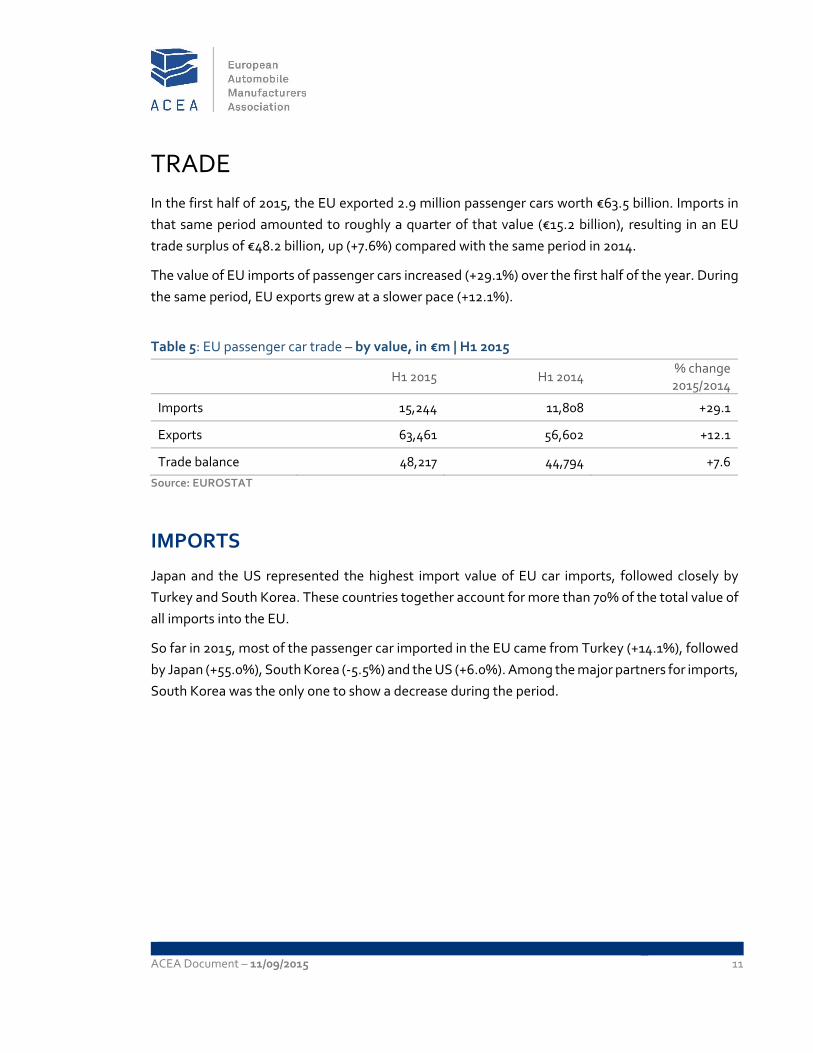
Table 5: EU passenger car trade – by value, in €m | H1 2015
H1 2015 H1 2014 % change 2015/2014
Imports 15,244 11,808 +29.1
Exports 63,461 56,602 +12.1
Trade balance 48,217 44,794 +7.6
Source: EUROSTAT
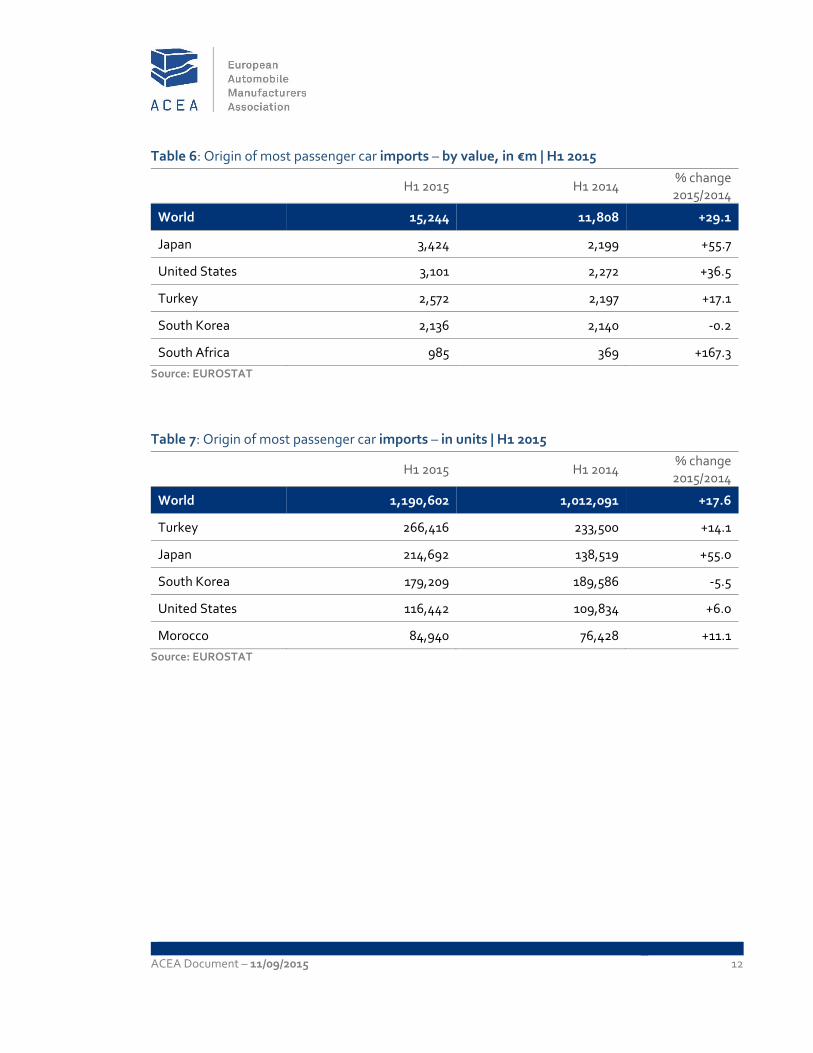
IMPORTS
Japan and the US represented the highest import value of EU car imports, followed closely by
Turkey and South Korea. These countries together account for more than 70% of the total value of
all imports into the EU.
So far in 2015, most of the passenger car imported in the EU came from Turkey (+14.1%), followed
by Japan (+55.0%), South Korea (‐5.5%) and the US (+6.0%). Among the major partners for imports,
South Korea was the only one to show a decrease during the period.
ACEA Document – 11/09/2015 12
Table 6: Origin of most passenger car imports – by value, in €m | H1 2015
H1 2015 H1 2014 % change 2015/2014
World 15,244 11,808 +29.1
Japan 3,424 2,199 +55.7
United States 3,101 2,272 +36.5
Turkey 2,572 2,197 +17.1
South Korea 2,136 2,140 ‐0.2
South Africa 985 369 +167.3
Source: EUROSTAT
Table 7: Origin of most passenger car imports – in units | H1 2015
H1 2015 H1 2014 % change 2015/2014
World 1,190,602 1,012,091 +17.6
Turkey 266,416 233,500 +14.1
Japan 214,692 138,519 +55.0
South Korea 179,209 189,586 ‐5.5
United States 116,442 109,834 +6.0
Morocco 84,940 76,428 +11.1
Source: EUROSTAT
ACEA Document – 11/09/2015 13
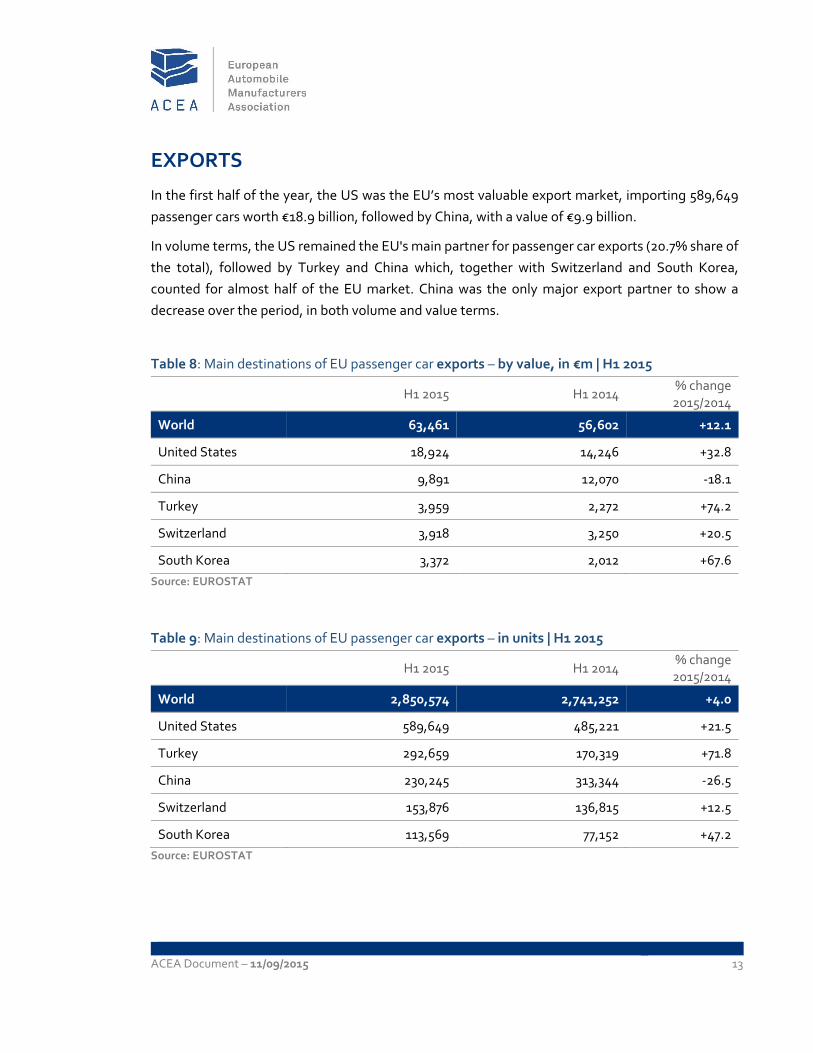
EXPORTS
In the first half of the year, the US was the EU’s most valuable export market, importing 589,649
passenger cars worth €18.9 billion, followed by China, with a value of €9.9 billion.
In volume terms, the US remained the EU's main partner for passenger car exports (20.7% share of
the total), followed by Turkey and China which, together with Switzerland and South Korea,
counted for almost half of the EU market. China was the only major export partner to show a
decrease over the period, in both volume and value terms.
Table 8: Main destinations of EU passenger car exports – by value, in €m | H1 2015
H1 2015 H1 2014 % change 2015/2014
World 63,461 56,602 +12.1
United States 18,924 14,246 +32.8
China 9,891 12,070 ‐18.1
Turkey 3,959 2,272 +74.2
Switzerland 3,918 3,250 +20.5
South Korea 3,372 2,012 +67.6
Source: EUROSTAT
Table 9: Main destinations of EU passenger car exports – in units | H1 2015
H1 2015 H1 2014 % change 2015/2014
World 2,850,574 2,741,252 +4.0
United States 589,649 485,221 +21.5
Turkey 292,659 170,319 +71.8
China 230,245 313,344 ‐26.5
Switzerland 153,876 136,815 +12.5
South Korea 113,569 77,152 +47.2
Source: EUROSTAT
ACEA Document – 11/09/2015 14
COMMERCIAL VEHICLES
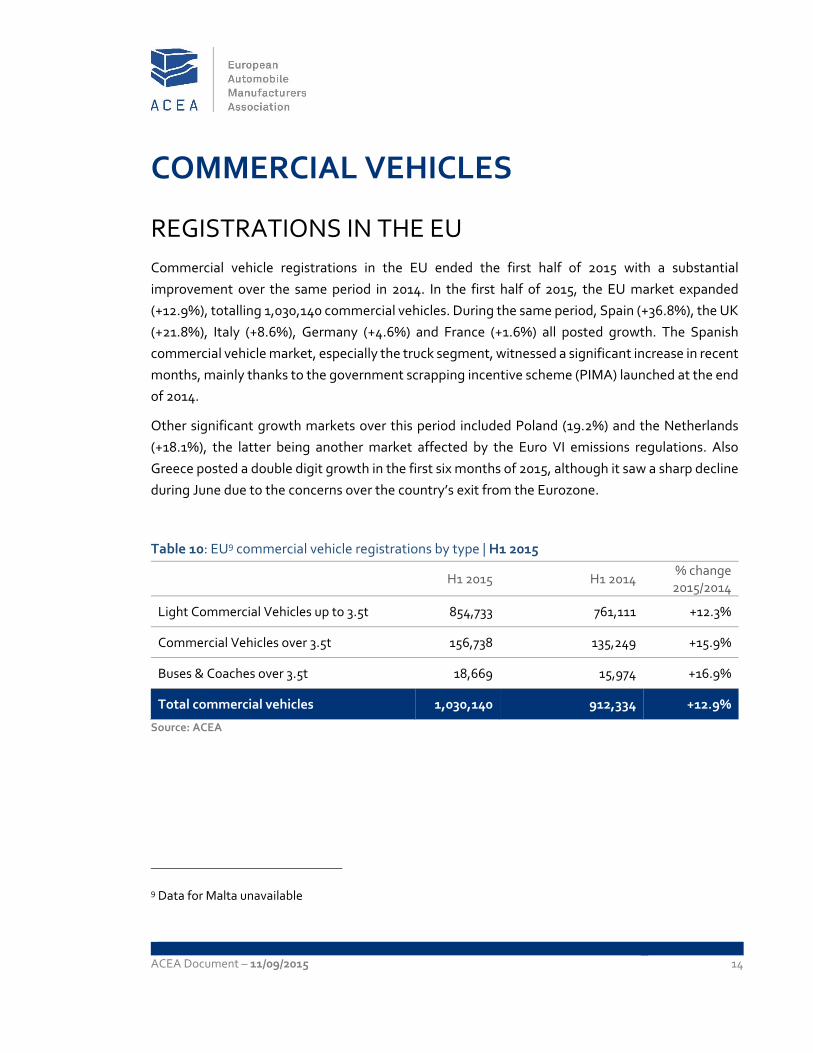
REGISTRATIONS IN THE EU
Commercial vehicle registrations in the EU ended the first half of 2015 with a substantial
improvement over the same period in 2014. In the first half of 2015, the EU market expanded
(+12.9%), totalling 1,030,140 commercial vehicles. During the same period, Spain (+36.8%), the UK
(+21.8%), Italy (+8.6%), Germany (+4.6%) and France (+1.6%) all posted growth. The Spanish
commercial vehicle market, especially the truck segment, witnessed a significant increase in recent
months, mainly thanks to the government scrapping incentive scheme (PIMA) launched at the end
of 2014.
Other significant growth markets over this period included Poland (19.2%) and the Netherlands
(+18.1%), the latter being another market affected by the Euro VI emissions regulations. Also
Greece posted a double digit growth in the first six months of 2015, although it saw a sharp decline
during June due to the concerns over the country’s exit from the Eurozone.
Table 10: EU9 commercial vehicle registrations by type | H1 2015
H1 2015 H1 2014 % change 2015/2014
Light Commercial Vehicles up to 3.5t 854,733 761,111 +12.3%
Commercial Vehicles over 3.5t 156,738 135,249 +15.9%
Buses & Coaches over 3.5t 18,669 15,974 +16.9%
Total commercial vehicles 1,030,140 912,334 +12.9%
Source: ACEA
9 Data for Malta unavailable
ACEA Document – 11/09/2015 15
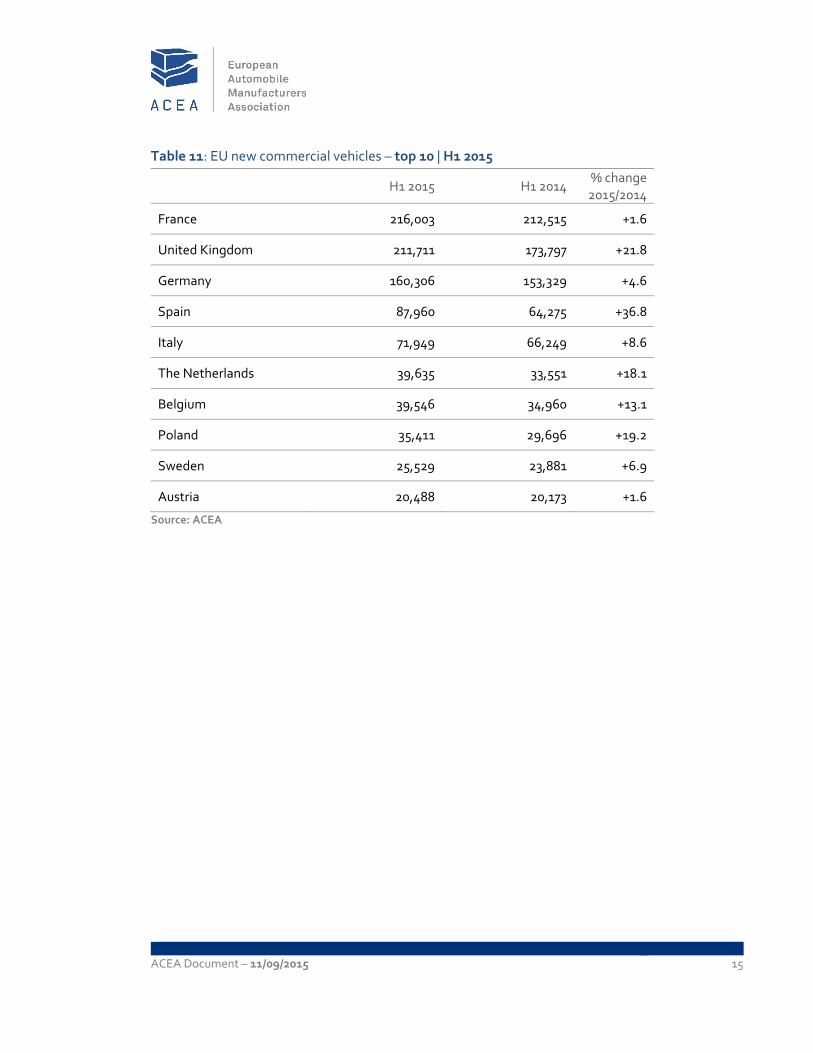
Table 11: EU new commercial vehicles – top 10 | H1 2015
H1 2015 H1 2014 % change 2015/2014
France 216,003 212,515 +1.6
United Kingdom 211,711 173,797 +21.8
Germany 160,306 153,329 +4.6
Spain 87,960 64,275 +36.8
Italy 71,949 66,249 +8.6
The Netherlands 39,635 33,551 +18.1
Belgium 39,546 34,960 +13.1
Poland 35,411 29,696 +19.2
Sweden 25,529 23,881 +6.9
Austria 20,488 20,173 +1.6
Source: ACEA
ACEA Document – 11/09/2015 16
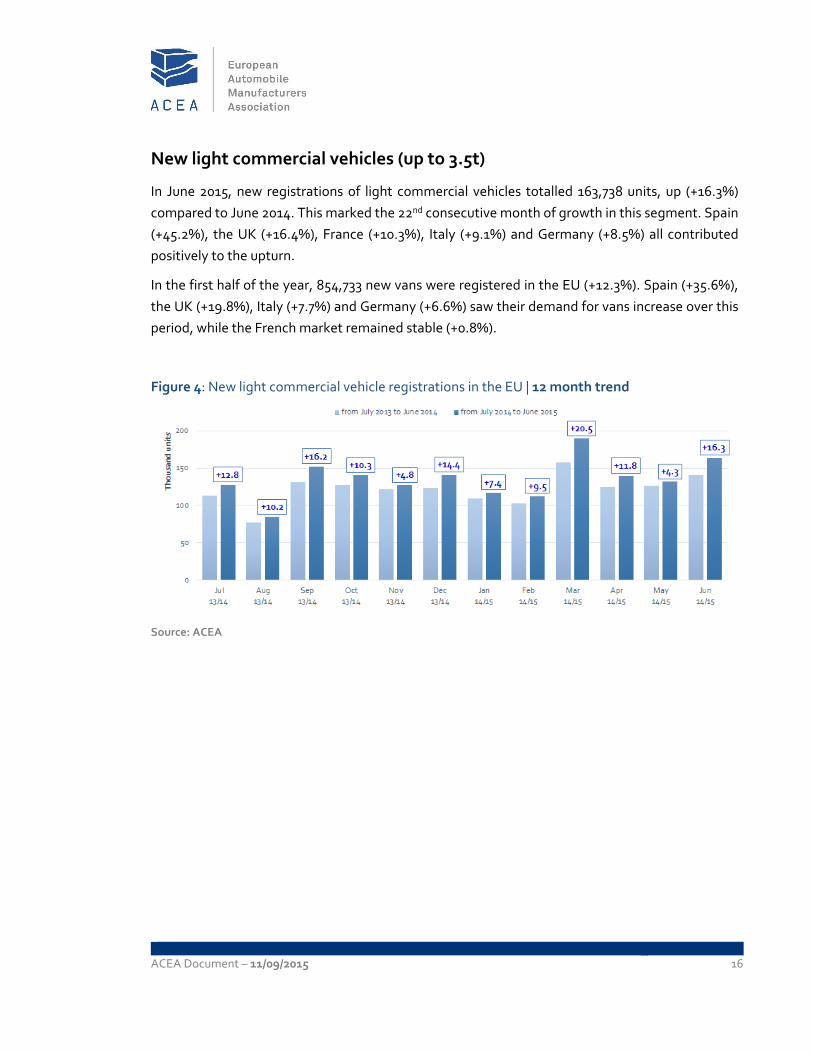
New light commercial vehicles (up to 3.5t)
In June 2015, new registrations of light commercial vehicles totalled 163,738 units, up (+16.3%)
compared to June 2014. This marked the 22nd consecutive month of growth in this segment. Spain
(+45.2%), the UK (+16.4%), France (+10.3%), Italy (+9.1%) and Germany (+8.5%) all contributed
positively to the upturn.
In the first half of the year, 854,733 new vans were registered in the EU (+12.3%). Spain (+35.6%),
the UK (+19.8%), Italy (+7.7%) and Germany (+6.6%) saw their demand for vans increase over this
period, while the French market remained stable (+0.8%).
Figure 4: New light commercial vehicle registrations in the EU | 12 month trend
Source: ACEA
ACEA Document – 11/09/2015 17
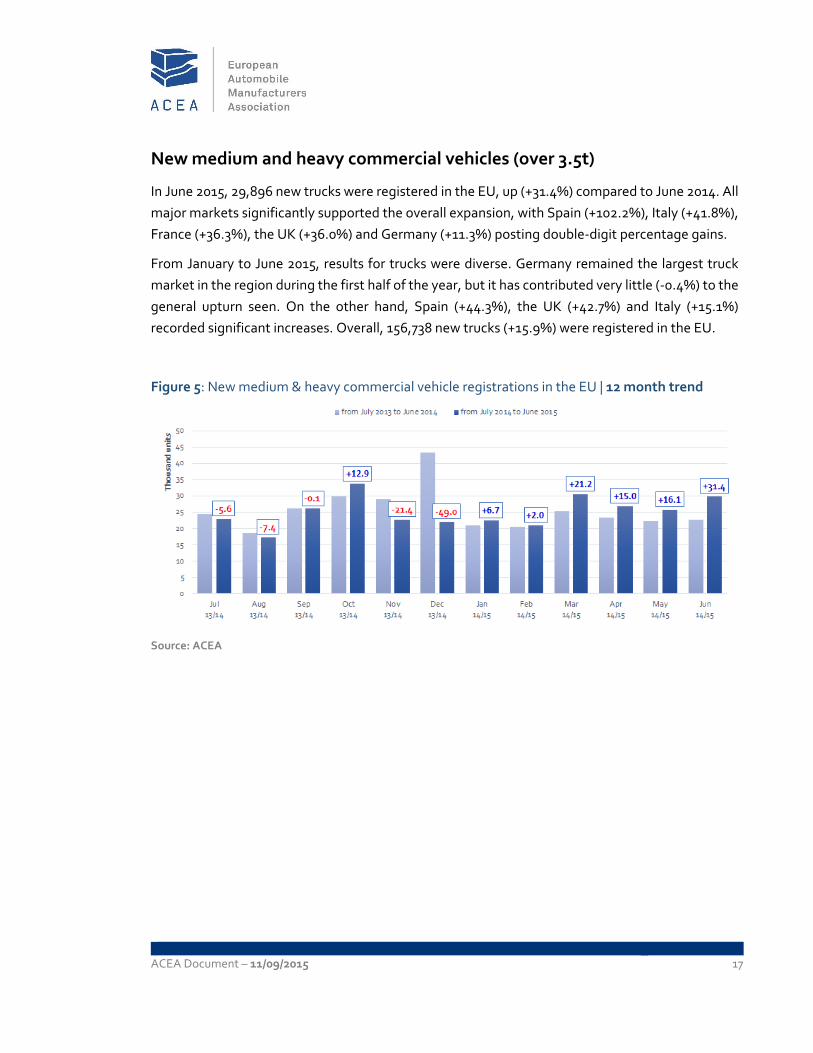
New medium and heavy commercial vehicles (over 3.5t)
In June 2015, 29,896 new trucks were registered in the EU, up (+31.4%) compared to June 2014. All
major markets significantly supported the overall expansion, with Spain (+102.2%), Italy (+41.8%),
France (+36.3%), the UK (+36.0%) and Germany (+11.3%) posting double‐digit percentage gains.
From January to June 2015, results for trucks were diverse. Germany remained the largest truck
market in the region during the first half of the year, but it has contributed very little (‐0.4%) to the
general upturn seen. On the other hand, Spain (+44.3%), the UK (+42.7%) and Italy (+15.1%)
recorded significant increases. Overall, 156,738 new trucks (+15.9%) were registered in the EU.
Figure 5: New medium & heavy commercial vehicle registrations in the EU | 12 month trend
Source: ACEA
ACEA Document – 11/09/2015 18
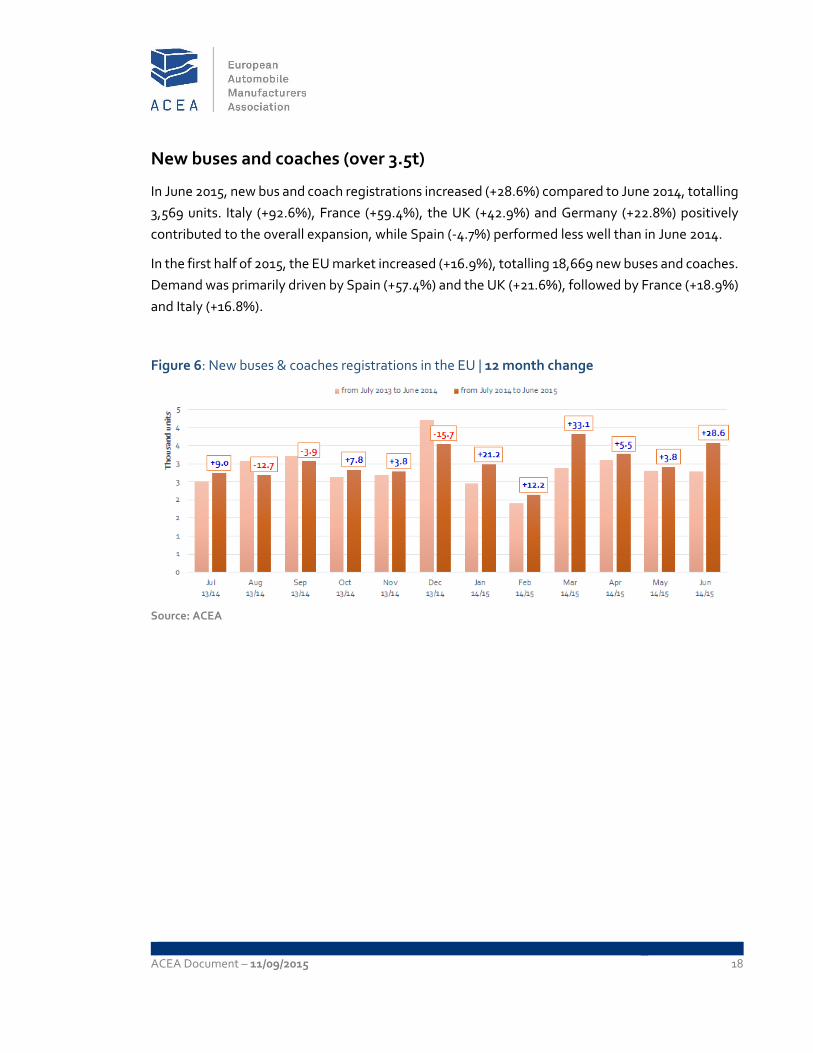
New buses and coaches (over 3.5t)
In June 2015, new bus and coach registrations increased (+28.6%) compared to June 2014, totalling
3,569 units. Italy (+92.6%), France (+59.4%), the UK (+42.9%) and Germany (+22.8%) positively
contributed to the overall expansion, while Spain (‐4.7%) performed less well than in June 2014.
In the first half of 2015, the EU market increased (+16.9%), totalling 18,669 new buses and coaches.
Demand was primarily driven by Spain (+57.4%) and the UK (+21.6%), followed by France (+18.9%)
and Italy (+16.8%).
Figure 6: New buses & coaches registrations in the EU | 12 month change
Source: ACEA
ACEA Document – 11/09/2015 19
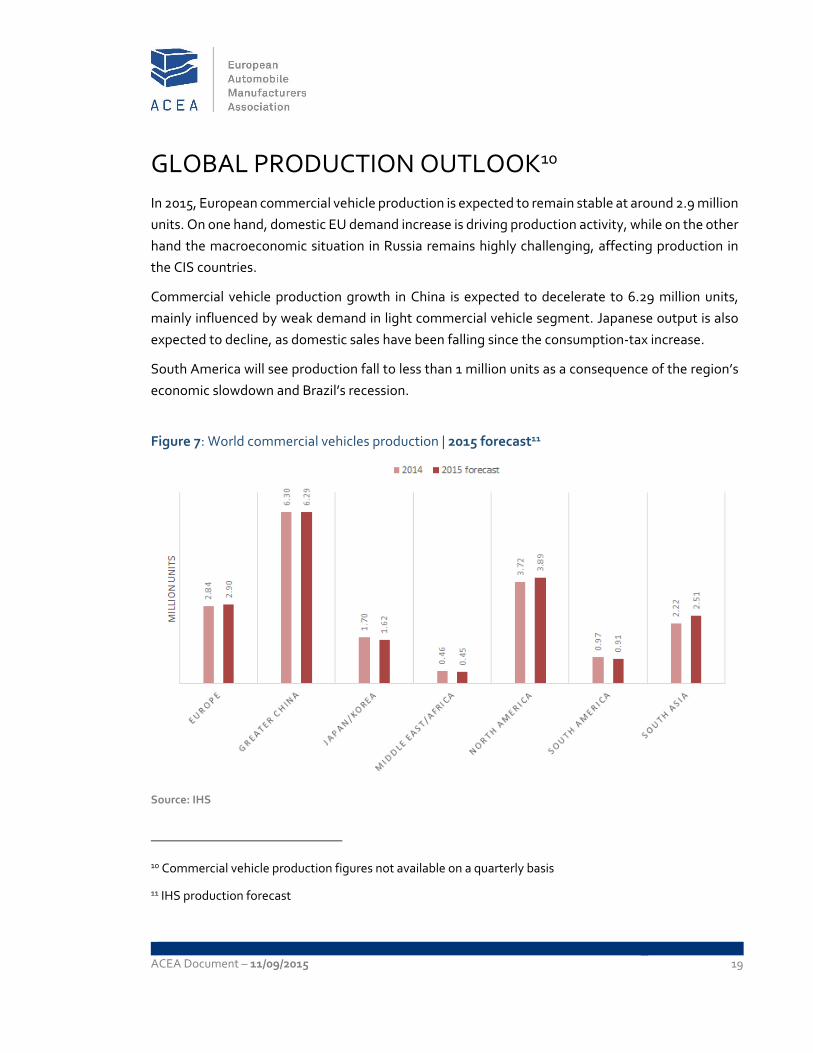
GLOBAL PRODUCTION OUTLOOK10
In 2015, European commercial vehicle production is expected to remain stable at around 2.9 million
units. On one hand, domestic EU demand increase is driving production activity, while on the other
hand the macroeconomic situation in Russia remains highly challenging, affecting production in
the CIS countries.
Commercial vehicle production growth in China is expected to decelerate to 6.29 million units,
mainly influenced by weak demand in light commercial vehicle segment. Japanese output is also
expected to decline, as domestic sales have been falling since the consumption‐tax increase.
South America will see production fall to less than 1 million units as a consequence of the region’s
economic slowdown and Brazil’s recession.
Figure 7: World commercial vehicles production | 2015 forecast11
Source: IHS
10 Commercial vehicle production figures not available on a quarterly basis
11 IHS production forecast
ACEA Document – 11/09/2015 20
TRADE
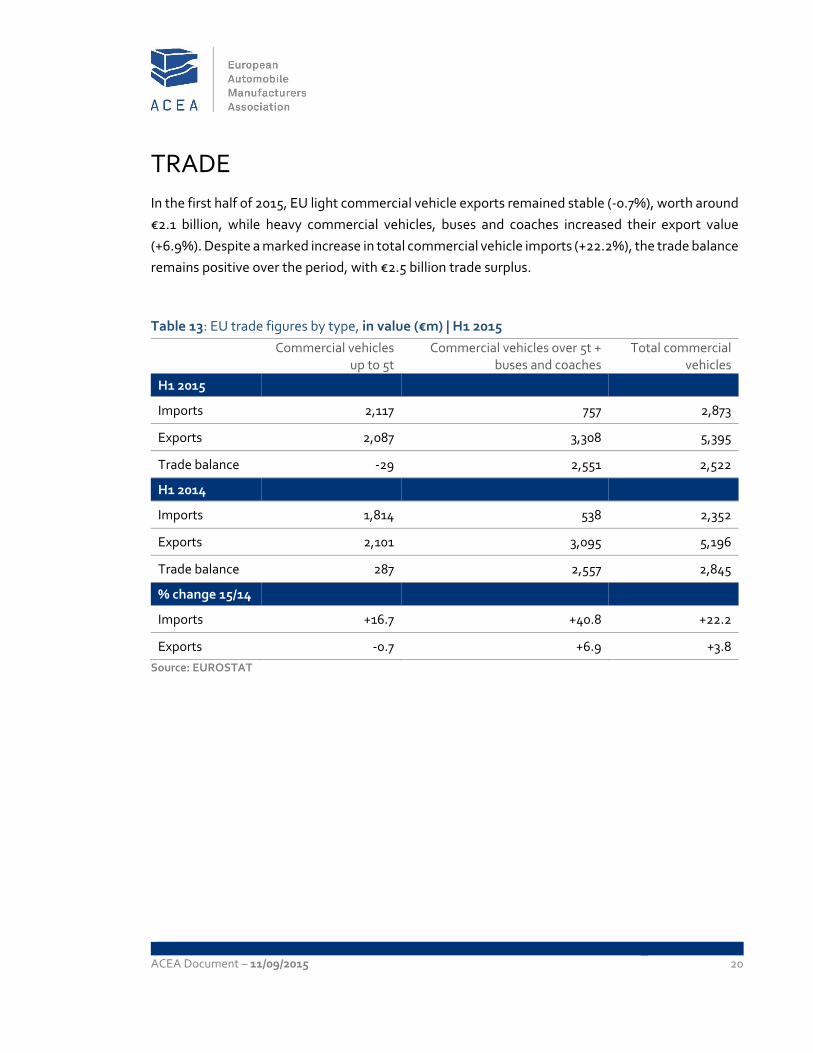
In the first half of 2015, EU light commercial vehicle exports remained stable (‐0.7%), worth around
€2.1 billion, while heavy commercial vehicles, buses and coaches increased their export value
(+6.9%). Despite a marked increase in total commercial vehicle imports (+22.2%), the trade balance
remains positive over the period, with €2.5 billion trade surplus.
Table 13: EU trade figures by type, in value (€m) | H1 2015
Commercial vehicles up to 5t
Commercial vehicles over 5t + buses and coaches
Total commercial vehicles
H1 2015
Imports 2,117 757 2,873
Exports 2,087 3,308 5,395
Trade balance ‐29 2,551 2,522
H1 2014
Imports 1,814 538 2,352
Exports 2,101 3,095 5,196
Trade balance 287 2,557 2,845
% change 15/14
Imports +16.7 +40.8 +22.2
Exports ‐0.7 +6.9 +3.8
Source: EUROSTAT
ACEA Document – 11/09/2015 21
IMPORTS
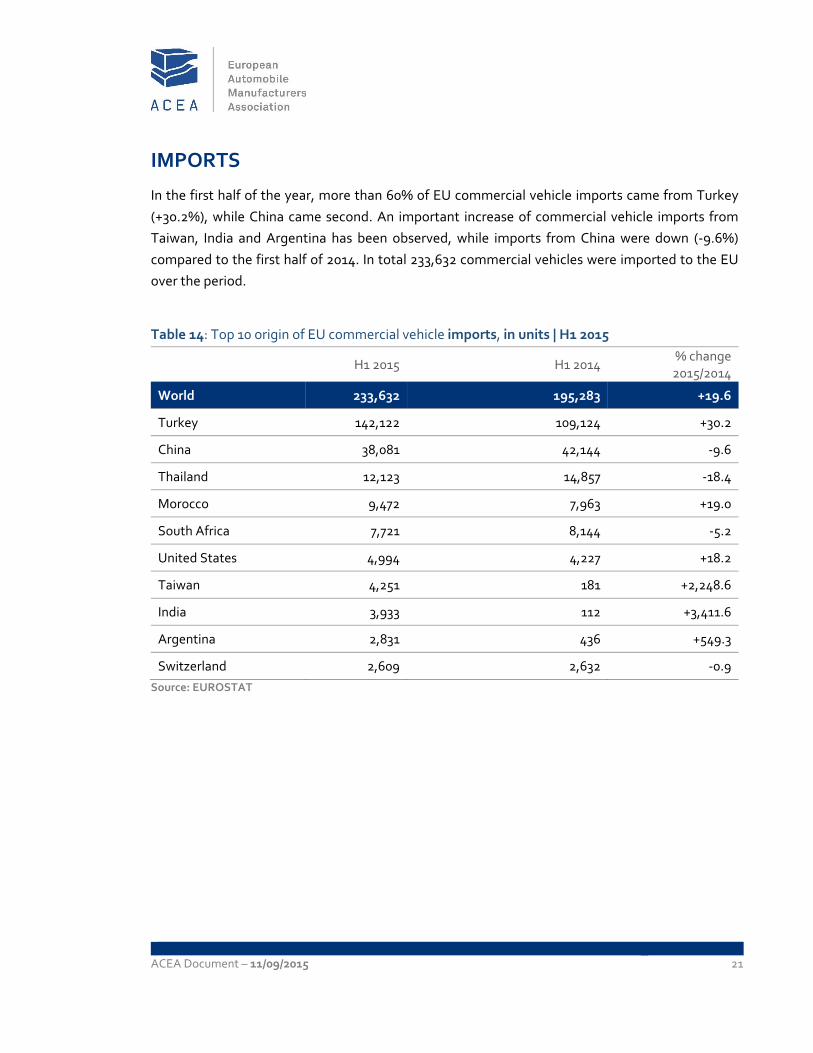
In the first half of the year, more than 60% of EU commercial vehicle imports came from Turkey
(+30.2%), while China came second. An important increase of commercial vehicle imports from
Taiwan, India and Argentina has been observed, while imports from China were down (‐9.6%)
compared to the first half of 2014. In total 233,632 commercial vehicles were imported to the EU
over the period.
Table 14: Top 10 origin of EU commercial vehicle imports, in units | H1 2015
H1 2015 H1 2014 % change 2015/2014
World 233,632 195,283 +19.6
Turkey 142,122 109,124 +30.2
China 38,081 42,144 ‐9.6
Thailand 12,123 14,857 ‐18.4
Morocco 9,472 7,963 +19.0
South Africa 7,721 8,144 ‐5.2
United States 4,994 4,227 +18.2
Taiwan 4,251 181 +2,248.6
India 3,933 112 +3,411.6
Argentina 2,831 436 +549.3
Switzerland 2,609 2,632 ‐0.9
Source: EUROSTAT
ACEA Document – 11/09/2015 22
EXPORTS
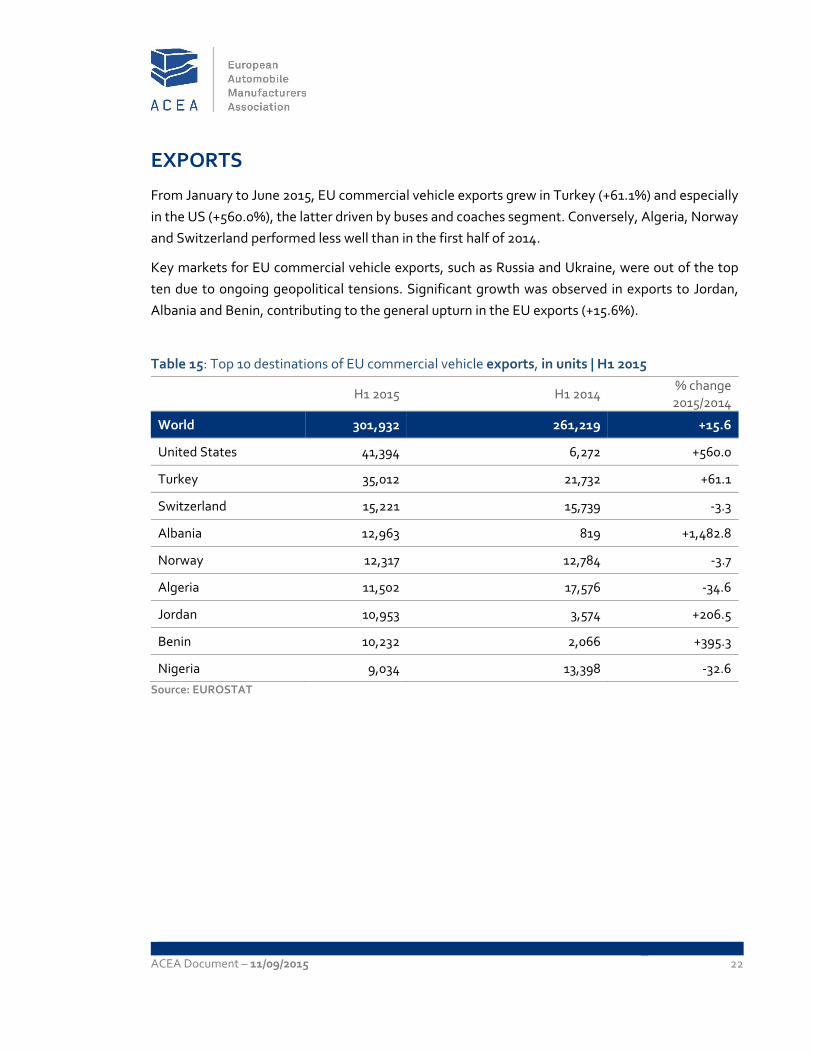
From January to June 2015, EU commercial vehicle exports grew in Turkey (+61.1%) and especially
in the US (+560.0%), the latter driven by buses and coaches segment. Conversely, Algeria, Norway
and Switzerland performed less well than in the first half of 2014.
Key markets for EU commercial vehicle exports, such as Russia and Ukraine, were out of the top
ten due to ongoing geopolitical tensions. Significant growth was observed in exports to Jordan,
Albania and Benin, contributing to the general upturn in the EU exports (+15.6%).
Table 15: Top 10 destinations of EU commercial vehicle exports, in units | H1 2015
H1 2015 H1 2014 % change 2015/2014
World 301,932 261,219 +15.6
United States 41,394 6,272 +560.0
Turkey 35,012 21,732 +61.1
Switzerland 15,221 15,739 ‐3.3
Albania 12,963 819 +1,482.8
Norway 12,317 12,784 ‐3.7
Algeria 11,502 17,576 ‐34.6
Jordan 10,953 3,574 +206.5
Benin 10,232 2,066 +395.3
Nigeria 9,034 13,398 ‐32.6
Source: EUROSTAT
ABOUT ACEA
ACEA’s members are BMW Group, DAF Trucks, Daimler, Fiat Chrysler Automobiles,
Ford of Europe, Hyundai Motor Europe, Iveco, Jaguar Land Rover, Opel Group, PSA
Peugeot Citroën, Renault Group, Toyota Motor Europe, Volkswagen Group, Volvo Cars,
Volvo Group. More information can be found on www.acea.be.
ABOUT THE EU AUTOMOBILE INDUSTRY
Some 12.1 million people ‐ or 5.6% of the EU employed population ‐ work in the
sector.
The 3.1 million jobs in automotive manufacturing represent 10.4% of EU's
manufacturing employment.
Motor vehicles account for €396 billion in tax contribution in the EU15.
The sector is also a key driver of knowledge and innovation, representing
Europe's largest private contributor to R&D, with €41.5 billion invested annually.
European Automobile Manufacturers' Association – ACEA Avenue des Nerviens 85 | B‐1040 Brussels | www.acea.be T +32 2 732 55 50 | M +32 485 886 647 | F +32 738 73 10 | [email protected] | @ACEA_eu