Embed Size (px)
Citation preview

www.naipartners.com 1
HOUSTON INDUSTRIAL | Q3 2016Economic and Market Outlook:
HOUSTON | SAN ANTONIO | AUSTIN
1
Table 1. Key market indicators for Q3 2016, and their percent (%) change on a quarter-over-quarter (QoQ) and year-over-year (YoY) basis.
Percent Change over Time Period
Market Variables Q3 2016 QoQ (%) YoY (%)
Net Absorption (sq. ft.) 6,890,715 1691.6 % 241.6 %
Leasing Activity 5,550,805 -3.6 % -9.5 %
Availability (%) 9.4% 1.1 % 17.5 %
Vacancy (%) 5.5% -5.2 % 14.6 %
Deliveries (RBA, sq. ft.) 6,593,114 151.7 % 86.0 %
Construction (RBA, sq. ft.) 7,495,046 -44.1 % -45.7 %
Inventory (RBA) 573,475,775 1.0 % 2.4 %
Inventory (No. Buildings) 18,634 0.2 % 0.8 %
Executive SummaryEconomy
• Economic uncertainty associated with an unprecedented presidential election cycle will continue after new administration moves in due to ongoing discontent between parties.
• U.S. energy sector has likely bottomed out; real signs of recovery have emerged over past the quarter, such as increases in rig counts.
• Gross domestic product (GDP) is anticipated to be 1.4% for 2016 and 2.0% for 2017, both slower than 2.5% in 2015.
• U.S. employment remains steady, posting 156,000 new jobs in September, after 167,000 in August. Job growth below 200,000 per month suggests tightening labor market.
• Houston technically entered an economic recession in November 2015; while the bottom has likely passed, Houston is not yet recovering.
• Houston’s economic outlook is to shift from a modestly negative stance to one that is generally flat for the remainder of 2016.
Industrial Market
• 6.8 million sq. ft. of net absorption in Q3 2016, representing large percent increases QoQ and YoY, but 4.0 million sq. ft. was accounted for by the Daikin Industries delivery.
• Leasing activity of 5.5 million sq. ft. was within historic Q3 performance of all industrial products.
• Availability at 9.4% was a 17.5% increase YoY; vacancy at 5.5% was a 14.6% increase YoY.
• Vacancy for flex, manufacturing, and warehouse/distribution space was 6.8%, 4.2%, and 5.7%, respectively.
• The primary soft spot is availability of manufacturing space, which at 9.2% is significantly greater than its historic average of 4.7%.
• With the Daikin delivery, RBA under construction is down to 7.5 million sq. ft., a decrease of 46% YoY.

HOUSTON INDUSTRIAL | Q3 2016
Sales of industrial owner-occupied buildings are still happening. This class of buyers typically has healthy balance sheets, and is taking advantage of the cheap money that is still out there. A 100-basis-point increase in rates is not enough for companies to turn the other way when it comes to buying. Most of these consumer service companies are not oil-field related.
There are numerous differences between this oil downturn and the one that occurred in the 1980’s, the most glaring of which is Houston’s population increase over the last five years. Peoples’ basic needs for food, clothing, and shelter have helped prop up the retail and consumer service industries, which are doing fairly well despite the oil crunch.
It will be very interesting to see how long it takes the oil industry to rebound if OPEC and other major non-OPEC nations hold true to their agreement to agree to freeze or cut production at the next OPEC meeting later in the Fall. Many oil service companies indicate they will need to see oil prices stabilize for six months before they will start to see a turnaround in their business. It’s too early to make any sort of prediction on this given the fact that a lot of the discussion about freeze and production cuts is just that: talk.
2
Broker’s Perspective
Chris Caudill Partner | NAI Partners
A 100-basis-point increase in rates is not enough for companies to turn the
other way when it comes to buying.
3
HOUSTON INDUSTRIAL | Q3 2016
National Economy With a truly unprecedented election cycle and associated economic uncertainty coming closer to an end, discontent between parties will still likely hang over policy and decision makers as a new administration takes hold. Gross domestic product (GDP) is anticipated to be 1.4% for 2016 and 2.0% for 2017, both slower than 2.5% in 2015. GDP is being led by consumer spending and job gains, but weak business, government spending, and slow export sales are holding it back. Consumer spending increased strongly by 4.3% in Q2. Revolving consumer credit continued its slow but steady increase, with August showing the largest increase in 2016. Consumer interest rates remained steady. The Consumer Sentiment index moved higher in September, rising 1.4 points to 91.2, most of which came from higher income households.
Employment continues to remain steady. September posted a solid 156,000 new jobs, following 167,000 new jobs in August. Job growth remaining below 200,000 per month is suggestive of a tightening labor market. As more people entered the labor force, unemployment moved up to 5%, which historically has been considered full employment in the labor force. Also, wage growth increased by 2.6% in September, following 2.4% in August. Some analyses still suggest that the recovery is weak and as a result interest rates may stay low. With strong September job growth, and two more job reports to go, the December FOMC meeting following the election will likely result in an interest rate hike by year’s end. Nevertheless, interest rates are expected to remain low and fluctuate within a small range.
International trade continues to see slow export sales. U.S. exports are down 3.7% YoY. Yet, the negative economic impacts of falling import prices is beginning to fade, as import prices inched up 0.1% in September and are only down 1.1% relative to this time last year. The trade deficit widened modestly in August, but realized net exports are likely to make
a positive contribution to GDP in Q3. Demand for U.S.-made durable goods abroad will remain weak and flat through the end of the year and increase modestly by 3-4% in 2017. These trends may stifle U.S. business investment.
The Small Business Optimism Index of the National Federation of Independent Businesses (NFIB) continued its decrease over the past 12-18 months, declining 0.3% points in September to 94.1, but remaining unchanged relative to the past six-month average. This indicates businesses are cautious on hiring and inventories. While factory orders of durable and nondurable goods rose in Q3, business investment in capital goods fell, which signaled a softer quarter. In September the ISM manufacturing index bounced firmly back into expansion territory at 51.5.
The U.S. energy sector appears to have bottomed out, and over the past quarter or so has begun to show real signs of recovery, with consistent weekly increases in rig counts being led by the Permian Basin. Nevertheless, modest increases in drilling activity and oil production does not signal the end of the persistent oversupply and large stockpiles. Recently, the Organization of the Petroleum Exporting Countries (OPEC) has agreed to agree to cut production at the next OPEC meeting, but when it still remains unclear when the global rebalance of the oil market will occur.
More people are looking to buy homes, but home availability remains low, driving up prices. Residential housing for August, in terms of sales of both new and existing homes fell, and new housing starts declined as well. Yet, this is in the context of a strong first half of 2016 where home sales and new home construction were very strong through July 2016. The Dodge Momentum Index of non-residential construction declined 4.3 percent in September to 129, but is up 5.1% YoY. Both July and August saw pullbacks in total construction momentum across residential, nonresidential, and public spending.
Houston and Texas Economy After adjusting for price effects, the Houston metropolitan area’s GDP grew 4.6% from 2014 to 2015. Texas and Houston continue to have a mixed set of economic numbers, but all indications are that the bottom has come and we are now moving up. Rig count has increased every week for 15 of the past 16 weeks. Technically, Houston did move into an economic recession in November of 2015; while the bottom has likely come and gone, Houston is not yet recovering. The outlook for Houston is to shift from a modestly negative economic stance to one that is generally flat for the remainder of 2016.
Employment in Texas grew 2.6% in August and 3.2% in July, with an annualized increase of 0.8% for 2016 thus far. The employment forecast for Texas is 1.2% in 2016. Jobs in Houston grew 1.8% over June, July, and August, the best seen since early 2015. Job growth remains low in the oil and oil service fields, while growth was seen in leisure and hospitality, private education and health services and government, and then trade, transportation, and utilities. This is all in the context of annualized -1.0% decline in employment of about 15,000 jobs year to date. Unemployment was 4.7% in Texas.
The revenue index of the Texas Service Sector Outlook survey increased from 6.5 to 13.0 in September. Meanwhile the sales index of the Texas Retail Outlook Survey increased from -5.3 to 2.0. Factory activity in Texas did increase substantially in September, according to the Texas Manufacturing Outlook Survey. The index which measures manufacturing conditions rose 12 points to 16.7, again a substantial increase. Nevertheless, consistent with the broader U.S. economy, business conditions in Texas are mixed. The general business activity index continued into negative territory for another month at -3.7, representing almost two years in negative territory. The Houston Business Cycle Index grew 2.6% in August, following 2.0% and 2.6% in July and June, respectively. Annually, however, the index is down 2.2% YoY. Texas exports declined 7% in July, the largest drop seen since 2009.
ECONOMIC OVERVIEW

Net Absorption
Net absorption, a key metric for demand of industrial space, measures the change in occupied inventory, including direct and sublet space. Total net absorption for all products combined in Q3 2016 was over 6.8 million sq. ft., yielding huge percent increases QoQ and YoY (Table 1, Fig 2A). It is important to note, however, that about 4.0 of this 6.8 million sq. ft. is accounted for solely by the Daikin Industries delivery.
The historic Q3 average (± 95% confidence interval) for net absorption is 1,866,538 sq. ft. (± 1,149,189). We are 95% certain that Q3 net absorption typically falls between 717,340 and 3,015,727 sq. ft. In the absence of the Daikin delivery, net absorption in Q3 2016 was within its average range of Q3 performance, but with the Daikin delivery net absorption is significantly greater than historic Q3 performance. Figure 2B breaks total net absorption down since 2005 by year and quarter for three product types: flex, manufacturing, and warehouse/distribution space. Flex saw modest increases of net absorption in Q3 2016, but manufacturing and warehouse/distribution spaces both saw substantial increases in net absorption (Figure 2B).
Leasing Activity
A measure of demand that is more forward looking than net absorption is leasing activity, the total amount of space represented by direct leases, subleases, renewals, and pre-leasing. Figure 3A reports all leasing activity since 2000; Figure 3B breaks down leasing activity by year and quarter for each of flex, manufacturing, and warehouse/distribution space. Leasing activity of 5.5 million sq. ft. occurred in Q3 2016, representing decreases of -3.6% QoQ and -9.5%
YoY (Table 1). The historic Q3 average (± 95% confidence interval) for leasing activity is 5,356,277 sq. ft. (± 764,596). We are 95% certain that Q3 leasing activity typically falls between 4,591,681 and 6,120,873 sq. ft., indicating that leasing activity in Q3 was within its historic range of Q3 performance since 2000. Notably, manufacturing leasing activity has
steadily increased QoQ from Q1 to Q3 2016.
Vacancy and Availability
Vacancy and availability measure the supply of industrial space. Availability estimates total supply because it includes vacant, occupied, and sublease space. Vacancy estimates empty space on the
4
HOUSTON INDUSTRIAL | Q3 2016

market, whether or not that space is leased or for rent. Supply continues to remain low, but with some key increases in recent quarters (Tables 1 and 2, Figure 4). For the industrial market as a whole, availability in Q3 2016 was 9.4%, an increase of 1.1% QoQ and 17.5% YoY (Table 1). Vacancy for all industrial space combined was 5.5%, a decrease of -5.2% QoQ but an increase of 14.6% YoY (Table 1).
Figure 4 shows percent availability and vacancy for flex, manufacturing, and warehouse/distribution buildings since 2000. Table 2 summarizes availability and vacancy of flex, manufacturing, and warehouse/distribution buildings for Q3 2016. In particular, note that vacancy and availability of flex space remain below historic levels. However, with the surge of sublease space, availability of manufacturing space at 9.2% is significantly greater than its historic average of 4.7%. Nonetheless, the vacancy measure for manufacturing has yet to see the increase exhibited by the availability measure, and remains within its historic 95% interval of performance at 4.2%. As for warehouse/distribution space, both vacancy and availability are increasing, but still within their historic ranges of performance.
Asking Rent
Figure 5 plots asking rent prices since 2000 for flex, manufacturing, and warehouse/distribution space. In Q3 2016, asking rents for flex space nudged upwards a touch, while manufacturing decreased, and warehouse/distribution space held steady.
Construction
Construction of new buildings shapes new supply of industrial space. “RBA Delivered” refers to
completed construction, while “RBA Construction” refers to space under construction that has not yet been completed. As detailed in Table 1 and Figure 6, deliveries in Q3 2016
were 6.5 million sq. ft., an increase of 152% QoQ and 86% YoY (Table 1). It is important to note that about 4.0 million sq. ft. is accounted for by Daikin Industries’ new campus in
5
HOUSTON INDUSTRIAL | Q3 2016
Table 2. Current (Q3 2016) supply of industrial space as measured by the availability and vacancy of flex, manufacturing, and warehouse/distribution space (% total RBA), compared to the historic first-quarter (Q3) average since 2000. The 95% confidence interval is the typical historic expected Q3 performance.
Q3 2016Historic
Q3 Average95% ConfidenceInterval for Q3
Availability (%)
Flex 11.5 13.6 12.2 to 15.0
Manufacturing 9.2 4.7 3.9 to 5.6
Warehouse/Distribution 9.4 8.7 7.9 to 9.4
Vacancy (%)
Flex 6.8 12.1 10.3 to 13.9
Manufacturing 4.2 3.8 2.8 to 4.7
Warehouse/Distribution 5.7 6.3 5.8 to 6.9

Waller, Texas. With this delivery, RBA under construction was down to 7.5 million sq. ft. in Q3 2016, a decrease of -44% QoQ and 46% YoY (Table 1).
Inventory
Figure 7 depicts changes in the inventory of flex, manufacturing, and warehouse/distribution space since 2000, both for RBA and number of buildings. RBA inventory for all industrial space increased to 573 million sq. ft. for 18,634 buildings, which is an increase of 0.2% QoQ and 0.8% YoY (Table 1).
6
HOUSTON INDUSTRIAL | Q3 2016

7
Select Largest Deliveries (AS OF END OF Q3)
Building Address Rentable Building Area Percent Leased14151 E Hillcroft St 240,000 0%
7256 S Sam Houston Pky W 112,500 50%
3516 Highway 225 72,791 41%
Highway 90 A & Beltway 8 68,800 0%
Highway 90 A & Beltway 8 55,250 0%
1330 Industrial Blvd 39,750 50%
10321 Regal Row 28,041 0%
5910 E Sam Houston Pky S 24,000 0%
633 Choctaw Ln 22,500 0%
1810 First Oaks St 20,000 63%
HOUSTON INDUSTRIAL | Q3 2016

8
HOUSTON INDUSTRIAL | Q3 2016
Select Under Construction (AS OF END OF Q3)
Building Address Rentable Building Area Percent Leased5000 Ameriport Pky 458,280 65%
1801 S 16th St 415,272 0%
4111 Malone Dr 231,983 0%
Highway 90 A & Beltway 8 208,907 0%
1401 S 16th St 193,586 0%
10643 W Airport Blvd 165,000 0%
9631 Bay Area Blvd 153,655 0%
9331 Bay Area Blvd 110,390 0%
S Sam Houston Pky E 108,000 0%
4033 Malone Dr 107,291 0%
10633 W Airport Blvd 95,400 0%
10653 W Airport Blvd 91,560 0%
12320 Cutten Rd 80,000 0%
13720 Stafford Rd 68,300 76%
S Sam Houston Pky E 64,800 0%
12527 Taylor Rd 36,600 0%
1924 Aldine Western Rd 34,500 0%
10344 New Decade Dr 34,350 0%
7800 Breen Rd 30,000 0%
12527 Taylor Rd 30,000 0%
12527 Taylor Rd 27,000 0%
12527 Taylor Rd 25,000 0%
10322 New Decade Dr 24,380 0%
5346 Bay Oaks Dr 24,000 0%
21500 Springbridge Dr 22,500 0%
Genoa Red Bluff @ Bay Oak Dr 21,840 0%
218 N Preston Ave 20,700 0%
8316 Willow Place Dr N 20,250 0%
3201 Awesome Ln 20,000 0%
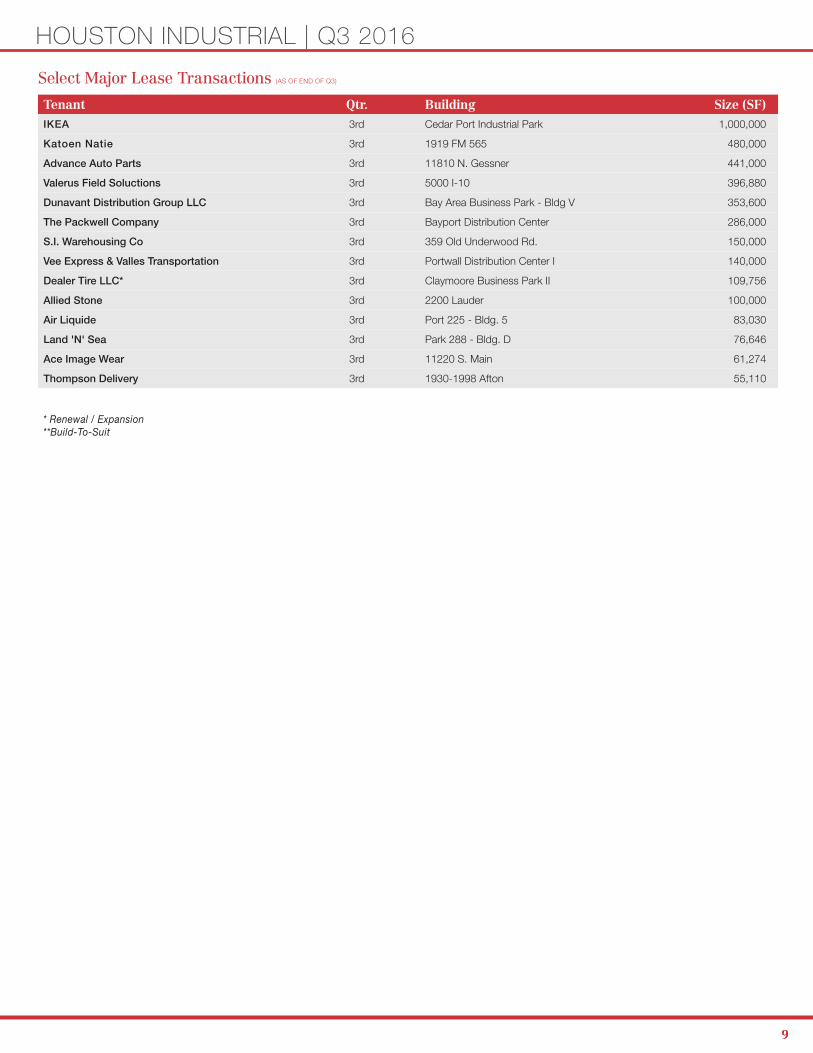
Select Major Lease Transactions (AS OF END OF Q3)
Tenant Qtr. Building Size (SF) IKEA 3rd Cedar Port Industrial Park 1,000,000
Katoen Natie 3rd 1919 FM 565 480,000
Advance Auto Parts 3rd 11810 N. Gessner 441,000
Valerus Field Soluctions 3rd 5000 I-10 396,880
Dunavant Distribution Group LLC 3rd Bay Area Business Park - Bldg V 353,600
The Packwell Company 3rd Bayport Distribution Center 286,000
S.I. Warehousing Co 3rd 359 Old Underwood Rd. 150,000
Vee Express & Valles Transportation 3rd Portwall Distribution Center I 140,000
Dealer Tire LLC* 3rd Claymoore Business Park II 109,756
Allied Stone 3rd 2200 Lauder 100,000
Air Liquide 3rd Port 225 - Bldg. 5 83,030
Land 'N' Sea 3rd Park 288 - Bldg. D 76,646
Ace Image Wear 3rd 11220 S. Main 61,274
Thompson Delivery 3rd 1930-1998 Afton 55,110
99
HOUSTON INDUSTRIAL | Q3 2016
* Renewal / Expansion**Build-To-Suit

Submarket # Blds Total RBATotal
Available SF Vacancy %YTD Net
AbsorptionUnder
Construction SFQuoted Rental
Rates ($/SF/Yr)
Austin County Ind 0 0 0 0.0% 0 0 $0.00
CBD Ind 170 3,640,908 199,293 5.5% (96,614) 0 $12.39
North Corridor Ind 392 10,499,674 681,162 6.5% 80,211 50,000 $9.40
Northeast Corridor Ind 64 762,483 58,750 7.7% (22,252) 0 $7.51
Northwest Corridor Ind 564 17,330,149 1,291,463 7.5% (178,865) 38,490 $8.89
San Jacinto County Ind 0 0 0 0.0% 0 0 $0.00
Southeast Corridor Ind 215 3,081,142 267,914 8.7% 89,202 42,800 $12.15
Southern Corridor Ind 123 2,483,568 132,334 5.3% 18,930 0 $8.92
Southwest Corridor Ind 475 12,779,301 816,598 6.4% 148,377 102,000 $11.31
Submarket # Blds Total RBATotal
Available SF Vacancy %YTD Net
AbsorptionUnder
Construction SFQuoted Rental
Rates ($/SF/Yr)
Austin County Ind 25 1,588,430 531,120 33.4% 396,915 0 $4.80
CBD Ind 1,898 55,775,415 2,862,176 5.1% (788,934) 0 $5.06
North Corridor Ind 3,128 88,928,457 7,959,309 9.0% 611,769 312,400 $7.26
Northeast Corridor Ind 946 35,312,439 807,320 2.3% 260,624 0 $4.69
Northwest Corridor Ind 4,125 142,692,190 7,852,667 5.5% 4,536,236 1,265,200 $6.59
San Jacinto County Ind 4 34,464 0 0.0% 0 0 $0.00
Southeast Corridor Ind 2,306 88,655,854 3,836,024 4.3% 1,797,358 4,015,869 $5.75
Southern Corridor Ind 1,910 47,831,439 1,381,006 2.9% 52,903 382,800 $5.78
Southwest Corridor Ind 2,223 60,573,758 2,646,305 4.4% (57,641) 1,255,487 $6.66
Submarket # Blds Total RBATotal
Available SF Vacancy %YTD Net
AbsorptionUnder
Construction SFQuoted Rental
Rates ($/SF/Yr)
Austin County Ind 25 1,588,430 531,120 33.4% 396,915 0 $4.80
CBD Ind 2,068 59,416,323 3,061,469 5.2% (885,548) 0 $5.31
North Corridor Ind 3,520 99,428,131 8,640,471 8.7% 691,980 362,400 $7.49
Northeast Corridor Ind 1,010 36,074,922 866,070 2.4% 238,372 0 $4.76
Northwest Corridor Ind 4,689 160,022,339 9,144,130 5.7% 4,357,371 1,303,690 $6.91
San Jacinto County Ind 4 34,464 0 0.0% 0 0 $0.00
Southeast Corridor Ind 2,521 91,736,996 4,103,938 4.5% 1,886,560 4,058,669 $6.18
Southern Corridor Ind 2,033 50,315,007 1,513,340 3.0% 71,833 382,800 $5.85
Southwest Corridor Ind 2,698 73,353,059 3,462,903 4.7% 90,736 1,357,487 $7.39
Flex Market Statistics (AS OF END OF Q3)
Warehouse Market Statistics (AS OF END OF Q3)
Total Industrial Market Statistics (AS OF END OF Q3)
10
HOUSTON INDUSTRIAL | Q3 2016

Copyright © and (P) 1988–2012 Microsoft Corporation and/or its suppliers. All rights reserved. http://www.microsoft.com/mappoint/Certain mapping and direction data © 2012 NAVTEQ. All rights reserved. The Data for areas of Canada includes information taken with permission from Canadian authorities, including: © Her Majesty the Queen in Right of Canada, © Queen's Printer for Ontario. NAVTEQ and NAVTEQ ON BOARD are trademarks of NAVTEQ. © 2012 Tele Atlas North America, Inc. All rights reserved. Tele Atlas and Tele Atlas North America are trademarks of Tele Atlas, Inc. © 2012 by Applied Geographic Solutions. All rights reserved. Portions © Copyright 2012 by Woodall Publications Corp. All rights reserved.
0 mi 10 20 30 40 50
CBD IND (1)
NORTH CORRIDOR IND (2)
NORTH EAST CORRIDOR IND (3)
NORTH WEST CORRIDOR IND (4)
SOUTHEAST CORRIDOR IND (5)
SOUTHERN CORRIDOR IND (6)
SOUTHWEST CORRIDOR IND (7)
11
The Houston Industrial Sub-market Map
HOUSTON INDUSTRIAL | Q3 2016
Information and data within this report were obtained from sources deemed to be reliable. No warranty or representation is made to guarantee its
accuracy. Sources include: U.S. Bureau of Economic Analysis, CoStar, Council on Foreign Relations, Federal Reserve Bank of Dallas, Greater
Houston Partnership, FiveThirtyEight.com, Houston Association of Realtors, Moody Analytics, NAI Global, National Association Realtors, Texas A&M
Real Estate Center, Well’s Fargo, University of Houston’s Institute of Regional Forecasting, U.S. Bureau of Labor Statistics

1900 West Loop South, Suite 500 | Houston, TX 77027 | tel 713 629 0500www.naipartners.com
HOUSTON INDUSTRIAL | Q3 2016Economic and Market Outlook:
HOUSTON | AUSTIN | SAN ANTONIO
Marketing & Research Team
J. Nathaniel Holland, Ph.D. Chief Research and Data Scientist
Steven Cox Director of Property Research
Larry Koestler Vice President of Marketing
Padaric Kolander Sr. Graphic Designer