Embed Size (px)
Citation preview

FHWA IF-02-047
EconomicAnalysis Primer

ECONOMIC ANALYSIS PRIMER 1
August 2003
Economic Analysis Primer
U.S. Department of TransportationFederal Highway AdministrationOffice of Asset Management

ECONOMIC ANALYSIS PRIMER 3
TABLE OF CONTENTS
Note From the Director 5
Introduction 7Role of Economic Analysis in Highway Decision Making 7Status of Economic Analysis 8Role of the Federal Highway Administration 8
Economic Fundamentals 9Accounting for Dollars Over the Project Life Cycle 9Inflation 9Time Value of Resources 11
Life-Cycle Cost Analysis 14When to Use Life-Cycle Cost Analysis 14Procedures for Best Results 14Cost Elements to Include 15User Cost Controversy 16Tools 16
Benefit-Cost Analysis 17The Benefit-Cost Analysis Process 18Benefit and Cost Elements to Include 19Comparing Benefits to Costs 23Misunderstandings 25Avoiding Pitfalls 25Tools 26
Forecasting Traffic for Benefit Calculations 27Traffic Flows Are Dynamic 27Traffic Forecasting Process 27Network and Corridor Effects 28Impact on Benefit Calculations 28When to Do a Full Demand Forecast 28
Risk Analysis 30Defining Risk 30Sensitivity Analysis 30Probabilistic Analysis 31Mitigating Risk 31
Economic Impact Analysis 32Role of Economic Impact Analysis 32When to Do Economic Impact Analysis 33Methods and Tools 33Presentation of Results 34
Conclusion 35

ECONOMIC ANALYSIS PRIMER 5
How do we know if a highway project is worth undertaking, when it should be
done, or what is the most cost-effective means of accomplishing it? What will
the effects of the project be on the regional economy? These are among the
questions that economic analysis will help to answer when it is coordinated with
transportation planning, engineering, environmental review, budgeting, and policy
making.
Although the idea of comparing the benefits and costs of transportation projects on
a dollar-to-dollar basis has long appealed to decision makers, the application of eco-
nomic analysis to such projects is often neglected in practice. Agencies may believe that
transportation benefits and costs are too hard to quantify and value, or too subject to
uncertainty to provide meaningful guidance. Fortunately, an expanding research base
on economic methods and values, improved modeling of traffic and uncertainty, and
more powerful desktop computers have made the widespread use of economic analysis
for highway projects an attainable goal.
This primer is intended to provide a foundation for understanding the role of eco-
nomic analysis in highway decision making. It is oriented toward State and local offi-
cials who have responsibility for assuring that limited resources get targeted to their
best uses and who must account publicly for their decisions. It presents economic analysis
as an integral component of a comprehensive infrastructure management methodology
that takes a long-term view of infrastructure performance and cost. The primer is non-
technical in its descriptions of economic methods, but it encompasses a full range of
economic issues that are of potential interest to transportation officials.
Office of Asset Management,Federal Highway Administration
NOTE FROM THE DIRECTOR

6 ECONOMIC ANALYSIS PRIMER
The issuance of this primer is in keeping with the Federal Highway Administration’s
commitment to provide technical assistance, tools, and training to support State and local
transportation agencies in their critical role of accommodating the Nation’s need for safe
and efficient transportation.
David R. GeigerDirector, Office of Asset Management

ECONOMIC ANALYSIS PRIMER 7
This primer begins by explaining what economicanalysis is and why it is important to transporta-tion decision making. The narrative proceeds tosome of the fundamental concepts required for the
economic analysis of projects (inflation and discounting)and then describes actual applications of economic analysismethodology, especially life-cycle cost analysis and ben-efit-cost analysis. An issue critical to accurate calculationsof project net benefits—forecasting traffic growth—isaddressed after the treatment of benefit-cost analysis.
Risk analysis can greatly improve the usefulness of eco-nomic analysis to decision makers. This subject is handledin a separate section, although it applies to all of the eco-nomic methods described in this primer.
Economic impact analysis is discussed at the end ofthe primer. It complements benefit-cost analysis by re-vealing how the direct transportation benefits and costsof highway projects (such as reduced travel time) mani-fest themselves in the form of new jobs, business growth,tourism, and income. Such information is often impor-tant for making decisions about highway projects.
INTRODUCTION
ROLE OF ECONOMIC ANALYSIS IN HIGHWAYDECISION MAKING
Economic analysis is a critical component of a compre-hensive project or program evaluation methodology thatconsiders all key quantitative and qualitative impacts ofhighway investments. It allows highway agencies to iden-tify, quantify, and value the economic benefits and costsof highway projects and programs over a multiyeartimeframe. With this information, highway agencies arebetter able to target scarce resources to their best uses interms of maximizing benefits to the public and to accountfor their decisions.
Economic analysis can inform many different phasesof the transportation decision making process (see box,page 8). It can assist engineers in the development of morecost-effective designs once a decision has been made togo forward with a project. In planning, it can be appliedto basic cost and performance data to screen a large num-ber of potential project alternatives, assisting in the de-velopment of program budgets and areas of programemphasis. Similarly, economic analysis can play a criticalrole in screening alternatives to accomplish a specificproject, providing information for the environmentalassessment process.
Although economic analysis can provide valuable in-formation for the environmental assessment of a projector program, it is neither a substitute for nor a requiredcomponent of the environmental assessment process.Nothing in this primer about economic analysis shouldbe interpreted as supplementing, overriding, or other-wise modifying Federal regulations and guidance onenvironmental assessments conducted under the NationalEnvironmental Policy Act of 1969, the Clean Air Act asamended in 1990, and other laws pertaining to environ-mental review of transportation projects.

8 ECONOMIC ANALYSIS PRIMER
ROLE OF THE FEDERAL HIGHWAY ADMINISTRATION
FHWA has a long tradition of promoting the applicationof economic analysis to highway project planning, de-sign, construction, preservation, and operation. FHWAhas strongly encouraged the use of life-cycle cost appli-cations as part of its pavement design and preservationinitiatives, as well as in the Value Engineering program.FHWA has also developed more advanced economic toolsthat measure benefits and costs of highway investments,including the program-level Highway Economic Require-ments System model described later in this primer.
As part of its long-term commitment to improvinghighway investment and management practices, FHWAwill continue to develop and advance economic tools andguidance. A major new impetus for this effort is the pro-motion of Transportation Asset Management for use bytransportation agencies. Transportation Asset Manage-ment is a strategic approach to maximize the benefits fromresources used to operate, expand, and preserve the trans-portation infrastructure over the long term. The use ofeconomic analysis to compare costs and benefits in dol-lar terms over multiyear periods provides vital informa-tion to this and other comprehensive infrastructure man-agement strategies.
Among the benefits of applying economic analysis tohighway projects are the following:
• Cost-Effective Design and Construction. Economic analy-sis can inform highway agencies as to which of severalproject designs can be implemented at the lowest life-cycle cost to the agency and the lowest work zone delaycost to the traveler, and it can identify the best afford-able balance between these costs.
• Best Return on Investment. Economic analysis can helpin planning and implementing transportation pro-grams with the best rate of return for any given bud-get, or it can be used to help determine an optimalprogram budget.
STATUS OF ECONOMIC ANALYSIS
The application of economic analysis to highway invest-ments is not a new concept. The American Associationof State Highway Officials published information on roaduser benefit analysis in 1952, showing that economicmethods and procedures for highway appraisal were wellunderstood and described 50 years ago. Of course, sig-nificant progress has been made since that time in areasas diverse as modeling of future traffic flows; estimatingthe consequences of highway projects on jobs and in-comes; and the application of computer technologies tosupport improved economic methods.
Today, many States and metropolitan planning orga-nizations (MPOs) and some local governments use eco-nomic tools in some capacity. There is, however, muchdiversity in application. Most agencies will occasionallyquantify the life-cycle costs or net benefits of projects orinvestigate their economic impacts on communities. Onlya minority of agencies, however, regularly measure projectnet benefits in monetary terms. Also, most agencies donot consider the full range of costs and benefits whenconducting their analyses. In general, there is significantpotential for the broader application of economic meth-ods to highway decision making.
• Understanding Complex Projects. In a time of growingpublic scrutiny of new and costly road projects, high-way agencies and other decision makers need to under-stand the true benefits of these projects, as well as theeffects that such projects will have on regional econo-mies. This information is often very helpful for inform-ing the environmental assessment process.
• Documentation of Decision Process. The discipline ofquantifying and valuing the benefits and costs of high-way projects also provides excellent documentationto explain the decision process to legislatures and thepublic.
BENEFITS OF USING ECONOMIC ANALYSIS

ECONOMIC ANALYSIS PRIMER 9
ECONOMIC FUNDAMENTALS
The most basic economic questions that people facein their day-to-day personal and business lives in-volve the tradeoffs between dollars earned, spent,or invested today and those dollars they hope to
earn, spend, or invest in the future. Such tradeoffs mustalso be considered when evaluating highway investments.
ACCOUNTING FOR DOLLARS OVER THE PROJECTLIFE CYCLE
A given project will generate costs and benefits over itsentire service life cycle. During construction, it will gen-erate mostly costs. Once in service, it will generate mostlybenefits, although some costs continue due to mainte-nance, periodic rehabilitation, and operational activities.In many cases, benefits will build over time as traffic lev-els increase. These benefits and costs can be presented indollar terms for each year of the project’s life cycle. Fig-ure 1 illustrates a typical time series of costs and benefits.
Comparison of benefits to costs over the project lifecycle would be a simple issue of summation except forone problem: the value of a dollar changes over time. Inparticular, a dollar that an individual or agency will spend
or earn in the future is almost always worth less to themtoday than a dollar they spend or earn now. This chang-ing value of the dollar must be understood and quanti-fied to enable meaningful comparisons of multiyear dol-lar streams.
Two separate and distinct factors account for why thevalue of a dollar, as seen from the present, diminishesover time. These factors are inflation and the time valueof resources.
INFLATION
Causes and Measurement
Inflation is said to occur when the prices of most goodsand services in the economy are rising by some degreeover time—also referred to as “general inflation.” Econo-mists believe that inflation is usually caused when thereis more demand expressed for goods and services in theeconomy than there is supply of those same goods andservices at current prices. To produce the goods and ser-vices needed to meet demand, firms must pay more forthe inputs (including labor and raw materials) needed to
produce the goods and ser-vices. For example, it mightbe necessary to pay over-time premiums to existingworkers or pay higher wagesto attract new workers.These higher costs getpassed on to consumers inthe form of higher prices forthe goods and services pro-duced; consumers in turnseek higher wages to pay forthe higher priced goods andservices, and so on, in a cir-cular manner.
FIGURE 1. Time Series of Costs and Benefits
0 1 2 3 4 5 6 7 8 9 10 11 12 13 14 15 16 17 18 19 20
Initial Capital Cost
Benefits
Costs
Dolla
rs
Year

10 ECONOMIC ANALYSIS PRIMER
Economists usually measure inflation by comparingthe price of groupings or “market baskets” of goods andservices from year to year. The prices of some goods andservices in the grouping will go up, the prices of othersmay go down—it is the overall price level of the group-ing that captures the effect of inflation. A price or infla-tion index is constructed by dividing the price of thegrouping in each year by its price in a fixed base year, andmultiplying the result by 100. The change in the indexvalue from year to year reveals the trend and scale of in-flation. The Consumer Price Index (CPI) is probably thebest-known price or inflation index to most Americans,but there are many others.
Just as inflation is encountered in the general economy,the costs of highway projects tend to rise over time as aresult of inflation. This is because highway projects mustcompete for many of the same resources (such as labor orsteel) that other sectors of the economy require.
FHWA measures trends in highway construction costsby a Bid Price Index (BPI, also called the Federal-AidHighway Construction Cost Composite Index). The BPIis constructed from the unit prices for materials in actualhighway project bids, compiled from reports of Stateawards for Federal-aid contracts of $500,000 or greater.Inflation in construction costs is measured by the changes
in these unit prices from year to year. Many States pro-duce their own highway cost indices to reflect local con-ditions and practices.
Engineering News-Record (ENR) publishes both aConstruction Cost Index and Building Cost Index thatare widely used in the construction industry. ENR alsopublishes various materials prices for 20 U.S. cities andtwo Canadian cities. Other indices include the TurnerConstruction Co. Composite Index and the R.S. MeansHeavy Construction Cost Index.
Dollars from one year can be converted into equiva-lent dollars of another year (as measured by purchasingpower) by using price indices to add or remove the ef-fects of inflation (see box). Dollars from which the infla-tion component has been removed are known as “real,”“constant,” or “base year” dollars. A real dollar is able tobuy the same amount of goods and services in a futureyear as in the base year of the analysis. Dollars that in-clude the effects of inflation are known as “nominal,” “cur-rent,” or “data year” dollars. A nominal dollar will typi-cally buy a different amount of goods and services in eachyear of the analysis period.
When to Adjust for Inflation
In the case of economic analysis of investments by a pub-lic agency, it is best practice to forecast life-cycle costsand benefits of a project without inflation (i.e., in real orbase year dollars). Inflation is very hard to predict, par-ticularly more than a few years into the future. Moreimportantly, if inflation is added to benefits and costs pro-jected for future years, it will only have to be removedagain before these benefits and costs can be compared inthe form of dollars of any given base year.
The essential time to consider inflation is when theproject budget is being prepared, after economic analysishas shown the project to be economically viable. Futureyear or multiyear project budgets are appropriated in fu-ture year dollars rather than base year dollars. Failure toaccount for inflation in project budgets will almost al-ways result in too few future year dollars being set asideto complete the projects (leading to public perceptionsof cost overruns and mismanagement) and will hurt theagency’s ability to program future projects. Also, if his-torical cost data are being used to develop base year costestimates for a project, the historical cost data should beadjusted to base year dollars using an inflation index.

ECONOMIC ANALYSIS PRIMER 11
When adjusting for inflation, an index appropriate forthe task should be used. For doing cost or budget esti-mates, this index will often be the State version of theBPI. In a few cases, the analyst may believe that aresource’s cost has grown or will grow much more rap-idly than the rate of inflation. For instance, right-of-waycosts may soar due to real estate speculation in anticipa-tion of a new road. In such cases, the analyst should workwith experts to determine how much the real price of theresource will change over time and include this adjustedprice in the economic analysis. It is good practice to con-sult with an economist whenever an issue arises over theappropriate treatment of inflation.
TIME VALUE OF RESOURCES
Most people have a day-to-day familiarity with inflation.They are less familiar, however, with the separate and dis-tinct concept of the time value of resources. Yet this latterconcept is the backbone of economic analysis of transporta-tion projects and of the Nation’s financial system in general.
The time value of resources is also referred to as thetime value of money or the opportunity cost (or value) ofresources. It reflects the fact that there is a cost associ-ated with diverting the resources needed for an invest-ment from other productive uses or planned consump-tion within the economy. This cost is equal to theeconomic return that could be earned on the investedresources (or the dollars used to buy them) in their nextbest alternative use. Equivalently, the time value of re-sources can be interpreted as the amount of compensa-tion that must be paid to people to induce them not toconsume their resources in the current year, but ratherto make them available for future investment.
The Role of the Discount Rate
The time value of resources is measured by an annualpercentage factor known as the discount rate. The dis-count rate has a positive value whether or not there isinflation in the economy, as illustrated by the followingexample.
FORMULAS FOR ADJUSTING FOR INFLATION
The use of price or inflation indices to adjust for inflation is relatively straightforward.
To remove inflation (i.e., convert data year, nominal dollars into base year, real dollars):
Dollars = Dollars x Price Index /Price Index
To add inflation (i.e., convert base year, real dollars into data year, nominal dollars):
Dollars = Dollars x Price Index /Price Index
For instance, assume that the base year for an analysis is 1999. If a highway structure cost $100,000 to buildin 1992, how much would it have cost in base year 1999 dollars (all else being equal)? The answer (based onthe structure price information contained in the Federal Highway Administration’s Bid Price Index [BPI])would be:
$100,000 x 138.3 / 108.4
or $127,583 base year 1999 dollars. Similarly, a base year dollar can be converted to an equivalent amount ofpurchasing power for any other year based on the second formula.
Historical price index data can be used to adjust for inflation in years prior to and including the present.When adjusting future, multiyear project budgets to allow for possible inflation, the analyst should consult afinancial or economic expert to develop reasonable estimates of anticipated future price growth.
base year data year base year data year
data year base year data year base year
data year (1992) BPI structures index (1999) BPI structures index (1992)

12 ECONOMIC ANALYSIS PRIMER
Assume that for the next 20 years no general inflationis expected. That is, $100 would buy the same (or a com-parable) market basket of goods and services in 20 yearsthat it will buy today. In this environment, would a per-son expect to be able to borrow money at zero interest?Would that person lend money to someone else at zerointerest? The answer to both questions, at least for mostpeople, is “no.” Money can always be invested now toearn a return (e.g., in real estate or a profitable enter-prise). Alternatively, it can be spent on something a per-son wants now (e.g., a nicer house), as opposed to havingto wait to buy it in the future.
Thus, people must be compensated for making moneyavailable even if there is no inflation. If, for example,people require at least $105 after one year as compensa-tion for making $100 available today, then they are equat-ing the value of $105 after one year to $100 in the present.Put another way, the “present value” of $105 one yearfrom now is $100. The annual rate of return (5 percentin this example) in compensation for the time value ofresources is the discount rate.
If an analyst knows the appropriate discount rate, heor she can calculate the “present value” of any sum ofresources or money to be spent or received in the future.The application of the discount rate to future sums tocalculate their present value is known as “discounting”(see box). Through discounting, different investment al-ternatives can be objectively compared based on theirrespective present values, even though each has a differ-ent stream of future benefits and costs.
FORMULA FOR DISCOUNTING
The standard formula for discounting is as fol-lows:
PV = [1/(1+ r)t ] A t
where:
PV = present value at time zero (the base year);r = discount rate;t = time (year); andA = amount of benefit or cost in year t.
The formula above is the most basic calculationof present value. The term
1 / (1+ r)t
which incorporates the discount rate “r” is calledthe discount factor. Multiplying a future sum bythe appropriate discount factor for that future yearwill yield the present value of that sum at timezero (e.g., the year in which the analysis is beingdone).
Of course, most highway projects generatecosts and benefits over their entire life cycles. Thisentire series of costs and benefits must be dis-counted to the present by multiple applicationsof the PV formula for each applicable year of thelife cycle (see formula below). These discountedvalues are then summed together (as representedby ∑) for each year of the life-cycle analysis pe-riod (“N”) to yield an overall present value. Theformula for doing this is as follows: NPV = ∑ [1/(1+ r)t ] A t t=1
The present value of a series of numbers is oftendescribed as the “net present value,” reflectingthe fact that the discounted sum often representsthe net value of benefits after costs are subtractedfrom them.

ECONOMIC ANALYSIS PRIMER 13
Selecting a Discount Rate
As a rule of best practice, economic analysis should bedone in real terms, i.e., using dollars and discount ratesthat do not include the effects of inflation. A real dis-count rate can be estimated by removing the rate of in-flation (as measured by a general price index such as theCPI) from a market (or nominal) interest rate for gov-ernment borrowing. The selected market rate for gov-ernment borrowing should be based on governmentbonds with maturities comparable in length to the analy-sis period used for the economic analysis. Real discountrates calculated in this manner have historically rangedfrom 3 percent to 5 percent—the rates most often usedby States for discounting highway investments (see box).
The U.S. Office of Management and Budget (OMB) cur-rently requires U.S. Federal agencies to use a 7 percent realdiscount rate to evaluate public investments and regulations.1
Federal agencies may use lower rates (based on inflation-adjusted Federal borrowing costs) for life-cycle cost analy-sis. In January 2003, OMB reported a 10-year real discountrate of 2.5 percent and a 30-year rate of 3.2 percent, basedon current Federal borrowing costs. These latter rates re-flect historically low costs of government borrowing.
In times of budget shortfalls, an agency may increaseits discount rate to reflect the higher opportunity cost of
THE DISCOUNT RATE MATTERS
The selection of an appropriate discount rate isimportant. For example, the present value of$1,000 of benefits received 30 years in the futureis $412 when discounted at 3 percent per year,$231 when discounted at 5 percent, but only $57when discounted at 10 percent. Thus, presentvalues of costs and benefits 30 years in the futurecan be changed by more than a factor of 5 de-pending on the discount rate used. Due to theimportance of the discount rate, care should betaken to select one that reflects a State’s actualtime value of resources.
1 This rate is adjusted occasionally. OMB has announced that signifi-cant changes in the 7 percent rate will be reflected in future guidanceto Federal agencies.
such funds. The agency should consider, however, thatthe discount rate applies over the life of the project, andadjusting the discount rate to reflect short-term fundingfluctuations may distort the value of long-term benefitsand costs. An agency may also increase its discount rateto account for project risk. FHWA recommends, how-ever, that risk be treated directly with risk analysis toolsrather than through adjustments to the discount rate (seesection on Risk Analysis, page 30).

14 ECONOMIC ANALYSIS PRIMER
LIFE-CYCLE COST ANALYSIS
The first systematic economic means of comparinghighway investments that will be discussed in thisprimer is called life-cycle cost analysis (LCCA). Itapplies the discount rate to the life-cycle costs of
two or more alternatives to accomplish a given project orobjective, enabling the least cost alternative to be identi-fied.
WHEN TO USE LIFE-CYCLE COST ANALYSIS
LCCA is applied when an agency must undertake a projectand is seeking to determine the lowest life-cycle-cost (i.e.,most cost-effective) means to accomplish the project’sobjectives. LCCA enables the analyst to make sure thatthe selection of a design alternative is not based solely onthe lowest initial costs, but also considers all the futurecosts (appropriately discounted) over the project’s usablelife.
LCCA is used appropriately only to select from amongdesign alternatives that would yield the same level of per-formance or benefits to the project’s users during normaloperations. If benefits vary among the design alternatives(e.g., they would accommodate different levels of traf-fic), then the alternatives cannot be compared solely onthe basis of cost. Rather, the analyst would need to employbenefit-cost analysis (BCA), which measures the monetaryvalue of life-cycle benefits as well as costs (BCA is discussedat length in the next section of this primer, page 17). Ac-cordingly, LCCA should be viewed as a distinct, cost-onlysubset of BCA. Even with these restrictions, however,LCCA has many useful applications (see box).
PROCEDURES FOR BEST RESULTS
Best-practice LCCA requires that the objective(s) of theproject be clearly defined, assumptions about future us-age be clearly stated, and all reasonable means of accom-plishing the same objective(s) be evaluated. Only whenall reasonable alternatives are evaluated can the analystbe confident that LCCA will reveal the most cost-effective transportation solution.
USEFUL APPLICATIONS OFLIFE-CYCLE COST ANALYSIS
Life-cycle cost analysis (LCCA) has applications formany areas of interest to State and local transpor-tation agencies. Common applications of LCCA in-clude the following:
• Designing, selecting, and documenting the most af-fordable means of accomplishing a specified projector objective. For instance, if a bridge must be replaced,LCCA can be used to select the replacement optionthat would cost the least over the expected life of thebridge.
• Evaluating pavement preservation strategies. Thecosts of each strategy can be evaluated relative to theexpected effects it will have on delaying the costs ofexpensive rehabilitations or reconstructions.
• Value engineering (VE). Value engineering must beapplied to all Federal-aid highway projects on the Na-tional Highway System with an estimated cost of $25million or more. Among other requirements, the VEteam must consider the lowest life-cycle-cost meansof accomplishing a project.
• Project planning and implementation, especially theuse and timing of work zones. LCCA allows the ana-lyst to balance higher agency and/or contractor costsassociated with off-peak work hours against reducedtraveler delay costs associated with fewer work zonesduring peak periods.
Note that these applications involve comparing al-ternatives with identical levels of service (e.g., pave-ment preservation or replacement strategies for anexisting two-lane road). Were the level of servicedifferent among alternatives being compared, astrict comparison of life-cycle costs using LCCAwould not be appropriate. Rather, the correct eco-nomic tool would be benefit-cost analysis.

ECONOMIC ANALYSIS PRIMER 15
In LCCA, the analyst applies the discount rate to thecosts from each year of the project’s life cycle. This yieldsthe present value of the project’s cost stream. Because thecosts of competing alternatives can only be comparedfairly if the alternatives yield the same benefits, the ana-lyst must compare the project alternatives over the sameoperational time period, known as the study or analysisperiod. As a rule of thumb, the analysis period should belong enough to incorporate all, or a significant portion,of each alternative’s life cycle, including at least one ma-jor rehabilitation activity for each alternative (typically aperiod of 30 to 40 years for pavements, but longer forbridges). In some cases, an analysis period long enoughto capture the life cycle of one alternative may requirethat a shorter-lived alternative be repeated during thatperiod.
It is important to capture all costs that differ amongthe alternatives being compared. Where uncertaintyassociated with future costs is identified, the analystshould assess its potential impact on the alternativeusing appropriate risk analysis methods (see section onRisk Analysis, page 30).
COST ELEMENTS TO INCLUDE
Costs associated with construction, rehabilitation, andmaintenance activities of each alternative being comparedshould be identified, monetized, and then discounted totheir present value. Table 1 lists the cost categories andelements generally included in LCCA.
There may be cases where some of the cost elementsshown in Table 1 need not be quantified when compar-ing alternatives using LCCA. This is because alternativesthat accomplish identical objectives (a requirement whenusing LCCA) often have many costs in common (e.g.,they occupy the same right-of-way and require the samedesign effort). Costs that are identical (in terms of boththeir amount and when they occur) among all alterna-tives need not be quantified, as they will “wash out” in acost comparison. In short, the analyst should focus onlyon those costs that vary among alternatives.
Of agency cost elements, construction and rehabilita-tion typically vary the most among alternatives and mustbe quantified. Routine maintenance costs may or may notvary significantly. Different alternatives may be evaluatedwith and without preservation treatments of differenttypes. The BCA section of this primer (page 17) containsmore information about quantifying agency costs.
“User costs” are those costs pertaining to a projectalternative that travelers, rather than the agency, wouldincur. User costs often vary significantly among alter-natives, largely due to different work zone requirementsfor the construction and rehabilitation activities asso-ciated with each alternative. Using available models,the analyst can estimate user costs associated with traveldelay at work zones with some accuracy. Vehicle oper-ating costs (VOC) in work zones can also be estimated,but these are typically small relative to those for traveldelay. Work zones can affect safety, but work zone crashcosts are sometimes omitted from LCCA due to in-conclusive data about crash rates and severities for spe-cific work zone configurations and traffic managementstrategies.
User costs under normal facility operating conditionsshould not vary significantly among the alternatives be-ing compared using LCCA. Significant differences in suchcosts among alternatives would suggest that the levels ofperformance (and therefore the benefits) of the alterna-tives are not equal and that BCA should be used insteadof LCCA.
TABLE 1. Costs Typically Considered in Life-Cycle CostAnalysis
Agency Costs
Design and engineering
Land acquisition
Construction
Reconstruction/Rehabilitation
Preservation/Routine maintenance
User Costs Associated With Work Zones
Delays
Crashes
Vehicle operating costs

16 ECONOMIC ANALYSIS PRIMER
USER COST CONTROVERSY
Work zones temporarily reduce capacity and can createsignificant delays to travelers. Best-practice LCCA shouldreflect work zone user costs along with agency costs. Manyagencies, however, have been reluctant to include workzone user costs with agency costs in LCCA calculations.Project design alternatives that reduce work zone usercosts often entail higher agency expenses—not welcomein times of tight highway budgets. This is particularlytrue because agency costs appear in agency budgets anduser costs do not. Agencies may also perceive that thereis too much uncertainty in valuing user travel delay time.
It is inadvisable, however, not to assign a value to workzone travel delay when using economic analysis methodssuch as LCCA or BCA. Highway agencies build roads toaccommodate users. If an agency cites benefits to usersas a justification for spending agency dollars to build orrehabilitate a road, it should also recognize the costs tousers caused by these actions. Most travelers clearly doattach significant value to their travel time—otherwisetraffic congestion would not generate so much publicconcern and irritation. In a national survey conducted in2000, FHWA found that frustration with construction-related delay ranked among the top items of motorist dis-satisfaction.2 Finally, the value of travel time in delay isnot arbitrary or uncertain. Economists are able to mea-sure its value with a good degree of accuracy (see sectionon BCA for information on the valuation of travel time).
Even if user costs are not counted on a dollar-to-dol-lar basis with agency costs, quantifying them throughLCCA informs decision makers about the “level of pain”to road users from any given project design alternative.It also provides an important perspective about the cost-effectiveness of strategies to reduce work zone disrup-tions (see box).
TOOLS
A wide variety of proprietary and nonproprietary toolsare available with which to analyze the life-cycle costs ofhighway projects. These tools are usually spreadsheet-based applications, some of which incorporate risk analysistechniques.
THE IMPORTANCE OF KEEPINGUSER COSTS IN PERSPECTIVE
The following excerpt illustrates one reason whyuser costs should be evaluated along with agencycosts for construction projects:
“When are they going to be done?” It’s a ques-tion echoed by frustrated motorists forced tonavigate through large construction zones acrossthe region. In fact, highway officials acknowledge,people who complain that road constructionprojects are taking longer and longer are right.
Traffic is slowing road repairs, they say. High-ways that could be rebuilt quickly if shut downcompletely must remain open to prevent back-ups from growing even worse. Meanwhile, ever-lengthening rush hours have eaten into the timeavailable to close even one lane. Road crews mustproceed more cautiously when working amidtraffic. (“Road Work Adds to Traffic and ViceVersa,” Washington Post, May 13, 2002, p. B1).
By placing dollar values on user costs, the costs ofstrategies to maintain traffic flow can be evalu-ated and compared. In some cases, life-cycle costanalysis may reveal it is less costly for agencies andusers to do a temporary road closure than tostretch out construction.
FHWA has undertaken several initiatives to promotethe application of LCCA in the highway pavement de-sign process. “Life-Cycle Cost Analysis in Pavement De-sign,” an FHWA interim technical bulletin (FHWA-SA-98-079, 1998), is an important resource to LCCApractitioners. It provides guidance on the estimation andtreatment of both agency and user costs in pavement de-sign and maintenance. In 2002, FHWA released a primeron LCCA and a spreadsheet software program (RealCost)to do LCCA for pavement designs. The “Life-Cycle CostAnalysis Primer” (FHWA IF-02-047) is available on theOffice of Asset Management Web site, http://www.fhwa.dot.gov/infrastructure/asstmgmt/invest.htm.The Web site also provides a link to the interim techni-cal bulletin. FHWA offers a free workshop to highwayagencies on the use of its RealCost LCCA software andthe methodology underlying it.
2 See “Moving Ahead: The American Public Speaks On Roadways AndTransportation In Communities,” FHWA-OP-01-017, February 1,2001, http://www.fhwa.dot.gov/reports/movingahead.htm.

ECONOMIC ANALYSIS PRIMER 17
LCCA is a useful economic tool for selecting amongalternatives where benefits of the possible projectalternatives are essentially identical. In many cases,however, alternatives that an agency is consider-
ing may not generate identical benefits. For instance,when reconstructing a road, an agency may wish to con-sider reconstructing it as is or with additional lanes. Theappropriate economic tool for these instances is benefit-cost analysis (BCA), which considers life-cycle benefitsas well as life-cycle costs (see box).
BCA attempts to capture all benefits and costs accru-ing to society from a project or course of action, regard-less of which particular party realizes the benefits or costs,or the form these benefits and costs take. Used properly,BCA reveals the economically efficient investment alter-native, i.e., the one that maximizes the net benefits to thepublic from an allocation of resources.
BCA is not the same thing as financial analysis. Finan-cial analysis is concerned with how to fund a project overits lifespan and measures the adequacy of current and fu-ture funds and revenues to cover the cost of building,operating, and maintaining the project. While financialanalysis is an important part of project management, theeconomic merit of the project as measured by BCA isgenerally not affected by how the project is financed.
BENEFIT-COST ANALYSIS
USEFUL APPLICATIONS OFBENEFIT-COST ANALYSIS
Benefit-cost analysis (BCA) considers the changesin benefits and costs that would be caused by apotential improvement to the status quo facility.In highway decision making, BCA may be usedto help determine the following:
• Whether or not a project should be undertaken atall (i.e., whether the project’s life-cycle benefits willexceed its costs).
• When a project should be undertaken. BCA mayreveal that the project does not pass economic mus-ter now, but would be worth pursuing 10 years fromnow due to projected regional traffic growth. If so,it would be prudent to take steps now to preservethe future project’s right-of-way.
• Which among many competing alternatives andprojects should be funded given a limited budget.BCA can be used to select from among design al-ternatives that yield different benefits (e.g., recon-struct a roadway with additional lanes versus noadditional lanes); unrelated highway projects (a wid-ened road versus an interchange on another road);and unrelated transportation projects in differenttransportation modes.

18 ECONOMIC ANALYSIS PRIMER
THE BENEFIT-COST ANALYSIS PROCESS
In BCA, the analyst applies a discount rate to the benefitsand costs incurred in each year of the project’s life cycle.This exercise yields one or more alternative measures ofa project’s economic merit.
The BCA process (see box) begins with the establish-ment of objectives for an improvement to a highway fa-cility, such as reducing traffic congestion or improvingsafety. A clear statement of the objective(s) is essential toreduce the number of alternatives considered. The nextstep is to identify constraints (policy, legal, natural, orother) on potential agency options and specify assump-tions about the future, such as expected regional trafficgrowth and vehicle mixes over the projected lifespan ofthe improvement.
Having identified objectives and assumptions, the ana-lyst (or analytical team) then develops a full set of rea-sonable improvement alternatives to meet the objectives.This process begins with the development of a “do mini-mal” option, known as the base case. The base case rep-resents the continued operation of the current facilityunder good management practices but without major in-vestments.3 Under these “do minimal” conditions, thecondition and performance of the base case would be
expected to decline over time. Reasonable improvementalternatives to the base case can include a range of op-tions, from major rehabilitation of the existing facility tofull-depth reconstruction to replacement by a higher vol-ume facility. Such alternatives will often involve construc-tion, but alternatives that improve highway operations(such as the use of intelligent transportation systems) ormanage travel demand (such as incentives for off-peaktravel) are suitable for consideration.
To ensure that the alternatives can be compared fairly,the analyst specifies a multiyear analysis period over whichthe life-cycle costs and benefits of all alternatives will bemeasured. The analysis period is selected to be longenough to include at least one major rehabilitation activ-ity for each alternative.
Ideally , the level of effort allocated to quantifying ben-efits and costs in the BCA is proportional to the expense,complexity, and controversy of the project. Also, to re-duce effort, the alternatives are screened initially to en-sure that the greatest share of analytical effort is allocatedto the most promising ones. Detailed analysis of all alter-natives is usually not necessary.
When an alternative is expected to generate signifi-cant net benefits to users, particularly in the form of con-gestion relief, the analyst evaluates the effect that the al-ternative would have on the future traffic levels andpatterns projected for the base case (see section on Fore-casting Traffic for Benefit Calculations, page 27). Changesin future traffic flows in response to an alternative willaffect the calculation of project benefits and costs.
The investment costs, hours of delay, crash rates, andother effects of each alternative are measured using engi-neering methods and then compared to those of the basecase, and the differences relative to the base case are quan-tified by year for each alternative. The analyst assigns dol-lar values to the different effects (e.g., the fewer hours ofdelay associated with an alternative relative to the base caseare multiplied by a dollar value per hour) and discounts themto a present value amount. Risk associated with uncertaincosts, traffic levels, and economic values also is assessed(see section on Risk Analysis, page 30).
Any alternative where the value of discounted benefitsexceeds the value of discounted costs is worth pursuingfrom an economic standpoint. For any given project, how-ever, only one design alternative can be selected. Usually,this alternative will be the economically efficient one, forwhich benefits exceed costs by the largest amount.
Based on the results of the BCA and associated riskanalysis, the analyst prepares a recommendation concern-
MAJOR STEPS IN THE BENEFIT-COSTANALYSIS PROCESS
1. Establish objectives
2. Identify constraints and specify assumptions
3. Define base case and identify alternatives
4. Set analysis period
5. Define level of effort for screening alternatives
6. Analyze traffic effects
7. Estimate benefits and costs relative to base case
8. Evaluate risk
9. Compare net benefits and rank alternatives
10. Make recommendations
3 The base case is sometimes called the “do nothing” option, but thisterm can be mistaken to mean that future management of the facilityis not responsive to change. The term “do minimal” conveys thenotion of ongoing managerial discretion to adjust to changingcircumstances in the base case scenario.

ECONOMIC ANALYSIS PRIMER 19
ing the best alternative from an economic standpoint. Itis good practice to document the recommendation witha summary of the analysis process conducted. In somecases, particularly for larger projects, this summary willinclude a discussion about the economic impact analysisconducted based on the results of the BCA (see sectionon Economic Impact Analysis, page 32).
BENEFIT AND COST ELEMENTS TO INCLUDE
Table 2 lists the benefit and cost categories and elementsthat are generally included in BCA.
The user elements in Table 2 are labeled as “cost/ben-efit” rather than “cost” or “benefit” only. This is becauseimprovement alternatives are being compared to the basecase (the “do minimal” option), and each may have a dif-ferent impact on users. For instance, one alternative mayreduce crash rates (a benefit) relative to the base case;another alternative may increase crash rates (a cost, alsocalled a negative benefit or disbenefit) relative to the basecase. In BCA, most, if not all, agency and user elementswill vary relative to the base case—thus, contrary toLCCA, all elements must typically be considered andquantified.
TABLE 2. Benefits and Costs Typically Considered inBenefit-Cost Analysis
Agency Costs
Design and engineering
Land acquisition
Construction
Reconstruction/Rehabilitation
Preservation/Routine maintenance
Mitigation (e.g., noise barriers)
User Costs/Benefits Associated With Work Zones
Delay
Crashes
Vehicle operating costs
User Costs/Benefits Associated With Facility Operations
Travel time and delay
Crashes
Vehicle operating costs
Externalities (nonuser impacts, if applicable)
Emissions
Noise
Other impacts
20 ECONOMIC ANALYSIS PRIMER
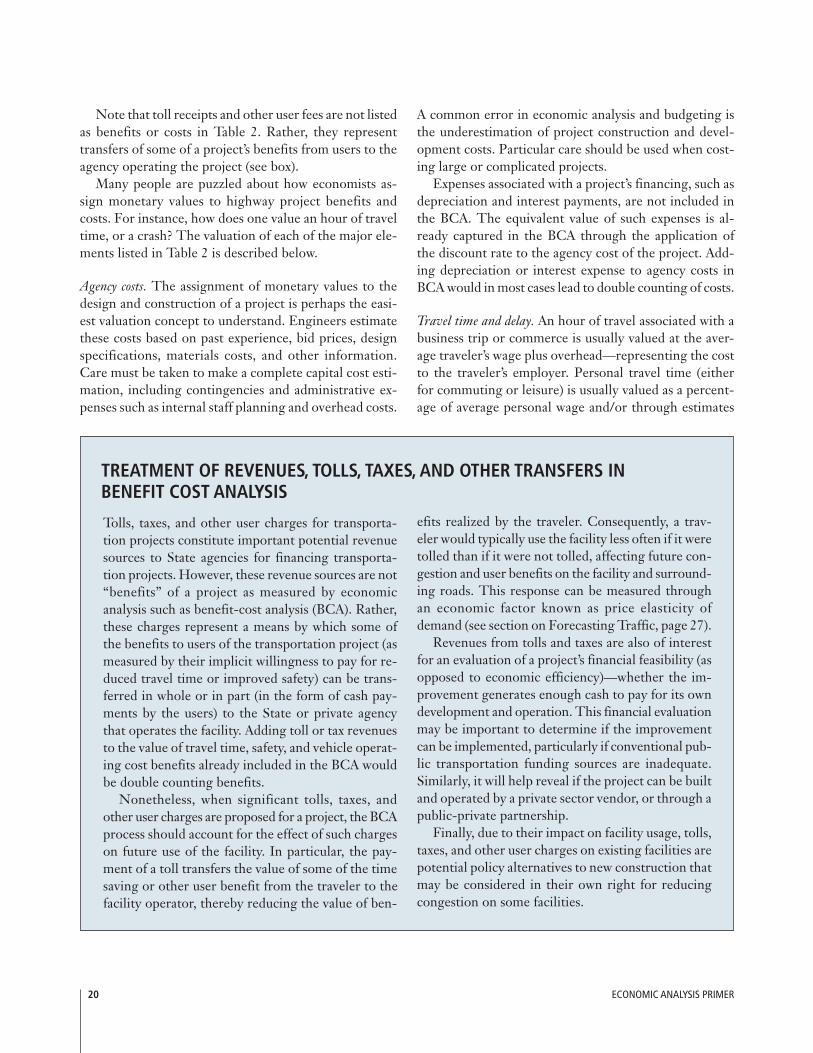
Note that toll receipts and other user fees are not listedas benefits or costs in Table 2. Rather, they representtransfers of some of a project’s benefits from users to theagency operating the project (see box).
Many people are puzzled about how economists as-sign monetary values to highway project benefits andcosts. For instance, how does one value an hour of traveltime, or a crash? The valuation of each of the major ele-ments listed in Table 2 is described below.
Agency costs. The assignment of monetary values to thedesign and construction of a project is perhaps the easi-est valuation concept to understand. Engineers estimatethese costs based on past experience, bid prices, designspecifications, materials costs, and other information.Care must be taken to make a complete capital cost esti-mation, including contingencies and administrative ex-penses such as internal staff planning and overhead costs.
A common error in economic analysis and budgeting isthe underestimation of project construction and devel-opment costs. Particular care should be used when cost-ing large or complicated projects.
Expenses associated with a project’s financing, such asdepreciation and interest payments, are not included inthe BCA. The equivalent value of such expenses is al-ready captured in the BCA through the application ofthe discount rate to the agency cost of the project. Add-ing depreciation or interest expense to agency costs inBCA would in most cases lead to double counting of costs.
Travel time and delay. An hour of travel associated with abusiness trip or commerce is usually valued at the aver-age traveler’s wage plus overhead—representing the costto the traveler’s employer. Personal travel time (eitherfor commuting or leisure) is usually valued as a percent-age of average personal wage and/or through estimates
Tolls, taxes, and other user charges for transporta-tion projects constitute important potential revenuesources to State agencies for financing transporta-tion projects. However, these revenue sources are not“benefits” of a project as measured by economicanalysis such as benefit-cost analysis (BCA). Rather,these charges represent a means by which some ofthe benefits to users of the transportation project (asmeasured by their implicit willingness to pay for re-duced travel time or improved safety) can be trans-ferred in whole or in part (in the form of cash pay-ments by the users) to the State or private agencythat operates the facility. Adding toll or tax revenuesto the value of travel time, safety, and vehicle operat-ing cost benefits already included in the BCA wouldbe double counting benefits.
Nonetheless, when significant tolls, taxes, andother user charges are proposed for a project, the BCAprocess should account for the effect of such chargeson future use of the facility. In particular, the pay-ment of a toll transfers the value of some of the timesaving or other user benefit from the traveler to thefacility operator, thereby reducing the value of ben-
efits realized by the traveler. Consequently, a trav-eler would typically use the facility less often if it weretolled than if it were not tolled, affecting future con-gestion and user benefits on the facility and surround-ing roads. This response can be measured throughan economic factor known as price elasticity ofdemand (see section on Forecasting Traffic, page 27).
Revenues from tolls and taxes are also of interestfor an evaluation of a project’s financial feasibility (asopposed to economic efficiency)—whether the im-provement generates enough cash to pay for its owndevelopment and operation. This financial evaluationmay be important to determine if the improvementcan be implemented, particularly if conventional pub-lic transportation funding sources are inadequate.Similarly, it will help reveal if the project can be builtand operated by a private sector vendor, or through apublic-private partnership.
Finally, due to their impact on facility usage, tolls,taxes, and other user charges on existing facilities arepotential policy alternatives to new construction thatmay be considered in their own right for reducingcongestion on some facilities.
TREATMENT OF REVENUES, TOLLS, TAXES, AND OTHER TRANSFERS INBENEFIT COST ANALYSIS

ECONOMIC ANALYSIS PRIMER 21
EXTERNALITIES VERSUS INDIRECT EFFECTS
Externalities considered in benefit-cost analysis (BCA) are the uncompensateddirect impacts of the project on nonusers of the project. These effects are addi-tive to other direct costs and benefits (such as the value of time saving or re-duced crashes and saved lives) measured in the BCA. Direct effects, however,usually lead to indirect effects on the regional economy through the actions ofthe marketplace. Indirect impacts of a transportation project could include lo-cal changes in employment or land use. The value of indirect effects is usuallynot additional to that of direct effects measured in BCA; rather, indirect effectsare a restatement or transfer to other parties of the value of direct effects. Indi-rect economic effects are measured using economic impact analysis and notBCA (see section on Economic Impact Analysis, page 32).
of what travelers would be willing to pay to reduce traveltime. The U.S. Department of Transportation (USDOT)recommends that analysts value local personal travel timeat 50 percent of average wage (see “Departmental Guid-ance for the Valuation of Travel Time in Economic Analy-sis,” available on the internet, for additional guidance).The value of reduced travel time often accounts for thegreatest share of a transportation project’s benefits.
Crashes. The assignment of monetary values to changesin crash rates or severities can provoke controversy be-cause crashes often involve injury or loss of life. The useof reasonable crash values is critical, however, to avoidunderinvesting in highway safety. Economists often usethe dollar amounts that travelers are willing to pay to re-duce their risk of injury or death to estimate monetaryvalues for fatalities and injuries associated with crashes.Medical, property, legal, and other crash-related costs arealso calculated and added to these amounts. USDOT of-fers extensive guidance on this subject (see “Revision ofDepartmental Guidance on Treatment of the Value ofLife and Injuries,” and “The Economic Impact of MotorVehicle Crashes,” 2000 (DOT HS 809 446), available onthe internet).
Vehicle operating costs. The costs of owning and operatingvehicles can be affected by a project due to the changesthat it causes in highway speeds, traffic congestion, pave-
ment surface, and other conditions that affect vehicle fuelconsumption and wear and tear. Accurate calculations ofa project’s effect on vehicle operating costs (VOC) re-quire good information on the relationship of vehicle per-formance to highway conditions, and clear assumptionsabout future vehicle fleet fuel efficiency and performance.USDOT does not provide official guidance on estimat-ing VOC, but useful information on the valuation of VOC(and other BCA elements) is provided in AASHTO’s 1977“Manual on User Benefit Analysis of Highway and Bus-Transit Improvements” and its successor document, andin the “Highway Economic Requirements System Vol-ume IV: Technical Report” (FHWA-PL-00-028), Chap-ter 7. Benefits attributable to lower VOC are usually nota major component of a project’s benefit stream.
Externalities. One of the more challenging areas of BCAis the treatment and valuation of the “externalities” oftransportation projects. In economics, an externality isthe uncompensated impact of one person’s actions on thewell-being of a bystander (see box). In the case of trans-portation investments, “bystanders” are the nonusers ofthe project. When the impact benefits the nonuser, thisis called a positive externality. When the impact is ad-verse, this is called a negative externality.
Often, when there is talk about externalities of high-ways, the focus is on negative externalities. Negative ex-ternalities include undesirable effects of a project on air
22 ECONOMIC ANALYSIS PRIMER
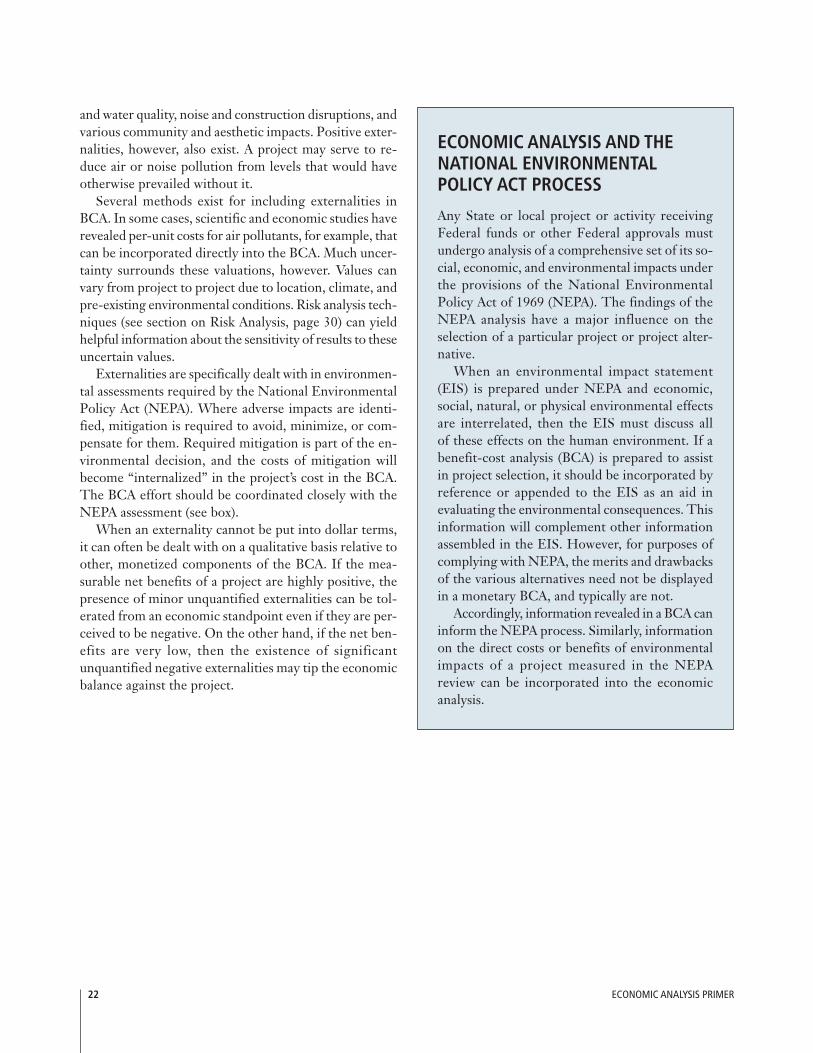
and water quality, noise and construction disruptions, andvarious community and aesthetic impacts. Positive exter-nalities, however, also exist. A project may serve to re-duce air or noise pollution from levels that would haveotherwise prevailed without it.
Several methods exist for including externalities inBCA. In some cases, scientific and economic studies haverevealed per-unit costs for air pollutants, for example, thatcan be incorporated directly into the BCA. Much uncer-tainty surrounds these valuations, however. Values canvary from project to project due to location, climate, andpre-existing environmental conditions. Risk analysis tech-niques (see section on Risk Analysis, page 30) can yieldhelpful information about the sensitivity of results to theseuncertain values.
Externalities are specifically dealt with in environmen-tal assessments required by the National EnvironmentalPolicy Act (NEPA). Where adverse impacts are identi-fied, mitigation is required to avoid, minimize, or com-pensate for them. Required mitigation is part of the en-vironmental decision, and the costs of mitigation willbecome “internalized” in the project’s cost in the BCA.The BCA effort should be coordinated closely with theNEPA assessment (see box).
When an externality cannot be put into dollar terms,it can often be dealt with on a qualitative basis relative toother, monetized components of the BCA. If the mea-surable net benefits of a project are highly positive, thepresence of minor unquantified externalities can be tol-erated from an economic standpoint even if they are per-ceived to be negative. On the other hand, if the net ben-efits are very low, then the existence of significantunquantified negative externalities may tip the economicbalance against the project.
ECONOMIC ANALYSIS AND THENATIONAL ENVIRONMENTALPOLICY ACT PROCESS
Any State or local project or activity receivingFederal funds or other Federal approvals mustundergo analysis of a comprehensive set of its so-cial, economic, and environmental impacts underthe provisions of the National EnvironmentalPolicy Act of 1969 (NEPA). The findings of theNEPA analysis have a major influence on theselection of a particular project or project alter-native.
When an environmental impact statement(EIS) is prepared under NEPA and economic,social, natural, or physical environmental effectsare interrelated, then the EIS must discuss allof these effects on the human environment. If abenefit-cost analysis (BCA) is prepared to assistin project selection, it should be incorporated byreference or appended to the EIS as an aid inevaluating the environmental consequences. Thisinformation will complement other informationassembled in the EIS. However, for purposes ofcomplying with NEPA, the merits and drawbacksof the various alternatives need not be displayedin a monetary BCA, and typically are not.
Accordingly, information revealed in a BCA caninform the NEPA process. Similarly, informationon the direct costs or benefits of environmentalimpacts of a project measured in the NEPAreview can be incorporated into the economicanalysis.

ECONOMIC ANALYSIS PRIMER 23
COMPARING BENEFITS TO COSTS
Once the analyst has calculated all benefits and costs ofthe project alternatives and discounted them, there areseveral measures to compare benefits to costs in BCA.The two most widely used measures are described below.
• Net present value (NPV). NPV is perhaps the most straight-forward BCA measure. All benefits and costs over analternative’s life cycle are discounted to the present, and thecosts are subtracted from the benefits to yield a NPV. Ifbenefits exceed costs, the NPV is positive and the project isworth pursuing. Where two or more alternatives for a projectexist, the one with the highest NPV over an equivalent analy-sis period should usually be pursued. Policy issues, perceivedrisk, and funding availability, however, may lead to the se-lection of an alternative with a lower, positive NPV.
• Benefit-cost ratio (BCR): The BCR is frequently used to se-lect among projects when funding restrictions apply. In thismeasure, the present value of benefits (including negative
benefits) is placed in the numerator of the ratio and thepresent value of the initial agency investment cost is placedin the denominator. The ratio is usually expressed as a quo-tient (e.g., $2.2 million/$1.1 million = 2.0). For any givenbudget, the projects with the highest BCRs can be selectedto form a package of projects that yields the greatest mul-tiple of benefits to costs (see box, page 24).
FHWA recommends the use of either the NPV or BCRmeasures for most economic evaluations. Other BCAmeasures are available and may be used, however, depend-ing on agency preference. For example, the equivalentuniform annual value approach converts the NPV mea-sure into an annuity amount. The internal rate of returnmeasure represents the discount rate necessary to yieldan NPV of zero from a project’s multiyear benefit andcost stream.

24 ECONOMIC ANALYSIS PRIMER
APPROPRIATE USE OF THE BENEFIT-COST RATIO
The benefit-cost ratio (BCR) is often used to se-lect among competing projects when an agency isoperating under budget constraints. In particular,use of the BCR can identify a collection of projectsthat yields the greatest multiple of benefits to costs,where the ability to incur costs is limited by avail-able funds. However, care must be taken when re-lying on the BCR as the primary benefit-cost analy-sis (BCA) measure.
The Federal Highway Administration (FHWA)recommends that only the initial agency investmentcost be included in the denominator of the ratio. Allother BCA values, including periodic rehabilitationcosts or user costs, such as delay associated with con-struction, should be included in the ratio’s numera-tor as positive or negative benefits. Adherence to thisguidance facilitates consistent project comparisons.For instance, assume there are two potential projects,each with a present value of $1 million in initial in-vestment costs, $4 million in user benefits, and $1million in negative benefits associated with user de-lay at construction work zones. If the analyst includesthe negative benefits with the benefits in the numera-tor of the BCR, the BCR would be ($4 million - $1million)/$1 million, or 3, for both projects. On theother hand, if the analyst includes the negative ben-efits with the initial investment costs in the denomi-nator of the BCR, the BCR would be $4 million/($1million + $1 million), or 2, for both projects. If theanalyst were inconsistent and assigned the respec-tive negative benefits to the numerator of one projectand the denominator of the other, then the firstproject would appear superior based on the BCR (3versus 2), when in fact, each project would yield thesame net present value of $2 million ($4 million –$1 million – $1 million).
It is also good practice not to base a selection fromamong two or more alternatives solely on simple BCRvalues, without reference to the budget or other in-vestment opportunities. Consider the case of two al-ternatives to improve an intersection. One alter-native (improved traffic signals with left-turn lanes)has modest benefits to the public ($10 million inpresent value) but a low initial investment cost($500,000)—yielding a BCR of 20. The other alter-native (constructing a grade-separated intersection)has high benefits ($100 million in present value) butan initial investment cost of $10 million—yielding alower BCR (10) than the first alternative. Selectionof the first alternative, based solely on its higher BCR,would preclude (at least for some period of time) theopportunity for the traveling public to gain the muchhigher net benefits associated with the second alter-native. In fact, selection of the first alternative wouldonly be appropriate if enough other projects existedwith BCRs above 10 such that the collective benefitsof the first alternative plus these other projects fundedwith the $10 million needed for the second alterna-tive would equal or exceed the $100 million in ben-efits of the second alternative.
Use of specialized procedures such as incremen-tal BCA, in which the increments in benefits and costsof one alternative relative to another are comparedin ratio format and prioritized subject to budget con-straints, can minimize the risk of selecting inferioralternatives using BCRs. A good description of theincremental BCA approach is provided in chapter 7of “HERS-ST 2.0 Highway Economic RequirementsSystem–State Version Overview,” FHWA, Septem-ber 2002, http://isddc.dot.gov/OLPFiles/FHWA/010617.pdf.
ECONOMIC ANALYSIS PRIMER 25
MISUNDERSTANDINGS
BCA is a powerful, informative tool available to assistplanners, engineers, and decision makers. Agencies oftenavoid or underutilize BCA due to misconceptions about it.
In some cases, agency personnel are skeptical aboutthe accuracy of BCA due to perceived uncertainties inmeasuring or valuing costs and benefits. In reality, thereis much more substance to economic analysis techniquesand values than is generally understood. Where uncer-tainty does exist, it can usually be measured and man-aged. It is helpful to remember that sound economicanalysis reduces uncertainty. Not doing the analysis onlyserves to hide uncertainty from decision makers.
Another concern is that the workload involved in BCAmay be excessive relative to agency resources. Once theengineering and economic capabilities are in place, how-ever, BCA workloads diminish markedly. BCA level ofeffort should also reflect project cost, complexity, andcontroversy—routine projects may be analyzed with mini-mal effort.
Finally, some agencies are concerned that the resultsof BCA could conflict with preferred or mandated out-comes. In any situation, an objective and independentassessment of a project’s economic consequences can con-tribute valuable information to the decision process.There are, however, valid reasons why decision makersmay choose to override or constrain economic informa-tion. For example, if there are concerns that BCA resultswould disproportionately favor projects in urban areas,policy makers can initially apportion funds betweenurban and rural areas based on equity considerations.Urban projects would then compete based on their eco-nomic merits for the urban funds; rural projects wouldsimilarly compete for the rural funds.
AVOIDING PITFALLS
As with any analytic method, BCA can give erroneousresults if it is misused. Perhaps the foremost cause of er-ror in BCA is the selection of an unrealistic base case.The base case must be premised on intelligent use andmanagement of the asset during the analysis period.For instance, allowances should be made for traffic di-version and changing peak periods as congestion buildsin the base case (the broader importance of accurate traf-fic forecasts is discussed in the next section, page 27). Fail-ure to do this can lead to overly pessimistic estimates ofdelay levels in the base case, to which by comparison anyalternative would look attractive. BCA results can also bebiased by the comparison of only one design alternativeto the base case, even though less costly alternativesexist. Proper BCA considers a full range of reasonablealternatives.
Another common BCA problem involves the evalua-tion of a “project” that is actually a combination of twoor more independent or separable projects. In such cases,the net benefits of one project may hide the net costs ofthe other, or vice versa. Both of the projects would eitherbe built or rejected if incorrectly joined together, whenin fact one should be built and the other rejected.
BCA results can be erroneous if they do not includethe correct cost or benefit elements or amounts associ-ated with a project. This problem happens most oftenwith the omission of user costs or major externalities (ifpresent). In some cases, an agency may focus only on lo-cal costs and benefits, failing to include those that accrueoutside its jurisdiction. Care must also be taken not toinclude “benefits” that are simply restatements of otherbenefits (or costs) measured elsewhere in the BCA. Thislatter error, a form of double counting, can occur whenemployment, business, or land use effects measured us-ing economic impact analysis are added to the travel timesaving, safety, and vehicle operating cost benefits of aproject. A more thorough discussion of this latter issue isprovided later in this primer, in the section on EconomicImpact Analysis (page 32).

26 ECONOMIC ANALYSIS PRIMER
TOOLS
Many tools that can accommodate BCA are available. Themajority of tools capture benefits and costs at the projectlevel only, but some tools can estimate the net benefits ofprojects at the program level.
In the United States, perhaps the best-known BCAtool for highways is that presented in the 1977 AASHTO“Manual on User Benefit Analysis of Highway and Bus-Transit Improvements,” referred to as the 1977 Redbook.This guide is being updated under a National Coopera-tive Highway Research Program contract and will be re-issued. The Texas Transportation Institute developed theMicroBENCOST model to implement the guidance inthe 1977 Redbook. A few States have developed their ownBCA models.
Some software applications are specific to subsets ofhighway investments. For instance, the Federal Railroad
Administration’s Gradedec software is specific to theBCA evaluation of upgrades, separations, and closures ofhighway-rail grade crossings.
In 2000, FHWA released a State-level version of itsHighway Economic Requirements System (HERS-ST).HERS-ST is a computer model that applies BCA tosection-level highway data to predict system-wide invest-ment requirements. HERS-ST considers capital improve-ments directed at correcting pavement, geometric, orcapacity deficiencies. HERS-ST can determine the pro-gram funding levels required to achieve desired highwayperformance goals in a cost-beneficial way. Alternatively,the model can estimate the highway system performancethat would result from various program-funding levels.An abundance of material concerning HERS-ST is avail-able on the Office of Asset Management Web site,http://www.fhwa.dot.gov/infrastructure/asstmgmt/invest.htm.

ECONOMIC ANALYSIS PRIMER 27
T raffic volumes determine both the numberof travelers who will benefit from a highwayimprovement project and, in the case of capacityenhancement projects, the future congestion re-
lief provided by the project. Accordingly, accurate fore-casts of traffic volumes are critical to obtaining valid re-sults from BCA.
Traffic forecasting is often more complicated than itfirst appears. An assumption that the historic growth rateof traffic on a road will continue unchanged after it isimproved can lead to significant miscalculations of itsactual future traffic. In fact, traffic levels on an improvedroad may increase faster than anticipated as drivers seekto take advantage of its better driving conditions.
FORECASTING TRAFFIC FOR BENEFIT CALCULATIONS
TRAFFIC FLOWS ARE DYNAMIC
Why would a road attract more traffic volume after it isimproved than it would if it were not improved?
Drivers who formerly avoided the facility because itwas too congested may start to use it once the congestionhas been reduced by an improvement. Many of these driv-ers will divert to the improved facility from other con-gested regional roads. Similarly, some drivers who for-merly traveled in off-peak hours on the facility to avoidsevere congestion will shift back to peak hours, adding topeak hour volumes when congestion is most noticeableto commuters.
Other drivers will “unchain” existing trips into mul-tiple trips or make new trips that they might otherwisehave avoided due to excessive delay associated with con-gestion. Some individuals may shift from transit to auto-mobile. Drivers may also make longer trips (to more re-mote locations) than they did before the improvement.Other traffic responses can and do occur.
The new and diverted users of the improved facilitywill enjoy benefits, just as will the existing users. Theseadditional users, however, will use up some of the capac-ity of the improved facility, reducing the congestion re-lief that would have resulted for existing users had theadditional users not arrived.
TRAFFIC FORECASTING PROCESS
The traffic forecasting process begins with the collectionof data on current traffic on the facility and throughoutthe region, followed by the calculation of expected growthin traffic for the region in general. This base case regionaltraffic projection should reflect expected economic, de-mographic, and land use trends, based on historic andprojected relationships between these factors and regionaltraffic growth.

28 ECONOMIC ANALYSIS PRIMER
Data on expected regional traffic growth can thenbe entered into the region’s travel demand model tosimulate regional traffic flows with and without the newhighway capacity. MPOs and States typically maintainthe travel demand models for planning purposes. Mosttravel demand models now in use are effective at mea-suring the extent to which existing network traffic willdivert to new capacity—a major source of “new” traf-fic on improved roads. Other traffic responses can beapproximated even when they are not measured explic-itly by the models. For instance, the models can bemanipulated, through various feedback adjustments, tosimulate the effects of mode shifts and alternative des-tinations chosen by regional travelers in response to areduction in congestion. Although not explicitly cap-tured in most travel demand models, the shifting oftraffic to and from peak periods as congestion levelschange can be estimated using supplemental methods.
NETWORK AND CORRIDOR EFFECTS
A travel demand model may indicate that a significantamount of future traffic on the facility to be improvedwill be diverted from other roads in the region. This ef-fect, while mitigating some of the congestion relief onthe improved facility itself, will reduce congestion on theother roads. In this case, the BCA for the new capacityproject should attempt to incorporate the beneficial ef-fects (as measured by the travel demand model) of theimproved facility on other roads in the corridor as well ason the facility itself. Of course, reduced delay on the af-fected roads may lead to some compensating, new tripgeneration on those roads as well.
IMPACT ON BENEFIT CALCULATIONS
Unless the analyst considers traffic responses to an im-proved facility, he or she may overestimate the benefitsof the improved facility to existing users and understatethe benefits to the new users and those drivers on otherroads in the regional highway network. This can lead tomisperceptions by decision makers and members of thepublic about the important benefits of new capacity onregional traffic patterns and congestion.
On the improved facility, the time saving benefit pertrip for pre-existing users will diminish relative to what itwould have been had traffic volume not changed, but will
still be positive. This saving can be calculated directlyfrom the reduction in delay based on changes in thevolume/capacity ratios caused by the improvement, afterallowing for traffic adjustments. Users of other routes inthe network who do not divert to the improved facilitywill similarly receive time saving benefits caused by thereduction in traffic volume due to the diversion of othersto the improved facility.
Users on the improved facility who diverted from otherroutes will receive benefits equal, on average, to the mid-point between those of pre-existing users of the improvedfacility and those of users of other facilities who do notdivert from those facilities. This midpoint value reflectsthe fact that some diverted users will gain the full timesaving of the improved facility but others will do onlyslightly better than had they not diverted. By a similarcomputation, users making new (as opposed to diverted)trips on the improved facility or other routes can be shownto experience benefits equal, on average, to half of thoseexperienced by pre-existing users on the respective fa-cilities.
Numbers of affected users for each user class, alongwith data on the amount of time saving, can be derivedfrom the travel demand modeling procedures describedin this section.
WHEN TO DO A FULL DEMAND FORECAST
Standard travel demand modeling, principally address-ing trip diversion, is often sufficient for BCA of routinecapacity projects. State or MPO planning offices oftenundertake such modeling as a matter of course in theirpreparation of transportation improvement plans. In gen-eral, it is a good idea to conduct BCA in close coordina-tion with planning offices.
A comprehensive traffic forecast, incorporating the fullrange of traffic responses to capacity improvements,should be done for regionally significant or controversialprojects. It is easy for the credibility of the BCA to bechallenged if it is learned that new trips or other effectsof new capacity were ignored. Traffic forecasting can beused to educate the public that the new capacity leads tobenefits for more than just the existing users of the to-be-improved road, and that traffic diverting to the newroad will reduce congestion throughout the network.

ECONOMIC ANALYSIS PRIMER 29
PRICE ELASTICITY OF DEMAND AND TRAFFIC FORECASTING
An important benefit of a capacity expansion projectis the reduction in travel times for highway users.Travel time is a major component in overall price orcost to the user, which includes time as well as out-of-pocket costs. As with most goods and services, alower price can be expected to lead to more quantitydemanded—in this case, some additional travel.
Price elasticity of demand is an economic conceptused to summarize how much more or less of some-thing people will consume if its price changes. Fromthe standpoint of estimating future traffic levels, elas-ticity represents how a change in the cost of driving,due to a reduction in travel time or implementationof a toll, may affect the volume of travel that willtake place. These changes in volume result from somedrivers’ decisions to make more or fewer trips thanthey otherwise would have made.
Elasticity is stated in percentage change terms, e.g.,an X percent reduction in travel price leads to a Ypercent increase in travel miles or trips. An elasticityof zero implies that travel is unresponsive to a price
change, no matter how large, while an infinite elas-ticity implies that even a one-second decrease in traveltime will cause all capacity to be completely absorbed.
While price elasticity is a generally accepted toolin economics, there are differing opinions about howto apply it in a transportation context. The transpor-tation economics literature reveals a wide range ofmeasured elasticity values, reflecting different studymethods, data, time periods, and locations. No stud-ies, however, suggest that travel demand elasticity iseither zero or infinite. When measured on a givenfacility, observed elasticity includes the effects of bothdiverted trips, which represent existing traffic that hassimply shifted from other routes or time periods, andnew travel taken as a consequence of the lower usercost. Additional research is needed to narrow therange of elasticity values that are applicable to a givenset of circumstances—whether facility, corridor, orregion—and to develop methods for better incorpo-rating demand elasticity into traffic forecasting.
30 ECONOMIC ANALYSIS PRIMER
RISK ANALYSIS
Uncertainty is a factor in the analysis of transpor-tation projects just as it is in any other enter-prise. Fortunately, much of the uncertaintyassociated with transportation investments can
be evaluated and managed.
DEFINING RISK
Typically, the analyst is faced with a number of uncer-tainties when evaluating a highway investment. Many ofthese uncertainties can be measured by quantifying theprobability of an event and its impact if it occurs. Mea-sured uncertainty is known as “risk.” Risk can be identi-fied and understood by answering three questions:
• What can happen? The following are examples of things thatcan happen that would change BCA results: there are initialconstruction or future rehabilitation cost overruns, facilityservice life is less or more than expected, or traffic volumesvary significantly from projections.
• How likely is it to happen? Some things are more likely tooccur than are others. For instance, it may be that the projectin question is well understood and unlikely to have con-struction cost overruns.
• What are the consequences of an event occurring? In some cases,an input variable may be subject to significant variability,but any given occurrence (within a realistic range) wouldnot substantially affect the economic justification for theproject. For instance, the price of a paving material may besubject to large swings, but the benefits of a particular alter-native using that material may be sufficiently large to main-tain the alternative as the preferred one even if the pavingmaterial price doubles. In other cases, there may be littlelikelihood that an event will occur (such as an earthquake),but its occurrence would have major consequences unlesscertain precautions are taken in the project’s design.
Risk analysis will help the analyst answer these questionsand determine if efforts to mitigate some or all of the riskwould be cost-effective.
SENSITIVITY ANALYSIS
The traditional means by which analysts have evaluatedrisk is through sensitivity analysis. In a typical sensitivityanalysis, the value of an input variable identified as a sig-nificant potential source of uncertainty is changed (ei-ther within some percentage of the initial value or over arange of reasonable values) while all other input valuesare held constant, and the amount of change in analysisresults is noted. This sensitivity process is repeated forother input variables for which risk has been identified.The input variables may then be ranked according to theeffect of their variability on BCA results.
Sensitivity analysis allows the analyst to get a feel forthe impact of the variability of individual inputs on over-all economic results. In general, if the sensitivity analysisreveals that reasonable changes in an uncertain input vari-able will not change the relative economic ranking ofproject alternatives or undermine the project’s economicjustification, then the analyst can have reasonable com-fort that the results are robust. Alternatively, a reason-able change in an uncertain input value could severelyundermine the project’s economic justification. If so, theanalyst would investigate methods to reduce the risk of achange in that input value and analyze steps to minimizeconsequences if the adverse event occurs. If the risk can-not be mitigated, the analyst may recommend against un-dertaking that particular project design.

ECONOMIC ANALYSIS PRIMER 31
PROBABILISTIC ANALYSIS
There is usually some uncertainty associated with severalvariables in an economic analysis, and these variables mayvary simultaneously. Sensitivity analysis as traditionallypracticed can measure the effect of a change in more thanone variable at a time, but the results of analysis involv-ing many different scenarios can become confusing tointerpret. Fortunately, continuing advances in comput-ing power available through microcomputers permit thepractice of probabilistic-based risk analysis, most oftenthrough a method known as Monte Carlo simulation.
In Monte Carlo simulation, the analyst assigns an ap-propriate probability distribution (based on expert opin-ion, historical data, and other information) to each of theinput variables subject to uncertainty in the economicanalysis. The Monte Carlo simulation samples randomlyfrom the probability distributions for each input, runsthe selected input values through the BCA formula tocalculate a discrete economic result, and then repeatsthis process over and over again. The results, whichare based on the randomly selected input values, arearrayed in the form of an average BCA result and aprobability distribution covering all potential outcomesof the BCA.
Figure 2 illustrates the NPV outcomes of two com-peting project alternatives analyzed using the MonteCarlo simulation method. This particular analysis is rela-tively easy to interpret. Assume that these are two alter-natives to accomplish a particular project, or two projectscompeting for the same funding. Alternative B has a
higher mean NPV (represented by the value under thepeak) than does alternative A. The NPV for alternativeA, however, has a tighter range of potential values thandoes alternative B, and, unlike alternative B, is not at sig-nificant risk of having a negative NPV. If the decisionmaker were risk neutral (or a risk taker), alternative Bwould be preferred. If the decision maker were risk averse,alternative A, with its somewhat lower NPV but lowerrange of downside outcomes, might be preferred.
MITIGATING RISK
Once risks have been identified and quantified, the nextstep is to evaluate potential actions to mitigate them.Many actions may be taken to reduce risk, including in-creased engineering, additional quality testing, applica-tion of value engineering, and various contractual meth-ods such as design/build. In some cases, the object of riskmitigation may be to shift risk to the party that is mostable to control it, such as through the use of constructionwarranties.
The reduction of risk to the agency and the travelingpublic associated with a potential risk mitigation actionmust be weighed against the cost of the action. Accord-ingly, the range of potential economic outcomes for theproject should be calculated with and without the riskmitigation action in place. If a highway agency were riskneutral, it would pursue risk mitigation to the extent thatthe cost of the action(s) is at least compensated by thehigher expected value of the mean BCA outcome (e.g.,due to a reduction in the number of potential downside
NPV outcomes). If the agency is riskaverse, it may decide to accept a lowerexpected NPV in exchange for reduceddownside risk.
More information on risk analysis,particularly as applied in LCCA, is avail-able in “Life-Cycle Cost Analysis inPavement Design,” an FHWA interimtechnical bulletin (FHWA-SA-98-079,1998). This document is available on theOffice of Asset Management Web siteat http://www.fhwa.dot.gov/infrastruc-ture/asstmgmt/lcca.htm.
FIGURE 2. Probabilistic Outcome Distributions
0.18
0.16
0.14
0.12
0.1
0.08
0.06
0.04
0.02
0–20–15 –10 –5 0 5 10 15 20 25 30 35 40 45 50 55 60 65 70 75 80
Rela
tive
Prob
abili
ty
Alternative A
Alternative B
Net Present Value ($ Millions)

32 ECONOMIC ANALYSIS PRIMER
Economic impact analysis (EIA) is the study of theway in which the direct benefits and costs of ahighway project (such as travel time saving) affectthe local, regional, or national economy. It at-
tempts to measure the consequences that a highwayproject or action will have on considerations such as lo-cal or regional employment patterns, wage levels, busi-ness activity, tourism, housing, and even migration pat-terns. As used in this primer, EIA should not be confusedwith Environmental Impact Analysis as related to require-ments of the National Environmental Policy Act of 1969and other environmental laws, regulations, and guidance.
ECONOMIC IMPACT ANALYSIS
ROLE OF ECONOMIC IMPACT ANALYSIS
BCA measures the direct benefits and costs that a projectcauses for highway agencies, travelers (users), and, in thecase of externalities, to nonusers affected by the project.Direct benefits and costs are the first order or immediateimpacts of the transportation project on users and nonus-ers, and consist of elements described earlier in this primer,including changes in travel time, crashes, vehicle operatingcosts, agency construction costs, and pollution costs. BCAtypically does not measure how these direct benefits andcosts are converted into indirect effects on the economy,
such as changes in employment, wages,business sales, or land use. This is the roleof EIA.
Economists generally hold that thedirect benefits and costs of transporta-tion improvements measured usingBCA are converted into wider, indirect,economic impacts through the opera-tion of the marketplace. These con-verted, indirect effects are assumed tohave the same net monetary value as theBCA-measured direct effects. Signifi-cantly, the value of most converted eco-nomic effects is not additive to the valueof the BCA-measured direct effects—rather, the former value is a restatementor capitalization of the latter value.
For instance, faster commutingtimes may induce more people to pur-chase houses distant from an employ-ment center. This new demand formore remote properties drives up theprice of the remote properties. Thus, thehighway user transfers part of the valueof his or her travel time saving to theowners of the remote properties in the

ECONOMIC ANALYSIS PRIMER 33
form of a higher purchase price than he or she wouldhave paid had the highway improvement not been built.
WHEN TO DO ECONOMIC IMPACT ANALYSIS
In many instances, the findings of BCA are compellingin their own right. A project intended to improve safetyor reduce traffic congestion can often be justified in lightof the number and value of crashes avoided or hours oftraveler time saved. Even so, indirect economic impactsmeasured by EIA based on BCA results are of major in-terest to decision makers, planners, and the public, espe-cially for large projects that are expected to generate majordirect transportation benefits and costs.
Similarly, individuals are generally at least as concernedabout the specific effects of a project on themselves asthey are about its overall effect on the public. People whowould particularly benefit may advocate for the project;those who perceive that they would be worse off may raisestrong objections to the project. EIA can identify whothese people are likely to be and how they would be af-fected. If EIA shows that those who are better off fromthe project greatly outnumber those who are worse off, itis easier to build public support for the project.
Any State or local project or activity receiving Federalfunds or other Federal approvals must undergo analysisof a comprehensive set of its social, economic, and envi-ronmental impacts under the provisions of NEPA. EIAcan play an important role in supporting this analysis.
METHODS AND TOOLS
There are many different levels of sophistication in EIA.As with BCA, the best method and level of effort for anygiven project depends on the scale, complexity, and con-troversy of the project.4
Basic methods of EIA include survey studies, marketstudies, and comparable case studies. Surveys may takethe form of expert interviews (e.g., with businesses alonga route), vehicle origin-destination logs, collection ofshopper origin-destination data, and corridor inventory(windshield survey) methods. Survey studies are gener-ally qualitative interpretations of the effects of transpor-
tation projects, preferably informed by BCA and othereconomic data pertaining to the transportation effects ofhighway projects.
Market studies consider demand and supply for busi-ness activity and then attempt to quantify the effects onthe market of a change in transportation costs caused bya project. Comparable case studies are most often usedto evaluate the localized economic impacts of a projecton neighborhoods, downtowns, or small towns. This ap-proach is applied to projects such as bypasses of smalltowns, where comparable projects and situations else-where in the same State or region can be readily identi-fied and studied.
More advanced EIA methods encompass econometricanalysis and economic modeling, including productivityimpact analysis and regional economic models. Produc-tivity impact analysis, also known as the production func-tion approach, attempts to measure aggregate economicgrowth that may result from additional highway spend-ing. This approach seeks to capture productivity benefitsnot typically included in BCA.
4The categories and descriptions in this section on EIA methods arebased on NCHRP Synthesis Report 290, “Current Practices for As-sessing Economic Development Impacts from Transportation Invest-ments: A Synthesis of Highway Practice,” 2000.

34 ECONOMIC ANALYSIS PRIMER
Input-output analysis is a key component of most regionaleconomic modeling of the employment, output, and incomeimpacts of transportation infrastructure investments. Input-output analysis quantifies the multiple economic effects re-sulting from a change in the final demand for a specific prod-uct or service. For example, a person being paid to work ona highway project will spend some of those wages to buygoods and services. The money he or she spends shows upas sales and wages to other parties, who spend the moneyelsewhere, and so on. This chain of effects, known as the“multiplier,” captures the distributive effects of transporta-tion capital spending and operating benefits across a broadrange of industries. Typically, the input-output multipliersare driven by the initial, direct benefits and costs of the projectmeasured by BCA.
The simplest regional economic models are direct ap-plications of input-output models, such as RIMS II (“Re-gional Input-Output Modeling System,” 2nd edition, U.S.Department of Commerce). These applications are“static” in the sense that they provide an all-at-once viewof economic effects, without a time component that isnecessary for understanding when the effects will berealized. More sophisticated applications of regional eco-nomic models supplement input-output relationships with
simulation techniques to forecast the year-to-year effectsof projects on economic and demographic patterns. Themost complex EIA models are those that integrate traveldemand models, land use models, dynamic simulationeconomic models, and input-output models.
PRESENTATION OF RESULTS
As a matter of best practice, EIA results should be pre-sented as a complementary analysis to the BCA. BCAresults show whether a project is worth the resources thatwill be invested in it from a total social welfare stand-point. EIA results are helpful in informing decision mak-ers and the public about how and in what form the ben-efits and costs of the project will ultimately be distributedwithin the economy. Information from both analyses maybe summarized in a recommendations package and con-sidered jointly in reaching a decision on whether or notto go forward with a project. The EIA results should nei-ther state nor imply, however, that the monetary value ofindirect economic effects is additional to the NPV mea-sured in the BCA. To do so would overstate the economicjustification of the project by effectively double countingthe project’s net benefits.

ECONOMIC ANALYSIS PRIMER 35
CONCLUSION
The goal of this primer has been to describe themajor principles, concepts, and methods fordoing economic analysis of highway projects. Thecoverage of these subjects has been necessarily
brief. For the interested reader, a wealth of additionalinformation is available from publicly accessible sources.5
The material in this primer, however, will hopefully besufficient to provide a learning framework, and to makethe reader aware of several key points.
First and foremost, economic analysis provides valu-able information to the planning, design, construction,preservation, and operation of the transportation infra-structure. The limited supply of transportation dollarsmust be invested in a manner that gives the greatest re-turn to the public. The most objective way to accomplishthis is to compare the benefits and costs of transporta-tion projects through the standard unit of the discounteddollar over the life cycles of projects. As such, economicanalysis is an integral component of any comprehensiveinfrastructure management methodology, such as Trans-portation Asset Management.
Benefit-cost analysis is the most comprehensivemethod to evaluate the reasonableness of highway projectsin economic terms. In some cases, when it is clear that aproject must be undertaken regardless of its cost (e.g., acritical bridge on an interstate highway must be repairedor replaced in kind), LCCA will reveal the most cost-effective way of accomplishing the project. Used prop-erly and in coordination with other disciplines, thesemethods can accommodate everything from user delayassociated with work zones to measuring the net benefitsof new roadway capacity.
State agencies and other practitioners typically mustinvest some effort to establish the skills and proceduresneeded to conduct economic analysis. Once established,however, economic analysis integrates with existing plan-ning, environmental, and engineering practices with mini-mal additional work. In fact, by directly addressing issuessuch as the effect of new highway capacity on traffic pat-terns or the justification for a project, economic analysiscan considerably lessen agency workloads associated withdesigning projects to appropriate scale and demonstrat-ing the need for such projects to the public.
Uncertainty is a complicating factor in economic analy-sis as it is in virtually every area of human endeavor. Un-certainty can be measured and quantified as risk throughrisk analysis methods. Using economic analysis to evalu-ate the net benefits of various risk reduction strategiescan help agencies manage risk.
Finally, through the mechanism of the marketplace,the direct benefits and costs of highway projects will causevarious indirect effects on local and regional economies,including impacts on employment levels, wages, businessactivity, and housing prices. EIA tools can measure theseindirect effects of highway projects based on the findingsof BCA. Indirect effects are often of major interest todecision makers and the public, and, particularly for largeprojects, can be presented in a complementary analysisto the BCA.
5For instance, the FHWA Office of Asset Management Web site, http://www.fhwa.dot.gov/infrastructure/asstmgmt/index.htm, has links tomany references for each of the subjects discussed in this primer.

For further information and additional copies of
this document, contact:
Office of Asset Management (HIAM)
Federal Highway Administration
U.S. Department of Transportation
400 7th Street, SW, Room 3211
Washington, DC 20590
Telephone: 202-366-9242
Fax: 202-366-9981

FHWA IF-03-032
EconomicAnalysis Primer