Embed Size (px)
Citation preview
Economic Analysis of the FMCG Industry In China
(Fast Moving Consumer Goods)
Supervisor: prof. Luigi Benfratello
Candidate Yu Shiqian
March 2021
Table of Contents INTRODUCTION ................................................................................................................................................ 4
1 THE CONCEPT OF FAST MOVING CONSUMER GOODS (FMCG) ................................................... 4
1.1 THE DEFINITION OF FMCG INDUSTRY ....................................................................................................... 4 1.2 THE TYPE OF FMCG INDUSTRY ................................................................................................................. 5 1.3 THE TYPES OF CHANNELS OF FMCG INDUSTRY ......................................................................................... 7 1.4 FMCG INDUSTRY PLAYS AN IMPORTANT ROLE ALL OVER THE WORLD ..................................................... 9
2 OVERVIEW ECONOMIC DEVELOPMENT OF FMCG INDUSTRY IN CHINA .............................. 12
2.1 THE DEVELOPMENT OF FMCG INDUSTRY DURING LAST TWO-THREE DECADES IN CHINA ........................ 12 2.2 OVERVIEW ECONOMIC DEVELOPMENT OF THE FMCG INDUSTRY IN CHINA ............................................... 14 2.3 CURRENT STATUS OF FMCG INDUSTRY STUDY ....................................................................................... 17
2.3.1 Key Market Segments in China ...................................................................................................... 17 2.3.2 Covid-19’s impact on the FMCG Industry ...................................................................................... 19 2.3.3 Market Investment Strategies ......................................................................................................... 20
3 MARKET ECONOMIC ANALYSIS OF THE FMCG INDUSTRY IN CHINA .................................... 24
3.1 ANALYSIS ON THE PROFITABILITY OF THE FMCG INDUSTRY IN CHINA...................................................... 24 3.1.1 Profitability Analysis of Packaged Food and Beverages ................................................................. 24 3.1.2 Profitability Analysis of Personal and Home Care ......................................................................... 26 3.1.3 Profitability Analysis of Imported Products .................................................................................... 27
3.2 THE DESCRIPTION OF THE MAJOR PLAYERS IN THE FMCG INDUSTRY IN CHINA – P&G AS AN EXAMPLE .... 28 3.2.1 Factors of Becoming a Giant in the GMCG Industry ..................................................................... 28 3.2.2 Economic Analysis of P&G Over the Past 20-30 Years .................................................................. 29 3.2.3 Economic Development of P&G’s Categories ................................................................................ 31
3.3 OPPORTUNITIES AND CHALLENGES OF THE FMCG INDUSTRY IN THE NEW ERA IN CHINA .......................... 36 3.3.1 Influence of Covid-19 Outbreak of FMCG Industry Development in China ..................................... 36 3.3.2 Consumption Upgrades - Chinese Consumers' Demand for High-end Products Rises ..................... 37 3.3.3 The Internet changes the mode of communication - the survival of the FMCG industry must embrace the Internet ................................................................................................................................................. 38
4 DRIVING FACTORS OF THE FMCG INDUSTRY DEVELOPMENT IN CHINA ............................. 40
4.1 CROWD ITERATION.................................................................................................................................. 40 4.2 ECONOMIC ENVIRONMENT ...................................................................................................................... 40 4.3 SUPER APP SOFTWARE ........................................................................................................................... 40 4.4 TECHNICAL FOUNDATION ........................................................................................................................ 41 4.5 POLITICAL FACTORS................................................................................................................................ 41
5 ECONOMIC ANALYSIS AND COMPARISON OF THE FMCG INDUSTRY BETWEEN CHINA AND THE WORLD BY TYPES ........................................................................................................................ 41
5.1 GLOBAL FMCG MARKET SHARE BY TYPE............................................................................................... 41 5.1.1 Beauty and Skin Care .................................................................................................................... 41 5.1.2 Food and Drinks (Beverage market as an example)................................................................... 44
5.2 CHINA FMCG MARKET SHARE BY TYPE ................................................................................................. 51 5.2.1 Beauty and Skin Care .................................................................................................................... 51 5.2.2 Food and Drinks(Beverage market as an example).................................................................... 55
6 THE COOPERATION AND COMPETITION BETWEEN LOCAL FMCG BRANDS AND FOREIGN FMCG BRANDS IN CHINA‘S ECONOMY ..................................................................................................... 58
6.1 FOREIGN BRANDS OF FMCG INDUSTRY ECONOMY DEVELOPMENT IN CHINA – P&G AS AN EXAMPLE ........ 58 6.2 LOCAL BRANDS OF FMCG INDUSTRY ECONOMY DEVELOPMENT IN CHINA ............................................... 59

6.3 COMPETITION BETWEEN CHINA INDIGENOUS ENTERPRISES AND FOREIGN-VENTURES ............................... 61
7 FUTURE SCENARIO OF FMCG INDUSTRY (DUE TO COVID-19)................................................... 63
7.1 POSITIVE TREND ..................................................................................................................................... 63 7.2 NEGATIVE TREND ................................................................................................................................... 66
8 CONCLUSION ......................................................................................................................................... 67
Introduction With the in-depth development of economic globalization, the world economy is constantly
developing and improving. FMCG Industry also develops very well. At the same time, China’s
FMCG market has developed tremendously under the declining international economic
environment. Many foreign companies, such as Procter & Gamble, Unilever, Mars and so on,
have seen opportunities to seize market share in China. The intervention of foreign companies
has intensified market competition, also bring development opportunities to domestic companies.
Under this situation, domestic companies have begun to rise rapidly. Meanwhile, many retailers
participate in this competition. This allows consumers to have a wider choice of space and
reduce their loyalty to the brand. In order to have a sufficient market share and maintain
economic growth, various FMCG companies began to conduct research on consumers and
invested a lot of money in this.
1 The Concept of Fast Moving Consumer Goods (FMCG) 1.1 The Definition of FMCG Industry FMCG is the acronym of Fast Moving Consumer Goods, which stands for Fast Moving
Consumer Goods. It refers to those products that have a short service life, a fast consumption
rate, and consumers need to buy repeatedly, involving food, beverages, cosmetics, detergents,
batteries, and toilet paper. And many other industries. Typical fast-moving consumer goods
include daily chemicals, food and beverages, tobacco, etc.; over-the-counter drugs (OTC) in
medicines can usually be classified as such.
They are called fast because they are first of all daily products, they rely on consumers' high
frequency and repeated use and consumption to obtain profit and value realization through large-
scale market volume. Therefore, the fast-moving consumer goods industry will have a "three-
month rule". If you let a new competitor fail to achieve quantitative breakthroughs in three
months, you are likely to eliminate it.
Sometimes, FMCG is also called PMCG (Packaged Mass Consumption Goods). As the name
suggests, products are packaged into individual small units for sale. Merchants pay more
attention to the impact of packaging, branding and popularization on this category. The easiest to
understand the definition of it includes packaged food, personal hygiene products, tobacco and
alcohol and beverages.
There are more important attributes of FMCG as following:
� Short product turnover cycle;
� The access to the market is short and wide;
� The market is vivid, outdoor billboards are set up in areas with high traffic and high-grade
products to advertise product image, and on-site demonstrations, promotions, discount sales
and other activities are carried out in stores;
� Convenience: consumers can habitually buy nearby;
� Visualized products: consumers are easily affected by the atmosphere of the store when they
buy;
� Low brand loyalty: It is easy for consumers to switch different brands among similar
products.
These characteristics determine the consumer's buying habits for fast-moving consumer goods:
simple, fast, impulsive, and emotional.
1.2 The Type of FMCG Industry Because the fast-moving consumer goods industry has a wide range of inclusiveness, the current
fast-moving consumer goods industry in China is mainly divided into consumer goods
manufacturing and distribution industries (supermarkets, hypermarkets, convenience stores and
other commercial forms).
Among them, the consumer goods manufacturing industry is mainly divided into the following
four sub-sectors:
Personal Care Industry: it consists of oral care products, hair care products, personal cleaning
products, cosmetics, tissue products and other industries.
Beauty cosmetics and personal care products refer to daily chemical industrial products that are
applied to the skin, hair, nails, lips and other parts of the human body by means of smearing,
wiping, spraying, etc., so as to achieve cleaning, maintenance, beauty, grooming and personal
care. . The beauty and personal care industry can be divided into skin care products, hair care
products, color cosmetics, perfumes, toiletries, baby products, deodorants and other fields
according to categories.
The United States has a market share of approximately 18.5% in the global beauty and personal
care market, and China has become the world's second largest beauty and personal care market
with a market share of 13%. In the context of global economic integration, emerging economies
represented by China, Brazil and India have developed rapidly. The rise of the middle class and
the increase in urbanization rates have provided a huge impetus for the beauty needs of emerging
countries.
In terms of market growth, markets such as China, Brazil, and South Korea have high growth
rates from 2014 to 2019, while mature markets such as Japan, France and Germany have
relatively low growth rates. China is the country with the fastest compound annual growth rate in
the global beauty industry, and shows huge consumption potential in the beauty and personal
care industry.
Home Care Industry: it is composed of cleaning products industry such as fabric cleaning
products, floor cleaners, air fresheners and insecticides.
With the continuous improvement of living standards, people's needs are not limited to food and
clothing, but also the pursuit of quality of life. For home care products, it is no longer the only
pursuit of cleanliness or cheap prices.
Driven by consumption upgrades and the "lazy" economy, home care products are also
constantly upgrading, among which high-efficiency, sophisticated, and high-quality products are
growing faster. The household cleaning care industry covers many parts from clothing cleaning
care, personal cleaning care and household cleaning care.
Brand Packaging Food and Beverage Industry: It is composed of healthy drinks, soft drinks,
baked goods, chocolate, ice cream, coffee and other industries.
According to “Innova Consumer Research”, Below ten trends could promote the future
economic growth of the food and beverage industry.
Storytelling-Winning with words: Today’s consumers’ curiosity for a variety of fresh foods has
found that many consumers are interested in the stories behind the products.
Plant-Based Revolution: Plant-based trends have entered the next stage due to consumer interest
in health, sustainability and ethics.
The Sustain Domain: Consumers’ expectations for sustainable development have exceeded the
previous ones, pushing companies to prioritize eco-efficiency work, especially food waste and
plastic waste.
The Right Bite: Consumers have adopted different responses to stress and busy pace of work
and life. Food innovation revolves around this phenomenon to create products that are easy to
prepare, easy to carry, or indulgent, so as to reduce stress and bring peace and enjoyment.
Tapping into Texture: According to the Innova survey, 70% of global respondents believe that
taste will bring more interesting food and beverage experiences, and they are also very active in
trying a variety of novel flavors.
Macronutrients Makeover: From a single product to the expansion of the category, or the
nutrition of the product to be more balanced and comprehensive.
Hello Hybrids: In addition to choosing specific raw materials to create novel tastes to cater to
consumers' curiosity, mixing and matching different tastes and categories is also a new trend.
Mix and match can be divided into three directions: category, taste, and raw materials.
A star is Born: Based on consumers' boldness to try new mentality and the pursuit of different
lifestyles, the food industry is also constantly experimenting with a variety of rare ingredients,
such as cannabis, cannabidiol CBD and prebiotics. However, consumer familiarity and
acceptance is the key to promoting rare ingredients.
Eat Pretty: In addition to their health concerns, consumers are becoming more and more
concerned about their appearance. According to the 2019 Innova Consumer Survey, more than
30% of Chinese respondents increase their intake of food and beverage products that can
improve their appearance to improve hair, skin and body. Food innovation related to appearance
continues to rise.
Brand Unlimited: Brands achieve unprecedented interaction with consumers through time-
limited personalized customization, and the limited time and limited sense of scarcity brings
consumers a unique and unique experience, which affects their consumption behavior.
Tobacco and Alcohol Industry: Items that can be digested quickly represent companies such as
Tsingtao Brewery.
1.3 The Types of Channels of FMCG Industry The main goal of establishing marketing channels is to deliver products to consumers smoothly,
so that consumers can shop as easily as possible and meet the needs of consumers at different
levels. Which model to adopt to set the market sales pattern is an important issue related to the
profitability of a company and the relationship between manufacturers.
Internet online channels: Amazon, Taobao, JD and other online sales channels have
become the main consumer platforms for future consumers, providing consumers with a more
convenient shopping experience.
Modern channels:
Hypermarkets: It provide consumers with one-stop shopping services. The types of goods sold
are complete, including non-food items such as home appliances, clothing, household goods,
fresh food and daily necessities, covering the daily needs of consumers. Due to the advantages of
scale, the prices of commodities are often lower.
Membership store:
A large-scale self-service shopping place that provides wholesale merchandise services for
members. The products sold are mainly FCL sales, and the price is cheaper than ordinary outlets.
Sam's Club and Metro belong to this channel.
Chain convenience:
Self-selected small stores operated in a chain manner, each store has a unified style of store
brand and store layout, and unified procurement and distribution. This type of customer mainly
provides fewer types of packaged food, beverages, and daily necessities for residents in the
surrounding communities. The goods in the store are clearly marked with prices, and there are
generally freezers selling frozen beverages. Generally longer business hours.
Traditional Channels:
Independent Convenience Store:
An independent self-service small store with no other branches. Such customers are small in
scale, with a business area of less than 100 square meters, and the types of goods provided are
limited, usually packaged food, beverages, and daily necessities consumed by surrounding
residents.
Traditional grocery store:
Traditional grocery stores are generally independent, family-run, non-self-service stores. General
sales of packaged food, beverages, daily necessities, toys, stationery and other commodities, of
which the proportion of food and beverage is relatively large.
Kiosk newsstand:
It mainly sells beverages, sweets, snacks, newspapers, magazines, cigarettes and other goods,
small shops or kiosks with fixed operating addresses, as well as mobile "water stalls" with strong
seasonality.
Educational channels:Generally for students and teachers in elementary schools, middle
schools and universities.
Transportation channels: provide consumers with medium and long-distance bus stations,
railway stations and airports service places.
Scenic spots/leisure/entertainment channels: places that meet consumer entertainment
needs.
At the same time, every marketing channel can profoundly explain that fast-moving consumer
goods penetrate into consumers' daily consumption life through various methods.
1.4 FMCG Industry Plays an Important Role All Over The World Take the personal care industry as an example. The consumption of beauty cosmetics is
becoming more and more mature. Consumers are upgrading from basic cosmetics to professional
cosmetics with stronger functional attributes, and then to medical beauty with faster results.
People with sensitive skin quickly expand, and consumers are gradually moving from ordinary
skin care to functional skin care. Sensitive skin refers to a highly reactive state of the skin under
certain conditions. It is essentially due to impaired skin barrier function and accelerated water
loss, which in turn leads to skin redness, irritation, itching, and molting. The cause of sensitive
skin is environmental factors on the one hand, and improper use of skin care products on the
other. Young women are the core group of sensitive skin. According to the "Consensus of
Experts on the Diagnosis and Treatment of Sensitive Skin in China", sensitive skin has a higher
incidence in all countries in the world, and the incidence of women is generally higher than that
of men. The 2017 survey showed that American women are 22.3%-50.9%, 40%-55.98% for
Asian women, and about 36.1% for Chinese women. There is 1 sensitive muscle in every 3
people. According to the "Guidelines for the Application of Soothing and Moisturizing Skin
Care Products in Sensitive Skin (2019)", the incidence of sensitive skin is increasing due to
changes in people's skin care methods, abuse of cosmetics or excessive cleaning, environmental
pollution and increased mental stress. Up to 32.4%-56%. The ever-increasing number of
sensitive muscles has given birth to the demand for professional skin care. Dermatology-level
skin care brands that focus on sensitive skin care have emerged and shine.
The constituent parties represented by post-95s and Kochi women have risen, and functional skin
care products have sufficient growth momentum. According to statistics from QuestMobile,
there is a clear trend of younger beauty consumer groups. From March 2019 to March 2020, the
proportion of beauty consumers under the age of 30 rose from 60.8% to 65.1%, of which post-
90s and post-95s occupy the main market. On the one hand, the fast pace of modern life makes
young people generally stay up late, and the disordered biological clock has spawned a variety of
skin problems. Young consumers urgently need powerful skin care products to meet their needs
for repairing skin problems; on the other hand, In the fast-developing Internet era, young
consumers have more channels to obtain and receive professional information, and their
awareness of skin care ingredients has increased, which has further stimulated the demand for
functional skin care products. According to a big push data, 84.83% of the constituent party
groups are women, and over 50% are 18-24 years old. From the perspective of occupational
distribution, people who are interested in professional skin care knowledge generally have
relatively good educational backgrounds, mainly college students, white-collar workers,
programmers, doctors and teachers. From the perspective of urban distribution, about half of the
party population is located in first- and second-tier cities, and their spending power is higher than
the entire population.
Let us turn our attention to the Home Care Industry. With the improvement of living standards
and the enhancement of people's hygiene awareness, more and more people realize the
importance of a clean family environment to human health and family happiness. Thanks to the
increase in per capita income, consumers have the ability to switch from the traditional cleaning
method of using rags and water to the use of more powerful professional surface cleaners, which
has greatly increased the consumption of hard face care products in China.
Cleaning products are indispensable in every family! At present, the household cleaning products
on the market can be described as a dazzling array. According to their uses, these products can
be roughly divided into kitchen and bathroom cleaning products, vegetable and fruit cleaning
products, clothing cleaning products, and wall cleaning products. If used improperly, these
chemical compounds will cause a certain amount of harm to the human body. Certain chemicals
may also produce harmful substances when used in combination, posing a threat to life safety.
This shows the importance of household cleaning products in the global economy.
The home cleansing category is also one of the few categories affected by the epidemic. The
sales of cleaning lotion during the epidemic increased by more than 300% year-on-year. It is
worth noting that the sales of products with low penetration rates such as dishwashers and
vegetable washing machines soared by 133% during the epidemic. Small kitchen appliances as a
whole were also industries that benefited from the surge in income/stock prices during the
epidemic. Currently, targeted dedicated washing There are still fewer brand choices for agents,
which means that there may be room for entrepreneurship in sub-categories in the future.
For paper towels/wet wipes, first, during the epidemic, various online channels and brands hope
to seize the dividends and channel their own products to sell online, so the promotion of paper
towels reappears; second, they need to stock up at home; third, health and cleanliness , The
importance of hygiene has risen sharply, so the market has grown substantially. Among them,
the more significant growth, which can not even be described as a big increase but can be
described as taking off from zero, is mainly alcohol disinfection wipes/cotton, and mid-to-high-
end products for the elderly, women, pregnant women, infants and young children.
Although this growth is directly related to the epidemic and will decline after the epidemic, it
seems that the epidemic may last for a longer period of time. This daily habit will be maintained,
and short-term growth has become a long-term necessity. In addition, consumer psychology has
undergone long-term and in-depth changes in the concept of disinfection and cleaning.
Therefore, the overall household cleaning market should be a large market with a growth rate
that exceeds conventional predictions, and growth is good.
The FMCG product group is an important contributor to the economy. The products include in
the FMCG group have a quick turnover. The global FMCG market includes the wide range of
durable and non-durable consumer products which are frequently purchased such as soap,
toiletries, cosmetics, shaving products, tooth cleaning products, and detergents and the non-
durable consumer products such as glassware, batteries, plastic goods, and paper products.
Personal care and household are the leading segment which generates highest revenue of the
overall market.
One of the major factors which is responsible to drive the growth of the global FMCG market
such as the increase in population. Increase in population is directly proportional to the increase
in consumption of the consumer goods. Moreover, frequent launches of new products also drive
the growth of the global FMCG market. Growing awareness in the consumers about FMCG
products is also responsible to drive the growth of the global FMCG market. Increase in the
disposable income of middle-class population drives the growth of the global FMCG market.
Rising income increases the purchases of FMCG products. Easier access of the consumer goods
for common people is also contributing in the growth of global FMCG market. Change in the
lifestyle of the consumers in developed and developing countries is also predicted to drive the
growth of the global FMCG market. In addition, effective advertisement of the brands is also
responsible for the growth of the global FMCG market. The FMCG industry has a strong
distribution channel which is responsible to drive the growth of the global FMCG market.
However, the growth of the FMCG market affected by the high competition in the major market
players of FMCG market. Moreover, retail execution is also restraining the growth of the global
FMCG market.
The growing trend of online shopping, R&D for the new brands and products and expansion of
FMCG network in rural areas of developing countries will act as an opportunity for the growth of
the global FMCG market.
2 Overview Economic Development of FMCG Industry in China 2.1 The Development of FMCG Industry During Last Two-Three Decades in
China In 2007, Beijing had a strong Olympic atmosphere.
That year, among the 10 sponsors of the Olympic Games, 5 were FMCG, 3 were beer,
Budweiser, Qingdao and Yanjing. Snow Beer, which has just bravely entered the capital, is also
fighting on the "grassroots" route. The sponsor’s Olympic rights are bombarded in various
outdoor media, and the beer war in Beijing is also going live: The promotional activities of “Big
Win the Olympics, Open the Cover to Win the Grand Prize” have allowed the three Beijing
factories of Tsingtao Brewery to reach their production capacity for the first time in history.
Saturated, Yanjing Beer quietly drove the car to the Tsingtao Brewery factory and approached
for reconnaissance.
In 2017, we all moved to the Internet. Occasionally look up, the waiting halls, buses, and
subways are all dominated by Tmall, JD, Xiaomi, Meituan, Toutiao, and Guazi; topics are AI,
blockchain, O2O, GP, LP, sharing, and small Fresh meat, Bitcoin...... We seem to be only one
Baidu and one Zhihu away from anything unknown. We are only one app away from any
product. We record life in the circle of friends and hold meetings in WeChat groups.. .... In
addition to mobile phones, life seems to be nothing necessary.
In the past ten years, the mobile Internet has been at the forefront and the scenery is infinite: 1. There is no middleman to make the difference: The main function of distributors (agents) for a
long time in the past was to undertake the functions of capital flow and warehousing logistics.
Now the flow of funds has been occupied by the mobile Internet, and the payment can be made
by scanning the code, and the money can be directly transferred without transfer or interception.
Nowadays, new retail, unmanned office shelves, and vending machines are the new version of
the "decisive terminal", the children born to the original small shops and Internet payment,
miniaturization, automation, terminal advancement, and sceneization. It is a common
opportunity and challenge for FMCG companies and channels.
2. From “Consumer” to “User” : In the context of FMCG, we usually call the end customer a
consumer. The Internet calls users who use its products and services. This is actually two
thinking and two modes.Let’s talk about fast-moving consumer goods first. Customers are
consumers. The distance is actually very far. Basic free range, stocking, occasional
communication, interaction, and feedback are often used to solve problems with probability,
such as opening the lid (scanning the code) and winning the prize. The probability is difficult to
achieve very high, how can it be almost universal like Didi Kuaidi’s subsidies back then.
Internet companies are different. Customer acquisition, new users, active users, and activity are
all viewed in real time every day, but they actually internalize customers (consumers). Under
these two thinking and operating models, the advantages and disadvantages are instant. The
consumer management operation model of Internet customization can better understand and
understand users. This kind of expression bottle actually forms a group to let users inform users
and let users move users.
3. The importance of “Intellectual Property” : Branding is hard work, and IP is clever work. Let's
restore consumers' buying psychology and behavior. Brand is often the guarantee factor, and the
decision to purchase is the effect of IP. Accumulating IP assets and generating a warmer, more
energetic, and more minded IP from the brand itself are new requirements for FMCG brands.
4. Capacity scale and execution are both double-edged swords: The larger the scale, the greater the
pressure, which may cause the brand to focus only on 80% of the big market, and then look
down on the small market. It feels that one hundred million is a small goal, not even a goal. But
the problem is that many cases in marketing history show that the 20% of the population in the
20% small market may have caused people in the 80% big market to follow and recreate 80% of
the big market. Staring at 80% of the big market can only deal with and think about today’s and
tomorrow’s 80%, hiding in today’s 20%
5. Consumption upgrade is a false proposition: When the brand is talking about "consumption
upgrade", the subtext is that the demands of consumers are now high, so they have to cater,
meet, adjust...
6. However, when we look at Apple, it is often that Apple leads the product upgrade, and then to
the next consumption upgrade and experience upgrade. The sense of brand is “consumer
upgrade”, which is actually the result of insufficient innovation of the brand itself, and the result
of staying in the comfort zone for too long.People without me can make others feel the
"consumption upgrade"; people with me without me, I feel the need to cater to the so-called
"consumption upgrade". For example, the beer industry. Why the ingredients have been "water,
rice, malt, and hops" for many years? When imported beer with "water, malt, and hops" and
craft beer with various ingredients such as "water, malt, blueberry, and hops" came , Do you
mean that consumption is really upgraded, or is it a slow insight? Is consumption upgraded or
the original marketing version is too old? The desire to be better, to replace the sub-optimal with
the better.
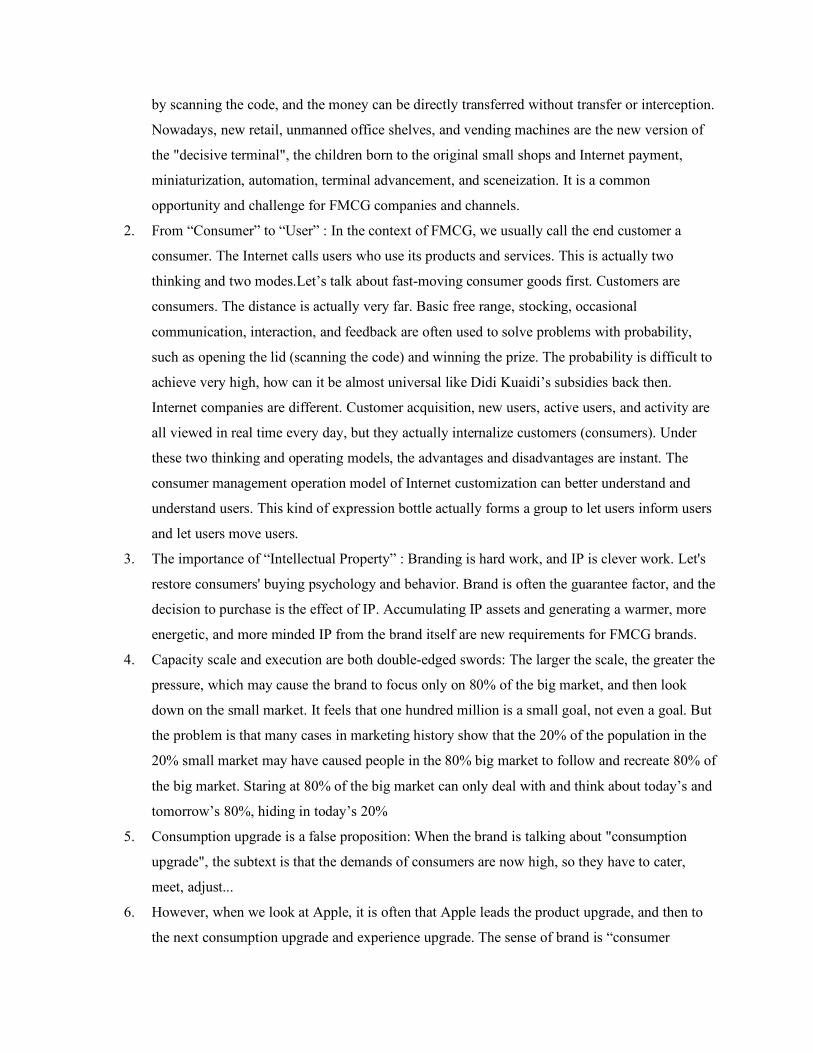
2.2 Overview Economic Development of the FMCG Industry in China With the development of China’s economy, especially the increase in the per capita disposable
income of Chinese urban residents, the consumption level of Chinese residents has jumped and
the consumption capacity has been continuously enhanced. China's potential consumer market is
huge, attracting overseas and domestic FMCG companies to expand into the Chinese market. As
of 2019, the per capita disposable income of urban residents in China reached RMB 42,359,
compared with RMB 39,250.84 in 2018.
The consumption power of Chinese residents continues to increase, which has promoted the
rapid growth of the total retail sales of consumer goods in China. In 2019, the total retail sales of
consumer goods in China reached 41.2 trillion yuan, a year-on-year increase of 8%. In addition,
China's online retail sales increased by 19.5% year-on-year in 2019, more than twice the growth
rate of offline retail sales.
Source: Public Information Collation
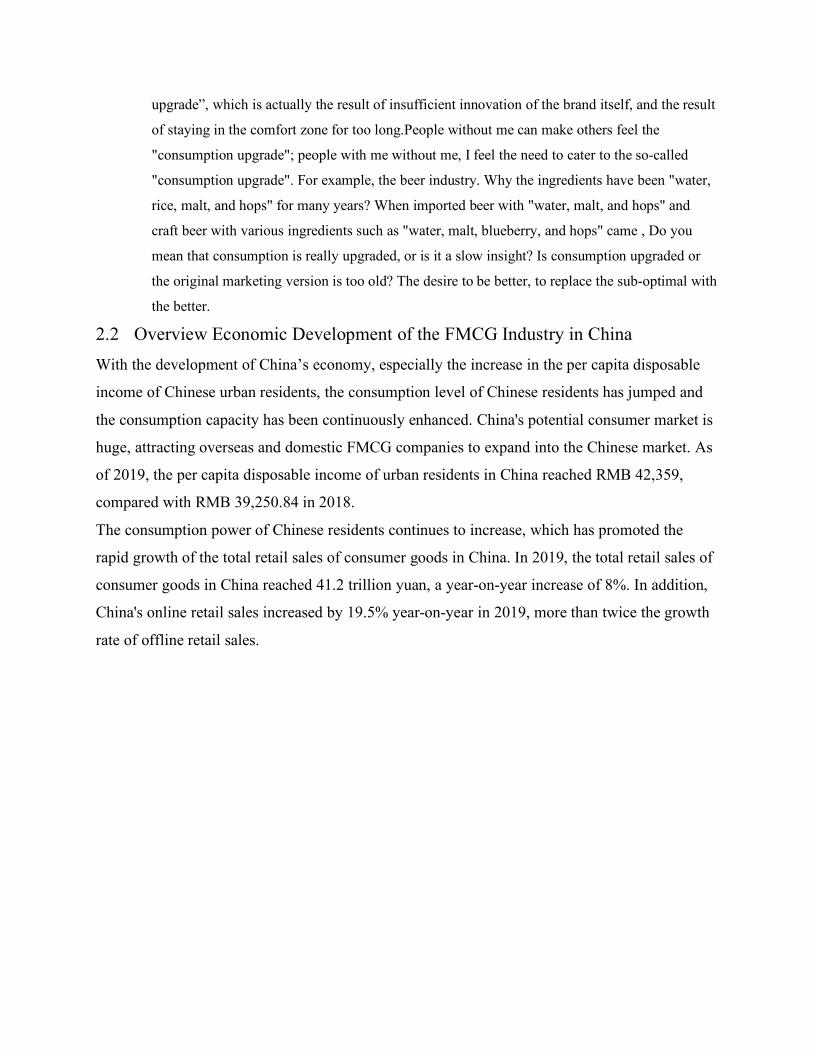
From data such as GDP, the pull of consumption to GDP, per capita GDP, per capita disposable
income, total retail sales of consumer goods, etc., it can be seen that although the growth of
China's overall economy and consumer market has slowed down in recent years, it is still on the
path of rapid growth. In China, new incremental markets continue to appear.
Source: Public Information Collation
0
10
20
30
40
50
60
70
80
90
100
2014 2015 2016 2017 2018 2019Q1-Q3
2014-2019Q1-Q3 China GDP Trend
GDP (Trillion RMB)
64.1 68.674
82.190
69.8
0.00%
10.00%
20.00%
30.00%
40.00%
50.00%
60.00%
70.00%
80.00%
0
0.2
0.4
0.6
0.8
1
1.2
2014 2015 2016 2017 2018 2019Q1-Q3
2014-2019Q1-Q3 ContributionTrend of China's Consumption to GDP Growth
Contribution Rate
60%67%
58%
76%
61%
49%
The momentum of consumption upgrades continues, and consumption has become the number
one engine of economic growth for five consecutive years. For early investment in the consumer
industry, there is still a lot of room for growth for start-ups to create value with a splash of ink.
When the overall economic environment is viewed as weak by many media, the market growth
rate of consumer goods remains at a high level, exceeding GDP The growth rate. And fast-
moving consumer goods represented by food and beverages, tobacco and alcohol, and cosmetics
have maintained a relatively higher growth rate.
The sales growth rate of automobiles, petroleum products, gold and silver jewelry,
communication equipment, building materials, furniture and home appliances dropped by about
4% during the same period. Under such a "drag", Social Retail still maintains the overall growth
level under the rapid growth of consumer goods, especially FMCG, which shows the growth
momentum of the FMCG market.
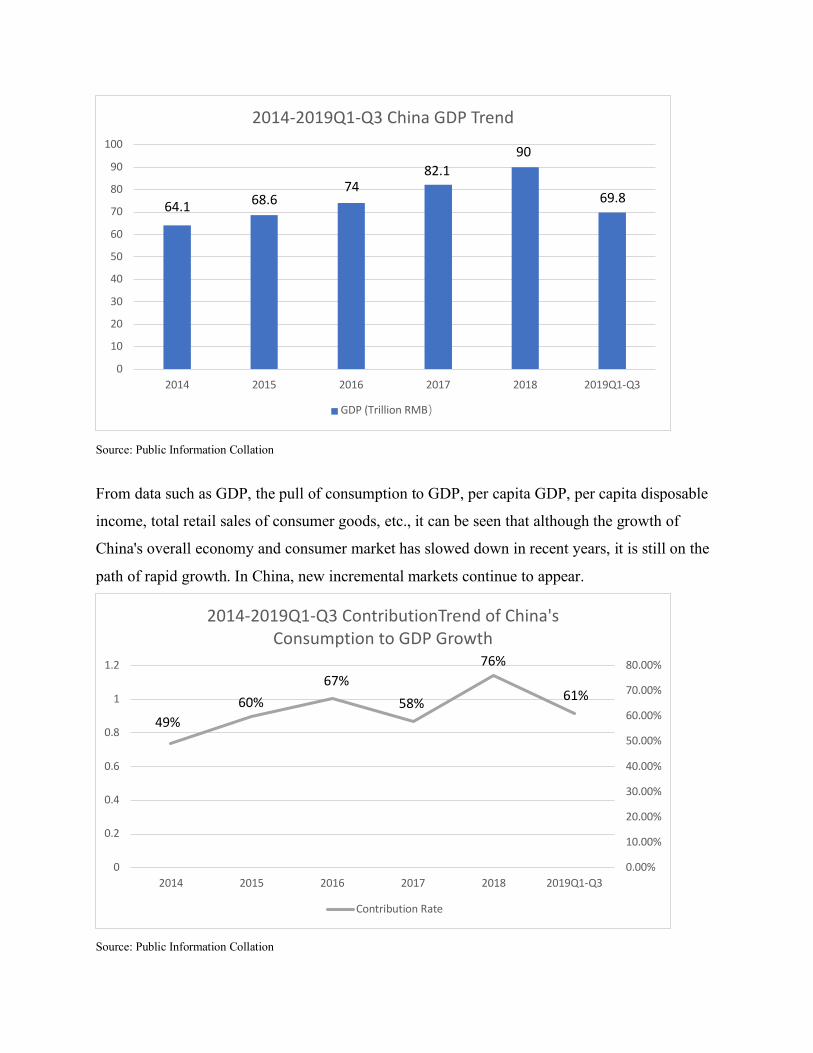
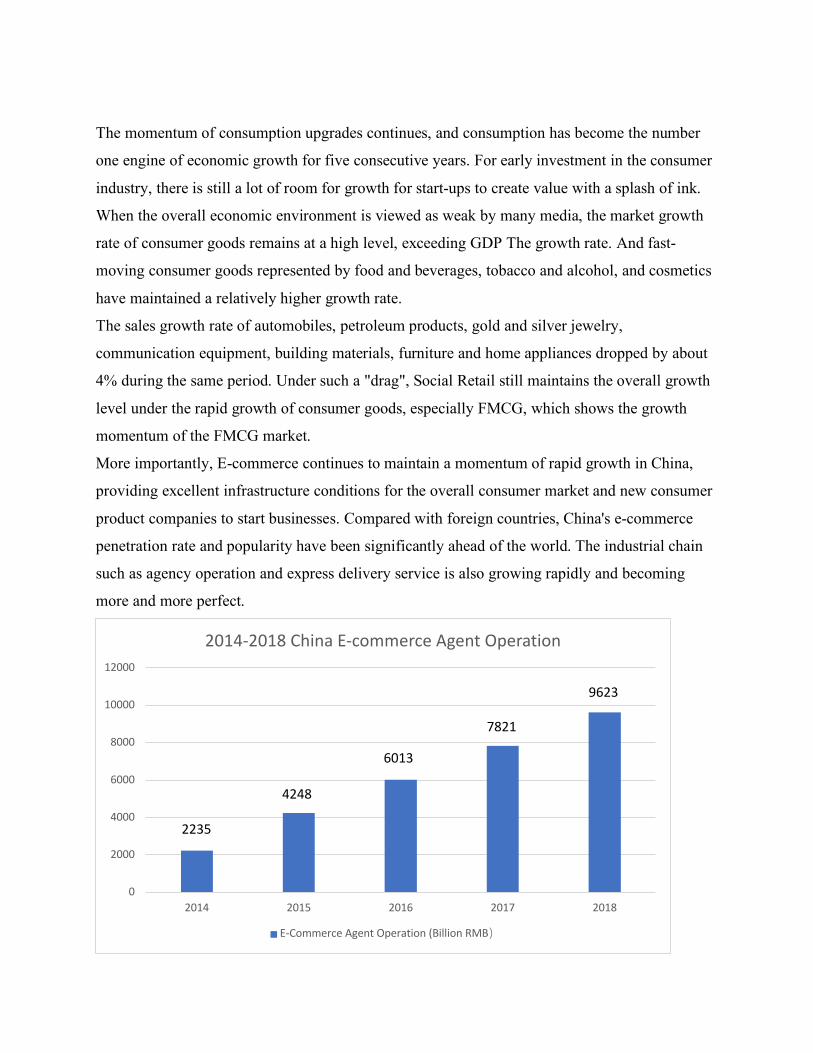
More importantly, E-commerce continues to maintain a momentum of rapid growth in China,
providing excellent infrastructure conditions for the overall consumer market and new consumer
product companies to start businesses. Compared with foreign countries, China's e-commerce
penetration rate and popularity have been significantly ahead of the world. The industrial chain
such as agency operation and express delivery service is also growing rapidly and becoming
more and more perfect.
0
2000
4000
6000
8000
10000
12000
2014 2015 2016 2017 2018
2014-2018 China E-commerce Agent Operation
E-Commerce Agent Operation (Billion RMB)
2235
4248
6013
7821
9623
Source: Public Information Collation
2.3 Current Status of FMCG Industry Study 2.3.1 Key Market Segments in China
In 2019, fast-moving consumer goods accounted for 34.6% of China's household consumption,
which was 13.2 trillion. The main categories are personal care, cosmetics, food, beverages, etc.
We can analyze the economic situation of China's fast-moving consumer goods from the
following 4 main categories:
Hair Care Category: In China, about 2000 manufacturers, 3000 brands. Mainly include Procter &
Gamble, Unilever, Henkel, L'Oreal and Lafan. Procter & Gamble accounted for 35%, Unilever
10%, and the top ten brands accounted for 55%. However, they have been declining in the past
five years. The market share of leading foreign companies has a tendency to be segmented by
emerging new brands and small brands. At the same time, the established domestic brands are
showing signs of aging.
Lafang's revenue in 2018 was 960 million, a decrease of 1.7%, and the revenue of the first three
quarters of 2019 was 700 million, a decrease of 1.8%. In the first three quarters of 2019, the
Tmall hair care market accounted for 55% of shampoo, 15% of hair care, hair styling, etc. For
the other 30%, the growth rates were 37%, 61%, and 59%.
In the past three years, the number of purchasers in the unit price range of Taobao hair care has
decreased year after year below 30 yuan, stayed at 30-60 yuan, and increased by 20% above 60
yuan. The overall trend has continued to evolve to mid-to-high end.
The concept of hair loss prevention has also received a lot of attention. In addition to the old
domestic brands Zhangguang, Bawang, and foreign brands such as Fulv Deya, Fengtian, etc., the
popular shampoo with the concept of hair loss has also accounted for 56% of the total
shampoos. % As much. The overall number of hair loss is 250 million, nearly half of them are
under 35 years old, 60% of them have hair loss before 25 years old, and 84% have hair loss
before 30 years old. The trend of feminization and youth is obvious. The proportion of people
born in the 90s who purchase anti-hair growth products is higher than that of ordinary hair care
products, reaching 40%.
Make-Up Category: The growth rate was 13% in the first five years, and the growth rate has
almost doubled in the past two years. Make-up has become the fast-moving consumer category
most closely related to the consumption upgrade and lifestyle pursuit of the younger generation,
and it is also an important carrier for the revival of domestic products. New young people are
forming makeup consumption habits, and the post-90s generation contributed 35% of the
makeup market growth.
Top ten online sales: Mei Ke, Maybelline, Perfect Diary, Dior, Saint Laurent, Armani,
Zhiyouquan, Catzlan, Estee Lauder, Givenchy. The top ten with the most content on the Little
Red Book: Magic, Lancome, Saint Laurent, 3CE, Armani, Perfect Diary, Chanel, Dior, NARS,
SK-II. The single-brand head Maybelline is 4.8 billion. The veteran domestic product
representative Mary Daijia was established in 2006, and about 1.2 billion in 2018, including 500
million for base makeup, 600 million for eye makeup and lip makeup, and 100 million for
makeup remover and makeup tools.
Make-up removers, false eyelashes, brushes, eyebrow pencils, eyeliners, nail polishes, etc. have
a high growth rate, but the overall market is small, and product attributes are limited. It is
currently difficult to separate brands. 50%.
Cleaning Lotion Category: The fabric cleaning market is highly concentrated, with the top ten
brands occupying more than 60% of the market. The laundry detergent accounts for 70% of the
fabric, and the laundry detergent and soap each account for 15%.
Naais 23 billion. Liby 21 billion, 52% of laundry powder, 26% of laundry detergent (26% of
Blue Moon), and 42% of detergent.
As consumption upgrades and the market matures, the proportion of detergents, insecticides,
polishes, bleaches and other categories has declined, while tableware cleaners, laundry
detergents, surface cleaners and toilet cleaning have increased significantly.
Comprehensive Snacks: The overall snack market exceeds trillions. The overall market
concentration is still very low, with a large number of brands and a certain degree of regionality.
The overall industry is asset-light, with fewer self-built factories, light production links, and
more energy and capital investment in sales and brand links. Listed companies have maintained a
relatively high growth rate. The more single the category, the slower the growth, and the faster
the growth of the rich category. The corporate market for single-category products has been
eroded by multiple categories. After consumers have certain brand trust and loyalty, expanding
new categories is convincing enough for consumers.
2.3.2 Covid-19’s impact on the FMCG Industry
The world is currently experiencing a pandemic due to the highly infectious virus known as the
coronavirus, or COVID-19. In an attempt to slow the spread of the virus, many countries have
imposed temporary closures to non-essential stores, bars, and venues, as well as putting a ban on
large public gatherings and encouraging people to work from home wherever possible. As such,
the market for fast-moving consumer goods faces considerable changes: demand for consumer
packaged goods (CPG) has climbed sharply in heavily-affected countries, while growth
in household goods spending surged as well. One way people try to reduce their chances of
catching the virus is by decreasing the frequency of going to the grocery store. Some consumers
are resorting to stockpiling water and food. Others are using e-commerce to purchase products
that they usually would find in a store.
North America is currently feeling COVID-19’s impact. In the United States, places that were
impacted by COVID-19 early on saw a surge in purchases of fast-moving consumer goods, such
as packaged and frozen foods. Consumers are also purchasing paper products and home care
items at an increased rate. Some people deliberately stock up on certain products, with over half
of respondents purchasing with the hopes of supplies lasting about two weeks. In Canada, people
are more frequently purchasing dry and canned goods, as well as home goods products such as
toilet paper and cleaning supplies. Over half of Canadian respondents living in Manitoba stated
that they had made food provisions as a result of the coronavirus outbreak. In both countries,
most markets for legal cannabis have seen a decrease in inventory, though Nevada is a notable
exception. Baby boomers’ legal cannabis consumption has decreased during the COVID-19
pandemic. At the same time, members of Generation X, Millennials, and Generation Z increased
purchases, perhaps to keep up the comfort levels at home while decreasing the frequency of
going out to the store.
The coronavirus was first noted in Latin America on February 26, when Brazil established a case
in São Paulo. Since then, governments across the region have taken an assortment of actions to
protect their citizens and contain COVID-19’s spread. Meanwhile, citizens are modifying their
behavior to stop the spread of the virus. Brazil saw an increase of consumption of hygiene
goods, especially face masks and antibacterial gels. Hand sanitizers had a sales growth of 623
percent from March 2019. Colombian consumers purchased around thirty percent
more household cleaning products than this time last year. In Argentina, most consumers
purchase more personal care and household cleaning products, as well as purchase more
substantial amounts in order to decrease trips to the store.
COVID-19 continues to spread across Europe, and governments are taking action with travel
advisories and school closures. Consumers, in turn, are changing their spending habits in various
parts of the continent. In Italy, household cleaners and personal care products were bought in
higher quantities. Compared to the previous year, sales of over-the-counter health care products
increased by 100 percent in Italy. Within the UK, more frozen and packaged foods are
purchased. Around twenty percent of UK consumers are stockpiling goods, though stockpiling is
viewed as unacceptable by the majority of the population surveyed. In Germany, goods
hoarded tend to be pantry items such as flour and rice, as well as disinfecting products. This is
similar to Russia, where consumers stockpiled cereals and canned food goods the most, as well
as masks.
The first impacts the virus had on the Chinese market were apparent already in February of 2020.
Several consumer product categories saw a serious online median price fluctuation, while other
products faced shortages on e-commerce platforms. Similarly, in Hong Kong, the most
recently out-of-stock items were all-purpose bleach, cleaning wipes, and paper towels, meaning
that consumers purchased these items beyond supply capacity. Emergency food sales online in
South Korea increased massively, especially in the case of canned foods, which grew by 268
percent compared to the previous week. Australia, which had over five thousand cases as of
April 7, 2020, also saw boosts in online purchases of certain products. Pasta, eggs, and canned
meals were the food items with the largest increases in sales.
2.3.3 Market Investment Strategies
For a long time, the FMCG industry has enjoyed great commercial success. The industry has not
only created 23 global Top 100 brands, but also maintained an overall return on investment of
15% for 40 years. This should be attributed to the wide application of the five-step value creation
method established after World War II.
(1) Gaining growth and high profits through building popular brands and product innovation;
(2) Establish close contacts with popular retail channels such as supermarkets to reach a wide
range of consumers;
(3) Enter the developing market earlier to establish new product categories and actively cultivate
consumer habits;
(4) Establish an operation mode aimed at implementing unified cost control;
(5) Use mergers to achieve market integration and new product entry, and use mature models to
achieve synergy to promote leapfrog development.
In recent years, the fast-moving consumer goods industry has gradually faded from its former
halo, and its organic growth rate is only 2.7% after deducting the effects of mergers and
acquisitions, exchange rates and inflation. McKinsey found that: 12 disruptive technology-driven
trends are or are about to break the market structure and cause traditional models to fail:
1. Different preferences of the younger generation
The younger generation (referring to those born in 1980 and later) prefers new brands, thinking
that new brands are better and more creative. Popular brands and popular channels no longer
attract them. Recent studies by McKinsey show that young consumers with purchasing power
four times higher than the older generation are reluctant to buy products produced by “large food
companies”. The younger generation prefers to conduct comprehensive research on products.
They resist marketing activities led by the brand, and like to understand the brand and product
situation by communicating with others (including family and friends, as well as online opinion
leaders and netizens). The younger generation is willing to spend money to buy goods that
demonstrate their own taste. They value the value of the goods, and under the premise of limited
income, they will be more cautious in spending money.
2. Digital Marketing
Digital technology is changing the way consumers understand and recognize brands, and the
effects of traditional marketing are not as good as before. Most FMCG companies have begun to
actively embrace digital technology, such as using WeChat public accounts to establish more
interactive and lasting connections with target consumers. But this work still has a long way to
go, especially in how to use massive data to promote precision marketing and sales.
3. The rapid rise of small brands
Many small consumer goods companies are using digital technology to quickly capture the
hearts of the younger generation of consumers. High profits, emotional connections with
consumers, easy outsourcing of the value chain, and low freight rates make it easier for small
brands to succeed in the FMCG industry. In addition, more than 4,000 small companies have
received US$17 billion in venture capital in the past decade. Such a huge amount of funds also
helped the new brand to rise rapidly. Traditional companies such as Procter & Gamble and
Sephora have also seen these changes and launched incubators to gain an advantage in the
competition.
4. Most categories have matured in most markets
Although innovation is still possible, chances are no longer comparable to those decades ago.
McKinsey's analysis of FMCG consumption patterns shows that once the median consumer
income reaches $30,000, the per capita sales of all categories will be flat. This means that it is no
longer possible to promote leapfrog growth by upgrading the grade or increasing the popularity.
5. The real rise of healthy food
Consumers now want more organic products that are free of sugar, gluten, pesticides and other
additives. They began to choose more fresh food. Overseas companies are trying to change to
meet the health needs of consumers, but Chinese companies obviously need more investment in
this area.
6. The Internet of Things Connected to Everything
Although the Internet of Things is still in its infancy, it is bound to have a revolutionary impact
on certain categories. For example, in the category of washing products, the Internet of Things
will transform consumers' demand for products into demand for services, completely changing
the operating mechanism of the industry. Considering that China has been leading the world in
the digitalization of the consumer market, domestic companies must pay attention to it early.
7. E-commerce giants seize the opportunity
E-commerce giants will have a profound impact on fast-moving consumer goods companies. As
a result of a large number of passenger flows, they can further reduce prices but this also caused
channel conflicts. European and American e-commerce giants have begun to try their own
brands to directly compete with FMCG companies. But from another perspective, domestic e-
commerce platforms such as Tmall provide Chinese FMCG companies with a different business
model. Fast-moving consumer goods companies usually sell through dealers, hypermarkets and
other middlemen, and have low control over the final consumers. The e-commerce platform
helps fast-moving consumer goods companies realize direct connections with consumers, and
provides opportunities for fast-moving consumer goods companies to change their voice in the
value chain.
8. Emerging retail channels such as convenience stores are in the ascendant
The younger generation of consumers are more inclined to make temporary rather than
concentrated consumption. They do not go to traditional retail channels such as hypermarkets to
shop like the older generation. Convenience stores have adapted to this change in behavior.
Especially in China, with the help of various APPs to combine online and offline, convenience
stores are even more powerful in reaching and serving consumers.
9. Large retailers are squeezed
The rise of e-commerce giants and new retail channels further squeeze the living space of
traditional retail channels such as hypermarkets. Over the past six years, the revenue of large
retailers has been stagnant. Under heavy pressure, they have also begun to take the initiative to
fight against it by adopting methods such as purchasing alliances. But for FMCG companies, this
will make large retailers a stronger trading partner.
10. The rise of local competitors
The developing market still has huge growth potential. By 2025, these markets could still
generate $11 trillion in sales. Local competitors are using more localized products, localized
talents and faster decision-making to compete with international fast-moving consumer goods
companies for this part of the business. International fast-moving consumer goods companies
must make changes, and the core is to change the highly centralized decision-making model now
commonly used.
11. Active investors continue to pressure
Investors will follow the pace of companies such as 3G and require FMCG companies to reduce
expenses and adopt an operating model that focuses on cost reduction. Many companies have
taken action to withstand the pressure of active investors in this regard.
12. Increased trading competition
Mergers and acquisitions will remain an important tool for market integration and an important
foundation for achieving revenue growth. However, in certain sectors (such as the over-the-
counter market), when high-quality assets are increasingly scarce and private equity companies
are becoming stronger in financing, competition between counterparties will become more
intense.
3 Market Economic Analysis of the FMCG Industry in China 3.1 Analysis on the Profitability of the FMCG Industry in China 3.1.1 Profitability Analysis of Packaged Food and Beverages
Kantar Worldpanel and Bain & Company jointly released the "2019 Chinese Shopper Report,
Series Two-Chinese Consumers' Shopping Enthusiasm Against the Background of Slowing
Economic Growth" shows that China's fast-moving consumer goods market is in the first three
months of 2019. Total sales for the quarter increased by 4.9%. Among them, the increase in
imported goods was particularly noticeable, accounting for 18% of the total sales of fast moving
consumer goods, always ahead of category growth.
Consumers’ demand for fast-moving consumer goods remains unchanged. In the third quarter of
2019, China’s GDP growth rate fell to 6.0%, the lowest level in 27 years. However, fast-moving
consumer goods are just in demand for Chinese consumers, and their shopping enthusiasm is
increasing. . As a whole, in the first three quarters of 2019, the total consumption of fast-moving
consumer goods achieved a growth of 4.9%, close to the growth rate of 5.2% in 2018, and the
quarterly growth rates were 2.7%, 6.9% and 5.7%.
In detail, the accelerated growth of sales cannot offset the negative impact of the slowdown in
average selling price growth. The growth rate of fast-moving consumer goods sales in the first
three quarters of 2019 was more than twice that of the same period in 2018, but the average sales
price growth rate was not It fell from 4.6% to 3.7%, slightly higher than inflation.

Source: Foresight Industry Research Institute
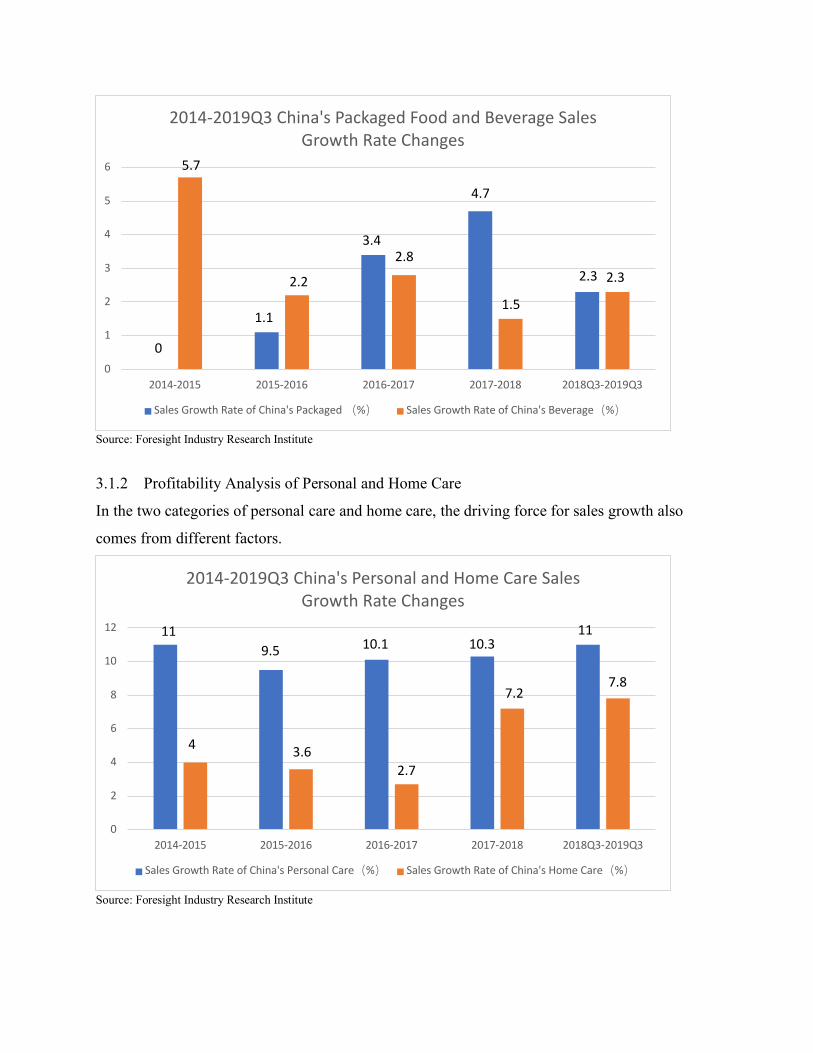
The sales of packaged food and beverages both increased by 2.3%, but the growth momentum of
the two major categories was not the same. For the packaged food category, the increase in sales
was dragged down by the increase in average selling price, resulting in an overall increase in
packaged food sales of only 2.3%, far below the level of 4.7% in 2018. In the beverage category,
on the contrary, the increase in prices has made up for the impact of the slight decline in sales
and promoted sales growth.
0
1
2
3
4
5
6
2014-2015 2015-2016 2016-2017 2017-2018 2018Q3-2019Q3
2014-2019Q3 China's Urban FMCG Consumption and Average Selling Price Growth Rate Changes
Growth rate of China's urban FMCG consumption(%)
Average sales price growth rate of fast-moving consumer goods in urban areas in China (%)
4.75.4
3.63.2
4.74.2
5.24.6
4.9
3.7
Source: Foresight Industry Research Institute
3.1.2 Profitability Analysis of Personal and Home Care
In the two categories of personal care and home care, the driving force for sales growth also
comes from different factors.
Source: Foresight Industry Research Institute
0
1
2
3
4
5
6
2014-2015 2015-2016 2016-2017 2017-2018 2018Q3-2019Q3
2014-2019Q3 China's Packaged Food and Beverage Sales Growth Rate Changes
Sales Growth Rate of China's Packaged (%) Sales Growth Rate of China's Beverage(%)
0
5.7
1.1
2.2
3.42.8
4.7
1.5
2.3 2.3
0
2
4
6
8
10
12
2014-2015 2015-2016 2016-2017 2017-2018 2018Q3-2019Q3
2014-2019Q3 China's Personal and Home Care Sales Growth Rate Changes
Sales Growth Rate of China's Personal Care(%) Sales Growth Rate of China's Home Care(%)
11
4
9.5
3.6
10.1
2.7
10.3
7.2
11
7.8
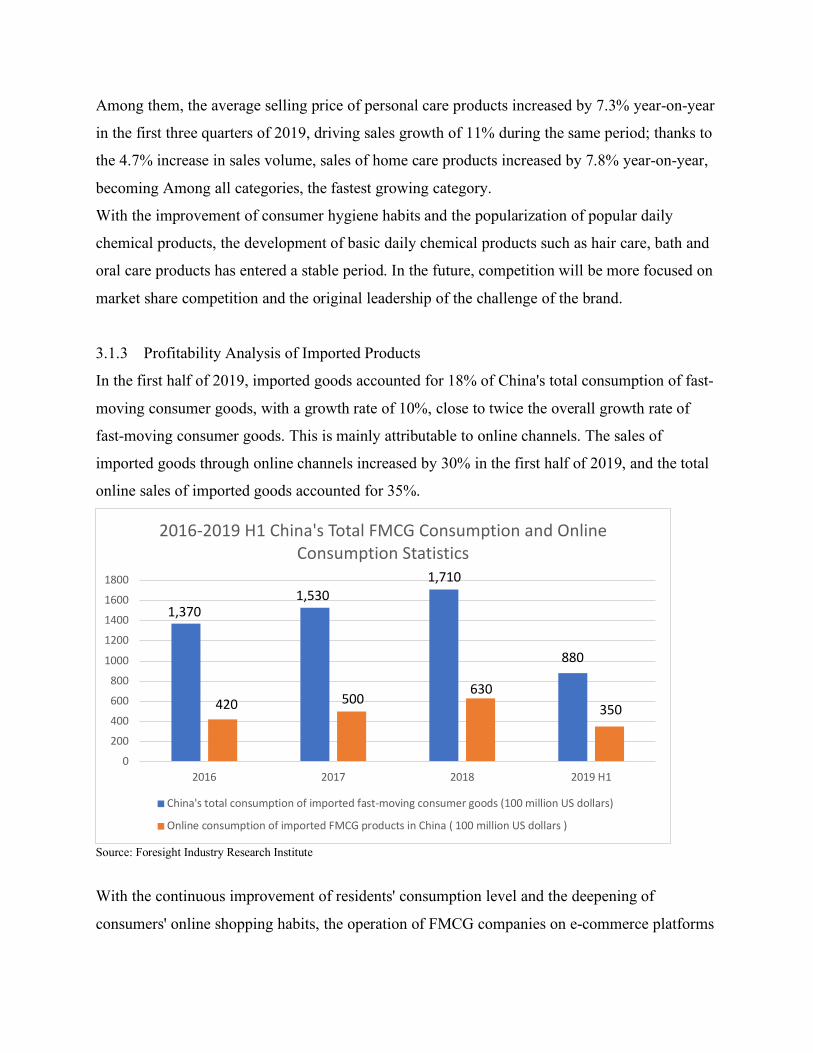
Among them, the average selling price of personal care products increased by 7.3% year-on-year
in the first three quarters of 2019, driving sales growth of 11% during the same period; thanks to
the 4.7% increase in sales volume, sales of home care products increased by 7.8% year-on-year,
becoming Among all categories, the fastest growing category.
With the improvement of consumer hygiene habits and the popularization of popular daily
chemical products, the development of basic daily chemical products such as hair care, bath and
oral care products has entered a stable period. In the future, competition will be more focused on
market share competition and the original leadership of the challenge of the brand.
3.1.3 Profitability Analysis of Imported Products
In the first half of 2019, imported goods accounted for 18% of China's total consumption of fast-
moving consumer goods, with a growth rate of 10%, close to twice the overall growth rate of
fast-moving consumer goods. This is mainly attributable to online channels. The sales of
imported goods through online channels increased by 30% in the first half of 2019, and the total
online sales of imported goods accounted for 35%.
Source: Foresight Industry Research Institute
With the continuous improvement of residents' consumption level and the deepening of
consumers' online shopping habits, the operation of FMCG companies on e-commerce platforms
0
200
400
600
800
1000
1200
1400
1600
1800
2016 2017 2018 2019 H1
2016-2019 H1 China's Total FMCG Consumption and Online Consumption Statistics
China's total consumption of imported fast-moving consumer goods (100 million US dollars)
Online consumption of imported FMCG products in China ( 100 million US dollars )
1,370
420
1,530
500
1,710
630
880
350
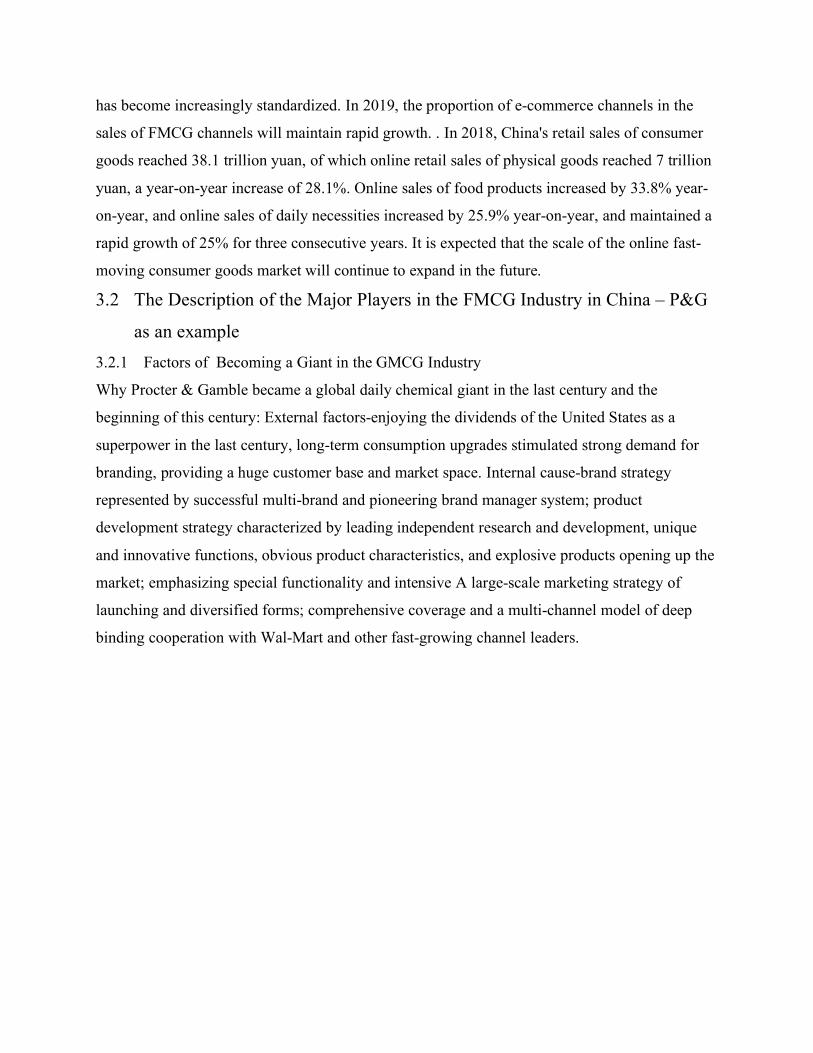
has become increasingly standardized. In 2019, the proportion of e-commerce channels in the
sales of FMCG channels will maintain rapid growth. . In 2018, China's retail sales of consumer
goods reached 38.1 trillion yuan, of which online retail sales of physical goods reached 7 trillion
yuan, a year-on-year increase of 28.1%. Online sales of food products increased by 33.8% year-
on-year, and online sales of daily necessities increased by 25.9% year-on-year, and maintained a
rapid growth of 25% for three consecutive years. It is expected that the scale of the online fast-
moving consumer goods market will continue to expand in the future.
3.2 The Description of the Major Players in the FMCG Industry in China – P&G
as an example 3.2.1 Factors of Becoming a Giant in the GMCG Industry
Why Procter & Gamble became a global daily chemical giant in the last century and the
beginning of this century: External factors-enjoying the dividends of the United States as a
superpower in the last century, long-term consumption upgrades stimulated strong demand for
branding, providing a huge customer base and market space. Internal cause-brand strategy
represented by successful multi-brand and pioneering brand manager system; product
development strategy characterized by leading independent research and development, unique
and innovative functions, obvious product characteristics, and explosive products opening up the
market; emphasizing special functionality and intensive A large-scale marketing strategy of
launching and diversified forms; comprehensive coverage and a multi-channel model of deep
binding cooperation with Wal-Mart and other fast-growing channel leaders.
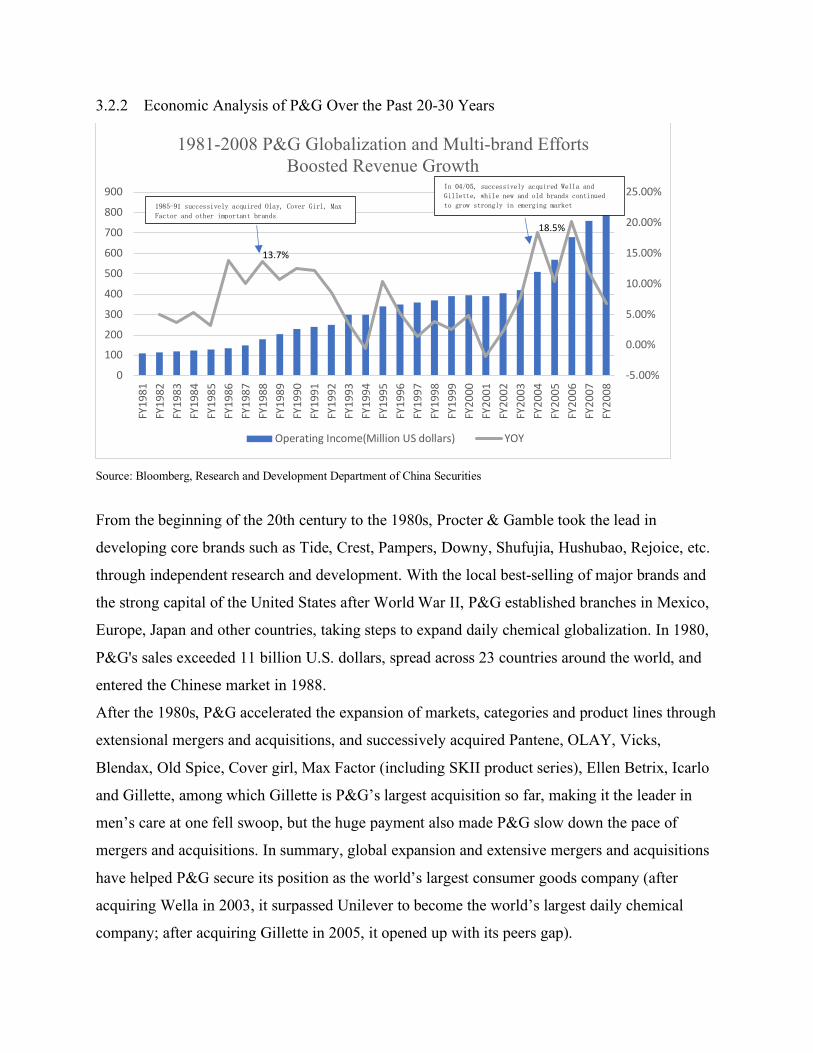
3.2.2 Economic Analysis of P&G Over the Past 20-30 Years
Source: Bloomberg, Research and Development Department of China Securities
From the beginning of the 20th century to the 1980s, Procter & Gamble took the lead in
developing core brands such as Tide, Crest, Pampers, Downy, Shufujia, Hushubao, Rejoice, etc.
through independent research and development. With the local best-selling of major brands and
the strong capital of the United States after World War II, P&G established branches in Mexico,
Europe, Japan and other countries, taking steps to expand daily chemical globalization. In 1980,
P&G's sales exceeded 11 billion U.S. dollars, spread across 23 countries around the world, and
entered the Chinese market in 1988.
After the 1980s, P&G accelerated the expansion of markets, categories and product lines through
extensional mergers and acquisitions, and successively acquired Pantene, OLAY, Vicks,
Blendax, Old Spice, Cover girl, Max Factor (including SKII product series), Ellen Betrix, Icarlo
and Gillette, among which Gillette is P&G’s largest acquisition so far, making it the leader in
men’s care at one fell swoop, but the huge payment also made P&G slow down the pace of
mergers and acquisitions. In summary, global expansion and extensive mergers and acquisitions
have helped P&G secure its position as the world’s largest consumer goods company (after
acquiring Wella in 2003, it surpassed Unilever to become the world’s largest daily chemical
company; after acquiring Gillette in 2005, it opened up with its peers gap).
-5.00%
0.00%
5.00%
10.00%
15.00%
20.00%
25.00%
0
100
200
300
400
500
600
700
800
900
FY19
81FY
1982
FY19
83FY
1984
FY19
85FY
1986
FY19
87FY
1988
FY19
89FY
1990
FY19
91FY
1992
FY19
93FY
1994
FY19
95FY
1996
FY19
97FY
1998
FY19
99FY
2000
FY20
01FY
2002
FY20
03FY
2004
FY20
05FY
2006
FY20
07FY
2008
1981-2008 P&G Globalization and Multi-brand Efforts Boosted Revenue Growth
Operating Income(Million US dollars) YOY
13.7%
18.5%
1985-91 successively acquired Olay, Cover Girl, Max
Factor and other important brands
In 04/05, successively acquired Wella and
Gillette, while new and old brands continued
to grow strongly in emerging market
Source: Bloomberg, Research and Development Department of China Securities
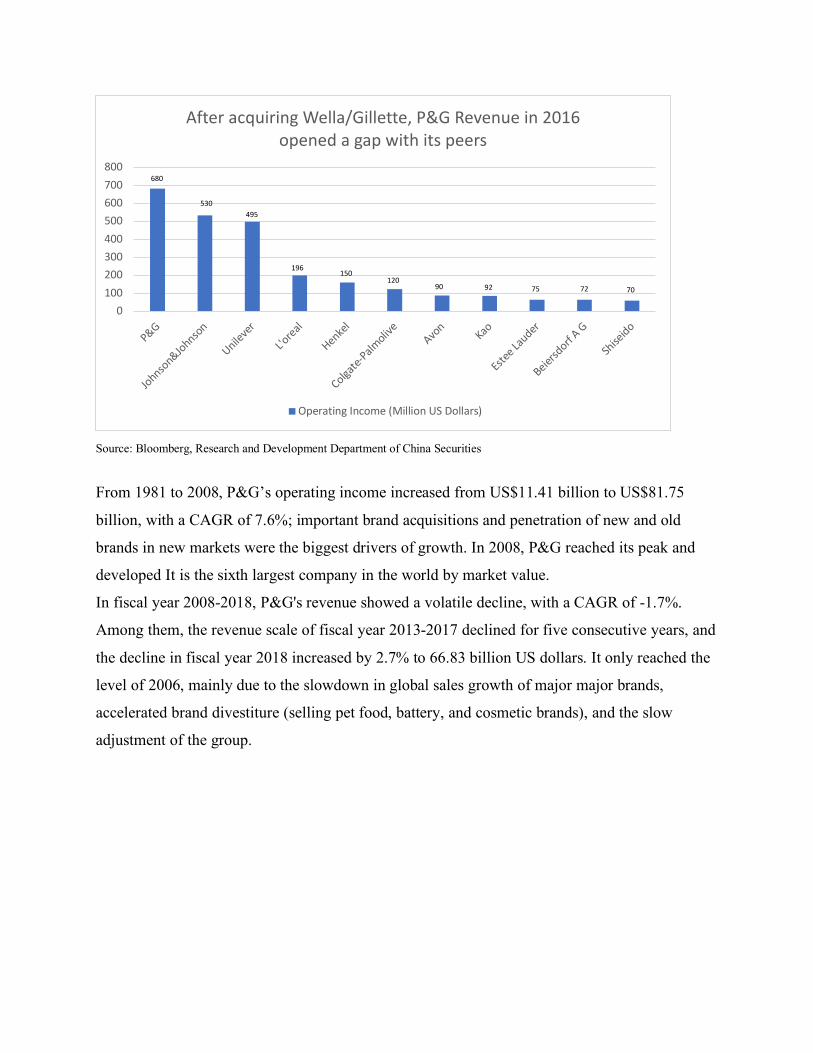
From 1981 to 2008, P&G’s operating income increased from US$11.41 billion to US$81.75
billion, with a CAGR of 7.6%; important brand acquisitions and penetration of new and old
brands in new markets were the biggest drivers of growth. In 2008, P&G reached its peak and
developed It is the sixth largest company in the world by market value.
In fiscal year 2008-2018, P&G's revenue showed a volatile decline, with a CAGR of -1.7%.
Among them, the revenue scale of fiscal year 2013-2017 declined for five consecutive years, and
the decline in fiscal year 2018 increased by 2.7% to 66.83 billion US dollars. It only reached the
level of 2006, mainly due to the slowdown in global sales growth of major major brands,
accelerated brand divestiture (selling pet food, battery, and cosmetic brands), and the slow
adjustment of the group.
0100200300400500600700800
P&G
Johnson&Johnso
n
Unileve
r
L'oreal
Henkel
Colgate-
Palmoliv
eAvo
nKao
Estee
Lauder
Beiersd
orf A G
Shise
ido
After acquiring Wella/Gillette, P&G Revenue in 2016 opened a gap with its peers
Operating Income (Million US Dollars)
680
530495
196150
12090 92 75 72 70
Source: Bloomberg, Research and Development Department of China Securities
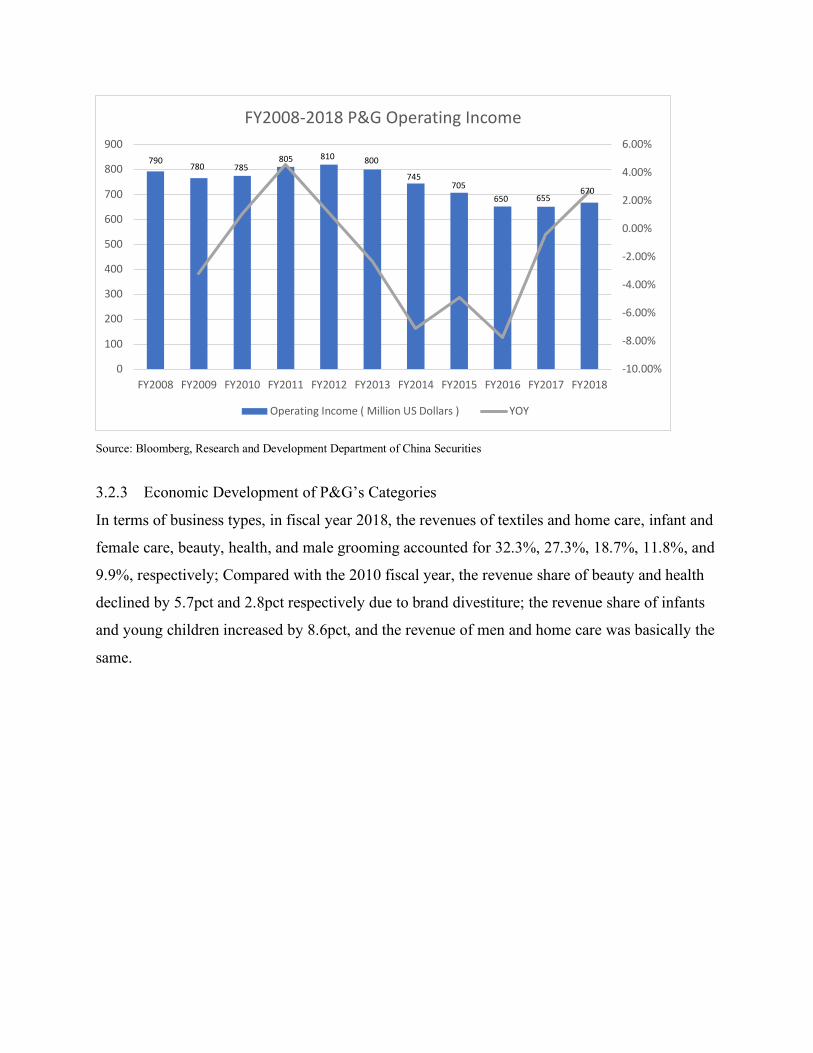
3.2.3 Economic Development of P&G’s Categories
In terms of business types, in fiscal year 2018, the revenues of textiles and home care, infant and
female care, beauty, health, and male grooming accounted for 32.3%, 27.3%, 18.7%, 11.8%, and
9.9%, respectively; Compared with the 2010 fiscal year, the revenue share of beauty and health
declined by 5.7pct and 2.8pct respectively due to brand divestiture; the revenue share of infants
and young children increased by 8.6pct, and the revenue of men and home care was basically the
same.
-10.00%
-8.00%
-6.00%
-4.00%
-2.00%
0.00%
2.00%
4.00%
6.00%
0
100
200
300
400
500
600
700
800
900
FY2008 FY2009 FY2010 FY2011 FY2012 FY2013 FY2014 FY2015 FY2016 FY2017 FY2018
FY2008-2018 P&G Operating Income
Operating Income ( Million US Dollars ) YOY
790780 785
805 810 800
745705
650 655670
Source: Bloomberg, Research and Development Department of China Securities
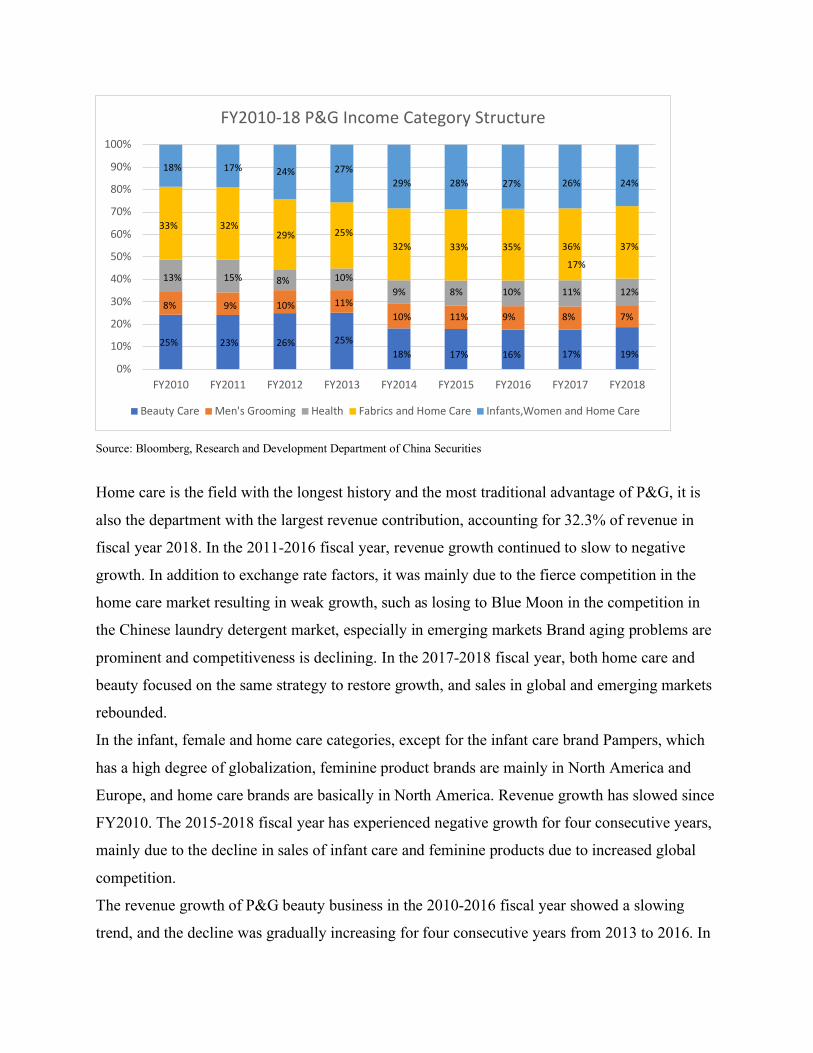
Home care is the field with the longest history and the most traditional advantage of P&G, it is
also the department with the largest revenue contribution, accounting for 32.3% of revenue in
fiscal year 2018. In the 2011-2016 fiscal year, revenue growth continued to slow to negative
growth. In addition to exchange rate factors, it was mainly due to the fierce competition in the
home care market resulting in weak growth, such as losing to Blue Moon in the competition in
the Chinese laundry detergent market, especially in emerging markets Brand aging problems are
prominent and competitiveness is declining. In the 2017-2018 fiscal year, both home care and
beauty focused on the same strategy to restore growth, and sales in global and emerging markets
rebounded.
In the infant, female and home care categories, except for the infant care brand Pampers, which
has a high degree of globalization, feminine product brands are mainly in North America and
Europe, and home care brands are basically in North America. Revenue growth has slowed since
FY2010. The 2015-2018 fiscal year has experienced negative growth for four consecutive years,
mainly due to the decline in sales of infant care and feminine products due to increased global
competition.
The revenue growth of P&G beauty business in the 2010-2016 fiscal year showed a slowing
trend, and the decline was gradually increasing for four consecutive years from 2013 to 2016. In
0%
10%
20%
30%
40%
50%
60%
70%
80%
90%
100%
FY2010 FY2011 FY2012 FY2013 FY2014 FY2015 FY2016 FY2017 FY2018
FY2010-18 P&G Income Category Structure
Beauty Care Men's Grooming Health Fabrics and Home Care Infants,Women and Home Care
25%
33%
13%
18%
8%
26%
29%
8%
24%
10%
23%
32%
15%
17%
9%
25%
25%
10%
27%
11%
18%
32%
9%
29%
10%
17%
33%
8%
28%
11%
16%
35%
10%
27%
9%
17%
36%
11%
26%
8%
19%
37%
12%
24%
7%
17%
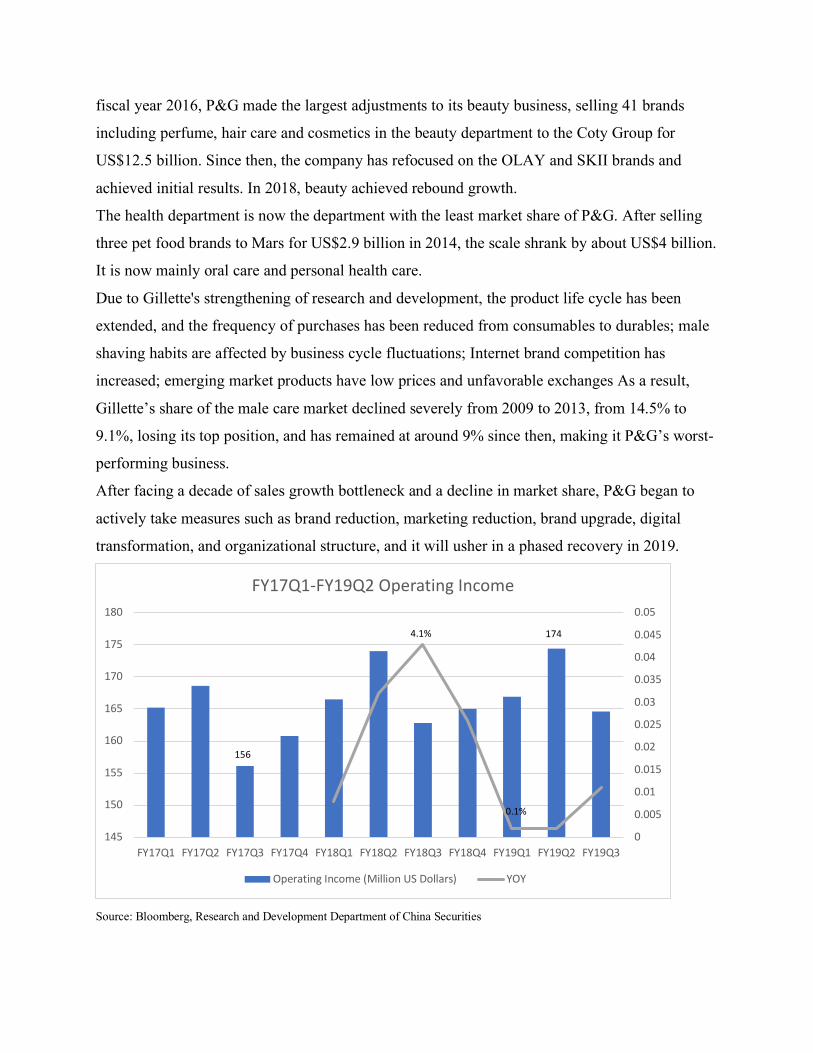
fiscal year 2016, P&G made the largest adjustments to its beauty business, selling 41 brands
including perfume, hair care and cosmetics in the beauty department to the Coty Group for
US$12.5 billion. Since then, the company has refocused on the OLAY and SKII brands and
achieved initial results. In 2018, beauty achieved rebound growth.
The health department is now the department with the least market share of P&G. After selling
three pet food brands to Mars for US$2.9 billion in 2014, the scale shrank by about US$4 billion.
It is now mainly oral care and personal health care.
Due to Gillette's strengthening of research and development, the product life cycle has been
extended, and the frequency of purchases has been reduced from consumables to durables; male
shaving habits are affected by business cycle fluctuations; Internet brand competition has
increased; emerging market products have low prices and unfavorable exchanges As a result,
Gillette’s share of the male care market declined severely from 2009 to 2013, from 14.5% to
9.1%, losing its top position, and has remained at around 9% since then, making it P&G’s worst-
performing business.
After facing a decade of sales growth bottleneck and a decline in market share, P&G began to
actively take measures such as brand reduction, marketing reduction, brand upgrade, digital
transformation, and organizational structure, and it will usher in a phased recovery in 2019.
Source: Bloomberg, Research and Development Department of China Securities
0
0.005
0.01
0.015
0.02
0.025
0.03
0.035
0.04
0.045
0.05
145
150
155
160
165
170
175
180
FY17Q1 FY17Q2 FY17Q3 FY17Q4 FY18Q1 FY18Q2 FY18Q3 FY18Q4 FY19Q1 FY19Q2 FY19Q3
FY17Q1-FY19Q2 Operating Income
Operating Income (Million US Dollars) YOY
0.1%
4.1% 174
156
P&G in China can be regarded as the epitome of P&G in the world. Procter & Gamble entered
China in 1988, sharing the growth dividend of the domestic daily chemical industry, brand
positioning based on the pace of consumption upgrades, advanced marketing and promotion
methods, and strong localization skills. It ushered in its peak before 2008 and began to decline in
2009/10. The share of domestic cosmetics dropped from 15.4% in 2009 to 10.2% in 2017, which
is consistent with the lack of growth in the global decade. The main reason is that brand aging
has increased during the period, and domestic consumption diversification needs have not been
captured; traditional physical retail has been affected, and e-commerce has complicated
competition; marketing interaction and innovation are insufficient, and function-oriented
advertising lacks topicality.
In response to the sluggish situation, P&G has actively adopted measures such as brand
reduction, marketing reduction, brand upgrade, digital transformation, organizational structure,
etc. in recent years, and achieved results in 2019, ushering in a phased recovery: physical
channels have actively promoted digital retail reform and improved Shopping experience; clearly
implement the plan to sell non-core brands; product renewal to regain the mainstream customer
base; marketing upgrade, flexible use of new media communication, reduce advertising costs and
the number of marketing agents; reduce costs and increase efficiency, reshape the organizational
structure, etc.
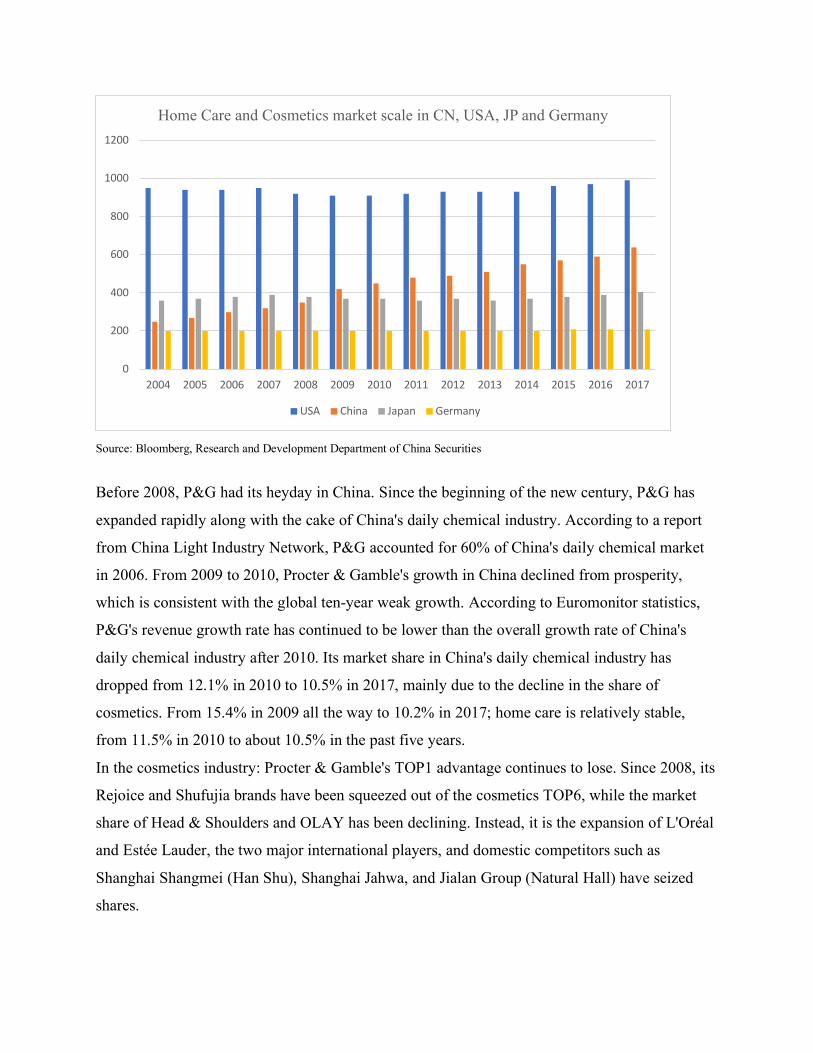
In 2017, China was the second largest daily chemical market in the world. The scale of home
care and cosmetics was US$63.91 billion, second only to the United States, and the growth rate
was leading.
Source: Bloomberg, Research and Development Department of China Securities
Before 2008, P&G had its heyday in China. Since the beginning of the new century, P&G has
expanded rapidly along with the cake of China's daily chemical industry. According to a report
from China Light Industry Network, P&G accounted for 60% of China's daily chemical market
in 2006. From 2009 to 2010, Procter & Gamble's growth in China declined from prosperity,
which is consistent with the global ten-year weak growth. According to Euromonitor statistics,
P&G's revenue growth rate has continued to be lower than the overall growth rate of China's
daily chemical industry after 2010. Its market share in China's daily chemical industry has
dropped from 12.1% in 2010 to 10.5% in 2017, mainly due to the decline in the share of
cosmetics. From 15.4% in 2009 all the way to 10.2% in 2017; home care is relatively stable,
from 11.5% in 2010 to about 10.5% in the past five years.
In the cosmetics industry: Procter & Gamble's TOP1 advantage continues to lose. Since 2008, its
Rejoice and Shufujia brands have been squeezed out of the cosmetics TOP6, while the market
share of Head & Shoulders and OLAY has been declining. Instead, it is the expansion of L'Oréal
and Estée Lauder, the two major international players, and domestic competitors such as
Shanghai Shangmei (Han Shu), Shanghai Jahwa, and Jialan Group (Natural Hall) have seized
shares.
0
200
400
600
800
1000
1200
2004 2005 2006 2007 2008 2009 2010 2011 2012 2013 2014 2015 2016 2017
Home Care and Cosmetics market scale in CN, USA, JP and Germany
USA China Japan Germany
In the field of home care: Guangzhou Liby, Naaisi Group, and Unilever ranked the top three
since 2009, followed by Procter & Gamble. Procter & Gamble's market share has basically
stabilized at about 10.5% since 2012, which is in line with P&G’s flagship The total market
share of the brand Tide/Bilang has changed in the same trend, and remained stable despite the
fierce domestic brands fighting (declining branding, the rise of Blue Moon and Super Energy).
3.3 Opportunities and Challenges of the FMCG Industry in the New Era in China 3.3.1 Influence of Covid-19 Outbreak of FMCG Industry Development in China
As one of the troikas driving economic growth, consumption has become the "ballast stone" of
China's economic growth.
In the face of the crisis, China's economy and consumer market are extremely resilient. Take the
2008 financial crisis as an example. After a period of downturn, China's economy and FMCG
industry rebounded quickly.
According to data released by the National Bureau of Statistics, in April, the total retail sales of
consumer goods fell by 7.5% in nominal terms year-on-year, and the rate of decline narrowed by
8.3 percentage points from March, indicating that consumption is gradually picking up.
During the epidemic, the core new consumer trends such as online shopping, online education,
remote office, health and technology are still continuing, and the online consumption scene is
still hot. According to Nielsen’s research, from January to February, March and April this year,
the online channels of FMCG increased by 33%, 32% and 43% compared with the same period
last year. The year-on-year growth rate so far this year is 37%, maintaining Strong growth
momentum.
The FMCG omni-channel growth rate was 3% year-on-year in January-February this year, fell in
March, or 6%, and returned to growth in April, an increase of 8%; the year-on-year growth rate
so far this year is 4%.
From the perspective of consumer products, basic consumer demand for food and personal care
has resumed growth. In the first quarter, milk powder, bulk chocolate and liquid milk fell by 5%,
9% and 1% from the same period last year. However, the growth trend has resumed in April,
with growth rates reaching 23%, 18% and 15%. In the first quarter, shampoo, toothpaste, and
toilet paper fell by 5%, 2%, and 5%, compared with the increase in April, which was 7%, 8%,
and 1%.
Nielsen’s latest CEO survey also showed that business leaders’ confidence increased in May.
When asked how to predict the impact of the epidemic on companies, 75% of respondents
believed that the situation in the second quarter was optimistic or had no impact; this proportion
was far higher 40% in March. 55% believe that the epidemic will have no impact or even a
positive impact on the company's full-year performance in 2020; this proportion was 50% in
March.
A large number of new products emerge in China's FMCG market every year, accounting for
46% of the growth of FMCG. The market growth brought about by successful product
innovation cannot be underestimated.
Affected by the new crown pneumonia epidemic, the pace of product innovation of brand owners
slowed down in the first quarter of this year, but began a strong recovery from March to April,
and the number of new products launched on the market increased by 6% over the same period
last year.
Local brands in China's FMCG market have achieved rapid growth in recent years, which means
that localization is becoming a new trend in product innovation. Nielsen data shows that from
March to April this year, 17,251 new products were launched, and 7 of the 10 new products
came from small regional brands, the latter has become an important force driving product
innovation.
In the food and beverage category, the momentum of major local brands has overshadowed
multinational brands, and 5 of the top 10 local companies have achieved share growth, compared
with only 3 of the top 10 multinational companies. increase.
In lower-tier cities and rural areas, the growth of regional brands is strong, especially in non-food
categories. They grab market share from mid-sized brands whose channels, supply chains, and
innovation capabilities are affected.
The growth of small brands is mainly contributed by rural areas. In dairy products, beverages,
snacks, and personal care products, small brands have the fastest growth, outperforming
medium-sized brands, large local brands and large multinational brands.
3.3.2 Consumption Upgrades - Chinese Consumers' Demand for High-end Products Rises
In the Chinese market, any industry will be considered to have a lot of space, because China has
a population of 1.354 billion, 657 cities, and a wide range of county/rural markets. However,
today in any industry in China, there are a large number of competitors, especially in the field of
fast-moving consumer goods, many categories of products and brands have been surplus, facing
the dazzling commodity world, consumers have begun to become picky and evolve For different
sub-groups. Perhaps in people’s existing impressions, it is different from luxury categories,
especially fast-moving consumer goods. If there are cheap ones, they don’t buy expensive ones.
However, in recent years, with the improvement of people's income level and the growth of
spending power, Chinese consumers' demand for high-quality high-end products has increased
significantly. In 2015, the per capita disposable income of urban residents was 31,195 yuan, an
increase of 8.2% over the previous year. After deducting price factors, the actual increase was
6.6%; the annual per capita net income of rural residents was 10,772 yuan.
This change can be seen from the sales growth of personal care products. In 2015, the sales
growth rate of personal care products in China far exceeded the sales volume, 7% and 1%
respectively. Especially in the skin care product market, high-end products such as moisturizer
and sunscreen are becoming the main driving force for sales. Although the sales volume
increased by less than 3% compared with the same period last year, the total sales growth rate
was considerable, as high as 13%. It is predicted that in 2016, as consumers continue to demand
high-end and high-quality products, the sales growth rate of these categories will once again
exceed sales.
In the growth of most fast-moving consumer goods, the introduction of high-end products has
become the dominant factor. Consumption upgrades have driven half the growth rate of fast-
moving consumer goods. With the further increase of brand concentration, the space for
enterprises to survive is getting smaller and smaller. Nowadays, consumers are becoming more
and more rational, brand awareness is gradually increasing, and the pursuit of product quality is
constantly improving. This requires companies to launch high-end products to satisfy consumers'
pursuit of product quality. This is a blue ocean strategy and a manifestation of diversified
development, and the richness and diversity of products push consumers to pursue the quality of
life more.
3.3.3 The Internet changes the mode of communication - the survival of the FMCG industry
must embrace the Internet
Over the past half century, the fast-moving consumer goods business has had such a simple
cycle: placing hundreds of millions of advertisements on a mainstream mass media to kidnap
consumers’ attention. Since almost everyone is the target customer of the product, it spreads
evenly to every The personal advertising costs are actually very small compared to the huge
returns generated by buying products. Advertisers thus make more money, put in more ads, and
the snowball gets bigger and bigger.
However, this kind of mass media that kidnap consumers’ attention is no longer popular with
young consumers. The Internet has made the acquisition, production, editing, and dissemination
of news from a vocational skill popularized as a necessary ability for everyone to express freely.
The scope of processing information expands the boundaries of its application.
For the fast-moving consumer goods industry, it is necessary to realize the transformation of the
enterprise mobile Internet model and accurately connect the heavy consumer groups. It is
necessary to achieve a consumer-centric Internet marketing model. Because the vast majority of
heavy consumers of fast-moving consumer goods are concentrated on the Internet. The netizen
population is highly matched with the FMCG consumer population. The popularity of the mobile
Internet and the emergence of various social network media have caused the number of Chinese
netizens to skyrocket. In the fast-moving consumer goods industry, its audience is mainly
concentrated in the 15-45 age group, which coincides with the "deep users" of the Internet.
Therefore, since 2016, the fast-moving consumer goods industry has focused on innovative
Internet marketing models, deepening the connection between the Internet and consumers,
resulting in the growth of the online shopping economy and the emergence of a large number of
KOLs.
On the other hand, all walks of life in the fast-moving consumer goods supply chain use a
dedicated network or the Internet to exchange and transmit data and carry out business models
for trading activities. Department stores, supermarkets, hypermarkets, shopping malls,
convenience stores and other retail terminals have their own supply chain systems, and generally
do not need fast-moving consumer goods B2B e-commerce to provide online supply services.
Rely on big data analysis to improve the efficiency of the entire link. Technically, FMCG B2B is
based on big data analysis; functionally, FMCG B2B solves many problems that plague
traditional channels, and its upgrading and transformation effects on traditional channels are
mainly reflected in three aspects: First, it shortens the supply chain level , To reduce the cost of
price increases; the second is to improve the efficiency of FMCG warehousing, reduce resource
waste, and reduce operating costs; third, to realize the data visualization of the entire supply
chain information, which can effectively assist upstream brands in product analysis, development
and Marketing.
4 Driving Factors of the FMCG Industry Development in China 4.1 Crowd Iteration Post-90s and post-00s accounted for 37%. The new population is close to 40%, which is
significantly different from the previous population in terms of consumption characteristics.
After 90s and 00s, the mobile Internet era began. Everyone pursues individuality and focuses on
content, and there are many ways to obtain information, and the era of information explosion.
Directly lead to changes in terminal consumer demand.
4.2 Economic Environment In China's domestic market, the per capita GDP exceeded US$8,000 two or three years ago, and
consumer brands are about to usher in explosive growth. The market demand starts, and local
entrepreneurs have the deepest understanding of the capital's culture and users, giving many local
brands and channels opportunities.
The continuous deepening of the integration of the digital economy and the real economy has
also brought new opportunities to the consumer market: judging from the active data of social
media in 2020, WeChat tops the list with 768 million DAU, Taobao, Douyin, Kuaishou, Weibo
Ranked in the second echelon, MAU trends are also converging. Looking at the online
advertising market from data such as iResearch’s "2019 China Online Advertising Market
Annual Monitoring Report" and other data, since 2018, the revenue of online advertising, mobile
advertising, and short video advertising has grown rapidly. According to forecasts, mobile
advertising and Social native advertising has the fastest growth rate, both exceeding 75%.
4.3 Super APP Software Such as WeChat, Douyin, Weibo, station b, Taobao, Xiaohongshu and other super apps with a
large user base. There are individual users, forming a business ecology, and nurturing some
outstanding consumer companies. The traffic dividend of the APP itself and the technical logic
behind it will bring qualitative changes to the marketing communication of consumer goods
companies.
4.4 Technical Foundation Technological progress has changed the consumer value chain and reconstructed production,
distribution, and retail models. AI, 5G, cloud computing, etc. have reduced costs and increased
efficiency for enterprises. Now consumer goods companies have evolved into a consumer-centric
value circle, and everything revolves around consumers.
4.5 Political Factors From a macroeconomic perspective, in August 2019, the General Office of the State Council
issued the "Opinions on Accelerating the Development of Circulation and Promoting
Commercial Consumption", and proposed 20 major policy measures to innovate and develop
circulation, promote consumption upgrading, and promote consumption expansion. Policy
adjustments promote consumption and boost consumer confidence.
5 Economic Analysis and Comparison of the FMCG Industry between
China and The World by Types 5.1 Global FMCG Market Share By Type 5.1.1 Beauty and Skin Care
In the context of the “face value economy” and “face-seeing era”, people’s consumer demand for
cosmetics is increasing. The emerging markets in the Asia-Pacific region, led by China, have
rapidly increased their consumption of cosmetics. The global cosmetics market continues to
expand, with a breakthrough of five in 2019. Hundreds of billions of dollars. Among them, skin
care products are the largest category of fine molecules required for cosmetics, accounting for
40%. On the other hand, with the development of global networks, e-commerce channels have
become increasingly important. In 2019, e-commerce sales increased by 27% year-on-year,
accounting for 14% of the global cosmetics market.
From 2010 to 2015, the global economic slowdown led to a significant decline in the growth rate
of the cosmetics market. In 2015, there was even a negative growth due to sluggish demand in
the Eurozone and a severe decline in the South American economy. After 2016, the global
cosmetics market ushered in a bottoming out, reversing the previous decline in development.
According to Euromonitor statistics, the global cosmetics market has reached 488 billion US
dollars in 2018.
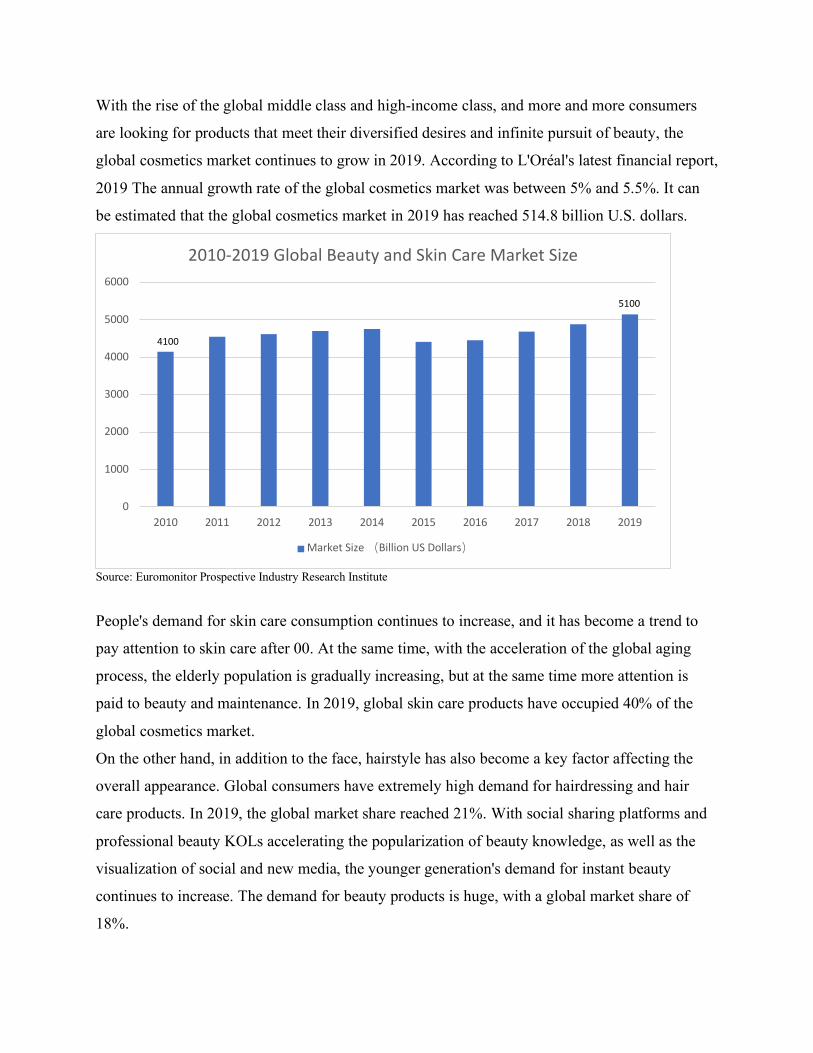
With the rise of the global middle class and high-income class, and more and more consumers
are looking for products that meet their diversified desires and infinite pursuit of beauty, the
global cosmetics market continues to grow in 2019. According to L'Oréal's latest financial report,
2019 The annual growth rate of the global cosmetics market was between 5% and 5.5%. It can
be estimated that the global cosmetics market in 2019 has reached 514.8 billion U.S. dollars.
Source: Euromonitor Prospective Industry Research Institute
People's demand for skin care consumption continues to increase, and it has become a trend to
pay attention to skin care after 00. At the same time, with the acceleration of the global aging
process, the elderly population is gradually increasing, but at the same time more attention is
paid to beauty and maintenance. In 2019, global skin care products have occupied 40% of the
global cosmetics market.
On the other hand, in addition to the face, hairstyle has also become a key factor affecting the
overall appearance. Global consumers have extremely high demand for hairdressing and hair
care products. In 2019, the global market share reached 21%. With social sharing platforms and
professional beauty KOLs accelerating the popularization of beauty knowledge, as well as the
visualization of social and new media, the younger generation's demand for instant beauty
continues to increase. The demand for beauty products is huge, with a global market share of
18%.
0
1000
2000
3000
4000
5000
6000
2010 2011 2012 2013 2014 2015 2016 2017 2018 2019
2010-2019 Global Beauty and Skin Care Market Size
Market Size (Billion US Dollars)
4100
5100
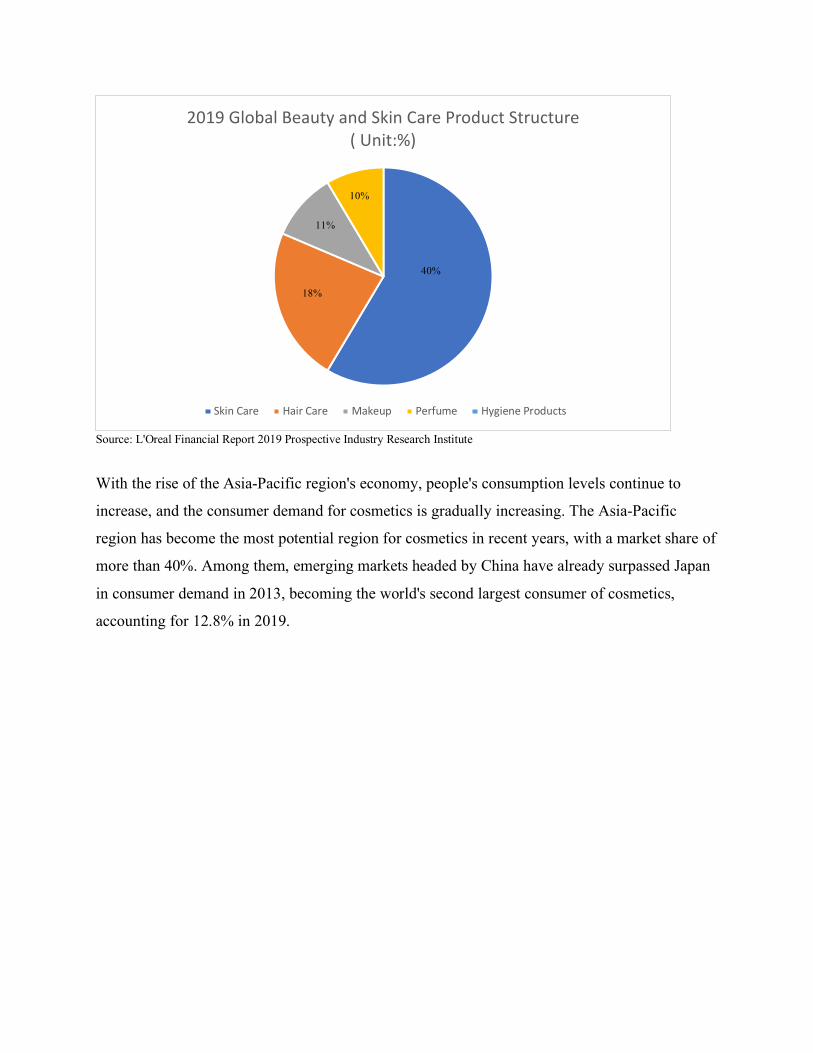
Source: L'Oreal Financial Report 2019 Prospective Industry Research Institute
With the rise of the Asia-Pacific region's economy, people's consumption levels continue to
increase, and the consumer demand for cosmetics is gradually increasing. The Asia-Pacific
region has become the most potential region for cosmetics in recent years, with a market share of
more than 40%. Among them, emerging markets headed by China have already surpassed Japan
in consumer demand in 2013, becoming the world's second largest consumer of cosmetics,
accounting for 12.8% in 2019.
2019 Global Beauty and Skin Care Product Structure ( Unit:%)
Skin Care Hair Care Makeup Perfume Hygiene Products
40%
18%
11%
10%
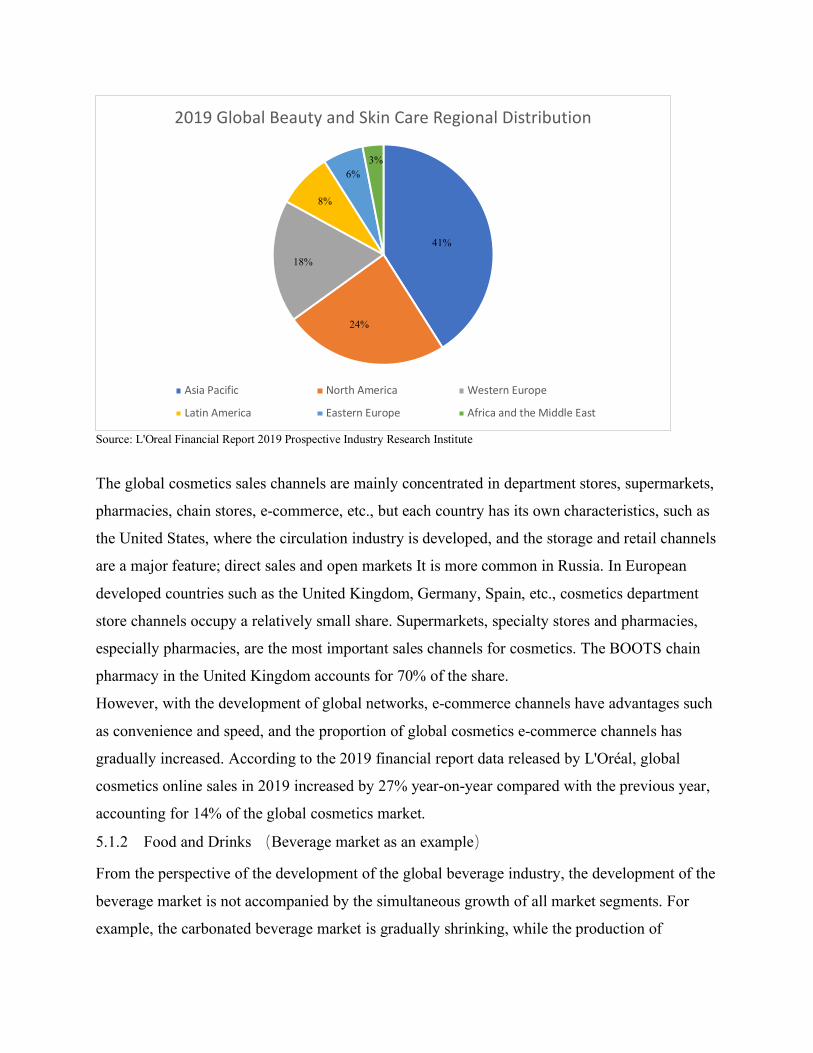
Source: L'Oreal Financial Report 2019 Prospective Industry Research Institute
The global cosmetics sales channels are mainly concentrated in department stores, supermarkets,
pharmacies, chain stores, e-commerce, etc., but each country has its own characteristics, such as
the United States, where the circulation industry is developed, and the storage and retail channels
are a major feature; direct sales and open markets It is more common in Russia. In European
developed countries such as the United Kingdom, Germany, Spain, etc., cosmetics department
store channels occupy a relatively small share. Supermarkets, specialty stores and pharmacies,
especially pharmacies, are the most important sales channels for cosmetics. The BOOTS chain
pharmacy in the United Kingdom accounts for 70% of the share.
However, with the development of global networks, e-commerce channels have advantages such
as convenience and speed, and the proportion of global cosmetics e-commerce channels has
gradually increased. According to the 2019 financial report data released by L'Oréal, global
cosmetics online sales in 2019 increased by 27% year-on-year compared with the previous year,
accounting for 14% of the global cosmetics market.
5.1.2 Food and Drinks (Beverage market as an example)
From the perspective of the development of the global beverage industry, the development of the
beverage market is not accompanied by the simultaneous growth of all market segments. For
example, the carbonated beverage market is gradually shrinking, while the production of
2019 Global Beauty and Skin Care Regional Distribution
Asia Pacific North America Western Europe
Latin America Eastern Europe Africa and the Middle East
24%
41%
18%
8%
6%3%
functional beverage products is rapid. Moreover, with the economic development and the
improvement of living standards in countries around the world, people have begun to pay
attention to nutrition and taste in the choice of beverages.
Product aspect
Digestive system health has become an "important trend", but this trend has not yet reached its
full potential. Highly processed foods are obsolete, which opens the way for products produced
by natural processes such as fermentation, and also helps create clean label products. By 2019,
more and more probiotic beverages, such as milk and kefir, and vinegar-based beverages will
continue to appear, and kombucha is expected to become the next major mixed beverage.
The variety of bottled water is growing, which will surpass all other non-alcoholic beverages and
will continue to evolve as it grows. Especially in the category of functional water, driven by
health-conscious consumers, the types of functional water are rapidly innovating. Adding
vitamins, collagen, minerals and natural caffeine is only part of the added function of beverages.
In the unsweetened beverage category, flavors such as citrus fruits will maintain strong growth.
As vegetarians, vegans, and plant-based lifestyles continue to gain popularity, vegetable and
herbal products will drive innovation in many different categories. Consumers are paying more
and more attention to the efficacy of vitamins and supplements, which opens a skylight for
natural foods that claim to have medicinal properties. Aloe, cannabidiol, coconut and algae will
continue to be popular ingredients in beverages to meet consumers' nutritional goals. Processing
protein and dietary fiber into products can enhance product texture, meet consumers' macro
nutritional needs, and enhance overall attractiveness. Ready-to-drink functionality remains a key
driver of purchase
Material aspect
At present, consumers’ sense of social responsibility is becoming stronger and they have realized
the negative impact of plastic packaging on the environment, so their eyes have shifted from
plastic packaging to more sustainable alternatives. 34% of global consumers believe that glass
bottles are The most environmentally friendly, followed by Tetra Pak, aluminum cans and metal
cans. Only a few people do not care about the adverse effects of plastic bottles or cans on the
environment.
In fact, plastic bottles are indeed one of the main causes of plastic waste. The British government
promised to eradicate all avoidable plastic waste by the end of 2042. China is shrinking imports

of foreign waste, and major countries around the world are formulating countermeasures against
plastic pollution. Therefore, whether it is from the perspective of environmental protection or the
sustainable development of enterprises, the use of renewable, recyclable, alternative materials
and reduction of material weight for product packaging is an inevitable trend in the development
of the soft drink industry. At the same time, manufacturers must ensure that these packaging
alternatives are easy to transport, open and reseal to rival the practicality of plastic bottles.
From the perspective of the development of the global beverage industry, the global beverage
industry market has maintained a continuous growth trend under the influence of market
demand. In 2014, the market size of the global beverage industry was US$1210.82 billion, which
increased to US$1432.3 billion in 2019, a year-on-year increase of 2.30%. The average annual
growth rate of the global beverage industry market size from 2014 to 2019 was 2.25%.
Source: Li Ding Industry Research Center
The size of the European beverage market is second only to the North American market. In 2014,
it was 335.44 billion U.S. dollars and increased to 367.0 billion U.S. dollars in 2019, a year-on-
year increase of 2.4%, and the growth rate has rebounded. The compound annual growth rate
from 2014 to 2019 reached 1.72%.
0.00%
0.50%
1.00%
1.50%
2.00%
2.50%
3.00%
11000
11500
12000
12500
13000
13500
14000
14500
2014 2015 2016 2017 2018 2019
2014-2019 Global Beverage Industry Market Size
Market Size (billion US Dollars) Growth Rate
2.52%
1.71%
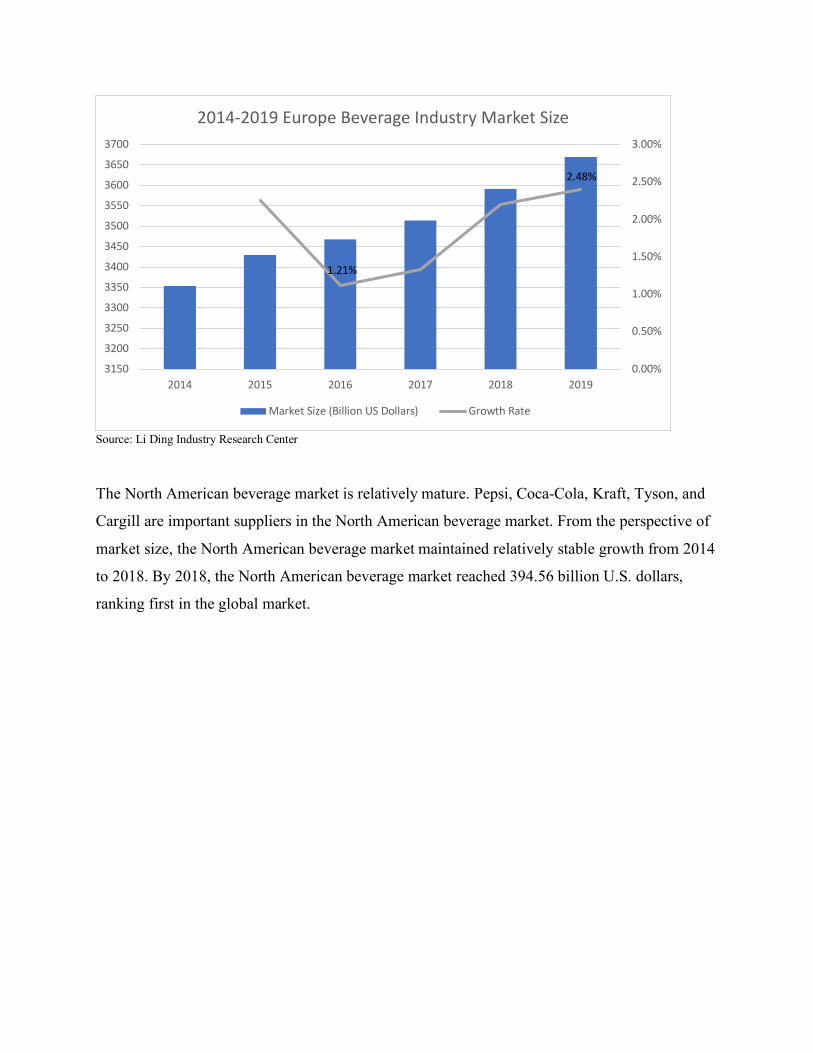
Source: Li Ding Industry Research Center
The North American beverage market is relatively mature. Pepsi, Coca-Cola, Kraft, Tyson, and
Cargill are important suppliers in the North American beverage market. From the perspective of
market size, the North American beverage market maintained relatively stable growth from 2014
to 2018. By 2018, the North American beverage market reached 394.56 billion U.S. dollars,
ranking first in the global market.
0.00%
0.50%
1.00%
1.50%
2.00%
2.50%
3.00%
3150
3200
3250
3300
3350
3400
3450
3500
3550
3600
3650
3700
2014 2015 2016 2017 2018 2019
2014-2019 Europe Beverage Industry Market Size
Market Size (Billion US Dollars) Growth Rate
2.48%
1.21%
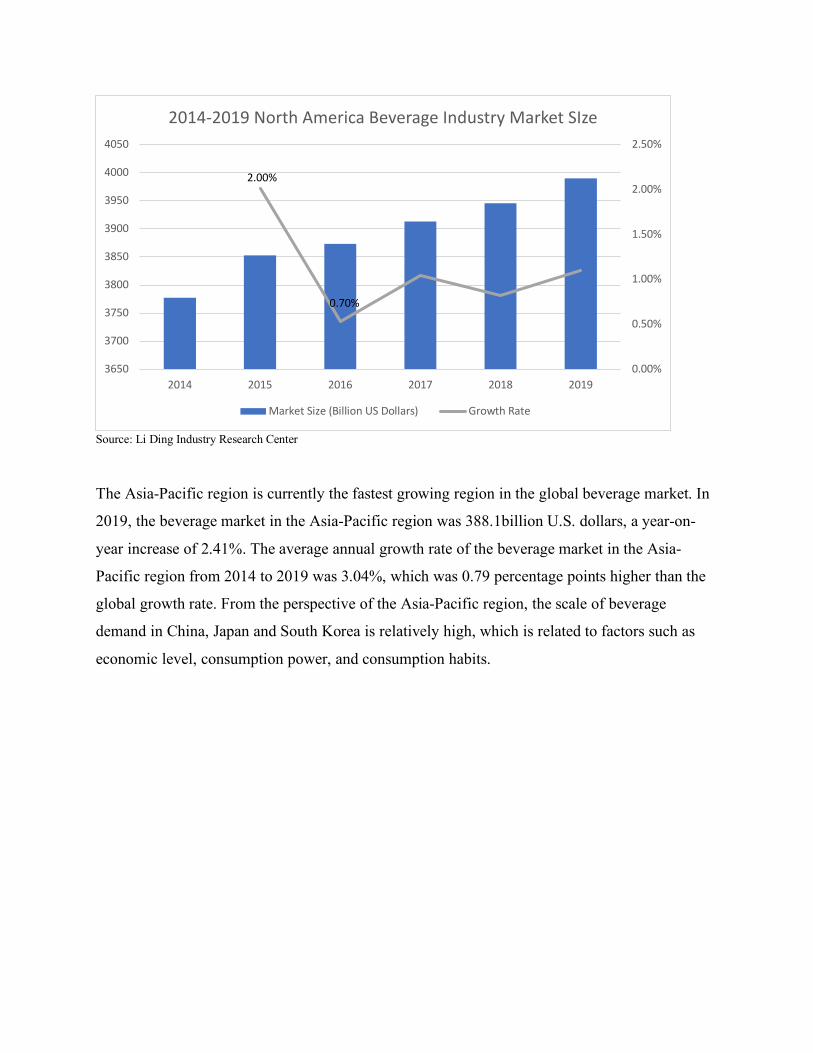
Source: Li Ding Industry Research Center
The Asia-Pacific region is currently the fastest growing region in the global beverage market. In
2019, the beverage market in the Asia-Pacific region was 388.1billion U.S. dollars, a year-on-
year increase of 2.41%. The average annual growth rate of the beverage market in the Asia-
Pacific region from 2014 to 2019 was 3.04%, which was 0.79 percentage points higher than the
global growth rate. From the perspective of the Asia-Pacific region, the scale of beverage
demand in China, Japan and South Korea is relatively high, which is related to factors such as
economic level, consumption power, and consumption habits.
0.00%
0.50%
1.00%
1.50%
2.00%
2.50%
3650
3700
3750
3800
3850
3900
3950
4000
4050
2014 2015 2016 2017 2018 2019
2014-2019 North America Beverage Industry Market SIze
Market Size (Billion US Dollars) Growth Rate
2.00%
0.70%
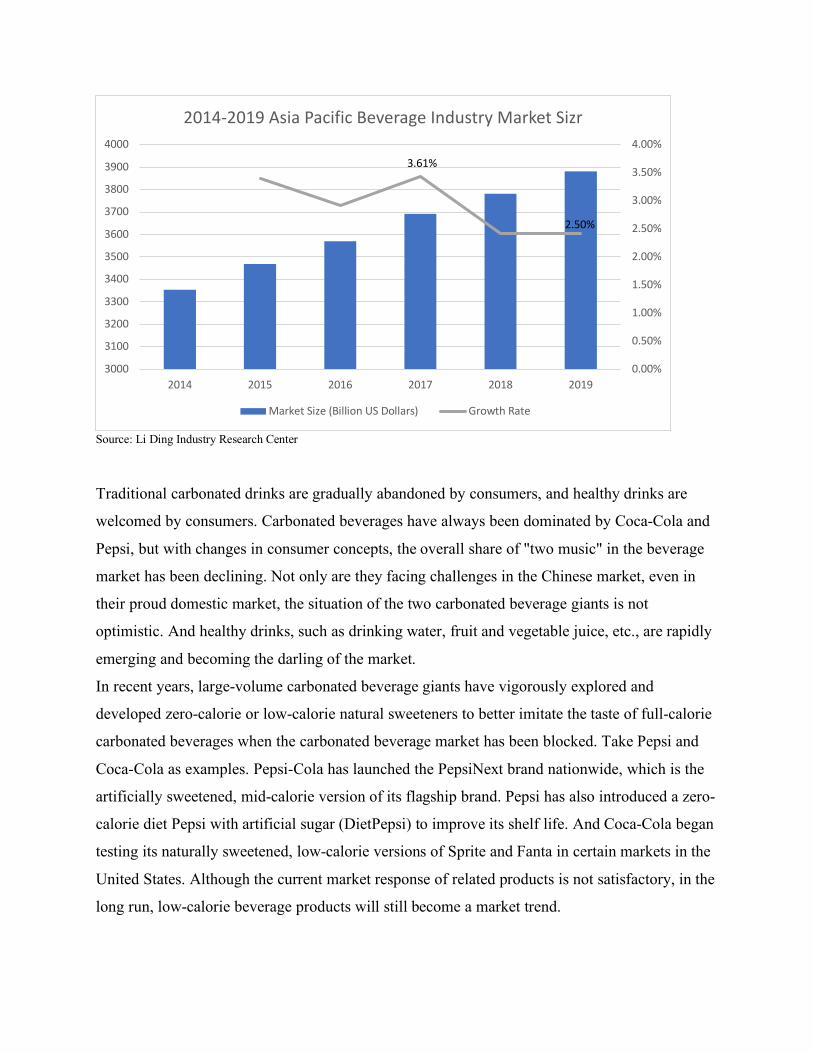
Source: Li Ding Industry Research Center
Traditional carbonated drinks are gradually abandoned by consumers, and healthy drinks are
welcomed by consumers. Carbonated beverages have always been dominated by Coca-Cola and
Pepsi, but with changes in consumer concepts, the overall share of "two music" in the beverage
market has been declining. Not only are they facing challenges in the Chinese market, even in
their proud domestic market, the situation of the two carbonated beverage giants is not
optimistic. And healthy drinks, such as drinking water, fruit and vegetable juice, etc., are rapidly
emerging and becoming the darling of the market.
In recent years, large-volume carbonated beverage giants have vigorously explored and
developed zero-calorie or low-calorie natural sweeteners to better imitate the taste of full-calorie
carbonated beverages when the carbonated beverage market has been blocked. Take Pepsi and
Coca-Cola as examples. Pepsi-Cola has launched the PepsiNext brand nationwide, which is the
artificially sweetened, mid-calorie version of its flagship brand. Pepsi has also introduced a zero-
calorie diet Pepsi with artificial sugar (DietPepsi) to improve its shelf life. And Coca-Cola began
testing its naturally sweetened, low-calorie versions of Sprite and Fanta in certain markets in the
United States. Although the current market response of related products is not satisfactory, in the
long run, low-calorie beverage products will still become a market trend.
0.00%
0.50%
1.00%
1.50%
2.00%
2.50%
3.00%
3.50%
4.00%
3000
3100
3200
3300
3400
3500
3600
3700
3800
3900
4000
2014 2015 2016 2017 2018 2019
2014-2019 Asia Pacific Beverage Industry Market Sizr
Market Size (Billion US Dollars) Growth Rate
3.61%
2.50%
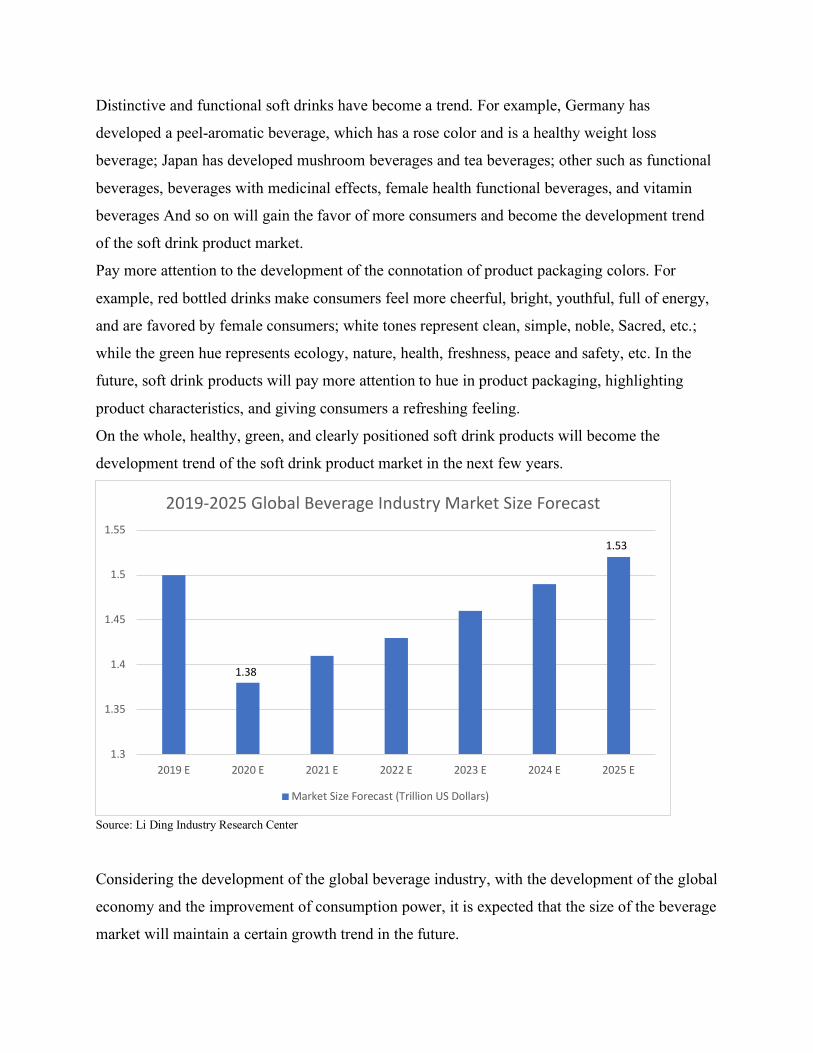
Distinctive and functional soft drinks have become a trend. For example, Germany has
developed a peel-aromatic beverage, which has a rose color and is a healthy weight loss
beverage; Japan has developed mushroom beverages and tea beverages; other such as functional
beverages, beverages with medicinal effects, female health functional beverages, and vitamin
beverages And so on will gain the favor of more consumers and become the development trend
of the soft drink product market.
Pay more attention to the development of the connotation of product packaging colors. For
example, red bottled drinks make consumers feel more cheerful, bright, youthful, full of energy,
and are favored by female consumers; white tones represent clean, simple, noble, Sacred, etc.;
while the green hue represents ecology, nature, health, freshness, peace and safety, etc. In the
future, soft drink products will pay more attention to hue in product packaging, highlighting
product characteristics, and giving consumers a refreshing feeling.
On the whole, healthy, green, and clearly positioned soft drink products will become the
development trend of the soft drink product market in the next few years.
Source: Li Ding Industry Research Center
Considering the development of the global beverage industry, with the development of the global
economy and the improvement of consumption power, it is expected that the size of the beverage
market will maintain a certain growth trend in the future.
1.3
1.35
1.4
1.45
1.5
1.55
2019 E 2020 E 2021 E 2022 E 2023 E 2024 E 2025 E
2019-2025 Global Beverage Industry Market Size Forecast
Market Size Forecast (Trillion US Dollars)
1.38
1.53
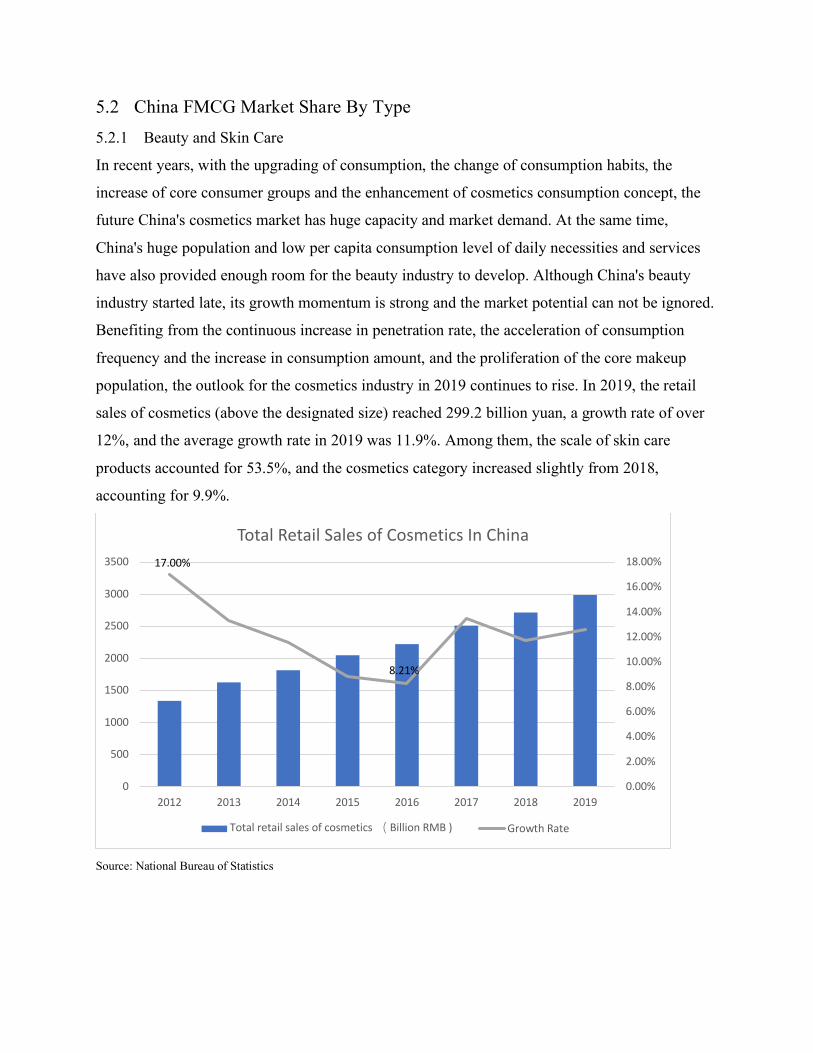
5.2 China FMCG Market Share By Type 5.2.1 Beauty and Skin Care
In recent years, with the upgrading of consumption, the change of consumption habits, the
increase of core consumer groups and the enhancement of cosmetics consumption concept, the
future China's cosmetics market has huge capacity and market demand. At the same time,
China's huge population and low per capita consumption level of daily necessities and services
have also provided enough room for the beauty industry to develop. Although China's beauty
industry started late, its growth momentum is strong and the market potential can not be ignored.
Benefiting from the continuous increase in penetration rate, the acceleration of consumption
frequency and the increase in consumption amount, and the proliferation of the core makeup
population, the outlook for the cosmetics industry in 2019 continues to rise. In 2019, the retail
sales of cosmetics (above the designated size) reached 299.2 billion yuan, a growth rate of over
12%, and the average growth rate in 2019 was 11.9%. Among them, the scale of skin care
products accounted for 53.5%, and the cosmetics category increased slightly from 2018,
accounting for 9.9%.
Source: National Bureau of Statistics
0.00%
2.00%
4.00%
6.00%
8.00%
10.00%
12.00%
14.00%
16.00%
18.00%
0
500
1000
1500
2000
2500
3000
3500
2012 2013 2014 2015 2016 2017 2018 2019
Total Retail Sales of Cosmetics In China
Total retail sales of cosmetics ( Billion RMB ) Growth Rate
17.00%
8.21%
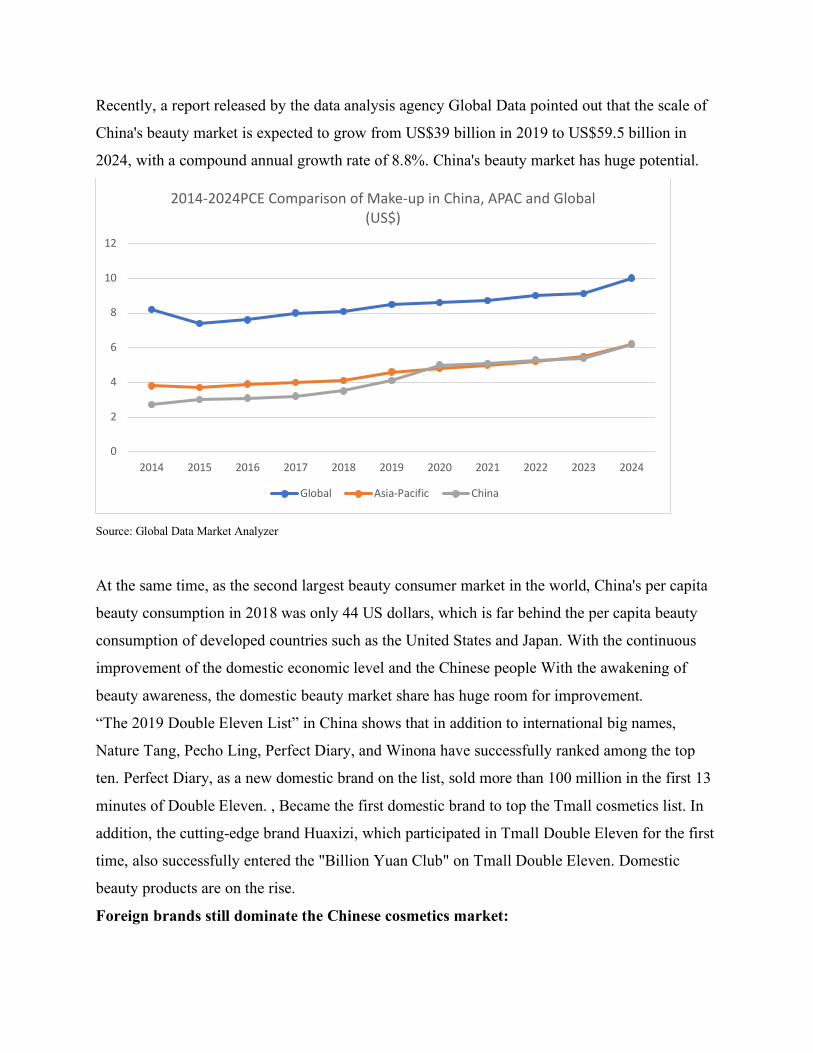
Recently, a report released by the data analysis agency Global Data pointed out that the scale of
China's beauty market is expected to grow from US$39 billion in 2019 to US$59.5 billion in
2024, with a compound annual growth rate of 8.8%. China's beauty market has huge potential.
Source: Global Data Market Analyzer
At the same time, as the second largest beauty consumer market in the world, China's per capita
beauty consumption in 2018 was only 44 US dollars, which is far behind the per capita beauty
consumption of developed countries such as the United States and Japan. With the continuous
improvement of the domestic economic level and the Chinese people With the awakening of
beauty awareness, the domestic beauty market share has huge room for improvement.
“The 2019 Double Eleven List” in China shows that in addition to international big names,
Nature Tang, Pecho Ling, Perfect Diary, and Winona have successfully ranked among the top
ten. Perfect Diary, as a new domestic brand on the list, sold more than 100 million in the first 13
minutes of Double Eleven. , Became the first domestic brand to top the Tmall cosmetics list. In
addition, the cutting-edge brand Huaxizi, which participated in Tmall Double Eleven for the first
time, also successfully entered the "Billion Yuan Club" on Tmall Double Eleven. Domestic
beauty products are on the rise.
Foreign brands still dominate the Chinese cosmetics market:
0
2
4
6
8
10
12
2014 2015 2016 2017 2018 2019 2020 2021 2022 2023 2024
2014-2024PCE Comparison of Make-up in China, APAC and Global(US$)
Global Asia-Pacific China
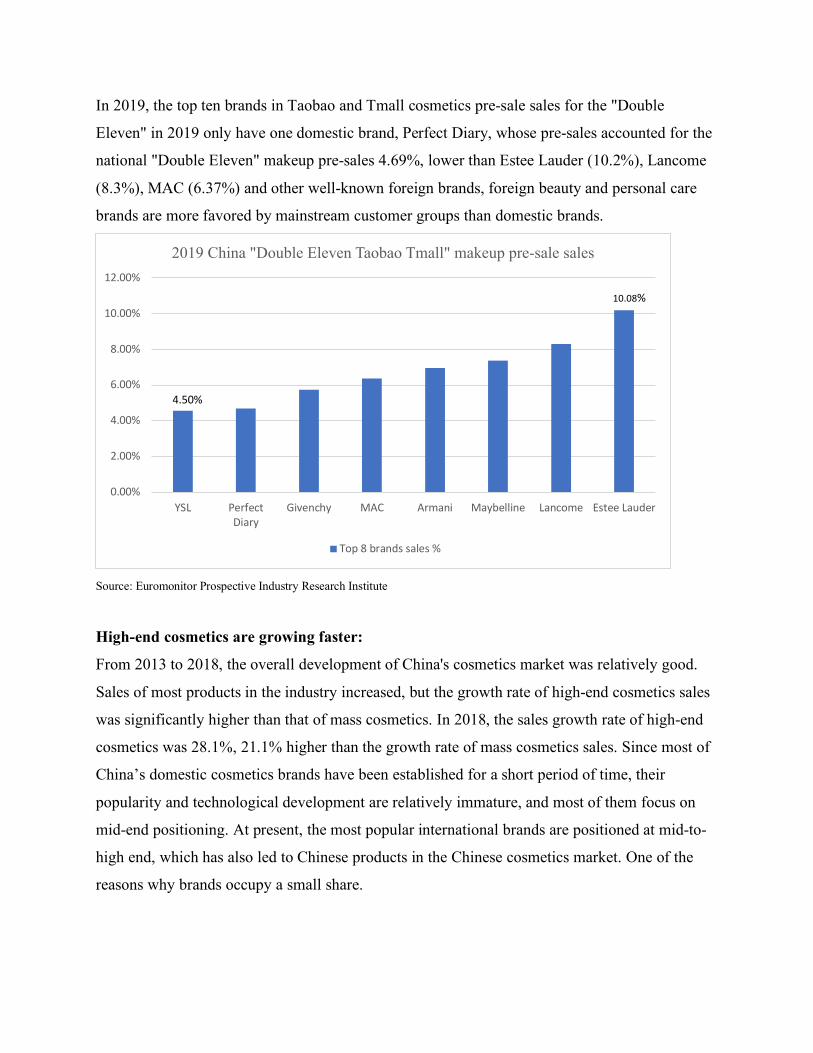
In 2019, the top ten brands in Taobao and Tmall cosmetics pre-sale sales for the "Double
Eleven" in 2019 only have one domestic brand, Perfect Diary, whose pre-sales accounted for the
national "Double Eleven" makeup pre-sales 4.69%, lower than Estee Lauder (10.2%), Lancome
(8.3%), MAC (6.37%) and other well-known foreign brands, foreign beauty and personal care
brands are more favored by mainstream customer groups than domestic brands.
Source: Euromonitor Prospective Industry Research Institute
High-end cosmetics are growing faster:
From 2013 to 2018, the overall development of China's cosmetics market was relatively good.
Sales of most products in the industry increased, but the growth rate of high-end cosmetics sales
was significantly higher than that of mass cosmetics. In 2018, the sales growth rate of high-end
cosmetics was 28.1%, 21.1% higher than the growth rate of mass cosmetics sales. Since most of
China’s domestic cosmetics brands have been established for a short period of time, their
popularity and technological development are relatively immature, and most of them focus on
mid-end positioning. At present, the most popular international brands are positioned at mid-to-
high end, which has also led to Chinese products in the Chinese cosmetics market. One of the
reasons why brands occupy a small share.
0.00%
2.00%
4.00%
6.00%
8.00%
10.00%
12.00%
YSL PerfectDiary
Givenchy MAC Armani Maybelline Lancome Estee Lauder
2019 China "Double Eleven Taobao Tmall" makeup pre-sale sales
Top 8 brands sales %
10.08%
4.50%
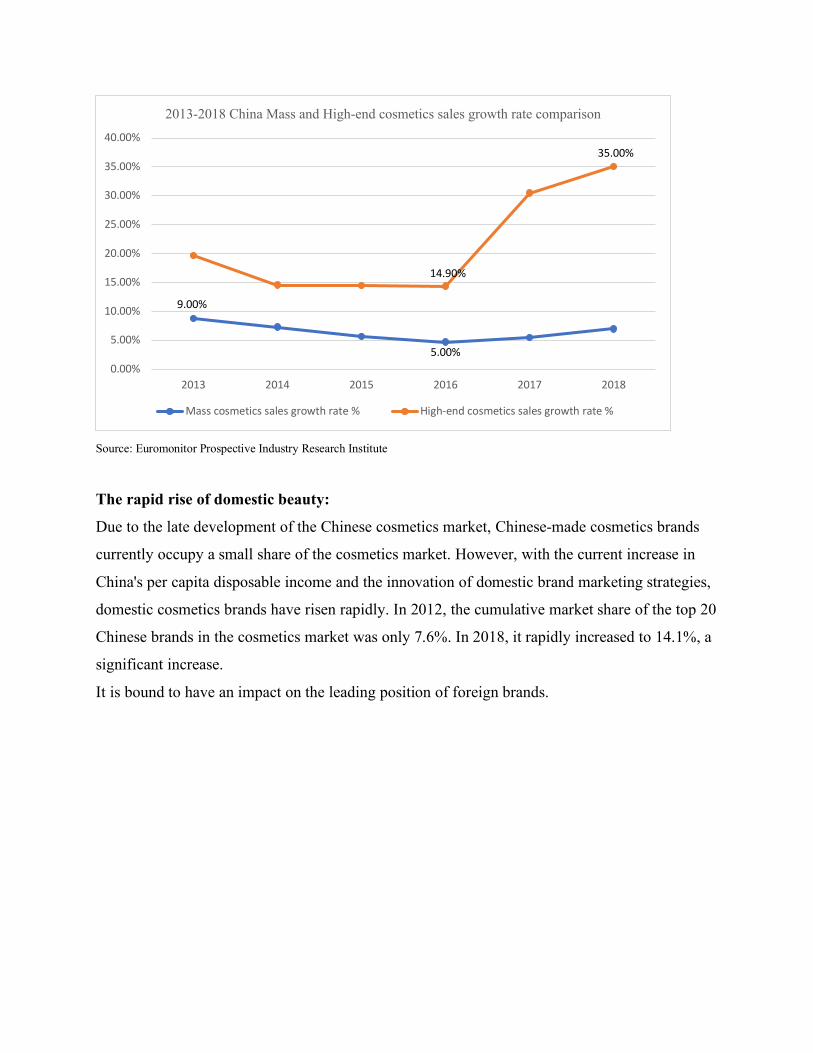
Source: Euromonitor Prospective Industry Research Institute
The rapid rise of domestic beauty:
Due to the late development of the Chinese cosmetics market, Chinese-made cosmetics brands
currently occupy a small share of the cosmetics market. However, with the current increase in
China's per capita disposable income and the innovation of domestic brand marketing strategies,
domestic cosmetics brands have risen rapidly. In 2012, the cumulative market share of the top 20
Chinese brands in the cosmetics market was only 7.6%. In 2018, it rapidly increased to 14.1%, a
significant increase.
It is bound to have an impact on the leading position of foreign brands.
0.00%
5.00%
10.00%
15.00%
20.00%
25.00%
30.00%
35.00%
40.00%
2013 2014 2015 2016 2017 2018
2013-2018 China Mass and High-end cosmetics sales growth rate comparison
Mass cosmetics sales growth rate % High-end cosmetics sales growth rate %
14.90%
35.00%
9.00%
5.00%
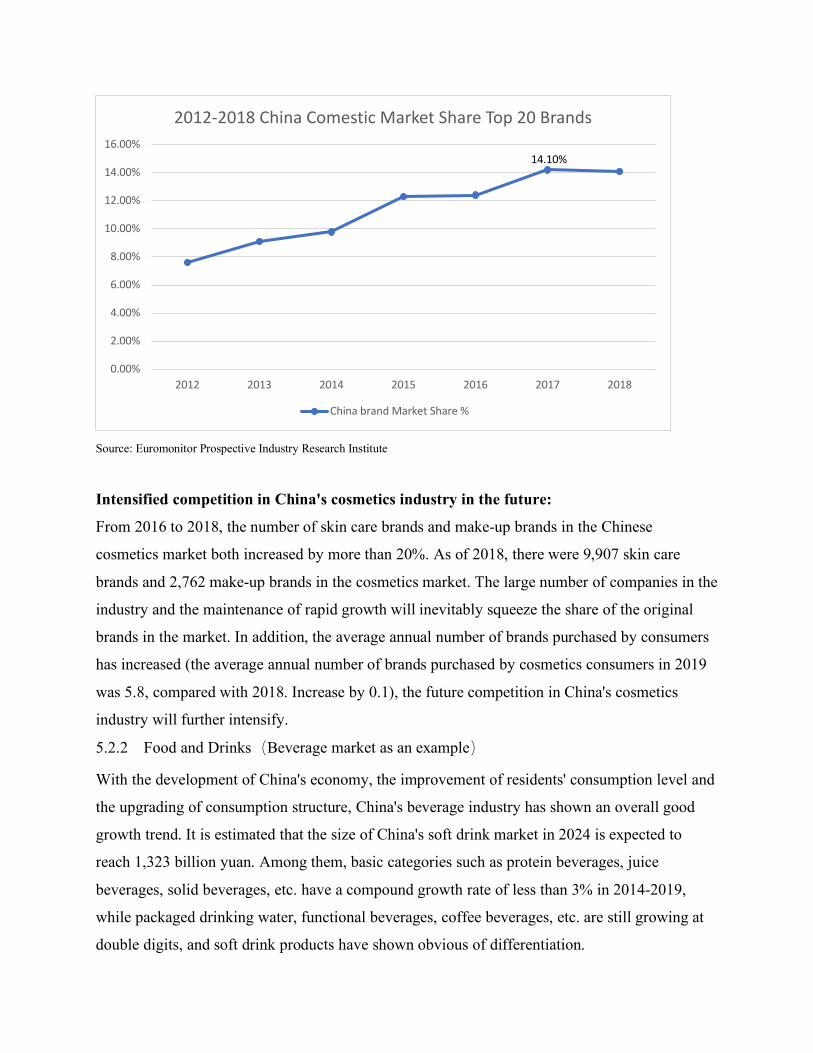
Source: Euromonitor Prospective Industry Research Institute
Intensified competition in China's cosmetics industry in the future:
From 2016 to 2018, the number of skin care brands and make-up brands in the Chinese
cosmetics market both increased by more than 20%. As of 2018, there were 9,907 skin care
brands and 2,762 make-up brands in the cosmetics market. The large number of companies in the
industry and the maintenance of rapid growth will inevitably squeeze the share of the original
brands in the market. In addition, the average annual number of brands purchased by consumers
has increased (the average annual number of brands purchased by cosmetics consumers in 2019
was 5.8, compared with 2018. Increase by 0.1), the future competition in China's cosmetics
industry will further intensify.
5.2.2 Food and Drinks(Beverage market as an example)
With the development of China's economy, the improvement of residents' consumption level and
the upgrading of consumption structure, China's beverage industry has shown an overall good
growth trend. It is estimated that the size of China's soft drink market in 2024 is expected to
reach 1,323 billion yuan. Among them, basic categories such as protein beverages, juice
beverages, solid beverages, etc. have a compound growth rate of less than 3% in 2014-2019,
while packaged drinking water, functional beverages, coffee beverages, etc. are still growing at
double digits, and soft drink products have shown obvious of differentiation.
0.00%
2.00%
4.00%
6.00%
8.00%
10.00%
12.00%
14.00%
16.00%
2012 2013 2014 2015 2016 2017 2018
2012-2018 China Comestic Market Share Top 20 Brands
China brand Market Share %
14.10%
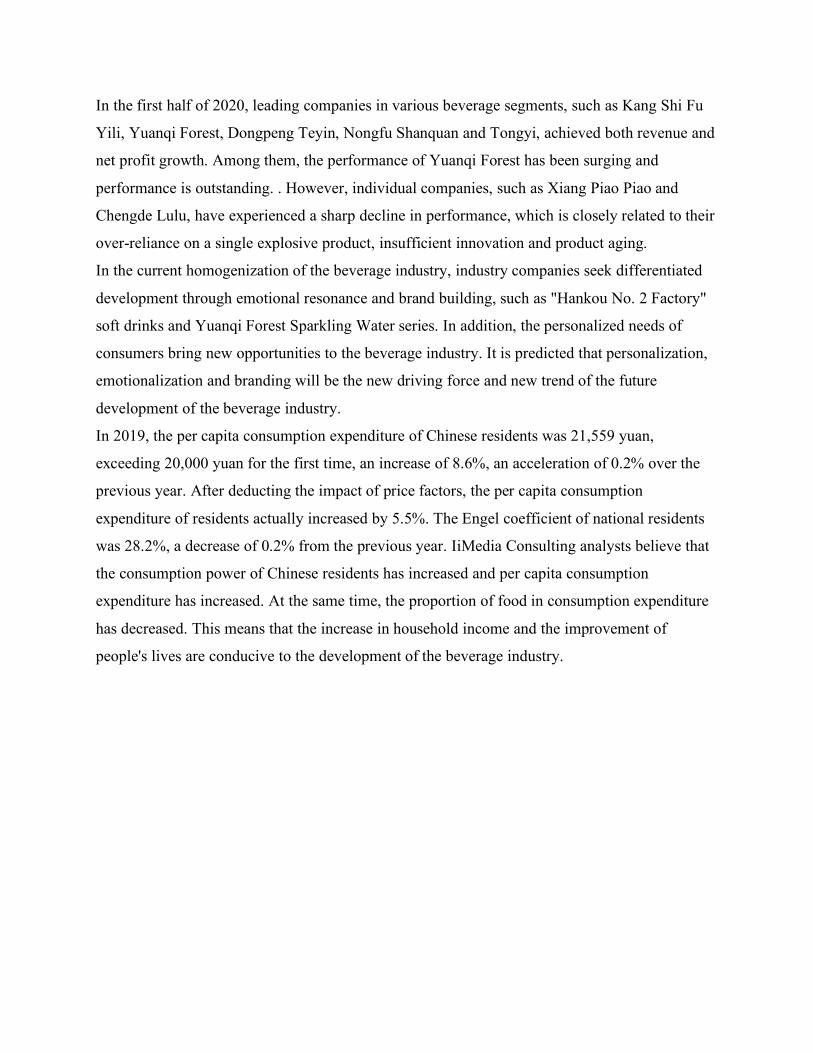
In the first half of 2020, leading companies in various beverage segments, such as Kang Shi Fu
Yili, Yuanqi Forest, Dongpeng Teyin, Nongfu Shanquan and Tongyi, achieved both revenue and
net profit growth. Among them, the performance of Yuanqi Forest has been surging and
performance is outstanding. . However, individual companies, such as Xiang Piao Piao and
Chengde Lulu, have experienced a sharp decline in performance, which is closely related to their
over-reliance on a single explosive product, insufficient innovation and product aging.
In the current homogenization of the beverage industry, industry companies seek differentiated
development through emotional resonance and brand building, such as "Hankou No. 2 Factory"
soft drinks and Yuanqi Forest Sparkling Water series. In addition, the personalized needs of
consumers bring new opportunities to the beverage industry. It is predicted that personalization,
emotionalization and branding will be the new driving force and new trend of the future
development of the beverage industry.
In 2019, the per capita consumption expenditure of Chinese residents was 21,559 yuan,
exceeding 20,000 yuan for the first time, an increase of 8.6%, an acceleration of 0.2% over the
previous year. After deducting the impact of price factors, the per capita consumption
expenditure of residents actually increased by 5.5%. The Engel coefficient of national residents
was 28.2%, a decrease of 0.2% from the previous year. IiMedia Consulting analysts believe that
the consumption power of Chinese residents has increased and per capita consumption
expenditure has increased. At the same time, the proportion of food in consumption expenditure
has decreased. This means that the increase in household income and the improvement of
people's lives are conducive to the development of the beverage industry.
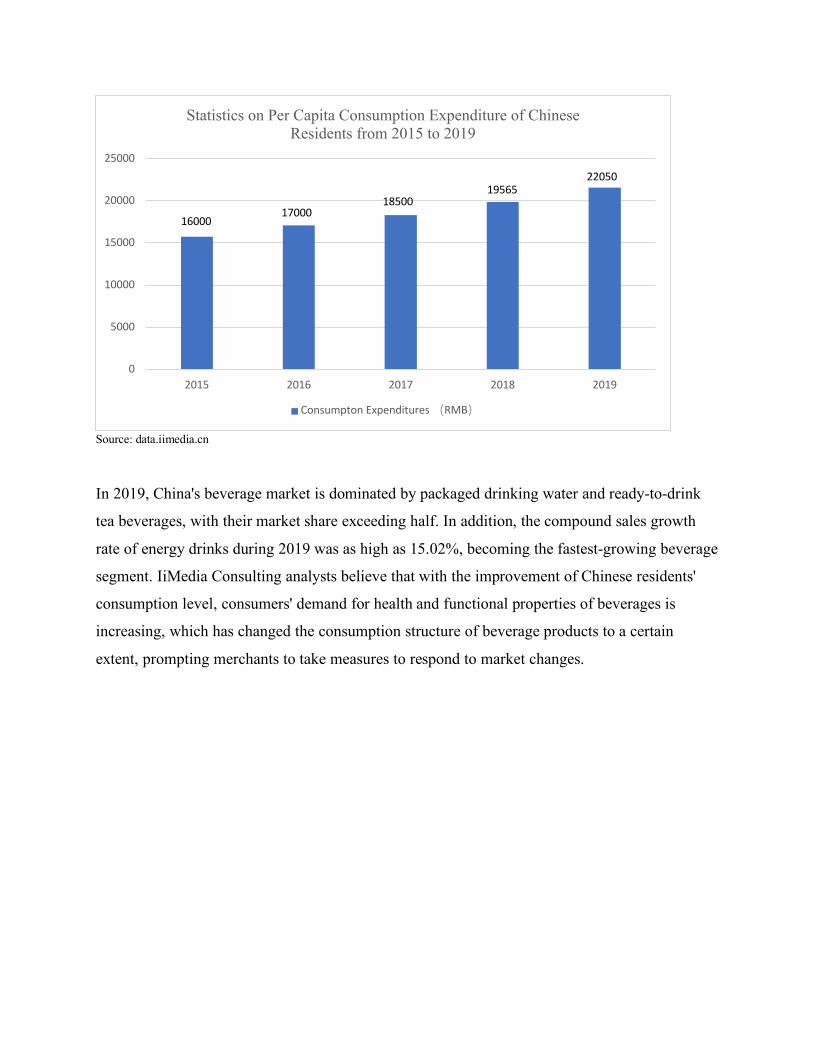
Source: data.iimedia.cn
In 2019, China's beverage market is dominated by packaged drinking water and ready-to-drink
tea beverages, with their market share exceeding half. In addition, the compound sales growth
rate of energy drinks during 2019 was as high as 15.02%, becoming the fastest-growing beverage
segment. IiMedia Consulting analysts believe that with the improvement of Chinese residents'
consumption level, consumers' demand for health and functional properties of beverages is
increasing, which has changed the consumption structure of beverage products to a certain
extent, prompting merchants to take measures to respond to market changes.
0
5000
10000
15000
20000
25000
2015 2016 2017 2018 2019
Statistics on Per Capita Consumption Expenditure of Chinese Residents from 2015 to 2019
Consumpton Expenditures (RMB)
1600017000
1850019565
22050
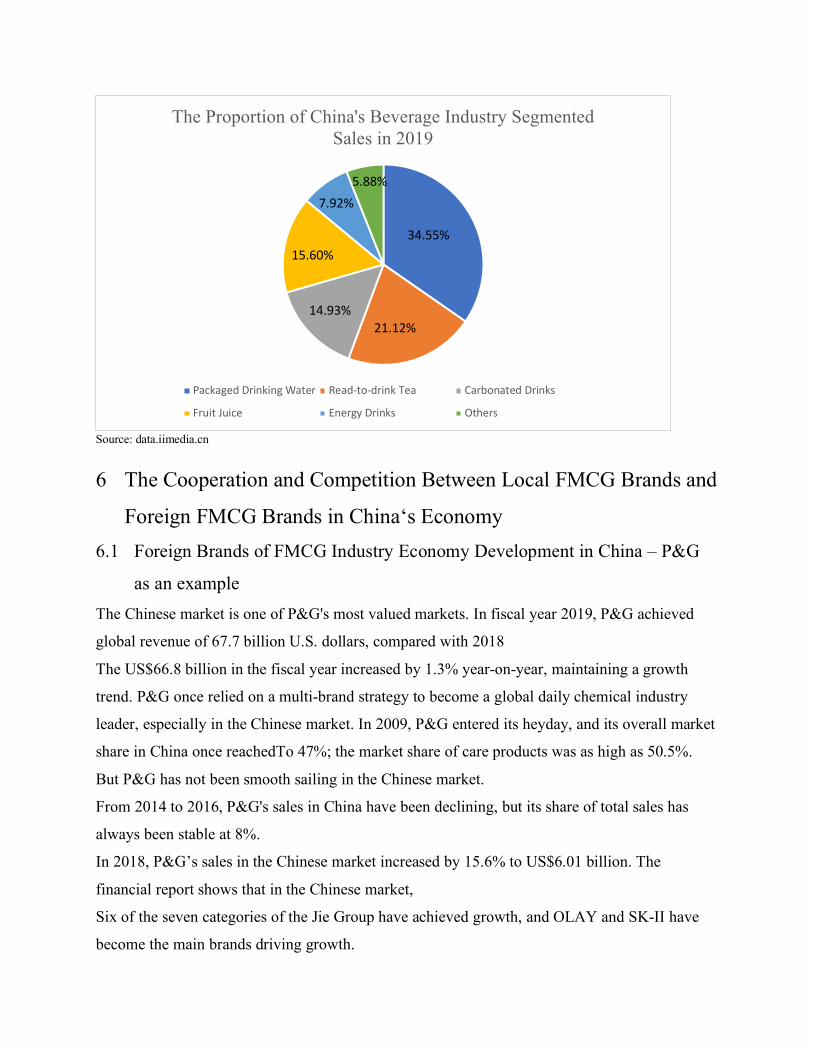
Source: data.iimedia.cn
6 The Cooperation and Competition Between Local FMCG Brands and
Foreign FMCG Brands in China‘s Economy 6.1 Foreign Brands of FMCG Industry Economy Development in China – P&G
as an example The Chinese market is one of P&G's most valued markets. In fiscal year 2019, P&G achieved
global revenue of 67.7 billion U.S. dollars, compared with 2018
The US$66.8 billion in the fiscal year increased by 1.3% year-on-year, maintaining a growth
trend. P&G once relied on a multi-brand strategy to become a global daily chemical industry
leader, especially in the Chinese market. In 2009, P&G entered its heyday, and its overall market
share in China once reachedTo 47%; the market share of care products was as high as 50.5%.
But P&G has not been smooth sailing in the Chinese market.
From 2014 to 2016, P&G's sales in China have been declining, but its share of total sales has
always been stable at 8%.
In 2018, P&G’s sales in the Chinese market increased by 15.6% to US$6.01 billion. The
financial report shows that in the Chinese market,
Six of the seven categories of the Jie Group have achieved growth, and OLAY and SK-II have
become the main brands driving growth.
The Proportion of China's Beverage Industry Segmented Sales in 2019
Packaged Drinking Water Read-to-drink Tea Carbonated Drinks
Fruit Juice Energy Drinks Others
34.55%
5.88%7.92%
15.60%
14.93%21.12%
In fiscal year 2019, its sales growth momentum in China continued to be strong. It is estimated
that P&G China’s sales in fiscal year 2019 will be approximately at 6.31 billion US dollars
(approximately RMB 43.41 billion), the two brands SK-II and OLAY contributed a lot.
Adhere to the localized marketing strategy of international brands. P&G’s advertising strategy in
China is mainly manifested in its adherence to international advertising strategy
At the same time, pay attention to the localization of international brands, grasp the common
consumer psychology of domestic and foreign consumers buying daily-use detergents, localize
products, and internationalize advertising strategies. According to the financial report, P&G’s
operating income in China increased from 105.13 billion yuan in the first quarter of fiscal year
2016 to 110.85 billion yuan in the third quarter of fiscal year 2019, and online sales increased
from 810 million yuan in the first quarter of fiscal year 2016 to 5.98 billion yuan in the second
quarter of 2019, an increase of 6.4 times. The company's various categories and brands also
account for considerable online sales in China. In December 2018, from the perspective of
category, the proportion of online sales of care cleaners/sanitary napkins/paper/aromatherapy,
skin care/beauty/essential oils and diapers/washing care/feeding/pushing bed The highest is
35.5%, 24.2% and 19.1% respectively; from the brand point of view, Pampers’ brand sales
accounted for the first place, reaching 18.3%; SK-II and Braun followed closely.
After that, they were 12.4% and 12.6%.
6.2 Local Brands of FMCG Industry Economy Development in China Yuanji Forest is a Chinese beverage company specializing in the production of sugar-free and
low-calorie products. The company's main products are burning tea and sparkling water. In 2015,
the Yuanqi Forest R&D Center was established; from 2015 to 2016, the company entered the
product development stage and the company was established; from 2017 to 2018, the Yuanqi
Forest products were officially marketed to the market and consumers; in 2019 and 2020, at the
618 e-commerce festival, Yuanqi Forest won No. 1 in beverage sales on Tmall.
Since its establishment, Yuanqi Forest has maintained the rhythm of financing once a year. In
October 2019, Yuanqi Forest received a strategic financing worth 150 million yuan, with a post-
investment valuation of 3.75 billion yuan. According to reports, Yuanqi Forest will complete a
new round of financing in July 2020, with a valuation of US$2 billion (approximately RMB 14
billion). IiMedia Consulting analysts believe that the recognition and pursuit of capital is firstly
optimistic about the potential of the health drink market; secondly, it has a certain relationship
with the market share of Yuanqi Forest, which is the marketing planning ability and growth
potential of Yuanqi Forest A kind of recognition; the third is that the current vitality forest
performance is in the process of triumphant advancement.
In May 2020, the sales performance of Yuanqi Forest reached 260 million yuan, exceeding the
total sales of 2018, with an average daily sales of 4.4 million yuan. It is estimated that the sales
in 2020 will exceed 2 billion yuan. IiMedia Consulting analysts believe that the brand
positioning of Yuanqi Forest is a "sugar-free specialist", and its products are especially popular
with women. All packaging designs and product positioning are also women-oriented rather than
gender-oriented, plus the spread of social platforms. It is easy to become a hot item, so the
current performance of Yuanqi Forest is still in a period of rapid rise.
Yuanqi Forest Products focuses on the concept of "0 sugar, 0 fat, 0 calories", among which the
sparkling water series has become an online celebrity product. Yuanqi Forest strives to jump out
of the consumption scene of a single explosive model, and has developed in the direction of
super-brands. Currently, in addition to burning tea, sparkling water, milk tea, and fitness light
tea, it also launched the energy drink brand "Alien" this year. Yuanqi Forest Sparkling Aquatic
Products not only ensure sufficient sweetness in the taste, but also avoid a large amount of heat
generation, successfully cater to the current consumer demand, and open the sugar-free beverage
market. In the case that the product boom has led to an increase in performance, Yuanqi Forest
has built its own factory to expand production capacity and improve product innovation
capabilities, laying the foundation for the later development of new products and market
competitiveness.
In recent years, with the increase of the elderly population and the improvement of consumer
health awareness, China's health industry has developed rapidly. In this context, consumers tend
to prefer nutritious and healthy products in beverage selection. Under the guidance of changes in
market consumption concepts and the country's policy of advocating the development of healthy
food, the product structure of China's beverage industry has begun to self-adjust. Milky
beverages, plant protein beverages, fruit and vegetable juices and other beverage brands that
advocate green and healthy will usher in development opportunities.
Facing an increasingly saturated market, the consumption of the beverage market has slowed
down, and brands need to continue to maintain their vitality to resonate with consumers. For
example, Wuhan Hengrun launched the "Hankou No. 2 Factory" brand with old soda
sensibilities and became a new generation of national trend beverages; another example is the
"Xiaoming Classmate" beverage launched by Uni-President, which focuses on young consumers
born in 1995. By giving beverage products a certain emotional culture, these companies are more
likely to resonate with specific groups of people, form differentiated competition, and quickly
occupy the market.
6.3 Competition Between China Indigenous Enterprises and Foreign-Ventures The reversal of the competitive landscape in China's consumer goods sector is happening quietly.
Since 2014, local companies have gained more and more market shares from foreign companies.
Changes in consumer shopping habits, the expansion of online channels, and the evolution of
prices are affecting the growth of Chinese fast-moving consumer goods companies. The overall
growth rate of China's fast-moving consumer goods market continued to slow, from around 12%
in 2011-2012 to 4.4% in the first quarter of 2015. However, the growth rate of local consumer
brands is higher than that of foreign brands, and the trend of local companies gaining greater
market share is obvious year by year. In 2014, the overall growth rate of local companies was
10%, continuing to lead the entire market, accounting for about 70% of sales in 26 market
categories; in 2014, the growth rate of foreign brands was only 3%. At the same time, 87% of the
market growth in 2014 came from local brands and 13% came from foreign brands; in 2013,
79% of the market growth came from local brands, and 21% came from foreign brands.
"The reason why local brands can seize market share is mainly because they have sound strategic
planning and strong execution, such as encircling offline cities outside of offline cities, large-
scale targeted marketing investment, and based on Chinese consumers Innovative products with
traditional concepts." Bruno said.
In terms of categories, local companies have won the market share of foreign companies in 18
categories, with the largest increase in skin care products, fabric softeners, cosmetics, infant
formula, juices and biscuits; foreign brands have lost in most categories Increased market share,
but only increased market share in 8 categories, including toilet paper, beer, conditioner and
chewing gum.
From a city perspective, the market share of foreign brands in cities at all levels has declined,
even in online cities where foreign brands once had a huge advantage. Nationwide, the market
share of foreign brands in 2014 decreased by 1.6% compared with 2013. Among them, the
market share of foreign brands in first-tier cities fell by 1.5%, second-tier cities fell by 1.9%, and
third, fourth, and fifth-tier cities fell by 1.0%, 1.2% and 1.2% respectively. 1.3%.
The slowdown in market growth in offline cities in China has little impact. Sales growth in these
cities is still close to a healthy 8%, which is significantly higher than the 2% in first- and second-
tier cities. This has accelerated the pace of Chinese fast-moving consumer goods companies
gaining market share from foreign competitors.
Another factor in the decline in the market share of foreign brands is related to channel changes.
The slowdown in China's fast-moving consumer goods market varies by sales channel.
According to Bruno's analysis, in the face of the strong offensive of e-commerce channels,
traditional channels continue to lose market share. With the decrease in passenger flow, the sales
growth rate of large supermarkets familiar with foreign capital has dropped by half. At the same
time, the passenger flow of small businesses such as supermarkets, small supermarkets, and
convenience stores has remained relatively stable, and local brands have more advantages in
these channels.
On the one hand, the halo of foreign brands is fading, and China’s manufacturing level has made
considerable progress, and its R&D level and marketing capabilities have gradually improved;
on the other hand, China’s post-80s and nearly 500 million post-70s and post-90s will be Major
consumers in China in the coming decades. Research shows that they will not reject "domestic
products."
However, it is worth noting that despite the outstanding performance of local brands, the share of
foreign FMCG companies in all eight categories has increased. "Part of the reason for the growth
of foreign brands is the first-mover advantage of certain categories (such as chocolate, chewing
gum, carbonated drinks and infant formula), and partly because of successful strategies such as
launching high-end product lines and channel expansion."
For example, Qingfeng Tissues, a subsidiary of Applied Group, focused on promoting several
major products, and its market share increased by 2.1%. Due to the consumption upgrade of
Chinese consumers, Budweiser and Heineken have won some market shares from local beer
brands; in terms of conditioners, L'Oréal has increased its market share through a series of
measures, such as expanding distribution channels in offline cities and configuring In-store hair
care consultants have launched new products such as colorful rhyme essence and golden branch
hair care essential oil; Schwarzkopf has accelerated its growth by launching high-end product
lines such as Feili hair cream and Hengshi Cuizhen series. With the help of channel expansion
and product line extension, Xuanmai has a 2.4% market share in chewing gum products.
Although local companies have become more and more competitive over time and can achieve
higher market growth by using the network layout of their offline cities, this does not mean that a
foreign brand is Failed in the category. In fact, individual foreign consumer product companies
such as Procter & Gamble and Unilever are still very strong, and the market concentration of
brands is relatively high.
"With the further maturity of the market and consumers, the competitive landscape between
foreign and local brands has transitioned from an obvious differentiated competition in the past
to an increasingly homogeneous competition today, and it is believed that this will become an
inevitable trend in the future. Learning from each other's business models and competitive
advantages, and maximizing strengths and avoiding weaknesses are public compulsory courses
for both parties to seize market share.
7 Future Scenario of FMCG Industry (Due to Covid-19) 7.1 Positive Trend During the twentieth century, the main innovation of the consumer goods industry was that its
achievements were upgraded from pure commodities to differentiated brands. In the 21st
century, the Internet revolution is driving industry transformation. In addition to technological
progress, the same powerful but more subtle social and behavioral changes and other driving
factors have also promoted the development and evolution of the consumer goods industry.
While major social, economic and technological developments continue to drive the digital
transformation of the industry, they have also brought many new risks and opportunities for
consumer goods companies.
As more and more millennials (that is, those born between 1980 and 2000) set up families and
start businesses, their consumption habits
Help the consumer goods industry determine the future development trend. It is estimated that
the total number of millennials worldwide exceeds 2 billion, accounting for 27% and 24% of the
adult population in the United States and Europe, respectively. They are the largest generation in
American history, even surpassing the baby boom generation. A large number of studies have
shown that millennials are more inclined to obtain availability than ownership, attach great
importance to convenience, and require increased transparency to understand the impact of
products and services on the planet and its own health.
Although millennials are reshaping the workplace, family, and social space, many countries are
also facing an aging population. Currently, the elderly the proportion of the global population (60
years and older) has increased from 9% in 1990 to approximately 12%, and it is expected to
reach 21% by 2050. This has driven the rapid growth of goods and services that meet their needs.
The elderly and millennials are using different ways to jointly promote the development of the
convenience economy.
At the same time, urbanization is developing rapidly. The United Nations estimates that by 2050,
the global population living in urban areas will increase from 54% in 2014 to nearly 60%. The
continuous growth of the global population will further expand the size of the global urban
population, causing cities to be too large and crowded. This trend has promoted the
popularization of innovative logistics and distribution models to meet consumer needs.
More importantly, the number of the global middle class7 is expected to increase from 1.8 billion
in 2009 to 3.2 billion in 2020, and to 49 by 2030.
Billion. The growth of this consumer group has stimulated the demand for products and services
in emerging markets, especially India and China.
In 2014, the Internet penetration rate reached about 40%, almost doubled in seven years; and at
the end of 2012, the number of mobile devices even exceeded the global population. The
increasing number of mobile and Internet services has caused more and more consumers to
transfer their purchase behavior to the Internet, enabling companies to have
Opportunities directly connect with consumers. For example, in the first quarter of 2014, 198
million American consumers (78% of the population over 15 years of age) made online
purchases.
People trust their peers seven times more than advertisements. Nowadays, consumers can
instantly share their opinions and create "public opinion" through various social media platforms.
This will have a great impact on companies. The more prominent examples include British
consumers’ dissatisfaction with Starbucks’ ultra-low tax payments, which led to a decline in
Starbucks sales; there is a well-known video on YouTube: "United Airlines broke me "United
Breaks Guitar" (United Breaks Guitar), with 10 million views, once plunged United Airlines into
a public relations crisis. Therefore, in today's highly interconnected world, companies need to act
quickly. Many companies have responded to this change
Responds: A recent survey revealed that nearly 80% of companies have established dedicated
social media teams.
By 2020, the Internet of Things will cover more than 50 billion connected devices, giving
companies the opportunity to create unique customer value propositions and experiences. This
will support consumer goods companies to provide personalized services on a large scale. For
example, sensors are installed at the entrance of the store to identify consumers and send targeted
promotional information to customers’ mobile devices based on their purchase records and
personal data. Of particular concern is that the retail industry has begun to adopt technologies
such as electronic point-of-sale and radio frequency identification (RFID) to strengthen the
ability of companies to accurately track the circulation and sales of goods.
Therefore, the following four digital transformation themes are expected to shape the consumer
goods industry in the next decade:
Capture of consumer data flow and value: The shift to digital customer interaction has created
many important opportunities for companies to obtain consumer information. In the fields where
traditional companies are lagging behind, new entrants are expected to replace their original
intermediary role. An important challenge facing the consumer goods industry will be how to
successfully develop data control and data monetization models. As society pays more and more
attention to data privacy and transparency, the importance of consumer and enterprise data will
inevitably increase, which will trigger increased attention and action by consumers and
regulators.
Experience economy: Products will evolve into services, services will evolve into experiences,
and data will become the backbone of all delivery activities. In fact, according to a Gartner
survey, 89% of business leaders believe that customer experience has become their main point of
competition. The continuous interaction between brand companies and consumers throughout the
product life cycle will become the norm. In the future, income will be gradually decoupled from
output and will be closely related to personal and social outcomes. Therefore, companies have
the opportunity to build new income models.
Omni-channel retail: At present, online purchases of most retail categories are increasing, and
traditional stores need to be reborn to keep up with the development of the times. The omni-
channel strategy will help these retailers keep up with the development needs of the times. E-
commerce is bound to achieve globalization, oligopoly, and provide a coexistence platform for
small retailers and second-hand merchandise sales. At the same time, profitable niche markets
will continue to emerge.
Digital operation model: The Internet of Things will continue to promote the development and
evolution of smart supply chains and smart factories, supporting large-scale, customized
products and omni-channel experiences. Designing an operating model that can properly manage
the consumer experience-such as "omnichannel support", "agile supply chain", "mass
customization" or "future workforce" will be an important task for companies to gain a
competitive advantage.
7.2 Negative Trend On the other hand, the revenue and profits of the fast-moving consumer goods industry suffered
a setback.
The epidemic directly affected the revenue of retail physical stores. Catering, shopping malls,
department stores and specialty brand stores, cinemas, and tourism were closed down, resulting
in setbacks in scene experience consumption categories such as fashion luxury goods and
alcohol; traditional supermarkets, convenience Although shops and street shops remain open to
ensure people’s livelihood needs, the flow has also been severely reduced. Fixed operating costs
such as labor, rent, inventory, etc., and bank loan interest expenses have put pressure on cash
flow, and operating profits will fall sharply. Directly challenge the survival of the enterprise. On
the other hand, although the order volume of online shopping platforms and O2O home services
has risen sharply, factors such as limited price increases and high service standards have
suppressed profits, and will show an upside-down situation in which volume increases and
profits decline.
The epidemic has triggered a further shift of retail companies to online, and at the same time
strategically shrinks their offline layout to improve overall performance and efficiency.
Companies with fragile operations will be hit harder, while high-margin categories and
companies that have deployed online business in advance will calmly respond. Strong brand
platforms take the opportunity to expand market share and grab customers, talents, stores,
suppliers and other resources of small, medium and micro enterprises; At the same time,
accelerate the acquisition and integration of small chain and independent brand stores in a
platform-based model; upstream and downstream jointly build a collaborative and symbiotic
digital ecosystem, and build alliances between shopping malls and merchants, consumer goods
suppliers and channels to jointly fight the epidemic. While the development of each sub-category
industry presents a strong Matthew effect and the strong will remain strong, the competitive
landscape in the sub-industry will intensify differentiation. Competition is no longer a
competition between individual companies, but companies join the collaborative alliance
ecosystem While building a symbiotic relationship within the system, a legion-style and
systematic competition is formed between the ecosystems.
Barriers to rigid-need categories such as fresh food, daily miscellaneous items, etc., were
breached in the epidemic. After the elderly user groups become online, the basic area, awareness
and acceptance of community e-commerce users will be enlarged. The human settlement
infrastructure promoted by the urbanization process in China is Community e-commerce
provides the environmental foundation. Large supermarkets and O2O home service platforms
have jointly provided services to consumers during the epidemic. The success of the cooperation
model has been verified. New social channels such as WeChat have dividends, integrated supply
chain-supported cost-effective products, and communities. The good delivery experience of the
market, the low operating cost of the pre-sale model, and the large-scale reproducibility will
prompt community e-commerce to be concentrated after this year. At the same time, the
involvement of capital will form a more intense competitive landscape in this field. Commercial
and residential properties, smart home appliances, O2O home services, supply chain platforms,
branded goods and service companies, and technology companies all expect to benefit from it.
8 Conclusion In this new era, the fast-moving consumer goods industry wants to survive and re-realize growth.
Need to establish a new value creation model to reshape the market structure. The core is to shift
from a simple focus on popular categories to a three-step product portfolio strategy. At the same
time, it is supplemented by agile operations to effectively support new strategic deployments,
and mergers and acquisitions are used as a key growth accelerator.
First, It is necessary to change the current strategy of focusing on developed markets and popular
brands to formulate product portfolios, and instead consider developed markets, developing
markets and high-end niche markets as three different sources of revenue.
Mature markets: Must maintain a high level of profit and continuously promote the growth of
core business. At the same time, sales strategies need to be considered to avoid potential channel
conflicts. In addition, data analysis and e-commerce should be used to improve execution
quality.
Developing market: The latest and best innovative products (not low-quality products) must be
brought to the developing market as soon as possible, and the market opportunity of 11 trillion
US dollars must be seized in time. The key to success lies in excellent digital execution
capabilities and full delegation of authority to the local leadership team.
High-end niche market: It is necessary to discover and cultivate high-end niche markets that
already have economic attractiveness and high growth potential, and promote the explosive
growth of small brands through capitalization operations.
Secondly, Agile operations can effectively help fast-moving consumer goods companies solve
the challenges that exist in traditional operating models. The agile operation model consists of
two parts: an agile front-end (including various business assault teams that promote business
goals through cross-functional cooperation) and a solid back-end (providing the front-line team
with the ability to achieve goals, including expertise, data, technology, etc. ).
This new model requires companies to abandon the traditional command control model (that is,
to issue orders from top to bottom to the front line). The new organizational model consists of
multiple small teams, each of which focuses on a certain direction and has full autonomy. In this
model, the role of the leadership team has changed from the current command to empowerment
("service-oriented leadership"). In China, Internet companies such as Tencent and Ali are
undoubtedly the early beneficiaries of agile operations. FMCG companies such as Mengniu are
also actively exploring organizational changes and have benefited from it.
In addition, in the new model, companies still need to quickly establish new sources of income
through mergers and acquisitions.
Finally, Consumers need more and more cross-border and cross-border products, so companies
need to find the best resources in the industry to connect with each other. Some brands follow the
trend to launch digital smart stores, which not only demonstrates that brands conform to digital
trends, but can also cater to the acuity and execution of the younger generation of consumers.
The industry needs to use the Internet to connect and use digital methods to build an ecological
system. This kind of ecological system is to take the consumer as the center, rely on the core
resources of the enterprise, integrate various resources that meet the target consumption needs,
and establish an ecological enterprise system.
Reference 1. Amsaveni, R; Gomathi, S. “ Fundamental Analysis of Selected FMCG Companies”. Aisa –
Pacific Finance and Accounting Review; New Delhi Vol. 1, lss. 3, (Apr-Jun 2013): 37-55
2. Ksenijia Kuzmina, Sharon Prndeville, Dale Walker, Fiona Charnley. “ Future scenarios for fast-
moving consumer goods in a circular economy”. 2018 Published by Elsevier Ltd.
3. H Varasteh, J Delkhah, HR Yazdani. “ Explaining the Appropriate Marketing and Sales Strategies of
Companies ( Case Study: FMCG Industry). Journal of Business Management, 2019-jibm.ut.ac.ir
4. AK Sar – Academy of Accounting and Financial Studies. “ Competitive Advantage and
Performance: An Analysis of FMCG Industry”. 2018 – search.proquest.com.
5. Y Gong, E Putnam, W You, C Zhao. “ Investigation Into Circular Economy of Plastics: The case of
the UK Fast Moving Consumer Goods Industry”. Journal of Cleaner Production, 2020 – Elsevier
6. R Stewart, M Niero. “ Circular Economy in Corporate Sustainability Strategies: A Review of
Corporate Sustainability Reports In The FMCG Industry”. Business Strategy and the Environment,
2018 – Wiley Online Library.
7. E Jacobs, C Mafini. “ Business Performance in the FMCG Industry”. Journal of Transport and
Supply Chain, 2019 – Journals.co.za.
8. MAH van Elzakker, LKK Maia, IE Grossmann. “ Optimizing Environmental and Economic Impacts
in the FMCG”. Sustainable Production, 2017 – Elsevier.
9. FS Stanciu, FO Virlanuta, OA Vochin, RV Lonescu. “ FMCG Market in Romania Features and
Trend”. Economic – 2019 – ceeol.com.
10. Y Oraman, MO Azabagaoglu, IH Inan. “ The firms’ survival and competition through global
expansion: A case study from food industry in FMCG”. 2011- Elsevier.
11. “Global FMCG Market Opportunity Analysis, 2018-2019 & 2025-A Billion New Consumers in
Emerging Markets”. 2019 Publised.
12. T XU, J Shi. “ Strategy Analysis of FMCG Industry”. 2010 – en.cnki.com.cn.
13. P Lacy, J Long, E Spindler. “ Fast-Moving Consumer Goods (FMCG) Industry Profile”. The
Circular Economy Handbook – 2020 – Springer.
14. M Ali, M IIyas, CA Rehman. “ Centric Marketing Mix Elements On Consumer Buying Behavior of
FMCG Industry”. 2016 – arabianjbmr.com.
15. B Szczepaniak – Acta Universitatis Nicolai Copernici. “ Marketing Management in FMCG
Industry”. 2018 – search.proquest.com.
16. A Prima – 2019 IEEE 6th International Conference. “Feasibility Analysis of Implementing Logistic
Information System with Internet of Things Technology on FMCG Company. 2019 –
ieeexplore.oeee.org.
17. D Kucherov, E Zhiltsova. “ Social Media in Employer Branding in FMCG in Russia: Millennials’
Perspective”. Journal of East-West Business, 2020 – Taylor & Francis.
18. V Rizos, J Bryhn, M Alessi, A Campmas, A Zarra. “ Identifying the impact of the circular economy
on the FMCG Industry opportunities and challenges for businesses, workers and consumers”. 2019 –
aei.pitt.edu.
19. MI Hossain, MRH Polas, MM Rahman. “ An Exploration of Covid – 19 Pandemic and its
consuquences on FMCG Industry. 2020 – readersinsight.net.
20. S Singh – IUP Journal of Business Strategy. “ The impact of marketing variables on business
performance: An Analysis of FMCG, Consumer Durables and Textile Industries”. 2015 –
search.proquest.com.