Embed Size (px)
Citation preview

The Florida Legislature
Office of Economic and
Demographic Research
850.487.1402
http://edr.state.fl.us
Presented by:
Supplemental Materials:
Economic Analysis of PPACA
and Medicaid Expansion
Select Committees on Patient Protection and
Affordable Care Act
March 4, 2013
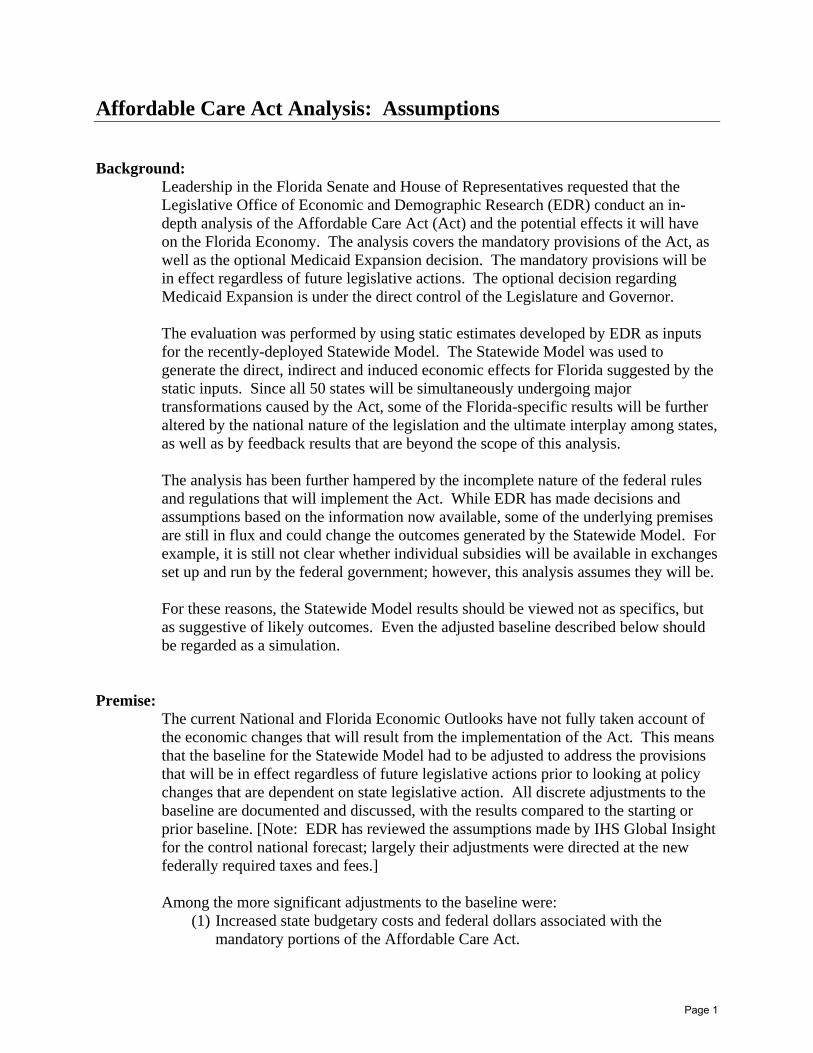
Affordable Care Act Analysis: Assumptions Background:
Leadership in the Florida Senate and House of Representatives requested that the Legislative Office of Economic and Demographic Research (EDR) conduct an in-depth analysis of the Affordable Care Act (Act) and the potential effects it will have on the Florida Economy. The analysis covers the mandatory provisions of the Act, as well as the optional Medicaid Expansion decision. The mandatory provisions will be in effect regardless of future legislative actions. The optional decision regarding Medicaid Expansion is under the direct control of the Legislature and Governor. The evaluation was performed by using static estimates developed by EDR as inputs for the recently-deployed Statewide Model. The Statewide Model was used to generate the direct, indirect and induced economic effects for Florida suggested by the static inputs. Since all 50 states will be simultaneously undergoing major transformations caused by the Act, some of the Florida-specific results will be further altered by the national nature of the legislation and the ultimate interplay among states, as well as by feedback results that are beyond the scope of this analysis. The analysis has been further hampered by the incomplete nature of the federal rules and regulations that will implement the Act. While EDR has made decisions and assumptions based on the information now available, some of the underlying premises are still in flux and could change the outcomes generated by the Statewide Model. For example, it is still not clear whether individual subsidies will be available in exchanges set up and run by the federal government; however, this analysis assumes they will be. For these reasons, the Statewide Model results should be viewed not as specifics, but as suggestive of likely outcomes. Even the adjusted baseline described below should be regarded as a simulation.
Premise:
The current National and Florida Economic Outlooks have not fully taken account of the economic changes that will result from the implementation of the Act. This means that the baseline for the Statewide Model had to be adjusted to address the provisions that will be in effect regardless of future legislative actions prior to looking at policy changes that are dependent on state legislative action. All discrete adjustments to the baseline are documented and discussed, with the results compared to the starting or prior baseline. [Note: EDR has reviewed the assumptions made by IHS Global Insight for the control national forecast; largely their adjustments were directed at the new federally required taxes and fees.]
Among the more significant adjustments to the baseline were:
(1) Increased state budgetary costs and federal dollars associated with the mandatory portions of the Affordable Care Act.
Page 1

a. Primary Care Practitioners Fee Increase to Medicare Rate—an increase in the state budget by the amount of anticipated federal dollars; the increase in state budget is then directed to providers in the ambulatory area without a commensurate increase in services.
i. Level pulled from the AHCA 12/12 Response (with state costs converted to federal: $349.4 million in FY 2012-13; $698.8 million in 2013-14; and $349.4 million in FY 2014-15.
b. Health Insurance Tax Impact on Medicaid Managed Care—as the new tax effectively increases managed care rates within the existing Medicaid Program, the cost will be split between increased federal reimbursements and realignment within the state budget to provide the required match. The increased federal reimbursements will effectively offset a portion of the dollars leaving the state to pay the initial tax.
i. Level pulled from the AHCA 12/12 Response (state costs range from $13.1 million in FY 2013-14 to $192.5 million in FY 2022-23.
c. The cost of implementing the Exchange and its effect on eligibility determinations are indeterminate.
(2) Increased insurance coverage associated with the mandatory portions of the Act resulting in a greater number of traditional insurance policies, self-insured programs and richer benefits, as well as the knock-on effects from overall increased demand for healthcare from the entire population of uninsured.
a. Increased demand for healthcare services resulting from uninsured becoming insured: Increased Demand = # of Uninsured x Policy Cost
i. In the PUMS data, 1,442,014 persons will receive policy coverage and 727,972 persons will fall under a self-insured program for a total of 2,169,986 uninsured persons becoming insured. These numbers are translated into percentages of the population and then allowed to grow over time as part the overall population growth within those shares.
1. Applied four-year ramp-up period: 40%, 60%, 80% and 100%.
2. Included aliens and the potential Medicaid Expansion population.
3. Made a 10% adjustment for the non-compliant portion of the tax base (referred to generally as “non-filers”) in any given year.
4. Made discrete assumptions based on age, employment status, size and type of employer, and income.
ii. For policy coverage, assumed new premium of $6,157 in base year (preliminary data from OIR). This assumption was developed by taking into account the following: 70% actuarial value of the silver plan; trend growth; reinsurance subsidy; guaranteed issue feature of the contract; new fees related to the Act; area factor average reduction; and essential health benefits requirement. In essence, the policy premiums initially increase
Page 2

by 25% to comply with the new law and then grow at one-half the rate they otherwise would have in the baseline. This result reflects the dual effects from the upward pressure on policy premiums associated with the “richer” benefit package and the downward effects from better health outcomes.
iii. Applied a scalar to the premium cost to reflect non-direct healthcare expenditures retained by insurance companies (based on EDR research: 18% non-health; 82% health). This non-health portion does not increase final demand for health services.
iv. Recognized the out-of-pocket healthcare spending today by the uninsured that will convert to spending on copayments, deductibles and incidentals: $583 per uninsured person that becomes covered (Health Affairs spending table).
v. Downwardly adjusted increased demand by the amount of today’s uncompensated care that will shift to the newly insured (whether through self-insurance programs or private coverage). Assumed $536 per newly insured person = $1.16 billion (Health Affairs spending table).
1. Assumed Disproportionate Share reductions will be largely offset by the shift from uncompensated care to newly insured care, resulting in no overall loss in spending.
2. Used “Estimated Total Uncompensated Care” as reported in the 2011 Florida Hospital Uniform Reporting System (FHURS): $2.6 billion. Insured care will reduce this amount by $1.2 billion, leaving a remaining level of uncompensated care of $1.4 billion and freeing the resources previously directed to the $1.2 billion.
3. Florida’s federal Disproportionate Share allocation has ranged from $188.3 million to $206.6 million.
vi. Developed separate estimates related to the treatment of federal “subsidies” for individuals and tax credits for small businesses.
1. Assumed individual subsidies will be limited to the non-working population with incomes greater than 100% and less than 400%.
2. Assumed business tax credits will be limited to entities with less than 25 employees—and that they will be further constrained by the amount of liability present within any given year.
vii. In regard to incidence, assumed that: 1. Premium policy costs for non-working individuals are
entirely absorbed by households.
Page 3

2. Premium policy costs for employees initially hit businesses, but households absorb 100% of the cost in the long-run.
3. Self-insurance programs are a complete cost-shift from today’s spending by households to businesses due to the lower requirements for self-insurance programs.
viii. There is also an increased demand for health services associated with the richer benefit packages required for existing policy-holders. Based on OIR preliminary data, a 25% mark-up is expected on the average policy premium costs today (from $5,177 to $6,465).
1. Some existing policy-holders are non-employed and pay for insurance out-of-pocket. A portion of this group is eligible for individual subsidies.
2. Some of the small firms providing insurance today are eligible for the tax credits.
ix. Woodworking (the entry of individuals who are currently eligible for the Medicaid or CHIP programs but not enrolled) is indeterminate as adopted by Social Services Estimating Conference (SSEC).
b. Insurance Premium Tax value is added to state revenues, which increases the size of the overall budget expenditure on the generic market basket of goods.
c. The business value associated with increased utility / productivity from better healthcare (reduced sick days, average workweek hours increased, and improved health) is indeterminate.
d. Effects from employers altering their practices regarding the provision of insurance (moving to self-funded pools to a greater extent than the historic trend, eliminating coverage altogether or reducing the scope of health benefits) are indeterminate and excluded from the baseline analysis. Similarly, the extent to which businesses scale back or eliminate coverage but increase wages is deemed indeterminate.
(3) The loss of Florida discretionary income and/or increases to business costs to pay increased federal taxes and fees required by the Affordable Care Act, as well as the dead-weight loss of penalties and the excise taxes on “Cadillac” insurance plans:
a. Individual penalties assumptions: i. Medicaid Expansion population is exempt from penalties due
to the blanket “hardship” exemption provided by HHS. In addition, the general threshold for the requirement to pay federal income taxes is within the Medicaid Expansion population group.
ii. The permanent penalties will be incurred only by the following:
1. Non-working adults—all of those 25 and younger, and 10% of those 26 and older (essentially the non-filers).
Page 4

2. 10% of the self-employed (essentially the non-filers). 3. The children associated with the above groups (10% of
all children). Moreover, only 50% of the non-filers will be identified within any given year and have to pay the penalty (including any back penalties).
iii. Temporary or time-limited penalties are assigned to certain individuals during the ramp-up period (1 minus the ramp-up period percentages). They will become compliant over time.
b. Business penalties assumption—Indeterminate i. Large firms will have total compliance due to competitive
pressures related to their brand images and recruitment needs. ii. Small firms are not subject to business penalties.
c. Existing policy-holders are assumed to have 100% compliance, meaning no penalties will apply.
d. Increased federal taxes and fees were adequately treated in the underlying National and Florida Economic Outlooks.
e. Changes associated with some plans being deemed “Cadillac” are indeterminate.
(4) The model endogenously handles the shifting between industry sectors from “all else” into healthcare, including the knock-on effects, to meet the new demand.
Scenarios (compared to adjusted baseline described above): The adjusted baseline can be considered the standard approach to modeling the Affordable Care Act “shock”, assuming everything works as designed without introducing atypical labor shortages, wage constraints or capacity issues. The alternative scenarios (#1 through #7) are provided to assess areas of potential risk or change and the impact they would have on the results; however, no attempt is made to gauge the likelihood of the alternative outcomes. [Note: In the presentation PowerPoint, the various scenarios are referred to as “risk simulations”.]
1. ADJUSTED BASELINE SCENARIO #1: Difference from the adjusted baseline after incorporating a barrier on additional healthcare workers moving into the state to fill jobs. [key features: potentially constrained infusion of federal dollars; no job-related migration]
2. ADJUSTED BASELINE SCENARIO #2: Difference from the adjusted baseline after assuming the uninsured today from the small business, self-employed, and non-working populations remain uninsured—meaning that those individuals originally buying policies instead pay penalties, as well as a complete erosion of existing insurance provision among small employers (1-50 employees, excluding self-employed)—meaning those employees move to individual coverage and the employers lose their tax credits. [key features: increased penalties; reduced Insurance Premium Tax collections; reduced federal tax credits]
Page 5

3. ADJUSTED BASELINE SCENARIO #3: Difference from the adjusted baseline after
assuming 25% entry rate for Woodworking. Woodworking values came from EDR. [key features: infusion of federal dollars; redirected state dollars]
4. ADJUSTED BASELINE SCENARIO #4: Difference from the adjusted baseline after
assuming that premium policy costs increase 50% from the existing blended level instead of the 25% assumed in the adjusted baseline, and that this higher level becomes the standard for all new policies. [key features: increased subsidies; increased Insurance Premium Tax]
5. ADJUSTED BASELINE SCENARIO #5 WITH MEDICAID EXPANSION: Difference from the adjusted baseline after incorporating the Medicaid Expansion coupled with an adjustment to assume 25% entry rate for Woodworking. Woodworking values came from EDR. The Medicaid Expansion values from the Social Services Estimating Conference have been updated to reflect new PUMS data and more recent “per member, per month” (PMPM) data. [key features: infusion of federal dollars; redirected state dollars; lower Insurance Premium Tax dollars due to the removal of the Medicaid Expansion and Crowd Out populations]
6. ADJUSTED BASELINE SCENARIO #6 WITH MEDICAID EXPANSION: Difference from the adjusted baseline after incorporating the Medicaid Expansion coupled with an adjustment to assume 25% entry rate for Woodworking and a barrier on additional healthcare workers moving into the state to fill jobs. Woodworking values came from EDR. The Medicaid Expansion values from the Social Services Estimating Conference have been updated to reflect new PUMS data and more recent PMPM data. [key features: infusion of federal dollars; redirected state dollars; lower Insurance Premium Tax dollars due to the removal of the Medicaid Expansion and Crowd Out populations; no job-related migration]
7. ADJUSTED BASELINE SCENARIO #7 WITH MEDICAID EXPANSION: Difference from the adjusted baseline after incorporating the Medicaid Expansion coupled with an adjustment to assume 25% entry rate for Woodworking and a 60% increase in the annual costs implied by the PMPM rates for the Medicaid Expansion and Woodworking entrants. Woodworking and increased Medicaid Expansion values came from EDR. [key features: infusion of federal dollars; redirected state dollars; lower Insurance Premium Tax dollars due to the removal of the Medicaid Expansion and Crowd Out populations]
8. BREAK-EVEN FUNDING ANALYSIS FOR MEDICAID EXPANSION: Incremental
federal funding adjustments to the scenario which incorporates the Medicaid Expansion with no other alterations (Scenario #5) to determine at what point the additional economic benefits are driven to zero. Loss of federal funds are offset through an equal infusion of state funds with overall budget reductions elsewhere. The selected welfare variable to measure the economic benefits is Domestic Consumption by Households and Government.
Page 6

9,671 46,926 92,869 12,762 21,234 571 37,185
689
25,893 129,527
0
100,000
200,000
300,000
400,000
500,000
600,000
700,000
0%
50%
100%
150%
200%
250%
Infants Children(Age 1-5)
Children(Age 6-18)
Children(Age 19-20)
Pregnant Women SSI Parents Childless AdultsAge 21+
Per
cen
t o
f Fe
der
al P
ove
rty
Leve
l
No Medicaid Expansion Scenario: Initial Population Base
138%
Bars: Labels: Blue: Medicaid enrolled Green: Mediciaid eligible, but not enrolled Yellow: CHIP Orange: CHIP eligible, but not enrolled
Source: US Census Bureau, 2009-11 3-year American Community Survey Public Use Microdata Sample
Page 7

Medicaid 221,218 58.6%
CHIP 156,109 41.4%
Eligible, but not Enrolled: No Expansion, Initial Population Base
Source: U.S. Census Bureau, 2009-11 3-year American Community Survey Public Use Microdata Sample
Total: 377,327
Page 8

Children Aged 0 to 18 149,466 67.6%
Adults Aged 19 and Over 71,752 32.4%
Eligible for Medicaid, but not Enrolled: Initial Population Base
Source: U.S. Census Bureau, 2009-11 3-year American Community Survey Public Use Microdata Sample
Total: 221,218
Page 9
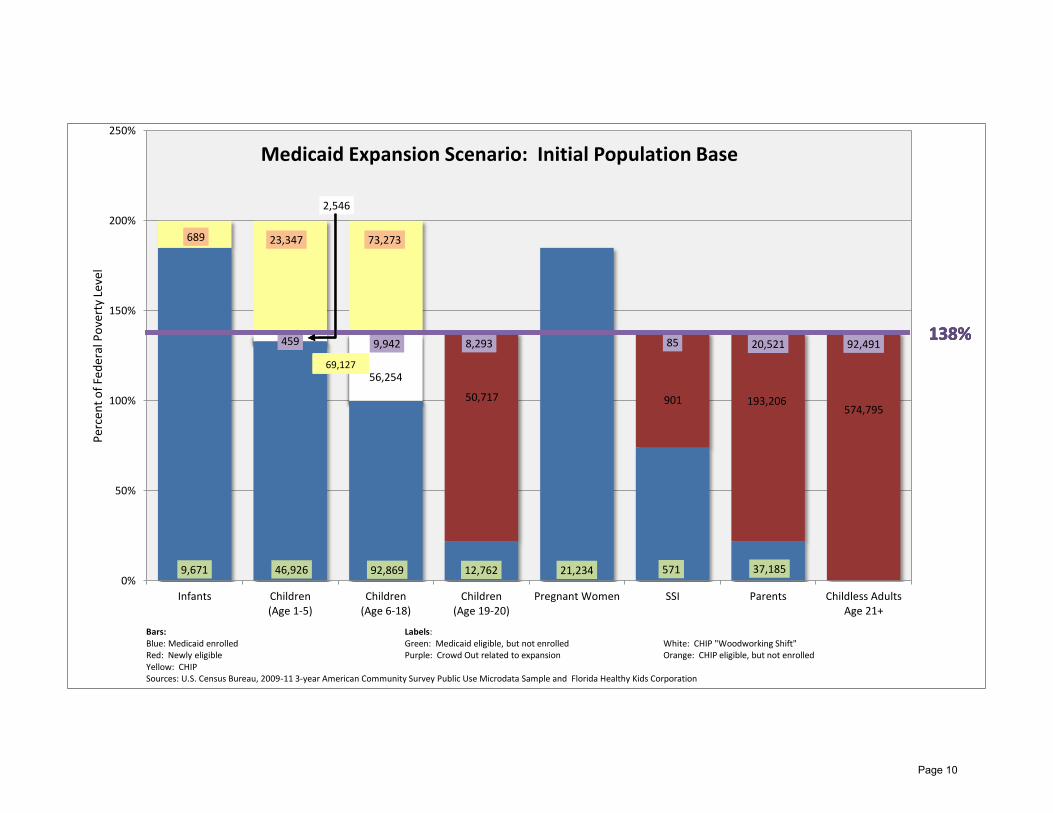
50,717 901 193,206 574,795
9,671 46,926 92,869 12,762 21,234 571 37,185
689 23,347 73,273
459 9,942 8,293 85 20,521 92,491
2,546
56,254
0
100,000
200,000
300,000
400,000
500,000
600,000
700,000
800,000
0%
50%
100%
150%
200%
250%
Infants Children(Age 1-5)
Children(Age 6-18)
Children(Age 19-20)
Pregnant Women SSI Parents Childless AdultsAge 21+
Per
cen
t o
f Fe
der
al P
ove
rty
Leve
l
Medicaid Expansion Scenario: Initial Population Base
138%
69,127
138%
Bars: Labels: Blue: Medicaid enrolled Green: Medicaid eligible, but not enrolled White: CHIP "Woodworking Shift" Red: Newly eligible Purple: Crowd Out related to expansion Orange: CHIP eligible, but not enrolled Yellow: CHIP Sources: U.S. Census Bureau, 2009-11 3-year American Community Survey Public Use Microdata Sample and Florida Healthy Kids Corporation
69,127
138%
69,127
138%
69,127
Page 10

Newly Eligible 819,619
75.9%
Crowd Out 131,791
12.2%
CHIP "Woodworking Shift" 58,800
5.4%
CHIP Transfer 69,127 6.4%
Medicaid Expansion Components: Initial Population Base
Sources: U.S. Census Bureau, 2009-11 3-year American Community Survey Public Use Microdata Sample and Florida Healthy Kids Corporation
Total: 1,079,337
Page 11

Children Aged 0 to 18 138,328 12.8%
Adults Aged 19 and Over 941,009 87.2%
Medicaid Expansion Impact: Initial Population Base
Sources: U.S. Census Bureau, 2009-11 3-year American Community Survey Public Use Microdata Sample and Florida Healthy Kids Corporation
Total: 1,079,337
Note: 92.5% of Children Aged 0 to 18 are from CHIP (includes enrolled and those eligible, but not enrolled)
Page 12

Newly Insured and Uninsured Percent of Current Uninsured*
Adjusted Baseline with Woodworking**
Adjusted Baseline with Woodworking**
and Medicaid Expansion
14.0%
18.0%
6.6%
15.1%
1.0% 1.4%
44.0%
Small & Large Business Employees,excluding Self-Funded
Self-Funded Small & LargeBusiness Employees
Self-Employed
Non-Working
CHIP Woodworking
Medicaid Woodworking
Medicaid, Newly Enrolled
Remain Uninsured
Newly Insured by Origin 11.0%
14.1%
5.1%
14.7%
0.6%
0.4% 1.4%
16.2%
36.5%
Small & Large BusinessEmployees, excluding Self-FundedSelf-Funded Small & LargeBusiness Employees
Self-Employed
Non-Working
Remaining CHIP Woodworking
CHIP "Woodworking Shift"
Medicaid Woodworking
Medicaid, Newly Enrolled
Remain Uninsured
Newly Insured by Origin
*4,040,731 ** Woodworking are individuals that are currently eligible but not enrolled
Page 13