Embed Size (px)
Citation preview
ECONOMIC ANALYSIS OF MALNUTRITION AND
PRESSURE ULCERS IN QUEENSLAND HOSPITALS
AND RESIDENTIAL AGED CARE FACILITIES
Merrilyn D Banks
BSc, Grad Dip Ed, Grad Dip Nutr & Diet, M Hlth Sc
Thesis submitted for the degree of
Doctor of Philosophy
Institute of Health and Biomedical Innovation
School of Public Health
Queensland University of Technology
June 2008

ii
Key Words
malnutrition, pressure ulcers, nutritional status, economic analysis, nutrition
intervention
iii
Abstract
Malnutrition is reported to be common in hospitals (10-60%), residential aged
care facilities (up to 50% or more) and in free living individuals with severe or
multiple disease (>10%) (Stratton et al., 2003). Published Australian studies
indicate similar results (Beck et al., 2001, Ferguson et al., 1997, Lazarus and
Hamlyn, 2005, Middleton et al., 2001, Visvanathan et al., 2003), but are
generally limited in number, with none conducted across multiple centres or in
residential aged care facilities. In Australia, there is a general lack of
awareness and recognition of the problem of malnutrition, with currently no
policy, standards or guidelines related to the identification, prevention and
treatment of malnutrition.
Malnutrition has been found to be associated with the development of pressure
ulcers, but studies are limited. The consequences of the development of
pressure ulcers include pain and discomfort for the patient, and considerable
costs associated with treatment and increased length of stay. Pressure ulcers
are considered largely preventable, and the demand for the establishment of
appropriate policy, standards and guidelines regarding pressure ulcers has
recently become important because the incidence and prevalence of pressure
ulcers is increasingly being considered a parameter of quality of care.
The aims of this study program were to firstly determine the prevalence of
malnutrition and its association with pressure ulcers in Queensland Health
hospitals and residential aged care facilities; and secondly to estimate the
potential economic consequences of malnutrition by determining the costs
arising from pressure ulcer attributable to malnutrition; and the economic
outcomes of an intervention to address malnutrition in the prevention of
pressure ulcers. The study program was conducted in two phases: an
epidemiological study phase and an economic modelling study phase.
In phase one, a multi centre, cross sectional audit of a convenience sample of
subjects was carried out as part of a larger audit of pressure ulcers in
iv
Queensland public acute and residential aged care facilities in 2002 and again
in 2003. Dietitians in 20 hospitals and six aged care facilities conducted single
day nutritional status audits of 2208 acute and 839 aged care subjects using
the Subjective Global Assessment, in either or both audits. Subjects excluded
were obstetric, same day, paediatric and mental health patients. Weighted
average proportions of nutritional status categories for acute and residential
aged care facilities across the two audits were determined and compared. The
effects of gender, age, facility location and medical specialty on malnutrition
were determined via logistic regression. The effect of nutritional status on the
presence of pressure ulcer was also determined via logistic regression.
Logistic regression analyses were carried out using an analysis of correlated
data approach with SUDAAN statistical package (Research Triangle Institute,
USA) to account for the potential clustering effect of different facilities in the
model.
In phase two, an exploratory economic modelling framework was used to
estimate the number of cases of pressure ulcer, total bed days lost to pressure
ulcer and the economic cost of these lost bed days which could be attributed to
malnutrition in Queensland public hospitals in 2002/2003. Data was obtained
on the number of relevant separations, the incidence rate of pressure ulcer, the
independent effect of pressure ulcers on length of stay, the cost of a bed day,
and the attributable fraction of malnutrition in the development of pressure
ulcers determined using the prevalence of malnutrition, the incidence rate of
developing a pressure ulcer and the odds risk of developing a pressure ulcer
when malnourished (as determined previously). A probabilistic sensitivity
analysis approach was undertaken whereby probability distributions to the
specified ranges for the key input parameters were assigned and 1000 Monte
Carlo samples made from the input parameters.
In an extension of the above model, an economic modelling framework was
also used to predict the number of cases of pressure ulcer avoided, number of
bed days not lost to pressure ulcer and economic costs if an intensive nutrition
support intervention was provided to all nutritionally at risk patients in
Queensland public hospitals in 2002/2003 compared to standard care. In
v
addition to the above input parameters, data was obtained on the change in risk
in developing a pressure ulcer associated with an intensive nutrition support
intervention compared to standard care. The annual monetary cost of the
provision of an intensive nutrition support intervention to at risk patients was
modelled at a cost of AU$ 3.8-$5.4 million for additional food and nutritional
supplements and staffing resources to assist patients with nutritional intake. A
probabilistic sensitivity analysis approach was again taken.
A mean of 34.7 + 4.0% and 31.4 + 9.5% of acute subjects and a median of
50.0% and 49.2% of residents of aged care facilities were found to be
malnourished in Audits 1 and 2, respectively. Variables found to be
significantly associated with an increased odds risk of malnutrition included:
older age groups, metropolitan location of facility and medical specialty, in
particular oncology and critical care.
Malnutrition was found to be significantly associated with an increased odds
risk of having a pressure ulcer, with the odds risk increasing with severity of
malnutrition. In acute facilities moderate malnutrition had an odds risk of 2.2
(95% CI 1.6-3.0, p<0.001) and severe malnutrition had an odds risk of 4.8 (95%
CI 3.2-7.2, p<0.001) of having a pressure ulcer. The overall adjusted odds risk
of having a pressure ulcer when malnourished (total malnutrition) in an acute
facility was 2.6 (95% CI 1.8-3.5, p<0.001). In residential facilities, where the
audit results were presented separately, the same pattern applied with
moderate malnutrition having an odds risk of 1.7 (95% CI 1.2-2.2, p<0.001) and
2.0 (95% CI 1.5-2.8, p<0.001); and severe malnutrition having an odds risk of
2.8 (95% CI1.2-6.6, p=0.02) and 2.2 (95% CI 1.5-3.1, p<0.001), for Audits 1
and 2 respectively. There was no statistical difference between these odds risk
ratios between the audits. The overall adjusted odds risk of having a pressure
ulcer when malnourished (total malnutrition) in a residential aged care facility
was 1.9 (95% CI 1.3-2.7, p<0.001) and 2.0 (95% CI 1.5-2.7, p<0.001) for Audits
1 and 2 respectively. Being malnourished was also found to be significantly
associated with an increased odds risk of having a higher stage and higher
number of pressure ulcers, with the odds risk increasing with severity of
malnutrition.
vi
The economic model predicted a mean of 3666 (Standard deviation 555) cases
of pressure ulcer attributable to malnutrition out of a total mean of 11162
(Standard deviation 1210), or approximately 33%, in Queensland public acute
hospitals in 2002/2003. The mean number of bed days lost to pressure ulcer
that were attributable to malnutrition was predicted to be 16050, which
represents approximately 0.67% of total patient bed days in Queensland public
hospitals in 2002/2003. The corresponding mean economic costs of pressure
ulcer attributable to malnutrition in Queensland public acute hospitals in
2002/2003 were estimated to be almost AU$13 million, out of a total mean
estimated cost of pressure ulcer of AU$ 38 526 601.
In the extension of the economic model, the mean economic cost of the
implementation of an intensive nutrition support intervention was predicted to
be a negative value ( -AU$ 5.4 million) with a standard deviation of $AU3.9
million, and interquartile range of –AU$ 7.7 million to –AU$ 2.5 million. Overall
there were 951 of the 1000 re-samples where the economic cost is a negative
value. This means there was a 95% chance that implementing an intensive
nutrition support intervention was overall cost saving, due to reducing the cases
of pressure ulcer and hospital bed days lost to pressure ulcer.
This research program has demonstrated an independent association between
malnutrition and pressure ulcers, on a background of a high prevalence of
malnutrition, providing evidence to justify the elevation of malnutrition to a
safety and quality issue for Australian healthcare organisations, similarly to
pressure ulcers. In addition this research provides preliminary economic
evidence to justify the requirement for consideration of healthcare policy,
standards and guidelines regarding systems to identify, prevent and treat
malnutrition, at least in the case of pressure ulcers in Australia.
vii
List of related Publications and Presentations
Refereed Journal Articles
Banks M , Ash S, Bauer J, Gaskill D. Prevalence of malnutrition in adults in Queensland public hospitals and residential aged care facilities. Nutrition & Dietetics. 2007, 64; 172-178
Vivanti A & Banks M . Hospital patients are admitted longer than hospital averages indicate – implications for patient nutrition and food services. Australian Health Review 2007, 31: 282-287 Refereed conference abstracts – accepted for presen tation Banks M, Ash S, Bauer J, Graves N. Cost effectiveness of nutrition support in the prevention of pressure ulcers in Australian Hospitals. Institute Health and Biomedical Innovation Postgraduate Student Research Conference. November 2007 Banks M, Ash S, Bauer J, Graves N. Cost effectiveness of nutrition support in the prevention of pressure ulcers in Australian Hospitals. Australian Gastroenterology Week. October 2007. Perth Banks M , Ash S, Bauer J, Graves N. Malnutrition and pressure ulcer risk in Australian hospitals. 29th European Society for Clinical Nutrition and Metabolism (ESPEN) Congress. Prague, Czech Republic. September 2007 (Clinical Nutrition 2: supp 2 9: O015) Ranked 13/482 abstracts and awarded an Outstanding Abstract. Invited to write full article for fast track publication and entry for an award, by journal: Nutrition Refereed conference abstracts – accepted for poster s Banks M , Ash S, Bauer J, Graves N. Malnutrition and pressure ulcer risk in Australian hospitals. Institute Health and Biomedical Innovation Postgraduate Student Research Conference. November 2007 Banks M, Ash S, Bauer J, Graves N. Costs of malnutrition in the development of pressure ulcers in Australian Hospitals. Institute Health and Biomedical Innovation Postgraduate Student Research Conference. November 2007 Banks M, Ash S, Bauer J, Graves N. Costs of malnutrition in the development of pressure ulcers in Australian Hospitals. Australian Gastroenterology Week. October 2007. Perth. Banks M, Ash S, Bauer J, Graves N. Costs of malnutrition in the development of pressure ulcers in Australian Hospitals. 29th European Society for Clinical
viii
Nutrition and Metabolism (ESPEN) Congress. Prague, Czech Republic. September 2007 (Clinical Nutrition vol 2: supp 2 133: P266) Ranked 15/482 abstracts and awarded an Outstanding Abstract. Invited conference speaker Banks M. The skeleton in the Closet: Where are we with Malnutrition in 2007? Australian Gastroenterology Week October 2007. Perth Banks M. Malnutrition in hospitalized patients and what are we doing about it? Royal Brisbane & Women’s Hospital Symposium. 2007 Banks M . What is the cost of nutrition in the prevention and treatment of pressure ulcers? Queensland Wound Care Association Biennial Conference. September 2007 Banks M . Nutrition and Pressure Ulcers – does it make a difference? Royal Brisbane and Women’s Hospital Symposium. 2006 Banks M , Malnutrition Doubles the risk of Pressure Ulcers. Queensland Pressure Ulcer Prevention Collaborative Launch. May 2006 Banks M , Is nutritional screening necessary in Australian hospitals? Australian Society of Parenteral and Enteral Nutrition Annual Scientific Meeting, as part of Australian Gastroenterology Week. Brisbane October 2005 Banks M , Malnutrition doubles the risk of Pressure Ulcers. Better Practice 2005. The Aged Care Standards and Accreditation Conference. Brisbane September 2005 Banks M , Malnutrition and Pressure Ulcers. Geriatric – Beyond the Boundaries Conference. Brisbane September 2005 Banks M , Malnutrition and Pressure Ulcers – DAA (Qld) Professional Development Day. Brisbane 2003
Workshop Presentaton/ Facilitation Watterson C, Fraser A, Banks M , Bare M, Scott E. Establishing Best Practice Processes for Malnutrition Across the Continuum of Care. Half day workshop. Dietitians Association of Australia 24th National Conference. Sydney 2006 Cassar A, Banks M , Bauer J. Nutrition and Pressure Ulcers Workshop Dietitians Association of Australia, 23rd National Conference. Perth 2005 Malnutrition screening and assessment workshops – invited to present Dietitians Association of Australian (Victoria) – 2007 Royal Hobart Hospital – 2006 Abbott Australia Conference Sydney, 2004 Northern Rivers (NSW) Dietitians Group. Murwillumbah 2004
ix
Table of Contents
Key Words ii Abstract iii List of Relevant Publications and Presentations vii Table of Contents ix List of Tables xiii List of Figures xv List of Abbreviations xvi Statement of Original Authorship xviii Acknowledgements xix Chapter 1 BACKGROUND/ OVERVIEW 1 Chapter 2 LITERATURE REVIEW 1 2.0 Introduction 3 2.1 Malnutrition – Definitions and Classication 4 2.2 Prevalence of malnutrition 5 2.3 Causes of malnutrition 26 2.3.1 Aetiology 26 2.3.2 Failure to recognize, reduce the incidence and treat malnutrition 27 2.3.3 Inadequate nutrition and food service systems 32 2.4 Consequences of malnutrition 35 2.4.1 Morbidity and mortality 35 2.4.2 Quality of life 36 2.4.3 Length of hospital stay 36 2.4.4 Admission and readmission to hospital 38 2.4.5 Economic cost of malnutrition 38 2.5 Prevention and treatment of malnutrition – Effects of nutrition Intervention 41 2.5.1 Reviews of nutrition support interventions for malnutrition 41 2.5.2 Reviewing the reviews of nutrition support interventions 46 2.5.3 Cost benefits of nutrition intervention for malnutrition 48 2.6 Nutrition assessment and nutrition screening 51 2.6.1 Nutrition assessment 51 2.6.2 Nutrition screening 56 2.7 Policy and practices for identification, prevention and treatment of malnutrition 58 2.8 Pressure ulcers – definitions and classification 60 2.9 Prevalence and incidence of pressure ulcers 61 2.9.1 Hospital/acute setting 74 2.9.2 Residential aged/ long term/ home care setting 75 2.10 Causes of pressure ulcer 75 2.10.1 Subject characteristics 76 2.10.2 Factors associated with developing pressure ulcers 78 2.11 Consequences of pressure ulcer 86 2.11.1 Morbidity and mortality 86 2.11.2 Quality of life 86
x
2.11.3 Length of hospital stay 86 2.11.4 Economic cost of pressure ulcers 87 2.12 Prevention and treatment of pressure ulcers 89 2.12.1 Prevention of pressure ulcers 90 2.12.2 Treatment of pressure ulcers 93 2.13 Policy and practices for identification, prevention and treatment of pressure ulcers 98 2.14 Economic evaluation in Healthcare Purpose of economic evaluation 101 2.15 Approaches to economic evaluation 102 2.15.1 Cost effectiveness analysis 102 2.15.2 Cost utility analysis 102 2.15.3 Cost benefit analysis 103 2.16 Costing analysis 103 2.16.1 Costing analysis of occupying a hospital bed 105 2.17 Effectiveness data for use in economic analysis 106 2.18 Allowing for uncertainty in the estimate of costs and consequences - sensitivity analysis 106 2.19 Incremental analysis of costs and consequences 108 2.20 Economic evaluation of nutritional status and nutrition interventions 110 2.21 Economic evaluation of pressure ulcers, and in the prevention and Treatment of pressure ulcers 111 2.22 Summary and limitations of current research 113 Chapter 3 AIMS, OBJECTIVES AND SIGNIFICANCE OF THE STUDY PROGRAM 115 3.1 Aims 115 3.2 Objectives and significance 115 Chapter 4 METHODS 118 4.1 Overview of approach for methods 118 4.2 The Epidemiological studies (Objectives 1 and 2) 118 4.2.1 Overview 118 4.2.2 Audit methodology 119 4.2.3 Nutritional status sample 119 4.2.4. Approval for the study 120 4.2.5 Variables 120 4.2.6 Determining if the sample was representative 123 4.2.7 Objective 1 analysis 124 4.3 Objective 2 Analysis 125 4.3.1 Data analysis methods 126 4.4 The Economic modelling studies (Objectives 3 and 4) 127 4.4.1 Objective 3 overview 127 4.4.2 Data required for model 128 4.4.3 The structure of the model 129 4.4.4 Sources of the input parameters 132 4.4.5 Allowing for uncertainty in the estimates of the input parameters 136 4.4.6 Model specification 137 4.4.7 Presentation of results 138
xi
4.5 Objective 4 4.5.1 Objective 4 – overview 139 4.5.2 Data required for the model 140 4.5.3 The structure of the model 141 4.5.4 Sources of the input parameters 143 4.5.5 Allowing for uncertainty in the estimates of the input parameters 148 4.5.6 Model specification 148 4.5.7 Presentation of results 149 Chapter 5 RESULTS – THE EPIDEMIOLOGICAL STUDIES - OBJECTIVES 1 AND 2 150 5.1 Study population 150 5.1.1 Representation of the study population 150 5.2 Objective 1 analysis 156 5.2.1 Prevalence of malnutrition in Queensland hospitals and residential aged care facilities 156 5.2.2 Effect of independent variables on the presence of malnutrition 158 5.3 Objective 2 analysis 161 5.3.1 Effect of nutritional status on the presence of pressure ulcers 161 5.3.2 Effect of nutritional status on the stages of pressure ulcers 167 5.3.3 Effect of nutritional status on the number of pressure ulcers 170 Chapter 6 RESULTS – THE ECONOMIC MODELLING STUDIES OBJECTIVES 3 AND 4 173 6.1 Objective 3 173 6.1.1 Values for the model input parameters 173 6.1.2 Model output distribution results 177 6.2 Objective 4 180 6.2.1 Values for the model input parameters 180 6.2.2 Model output distribution results 182 Chapter 7 DISCUSSION, STRENGTHS, LIMITATIONS, CONCLUSIONS AND RECOMMENDATIONS 185 7.1 Overview of chapter 185 7.2 Discussion of study aims and objectives findings 186 7.2.1 Objective 1: 186 Prevalence of malnutrition 186 Effect of variables on the presence of malnutrition 189 Comparison of prevalence of malnutrition between Audits 1 and 2 191 Has anything changed since the 1970s? 192 7.2.2 Objective 2: 194 Nutritional status and the presence of pressure ulcers 194 Nutritional status and the stage and numbers of pressure ulcers 195 Comparison of the effect of nutritional status on the presence of pressure ulcers between Audit 1 and 2 196
xii
Nutrition intervention and pressure ulcers 197 7.2.3 Objective 3 199 7.2.4 Objective 4 202 7.3 Implications of this research for policy and standards of care 207 Pressure ulcer policy, standards and guidelines 207 Malnutrition policy, standards and guidelines 208 Nutrition risk screening 214 Nutrition in pressure ulcer policy and guidelines 216 7.4 Why is there a lack of strong evidence for nutrition intervention 217 7.5 Strengths and limitations of this research 221 7.6 Conclusions and contributions to knowledge 226 7.7 Recommendations for practice 228 7.8 Recommendations for future research 230 Chapter 8 REFERENCES 231 Chapter 9 APPENDICES 250 Appendix 1 Summary of the most commonly referenced nutrition screening tools 251 Appendix 2 Visual Basic Language used to make 1000 Monte Carlo resamples from input parameters 256 Appendix 3 Graphs of input distributions 257 Appendix 4 Extra nutrition/ dietetic staffing resources to ensure a minimum benchmarked level of staffing 261 Appendix 5 Manuscripts and peer reviewed conference abstracts related to thesis 262
xiii
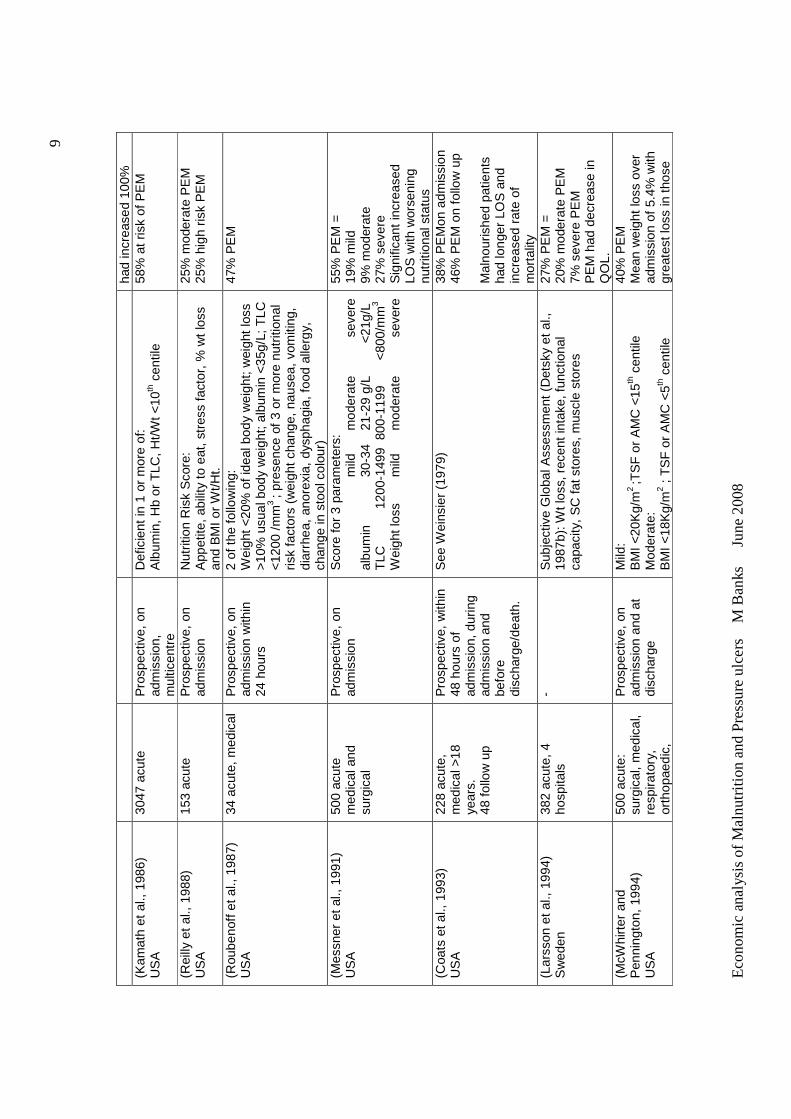
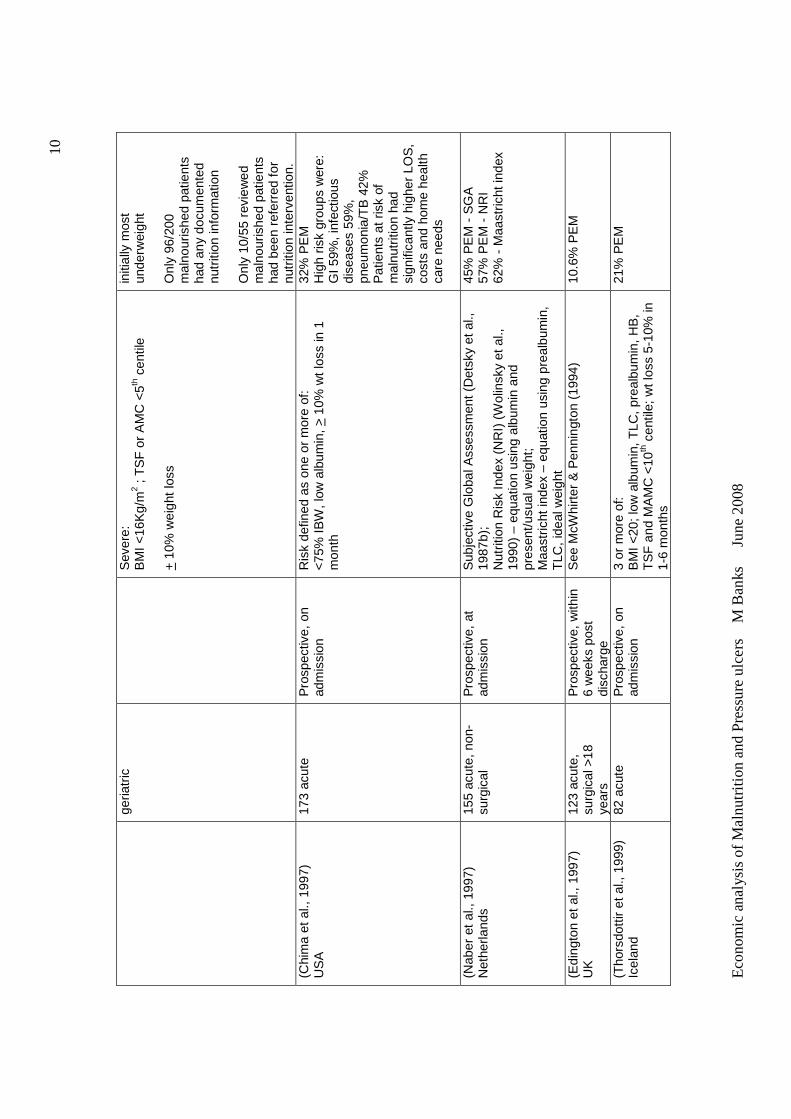
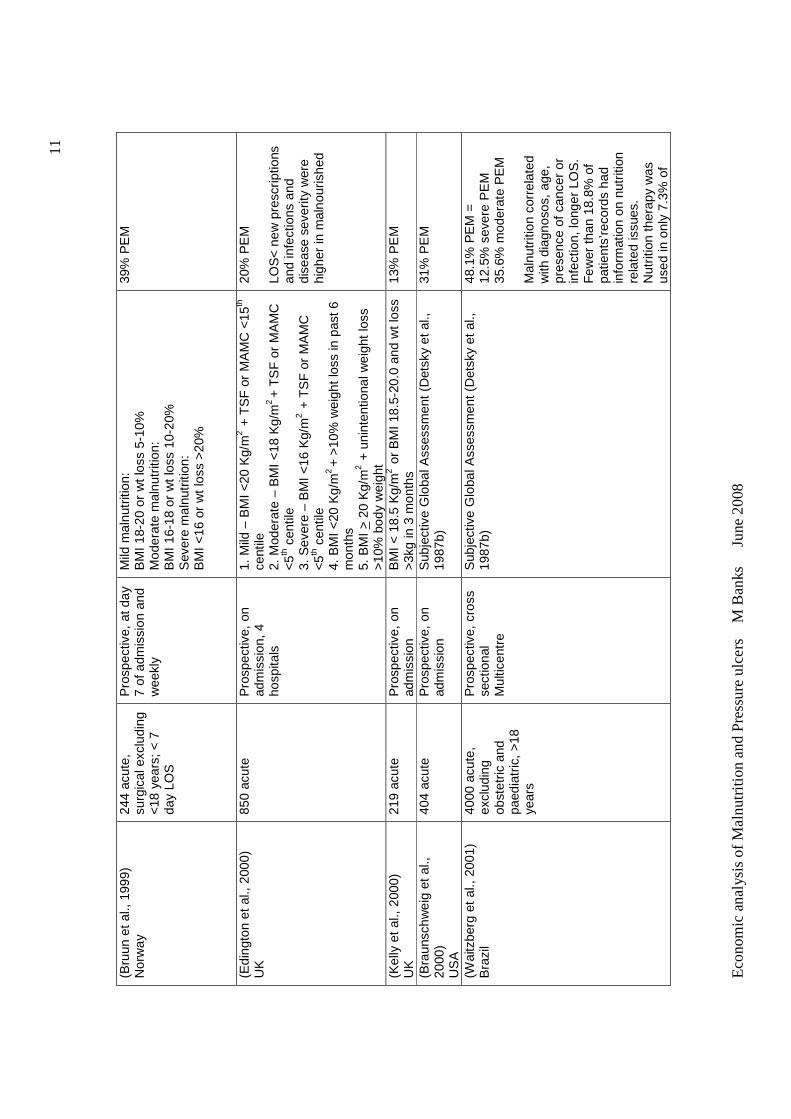
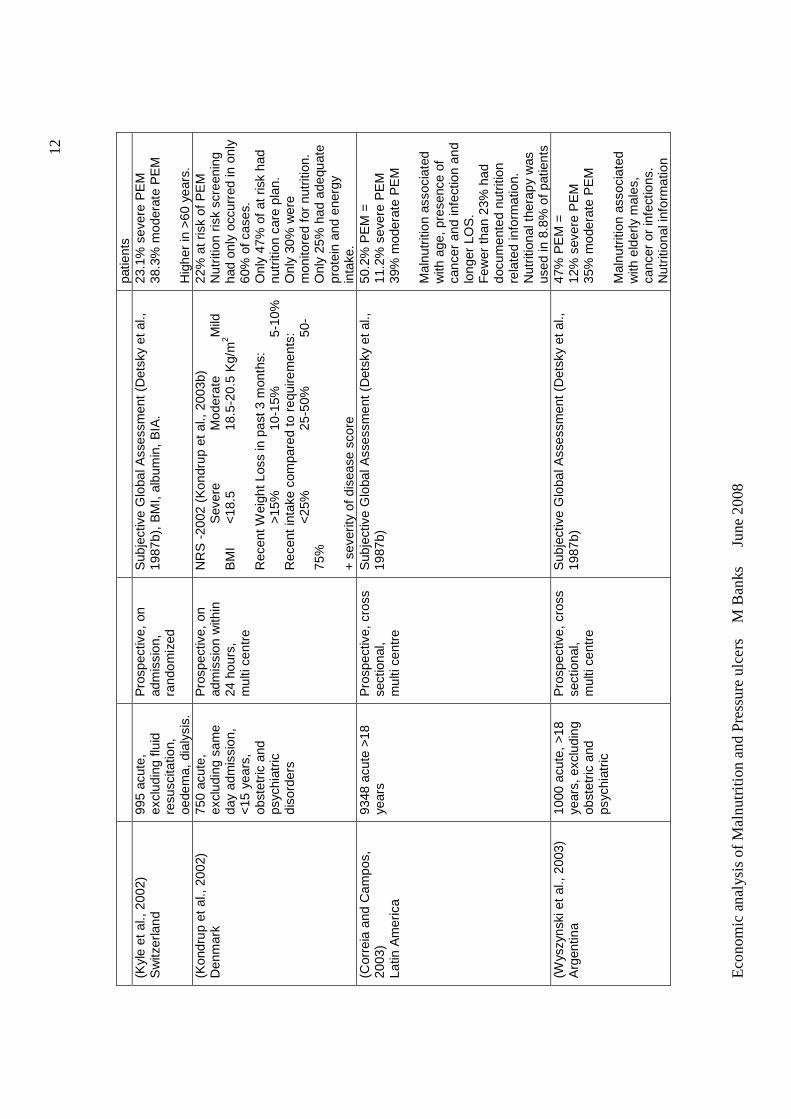
List of Tables Table 2.1 Summary of overseas studies of the prevalence of malnutrition
in adults………………………………………………………………………… 7
Table 2.2 Summary of Australian studies of the prevalence of malnutrition in
adults…………………………………………………………………………… 18
Table 2.3 Comparison of studies of prevalence of malnutrition in acute
hospital inpatients of mixed diagnoses, according to Subjective Global
Assessment (SGA)………………………………………………………… 24
Table 2.4 Number of nutrition intervention trials with positive effects or no
effect in patients with chronic non-malignant disorders…………………… 42
Table 2.5 Summary of overseas studies of prevalence and/or incidence of
pressure ulcers……………………………………………………………….. 62
Table 2.6 Summary of Australian studies of prevalence and/or incidence of
pressure ulcers……………………………………………………………….. 72
Table 2.7 Results of studies which demonstrated independent
associations for nutrition related factors with multivariable logistic
regression analyses………………………………………………………… 82
Table 4.1 Prevalence of pressure ulcer by nutritional status in Queensland
public hospitals – two by two table layout…………………………………… 135
Table 5.1 Nutritional status audit sample and the proportional
representation of: the pressure ulcer audit sample; the daily average
number of public occupied hospital beds in facilities where nutritional
status audits were conducted; and total daily average occupied public
hospital beds for all facilities in Queensland in 2002/2003……………….. 151
Table 5.2 Demographic variables for subjects in the nutritional status audit
sample for acute facilities………………………………………………….. 154
Table 5.3 Demographic variables for subjects in the nutritional status audit
sample for residential aged care facilities……………………………………. 155
Table 5.4. Weighted average proportions of nutritional status categories
according to SGA across facilities at Audit 1 and 2………………………… 157
Table 5.5 Multivariable relationships of variables on malnutrition for public
hospitals and residential aged care facilities in Queensland……………… 160
Table 5.6 Bivariate relationships between various parameters on the
xiv
presence of pressure ulcers for public hospitals and residential aged care
facilities in Queensland………………………………………………………. 162
Table 5.7 Adjusted odds ratio of effect of nutritional status on the presence of
pressure ulcers in Queensland public hospitals and residential aged care
facilities………………………………………………………………………….. 166
Table 5.8 Adjusted odds ratio of effect of nutritional status on stages of
pressure ulcers in Queensland public hospitals …………………………… 168
Table 5.9 Adjusted odds ratio of effect of nutritional status on stages of
pressure ulcers in Queensland public residential aged care facilities…… 169
Table 5.10 Adjusted odds ratio of the effect of nutritional status on the
number of pressure ulcers in Queensland public hospitals………………. 171
Table 5.11 Adjusted odds ratio of the effect of nutritional status on the
number of pressure ulcers in Queensland public residential aged care
facilities…………………………………………………………………………. 172
Table 6.1 Prevalence of pressure ulcer by nutritional status in Queensland
public hospitals – 2002 and 2003 pooled data…………………………….. 174
Table 6.2 Predicted mean, variance and range values for the number of
cases, bed days lost to pressure ulcers, and economic costs of pressure
ulcers in total and attributable to malnutrition in Queensland public acute
hospitals 2002/2003…………………………………………………………… 177
Table 6.3 Costing model of provision of an intensive nutrition support
intervention in Queensland public hospitals in 2002/2003………………... 182
Table 6.4 Predicted mean, variance and range values for the number of
cases of pressure ulcer avoided, bed days not lost and economic costs
with an intensive nutrition support intervention for at risk patients for
Queensland public hospitals in 2002/2003…………………………………. 182
xv
List of Figures
Figure 2.1 Staging classification of Pressure Ulcers …………………… 61
Figure 2.2 Pressure ulcer development model…..................................... 79
Figure 2.3 Role of malnutrition in the development of pressure ulcers….. 84
Figure 2.4 Prevention of pressure ulcers in at risk patients following
nutritional support versus routine (standard) care: a meta-analysis.. 94
Figure 2.5 Cost effectiveness plane……………………………………… 109
Figure 4.1 Diagrammatic representation of the model to predict the costs
arising from pressure ulcers in the Queensland public hospital population
in 2002/2003……………………………………………………………………. 131
Figure 4.2 Diagrammatic representation of the model to predict the economic
outcomes if an intensive nutrition support intervention was provided to all
nutritionally at risk patients in the Queensland public hospital population in
2002/2003, compared to standard care………………………………….. 143
Figure 6.1 Calculation of unadjusted Relative Risk of having a pressure ulcer
when malnourished……………………………………………………………. 175
Figure 6.2 Calculations for predicting the attributable fraction of malnutrition in
the development of pressure ulcers…………………………………………. 175
Figure 6.3 Calculation of attributable fraction of malnutrition in the development
of pressure ulcers using Levin’s formula……………………………………. 176
Figure 6.4 Histogram of output for ‘Cases of pressure ulcer attributable to
malnutrition’ in Queensland public acute hospitals 2002/2003…………… 178
Figure 6.5 Histogram of output for ‘Bed days lost to pressure ulcer attributable
to malnutrition’ in Queensland public acute hospitals 2002/2003………… 178
Figure 6.6 Histogram for the output ‘ Economic cost of pressure ulcer
attributable to malnutrition’ in Queensland public acute hospitals
2002/2003……………………………………………………………………….. 179
Figure 6.7 Cases of pressure ulcer avoided versus economic cost ……… 183
Figure 6.8 Bed days not lost to pressure ulcer versus economic cost……. 184
xvi
List of Abbreviations
AMC arm muscle circumference
BMI body mass index
CABG coronary artery bypass graft
CBA cost benefit analysis
CEA cost effectiveness analysis
CHI creatinine height index
CI confidence interval
COAD chronic obstructive airways disease
CUA cost utility analysis
DCH delayed cutaneous hypersensitivity
DM Deutch mark
DRG diagnosis related group
EUR Euro dollars
GP general practitioner
Hb haemoglobin
Hct haematocrit
Ht height
LOM likelihood of malnutrition
LOS length of stay
MAMC mid arm muscle circumference
MNA Mini Nutritional Assessment
MNA-SF Mini Nutritional Assessment – Short Form
MST Malnutrition Screening Tool
MUST Malnutrition Universal Screening Tool
NBM nil by mouth
NHS national health service
NRS-2002 Nutritional risk screen - 2002
OR odds risk
PEM protein energy malnutrition
PG-SGA patient generated Subjective Global Assessment
PU pressure ulcer
xvii
QALY quality adjusted life years
RBC red blood count
RCT randomized controlled trial
RR relative risk
SF skin fold
SNAQ Short Nutritional Assessment Questionaire
SGA Subjective Global Assessment
TIBC total iron binding capacity
TLC total lymphocyte count
UK United Kingdom
USA United States of America
TSF triceps skin fold
WHR weight height ratio
Wt weight

xviii
Statement of Original Authorship
The work contained in this thesis has not been previously submitted to meet
requirements for an award at this or any other higher degree institution. To the
best of my knowledge and belief, the thesis contains no material previously
published or written by another person except where due reference is made.
Signature:
Date:

xix
Acknowledgements
I am very grateful to the following people for assisting and supporting me
through this journey:
To my supervisors, Sue Ash, Nick Graves and Judy Bauer, for taking me on
and providing direction, assistance and ongoing motivation.
To the late Carla Patterson for starting this journey with me, and Sandra Capra
for encouraging me to start.
To the staff of Nutrition and Dietetics at the Princess Alexandra and
subsequently the Royal Brisbane & Women’s Hospital for their support and
patience while I was absent to undertake this research.
To my incredibly patient family, Steve, Holly and Carly, for their love and
understanding.

xx
Economic analysis of Malnutrition and Pressure ulcers M Banks June 2008
CHAPTER 1 BACKGROUND
In Australia there is much literature and discussion on the high and increasing
prevalence of overweight and obesity and related disorders, including diabetes.
Disorders related to ‘overnutrition’ are now a national health priority (NHMRC,
1997, National Obesity Taskforce, 2003). Emphasis placed on this extreme of
nutritional status, has resulted in little awareness of the other extreme,
undernutrition, in the Australian population. There is however evidence that
undernutrition (or malnutrition as referred to in this thesis) does occur in high
proportions in certain populations. Malnutrition is reported to be common in
hospitals (10-60%), residential aged care facilities (up to 50% or more) and in
free living individuals with severe of multiple disease (>10%) (Stratton et al.,
2003). Published Australian studies indicate similar results (Beck et al., 2001c,
Ferguson et al., 1997, Lazarus and Hamlyn, 2005, Middleton et al., 2001,
Visvanathan et al., 2003), but are generally limited in number, with none
conducted across multiple centres or in residential aged care facilities. In
Australia, there is a general lack of awareness and recognition of the problem of
malnutrition, with currently no policy, standards or guidelines related to the
identification, prevention and treatment of malnutrition.
Malnutrition is however associated with increased complications, length of
hospital stay and mortality (Green, 1999, Correia and Waitzberg, 2003).
Malnutrition has also been found to be associated with the development of
pressure ulcers, but studies are limited. The consequences of the development
of pressure ulcers include pain and discomfort for the patient, and considerable
costs associated with treatment and increased length of stay of the patients.
Pressure ulcers are considered largely preventable, and the demand for the
establishment of appropriate policy, standards and guidelines regarding pressure
ulcers has recently become important because the incidence and prevalence of
pressure ulcers is increasingly being considered a parameter of quality of care.
Economic analysis of Malnutrition and Pressure ulcers M Banks June 2008
2
The first aim of the is study was to determine the prevalence of malnutrition;
variables associated with malnutrition; and the association between malnutrition
and pressure ulcers as an example of a consequence of malnutrition, in
Queensland Health hospitals and residential aged care facilities. A high
prevalence of malnutrition and an association between malnutrition and pressure
ulcers in the Australian context highlights the importance of the need for policy,
standards and/or guidelines regarding the identification, prevention and treatment
of malnutrition also.
Secondly, this study aimed to establish the economic consequences of
malnutrition, with pressure ulcers as a case example. This was done by
undertaking exploratory analysis to estimate the economic cost arising from
pressure ulcers that are attributable to malnutrition in the hospital population, as
well as estimating economic outcomes of a nutrition intervention to address
malnutrition aimed at reducing the incidence of pressure ulcers in the hospital
population. Data are available on the economic cost of pressure ulcer from
extended length of stay of hospitalized patients in Australia. The determination of
the proportion of these costs attributable to malnutrition highlights the potential
and unnecessary costs of malnutrition to Queensland public hospitals, just in the
case of pressure ulcers, which could have been spent treating other patients.
Data are also available which demonstrate that nutrition support (that is the
provision of nutrition in addition to a usual diet, such as oral nutrition supplements
or enteral tube feeding) is significantly associated with a lower incidence of
pressure ulcer development in at risk patients compared with standard care (that
being usual diet). This data was used to estimate the economic outcomes of a
nutrition support intervention in the prevention of pressure ulcers. The results of
these studies provide preliminary evidence for economic arguments to justify the
consideration of the requirement for policy, standards and guidelines regarding
the implementation of systems to identify, prevent and treat malnutrition in
Australia.
Economic analysis of Malnutrition and Pressure ulcers M Banks June 2008
3
CHAPTER 2 LITERATURE REVIEW
2.0 INTRODUCTION
The aim of the study program is to determine the prevalence of malnutrition in
Queensland hospitals and residential aged care facilities, and its economic
consequences, with pressure ulcers as a case example.
The literature review is divided into three main sections. The first section reviews
literature on the prevalence, causes, health outcome and economic
consequences of malnutrition; and effects of nutrition support interventions for
malnutrition. This section also briefly reviews literature related to nutrition
assessment and nutrition screening, including current policy, standards and
practices related to nutrition care.
The second section reviews literature related to pressure ulcer prevalence;
causes and factors associated with pressure ulcers, focusing on nutritional
factors; and prevention and treatment of pressure ulcers, again focusing on
nutritional factors. This section also reviews current policy, standards and
practices related to pressure ulcer identification, prevention and treatment,
focusing particularly on nutritional aspects.
As this research program includes economic analyses, the third section outlines
relevant economic principles and reviews the economic literature in the areas of
malnutrition and nutrition intervention, and pressure ulcers.
Economic analysis of Malnutrition and Pressure ulcers M Banks June 2008
4
2.1 MALNUTRITION - DEFINITIONS AND CLASSIFICATION
Malnutrition is a broad term that can be used to describe any disorder of nutrition,
from diseases of the developed world caused by over-nutrition, to extremes of
under-nutrition found in situations of famine. It can also be used to describe
unbalanced nutrition with one or more micronutrient or mineral deficiencies
(Allison, 2000). In the hospitalised patient, it is more likely that protein energy
malnutrition, rather than vitamin deficiency syndromes will be present (Allison,
2000, Bistrian, 1984, Butterworth and Blackburn, 1975). In this thesis the term
malnutrition will be used to describe protein energy malnutrition (PEM) or under-
nutrition, primarily in developed countries.
Although the aetiology of malnutrition is complex, its development is primarily due
to inadequate dietary intake (primary malnutrition) or increased metabolic
demands or nutrient losses as a result of certain diseases or medical conditions
(secondary malnutrition) (Corish and Kennedy, 2000).
There are two main types of malnutrition described in the literature: marasmus
and kwashiorkor. Bistrian (1984) describes these as: “Marasmus or chronic
inanition results from a prolonged period of inadequate energy intake. The
person appears wasted due to depletion of somatic protein and fat stores.”
Kwashiorkor or hypoalbuminaemia syndrome develops more rapidly as a
consequence of a protein deficit concurrent with physiological stress. Fat or
somatic muscle stores may be normal or above normal however biochemical
tests indicate severely depressed serum proteins. Patients may be oedematous.
If the marasmic patient is subjected to physiological stress the hypoalbuminaemic
syndrome may develop rapidly. ‘Marasmic-kwashiorkor’ is most commonly
observed in hospitalized patients, consisting of wasting of muscle and fat with
hypoalbuminaemia (Corish and Kennedy, 2000).
Economic analysis of Malnutrition and Pressure ulcers M Banks June 2008
5
The differential loss of tissue from fat, skeletal muscle and visceral protein in
uncomplicated semi-starvation does not lead to an increase in mortality rate until
weight loss is severe (greater than 40%). However weight loss of 25% can be
lethal if stress is superimposed on semi-starvation (Bistrian, 1984).
Although malnutrition is described as above in the literature, there is no national
or international standard for defining nutritional status (Corish and Kennedy,
2000). Malnutrition is used to describe a broad spectrum of clinical conditions
ranging from mild to very severe. The state of impending malnutrition or
increased nutritional risk is also often included under the umbrella of malnutrition
(Corish and Kennedy, 2000).
A lack of standard definition of malnutrition has given rise to much confusion in
the literature, with respect to comparison between studies examining prevalence
of malnutrition (Corish and Kennedy, 2000), and in studies concerning the
benefits of nutrition support (Allison, 2000).
2.2 PREVALENCE OF MALNUTRITION
Prevalence is the number of existing cases of a particular condition in a given
population at a given time.
Correia and Waitzberg (2003) state that “epidemiologists define ‘common
disease’ as having prevalence above 10%, therefore malnutrition may be the
most common disease in the hospital setting”.
The high prevalence of malnutrition in hospitalised patients in developed
countries was first reported in 1974 in a landmark article by Butterworth (1974).
In the same year, Bistrian et al (1974) reported that 50% of a group of 131
surgical patients in a Boston hospital demonstrated moderate to severe PEM as
judged by anthropometric and biochemical indices. Using similar methodology
Economic analysis of Malnutrition and Pressure ulcers M Banks June 2008
6
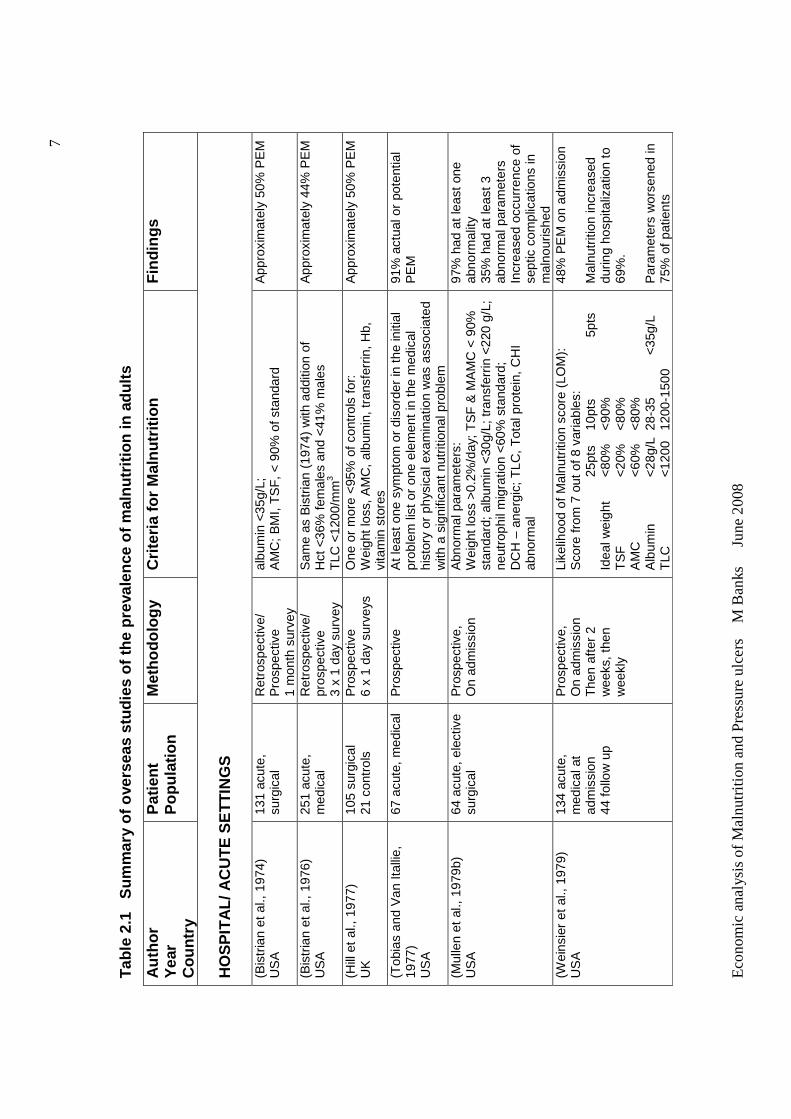
Bistrian et al (1976) reported a 44% prevalence of malnutrition in general medical
patients. The authors wrote “The amount of protein-calorie malnutrition found in
both patient categories is alarming”. Prompted by the USA evidence, Hill (1977)
assessed the prevalence of malnutrition in a UK hospital, and found that 50% of
105 surgical patients had one or more abnormal values suggestive of
malnutrition.
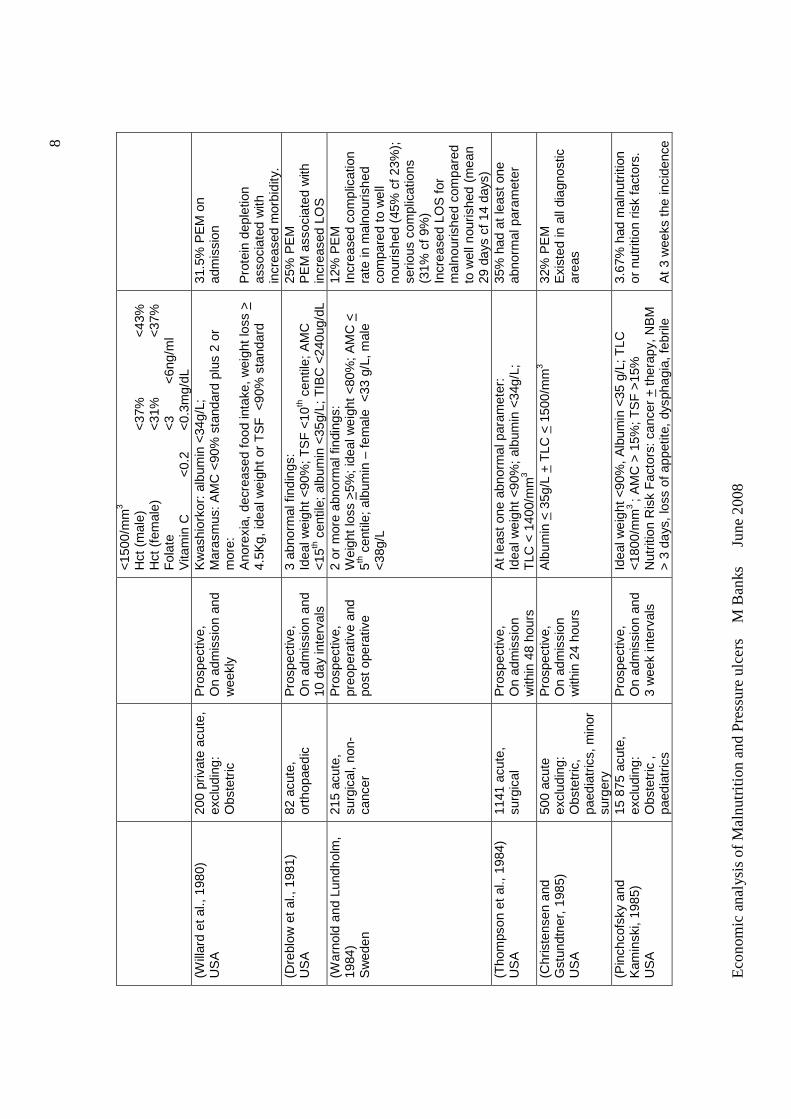
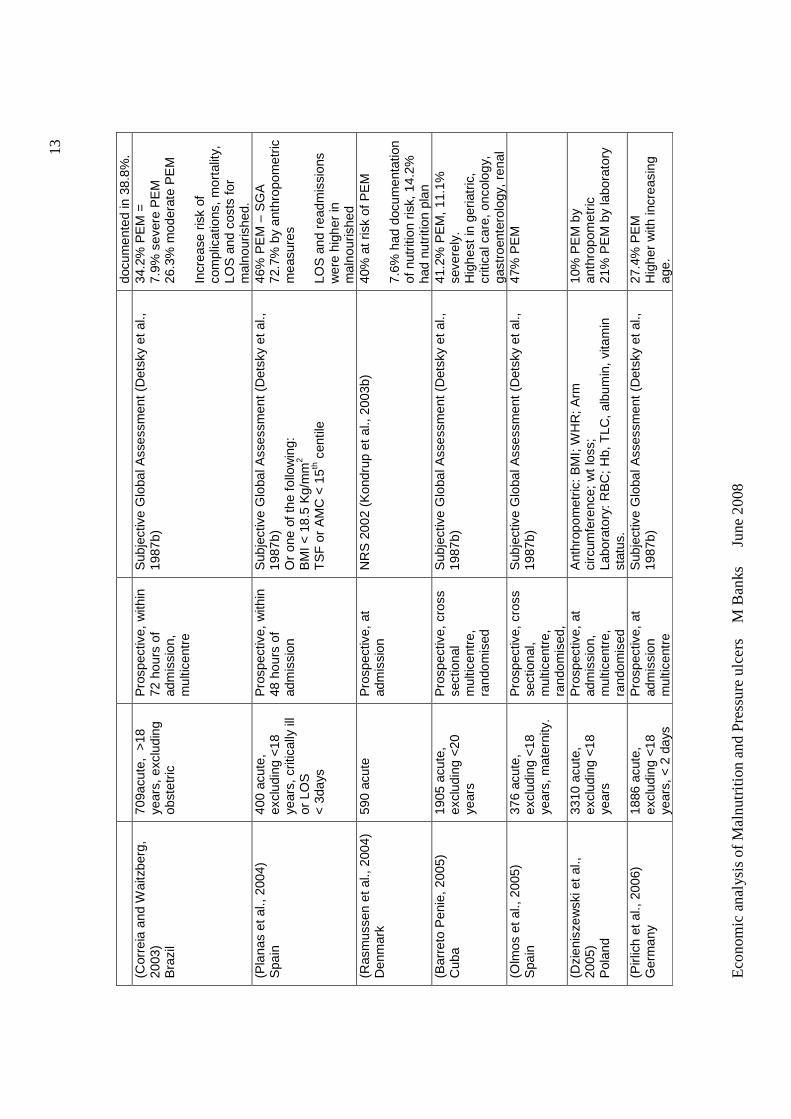
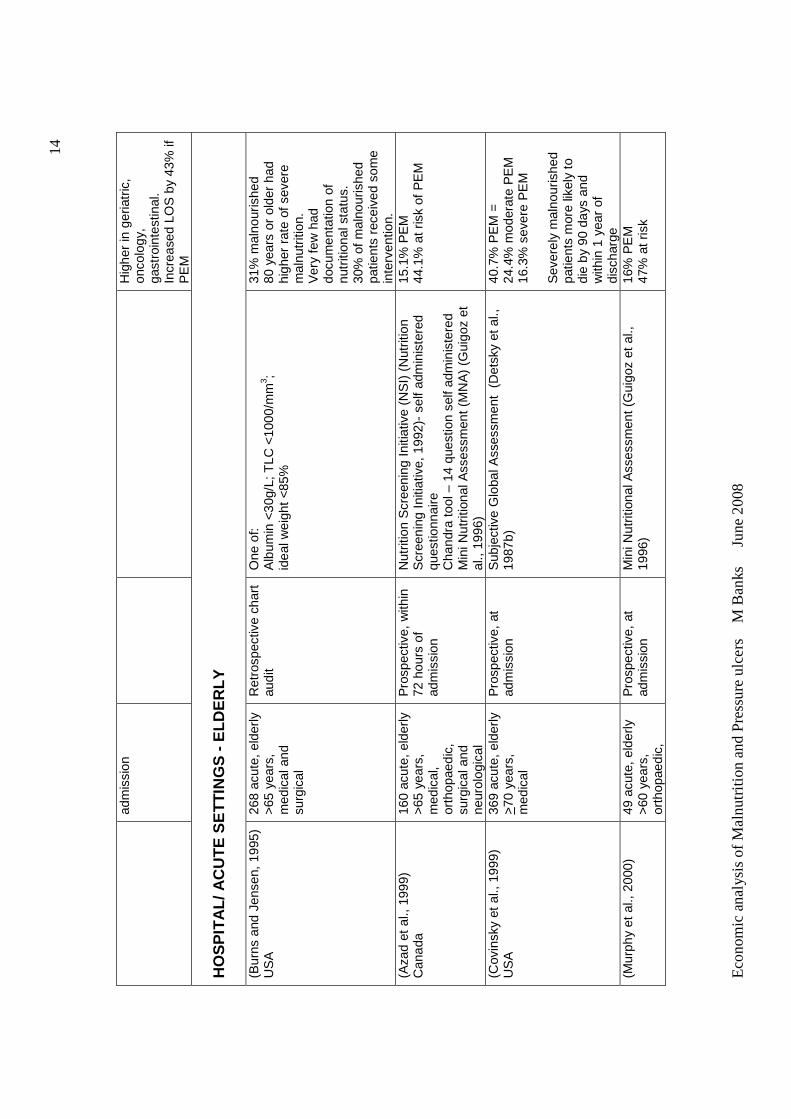
A summary of these and other studies on the prevalence of malnutrition in adults
in acute, sub-acute, residential and community settings from overseas and
Australia are presented in Tables 2.1 and 2.2 respectively. Studies with a
primary aim of determining prevalence of malnutrition are included, with the
prevalence of malnutrition and other significant findings of the studies
summarized.
Eco
nom
ic a
nal
ysis
of
Ma
lnut
ritio
n a
nd
Pre
ssu
re u
lce
rs
M B
anks
Ju
ne 2
008
7
Tab
le 2
.1
Sum
mar
y of
ove
rsea
s st
udie
s of
the
prev
alen
ce o
f mal
nutr
ition
in a
dults
Aut
hor
Yea
r C
ount
ry
Pat
ient
P
opul
atio
n M
etho
dolo
gy
Crit
eria
for
Mal
nutr
ition
F
indi
ngs
HO
SP
ITA
L/ A
CU
TE
SE
TT
ING
S
(Bis
tria
n et
al.,
197
4)
US
A
131
acut
e,
surg
ical
R
etro
spec
tive/
P
rosp
ectiv
e 1
mon
th s
urve
y
albu
min
<35
g/L;
A
MC
; B
MI,
TS
F,
< 9
0% o
f sta
ndar
d A
ppro
xim
atel
y 50
% P
EM
(Bis
tria
n et
al.,
197
6)
US
A
251
acut
e,
med
ical
R
etro
spec
tive/
pr
ospe
ctiv
e 3
x 1
day
surv
ey
Sam
e as
Bis
tria
n (1
974)
with
add
ition
of
H
ct <
36%
fem
ales
and
<41
% m
ales
T
LC <
1200
/mm
3
App
roxi
mat
ely
44%
PE
M
(Hill
et
al.,
1977
) U
K
105
surg
ical
21
con
trol
s P
rosp
ectiv
e 6
x 1
day
surv
eys
One
or
mor
e <
95%
of c
ontr
ols
for:
W
eigh
t los
s, A
MC
, al
bum
in, t
rans
ferr
in, H
b,
vita
min
sto
res
App
roxi
mat
ely
50%
PE
M
(Tob
ias
and
Van
Ital
lie,
1977
) U
SA
67 a
cute
, med
ical
P
rosp
ectiv
e
At l
east
one
sym
ptom
or
diso
rder
in t
he in
itial
pr
oble
m li
st o
r on
e el
emen
t in
the
med
ical
hi
stor
y or
phy
sica
l exa
min
atio
n w
as a
ssoc
iate
d w
ith a
sig
nific
ant
nutr
ition
al p
robl
em
91%
act
ual o
r po
tent
ial
PE
M
(Mul
len
et a
l., 1
979b
) U
SA
64
acu
te, e
lect
ive
surg
ical
P
rosp
ectiv
e,
On
adm
issi
on
Abn
orm
al p
aram
eter
s:
Wei
ght l
oss
>0.
2%/d
ay;
TS
F &
MA
MC
< 9
0%
stan
dard
; al
bum
in <
30g/
L; tr
ansf
errin
<22
0 g/
L;
neut
roph
il m
igra
tion
<60
% s
tand
ard;
D
CH
– a
nerg
ic;
TLC
, T
otal
pro
tein
, C
HI
abno
rmal
97%
had
at
leas
t one
ab
norm
ality
35
% h
ad a
t le
ast 3
ab
norm
al p
aram
eter
s In
crea
sed
occu
rren
ce o
f se
ptic
com
plic
atio
ns in
m
alno
uris
hed
(Wei
nsie
r et
al.,
197
9)
US
A
134
acut
e,
med
ical
at
adm
issi
on
44 fo
llow
up
Pro
spec
tive,
O
n ad
mis
sion
T
hen
afte
r 2
wee
ks, t
hen
wee
kly
Like
lihoo
d of
Mal
nutr
ition
sco
re (
LOM
):
Sco
re f
rom
7 o
ut o
f 8 v
aria
bles
:
25
pts
10pt
s
5pts
Id
eal w
eigh
t <
80%
<
90%
T
SF
<20
%
<80
%
AM
C
<
60%
<
80%
A
lbum
in
<28
g/L
28-3
5
<
35g/
L T
LC
<
1200
12
00-1
500
48%
PE
M o
n ad
mis
sion
M
alnu
triti
on in
crea
sed
durin
g ho
spita
lizat
ion
to
69%
. P
aram
eter
s w
orse
ned
in
75%
of
patie
nts
Eco
nom
ic a
nal
ysis
of
Ma
lnut
ritio
n a
nd
Pre
ssu
re u
lce
rs
M B
anks
Ju
ne 2
008
8
<15
00/m
m3
Hct
(m
ale)
<37
%
<
43%
H
ct (
fem
ale)
<31
%
<
37%
F
olat
e
<
3
<6n
g/m
l V
itam
in C
<
0.2
<0.
3mg/
dL
(W
illar
d et
al.,
198
0)
US
A
200
priv
ate
acut
e,
excl
udin
g:
Obs
tetr
ic
Pro
spec
tive,
O
n ad
mis
sion
and
w
eekl
y
Kw
ashi
orko
r: a
lbum
in <
34g/
L;
Mar
asm
us: A
MC
<90
% s
tand
ard
plus
2 o
r m
ore:
A
nore
xia,
dec
reas
ed fo
od in
take
, wei
ght
loss
>
4.5K
g, id
eal w
eigh
t or
TS
F <
90%
sta
ndar
d
31.5
% P
EM
on
adm
issi
on
Pro
tein
dep
letio
n as
soci
ated
with
in
crea
sed
mor
bidi
ty.
(Dre
blow
et
al.,
1981
) U
SA
82
acu
te,
orth
opae
dic
P
rosp
ectiv
e,
On
adm
issi
on a
nd
10 d
ay in
terv
als
3 ab
norm
al f
indi
ngs:
Id
eal w
eigh
t <9
0%;
TS
F <
10th c
entil
e; A
MC
<
15th c
entil
e; a
lbum
in <
35g/
L; T
IBC
<24
0ug/
dL
25%
PE
M
PE
M a
ssoc
iate
d w
ith
incr
ease
d LO
S
(War
nold
and
Lun
dhol
m,
1984
) S
wed
en
215
acut
e,
surg
ical
, no
n-ca
ncer
Pro
spec
tive,
pr
eope
rativ
e an
d po
st o
pera
tive
2 or
mor
e ab
norm
al fi
ndin
gs:
Wei
ght l
oss
>5%
; ide
al w
eigh
t <
80%
; A
MC
<
5th c
entil
e; a
lbum
in –
fem
ale
<33
g/L
, mal
e <
38g/
L
12%
PE
M
Incr
ease
d co
mpl
icat
ion
rate
in m
alno
uris
hed
com
pare
d to
wel
l no
uris
hed
(45%
cf 2
3%);
se
rious
com
plic
atio
ns
(31%
cf 9
%)
Incr
ease
d LO
S fo
r m
alno
uris
hed
com
pare
d to
wel
l nou
rishe
d (m
ean
29 d
ays
cf 1
4 da
ys)
(Tho
mps
on e
t al.,
198
4)
US
A
1141
acu
te,
surg
ical
P
rosp
ectiv
e,
On
adm
issi
on
with
in 4
8 ho
urs
At l
east
one
abn
orm
al p
aram
eter
: Id
eal w
eigh
t <9
0%;
albu
min
<34
g/L;
T
LC <
140
0/m
m3
35%
had
at
leas
t one
ab
norm
al p
aram
eter
(Chr
iste
nsen
and
G
stun
dtne
r, 1
985)
U
SA
500
acut
e ex
clud
ing:
O
bste
tric
, pa
edia
tric
s, m
inor
su
rger
y
Pro
spec
tive,
O
n ad
mis
sion
w
ithin
24
hour
s
Alb
umin
< 3
5g/L
+ T
LC <
150
0/m
m3
32%
PE
M
Exi
sted
in a
ll di
agno
stic
ar
eas
(Pin
chco
fsky
and
K
amin
ski,
1985
) U
SA
15 8
75 a
cute
, ex
clud
ing:
O
bste
tric
, pa
edia
tric
s
Pro
spec
tive,
O
n ad
mis
sion
and
3
wee
k in
terv
als
Idea
l wei
ght
<90%
, A
lbum
in <
35 g
/L; T
LC
<18
00/m
m3 ;
AM
C >
15%
; TS
F >
15%
N
utrit
ion
Ris
k F
acto
rs: c
ance
r +
ther
apy,
NB
M
> 3
day
s, lo
ss o
f app
etite
, dy
spha
gia,
febr
ile
3.67
% h
ad m
alnu
triti
on
or n
utrit
ion
risk
fact
ors.
A
t 3
wee
ks t
he in
cide
nce
Eco
nom
ic a
nal
ysis
of
Ma
lnut
ritio
n a
nd
Pre
ssu
re u
lce
rs
M B
anks
Ju
ne 2
008
9
ha
d in
crea
sed
100%
(K
amat
h et
al.,
198
6)
US
A
3047
acu
te
Pro
spec
tive,
on
adm
issi
on,
mul
ticen
tre
Def
icie
nt in
1 o
r m
ore
of:
Alb
umin
, H
b or
TLC
, Ht/W
t <10
th c
entil
e 58
% a
t ris
k of
PE
M
(Rei
lly e
t al
., 19
88)
US
A
153
acut
e P
rosp
ectiv
e, o
n ad
mis
sion
N
utrit
ion
Ris
k S
core
: A
ppet
ite, a
bilit
y to
eat
, str
ess
fact
or, %
wt
loss
an
d B
MI
or W
t/Ht.
25%
mod
erat
e P
EM
25
% h
igh
risk
PE
M
(R
oube
noff
et a
l., 1
987)
U
SA
34
acu
te, m
edic
al
Pro
spec
tive,
on
adm
issi
on w
ithin
24
hou
rs
2 of
the
follo
win
g:
Wei
ght <
20%
of i
deal
bod
y w
eigh
t; w
eigh
t lo
ss
>10
% u
sual
bod
y w
eigh
t; al
bum
in <
35g/
L; T
LC
<12
00 /
mm
3 ; p
rese
nce
of 3
or
mor
e nu
triti
onal
ris
k fa
ctor
s (w
eigh
t cha
nge,
nau
sea,
vom
iting
, di
arrh
ea,
anor
exia
, dy
spha
gia,
foo
d al
lerg
y,
chan
ge in
sto
ol c
olou
r)
47%
PE
M
(Mes
sner
et a
l., 1
991)
U
SA
50
0 ac
ute
med
ical
and
su
rgic
al
Pro
spec
tive,
on
adm
issi
on
Sco
re f
or 3
par
amet
ers:
m
ild
mod
erat
e se
vere
al
bum
in
30-3
4 21
-29
g/L
<
21g/
L T
LC
1
200-
1499
80
0-11
99
<
800/
mm
3
Wei
ght l
oss
mild
m
oder
ate
seve
re
55%
PE
M =
19
% m
ild
9% m
oder
ate
27%
sev
ere
Sig
nific
ant
incr
ease
d LO
S w
ith w
orse
ning
nu
triti
onal
sta
tus
(Coa
ts e
t al.,
199
3)
US
A
228
acut
e,
med
ical
>18
ye
ars.
48
follo
w u
p
Pro
spec
tive,
with
in
48 h
ours
of
adm
issi
on, d
urin
g ad
mis
sion
and
be
fore
di
scha
rge/
deat
h.
See
Wei
nsie
r (1
979)
38
% P
EM
on a
dmis
sion
46
% P
EM
on
follo
w u
p M
alno
uris
hed
patie
nts
had
long
er L
OS
and
in
crea
sed
rate
of
mor
talit
y (L
arss
on e
t al.,
199
4)
Sw
eden
38
2 ac
ute,
4
hosp
itals
-
Sub
ject
ive
Glo
bal A
sses
smen
t (D
etsk
y et
al.,
19
87b)
: Wt l
oss,
rec
ent i
ntak
e, fu
nctio
nal
capa
city
, S
C fa
t sto
res,
mus
cle
stor
es
27%
PE
M =
20
% m
oder
ate
PE
M
7% s
ever
e P
EM
P
EM
had
dec
reas
e in
Q
OL.
(M
cWhi
rter
and
P
enni
ngto
n, 1
994)
U
SA
500
acut
e:
surg
ical
, m
edic
al,
resp
irato
ry,
orth
opae
dic,
Pro
spec
tive,
on
adm
issi
on a
nd a
t di
scha
rge
Mild
:
BM
I <20
Kg/
m2 ;T
SF
or
AM
C <
15th c
entil
e M
oder
ate:
B
MI <
18K
g/m
2 ; T
SF
or
AM
C <
5th c
entil
e
40%
PE
M
Mea
n w
eigh
t lo
ss o
ver
adm
issi
on o
f 5.
4% w
ith
grea
test
loss
in th
ose
Eco
nom
ic a
nal
ysis
of
Ma
lnut
ritio
n a
nd
Pre
ssu
re u
lce
rs
M B
anks
Ju
ne 2
008
10
geria
tric
S
ever
e:
BM
I <16
Kg/
m2 ;
TS
F o
r A
MC
<5th
cen
tile
+ 1
0% w
eigh
t lo
ss
initi
ally
mos
t un
derw
eigh
t O
nly
96/2
00
mal
nour
ishe
d pa
tient
s ha
d an
y do
cum
ente
d nu
triti
on in
form
atio
n O
nly
10/5
5 re
view
ed
mal
nour
ishe
d pa
tient
s ha
d be
en r
efer
red
for
nutr
ition
inte
rven
tion.
(C
him
a et
al.,
199
7)
US
A
173
acut
e P
rosp
ectiv
e, o
n ad
mis
sion
R
isk
defin
ed a
s on
e or
mor
e of
: <
75%
IB
W, l
ow a
lbum
in, >
10%
wt l
oss
in 1
m
onth
32%
PE
M
Hig
h ris
k gr
oups
wer
e:
GI 5
9%, i
nfec
tious
di
seas
es 5
9%,
pneu
mon
ia/T
B 4
2%
Pat
ient
s at
ris
k of
m
alnu
triti
on h
ad
sign
ifica
ntly
hig
her
LOS
, co
sts
and
hom
e he
alth
ca
re n
eeds
(Nab
er e
t al
., 19
97)
Net
herla
nds
155
acut
e, n
on-
surg
ical
P
rosp
ectiv
e, a
t ad
mis
sion
S
ubje
ctiv
e G
loba
l Ass
essm
ent (
Det
sky
et a
l.,
1987
b);
N
utrit
ion
Ris
k In
dex
(NR
I) (
Wol
insk
y et
al.,
19
90)
– eq
uatio
n us
ing
albu
min
and
pr
esen
t/us
ual w
eigh
t;
Maa
stric
ht in
dex
– eq
uatio
n us
ing
prea
lbum
in,
TLC
, id
eal w
eigh
t
45%
PE
M -
SG
A
57%
PE
M -
NR
I 62
% -
Maa
stric
ht in
dex
(Edi
ngto
n et
al.,
199
7)
UK
12
3 ac
ute,
su
rgic
al >
18
year
s
Pro
spec
tive,
with
in
6 w
eeks
pos
t di
scha
rge
See
McW
hirt
er &
Pen
ning
ton
(199
4)
10.6
% P
EM
(Tho
rsdo
ttir
et a
l., 1
999)
Ic
elan
d 82
acu
te
Pro
spec
tive,
on
adm
issi
on
3 or
mor
e of
: B
MI <
20; l
ow a
lbum
in, T
LC, p
real
bum
in,
HB
, T
SF
and
MA
MC
<10
th c
entil
e; w
t los
s 5-
10%
in
1-6
mon
ths
21%
PE
M
Eco
nom
ic a
nal
ysis
of
Ma
lnut
ritio
n a
nd
Pre
ssu
re u
lce
rs
M B
anks
Ju
ne 2
008
11
(Bru
un e
t al.,
199
9)
Nor
way
24
4 ac
ute,
su
rgic
al e
xclu
ding
<
18 y
ears
; <
7 da
y LO
S
Pro
spec
tive,
at d
ay
7 of
adm
issi
on a
nd
wee
kly
Mild
mal
nutr
ition
: B
MI 1
8-20
or
wt l
oss
5-10
%
Mod
erat
e m
alnu
triti
on:
BM
I 16-
18 o
r w
t los
s 10
-20%
S
ever
e m
alnu
triti
on:
BM
I <16
or
wt
loss
>20
%
39%
PE
M
(E
ding
ton
et a
l., 2
000)
U
K
850
acut
e P
rosp
ectiv
e, o
n ad
mis
sion
, 4
hosp
itals
1. M
ild –
BM
I <20
Kg/
m2
+ T
SF
or
MA
MC
<15
th
cent
ile
2. M
oder
ate
– B
MI
<18
Kg/
m2 +
TS
F o
r M
AM
C
<5th
cen
tile
3. S
ever
e –
BM
I <16
Kg/
m2
+ T
SF
or
MA
MC
<
5th c
entil
e 4.
BM
I <20
Kg/
m2 +
>10
% w
eigh
t lo
ss in
pas
t 6
mon
ths
5. B
MI >
20
Kg/
m2
+ u
nint
entio
nal w
eigh
t lo
ss
>10
% b
ody
wei
ght
20%
PE
M
LOS
< n
ew p
resc
riptio
ns
and
infe
ctio
ns a
nd
dise
ase
seve
rity
wer
e hi
gher
in m
alno
uris
hed
(Kel
ly e
t al.,
200
0)
UK
21
9 ac
ute
Pro
spec
tive,
on
adm
issi
on
BM
I < 1
8.5
Kg/
m2
or B
MI
18.5
-20.
0 an
d w
t los
s >
3kg
in 3
mon
ths
13%
PE
M
(Bra
unsc
hwei
g et
al.,
20
00)
US
A
404
acut
e P
rosp
ectiv
e, o
n ad
mis
sion
S
ubje
ctiv
e G
loba
l Ass
essm
ent (
Det
sky
et a
l.,
1987
b)
31%
PE
M
(Wai
tzbe
rg e
t al
., 20
01)
Bra
zil
4000
acu
te,
excl
udin
g ob
stet
ric a
nd
paed
iatr
ic,
>18
ye
ars
Pro
spec
tive,
cro
ss
sect
iona
l M
ultic
entr
e
Sub
ject
ive
Glo
bal A
sses
smen
t (D
etsk
y et
al.,
19
87b)
48
.1%
PE
M =
12
.5%
sev
ere
PE
M
35.6
% m
oder
ate
PE
M
Mal
nutr
ition
cor
rela
ted
with
dia
gnos
os,
age,
pr
esen
ce o
f can
cer
or
infe
ctio
n, lo
nger
LO
S.
Few
er th
an 1
8.8%
of
patie
nts’
reco
rds
had
info
rmat
ion
on n
utrit
ion
rela
ted
issu
es.
Nut
ritio
n th
erap
y w
as
used
in o
nly
7.3%
of
Eco
nom
ic a
nal
ysis
of
Ma
lnut
ritio
n a
nd
Pre
ssu
re u
lce
rs
M B
anks
Ju
ne 2
008
12
patie
nts
(Kyl
e et
al.,
200
2)
Sw
itzer
land
99
5 ac
ute,
ex
clud
ing
fluid
re
susc
itatio
n,
oede
ma,
dia
lysi
s.
Pro
spec
tive,
on
adm
issi
on,
rand
omiz
ed
Sub
ject
ive
Glo
bal A
sses
smen
t (D
etsk
y et
al.,
19
87b)
, B
MI,
albu
min
, B
IA.
23.1
% s
ever
e P
EM
38
.3%
mod
erat
e P
EM
H
ighe
r in
>60
yea
rs.
(Kon
drup
et
al.,
2002
) D
enm
ark
750
acut
e,
excl
udin
g sa
me
day
adm
issi
on,
<15
yea
rs,
obst
etric
and
ps
ychi
atric
di
sord
ers
Pro
spec
tive,
on
adm
issi
on w
ithin
24
hou
rs,
m
ulti
cent
re
NR
S -
2002
(K
ondr
up e
t al
., 20
03b)
Sev
ere
M
oder
ate
Mild
B
MI
<18
.5
18
.5-2
0.5
Kg/
m2
Rec
ent W
eigh
t Los
s in
pas
t 3 m
onth
s:
>
15%
10-1
5%
5-10
%
Rec
ent i
ntak
e co
mpa
red
to r
equi
rem
ents
:
<25
%
25
-50%
50
-75
%
+ s
ever
ity o
f dis
ease
sco
re
22%
at r
isk
of P
EM
N
utrit
ion
risk
scre
enin
g ha
d on
ly o
ccur
red
in o
nly
60%
of c
ases
. O
nly
47%
of
at r
isk
had
nutr
ition
car
e pl
an.
Onl
y 30
% w
ere
mon
itore
d fo
r nu
triti
on.
Onl
y 25
% h
ad a
dequ
ate
prot
ein
and
ener
gy
inta
ke.
(Cor
reia
and
Cam
pos,
20
03)
Latin
Am
eric
a
9348
acu
te >
18
year
s P
rosp
ectiv
e, c
ross
se
ctio
nal,
m
ulti
cent
re
Sub
ject
ive
Glo
bal A
sses
smen
t (D
etsk
y et
al.,
19
87b)
50
.2%
PE
M =
11
.2%
sev
ere
PE
M
39%
mod
erat
e P
EM
M
alnu
triti
on a
ssoc
iate
d w
ith a
ge, p
rese
nce
of
canc
er a
nd in
fect
ion
and
long
er L
OS
. F
ewer
than
23%
had
do
cum
ente
d nu
triti
on
rela
ted
info
rmat
ion.
N
utrit
iona
l the
rapy
was
us
ed in
8.8
% o
f pat
ient
s (W
yszy
nski
et
al.,
2003
) A
rgen
tina
1000
acu
te,
>18
year
s, e
xclu
ding
ob
stet
ric a
nd
psyc
hiat
ric
Pro
spec
tive,
cro
ss
sect
iona
l,
mul
ti ce
ntre
Sub
ject
ive
Glo
bal A
sses
smen
t (D
etsk
y et
al.,
19
87b)
47
% P
EM
=
12%
sev
ere
PE
M
35%
mod
erat
e P
EM
M
alnu
triti
on a
ssoc
iate
d w
ith e
lder
ly m
ales
, ca
ncer
or
infe
ctio
ns.
Nut
ritio
nal i
nfor
mat
ion
Eco
nom
ic a
nal
ysis
of
Ma
lnut
ritio
n a
nd
Pre
ssu
re u
lce
rs
M B
anks
Ju
ne 2
008
13
docu
men
ted
in 3
8.8%
. (C
orre
ia a
nd W
aitz
berg
, 20
03)
Bra
zil
709a
cute
, >
18
year
s, e
xclu
ding
ob
stet
ric
Pro
spec
tive,
with
in
72 h
ours
of
adm
issi
on,
mul
ticen
tre
Sub
ject
ive
Glo
bal A
sses
smen
t (D
etsk
y et
al.,
19
87b)
34
.2%
PE
M =
7.
9% s
ever
e P
EM
26
.3%
mod
erat
e P
EM
In
crea
se r
isk
of
com
plic
atio
ns,
mor
talit
y,
LOS
and
cos
ts fo
r m
alno
uris
hed.
(Pla
nas
et a
l., 2
004)
S
pain
40
0 ac
ute,
ex
clud
ing
<18
ye
ars,
crit
ical
ly il
l or
LO
S
< 3
days
Pro
spec
tive,
with
in
48 h
ours
of
adm
issi
on
Sub
ject
ive
Glo
bal A
sses
smen
t (D
etsk
y et
al.,
19
87b)
O
r on
e of
the
follo
win
g:
BM
I < 1
8.5
Kg/
mm
2
TS
F o
r A
MC
< 1
5th c
entil
e
46%
PE
M –
SG
A
72.7
% b
y an
thro
pom
etric
m
easu
res
LOS
and
rea
dmis
sion
s w
ere
high
er in
m
alno
uris
hed
(Ras
mus
sen
et a
l., 2
004)
D
enm
ark
590
acut
e P
rosp
ectiv
e, a
t ad
mis
sion
N
RS
200
2 (K
ondr
up e
t al.,
200
3b)
40
% a
t ris
k of
PE
M
7.6%
had
doc
umen
tatio
n of
nut
ritio
n ris
k, 1
4.2%
ha
d nu
triti
on p
lan
(Bar
reto
Pen
ie, 2
005)
C
uba
1905
acu
te,
excl
udin
g <
20
year
s
Pro
spec
tive,
cro
ss
sect
iona
l m
ultic
entr
e,
rand
omis
ed
Sub
ject
ive
Glo
bal A
sses
smen
t (D
etsk
y et
al.,
19
87b)
41.2
% P
EM
, 11
.1%
se
vere
ly.
Hig
hest
in g
eria
tric
, cr
itica
l car
e, o
ncol
ogy,
ga
stro
ente
rolo
gy,
rena
l (O
lmos
et a
l., 2
005)
S
pain
37
6 ac
ute,
ex
clud
ing
<18
ye
ars,
mat
erni
ty.
Pro
spec
tive,
cro
ss
sect
iona
l, m
ultic
entr
e,
rand
omis
ed,
Sub
ject
ive
Glo
bal A
sses
smen
t (D
etsk
y et
al.,
19
87b)
47%
PE
M
(Dzi
enis
zew
ski e
t al
., 20
05)
Pol
and
3310
acu
te,
excl
udin
g <
18
year
s
Pro
spec
tive,
at
adm
issi
on,
mul
ticen
tre,
ra
ndom
ised
Ant
hrop
omet
ric: B
MI;
WH
R; A
rm
circ
umfe
renc
e; w
t los
s;
Labo
rato
ry:
RB
C;
Hb,
TLC
, alb
umin
, vi
tam
in
stat
us.
10%
PE
M b
y an
thro
pom
etric
21
% P
EM
by
labo
rato
ry
(Pirl
ich
et a
l., 2
006)
G
erm
any
1886
acu
te,
excl
udin
g <
18
year
s, <
2 d
ays
Pro
spec
tive,
at
adm
issi
on
mul
ticen
tre
Sub
ject
ive
Glo
bal A
sses
smen
t (D
etsk
y et
al.,
19
87b)
27.4
% P
EM
H
ighe
r w
ith in
crea
sing
ag
e.
Eco
nom
ic a
nal
ysis
of
Ma
lnut
ritio
n a
nd
Pre
ssu
re u
lce
rs
M B
anks
Ju
ne 2
008
14
adm
issi
on
Hig
her
in g
eria
tric
, on
colo
gy,
gast
roin
test
inal
. In
crea
sed
LOS
by
43%
if
PE
M
HO
SP
ITA
L/ A
CU
TE
SE
TT
ING
S -
ELD
ER
LY
(Bur
ns a
nd J
ense
n, 1
995)
U
SA
26
8 ac
ute,
eld
erly
>
65 y
ears
, m
edic
al a
nd
surg
ical
Ret
rosp
ectiv
e ch
art
audi
t O
ne o
f: A
lbum
in <
30g/
L; T
LC <
1000
/mm
3 ;
idea
l wei
ght
<85%
31%
mal
nour
ishe
d 80
yea
rs o
r ol
der
had
high
er r
ate
of s
ever
e m
alnu
triti
on.
V
ery
few
had
do
cum
enta
tion
of
nutr
ition
al s
tatu
s.
30%
of
mal
nour
ishe
d pa
tient
s re
ceiv
ed s
ome
inte
rven
tion.
(A
zad
et a
l., 1
999)
C
anad
a 16
0 ac
ute,
eld
erly
>
65 y
ears
, m
edic
al,
orth
opae
dic,
su
rgic
al a
nd
neur
olog
ical
Pro
spec
tive,
with
in
72 h
ours
of
adm
issi
on
Nut
ritio
n S
cree
ning
Ini
tiativ
e (N
SI)
(N
utrit
ion
Scr
eeni
ng I
nitia
tive,
199
2)-
self
adm
inis
tere
d qu
estio
nnai
re
Cha
ndra
tool
– 1
4 qu
estio
n se
lf ad
min
iste
red
Min
i Nut
ritio
nal A
sses
smen
t (M
NA
) (G
uigo
z et
al
., 19
96)
15.1
% P
EM
44
.1%
at r
isk
of P
EM
(Cov
insk
y et
al.,
199
9)
US
A
369
acut
e, e
lder
ly
>70
yea
rs,
med
ical
Pro
spec
tive,
at
adm
issi
on
Sub
ject
ive
Glo
bal A
sses
smen
t (D
etsk
y et
al.,
19
87b)
40
.7%
PE
M =
24
.4%
mod
erat
e P
EM
16
.3%
sev
ere
PE
M
Sev
erel
y m
alno
uris
hed
patie
nts
mor
e lik
ely
to
die
by 9
0 da
ys a
nd
with
in 1
yea
r of
di
scha
rge
(Mur
phy
et a
l., 2
000)
49
acu
te, e
lder
ly
>60
yea
rs,
orth
opae
dic,
Pro
spec
tive,
at
adm
issi
on
Min
i Nut
ritio
nal A
sses
smen
t (G
uigo
z et
al.,
19
96)
16%
PE
M
47%
at r
isk
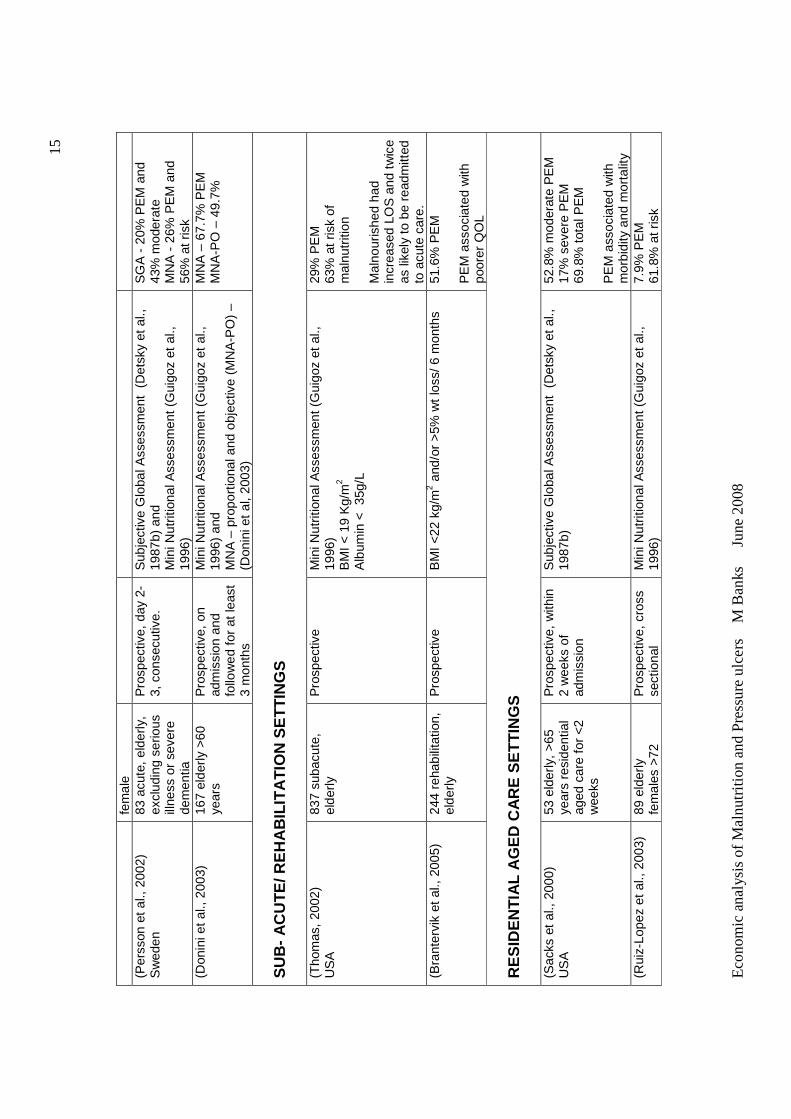
Eco
nom
ic a
nal
ysis
of
Ma
lnut
ritio
n a
nd
Pre
ssu
re u
lce
rs
M B
anks
Ju
ne 2
008
15
fem
ale
(Per
sson
et a
l., 2
002)
S
wed
en
83 a
cute
, eld
erly
, ex
clud
ing
serio
us
illne
ss o
r se
vere
de
men
tia
Pro
spec
tive,
day
2-
3, c
onse
cutiv
e.
Sub
ject
ive
Glo
bal A
sses
smen
t (D
etsk
y et
al.,
19
87b)
and
M
ini N
utrit
iona
l Ass
essm
ent (
Gui
goz
et a
l.,
1996
)
SG
A -
20%
PE
M a
nd
43%
mod
erat
e
MN
A -
26%
PE
M a
nd
56%
at r
isk
(D
onin
i et
al.,
2003
) 16
7 el
derly
>60
ye
ars
Pro
spec
tive,
on
adm
issi
on a
nd
follo
wed
for
at le
ast
3 m
onth
s
Min
i Nut
ritio
nal A
sses
smen
t (G
uigo
z et
al.,
19
96)
and
MN
A –
pro
port
iona
l and
obj
ectiv
e (M
NA
-PO
) –
(Don
ini e
t al
, 200
3)
MN
A –
67.
7% P
EM
M
NA
-PO
– 4
9.7%
SU
B-
AC
UT
E/ R
EH
AB
ILIT
AT
ION
SE
TT
ING
S
(Tho
mas
, 20
02)
US
A
837
suba
cute
, el
derly
P
rosp
ectiv
e M
ini N
utrit
iona
l Ass
essm
ent (
Gui
goz
et a
l.,
1996
) B
MI <
19
Kg/
m2
Alb
umin
<
35g/
L
29%
PE
M
63%
at r
isk
of
mal
nutr
ition
M
alno
uris
hed
had
incr
ease
d LO
S a
nd t
wic
e as
like
ly t
o be
rea
dmitt
ed
to a
cute
car
e.
(Bra
nter
vik
et a
l., 2
005)
24
4 re
habi
litat
ion,
el
derly
P
rosp
ectiv
e B
MI <
22 k
g/m
2 and
/or
>5%
wt
loss
/ 6 m
onth
s 51
.6%
PE
M
PE
M a
ssoc
iate
d w
ith
poor
er Q
OL
RE
SID
EN
TIA
L A
GE
D C
AR
E S
ET
TIN
GS
(S
acks
et
al.,
2000
) U
SA
53
eld
erly
, >
65
year
s re
side
ntia
l ag
ed c
are
for
<2
wee
ks
Pro
spec
tive,
with
in
2 w
eeks
of
adm
issi
on
Sub
ject
ive
Glo
bal A
sses
smen
t (D
etsk
y et
al.,
19
87b)
52
.8%
mod
erat
e P
EM
17
% s
ever
e P
EM
69
.8%
tot
al P
EM
P
EM
ass
ocia
ted
with
m
orbi
dity
and
mor
talit
y (R
uiz-
Lope
z et
al.,
200
3)
89 e
lder
ly
fem
ales
>72
P
rosp
ectiv
e, c
ross
se
ctio
nal
Min
i Nut
ritio
nal A
sses
smen
t (G
uigo
z et
al.,
19
96)
7.9%
PE
M
61.8
% a
t ris
k
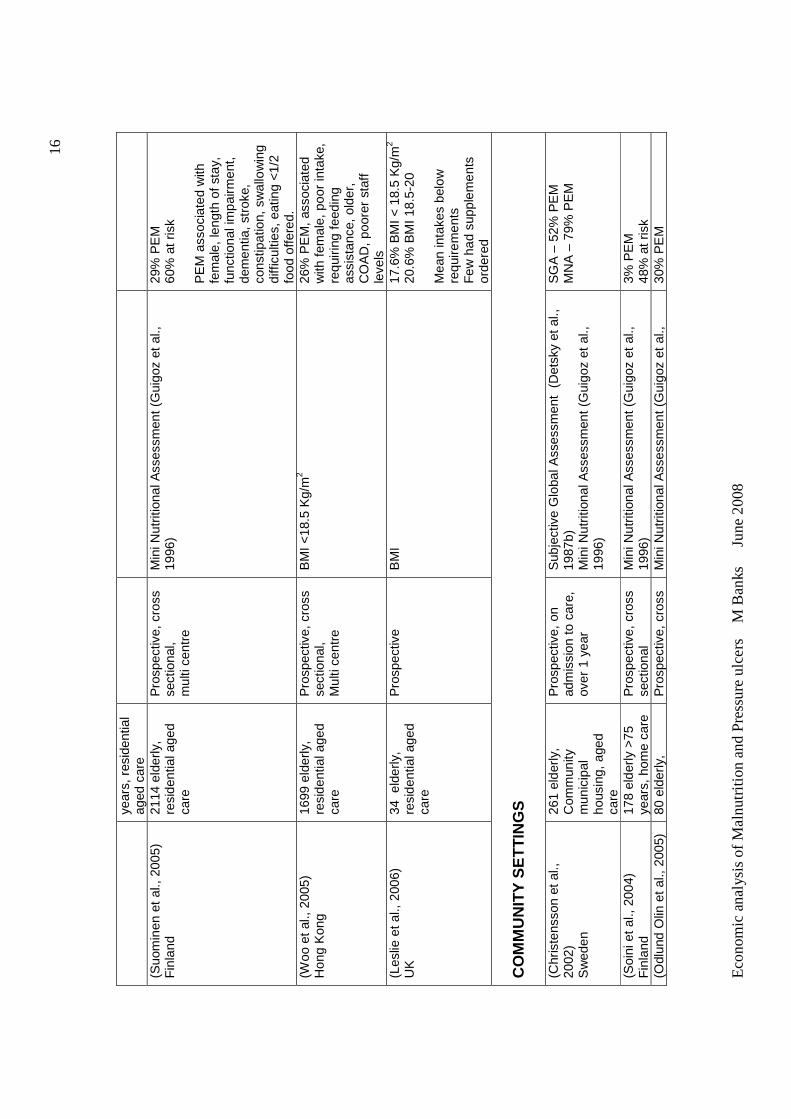
Eco
nom
ic a
nal
ysis
of
Ma
lnut
ritio
n a
nd
Pre
ssu
re u
lce
rs
M B
anks
Ju
ne 2
008
16
year
s, r
esid
entia
l ag
ed c
are
(S
uom
inen
et
al.,
2005
) F
inla
nd
2114
eld
erly
, re
side
ntia
l age
d ca
re
Pro
spec
tive,
cro
ss
sect
iona
l,
mul
ti ce
ntre
Min
i Nut
ritio
nal A
sses
smen
t (G
uigo
z et
al.,
19
96)
29%
PE
M
60%
at r
isk
PE
M a
ssoc
iate
d w
ith
fem
ale,
leng
th o
f sta
y,
func
tiona
l im
pairm
ent,
dem
entia
, str
oke,
co
nstip
atio
n, s
wal
low
ing
diff
icul
ties,
eat
ing
<1/
2 fo
od o
ffere
d.
(Woo
et a
l., 2
005)
H
ong
Kon
g 16
99 e
lder
ly,
resi
dent
ial a
ged
care
Pro
spec
tive,
cro
ss
sect
iona
l, M
ulti
cent
re
BM
I <18
.5 K
g/m
2 26
% P
EM
, as
soci
ated
w
ith f
emal
e, p
oor
inta
ke,
requ
iring
fee
ding
as
sist
ance
, old
er,
CO
AD
, po
orer
sta
ff le
vels
(L
eslie
et a
l., 2
006)
U
K
34 e
lder
ly,
resi
dent
ial a
ged
care
Pro
spec
tive
B
MI
17
.6%
BM
I < 1
8.5
Kg/
m2
20.6
% B
MI 1
8.5-
20
Mea
n in
take
s be
low
re
quire
men
ts
Few
had
sup
plem
ents
or
dere
d C
OM
MU
NIT
Y S
ET
TIN
GS
(C
hris
tens
son
et a
l.,
2002
) S
wed
en
261
elde
rly,
C
omm
unity
m
unic
ipal
ho
usin
g, a
ged
care
Pro
spec
tive,
on
adm
issi
on to
car
e,
over
1 y
ear
Sub
ject
ive
Glo
bal A
sses
smen
t (D
etsk
y et
al.,
19
87b)
M
ini N
utrit
iona
l Ass
essm
ent (
Gui
goz
et a
l.,
1996
)
SG
A –
52%
PE
M
MN
A –
79%
PE
M
(Soi
ni e
t al.,
200
4)
Fin
land
17
8 el
derly
>75
ye
ars,
hom
e ca
re
Pro
spec
tive,
cro
ss
sect
iona
l M
ini N
utrit
iona
l Ass
essm
ent (
Gui
goz
et a
l.,
1996
) 3%
PE
M
48%
at r
isk
(Odl
und
Olin
et a
l., 2
005)
80
eld
erly
, P
rosp
ectiv
e, c
ross
M
ini N
utrit
iona
l Ass
essm
ent (
Gui
goz
et a
l.,
30%
PE
M
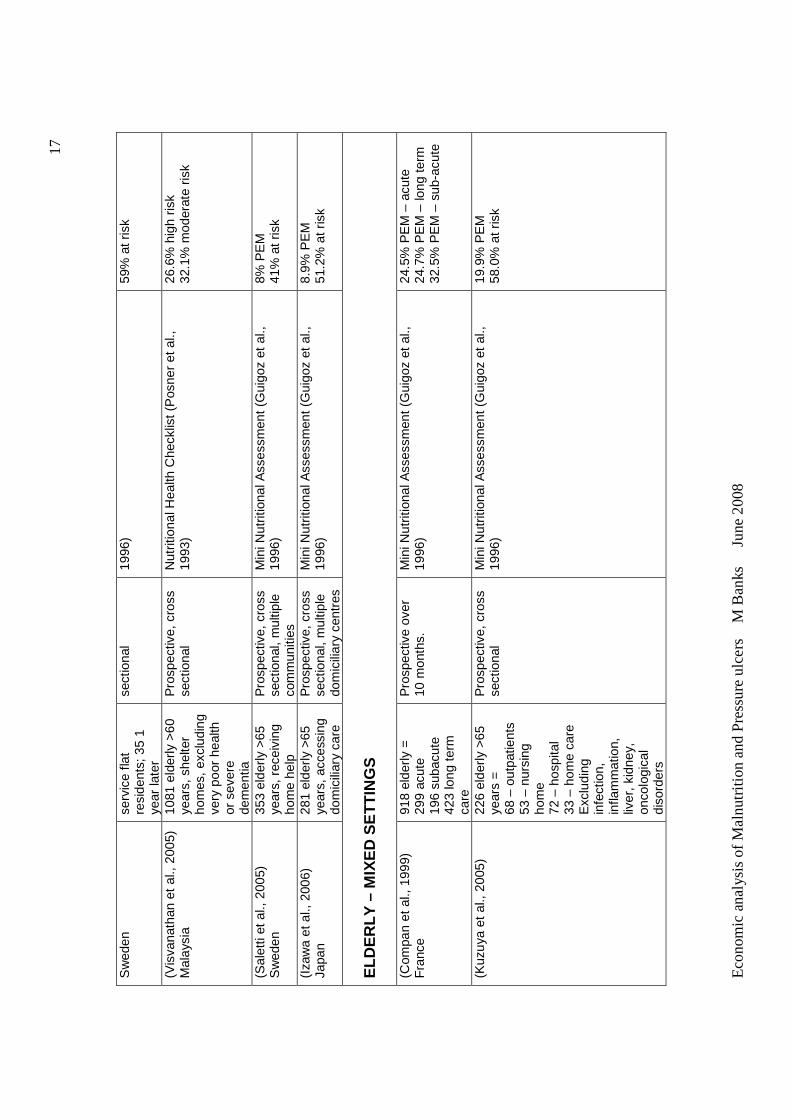
Eco
nom
ic a
nal
ysis
of
Ma
lnut
ritio
n a
nd
Pre
ssu
re u
lce
rs
M B
anks
Ju
ne 2
008
17
Sw
eden
se
rvic
e fla
t re
side
nts;
35
1 ye
ar la
ter
sect
iona
l 19
96)
59%
at r
isk
(Vis
vana
than
et
al.,
2005
) M
alay
sia
1081
eld
erly
>60
ye
ars,
she
lter
hom
es,
excl
udin
g ve
ry p
oor
heal
th
or s
ever
e de
men
tia
Pro
spec
tive,
cro
ss
sect
iona
l N
utrit
iona
l Hea
lth C
heck
list (
Pos
ner
et a
l.,
1993
) 26
.6%
hig
h ris
k 32
.1%
mod
erat
e ris
k
(Sal
etti
et a
l., 2
005)
S
wed
en
353
elde
rly >
65
year
s, r
ecei
ving
ho
me
help
Pro
spec
tive,
cro
ss
sect
iona
l, m
ultip
le
com
mun
ities
Min
i Nut
ritio
nal A
sses
smen
t (G
uigo
z et
al.,
19
96)
8% P
EM
41
% a
t ris
k
(Iza
wa
et a
l., 2
006)
Ja
pan
281
elde
rly >
65
year
s, a
cces
sing
do
mic
iliar
y ca
re
Pro
spec
tive,
cro
ss
sect
iona
l, m
ultip
le
dom
icili
ary
cent
res
Min
i Nut
ritio
nal A
sses
smen
t (G
uigo
z et
al.,
19
96)
8.9%
PE
M
51.2
% a
t ris
k
ELD
ER
LY –
MIX
ED
SE
TT
ING
S
(Com
pan
et a
l., 1
999)
F
ranc
e 91
8 el
derly
=
299
acut
e 19
6 su
bacu
te
423
long
ter
m
care
Pro
spec
tive
over
10
mon
ths.
M
ini N
utrit
iona
l Ass
essm
ent (
Gui
goz
et a
l.,
1996
) 24
.5%
PE
M –
acu
te
24.7
% P
EM
– lo
ng t
erm
32
.5%
PE
M –
sub
-acu
te
(Kuz
uya
et a
l., 2
005)
22
6 el
derly
>65
ye
ars
=
68 –
out
patie
nts
53 –
nur
sing
ho
me
72 –
hos
pita
l 33
– h
ome
care
E
xclu
ding
in
fect
ion,
in
flam
mat
ion,
liv
er,
kidn
ey,
onco
logi
cal
diso
rder
s
Pro
spec
tive,
cro
ss
sect
iona
l M
ini N
utrit
iona
l Ass
essm
ent (
Gui
goz
et a
l.,
1996
) 19
.9%
PE
M
58.0
% a
t ris
k
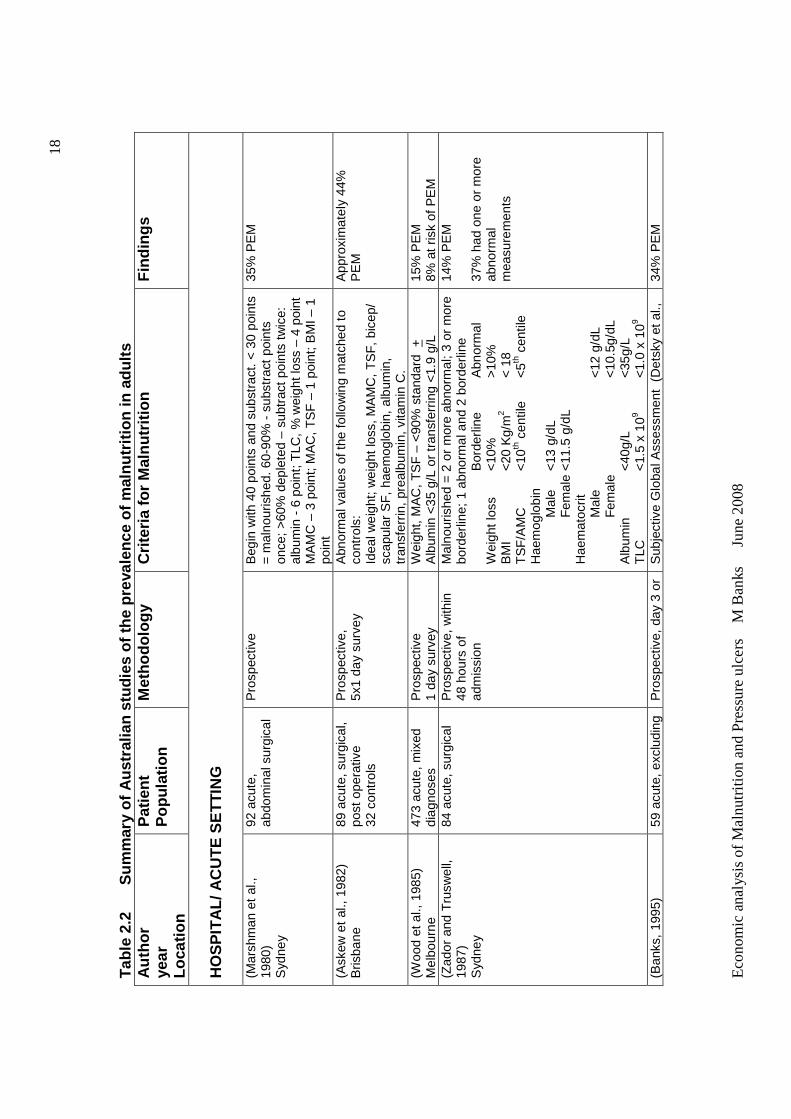
Eco
nom
ic a
nal
ysis
of
Ma
lnut
ritio
n a
nd
Pre
ssu
re u
lce
rs
M B
anks
Ju
ne 2
008
18
Tab
le 2
.2
Sum
mar
y of
Aus
tral
ian
stud
ies
of th
e pr
eval
ence
of m
alnu
triti
on in
adu
lts
Aut
hor
year
Lo
catio
n
Pat
ient
P
opul
atio
n M
etho
dolo
gy
Crit
eria
for
Mal
nutr
ition
F
indi
ngs
HO
SP
ITA
L/ A
CU
TE
SE
TT
ING
(M
arsh
man
et
al.,
1980
) S
ydne
y
92 a
cute
, ab
dom
inal
sur
gica
l P
rosp
ectiv
e B
egin
with
40
poin
ts a
nd s
ubst
ract
. < 3
0 po
ints
=
mal
nour
ishe
d. 6
0-90
% -
sub
stra
ct p
oint
s on
ce;
>60
% d
eple
ted
– su
btra
ct p
oint
s tw
ice:
al
bum
in -
6 p
oint
; TLC
, % w
eigh
t los
s –
4 po
int
MA
MC
– 3
poi
nt; M
AC
, TS
F –
1 p
oint
; BM
I – 1
po
int
35%
PE
M
(Ask
ew e
t al
., 19
82)
Bris
bane
89
acu
te, s
urgi
cal,
post
ope
rativ
e 32
con
trol
s
Pro
spec
tive,
5x
1 da
y su
rvey
A
bnor
mal
val
ues
of th
e fo
llow
ing
mat
ched
to
cont
rols
: Id
eal w
eigh
t; w
eigh
t lo
ss, M
AM
C,
TS
F,
bice
p/
scap
ular
SF
, ha
emog
lobi
n, a
lbum
in,
tran
sfer
rin, p
real
bum
in, v
itam
in C
.
App
roxi
mat
ely
44%
P
EM
(Woo
d et
al.,
198
5)
Mel
bour
ne
473
acut
e, m
ixed
di
agno
ses
Pro
spec
tive
1
day
surv
ey
Wei
ght,
MA
C, T
SF
– <
90%
sta
ndar
d +
A
lbum
in <
35 g
/L o
r tr
ansf
errin
g <1
.9 g
/L
15%
PE
M
8% a
t ris
k of
PE
M
(Zad
or a
nd T
rusw
ell,
1987
) S
ydne
y
84 a
cute
, sur
gica
l P
rosp
ectiv
e, w
ithin
48
hou
rs o
f ad
mis
sion
Mal
nour
ishe
d =
2 o
r m
ore
abno
rmal
; 3 o
r m
ore
bord
erlin
e; 1
abn
orm
al a
nd 2
bor
derli
ne
Bor
derli
ne
Abn
orm
al
Wei
ght l
oss
<10
%
>
10%
B
MI
<
20 K
g/m
2
< 1
8 T
SF
/AM
C
<10
th c
entil
e <
5th c
entil
e H
aem
oglo
bin
Mal
e <
13 g
/dL
F
emal
e <
11.5
g/d
L H
aem
atoc
rit
Mal
e
<
12 g
/dL
F
emal
e
<
10.5
g/dL
A
lbum
in
<40
g/L
<
35g/
L T
LC
<
1.5
x 10
9 <
1.0
x 10
9
14%
PE
M
37%
had
one
or
mor
e ab
norm
al
mea
sure
men
ts
(Ban
ks,
1995
) 59
acu
te, e
xclu
ding
P
rosp
ectiv
e, d
ay 3
or
Sub
ject
ive
Glo
bal A
sses
smen
t (D
etsk
y et
al.,
34
% P
EM
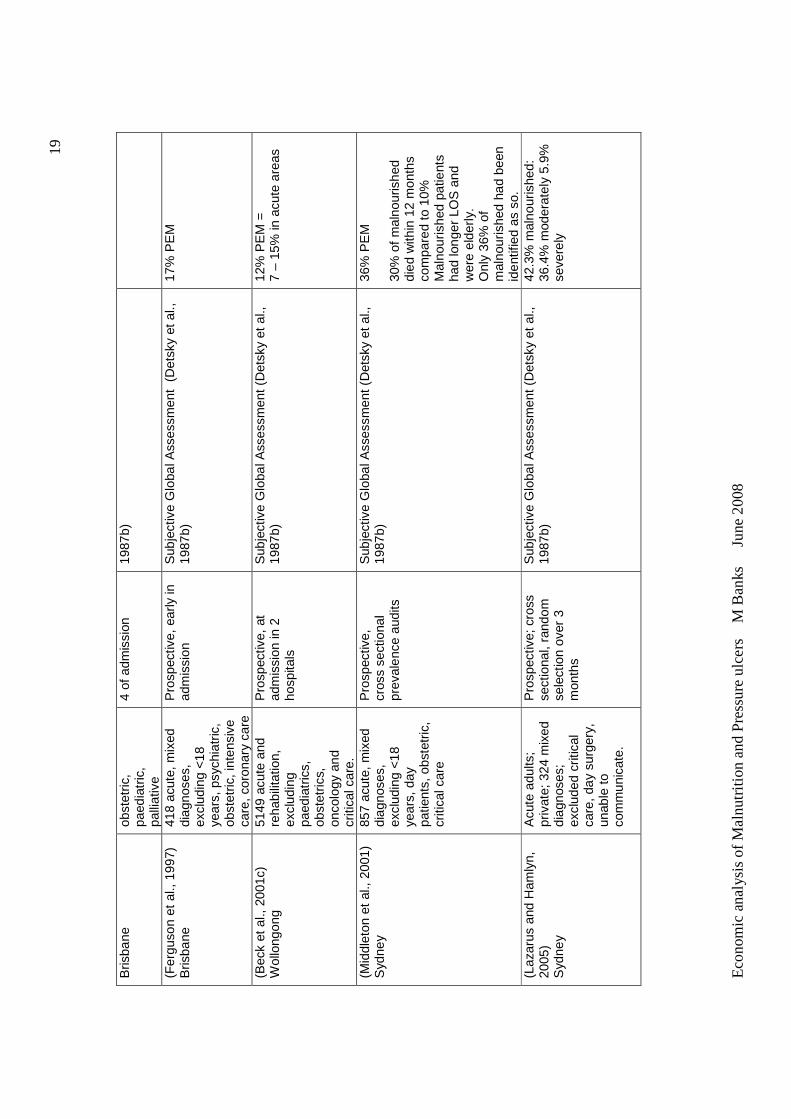
Eco
nom
ic a
nal
ysis
of
Ma
lnut
ritio
n a
nd
Pre
ssu
re u
lce
rs
M B
anks
Ju
ne 2
008
19
Bris
bane
ob
stet
ric,
paed
iatr
ic,
palli
ativ
e
4 of
adm
issi
on
1987
b)
(Fer
guso
n et
al.,
199
7)
Bris
bane
41
8 ac
ute,
mix
ed
diag
nose
s,
excl
udin
g <
18
year
s, p
sych
iatr
ic,
obst
etric
, int
ensi
ve
care
, cor
onar
y ca
re
Pro
spec
tive,
ear
ly in
ad
mis
sion
S
ubje
ctiv
e G
loba
l Ass
essm
ent
(Det
sky
et a
l.,
1987
b)
17%
PE
M
(Bec
k et
al.,
200
1c)
Wol
long
ong
5149
acu
te a
nd
reha
bilit
atio
n,
excl
udin
g pa
edia
tric
s,
obst
etric
s,
onco
logy
and
cr
itica
l car
e.
Pro
spec
tive,
at
adm
issi
on in
2
hosp
itals
Sub
ject
ive
Glo
bal A
sses
smen
t (D
etsk
y et
al.,
19
87b)
12
% P
EM
=
7 –
15%
in a
cute
are
as
(Mid
dlet
on e
t al
., 20
01)
Syd
ney
857
acut
e, m
ixed
di
agno
ses,
ex
clud
ing
<18
ye
ars,
day
pa
tient
s, o
bste
tric
, cr
itica
l car
e
Pro
spec
tive,
cr
oss
sect
iona
l pr
eval
ence
aud
its
Sub
ject
ive
Glo
bal A
sses
smen
t (D
etsk
y et
al.,
19
87b)
36
% P
EM
30
% o
f m
alno
uris
hed
died
with
in 1
2 m
onth
s co
mpa
red
to 1
0%
Mal
nour
ishe
d pa
tient
s ha
d lo
nger
LO
S a
nd
wer
e el
derl
y.
Onl
y 36
% o
f m
alno
uris
hed
had
been
id
entif
ied
as s
o.
(Laz
arus
and
Ham
lyn,
20
05)
Syd
ney
Acu
te a
dults
; pr
ivat
e; 3
24 m
ixed
di
agno
ses;
ex
clud
ed c
ritic
al
care
, day
sur
gery
, un
able
to
com
mun
icat
e.
Pro
spec
tive;
cro
ss
sect
iona
l, ra
ndom
se
lect
ion
over
3
mon
ths
Sub
ject
ive
Glo
bal A
sses
smen
t (D
etsk
y et
al.,
19
87b)
42
.3%
mal
nour
ishe
d:
36.4
% m
oder
atel
y 5.
9%
seve
rely
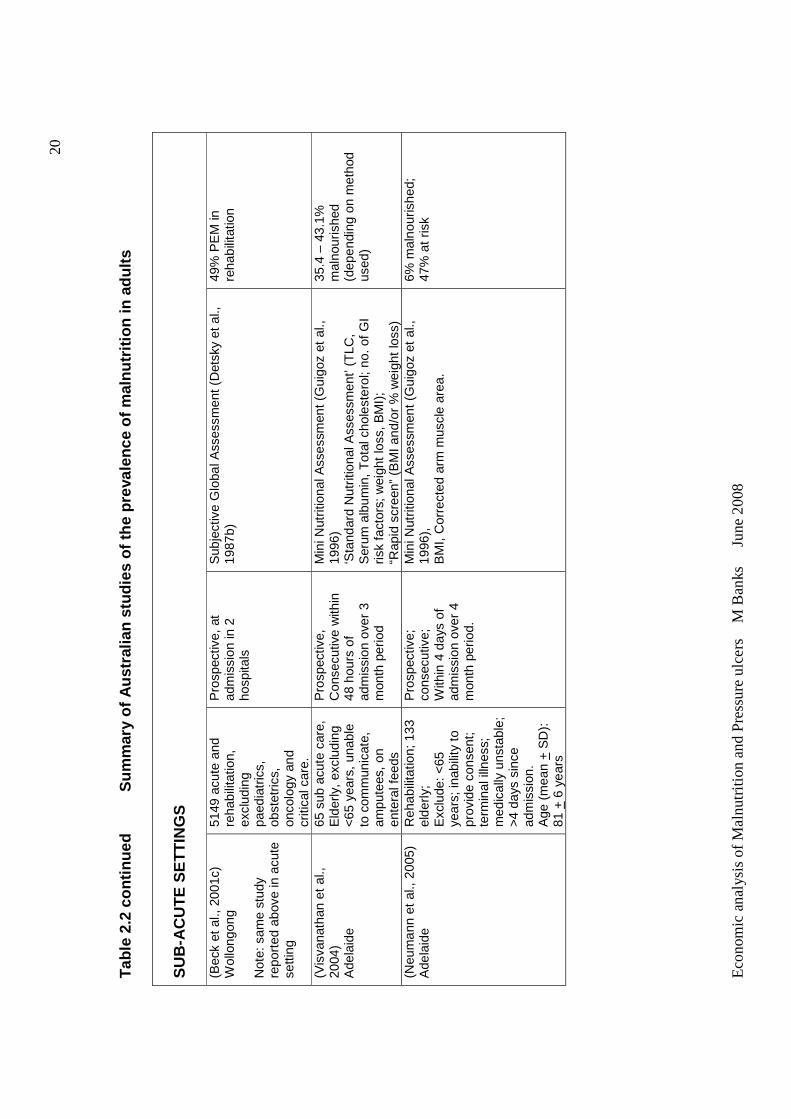
Eco
nom
ic a
nal
ysis
of
Ma
lnut
ritio
n a
nd
Pre
ssu
re u
lce
rs
M B
anks
Ju
ne 2
008
20
Tab
le 2
.2 c
ontin
ued
Sum
mar
y of
Aus
tral
ian
stud
ies
of t
he p
reva
lenc
e of
mal
nutr
ition
in a
dults
S
UB
-AC
UT
E S
ET
TIN
GS
(B
eck
et a
l., 2
001c
) W
ollo
ngon
g N
ote:
sam
e st
udy
repo
rted
abo
ve in
acu
te
setti
ng
5149
acu
te a
nd
reha
bilit
atio
n,
excl
udin
g pa
edia
tric
s,
obst
etric
s,
onco
logy
and
cr
itica
l car
e.
Pro
spec
tive,
at
adm
issi
on in
2
hosp
itals
Sub
ject
ive
Glo
bal A
sses
smen
t (D
etsk
y et
al.,
19
87b)
49
% P
EM
in
reha
bilit
atio
n
(Vis
vana
than
et
al.,
2004
) A
dela
ide
65 s
ub a
cute
car
e,
Eld
erly
, ex
clud
ing
<65
yea
rs,
unab
le
to c
omm
unic
ate,
am
pute
es,
on
ente
ral f
eeds
Pro
spec
tive,
C
onse
cutiv
e w
ithin
48
hou
rs o
f ad
mis
sion
ove
r 3
mon
th p
erio
d
Min
i Nut
ritio
nal A
sses
smen
t (G
uigo
z et
al.,
19
96)
‘Sta
ndar
d N
utrit
iona
l Ass
essm
ent’
(TLC
, S
erum
alb
umin
, T
otal
cho
lest
erol
; no.
of G
I ris
k fa
ctor
s; w
eigh
t lo
ss, B
MI)
;
“Rap
id s
cree
n” (
BM
I and
/or
% w
eigh
t lo
ss)
35.4
– 4
3.1%
m
alno
uris
hed
(dep
endi
ng o
n m
etho
d us
ed)
(Neu
man
n et
al.,
200
5)
Ade
laid
e R
ehab
ilita
tion;
133
el
derly
; E
xclu
de:
<65
ye
ars;
inab
ility
to
prov
ide
cons
ent;
te
rmin
al il
lnes
s;
med
ical
ly u
nsta
ble;
>
4 da
ys s
ince
ad
mis
sion
. A
ge (
mea
n +
SD
):
81 +
6 y
ears
Pro
spec
tive;
co
nsec
utiv
e;
With
in 4
day
s of
ad
mis
sion
ove
r 4
mon
th p
erio
d.
Min
i Nut
ritio
nal A
sses
smen
t (G
uigo
z et
al.,
19
96),
B
MI,
Cor
rect
ed a
rm m
uscl
e ar
ea.
6% m
alno
uris
hed;
47
% a
t ris
k
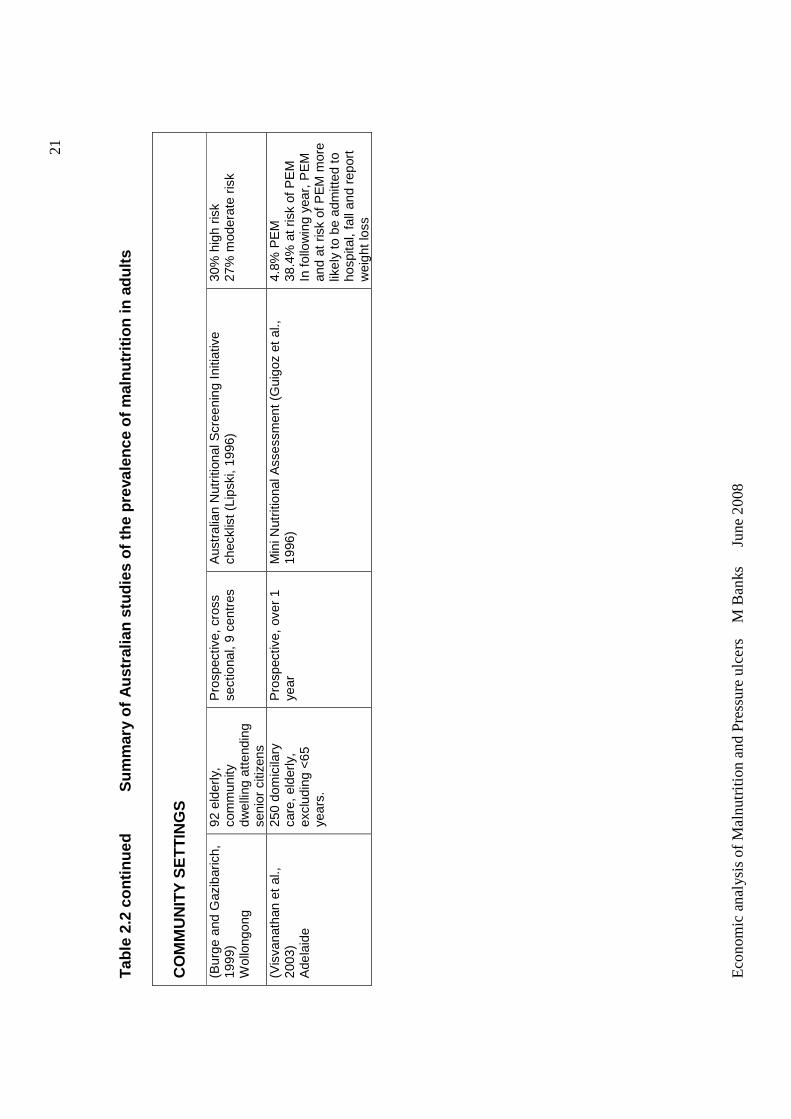
Eco
nom
ic a
nal
ysis
of
Ma
lnut
ritio
n a
nd
Pre
ssu
re u
lce
rs
M B
anks
Ju
ne 2
008
21
Tab
le 2
.2 c
ontin
ued
Sum
mar
y of
Aus
tral
ian
stud
ies
of t
he p
reva
lenc
e of
mal
nutr
ition
in a
dults
C
OM
MU
NIT
Y S
ET
TIN
GS
(B
urge
and
Gaz
ibar
ich,
19
99)
Wol
long
ong
92 e
lder
ly,
com
mun
ity
dwel
ling
atte
ndin
g se
nior
citi
zens
Pro
spec
tive,
cro
ss
sect
iona
l, 9
cent
res
Aus
tral
ian
Nut
ritio
nal S
cree
ning
Ini
tiativ
e ch
eckl
ist (
Lips
ki,
1996
) 30
% h
igh
risk
27%
mod
erat
e ris
k
(Vis
vana
than
et
al.,
2003
) A
dela
ide
250
dom
icila
ry
care
, eld
erly
, ex
clud
ing
<65
ye
ars.
Pro
spec
tive,
ove
r 1
year
Min
i Nut
ritio
nal A
sses
smen
t (G
uigo
z et
al.,
19
96)
4.8%
PE
M
38.4
% a
t ris
k of
PE
M
In fo
llow
ing
year
, P
EM
an
d at
ris
k of
PE
M m
ore
likel
y to
be
adm
itted
to
hosp
ital,
fall
and
repo
rt
wei
ght l
oss
Economic analysis of Malnutrition and Pressure ulcers M Banks June 2008
The majority of studies investigating the prevalence of malnutrition have been
undertaken in the hospital, particularly the acute care setting, with relatively few
conducted in residential care or community settings. In several countries large
multi-centre studies have been undertaken providing substantial evidence on the
prevalence of malnutrition, usually in the acute hospital setting, for these
countries (Correia and Campos, 2003, Correia and Waitzberg, 2003,
Dzieniszewski et al., 2005, Edington et al., 2000, Kamath et al., 1986, Kondrup et
al., 2002, Olmos et al., 2005, Barreto Penie, 2005, Pirlich et al., 2006, Saletti et
al., 2005, Suominen et al., 2005, Waitzberg et al., 2001, Wyszynski et al., 2003).
Published Australian studies on the prevalence of malnutrition demonstrate
similar findings to overseas studies, but are generally limited in number, with
none conducted across multiple centres, only two conducted in community
settings and none conducted in residential settings. Refer to Table 2.2.
Stratton et al (2003) in an international review of the prevalence of malnutrition in
patients with different disease groups, mixed diagnoses, across different age
groups and in different settings, concluded that malnutrition was common in
hospitals (10-60%), in residential aged care facilities (up to 50% or more) and in
free living individuals with severe or multiple disease (>10%).
There is a wide range in the proportion of patients being classified as
malnourished. Variation in the reported prevalence of malnutrition could be due
to: different methods used to assess nutritional status; use of different
anthropometric standards and/or laboratory reference ranges; studies undertaken
in different countries; differences in patient population and criteria for inclusion in
the study; sample size; timing of the study with respect to duration of admission,
and decade of the study (Banks, 1995). These variables make it difficult to
compare these studies. In a review paper on the prevalence of malnutrition in
hospital inpatients, Corish and Kennedy (2000) found that a lack of guidelines or
cut off points for most nutrition related variables make nutritional assessment
Economic analysis of Malnutrition and Pressure ulcers M Banks June 2008
23
difficult and proper comparisons between studies impossible. This paper
highlighted the problems which arise when deciphering studies on malnutrition in
hospitals/ institutions and the resulting difficulty in determining the true
prevalence of malnutrition and nutrition risk.
Even if a comparison is made of studies undertaken in the same decade, using
the same methodology and patient population, variations in prevalence are still
found. Studies by Braunschweig et al (2000), Waitzberg et al (2001), Kyle et al
(2002), Wyszynski et al (2003), Correia and Campos (2003), Correia and
Waitzberg (2003), Planas et al (2004), Olmos et al (2005), Pirlich et al (2006),
Ferguson et al (1997), Middleton et al (2001), Beck, E. et al (2001), and Lazarus
and Hamlyn (2005) all used Subjective Global Assessment (SGA) (Detsky et al.,
1987b) to determine nutritional status in acute hospitalized adults with mixed
diagnoses. Results of the prevalence of malnutrition in these studies are
summarized in Table 2.3.
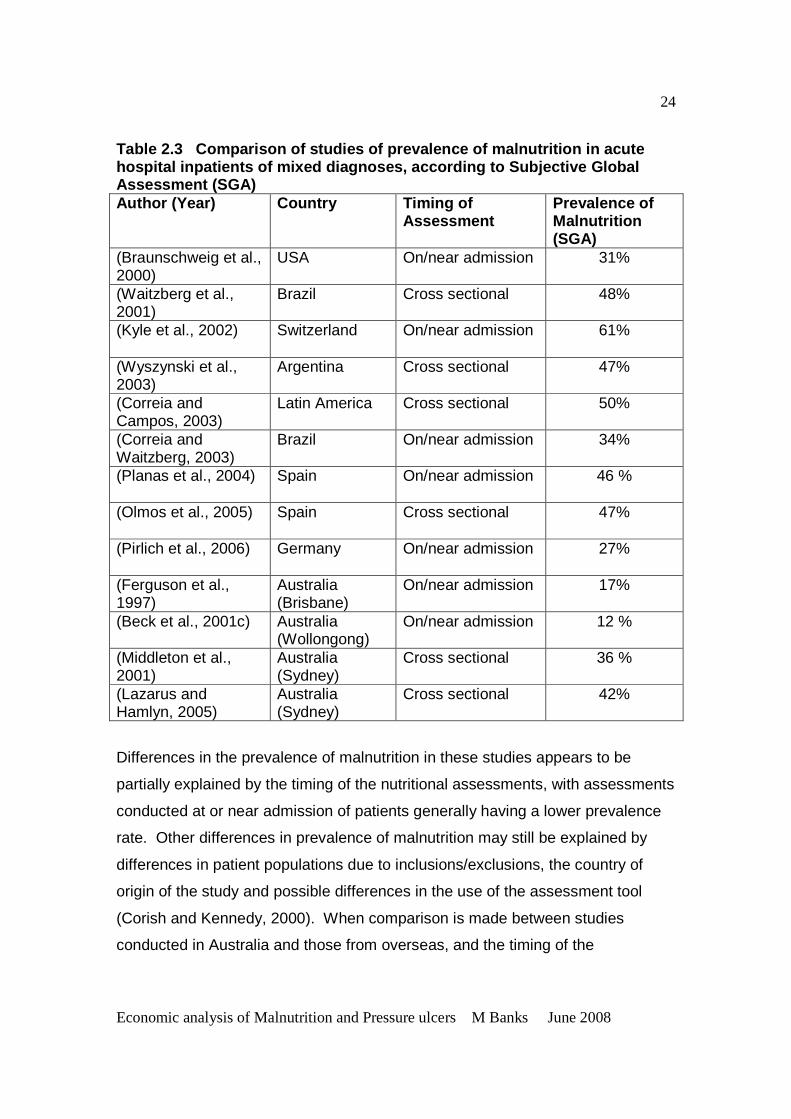
Economic analysis of Malnutrition and Pressure ulcers M Banks June 2008
24
Table 2.3 Comparison of studies of prevalence of malnutrition in acute hospital inpatients of mixed diagnoses, according t o Subjective Global Assessment (SGA) Author (Year) Country Timing of
Assessment Prevalence of Malnutrition (SGA)
(Braunschweig et al., 2000)
USA On/near admission 31%
(Waitzberg et al., 2001)
Brazil Cross sectional 48%
(Kyle et al., 2002)
Switzerland On/near admission 61%
(Wyszynski et al., 2003)
Argentina Cross sectional 47%
(Correia and Campos, 2003)
Latin America Cross sectional 50%
(Correia and Waitzberg, 2003)
Brazil On/near admission 34%
(Planas et al., 2004)
Spain On/near admission 46 %
(Olmos et al., 2005)
Spain Cross sectional 47%
(Pirlich et al., 2006)
Germany On/near admission 27%
(Ferguson et al., 1997)
Australia (Brisbane)
On/near admission 17%
(Beck et al., 2001c) Australia (Wollongong)
On/near admission 12 %
(Middleton et al., 2001)
Australia (Sydney)
Cross sectional 36 %
(Lazarus and Hamlyn, 2005)
Australia (Sydney)
Cross sectional 42%
Differences in the prevalence of malnutrition in these studies appears to be
partially explained by the timing of the nutritional assessments, with assessments
conducted at or near admission of patients generally having a lower prevalence
rate. Other differences in prevalence of malnutrition may still be explained by
differences in patient populations due to inclusions/exclusions, the country of
origin of the study and possible differences in the use of the assessment tool
(Corish and Kennedy, 2000). When comparison is made between studies
conducted in Australia and those from overseas, and the timing of the
Economic analysis of Malnutrition and Pressure ulcers M Banks June 2008
25
assessment is taken into account, the studies conducted in Australia appear to
find a lower prevalence of malnutrition. This may be expected if comparison is
made to countries in Latin America, but would not be expected when comparing
to other developed countries such as USA and Germany.
A number of studies have also found deterioration in nutritional status in a
significant proportion of hospitalised patients over the course of their admission
(Braunschweig et al., 2000, Bruun et al., 1999, Dzieniszewski et al., 2005,
Gariballa, 2001, Incalzi et al., 1998, Kondrup et al., 2002, McWhirter and
Pennington, 1994, Pinchcofsky and Kaminski, 1985, Sullivan et al., 1999,
Weinsier et al., 1979). For example, McWhirter and Pennington (1994) in the
UK found 54% of 31 well nourished patients and 75% of 55 malnourished
patients had deterioration in nutritional status from admission to discharge.
Bruun et al (1999) from Norway reported 83% of 64 surgical patients admitted for
greater than seven days (median stay 14 days, range 3-115 days) lost weight
during admission, with 8% (5) losing greater than 10% of body weight. Of the 21
patients who had recent weight loss of greater than 5% at admission, 17 (81%)
continued to lose weight. Braunschweig et al (2000) assessed the nutritional
status on admission and discharge of 404 patients admitted for at least seven
days in a USA hospital, and found overall 31% of patients experienced declines
in nutritional status during admission.
Summary
Despite many studies showing high levels of malnutrition in a variety of settings
from different countries, it is difficult to ascertain the actual prevalence of
malnutrition in hospitals, residential care or the community, or to apply these
findings to Australian setting in general. However, the large number of studies
indicating a high prevalence of malnutrition and ongoing decline in nutritional
status indicates that malnutrition does occur to a substantial degree, and across
many different populations and diagnostic groups. In Australia, this issue is
worthy of further valid research using standardized methodology.
Economic analysis of Malnutrition and Pressure ulcers M Banks June 2008
26
2.3 CAUSES OF MALNUTRITION
2.3.1 Aetiology
The causes of malnutrition are multifactorial and although the aetiology is
complex, malnutrition may develop due to inadequate dietary intake, increased
metabolic demands or increased nutrient losses, or a combination of these
(Corish and Kennedy, 2000). The lack of a suitable food supply and other
environmental factors due to poverty are beyond the scope of this thesis.
The main cause of malnutrition in developed countries, particularly in adults, is
disease, hence the term ‘disease associated malnutrition’ (Stratton et al., 2003,
Corish and Kennedy, 2000). The older population is at particular risk of
nutritional deficiency due to physiological changes associated with ageing and
increased prevalence of disease (Brownie, 2006).
Ageing is associated with a decline in a number of physiological functions that
can impact nutritional status, including: reduced lean body mass and a resultant
decrease in basal metabolic rate; decreased appetite; sensory function deficits in
taste and smell; decreased gastric secretions of digestive juices; changes in the
oral cavity effecting ability to chew and swallow; impaired cognitive function;
reduced manual dexterity resulting in difficulty with feeding oneself; changes in
fluid and electrolyte regulation and chronic illness. Medication, hospitalization
and other social determinants also can contribute to nutritional inadequacy
(Brownie, 2006, Abbasi and Rudman, 1994).
The development of disease may be accompanied by many physiological factors
which cause malnutrition, and for the elderly compound the impacts on nutritional
status of ageing. Depression and chronic illness may lead to anorexia. Patients
with neurological disorders such as cerebrovascular disease and motor neurone
disease may be unable to eat. Intestinal disease such as coeliac disease,
Economic analysis of Malnutrition and Pressure ulcers M Banks June 2008
27
Chrohn’s disease, radiation enteritis and motility disorders reduce the efficacy of
the intestine and are frequently accompanied by maldigestion and the impaired
absorption of nutrients. The additional influence of infection, burns and trauma
including surgical operations may lead to accelerated nutritional decline from
metabolic changes attributed principally to the release of cytokines. These
metabolic changes include increased protein and fat breakdown. In addition,
immobility causes wasting of muscles and weakness (Pennington, 1998).
Inadequate nutritional intake compounds these effects. Inadequate nutritional
intake may be due to the provision of inadequate quantities of suitable food or
difficulties in consuming it (Allison, 2001).
2.3.2 Failure to recognize, reduce the incidence a nd treat malnutrition
The majority of authors describing malnutrition in hospitals/ institutional settings
cite a lack of awareness and recognition of the problem by medical and nursing
staff. This lack of awareness and recognition of the problem of malnutrition has
resulted in a lack of activities to identify, prevent and treat malnutrition, and other
practices which may contribute to increasing the prevalence of malnutrition
(Askew et al., 1982, Bistrian et al., 1974, Blackburn and Ahmad, 1995, Burns and
Jensen, 1995, Butterworth, 1974, Butterworth and Blackburn, 1975, Corish and
Kennedy, 2000, Correia and Campos, 2003, Correia and Waitzberg, 2003,
Edington et al., 1997, Farthing, 1994, Hall et al., 2000, Hill et al., 1977, Huang,
2001, Incalzi et al., 1998, Kondrup et al., 2003a, Lennard-Jones et al., 1995,
McWhirter and Pennington, 1994, Pennington, 1998, Roubenoff et al., 1987,
Waitzberg et al., 2001, Weekes et al., 2004, Wood et al., 1985, Wyszynski et al.,
2003, Edington et al., 2000, Lazarus and Hamlyn, 2005, Middleton et al., 2001,
Rasmussen et al., 2004, Porben, 2006, Singh et al., 2006, Kelly et al., 2000,
Nightingale and Reeves, 1999). For example, of 168 patients identified as
malnourished in a UK multi-centre study, only 41 (24%) were referred to a
dietitian for nutrition intervention (Edington et al., 2000). In a Danish multi centre
study (Rasmussen et al., 2004) documentation of nutritional risk or nutrition care
Economic analysis of Malnutrition and Pressure ulcers M Banks June 2008
28
plan was found to be poor. Out of 590 patients, 39.9% were nutritionally at risk,
but only 7.6% of medical records contained information about nutritional risk.
One quarter of the patients lost weight during hospitalization, but only in 4% of all
records was weight loss recorded during hospitalization. Only 14.2% of patients
had nutrition plan recorded, more often in patients at nutritional risk (32.8%), but
the quality of the nutrition plans varied considerably. In a Canadian study (Singh
et al., 2006) only one out of 48 patients assessed as malnourished was identified
as such by medical staff. References to nutritional status were recorded for only
two patients. History of weight loss, appetite, current intake and functional status
was recorded for only 33% of patients.
In Australia, Middleton et al. (2001) found that only 36% of 295 malnourished
patients had been previously identified as such, including only half of the severely
malnourished patients. Lazarus and Hamlyn (2005) found only one of 137
patients identified as malnourished in their study was documented as such in the
medical record and only 21 (15.3%) were referred for nutrition intervention.
Therefore a majority of malnourished patients in these studies were not receiving
specialized nutrition care.
Green (1999) summarized the reasons for the lack of awareness and recognition
of the problem of malnutrition in institutions, including:
• Lack of training and knowledge of medical and nursing staff
• Lack of interest, failure to regard nutrition as important and/or poor
recording in hospital notes.
• Scarcity of specialist clinical nutrition appointments.
• Lack of hospital management policies with appropriate resources
• Lack of good practice guidelines and (nationally) agreed standards.
• Lack of organization of nutritional services within hospitals linking relevant
disciplines, lack of a nutrition team and/or lack of continuity in
responsibility for nutritional care support, both internally and between
hospital and community.
Economic analysis of Malnutrition and Pressure ulcers M Banks June 2008
29
Specific factors which have been identified as contributing to the failure to
recognize, reduce the incidence of and treat malnutrition have been reported for
over 30 years. Butterworth (1974) described a number of routine hospital
practices which potentially adversely affect the nutritional status of patients,
including:
1. Failure to record height and weight.
2. Rotation of staff at frequent intervals.
3. Diffusion of responsibility of patient care.
4. Prolonged use of glucose and saline intravenous feedings.
5. Failure to observe patients’ food intake.
6. Withholding meals because of diagnostic tests.
7. Use of tube feedings in inadequate amounts, of uncertain composition,
and under insanitary conditions.
8. Ignorance of the composition of vitamin mixtures and other nutritional
products.
9. Failure to recognize increased nutritional needs due to injury or illness.
10. Performance of surgical procedures without first making certain that the
patient is optimally nourished, and failure to give the body nutritional
support after surgery.
11. Failure to appreciate the role of nutrition in the prevention of and recovery
from infection, and unwarranted reliance on antibiotics.
12. Lack of communication and interaction between physician and dietitian.
As staff professionals, dietitians should be concerned with the nutritional
health of every hospital patient.
13. Delay of nutrition support until the patient is in an advanced state of
depletion, which is sometimes irreversible.
14. Limited availability of laboratory tests to assess nutritional status, and
failure to use those that are available.
Many of these practices remain common today (Corish and Kennedy, 2000).
Economic analysis of Malnutrition and Pressure ulcers M Banks June 2008
30
The lack of clear assignment of responsibility in the nutritional care of patients
was also pointed out by authors in the 1970s (Bistrian et al., 1974, Butterworth,
1974, Butterworth and Blackburn, 1975, Tobias and Van Itallie, 1977).
Professional responsibility for prevention of malnutrition in hospital has never
been resolved, as it lies on the occupational interface between medicine, nursing
and dietetics (Jordan et al., 2003). Jordan et al, (2003) discussed that with ill-
defined professional territory, all professionals may abrogate responsibility
exposing a ‘care gap’. The nutritional care of patients is the responsibility of at
least medical, nursing, dietetic and food services staff in institutions. The sharing
of responsibility between these groups would indicate that clear roles and
responsibilities of the healthcare workers are required, as well as multidisciplinary
nutrition care teams to oversee the coordination of nutrition care (Allison, 2001).
In Australia, the situation is equally applicable as detailed in studies published
overseas. Wood et al. (1985) from Victoria discussed their findings of
malnutrition in hospitalized patients frequently remaining invisible, with that
characteristic being mainly responsible for failure to initiate nutritional
intervention. They stated, “Nutrition is not a high technology science. This often
contributes to its low priority in medical care. Modest revisions of attitudes and
administrative support, and further development of nutrition and food service
policies within hospitals, would provide cost-effective improvement in the
nutritional status of hospitalised patients.” It would seem, based on the finding
from Middleton et al, (2001) and Lazarus and Hamlyn (2005) of the lack of
identification and treatment of a majority of malnourished patients, that little has
changed in Australia since this work, and that these statements still apply.
A few studies have been conducted to determine attitudes and practices of
individual clinicians regarding the provision of nutritional care. These studies
have highlighted a low priority placed on nutritional care by many clinical staff.
Lennard-Jones et al, (1995) surveyed 454 nurses and 319 doctors in 70 hospitals
in the UK to determine if they assessed patients for malnutrition on admission to
Economic analysis of Malnutrition and Pressure ulcers M Banks June 2008
31
hospitals and where they did not assess nutritional status, their reasons for not
doing so (Lennard-Jones et al., 1995). About two thirds of the doctors and
nurses asked patients about recent food intake. About half the nurses and 70%
of the doctors asked about unintentional weight loss. This information was
recorded in the medical notes on 52 to 73% of occasions. Two thirds of nurses
weighed the patient and approximately 90 per cent of results were recorded.
Most nurses and doctors who asked no questions about nutrition reported they
failed to do so because they regarded them as unimportant. Other reasons
included that the patient was too ill and there was lack of time.
A Danish study found large a discrepancy between attitudes toward appropriate
nutritional care and clinical practice in a survey of doctors and nurses conducted
in 1998 (Rasmussen et al., 1999). They concluded that standards of nutritional
care fell short and that the main barriers were lack of priority, lack of knowledge
and lack of interest of the medical and nursing staff. The survey was repeated in
2004 across Scandinavian countries (Mowe et al., 2006). Again it was found that
there was a large discrepancy between attitudes and practice. Good nutritional
practice was reported only in a small proportion of the responders even though
about 90% agreed that it was important to increase efforts and focus on nutrition
practice. Interestingly, compared to Norway, both Sweden and Denmark had
better results for practice. Denmark has had a focus on treatment of hospital
malnutrition for many years and Sweden has a long history in clinical nutrition
research. Both countries also have national guidelines regarding nutritional care
and national societies in clinical nutrition, focusing on hospital malnutrition.
A comparison of the 1998 and 2004 survey results for Denmark was also
undertaken and reported significant positive changes in nutritional care practice
(Lindorff-Larsen et al., 2007). This was attributed to the nation wide initiatives
that had been undertaken to promote action related to malnutrition in hospitals as
a high priority. This study shows that the promotion of the importance of
nutritional care can lead to related improvements.
Economic analysis of Malnutrition and Pressure ulcers M Banks June 2008
32
2.3.3 Inadequate nutrition and food service system s
One of the major causes of malnutrition in institutions is the failure to provide
adequate nutrition in a form appropriate for patients, despite adequate quantities
of food usually being delivered (Allison, 2000). Economic and system constraints
may result in limited choice and often unpalatable meals served in a way that
makes them unappealing and inaccessible, in difficult to open containers, often
out of reach of incapacitated patients. The lack of flexibility in hospital food
services including restricted mealtimes and lack of availability of food between
meals, especially over night, contributes to the problem (Corish and Kennedy,
2000). In addition, many patients have complex eating disabilities and may not
receive adequate assistance with eating (Green, 1999). Studies have found
where nursing staff are not involved in the provision of the meal service, patients
frequently do not receive the assistance they require to consume their meal, and
nursing staff are not aware of patient’s food and fluid intake (Kowanko, 1997,
Carr and Mitchell, 1991).
A number of studies have found a significant proportion of patients do not
consume enough food (Allison, 2000, Corish and Kennedy, 2000, Dupertiuis et
al., 2003, Incalzi et al., 1998, Sullivan et al., 1999). For example, one USA study
found 21% of 497 elderly hospitalised patients consumed less than 50% of their
estimated energy requirements (Sullivan et al., 1999). These patients, who did
not differ significantly from the other patients in admission illness severity and
nutritional status, had a significantly lower nutritional status at discharge and a
higher rate of in hospital mortality and subsequent 90 day mortality. Another
study conducted with 370 elderly patients in Italy found the average daily energy
intake was 63 + 40%, 63 + 31% and 69 + 34% of that required in a surgical,
medical and geriatric ward respectively, and that inadequate intake was a co
contributor to the risk of hospital mortality (Incalzi et al., 1998). Similarly, in a
Swiss study, 70% of 1400 patients did not eat enough according to their
estimated requirements, despite the meal service providing well in excess of
Economic analysis of Malnutrition and Pressure ulcers M Banks June 2008
33
requirements (Dupertiuis et al., 2003). They examined reasons why patients did
not consume adequate nutrition and found that the food intake of 69% of those
that did not eat enough was not due to the affects of disease per se but other
modifiable causes, such as quality of food service. They stated therefore that
there is potential to improve the meal service and assistance with meals to
improve the intake of patients. Similarly, a review of poor intake by hospitalised
elderly found that while factors such as dementia, depression, various disease
states, drugs and social and environmental factors effect nutritional intake, most
factors were modifiable and able to be addressed to improve nutritional intake
(Marcus and Berry, 1998)
Abbasi and Rudman (1994) describe a study across USA Veterans Affairs
nursing homes, where two different nursing homes with markedly different
frequencies of reported underweight residents are compared for their standard of
nutritional care. They report the low prevalence of malnutrition and other
negative health outcomes in the nursing home where few residents were
underweight to be in part due to the quality of food and nutritional care provided
in that institution. A study recently undertaken in Canada demonstrated that
certain characteristics of a nursing home food service were associated with
residents being at risk or malnourished. They surveyed 183 randomly selected
cognitively intact residents from 38 different nursing homes and found food
service factors including food packages, food delivery systems, serving dishes,
menu cycle length, and overall food satisfaction all significantly associated with
risk of malnutrition (Carrier et al., 2007).
Related to patients poor intake is high food wastage, which is often in the order of
30-40% (Barton et al., 2000a). In a study by Barton et al (2000a) wastage rates
of more than 40% of food provided in a university hospital over a month resulted
in energy and protein intakes of patients being less than 80% of minimum
recommended. Dupertiuis et al. (2003) found an average of 23% of energy and
25% of protein wasted in a survey of 1400 patients.
Economic analysis of Malnutrition and Pressure ulcers M Banks June 2008
34
These studies provide a possible explanation for the continuing decline in
nutritional status of patients during hospital admission and in residential facilities
despite the provision usually of adequate quantities of food, and represent a
large waste of resources. The wastage of these resources should be reduced
and redirected into improving intakes of patients (Allison, 2001).
A number of studies in both the hospital and residential aged care settings
demonstrate that changes to the provision of food and nutrition services to better
meet individual requirements and increased encouragement and assistance with
meals can improve nutritional intake (Barton et al., 2000b, Gall et al., 1998,
Joansen et al., 2004, Nijs et al., 2006, Odlund Olin et al., 2003).
When patients cannot eat sufficiently to meet requirements, nutrition support in
the form of oral supplements, tube feeding and parenteral nutrition are also
available. However, as already discussed, many studies document the lack of
identification and the consequent lack of receipt of specialized nutrition care of
patients at risk of or already malnourished (Burns and Jensen, 1995, Correia
and Campos, 2003, Edington et al., 2000, Kondrup et al., 2002, Kruizenga et al.,
2003, McWhirter and Pennington, 1994, Middleton et al., 2001, Pennington,
1998, Rasmussen et al., 2004, Waitzberg et al., 2001, Wood et al., 1985,
Wyszynski et al., 2003, Tobias and Van Itallie, 1977, Sullivan et al., 1999, Incalzi
et al., 1998, Gariballa, 2001, Lazarus and Hamlyn, 2005, Kelly et al., 2000,
Porben, 2006).
Summary
The causes of malnutrition are multifactorial, but it essentially develops due to
inadequate intake, increased metabolic demands or increased nutrient losses, or
a combination of these which may occur in disease. However, the majority of
literature cites the frequent failure to recognize malnutrition and its
Economic analysis of Malnutrition and Pressure ulcers M Banks June 2008
35
consequences, and/or the absence of effective food and nutrition support
systems to reduce the incidence and treat malnutrition, as largely contributing to
the problem of malnutrition.
2.4 CONSEQUENCES OF MALNUTRITION
Malnutrition is recognized as having serious implications for health and for
recovery from illness or surgery (Corish and Kennedy, 2000). Malnutrition is
associated with decreased: skeletal muscle function (for example, ability to walk
and undertake voluntary tasks); somatic muscle function (for example, lung and
cardiac muscle function); gastrointestinal function (ability to consume, digest and
absorb nutrients); immune function (for example, decreased ability to fight
infection) and wound healing. The consequences of these functional changes
increase the incidence of complications and impact on clinical outcome (morbidity
and mortality). These factors then in turn have major implications for length of
hospital stay, readmission to hospital, quality of life, convalescence and
healthcare costs (Green, 1999).
2.4.1 Morbidity and mortality
Increased complications (including infection, pressure ulcers, poor wound healing
and poor functional status) and mortality have been found to be associated with
malnutrition in many studies in: surgical patients (Detsky et al., 1987a,
Marshman et al., 1980, Mullen et al., 1979a, Warnold and Lundholm, 1984);
elderly female orthopaedic surgical patients (Bastow et al., 1983, Lumbers et al.,
1996); stroke patients (Gariballa, 2001); geriatric patients (Burns and Jensen,
1995, Covinsky et al., 1999, Incalzi et al., 1998, Persson et al., 2002); medical
patients (Naber et al., 1997); critically ill patients (Giner et al., 1995) and mixed
patient groups (Correia and Waitzberg, 2003, Middleton et al., 2001, Edington et
al., 2000). For example, in a USA study examining the relationship between
nutritional status and outcomes in 369 older hospitalized medical patients,
Covinsky et al (1999) found in a logistic regression model controlling for acute
Economic analysis of Malnutrition and Pressure ulcers M Banks June 2008
36
illness severity, co-morbidity, and functional status on admission, that severely
malnourished patients were more likely than well nourished patients to die within
one year of discharge (OR=2.83, 95% CI 1.47-5.45), to be dependent in activities
of daily living 3 months after discharge (OR=2.81, 95% CI 1.06-7.46), and to
spend time in a nursing home during the year after discharge (OR = 3.22, 95% CI
1.05-9.87).
In Australia, Middleton et al (2001) in found in a study of 819 patients that the
incidence of mortality at 12 months for malnourished patients (36%) admitted to
two Sydney teaching hospitals to be 30%, compared with 10% in those that had
been classified as well nourished. Neumann et al (2005) found in a study of 133
elderly patients (> 65 years) admitted to an Adelaide rehabilitation hospital, that
subjects at risk of malnutrition or malnourished (53%) were more likely to require
a higher level of care (p<0.05), and had poorer function at 90 days (p<0.017).
The association between malnutrition and pressure ulcers is discussed later in
Section 2.10.2.
2.4.2 Quality of life
Quality of life has also been shown to be lower in patients with malnutrition than
patients who are well nourished (Brantervik et al., 2005, Ferguson, 1999,
Larsson et al., 1994, Neumann et al., 2005). For example, in the study by
Neumann et al (2005) described above, rehabilitation patients that were
malnourished reported poorer quality of life on admission (p<0.008) and after 90
days (p=0.017) .
2.4.3 Length of hospital stay
Many studies have found extended length of hospital stays associated with
malnutrition (Correia and Waitzberg, 2003, Burns and Jensen, 1995, Covinsky et
al., 1999, Chima et al., 1997, Edington et al., 2000, Giner et al., 1995, Gallagher-
Allred et al., 1996, Marshman et al., 1980, Naber et al., 1997, Warnold and
Economic analysis of Malnutrition and Pressure ulcers M Banks June 2008
37
Lundholm, 1984, Planas et al., 2004, Waitzberg et al., 2001, Middleton et al.,
2001, Weinsier et al., 1979, Dreblow et al., 1981, Messner et al., 1991, Correia
and Campos, 2003, Robinson et al., 1987, Pichard et al., 2004, Reilly et al.,
1988, Tucker and Miguel, 1996, Banks, 1995, Pirlich et al., 2006, Neumann et al.,
2005, Brantervik et al., 2005). For example, a recently published study by Pirlich
et al (2006) in Germany found in a multi-centre study of 1886 hospitalized
patients, that those classified as malnourished exhibited a significantly longer
length of stay compared to well nourished patients (average difference 4.6 days
or 42%) (p<0.001).
In Australia, in the study of 819 patients by Middleton et al (2001) described
previously, malnourished subjects had a significantly longer median length of
stay compared to well nourished patients (17 days versus 11 days).
The validity of length of stay as an outcome parameter can be criticised because
of the many non-nutritional factors that can influence it. For example patients who
are malnourished are more likely to have higher illness acuity which itself may
require longer length of hospital stay. However these factors can be controlled
for, for example by comparing length of stay to diagnosis related group (DRG)
length of stay. This value is an average value determined for different diagnoses
and so comparing with this value controls for higher acuity illnesses. A study
conducted by this author as part of a Masters thesis (Banks, 1995) found in a
Brisbane hospital (n=59) that patients classified as malnourished (33.6%) had a
significantly greater difference between their actual length of hospital stay and
the DRG length of stay, by approximately 10-14 days, compared with well
nourished patients.
Length of stay is a valuable outcome measure as it captures the possible effects
of complications such as infections, impaired functional status and poor wound
healing. Changes in length of stay, while controlling for potential confounders,
Economic analysis of Malnutrition and Pressure ulcers M Banks June 2008
38
also allows estimates of economic costs related to complications to be made
(Green, 1999).
2.4.4 Admission and readmission to hospital
In addition to extended length of hospital stay, a number of studies have also
found an increased rate of admissions and readmissions associated with patients
who were malnourished (Burns and Jensen, 1995, Friedmann et al., 1997,
Planas et al., 2004). For example, in a study by Planas et al (2004) in 400 adult
hospitalized patients in Spain, not only did malnourished patients (46%) have
significantly increased length of stay compared to well nourished patients, they
had subsequently more non-elective readmissions.
In a study conducted in 250 recipients of domiciliary care services in the
community in Adelaide, subjects not classified as well nourished (43.2%) were
more likely than well nourished subjects to have been admitted to hospital (risk
ratio (RR) 1.51, 95% CI 1.07-2,14), have two or more emergency hospital
admission (RR=2.96, 95% CI 1.15-7.59), spend more than four weeks in hospital
(RR=3.22, 95% CI 1.29-8.07) and fall (RR=1.65, 95% CI 1.13-2.41) within the
next 12 months (Visvanathan et al., 2003).
2.4.5 Economic cost of malnutrition
The cost of disease associated malnutrition in the UK is predicted to be in the
order of >£7.3 billion per year (Elia, 2006). This was based on malnourished
patients visiting GPs more (65% more), having more hospital admissions (82%
more), longer lengths of hospital stay (>30% more) and greater likelihood of
admission to residential aged care homes, than well nourished individuals. About
50% is estimated to be expended on the care of malnourished patients in
hospitals, and most of the remainder in long term care facilities.
A few studies have examined the specific impact of poor nutritional status on
clinical outcome and extended length of hospital stays on the subsequent
Economic analysis of Malnutrition and Pressure ulcers M Banks June 2008
39
economic costs and found in all cases that malnutrition is associated with
increased economic costs (Robinson et al., 1987, Reilly et al., 1988, Chima et al.,
1997, Correia and Waitzberg, 2003, Braunschweig et al., 2000, Elia, 2006). For
example, Robinson et al (1987) (USA) prospectively audited 100 medical
admissions to determine the relationship between initial nutritional status, length
of stay and actual hospital charges. Patients defined as malnourished on
admission (40%) had a significantly longer average length of stay of 15.6 + 2/2
days compared to approximately 10 days in the well nourished and borderline
patients (p<0.01). Due to the longer length of stay, the hospital charges were
also significantly greater in the malnourished patients (US$16 691 + 4389, pre
1987 prices) compared with the well nourished group (US$7692 + 687). These
differences were observed in all diagnosis related groups.
In a retrospective review of 771 patient records (medical and surgical) in two US
acute care hospitals, patients identified as at risk of malnutrition (50% and 48%
for medical and surgical patients respectively) had significantly longer length of
stay which increased excess costs and charges by $1738 and $3557 per medical
or surgical patient respectively (pre-1988 prices). Complications were 2.6 or 3.4
times as likely in malnourished patients, and incurred an additional $2996 or
$6157 excess costs and charges per medical or surgical patient respectively
(Reilly et al., 1988).
Chima et al (1997) demonstrated in a prospective study that when compared to
patients regarded as not at risk, patients admitted to the medical service who
were classified as at risk of malnutrition (56 of the 172 studied) had significantly
longer median length of stay (6 versus 4 days), significantly higher mean hospital
costs ($6196 versus $4563, pre 1997 prices), and increased likelihood of
requiring home health care after discharge (31% versus 12%).
In 404 adults admitted to a tertiary hospital for more than seven days, patients
who declined nutritionally during hospitalization (31%), regardless of nutritional
Economic analysis of Malnutrition and Pressure ulcers M Banks June 2008
40
status on admission, had significantly higher mean hospital charges ($45 762
versus $28 631) compared with those who remained well nourished
(Braunschweig et al., 2000).
These consequences and costs are impressive, however whilst these studies
demonstrate an association, they do not demonstrate a direct link between
malnutrition per se (rather than underlying disease processes) and complications,
length of stay and thus cost. Research demonstrating an independent
association is provided in a retrospective study of over 700 patients in Brazil.
Correia and Waitzberg (2003) used a multivariate model to evaluate the unique
impact of malnutrition on morbidity, mortality and length of stay in hospital. They
showed the presence of malnutrition (34.2%) was associated with increased
complications (incidence was 27% in malnourished, relative risk = 1.6), length of
stay (16.7+ 24.5 days for malnourished versus 10.1 + 11.7 days), mortality
(12.4% in malnourished versus 4.7%) and hospital costs, which were increased
over 300% for malnourished patients. They adjusted for the effect of disease,
age, prevalence of infection and cancer as well as the absence of existing
complications on the outcome of the patient and hence determined malnutrition
to be an independent risk factor for increased morbidity, mortality, length of stay
and costs.
Whilst these studies all indicate significant costs related to malnutrition, all of the
studies presented can be criticized in relation to economic analysis methodology.
This is reviewed in detail in Section 2.20.
Summary
There is evidence in the literature that malnutrition is a significant adverse
prognostic factor for patients. Malnutrition has been shown to be an independent
risk factor for decreased quality of life, increased morbidity, mortality, length of
stay, admission and readmission to hospital, and costs. It will also be seen in a
Economic analysis of Malnutrition and Pressure ulcers M Banks June 2008
41
later section (Section 2.9.2) that malnutrition has been found to be independently
associated with the development of pressure ulcers.
2.5 PREVENTION AND TREATMENT OF MALNUTRITION - EFFE CTS OF NUTRITION INTERVENTION It has been shown that malnutrition exists in high proportions in institutionalized
patients and probably to a lesser extent in the community dwelling frail elderly/
disabled. It has also been demonstrated that malnutrition is associated with
deficits in functional indices, increased incidence of complications, prolonged
hospital stay and convalescence, increased mortality and greater costs. It
follows therefore that nutrition intervention (or nutrition support) should result in
improvement of nutritional status and clinical outcomes and reduction in costs.
There has however been general lack of good quality studies in the literature to
confirm this hypothesis.
2.5.1 Reviews of nutrition support interventions fo r malnutrition
A number of reviews, including several Cochrane systematic reviews of nutrition
support for malnutrition have been conducted and some are discussed (Akner
and Cederholm, 2001, Avenell and Handoll, 2006, Baldwin et al., 2007, Ferreira
et al., 2005, Milne et al., 2005, Stratton et al., 2003, Vanderkroft et al., 2007).
Akner & Cederholm (2001) summarized studies that evaluated the effect of
nutritional treatment in cases of protein energy malnutrition or risk of malnutrition,
in chronic non-malignant disorders (Akner and Cederholm, 2001). They
reviewed 90 nutrition treatment studies, 50 of which were randomized controlled
trials (RCTs). In 59 studies (66%) oral or enteral nutritional supplements were
used. Some of the overall effects are summarized in Table 2.4. Five studies
(6%, 2 RCTs) noted improved mortality, 38 studies (42%, 22 RCTs) found
improved functional capacities and 64 studies (71%, 35 RCTs) reported
anthropometric or biochemical improvement. Seventeen studies (19%, 14 RCTs)
found no improvement in functional capacity. Eleven studies (10%, 8 RCTs)
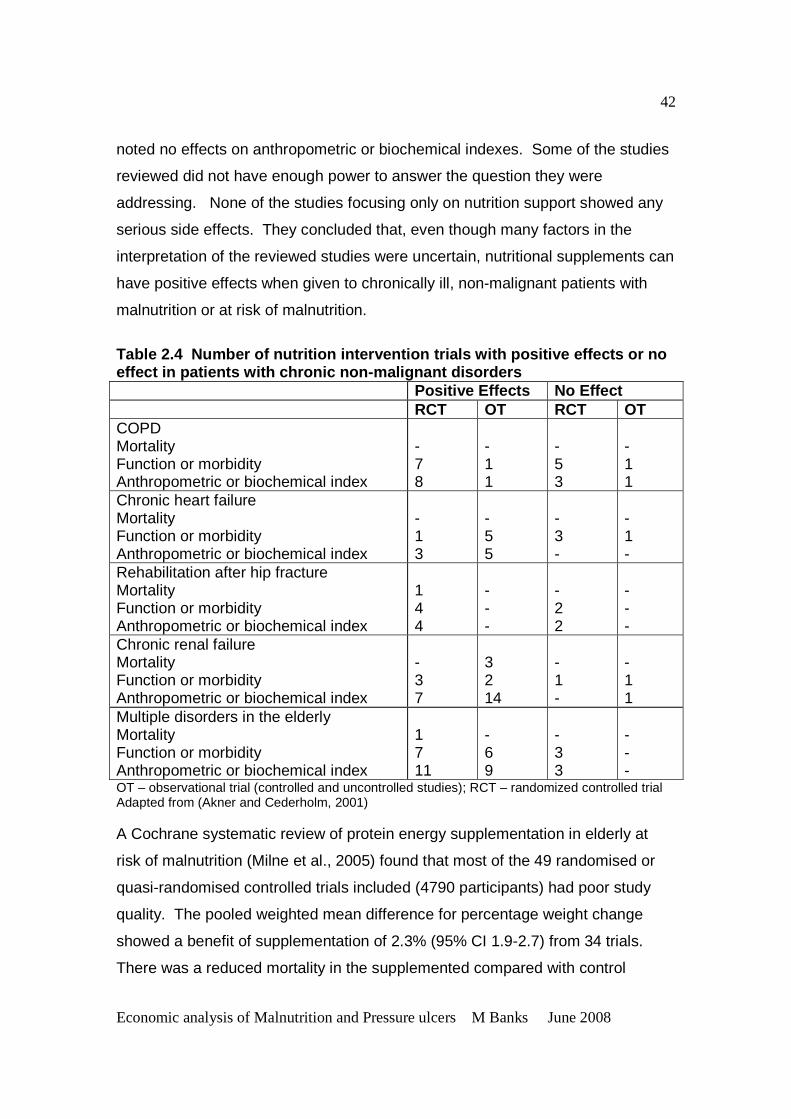
Economic analysis of Malnutrition and Pressure ulcers M Banks June 2008
42
noted no effects on anthropometric or biochemical indexes. Some of the studies
reviewed did not have enough power to answer the question they were
addressing. None of the studies focusing only on nutrition support showed any
serious side effects. They concluded that, even though many factors in the
interpretation of the reviewed studies were uncertain, nutritional supplements can
have positive effects when given to chronically ill, non-malignant patients with
malnutrition or at risk of malnutrition.
Table 2.4 Number of nutrition intervention trials with positive effects or no effect in patients with chronic non-malignant disor ders Positive Effects No Effect RCT OT RCT OT COPD Mortality Function or morbidity Anthropometric or biochemical index
- 7 8
- 1 1
- 5 3
- 1 1
Chronic heart failure Mortality Function or morbidity Anthropometric or biochemical index
- 1 3
- 5 5
- 3 -
- 1 -
Rehabilitation after hip fracture Mortality Function or morbidity Anthropometric or biochemical index
1 4 4
- - -
- 2 2
- - -
Chronic renal failure Mortality Function or morbidity Anthropometric or biochemical index
- 3 7
3 2 14
- 1 -
- 1 1
Multiple disorders in the elderly Mortality Function or morbidity Anthropometric or biochemical index
1 7 11
- 6 9
- 3 3
- - -
OT – observational trial (controlled and uncontrolled studies); RCT – randomized controlled trial Adapted from (Akner and Cederholm, 2001) A Cochrane systematic review of protein energy supplementation in elderly at
risk of malnutrition (Milne et al., 2005) found that most of the 49 randomised or
quasi-randomised controlled trials included (4790 participants) had poor study
quality. The pooled weighted mean difference for percentage weight change
showed a benefit of supplementation of 2.3% (95% CI 1.9-2.7) from 34 trials.
There was a reduced mortality in the supplemented compared with control
Economic analysis of Malnutrition and Pressure ulcers M Banks June 2008
43
groups (relative risk 0.74, 95% CI 0.59-0.92) from 32 trials. The risk of
complications from 14 trials showed no significant difference (relative risk 0.95,
95% CI 0.81-1.11). Few trials were able to suggest any functional benefits from
supplementation. There was some indication that mean length of hospital stay
was shortened, but the pooled weighted mean difference for length of stay from
10 trials did not show a statistically significant effect (-1.98 days, 95% CI -5.20-
1.24). These authors concluded that protein and energy supplementation
produced a small but consistent weight gain, and that there was a statistically
significant benefit on mortality. They however stated that there was insufficient
evidence of improvement of clinical outcomes, functional benefits or reduction in
length of hospital stay with supplementation, and that additional data from large
scale multi centre trials are still required.
A Cochrane review of dietary advice encouraging the use of energy- and nutrient-
rich foods rather than oral nutritional supplementation for the management of
disease-related malnutrition has also been undertaken (Baldwin et al., 2007).
There were 35 randomised controlled trials (2648 participants) included.
Significant improvements in weight at three months were found for groups
receiving dietary advice plus nutritional supplements compared with dietary
advice alone, (weighted mean difference 1.68kg, 95% CI 0.14-3.21) or no
additional advice (weighted mean difference 1.97 (95% CI 0.07-3.86). There
were significant improvements in grip strength and mid-arm muscle
circumference in the advice plus supplement groups compared with dietary
advice alone. It was uncertain whether nutritional supplements and dietary
advice produce the same effects. No significant differences were found between
groups for clinical outcomes. They concluded that a large adequately powered
randomised controlled trial is needed comparing the efficacy of different therapies
to increase dietary intake in people with illness-related malnutrition and
examining the impact of this on clinical function and survival.
Economic analysis of Malnutrition and Pressure ulcers M Banks June 2008
44
A review was recently undertaken to identify best available practices, in the
hospital setting, that minimise under-nutrition or the risk of under-nutrition, in the
acute care older patient (Vanderkroft et al., 2007). Twenty-nine studies met the
inclusion criteria (4021 participants). Information was sought on the following
outcomes: dietary intake measures including energy and protein intake and plate
waste; anthropometry and body composition measures including weight, body
mass index, skin folds, arm muscle circumference and mid arm circumference;
biochemical indicators including albumin and pre-albumin; clinical outcomes
including length of stay, mortality and prevalence or incidence of malnutrition;
functional indicators including handgrip strength and indicators of activities of
daily living. Studies were grouped and analysed as follows:
• The use of mixed oral nutrition supplement interventions: The focus of 15
interventions was supplying oral nutritional supplements with a mixed nutrient
profile (that is protein, fat, carbohydrates, vitamins and minerals) in addition to
the standard hospital diet to participants. Meta-analysis found strong evidence
to support that oral supplement interventions compared with standard hospital
care significantly improve weight status and arm muscle circumference (lean
body mass) in hospitalised elderly (p<0.05). The evidence for improved
handgrip strength was also promising but not significant due to a limited
number of studies. There was a non significant reduction in mortality. There
was no supportive evidence for improvement in mid arm circumference,
triceps skin fold thickness, albumin, pre-albumin, length of stay as a result of
oral supplement interventions.
• The use of enteral tube feeding nutrition interventions: There were six studies
involving enteral tube feeding nutrition therapy as an intervention. From the
conducted meta-analysis there was no strong evidence to support that enteral
tube feeding nutrition intervention compared with standard care improves
outcomes (death, weight, arm muscle circumference, mid arm circumference,
triceps skin fold, albumin, pre-albumin, length of stay and activities of daily
living).
Economic analysis of Malnutrition and Pressure ulcers M Banks June 2008
45
• The implementation of guidelines as an intervention: Guideline
implementation included screening for malnutrition and related nutrition care
pathways. Of the three studies reviewed, there was no consensus for any of
the outcome measures investigated to conclude on the effectiveness of
implementing guidelines aimed at minimising under-nutrition.
• Additional staff support interventions: There was only one study involving
additional staff support. There was no significant impact on any of the
outcome measures, however the study failed to report on the compliance
with the intervention by the staff.
• Changes to food provided as part of the hospital diet. All four studies
reviewed were successful in increasing protein and energy intakes of the
treatment group, but no other outcomes of interest were measured.
The findings of this review support the use of mixed oral supplements to minimise
under-nutrition in elderly inpatients. The results also however emphasise the
need for more high quality research using appropriate outcome measures in the
area of minimisation of under-nutrition.
Stratton et al (2003) conducted a comprehensive review and meta-analyses of
studies investigating the effects of oral nutritional supplements and enteral tube
feeding compared with routine clinical care in various patient groups and in
hospital and community settings. There were a number of physiological and
clinical outcome measures including mortality, complication rates, length of
hospital stay and body weight. They then conducted a combined analysis of the
oral nutritional supplements and enteral tube feeding intervention (nutrition
support) studies. Combined meta-analysis of 30 sets of randomized controlled
data across patient groups and healthcare settings found the following:
• Significant reductions in mortality (17% versus 25%, p<0.001; odds ratio 0.59
(95% CI 0.48-0.72), n=3258) occur with nutrition support in patient groups
who are or are not underweight, but are more likely if nutrition support is given
for more than two weeks.
Economic analysis of Malnutrition and Pressure ulcers M Banks June 2008
46
• Significant reductions in complication rates (28% versus 46%, p<0.001; odds
ratio 0.41 (95% CI 0.32-0.53), n=1710), particularly infective complications
(25% versus 44%, p<0.001, odds ratio 0.34 (95% CI 0.21-0.55)). The effect of
initial nutritional status and the duration and intake of nutrition support require
further study.
• Reduction in length of hospital stay occurs in most trials (70%) with a mean
reduction of 6 days (range 1-36 days) compared with controls. As data from
individual trials were presented as means or medians, with or without an
indication of the variability of results, a meta-analysis was not able to be
undertaken.
• Small improvements in body weight occur with nutrition support with either
greater percent weight gain or less percent weight loss than in patients given
standard clinical care. Weighted analysis of mean percent eight change
indicated a greater improvement (+2.85%) in patients that received nutrition
support. The greatest effect size was seen in patients who were classified as
underweight.
The combined analysis demonstrated significantly and clinically relevant effects
of nutrition support compared with standard care on mortality, complications and
length of stay.
2.5.2 Reviewing the reviews of nutrition support interventions for
malnutrition
It is interesting to note the different outcomes of these reviews. This can be
explained by the different objectives, and inclusion criteria for studies, outcomes
examined and possibly when the review was undertaken. For example, the
review undertaken by Vanderkroft et al (2007) appears to be similar to the
Cochrane review undertaken by Milne et al (2005), however the Milne review
only included studies which were random controlled trials (RCT) and quasi-RCT,
and examined only one type of intervention, that being where extra protein and
energy were provided. The extra protein and energy provided was usually in the
Economic analysis of Malnutrition and Pressure ulcers M Banks June 2008
47
form of commercial oral supplements, although levels varied between studies.
The Vanderkroft et al (2007) review assessed a range of interventions to
minimise under-nutrition in the elderly, and reviewed a wider range of outcomes.
The timing of the reviews may also be relevant. Milne et al (2005) concluded
that protein and energy supplementation produces a small but consistent weight
gain, and that there was a statistically significant benefit on mortality. They
however stated that there was insufficient evidence of improvement of clinical
outcomes, functional benefits or reduction in length of hospital stay with
supplementation. Vanderkroft et al (2007) found strong evidence to support that
oral supplement interventions compared with standard hospital care significantly
improve weight status (and arm muscle circumference) in hospitalised elderly,
which is similar to Milne et al (2005), but there was no supportive evidence for
improvement in mortality, as was found by Milne et al (2005). This may be
because Vanderkroft et al (2007) analysed the studies under different types of
interventions as opposed to pooling different forms of nutrition intervention, and
this reduced the power the analysis.
The review by Stratton et al (2003) on the other hand found significantly and
clinically relevant effects of nutrition support compared with standard care on
mortality, complications and length of stay. Their meta-analysis involved a
combination of trials of oral nutritional supplements and enteral tube feeding
compared with standard clinical care in various patient groups and across
hospital and community settings. This meta-analysis approach can be criticised
on the basis of heterogeneity of the component data sets, however these authors
justify their approach on the basis that inadequate intake produces adverse
effects (malnutrition) and that improving the intake, by whatever means, will
prevent such detriments and improve outcomes. Such an approach may provide
more generalisable results, obtained with a larger number of trials and patients
(Stratton et al., 2003).
Economic analysis of Malnutrition and Pressure ulcers M Banks June 2008
48
Many of these review authors conclude that there is evidence for the benefits of
nutrition support, especially oral nutritional supplements in malnourished patients,
but that there is a great need for randomized controlled long term studies of the
effects of defined nutrition support intervention programs for malnutrition.
The effects of nutrition intervention on the prevention and treatment of pressure
ulcers is discussed later in Section 2.11.
2.5.3 Cost benefits of nutrition intervention for malnutrition
The examination of the impact of nutrition support on economic costs has been
studied by a few authors, the quality of which will be discussed in Section 2.20.
Tucker & Miguel (1996) reviewed malnourished patients in twenty acute care
USA hospitals (2485 participants) who were discharged during a typical month
and who had stayed in hospital for more than 7 days. The study showed that
patients with high nutrition risk scores had a hospital stay of 5 to 6 days longer
than those at low risk and that 80% of the difference was related to disease
severity and 20% to malnutrition per se. Only 32% of patients with high nutrition
risk scores however received some form of nutritional intervention. Of these, half
received ‘early’ nutritional intervention (starting on or before the third day of
hospital stay) and the rest received ‘late’ intervention, starting on or after the
fourth day. Subgroup analysis revealed that an average length of stay for the
‘late’ subgroup was 3 days longer than that of the ‘early’ subgroup. Stepwise
regression analysis indicated that the ‘early’ subgroup had a 2.1 day shorter
length of stay than the ‘late’ subgroup after correction for other variables which
influenced length of stay and as the delay before nutritional intervention
increased, the length of stay also increased by a factor of 0.5. That is, for each 2
days of earlier intervention, there was a decline of 1 day of length of stay.
Potential savings of over US$1 million per average hospital (pre- 1996 prices)
Economic analysis of Malnutrition and Pressure ulcers M Banks June 2008
49
were calculated for the provision of early nutrition intervention (Tucker and
Miguel, 1996).
Stratton et al. (2003a) undertook a retrospective cost analysis in nine randomised
controlled trials with and without the use of nutritional supplements, where data
were available on length of stay and complications. They assigned a cost per
bed day of £250, treatment cost per complication of £80 and cost of oral nutrition
support of £3 per day. This exercise demonstrated mean cost savings of
between £352 and £8179 per patient in surgical, orthopaedic, elderly and stroke
patients. The average reduction in length of stay in hospital of 6 days determined
by these authors in a combined analysis of interventions with oral nutritional
supplements and enteral tube feeds would result in significant hospital bed day
and cost savings.
In the UK potential cost savings by the National Health Service (NHS) of £266
million (1992 prices) were calculated if appropriate nutrition support was given to
malnourished patients, thus reducing hospital stay by 5 days in 10% of hospital
inpatients (Lennard-Jones, 1992) . In the US, potential cost savings have been
estimated at US$18 billion annually (pre- 1993 prices), if appropriate nutrition
support was given to malnourished patients (Bernstein et al., 1993). Green
(1999) applied some very simple assumptions and estimated potential cost
savings of at least £330 per surgical patient treated for malnutrition (pre-1999
prices).
There is relatively little data on the cost-effectiveness of nutritional support in the
community. Green, (1999) argued that it does not seem unreasonable to
suggest that if treatment of malnutrition in the community leads to a reduced
need for general (medical) practitioner (GP) visits, hospitalisation, and shorter
periods of hospitalisation, as well as contributing to improvements which are not
measurable in monetary terms, such as functional capacity and quality of life,
then it can be regarded as cost-effective.
Economic analysis of Malnutrition and Pressure ulcers M Banks June 2008
50
Another study assessed the cost of malnutrition and related co-morbidities
among 378 elderly patients living in the community and determined the impact of
nutrition support on outcomes including cost (Arnaud-Battandier et al., 2004).
They found nutritional status improved significantly in the group of patients
provided frequent prescriptions for nutrition supplements. The adjusted cost per
patient of hospital care (EUR -551), nursing care (EUR -145) and other medical
care was significantly reduced in the nutrition supplemented group. Including the
costs related to nutritional products, the total cost saving per patient attributable
to nutrition support were EUR -195 (90% CI: EUR -929 - EUR+478). No levels of
statistical significance were provided for this study, nor even data on the
percentage of cost values that were negative which would have helped determine
the significance of these cost savings. However this is the first pharmaco-
economic study of malnutrition care in the community and does indicate that
there are potentially significant economic benefits, as well as health benefits, to
be gained from the provision of nutrition support.
Although many of the assumptions and methods of calculations of the above
studies can be criticized, the indication that large cost savings might be possible
suggest that it would be very worthwhile to undertake proper economic analyses
alongside nutrition intervention studies (Green, 1999, Stratton et al., 2003).
Economic benefit of coding for malnutrition
In addition to the economic benefits of nutrition intervention related to improved
patient outcomes, many studies have shown that the coding of malnutrition as a
co-morbidity or complication can attract additional funding for hospitals funded
under diagnosis related group (DRG) casemix funding. This is because coding
for malnutrition may effect the diagnosis group of a patient to one that is more
complicated and hence attracts a higher level of funding (Anderson and
Steinberg, 1986, Christensen, 1986, Delhey et al., 1989, Ferguson et al., 1997,
Ockenga et al., 2005, Raja et al., 2004, Robinson et al., 1987, Sayarath, 1993,
Economic analysis of Malnutrition and Pressure ulcers M Banks June 2008
51
Smith and Smith, 1992, Smith and Smith, 1993, Trimble, 1992). In an Australian
study, the inclusion of a malnutrition code resulted in a favourable reimbursement
difference for 30% of malnourished patients, which projected into an annual
additional reimbursement of greater than $AUS 1.6 million (pre 1997 costs) for a
300 bed Brisbane private hospital (Ferguson et al., 1997). Whilst the
identification of malnutrition is not actually cost saving, hospitals may benefit from
increased funding in a competitive funding environment.
Summary
Whilst it is clear there is a need for randomized, long term studies of the effects
of defined nutrition support interventions, there is sufficient data to support the
provision of nutrition support interventions to patients who are malnourished or at
risk of developing malnutrition. The indication of potentially substantial
economic cost savings suggest that it would be very worthwhile to undertake
proper economic analyses in conjunction with studies investigating the effects of
nutrition intervention.
2.6 NUTRITION ASSESSMENT AND NUTRITION SCREENING
2.6.1 Nutrition assessment Nutrition assessment is a comprehensive approach to defining nutritional status
using medical, diet and medication histories; physical examination;
anthropometric measurements and laboratory data (American Dietetic
Association (ADA), 1994).
One of the outcomes of a nutrition assessment is the determination of whether a
patient is malnourished or not. The following parameters have been used alone
or in combination to define malnutrition:
Anthropometric parameters: height, weight, ideal body weight, weight as a
percentage of ideal body weight, weight as a percentage of usual weight, body
Economic analysis of Malnutrition and Pressure ulcers M Banks June 2008
52
mass index, absolute weight loss, triceps skin fold, mid upper arm circumference,
mid upper arm muscle circumference, mid upper arm muscle area.
Biochemical parameters: serum albumin, serum pre-albumin, serum total
protein, serum transferring, total iron binding capacity, retinol binding protein, C-
reactive protein, 24 hour urinary urea nitrogen, 24 hour urinary creatinine,
creatinine height index, nitrogen balance, obligatory nitrogen loss, net protein
utilization, vitamins, haemoglobin, haematocrit, total cholesterol.
Clinical parameters: medical history, medication history, physical examination
(muscle wasting, loss of subcutaneous adipose tissue, appearance of skin,
gums, teeth, hair, nails, eyes)
Dietary parameters: protein intake, energy intake, nutrient intakes, intake of
nutrients as a percentage of requirements, intake of nutrients as a percentage of
usual intake, energy expenditure
Functional parameters: hand grip dynamometry, respiratory function tests,
Immunological parameters: total lymphocyte count, delayed cutaneous
hypersensitivity.
Laboratory body composition techniques: total body water, total body nitrogen,
total body potassium, bioelectrical impedance, total body electrical conductivity
It is not the purpose of this thesis to review the advantages and disadvantages of
each of these parameters. This has been undertaken previously (Ferguson,
1999). However all nutrition assessment parameters may be affected by non-
nutritional factors, resulting in poor sensitivity and specificity (Jeejeebhoy, 2000).
In addition, the parameters were originally designed to describe the nutritional
status of populations, therefore they often have wide confidence limits, restricting
Economic analysis of Malnutrition and Pressure ulcers M Banks June 2008
53
their use for individual patients. Hence no single parameter is sensitive and
specific enough to determine nutritional status in any given individual and a
combination of parameters should be used (Gibson, 1990).
Nutrition assessment tools
In an attempt to overcome the limitations of objective parameters and increase
the sensitivity and specificity and hence predictive value, nutrition parameters
have been combined to form numerous nutrition assessment tools/ indices.
These have been reviewed in detail previously (Banks, 1995). The most
commonly cited tools in more recent literature include: Subjective Global
Assessment (Detsky et al., 1987b) and Mini Nutritional Assessment (Guigoz et
al., 1996). A short review of each tool is described.
The Subjective Global Assessment (SGA) determines nutritional status and
malnutrition based upon a medical assessment (weight change, dietary intake
change, gastrointestinal symptoms, nutrition related functional capacity) and
physical examination (evidence of loss of subcutaneous fat, muscle wasting,
oedema and ascites). The features are combined subjectively into an overall or
global assessment where patients are rated as being well nourished, moderately
(or suspected of being) malnourished, or severely malnourished (Detsky et al.,
1987b). Combining the proportions of moderately and severely malnourished
provides a proportion of the total malnourished.
The SGA been found to have a high degree of inter-rater reliability (with assessor
agreement of 80-90% and kappa statistics of 0.75- 0.78) (Correia and Campos,
2003, Detsky et al., 1987b, Lazarus and Hamlyn, 2005, Middleton et al., 2001,
Waitzberg et al., 2001, Wyszynski et al., 2003), and good predictive and
convergent validity correlating well with measures of morbidity (incidence of
infection, use of antibiotics, length of stay) , and traditional objective nutritional
parameters (anthropometric, biochemical, functional and immunological) (Detsky
et al., 1987a, Duerksen et al., 2000).
Economic analysis of Malnutrition and Pressure ulcers M Banks June 2008
54
The SGA has been found to be a valid nutrition assessment tool in a variety of
patient population settings including: surgery (Detsky et al., 1987b), geriatric
(Christensson et al., 2002, Duerksen et al., 2000, Persson et al., 2002), including
in the aged care setting (Sacks et al., 2000), oncology (Ottery, 1996, Thoresen et
al., 2002), liver transplant (Stephenson et al., 2001), and renal (Cooper et al.,
2001), making it an ideal tool for use as it allows for comparisons to be made
across different population settings. Many recent Australian and international
studies investigating the prevalence of malnutrition have used the SGA (Beck et
al., 2001c, Correia and Campos, 2003, Ferguson et al., 1997, Kyle et al., 2002,
Lazarus and Hamlyn, 2005, Middleton et al., 2001, Olmos et al., 2005, Persson
et al., 2002, Planas et al., 2004, Waitzberg et al., 2001, Wyszynski et al., 2003,
Barreto Penie, 2005).
Advantages of SGA include: its subjectivity, use of clinicians experience and
expertise; non reliance on laboratory tests; use of available data; able to be
performed quickly; simple; reliable; inexpensive and able to be performed at the
bedside (Detsky et al., 1987b). A criticism of SGA is its subjective nature and
requirement for trained staff. A scored patient generated subjective (PG-SGA)
has however been developed (Ottery, 1996). The scoring allows for an element
of objectivity, and may be useful in monitoring short term changes in nutritional
status. The scored PG-SGA has been validated for use in oncology patients
(Bauer et al., 2002, Isenring et al., 2003) and renal patients (Campbell et al.,
2007).
Jeejeebhoy (2000) reviewed many current common nutrition assessment
methodologies including body weight and weight loss, anthropometry, creatinine
height index, serum albumin and prealbumin, immune competence, serum
cholesterol, SGA, functional tests of malnutrition and measurements of body
composition. He concluded that SGA combined with selective objective
Economic analysis of Malnutrition and Pressure ulcers M Banks June 2008
55
parameters was the best predictor of increased morbidity and mortality, in the
absence of nutrition support.
The Mini Nutritional Assessment (MNA) (Guigoz et al., 1996) is a nutrition
assessment technique, designed to provide assessment of the nutritional status
of the elderly. The MNA consists of: anthropometric measurements (weight,
height, and weight loss); global assessment (six questions related to lifestyle,
medication, and mobility); dietary questions (eight questions, related to number of
meals, food and fluid intake, and autonomy of feeding); subjective assessment
(self perception of health and nutrition). For the frail elderly the parameters in
the MNA are more likely to identify risk of developing malnutrition and
malnutrition at an early stage, since it includes physical and mental aspects that
frequently affect the nutritional status of the elderly. In its development, as with
the SGA, the MNA was compared to objective nutritional parameters and found
to be highly correlated (Vellas et al., 2000). The MNA has been validated in the
whole spectrum of elderly populations, from the very active healthy to the patient
institutionalized with dementia, and has significant inter-observer agreement
(Vellas et al., 1999). The MNA has been found to be useful for predicting
morbidity and mortality by several researchers (Donini et al., 2003, Gazzotti et
al., 2000, Beck et al., 1999, Van Nes et al., 2001, Visvanathan et al., 2004,
Neumann et al., 2005) and risk for hospitalization (Visvanathan et al., 2003, Beck
et al., 2001b, Van Nes et al., 2001), although is appears to be better at detecting
elderly who are at risk of malnutrition that may need preventative nutritional
measures than a diagnostic tool (Christensson et al., 2002). The MNA however
has been found to be too complex by some users, with too many fields that
cannot be completed, leading to increased subjectivity (Capra, 2007). Another
limitation of the MNA is that it is only valid for use in the elderly.
At present, despite the presence of available validated nutrition assessment tools
there is still no ‘gold standard’ for evaluating nutritional status (Corish and
Kennedy, 2000). The reliability of any nutrition assessment technique as a true
Economic analysis of Malnutrition and Pressure ulcers M Banks June 2008
56
measure of nutritional status has never been validated (Jeejeebhoy, 2000).
Corish and Kennedy (2000) point out for the nutritional status of patients to be
considered seriously by the medical and nursing professions, agreement must be
reached for a definition of malnutrition and nutritional risk and a standardized
nutrition assessment method.
In summary, despite there being no ‘gold standard’ for evaluating nutritional
status, there are valid nutrition assessment tools available. The SGA has been
found to be a valid diagnostic tool in a number of populations and settings. The
MNA has been found to be valid for use in the elderly across a number of
settings, although is less useful as a diagnostic tool and more useful in detecting
individuals who may need preventive nutritional measures.
2.6.2 Nutrition screening Nutrition assessment provides an objective measurement of the need for and
efficacy of nutritional care. However it is not justified for all patients due to
demands on time and expense, nor is it necessary for all patients (Hunt et al.,
1985). Nutrition risk screening or nutrition screening is the process of identifying
patients with characteristics commonly associated with nutrition problems that
may require comprehensive nutrition assessment (American Dietetic Association
(ADA), 1994) and hence intervention.
The purpose of nutrition screening is to:
• Quickly identify individuals who are malnourished or at risk of becoming
malnourished who would benefit from nutrition support
• Focus resources on patients who need nutrition support the most, and
• Expedite the provision of nutritional support to malnourished patients.
(Hunt et al., 1985, American Dietetic Association (ADA), 1994)
A nutrition screening system needs to be established in institutions, and linked to
a strategy for timely nutrition intervention (Bernstein et al., 1993).
Economic analysis of Malnutrition and Pressure ulcers M Banks June 2008
57
The value of implementing routine nutrition screening is directly related to the
benefits of the treatment of malnutrition, already addressed in Section 2.5.
These include benefits with respect to patient morbidity, mortality, quality of life
and costs. Studies demonstrate that the implementation of comprehensive
nutrition screening and intervention programs decreases the prevalence of
malnutrition (Brugler et al., 1999, O'Flynn et al., 2005). O’Flynn et al (2005)
showed a significant reduction in the prevalence of malnutrition over a five year
period from 1998 (23.5%) to 2003 (19.1%) (p= 0.001), associated with the
implementation of nutrition screening, improvements in food service and nutrition
education. There was a significant increase in the number of malnourished
patients receiving nutritional care from 56.5% in 1998 to 71.2% in 2003 (p=
0.003).
Nutrition screening tools
Numerous nutrition screening tools have been developed in an attempt to quickly
and effectively identify patients at risk of malnutrition in various settings.
The American Dietetic Association (1994) suggests that an effective nutrition
screening tool should be:
• simple, quick, reliable, valid, inexpensive;
• easily administered with minimal nutrition expertise;
• applicable to most patients and designed to incorporate only routine tests and
data available on admission;
• able to be implemented at admission in any setting and able to be completed
by non technical staff, family or the patient themselves (Elmore et al., 1994).
The most commonly referenced nutrition screening tools in recent literature and
their applications are summarized in Appendix 1. These are the: Malnutrition
Screening Tool (MST) (Ferguson et al., 1999) (Australia); Malnutrition Universal
Screening Tool (MUST) (MAG (BAPEN), 2003) (UK); Mini Nutritional
Economic analysis of Malnutrition and Pressure ulcers M Banks June 2008
58
Assessment – Short Form (MNA-SF) (Rubenstein et al., 2001) (France); NRS
2002 (Kondrup et al., 2003b) (Denmark). These tools all include some similar
parameters including recent unintentional weight loss and recent poor intake, but
differ with the inclusion of other parameters and their application. All tools have
all been found to be valid and reliable in different settings and there is at least
one valid tool suitable for different patient populations, and for other varying
needs of institutions.
Summary
Despite there being no ‘gold standard’ for evaluating nutritional status, there are
valid nutrition assessment tools available and there are a number of valid and
reliable nutrition screening tools.
2.7 POLICY AND PRACTICES IN IDENTIFICATION, PREVEN TION AND
TREATMENT OF MALNUTRITION
In the USA, nutrition screening and nutrition care planning in hospitals is required
for accreditation by the Joint Commission on Accreditation of Health Care
Organizations (JCAHO, 2003). In addition, the USA Medicare system is a
prospective payment system, whereby nutrition departments can receive
reimbursements for providing nutrition services to patients classified as
malnourished as a co-morbidity or complication (Smith and Smith, 1992, Smith
and Smith, 1993, Sayarath, 1993, Christensen, 1986, Trimble, 1992). Because
of accreditation requirements and funding incentives there is an emphasis on and
existence of nutrition screening, assessment and management in USA hospitals.
Several other continents or countries also have health policy in place which either
mandates or recommends nutrition screening and management strategies,
including Europe (Council of Europe, 2003), Denmark (Kondrup et al., 2003b),
Brazil and Costa Rica (Correia and Campos, 2003), and the UK (Department of
Health (DOH), 2001).
Economic analysis of Malnutrition and Pressure ulcers M Banks June 2008
59
In addition to or alternatively, country or continent based nutritional organizations
have recommendations regarding nutrition screening and treatment programs.
Examples include: The European Society for Parenteral and Enteral Nutrition
(ESPEN); The British Society for Parenteral and Enteral Nutrition (MAG
(BAPEN), 2003); American Society for Parenteral and Enteral Nutrition (ASPEN)
(ASPEN Board of Directors, 2002); American Dietetic Association (American
Dietetic Association (ADA), 1994); The Latin American Federation of Parenteral
and Enteral Nutrition (FELANDE) (Correia and Campos, 2003); The Brazilian
Society of Parenteral and Enteral Nutrition (SBPNE) (Waitzberg et al., 2001).
In Australia there are currently no such recommendations regarding nutrition
screening from either government bodies or even the independent nutrition
organizations. Ferguson & Capra (1998) conducted a survey in 1995 of
Australian dietitians and found fewer than 5% of Australian hospitals (n=124)
conducted nutrition screening and most dietitians rely on referrals being made
directly by medical and nursing staff (Ferguson and Capra, 1998). An
unpublished survey of dietitians in Queensland Health hospitals and residential
aged care facilities was conducted by this author to obtain information regarding
nutrition screening practices found a majority of institutions have not attempted to
introduce nutrition screening, particularly at institutions without dietitians (Banks,
2003). The main barriers to the implementation of nutrition screening was
reported to be a lack of awareness by medical, nursing and other staff, of the
issue of malnutrition and the benefits of identifying and preventing or treating
malnutrition; and a lack of resources to undertake these processes.
Summary
Policy, standards and guidelines related to the identification, prevention and
treatment of malnutrition, including nutrition screening and intervention programs
have been implemented into a variety of settings, especially in the USA, UK and
Denmark. However, in Australia there are no such policies, guidelines or
standards and nutrition screening appears to have implemented only to a limited
Economic analysis of Malnutrition and Pressure ulcers M Banks June 2008
60
extent. The greatest barrier to the successful implementation of nutrition
screening and intervention processes appears to be a lack of awareness by
medical, nursing and other staff, of the whole issue of malnutrition and the
benefits of identifying and preventing or treating malnutrition.
2.8 PRESSURE ULCERS - DEFINITIONS AND CLASSIFICATI ON
Pressure ulcer, also referred to as pressure sore, bed sore and decubitus ulcer is
defined as: an area of localised damage to the skin and underlying tissue caused
by pressure, shear, friction and/or a combination of these (EPUAP, 2003).
Pressure ulcers are caused by a local breakdown of soft tissue as a result of
compression between a bony prominence and an external surface. They occur
most commonly on the lower half of the body and especially on areas of the body
where bones protrude, such as the sacrum, hip and buttocks, heel, ankle and
elbow (Grey et al., 2006).
Pressure ulcers are classified by the depth of tissue damage. The Australian
Wound Management Association recommendations for staging of pressure
ulcers (Australian Wound Management Association, 2001) (Figure 2.1) is
consistent with the gradings of the National Pressure Ulcer Advisory Panel,
although these has been recently updated to provide more detail on assessing
dark pigmented skin (NPUAP, 2007). This grading system is also very similar to
the one recommended by the European Pressure Ulcer Advisory Panel (EPUAP,
2003) and hence there is general international consensus on the grading of
pressure ulcers. A study investigating the reliability of the European Pressure
Ulcer Advisory Panel classification system however found that inter-rater and
intra-rater reliability was very low by nurses, when using lesion photographs
(Defloor et al., 2006). So despite general international consensus on the grading
of pressure ulcers, grading may not be consistent.
Economic analysis of Malnutrition and Pressure ulcers M Banks June 2008
61
Figure 2.1 Staging classification of Pressure Ulce rs (Australian Wound Management Association, 2001)
2.9 PREVALENCE AND INCIDENCE OF PRESSURE ULCERS Many studies have been undertaken investigating both the prevalence and
incidence of pressure ulcers. The prevalence rate of pressure ulcer is the
measure of the number of existing cases of pressure ulcer in a given population
at a designated time, whereas the incidence rate is the number of new cases of
pressure ulcer in a population during a specific period of time (Australian Wound
Management Association, 2001). Table 2.5 and 2.6 provide a summary of some
of the overseas and Australian studies respectively, on the prevalence and/or
incidence of pressure ulcers in adults, and factors found to be associated with the
occurrence of pressure ulcer.
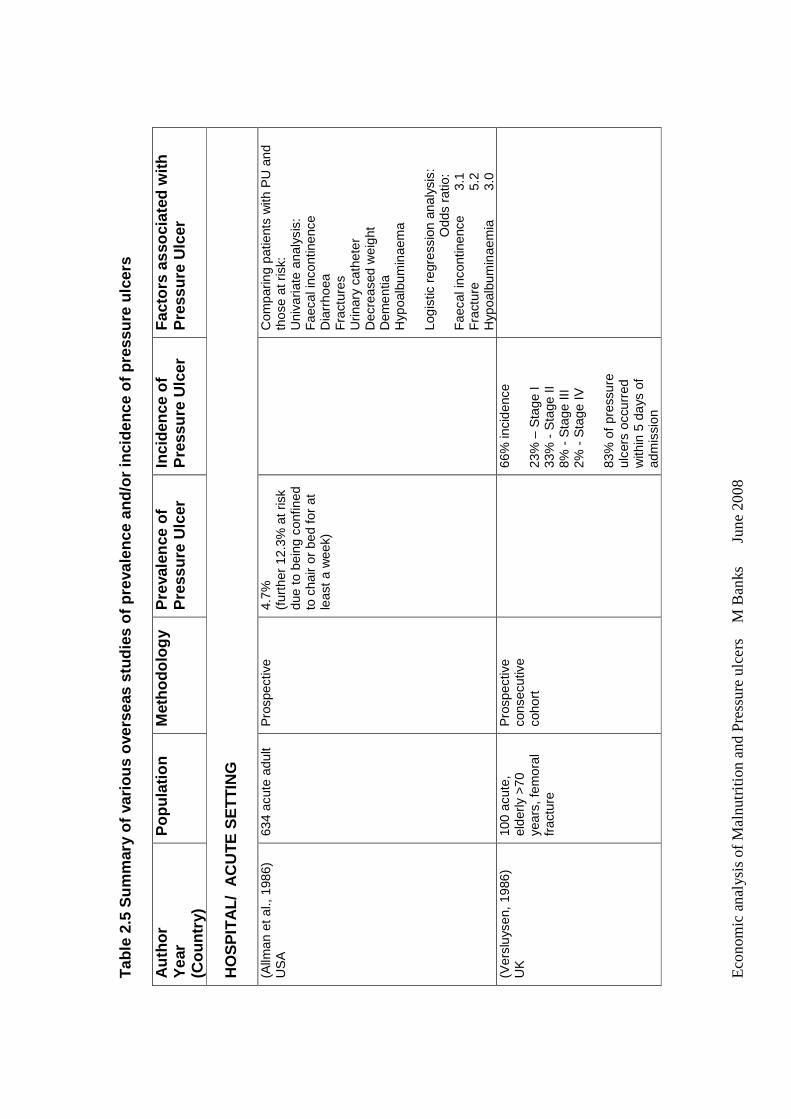
Eco
nom
ic a
nal
ysis
of
Ma
lnut
ritio
n a
nd
Pre
ssu
re u
lce
rs
M B
anks
Ju
ne
200
8
Tab
le 2
.5 S
umm
ary
of v
ario
us o
vers
eas
stud
ies
of p
rev
alen
ce a
nd/o
r in
cide
nce
of p
ress
ure
ulce
rs
Aut
hor
Yea
r
(Cou
ntry
)
Pop
ulat
ion
Met
hodo
logy
P
reva
lenc
e of
P
ress
ure
Ulc
er
Inci
denc
e of
P
ress
ure
Ulc
er
Fac
tors
ass
ocia
ted
with
P
ress
ure
Ulc
er
HO
SP
ITA
L/ A
CU
TE S
ET
TIN
G
(Allm
an e
t al.,
198
6)
US
A
634
acut
e ad
ult
Pro
spec
tive
4.
7%
(fur
ther
12.
3% a
t ris
k du
e to
bei
ng c
onfin
ed
to c
hair
or b
ed fo
r at
le
ast
a w
eek)
C
ompa
ring
patie
nts
with
PU
and
th
ose
at r
isk:
U
niva
riate
ana
lysi
s:
Fae
cal i
ncon
tinen
ce
Dia
rrho
ea
Fra
ctur
es
Urin
ary
cath
eter
D
ecre
ased
wei
ght
Dem
entia
H
ypoa
lbum
inae
ma
Logi
stic
reg
ress
ion
anal
ysis
:
O
dds
ratio
: F
aeca
l inc
ontin
ence
3.
1 F
ract
ure
5.
2 H
ypoa
lbum
inae
mia
3.
0 (V
ersl
uyse
n, 1
986)
U
K
100
acut
e,
elde
rly >
70
year
s, fe
mor
al
frac
ture
Pro
spec
tive
cons
ecut
ive
coho
rt
66
% in
cide
nce
23%
– S
tage
I 33
% -
Sta
ge II
8%
- S
tage
III
2% -
Sta
ge I
V
83%
of
pres
sure
ul
cers
occ
urre
d w
ithin
5 d
ays
of
adm
issi
on
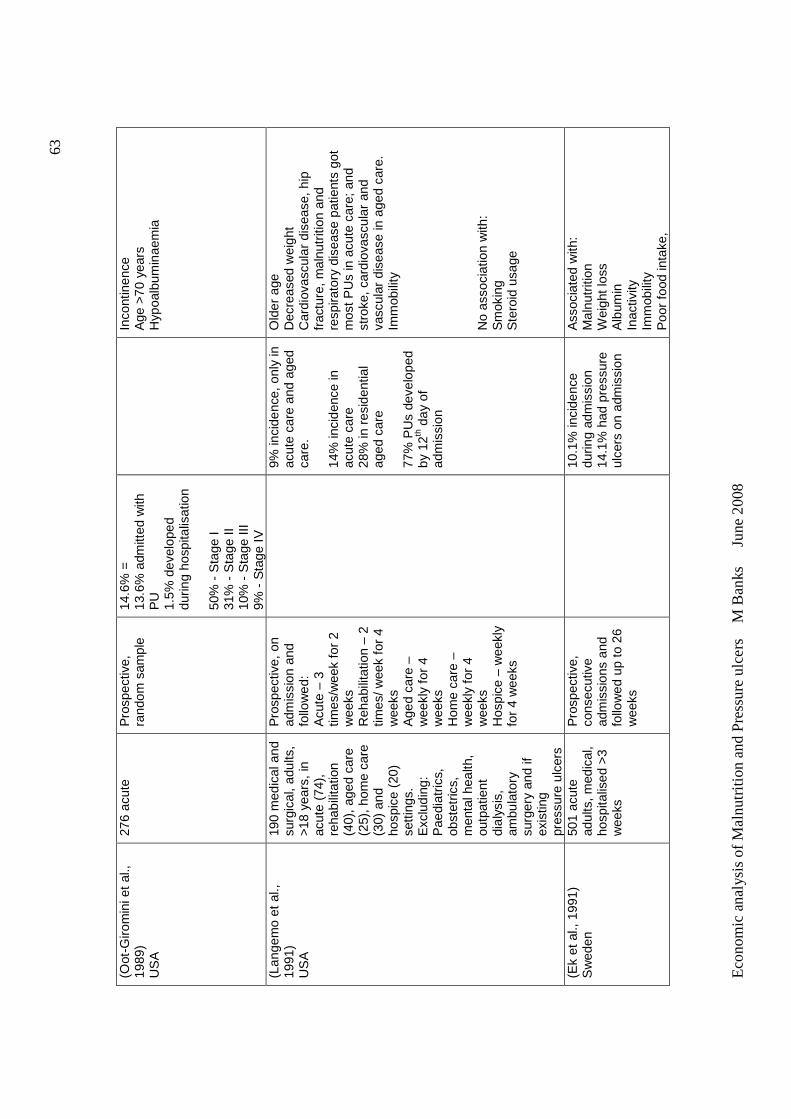
Eco
nom
ic a
nal
ysis
of
Ma
lnut
ritio
n a
nd
Pre
ssu
re u
lce
rs
M B
anks
Ju
ne 2
008
63
(Oot
-Giro
min
i et
al.,
1989
) U
SA
276
acut
e
Pro
spec
tive,
ra
ndom
sam
ple
14.6
% =
13
.6%
adm
itted
with
P
U
1.5%
dev
elop
ed
durin
g ho
spita
lisat
ion
50%
- S
tage
I 31
% -
Sta
ge II
10
% -
Sta
ge II
I 9%
- S
tage
IV
In
cont
inen
ce
Age
>70
yea
rs
Hyp
oalb
umin
aem
ia
(Lan
gem
o et
al.,
19
91)
US
A
190
med
ical
and
su
rgic
al,
adul
ts,
>18
year
s, in
ac
ute
(74)
, re
habi
litat
ion
(40)
, age
d ca
re
(25)
, hom
e ca
re
(30)
and
ho
spic
e (2
0)
setti
ngs.
E
xclu
ding
: P
aedi
atric
s,
obst
etric
s,
men
tal h
ealth
, ou
tpat
ient
di
alys
is,
ambu
lato
ry
surg
ery
and
if ex
istin
g pr
essu
re u
lcer
s
Pro
spec
tive,
on
adm
issi
on a
nd
follo
wed
: A
cute
– 3
tim
es/w
eek
for
2 w
eeks
R
ehab
ilita
tion
– 2
times
/ wee
k fo
r 4
wee
ks
Age
d ca
re –
w
eekl
y fo
r 4
wee
ks
Hom
e ca
re –
w
eekl
y fo
r 4
wee
ks
Hos
pice
– w
eekl
y fo
r 4
wee
ks
9%
inci
denc
e, o
nly
in
acut
e ca
re a
nd a
ged
care
. 14
% in
cide
nce
in
acut
e ca
re
28%
in r
esid
entia
l ag
ed c
are
77%
PU
s de
velo
ped
by 1
2th d
ay o
f ad
mis
sion
Old
er a
ge
Dec
reas
ed w
eigh
t C
ardi
ovas
cula
r di
seas
e, h
ip
frac
ture
, mal
nutr
ition
and
re
spira
tory
dis
ease
pat
ient
s go
t m
ost P
Us
in a
cute
car
e; a
nd
stro
ke, c
ardi
ovas
cula
r an
d va
scul
ar d
isea
se in
age
d ca
re.
Imm
obili
ty
No
asso
ciat
ion
with
: S
mok
ing
Ste
roid
usa
ge
(Ek
et a
l., 1
991)
S
wed
en
501
acut
e ad
ults
, med
ical
, ho
spita
lised
>3
wee
ks
Pro
spec
tive,
co
nsec
utiv
e ad
mis
sion
s an
d fo
llow
ed u
p to
26
wee
ks
10
.1%
inci
denc
e du
ring
adm
issi
on
14.1
% h
ad p
ress
ure
ulce
rs o
n ad
mis
sion
Ass
ocia
ted
with
: M
alnu
triti
on
Wei
ght l
oss
Alb
umin
In
activ
ity
Imm
obili
ty
Poo
r fo
od in
take
,
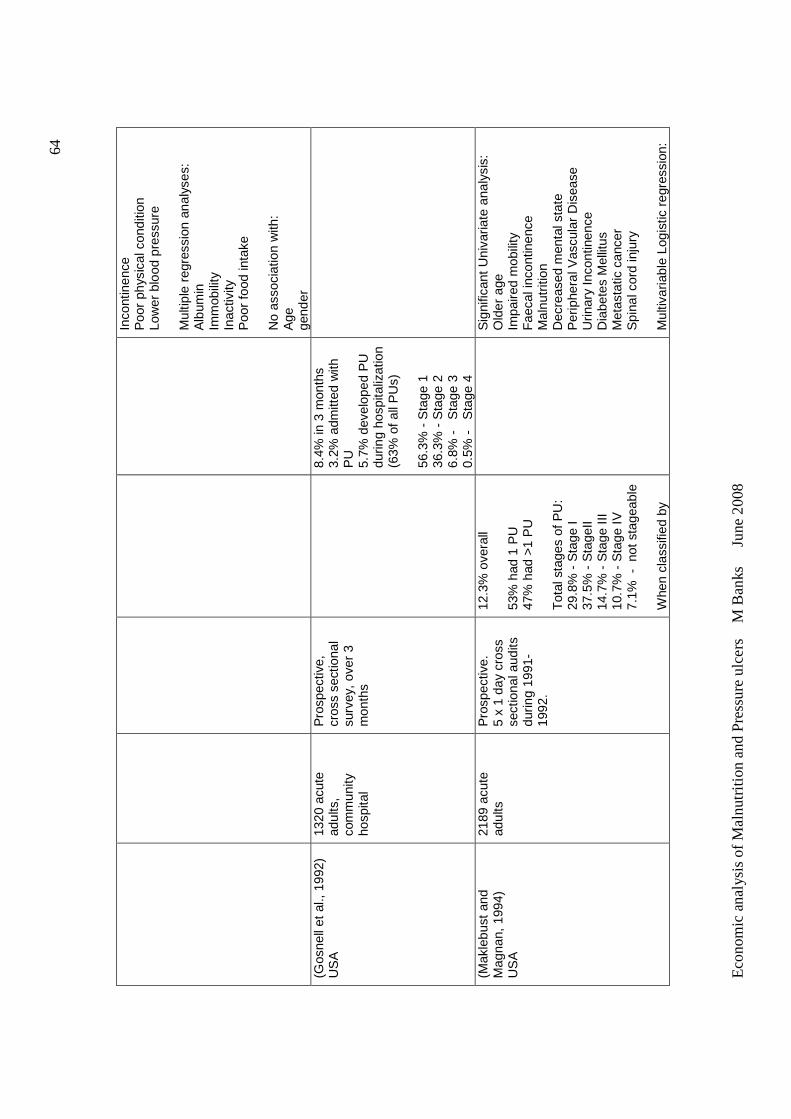
Eco
nom
ic a
nal
ysis
of
Ma
lnut
ritio
n a
nd
Pre
ssu
re u
lce
rs
M B
anks
Ju
ne 2
008
64
Inco
ntin
ence
P
oor
phys
ical
con
ditio
n Lo
wer
blo
od p
ress
ure
Mul
tiple
reg
ress
ion
anal
yses
: A
lbum
in
Imm
obili
ty
Inac
tivity
P
oor
food
inta
ke
No
asso
ciat
ion
with
: A
ge
gend
er
(Gos
nell
et a
l., 1
992)
U
SA
13
20 a
cute
ad
ults
, co
mm
unity
ho
spita
l
Pro
spec
tive,
cr
oss
sect
iona
l su
rvey
, ov
er 3
m
onth
s
8.
4% in
3 m
onth
s 3.
2% a
dmitt
ed w
ith
PU
5.
7% d
evel
oped
PU
du
ring
hosp
italiz
atio
n (6
3% o
f all
PU
s)
56.3
% -
Sta
ge 1
36
.3%
- S
tage
2
6.8%
-
Sta
ge 3
0.
5% -
S
tage
4
(Mak
lebu
st a
nd
Mag
nan,
199
4)
US
A
2189
acu
te
adul
ts
Pro
spec
tive.
5
x 1
day
cros
s se
ctio
nal a
udits
du
ring
1991
-19
92.
12.3
% o
vera
ll 53
% h
ad 1
PU
47
% h
ad >
1 P
U
Tot
al s
tage
s of
PU
: 29
.8%
- S
tage
I 37
.5%
- S
tage
II 14
.7%
- S
tage
III
10.7
% -
Sta
ge IV
7.
1% -
not
sta
geab
le
Whe
n cl
assi
fied
by
S
igni
fican
t U
niva
riate
ana
lysi
s:
Old
er a
ge
Impa
ired
mob
ility
F
aeca
l inc
ontin
ence
M
alnu
triti
on
Dec
reas
ed m
enta
l sta
te
Per
iphe
ral V
ascu
lar
Dis
ease
U
rinar
y In
cont
inen
ce
Dia
bete
s M
ellit
us
Met
asta
tic c
ance
r S
pina
l cor
d in
jury
M
ultiv
aria
ble
Logi
stic
reg
ress
ion:
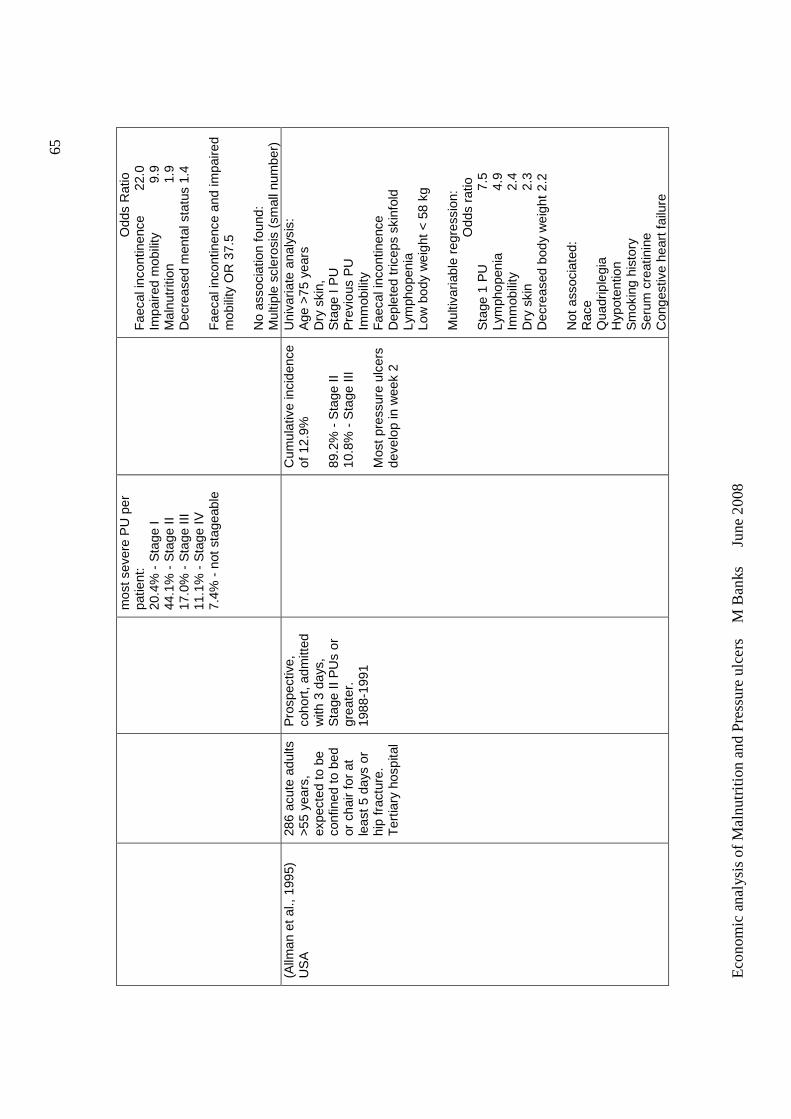
Eco
nom
ic a
nal
ysis
of
Ma
lnut
ritio
n a
nd
Pre
ssu
re u
lce
rs
M B
anks
Ju
ne 2
008
65
mos
t sev
ere
PU
per
pa
tient
: 20
.4%
- S
tage
I 44
.1%
- S
tage
II
17.0
% -
Sta
ge II
I 11
.1%
- S
tage
IV
7.4%
- n
ot s
tage
able
Odd
s R
atio
F
aeca
l inc
ontin
ence
22
.0
Impa
ired
mob
ility
9
.9
M
alnu
triti
on
1
.9
Dec
reas
ed m
enta
l sta
tus
1.4
Fae
cal i
ncon
tinen
ce a
nd im
paire
d m
obili
ty O
R 3
7.5
No
asso
ciat
ion
foun
d:
Mul
tiple
scl
eros
is (
smal
l num
ber)
(A
llman
et a
l., 1
995)
U
SA
28
6 ac
ute
adul
ts
>55
year
s,
expe
cted
to b
e co
nfin
ed t
o be
d or
cha
ir fo
r at
le
ast 5
day
s or
hi
p fr
actu
re.
Ter
tiary
hos
pita
l
Pro
spec
tive,
co
hort
, adm
itted
w
ith 3
day
s,
Sta
ge II
PU
s or
gr
eate
r.
1988
-199
1
C
umul
ativ
e in
cide
nce
of 1
2.9%
89
.2%
- S
tage
II
10.8
% -
Sta
ge II
I M
ost
pres
sure
ulc
ers
deve
lop
in w
eek
2
Uni
varia
te a
naly
sis:
A
ge >
75 y
ears
D
ry s
kin,
S
tage
I P
U
Pre
viou
s P
U
Imm
obili
ty
Fae
cal i
ncon
tinen
ce
Dep
lete
d tr
icep
s sk
info
ld
Lym
phop
enia
Lo
w b
ody
wei
ght
< 58
kg
Mul
tivar
iabl
e re
gres
sion
:
O
dds
ratio
S
tage
1 P
U
7.
5 Ly
mph
open
ia
4.
9 Im
mob
ility
2.4
Dry
ski
n
2.3
Dec
reas
ed b
ody
wei
ght
2.2
Not
ass
ocia
ted:
R
ace
Qua
drip
legi
a H
ypot
entio
n S
mok
ing
hist
ory
Ser
um c
reat
inin
e C
onge
stiv
e he
art f
ailu
re
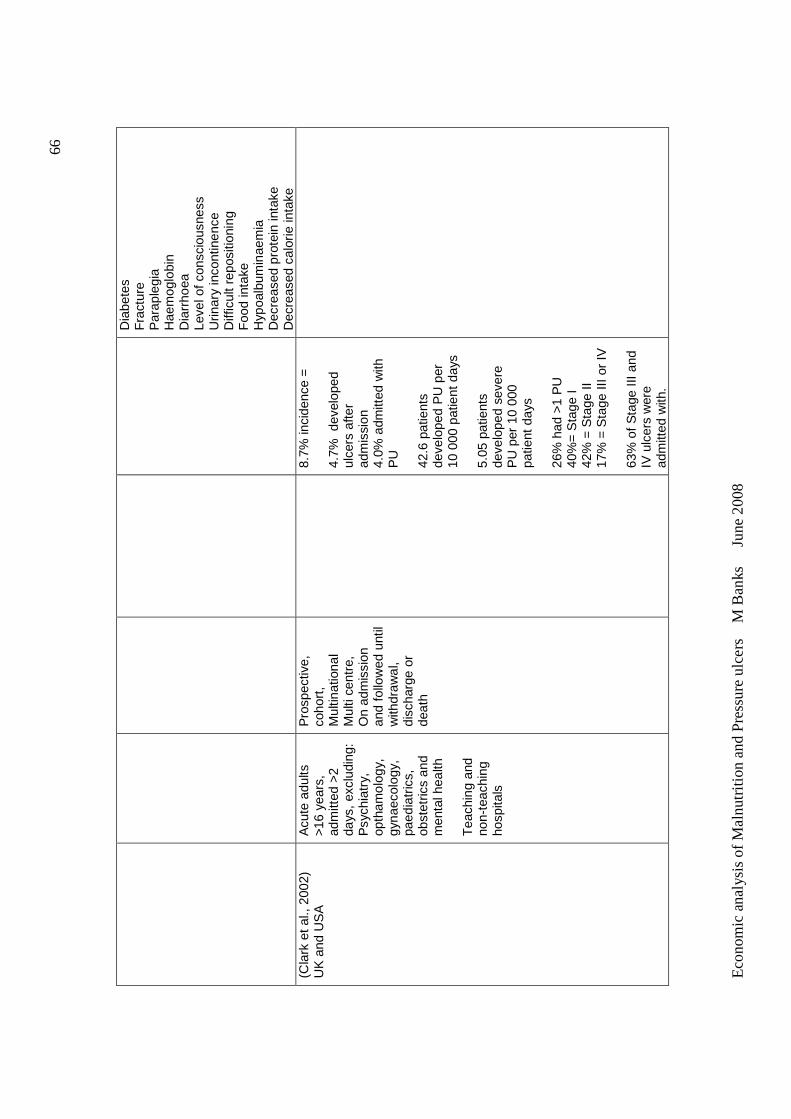
Eco
nom
ic a
nal
ysis
of
Ma
lnut
ritio
n a
nd
Pre
ssu
re u
lce
rs
M B
anks
Ju
ne 2
008
66
Dia
bete
s F
ract
ure
Par
aple
gia
Hae
mog
lobi
n D
iarr
hoea
Le
vel o
f con
scio
usne
ss
Urin
ary
inco
ntin
ence
D
iffic
ult r
epos
ition
ing
Foo
d in
take
H
ypoa
lbum
inae
mia
D
ecre
ased
pro
tein
inta
ke
Dec
reas
ed c
alor
ie in
take
(C
lark
et a
l., 2
002)
U
K a
nd U
SA
A
cute
adu
lts
>16
year
s,
adm
itted
>2
days
, ex
clud
ing:
P
sych
iatr
y,
opth
amol
ogy,
gy
naec
olog
y,
paed
iatr
ics,
ob
stet
rics
and
men
tal h
ealth
T
each
ing
and
non-
teac
hing
ho
spita
ls
Pro
spec
tive,
co
hort
, M
ultin
atio
nal
Mul
ti ce
ntre
, O
n ad
mis
sion
an
d fo
llow
ed u
ntil
with
draw
al,
disc
harg
e or
de
ath
8.
7% in
cide
nce
=
4.7%
dev
elop
ed
ulce
rs a
fter
adm
issi
on
4.0%
adm
itted
with
P
U
42.6
pat
ient
s de
velo
ped
PU
per
10
000
pat
ient
day
s 5.
05 p
atie
nts
deve
lope
d se
vere
P
U p
er 1
0 00
0 pa
tient
day
s 26
% h
ad >
1 P
U
40%
= S
tage
I
42%
= S
tage
II
17%
= S
tage
III o
r IV
63
% o
f S
tage
III a
nd
IV u
lcer
s w
ere
adm
itted
with
.
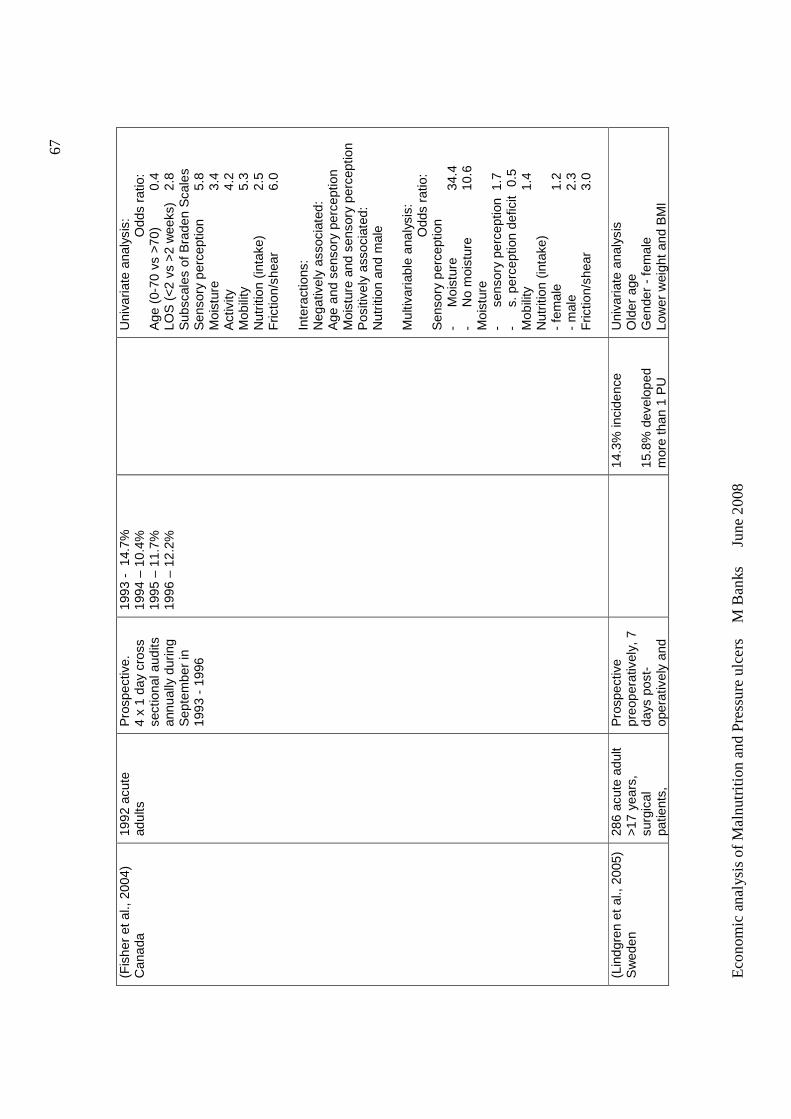
Eco
nom
ic a
nal
ysis
of
Ma
lnut
ritio
n a
nd
Pre
ssu
re u
lce
rs
M B
anks
Ju
ne 2
008
67
(Fis
her
et a
l., 2
004)
C
anad
a 19
92 a
cute
ad
ults
P
rosp
ectiv
e.
4 x
1 da
y cr
oss
sect
iona
l aud
its
annu
ally
dur
ing
Sep
tem
ber
in
1993
- 1
996
1993
- 1
4.7%
19
94 –
10.
4%
1995
– 1
1.7%
19
96 –
12.
2%
U
niva
riate
ana
lysi
s:
Odd
s ra
tio:
Age
(0-
70 v
s >7
0)
0.4
LOS
(<
2 vs
>2
wee
ks)
2.8
Sub
scal
es o
f Bra
den
Sca
les
Sen
sory
per
cept
ion
5.8
Moi
stur
e
3.4
Act
ivity
4.2
Mob
ility
5.3
Nut
ritio
n (in
take
) 2.
5 F
rictio
n/sh
ear
6.
0 In
tera
ctio
ns:
Neg
ativ
ely
asso
ciat
ed:
Age
and
sen
sory
per
cept
ion
Moi
stur
e an
d se
nsor
y pe
rcep
tion
P
ositi
vely
ass
ocia
ted:
N
utrit
ion
and
mal
e M
ultiv
aria
ble
anal
ysis
:
O
dds
ratio
: S
enso
ry p
erce
ptio
n -
Moi
stur
e
34.4
-
No
moi
stur
e 10
.6
Moi
stur
e -
sens
ory
perc
eptio
n 1
.7
- s.
per
cept
ion
defic
it 0
.5
Mob
ility
1.4
Nut
ritio
n (in
take
) -
fem
ale
1.
2 -
mal
e
2.
3 F
rictio
n/sh
ear
3.
0
(Lin
dgre
n et
al.,
200
5)
Sw
eden
28
6 ac
ute
adul
t >1
7 ye
ars,
su
rgic
al
patie
nts,
Pro
spec
tive
preo
pera
tivel
y, 7
da
ys p
ost-
op
erat
ivel
y an
d
14
.3%
inci
denc
e 15
.8%
dev
elop
ed
mor
e th
an 1
PU
Uni
varia
te a
naly
sis
Old
er a
ge
Gen
der
- fe
mal
e Lo
wer
wei
ght
and
BM
I
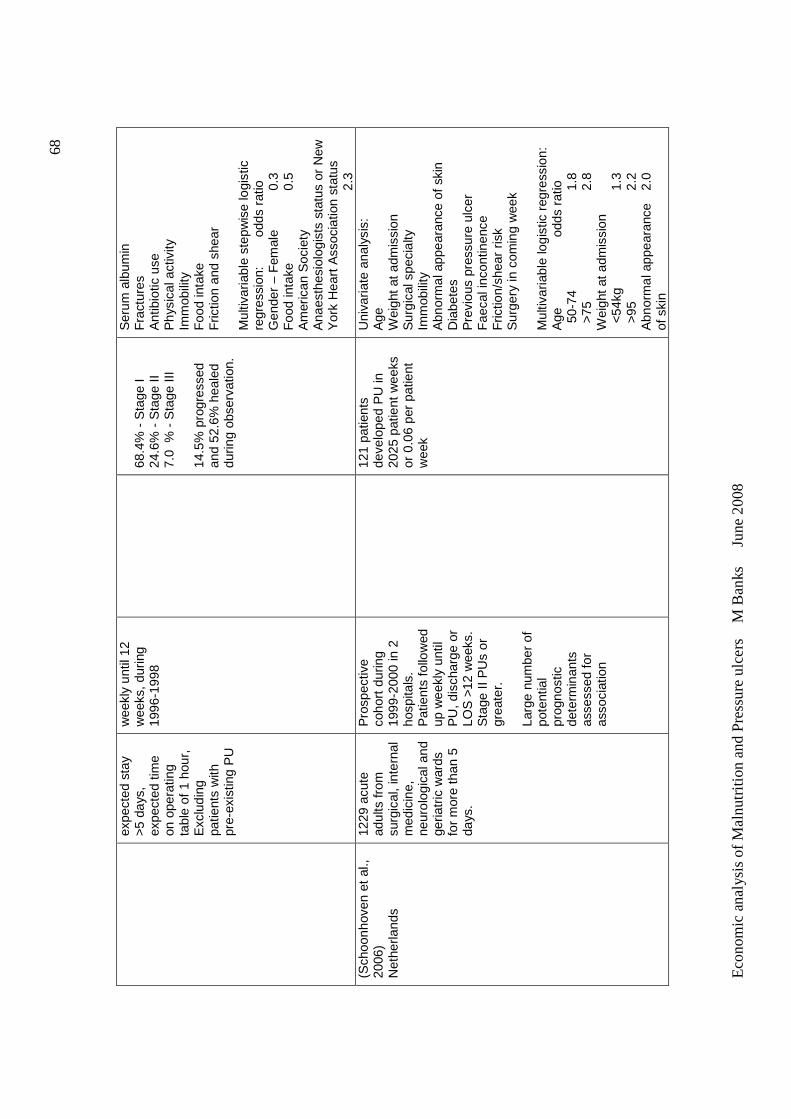
Eco
nom
ic a
nal
ysis
of
Ma
lnut
ritio
n a
nd
Pre
ssu
re u
lce
rs
M B
anks
Ju
ne 2
008
68
expe
cted
sta
y >5
day
s,
expe
cted
tim
e on
ope
ratin
g ta
ble
of 1
hou
r,
Exc
ludi
ng
patie
nts
with
pr
e-ex
istin
g P
U
wee
kly
until
12
wee
ks, d
urin
g 19
96-1
998
68.4
% -
Sta
ge I
24.6
% -
Sta
ge II
7.
0 %
- S
tage
III
14.5
% p
rogr
esse
d an
d 52
.6%
hea
led
durin
g ob
serv
atio
n.
Ser
um a
lbum
in
Fra
ctur
es
Ant
ibio
tic u
se
Phy
sica
l act
ivity
Im
mob
ility
F
ood
inta
ke
Fric
tion
and
shea
r M
ultiv
aria
ble
step
wis
e lo
gist
ic
regr
essi
on:
odds
rat
io
Gen
der
– F
emal
e 0.
3 F
ood
inta
ke
0.
5
Am
eric
an S
ocie
ty
Ana
esth
esio
logi
sts
stat
us o
r N
ew
Yor
k H
eart
Ass
ocia
tion
stat
us
2.
3 (S
choo
nhov
en e
t al
., 20
06)
N
ethe
rland
s
1229
acu
te
adul
ts fr
om
surg
ical
, in
tern
al
med
icin
e,
neur
olog
ical
and
ge
riatr
ic w
ards
fo
r m
ore
than
5
days
.
Pro
spec
tive
coho
rt d
urin
g 19
99-2
000
in 2
ho
spita
ls.
Pat
ient
s fo
llow
ed
up w
eekl
y un
til
PU
, dis
char
ge o
r LO
S >
12 w
eeks
. S
tage
II P
Us
or
grea
ter.
La
rge
num
ber
of
pote
ntia
l pr
ogno
stic
de
term
inan
ts
asse
ssed
for
asso
ciat
ion
12
1 pa
tient
s de
velo
ped
PU
in
2025
pat
ient
wee
ks
or 0
.06
per
patie
nt
wee
k
Uni
varia
te a
naly
sis:
A
ge
Wei
ght a
t adm
issi
on
Sur
gica
l spe
cial
ty
Imm
obili
ty
Abn
orm
al a
ppea
ranc
e of
ski
n D
iabe
tes
Pre
viou
s pr
essu
re u
lcer
F
aeca
l inc
ontin
ence
F
rictio
n/sh
ear
risk
Sur
gery
in c
omin
g w
eek
Mul
tivar
iabl
e lo
gist
ic r
egre
ssio
n:
Age
odds
rat
io
50-
74
1.
8 >
75
2.8
Wei
ght a
t adm
issi
on
<54
kg
1.
3 >
95
2.2
Abn
orm
al a
ppea
ranc
e
2.0
of s
kin
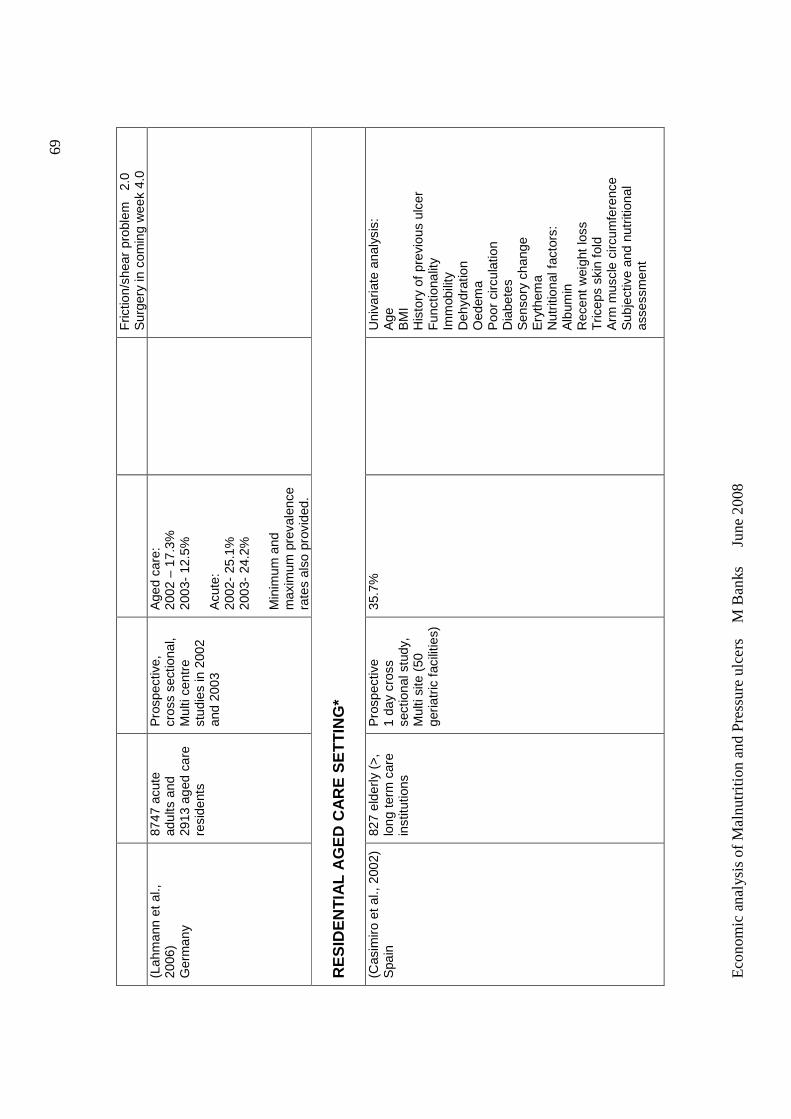
Eco
nom
ic a
nal
ysis
of
Ma
lnut
ritio
n a
nd
Pre
ssu
re u
lce
rs
M B
anks
Ju
ne 2
008
69
Fric
tion/
shea
r pr
oble
m
2.0
Sur
gery
in c
omin
g w
eek
4.0
(Lah
man
n et
al.,
20
06)
Ger
man
y
8747
acu
te
adul
ts a
nd
2913
age
d ca
re
resi
dent
s
Pro
spec
tive,
cr
oss
sect
iona
l, M
ulti
cent
re
stud
ies
in 2
002
and
2003
Age
d ca
re:
2002
– 1
7.3%
20
03-
12.5
%
Acu
te:
2002
- 25
.1%
20
03-
24.2
%
Min
imum
and
m
axim
um p
reva
lenc
e ra
tes
also
pro
vide
d.
RE
SID
EN
TIA
L A
GE
D C
AR
E S
ET
TIN
G*
(Cas
imiro
et a
l., 2
002)
S
pain
82
7 el
derly
(>
, lo
ng t
erm
car
e in
stitu
tions
Pro
spec
tive
1
day
cros
s se
ctio
nal s
tudy
, M
ulti
site
(50
ge
riatr
ic f
acili
ties)
35.7
%
U
niva
riate
ana
lysi
s:
Age
B
MI
His
tory
of
prev
ious
ulc
er
Fun
ctio
nalit
y Im
mob
ility
D
ehyd
ratio
n O
edem
a P
oor
circ
ulat
ion
Dia
bete
s S
enso
ry c
hang
e E
ryth
ema
Nut
ritio
nal f
acto
rs:
Alb
umin
R
ecen
t w
eigh
t lo
ss
Tric
eps
skin
fold
A
rm m
uscl
e ci
rcum
fere
nce
Sub
ject
ive
and
nutr
ition
al
asse
ssm
ent
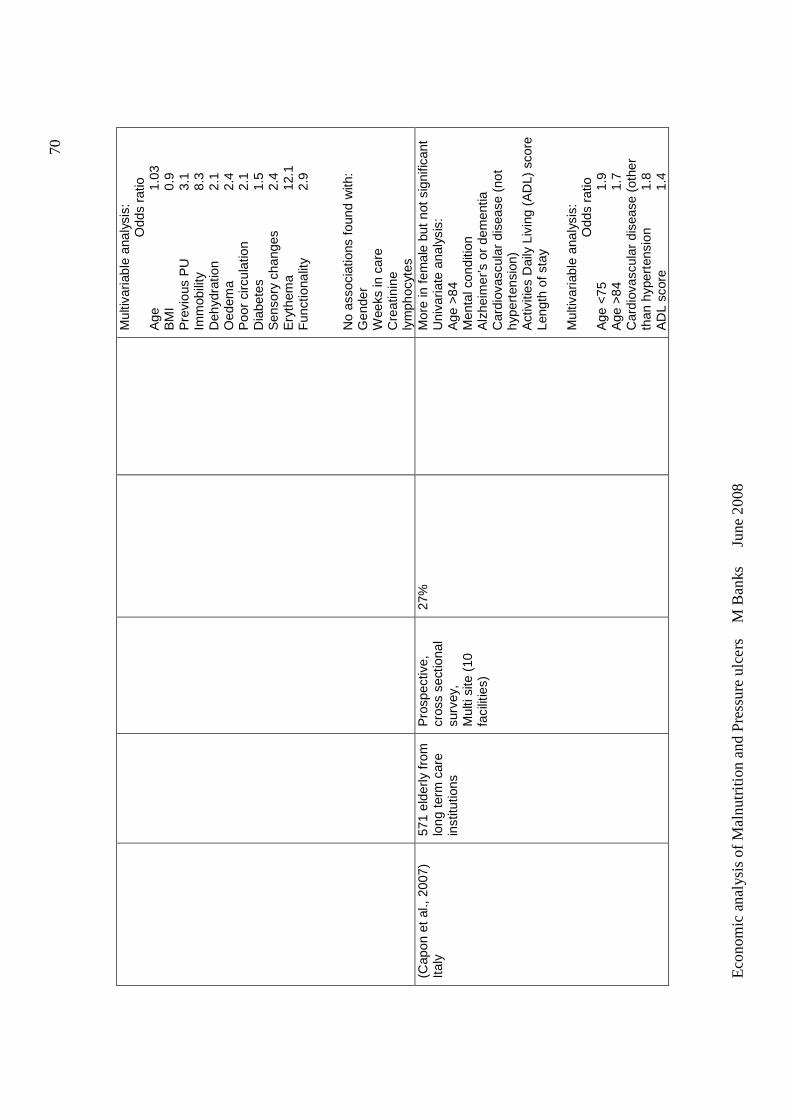
Eco
nom
ic a
nal
ysis
of
Ma
lnut
ritio
n a
nd
Pre
ssu
re u
lce
rs
M B
anks
Ju
ne 2
008
70
Mul
tivar
iabl
e an
alys
is:
Odd
s ra
tio
Age
1.
03
BM
I
0.
9 P
revi
ous
PU
3.1
Imm
obili
ty
8.
3 D
ehyd
ratio
n
2.1
Oed
ema
2.
4 P
oor
circ
ulat
ion
2.
1 D
iabe
tes
1.
5 S
enso
ry c
hang
es
2.4
Ery
them
a
12.1
F
unct
iona
lity
2.9
N
o as
soci
atio
ns f
ound
with
: G
ende
r W
eeks
in c
are
Cre
atin
ine
lym
phoc
ytes
(C
apon
et
al.,
2007
) Ita
ly
571
elde
rly f
rom
lo
ng t
erm
car
e in
stitu
tions
Pro
spec
tive,
cr
oss
sect
iona
l su
rvey
, M
ulti
site
(10
fa
cilit
ies)
27%
Mor
e in
fem
ale
but
not s
igni
fican
t U
niva
riate
ana
lysi
s:
Age
>84
M
enta
l con
ditio
n A
lzhe
imer
’s o
r de
men
tia
Car
diov
ascu
lar
dise
ase
(not
hy
pert
ensi
on)
Act
iviti
es D
aily
Liv
ing
(AD
L) s
core
Le
ngth
of s
tay
Mul
tivar
iabl
e an
alys
is:
Odd
s ra
tio
Age
<75
1.9
Age
>84
1.7
Car
diov
ascu
lar
dise
ase
(oth
er
than
hyp
erte
nsio
n 1.
8 A
DL
scor
e
1.4
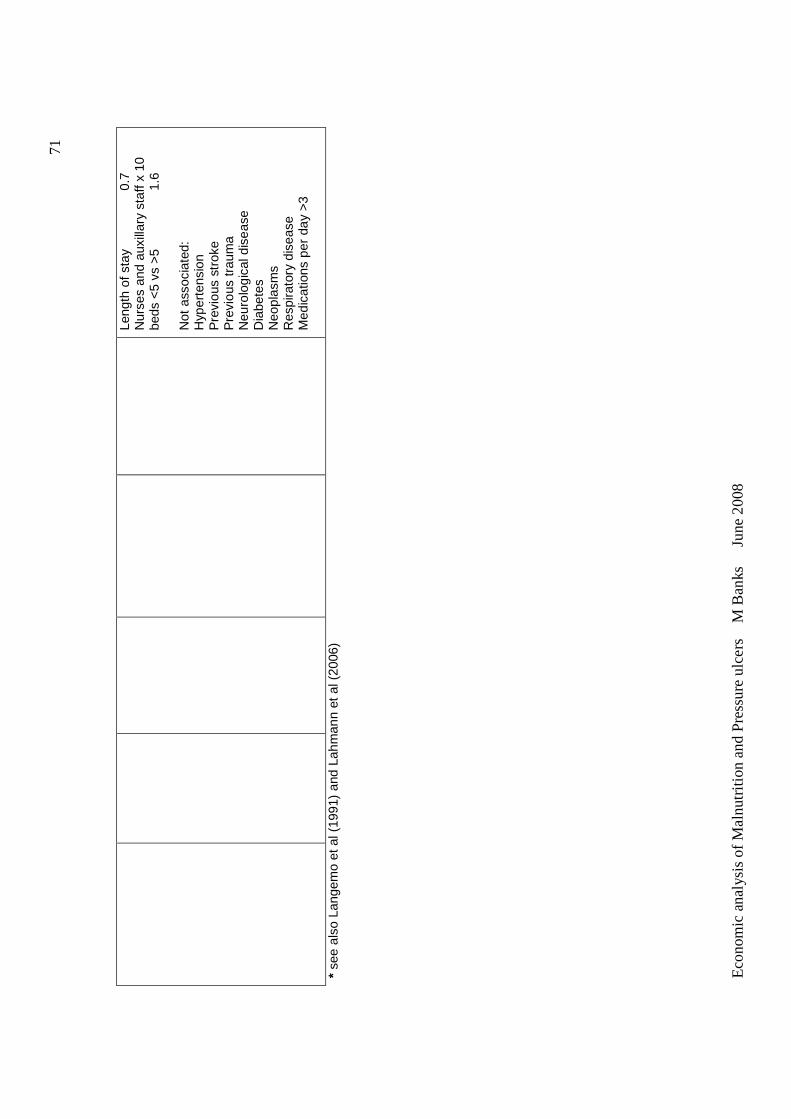
Eco
nom
ic a
nal
ysis
of
Ma
lnut
ritio
n a
nd
Pre
ssu
re u
lce
rs
M B
anks
Ju
ne 2
008
71
Leng
th o
f sta
y
0.7
Nur
ses
and
auxi
llary
sta
ff x
10
beds
<5
vs >
5
1.6
Not
ass
ocia
ted:
H
yper
tens
ion
Pre
viou
s st
roke
P
revi
ous
trau
ma
Neu
rolo
gica
l dis
ease
D
iabe
tes
Neo
plas
ms
Res
pira
tory
dis
ease
M
edic
atio
ns p
er d
ay >
3
* se
e al
so L
ange
mo
et a
l (19
91)
and
Lahm
ann
et a
l (20
06)
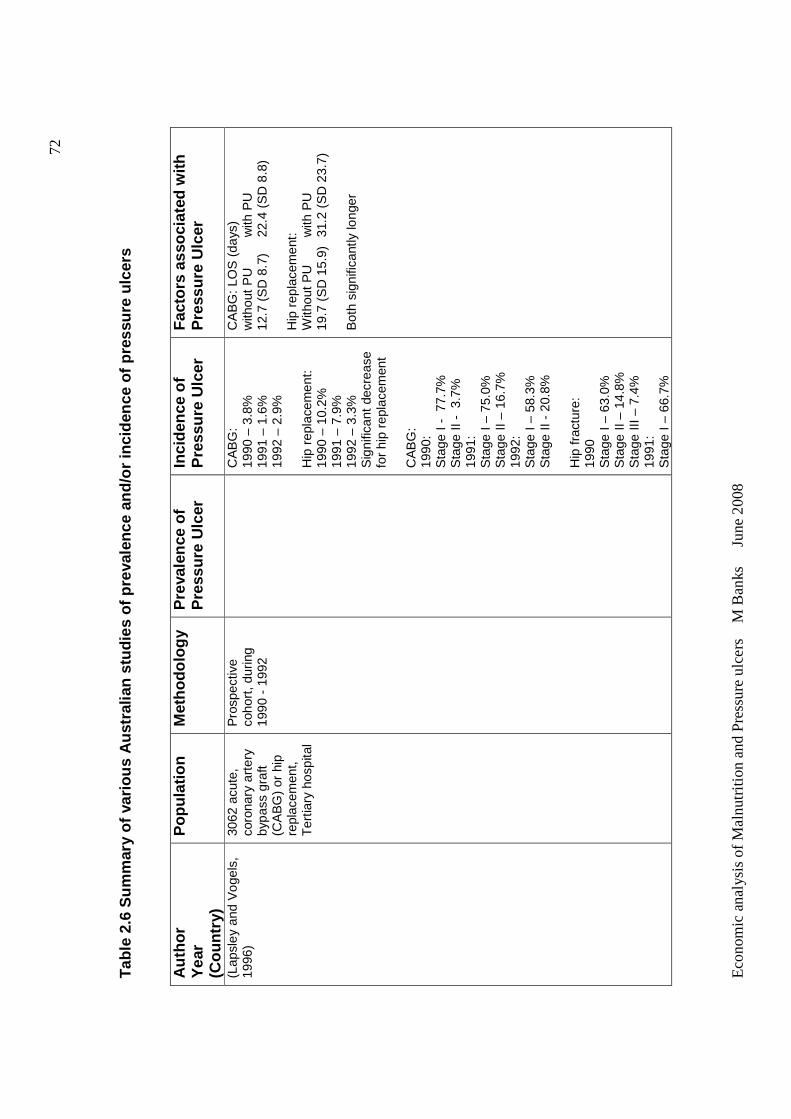
Eco
nom
ic a
nal
ysis
of
Ma
lnut
ritio
n a
nd
Pre
ssu
re u
lce
rs
M B
anks
Ju
ne 2
008
72
Tab
le 2
.6 S
umm
ary
of v
ario
us A
ustr
alia
n st
udie
s of
pr
eval
ence
and
/or
inci
denc
e of
pre
ssur
e ul
cers
A
utho
r Y
ear
(C
ount
ry)
Pop
ulat
ion
Met
hodo
logy
P
reva
lenc
e of
P
ress
ure
Ulc
er
Inci
denc
e of
P
ress
ure
Ulc
er
Fac
tors
ass
ocia
ted
with
P
ress
ure
Ulc
er
(Lap
sley
and
Vog
els,
19
96)
3062
acu
te,
coro
nary
art
ery
bypa
ss g
raft
(CA
BG
) or
hip
re
plac
emen
t,
Ter
tiary
hos
pita
l
Pro
spec
tive
coho
rt, d
urin
g 19
90 -
199
2
C
AB
G:
1990
– 3
.8%
19
91 –
1.6
%
1992
– 2
.9%
H
ip r
epla
cem
ent:
19
90 –
10.
2%
1991
– 7
.9%
19
92 –
3.3
%
Sig
nific
ant
decr
ease
fo
r hi
p re
plac
emen
t C
AB
G:
1990
: S
tage
I -
77.
7%
Sta
ge II
- 3
.7%
19
91:
Sta
ge I
– 75
.0%
S
tage
II –
16.
7%
1992
: S
tage
I –
58.3
%
Sta
ge II
- 2
0.8%
H
ip f
ract
ure:
19
90
Sta
ge I
– 63
.0%
S
tage
II –
14.
8%
Sta
ge II
I –
7.4%
19
91:
Sta
ge I
– 66
.7%
CA
BG
: LO
S (
days
) w
ithou
t P
U
with
PU
12
.7 (
SD
8.7
) 22
.4 (
SD
8.8
) H
ip r
epla
cem
ent:
W
ithou
t PU
w
ith P
U
19.7
(S
D 1
5.9)
31
.2 (
SD
23.
7)
Bot
h si
gnifi
cant
ly lo
nger
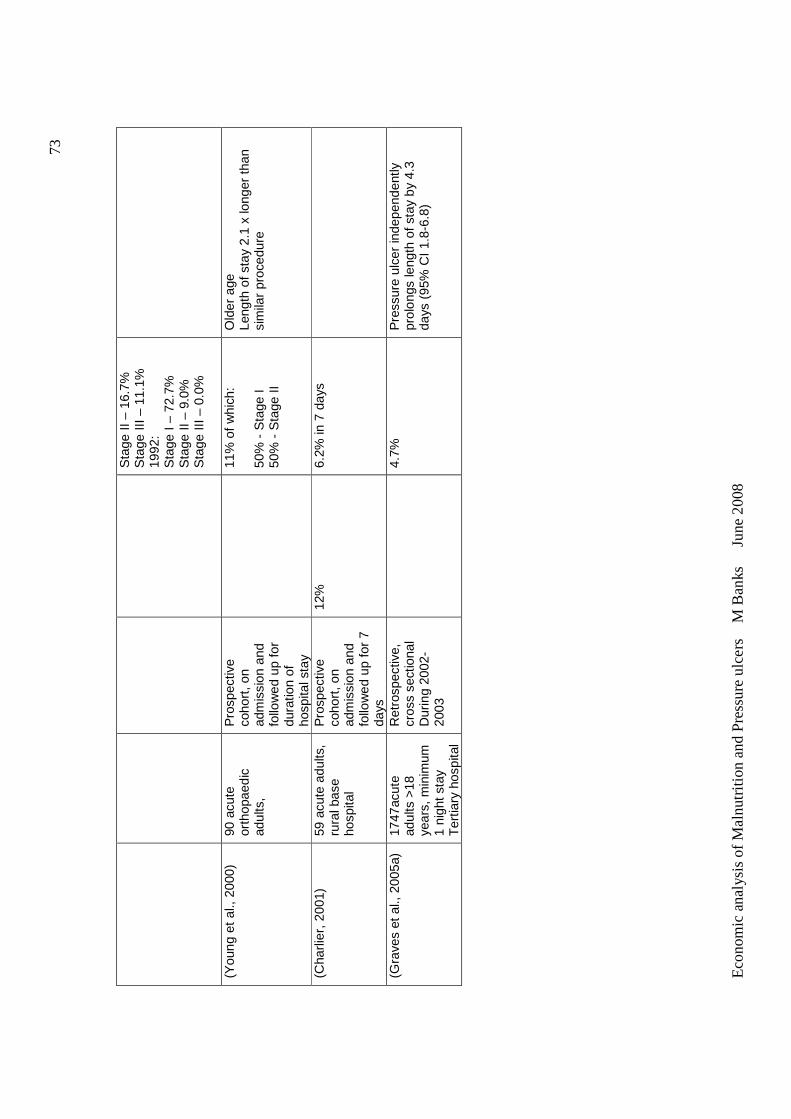
Eco
nom
ic a
nal
ysis
of
Ma
lnut
ritio
n a
nd
Pre
ssu
re u
lce
rs
M B
anks
Ju
ne 2
008
73
Sta
ge II
– 1
6.7%
S
tage
III
– 11
.1%
19
92:
Sta
ge I
– 72
.7%
S
tage
II –
9.0
%
Sta
ge II
I –
0.0%
(Y
oung
et
al.,
2000
) 90
acu
te
orth
opae
dic
adul
ts,
Pro
spec
tive
coho
rt, o
n ad
mis
sion
and
fo
llow
ed u
p fo
r du
ratio
n of
ho
spita
l sta
y
11
% o
f w
hich
: 50
% -
Sta
ge I
50%
- S
tage
II
Old
er a
ge
Leng
th o
f sta
y 2.
1 x
long
er th
an
sim
ilar
proc
edur
e
(Cha
rlier
, 200
1)
59 a
cute
adu
lts,
rura
l bas
e ho
spita
l
Pro
spec
tive
coho
rt, o
n ad
mis
sion
and
fo
llow
ed u
p fo
r 7
days
12%
6.
2% in
7 d
ays
(Gra
ves
et a
l., 2
005a
)
1747
acut
e ad
ults
>18
ye
ars,
min
imum
1
nigh
t sta
y T
ertia
ry h
ospi
tal
Ret
rosp
ectiv
e,
cros
s se
ctio
nal
Dur
ing
2002
-20
03
4.
7%
Pre
ssur
e ul
cer
inde
pend
ently
pr
olon
gs le
ngth
of s
tay
by 4
.3
days
(95
% C
I 1.8
-6.8
)
Economic analysis of Malnutrition and Pressure ulcers M Banks June 2008
74
2.9.1 Hospital /acute setting The reported prevalence of pressure ulcers in the acute setting ranges from
4.7% (Allman et al., 1986) to 25.1% (Lahmann et al., 2006), with most studies,
including those conducted in Australia reporting prevalence rates at
approximately 10-15%. See Tables 2.5 and 2.6.
The following incidence rates of pressure ulcer in acute settings have been
determined in studies: 14% (Langemo et al., 1991); 8.4% (Gosnell et al.,
1992) (USA); 6.2% (Charlier, 2001) (Australia); 8.7% (Clark et al., 2002) (UK
and USA); 4.7% (Graves et al., 2005a) (Australia); 14.3% (Lindgren et al.,
2005) (Canada), with most studies reporting incidence rates between
approximately 5-10%. An extreme finding of 66% incidence in elderly patients
with femoral fracture was reported by Versluysen (1987) in the UK.
Although the majority of individuals develop only one pressure ulcer, a high
percentage develop more than one. Forty-seven per cent of patients in the
prevalence study by Maklebust and Magnan (1994) had more than one
pressure ulcer, with a range of 1-16 ulcers per individual. Clark et al (2002)
reported 26% of patients had more than one pressure ulcer. Lindgren et al,
(2005) reported 15.8% of patients developed more than one pressure ulcer.
Studies show that stage I and II are the most common stages of pressure
ulcer (Clark et al., 2002, Gosnell et al., 1992, Lapsley and Vogels, 1996,
Lindgren et al., 2005, Maklebust and Magnan, 1994, Oot-Giromini et al., 1989,
Versluysen, 1986). When classified by the highest (or most severe) stage of
pressure ulcer per patient, Maklebust and Magnan (1994) found there to be:
20.4% stage I; 44.1% stage II; 17.0% stage III and 11.1% stage IV and 7.4%
unable to be staged.
Studies investigating incidence and prevalence of pressure ulcers have found
approximately 50-60% of pressure ulcers develop after admission, with the
remainder being present on admission (Clark et al., 2002, Gosnell et al., 1992,
Versluysen, 1986, Langemo et al., 1991, Ek et al., 1991). Studies also report
Economic analysis of Malnutrition and Pressure ulcers M Banks June 2008
75
the majority of pressure ulcers develop in the first two weeks of admission
(Allman et al., 1995, Langemo et al., 1991, Versluysen, 1986).
2.9.2 Residential aged / long term / home care se tting
The prevalence of pressure ulcer is generally reported to be higher in
residential aged care facilities than in hospitals (Stratton et al., 2003). A
review of the prevalence of pressure ulcers in residential aged care facilities
reported 7-23% prevalence of pressure ulcers from five published studies
(Smith, 1995). Studies presented in Table 2.5 show a range in prevalence
from 12.5% (Lahmann et al., 2006) to 35.7% (Casimiro et al., 2002).
Lahmann et al (2006) investigated the prevalence of pressure ulcer in both
acute and aged care settings and in contrast to other authors, reported a
lower prevalence of pressure ulcers in the aged care setting.
There are few studies on the prevalence or incidence of pressure ulcers
among persons who are cared for in the home setting. Stratton et al. (2003)
stated approximately 17% of individuals cared for in their own home have
pressure ulcers. They reported on one large scale survey of 1711 non-
hospice community based adults receiving home health care, which found an
incidence rate of 3.2% over a 14 month period, for stage 2 or greater pressure
ulcers.
Summary
There is significant variance reported in pressure ulcer prevalence and
incidence studies can generally be explained by variation in study population,
clinical setting and methodology. Despite this variance a number of studies
indicate a high prevalence and incidence of pressure ulcers.
2.10 CAUSES OF PRESSURE ULCER
The pathogenesis of pressure ulcers is multifactorial (Stratton et al., 2003).
The four main factors implicated in the pathogenesis of pressure ulcer are
interface pressure, shear, friction and moisture (Grey et al., 2006). Sustained
high pressure leads to decreased capillary blood flow, occlusion of blood
vessels and lymphatic vessels, and tissue ischaemia. These changes are
Economic analysis of Malnutrition and Pressure ulcers M Banks June 2008
76
ultimately responsible for the necrosis of muscle, subcutaneous tissue, dermis
and epidermis, and consequent formation of pressure ulcers. An excessively
moist environment caused, for example, by perspiration, urinary or faecal
incontinence, or excessive wound drainage increases the deleterious effects
of pressure, friction and shear (Grey et al., 2006).
The critical determinants of pressure ulcer development are the intensity and
duration of pressure, and the tolerance of the skin and its supporting
structures (Australian Wound Management Association, 2001).
2.10.1 Subject characteristics and pressure ulcer
Pressure ulcers have been found to be associated with a number of individual
characteristics, and therefore the prevalence and incidence of pressure ulcers
has been found to vary in different sub-populations. Possible reasons for
these characteristics being associated with pressure ulcers are discussed
later in this chapter.
Age
Many studies have found an association between older age and risk of
pressure ulcer (Lindgren et al., 2005, Allman et al., 1995, Capon et al., 2007,
Casimiro et al., 2002, Fisher et al., 2004, Maklebust and Magnan, 1994, Oot-
Giromini et al., 1989, Schoonhoven et al., 2006, Young et al., 2000). For
example Schoonhoven et al, (2006) found in a multivariable logistic regression
model that patient aged 50-74 had a significant odds risk of developing a
pressure ulcer of 1.8 compared to younger age groups, which increased to 2.8
in those 75 years or older. Older age would be the main reason for the higher
prevalence of pressure ulcers in residential aged care settings (Capon et al,
2007). However some studies have found the effect of age to become non
significant in multivariable analysis (Ek et al., 1991, Fisher et al., 2004,
Lindgren et al., 2005).
Gender
Some studies have found females at greater risk (Lindgren et al., 2005,
Capon et al., 2007), while at least one study has found males to be at greater
Economic analysis of Malnutrition and Pressure ulcers M Banks June 2008
77
risk of developing pressure ulclers (Fisher et al., 2004). Most studies
however have not found an association between gender and pressure ulcer
risk (Tables 2.3 and 2.4). Lindgren et al (2005) noted that despite female
being found to be an independent risk factor for pressure ulcer, that female
gender itself was probably not a risk, but that overall females in their study
were older, less mobile and in poorer condition. With respect to the finding of
male gender being associated with pressure ulcer, Fisher et al. (2004) stated
this finding is difficult to explain because males generally have better tissue
tolerance than females, due to their muscle mass and anabolic hormones;
however in this study a significant relationship was found between male
gender and malnutrition.
Diagnosis
Lindgren et al, (2005) found an incidence rate of developing pressure ulcer
after surgery of 14.3%. Schoonhoven et al (2006) found that having surgery
was associated with an adjusted odds ratio of 4.0 (95% CI 2.5-6.5) of
developing a pressure ulcer.
Patients undergoing orthopaedic surgery, especially for hip fracture appear to
be at particular risk of developing pressure ulcer, with incidence rates up to
66% reported (Versluysen, 1986). In an Australian study on the incidence of
pressure ulcer in an acute orthopaedic setting, 11% of 90 patients developed
pressure ulcers over a six week period, with 50% being stage 2 or greater
(Young et al., 2000). The majority of the sample had undergone total hip
surgery (42.2%) or total knee replacement (16.7%).
Patients with cardiovascular and vascular diseases (including diabetes) have
also been found to be at higher risk of pressure ulcer in some studies (Capon
et al., 2007, Gosnell et al., 1992, Langemo et al., 1991, Maklebust and
Magnan, 1994). For example, Capon et al, (2007) found in multivariable
analysis that patients with cardiovascular disease (other than hypertension)
had a significant increased odds risk of 1.8 of developing a pressure ulcer.
Economic analysis of Malnutrition and Pressure ulcers M Banks June 2008
78
Studies have also found a high incidence rate of pressure ulcers in the
neurological conditions and stroke (Capon et al., 2007). Critical ill patients
and individuals with quadriplegia are also at significantly high risk of
developing pressure ulcers with prevalence rates up to 60% in this population
having been reported (Australian Wound Management Association, 2001).
2.10.2 Factors associated with developing pressure ulcer
Many studies have determined factors associated with the presence of
pressure ulcers (eg. in prevalence studies) or development of pressure ulcers
(eg. incidence studies) (Allman et al., 1995, Allman et al., 1986, Capon et al.,
2007, Casimiro et al., 2002, Fisher et al., 2004, Langemo et al., 1991, Horn et
al., 2004, Lindgren et al., 2005, Maklebust and Magnan, 1994, Oot-Giromini et
al., 1989, Schoonhoven et al., 2006, Ek et al., 1991). Tables 2.5 and 2.6
shows the results of factors found to be associated with pressure ulcers in
these studies. Study findings vary due to factors investigated and
methodology.
Risk factors for pressure ulcer are those which expose the skin to excessive
pressure; or diminish its tolerance to pressure. Figure 2.2 demonstrates a
model of pressure ulcer development from Braden and Bergstrom (1987).
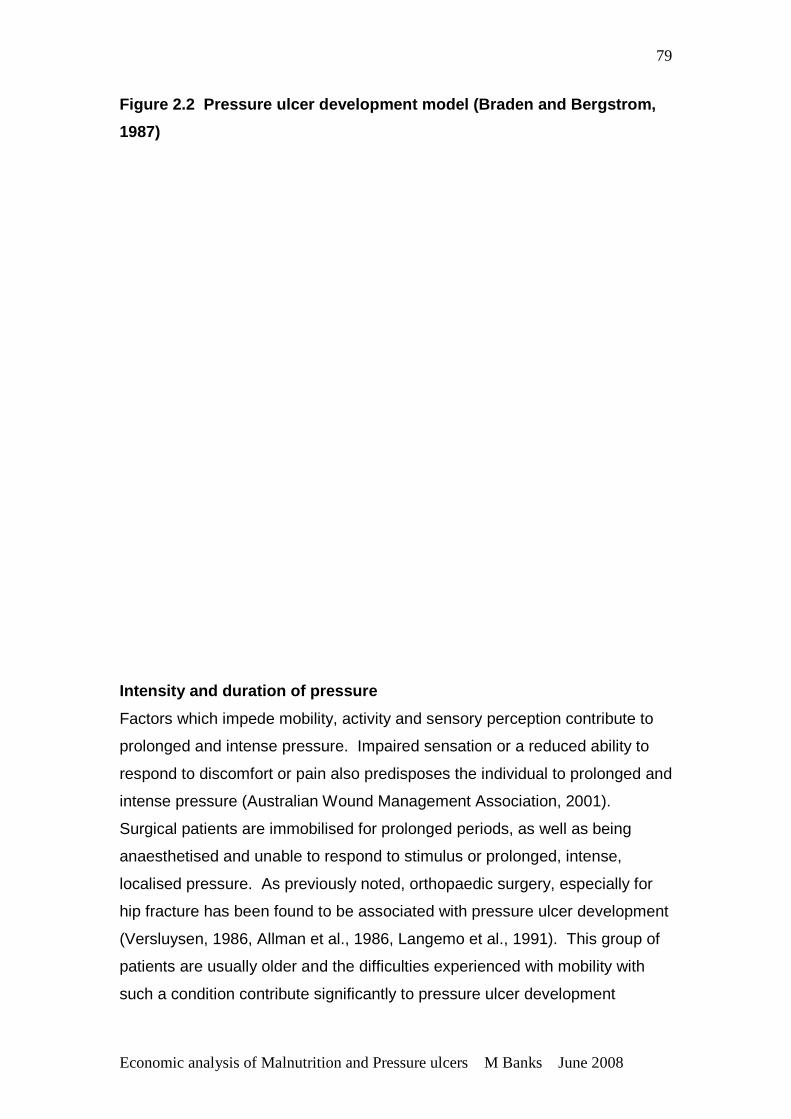
Economic analysis of Malnutrition and Pressure ulcers M Banks June 2008
79
Figure 2.2 Pressure ulcer development model (Brade n and Bergstrom,
1987)
Intensity and duration of pressure
Factors which impede mobility, activity and sensory perception contribute to
prolonged and intense pressure. Impaired sensation or a reduced ability to
respond to discomfort or pain also predisposes the individual to prolonged and
intense pressure (Australian Wound Management Association, 2001).
Surgical patients are immobilised for prolonged periods, as well as being
anaesthetised and unable to respond to stimulus or prolonged, intense,
localised pressure. As previously noted, orthopaedic surgery, especially for
hip fracture has been found to be associated with pressure ulcer development
(Versluysen, 1986, Allman et al., 1986, Langemo et al., 1991). This group of
patients are usually older and the difficulties experienced with mobility with
such a condition contribute significantly to pressure ulcer development
Economic analysis of Malnutrition and Pressure ulcers M Banks June 2008
80
(Langemo et al., 1991). These individuals are also found to be at higher risk
of malnutrition (Stratton et al., 2003). Loss of sensory function, as occurs in
diabetic neuropathy, and motor function, as occurs in spinal cord injury, is also
associated with the development of pressure ulcers (Maklebust and Magnan,
1994).
Tissue tolerance for pressure
Tissue tolerance is the ability of both the skin and its supporting structures to
endure the effects of pressure without adverse sequelae (Australian Wound
Management Association, 2001). Tissue tolerance is affected by both extrinsic
factors including shear, friction and moisture; and intrinsic factors including
older age, factors which affect peripheral perfusion, increased skin
temperature, dry skin and nutritional status (Australian Wound Management
Association, 2001).
The elderly are particularly prone to pressure ulcer development because of
aged skin (decreased proliferation in the epidermis, sensory loss, reduced
elasticity), loss of subcutaneous tissue, reduced pain perception, decreased
cell-mediated immunity and slower wound healing (Lindgren et al., 2005,
Allman et al., 1995, Capon et al., 2007, Casimiro et al., 2002, Fisher et al.,
2004, Maklebust and Magnan, 1994, Oot-Giromini et al., 1989, Schoonhoven
et al., 2006, Young et al., 2000). In addition they are also more prone to
prone to other risks for pressure ulcer development, including long periods of
immobility, arterial disease and poor nutritional status (Stratton et al., 2003).
Nutritional factors
Nutrition has been found to be a risk factor for pressure ulcer development in
a number of studies. Both poor nutritional intake (Breslow and Bergstrom,
1994, Ek et al., 1991, Fisher et al., 2004, Green, 1999, Horn et al., 2004,
Lindgren et al., 2005), and malnutrition (Allman et al., 1986, Westergren et
al., 2001, Casimiro et al., 2002, Horn et al., 2004, Ek et al., 1991, Maklebust
and Magnan, 1994) are associated with the development of pressure ulcers.
Nutritional factors such as low body mass index (BMI), low body weight,
recent weight loss, oral eating problems, low serum albumin and lymphocyte
Economic analysis of Malnutrition and Pressure ulcers M Banks June 2008
81
levels are also associated with the development of pressure ulcers (Allman et
al., 1995, Allman et al., 1986, Breslow and Bergstrom, 1994, Casimiro et al.,
2002, Horn et al., 2004, Ek et al., 1991, Langemo et al., 1991, Lindgren et al.,
2005, Maklebust and Magnan, 1994, Oot-Giromini et al., 1989, Schoonhoven
et al., 2006). Table 2.7 details results of studies which demonstrate
independent associations for nutrition related factors. Many of these
nutritional factors are not independent of each other, for example malnutrition
is often associated with poor nutritional intake, weight loss, and low body
weight and possibly hypoalbuminaemia, and so it would be expected that if
malnutrition is associated with the development of pressure ulcer, then other
related nutritional factors would be also.
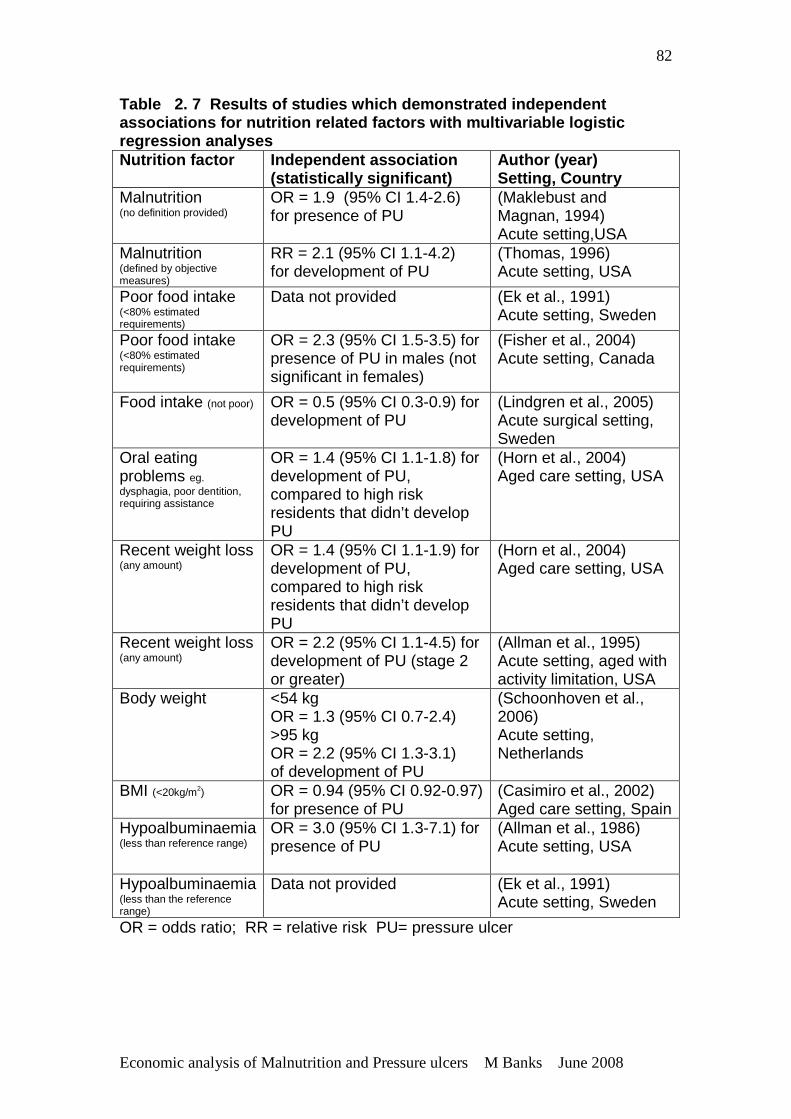
Economic analysis of Malnutrition and Pressure ulcers M Banks June 2008
82
Table 2. 7 Results of studies which demonstrated independent associations for nutrition related factors with mul tivariable logistic regression analyses Nutrition factor Independent association
(statistically significant) Author (year) Setting, Country
Malnutrition (no definition provided)
OR = 1.9 (95% CI 1.4-2.6) for presence of PU
(Maklebust and Magnan, 1994) Acute setting,USA
Malnutrition (defined by objective measures)
RR = 2.1 (95% CI 1.1-4.2) for development of PU
(Thomas, 1996) Acute setting, USA
Poor food intake (<80% estimated requirements)
Data not provided (Ek et al., 1991) Acute setting, Sweden
Poor food intake (<80% estimated requirements)
OR = 2.3 (95% CI 1.5-3.5) for presence of PU in males (not significant in females)
(Fisher et al., 2004) Acute setting, Canada
Food intake (not poor) OR = 0.5 (95% CI 0.3-0.9) for development of PU
(Lindgren et al., 2005) Acute surgical setting, Sweden
Oral eating problems eg. dysphagia, poor dentition, requiring assistance
OR = 1.4 (95% CI 1.1-1.8) for development of PU, compared to high risk residents that didn’t develop PU
(Horn et al., 2004) Aged care setting, USA
Recent weight loss (any amount)
OR = 1.4 (95% CI 1.1-1.9) for development of PU, compared to high risk residents that didn’t develop PU
(Horn et al., 2004) Aged care setting, USA
Recent weight loss (any amount)
OR = 2.2 (95% CI 1.1-4.5) for development of PU (stage 2 or greater)
(Allman et al., 1995) Acute setting, aged with activity limitation, USA
Body weight <54 kg OR = 1.3 (95% CI 0.7-2.4) >95 kg OR = 2.2 (95% CI 1.3-3.1) of development of PU
(Schoonhoven et al., 2006) Acute setting, Netherlands
BMI (<20kg/m2) OR = 0.94 (95% CI 0.92-0.97) for presence of PU
(Casimiro et al., 2002) Aged care setting, Spain
Hypoalbuminaemia (less than reference range)
OR = 3.0 (95% CI 1.3-7.1) for presence of PU
(Allman et al., 1986) Acute setting, USA
Hypoalbuminaemia (less than the reference range)
Data not provided (Ek et al., 1991) Acute setting, Sweden
OR = odds ratio; RR = relative risk PU= pressure ulcer
Economic analysis of Malnutrition and Pressure ulcers M Banks June 2008
83
A higher body mass index was found to have a protective effect by Casimiro
et al (2002). They found BMI was significantly higher in subjects without
pressure ulcer than in those with pressure ulcer , although the difference was
small (24.2 versus 22.7kg/m2, p=0.0001). Schoonhoven et al (2006) however
demonstrate that when weight is categorised, that being very underweight
(<54kg) and being very overweight (>95 kg) are associated with increased risk
of pressure ulcer development.
Hypoalbuminaemia is also been found to be an independent factor associated
with pressure ulcer development (Allman et al., 1986, Ek et al., 1991).
Hypoalbuminaemia occurs when there are lower than expected levels of
albumin, the primary protein found in blood or serum, which is often
associated with malnutrition. However decreases in serum albumin may
reflect the presence of a systemic inflammatory response rather than
nutritional status (Thomas, 2006). Albumin is a negative acute-phase protein,
that is, its levels decrease during acute metabolic stress associated with
illness or injury (Cordeiro et al., 2005). A study which investigated oxidative
stress and the acute-phase response in patients with pressure ulcers found
serum albumin levels were significantly lower and C-reactive protein
concentrations were significantly higher (a marker of the systematic
inflammatory response) in patients with pressure ulcers compared to controls,
indicating a systemic inflammatory response in relation to having a pressure
ulcer (Cordeiro et al., 2005). Similar findings were made by Raffoul et al
(2006). Horn et al (2004) found serum albumin levels significantly lower in
residents with an existing pressure ulcer than those who developed a
pressure ulcer, which they stated may be due to decreased protein synthesis
and catabolism during wound healing or losses of protein in the wound
exudate. Therefore hypoalbumaemia may be likely to be a measure of illness
rather than a measure of nutritional status in individuals with pressure ulcer
(Cordeiro et al., 2005).
The studies by Raffoul et al (2006) and Cordeiro et al (2005) also found in
addition to low levels of albumin, low levels, compared to expected levels, of
vitamins (or related metabolites) and minerals which have identified roles in
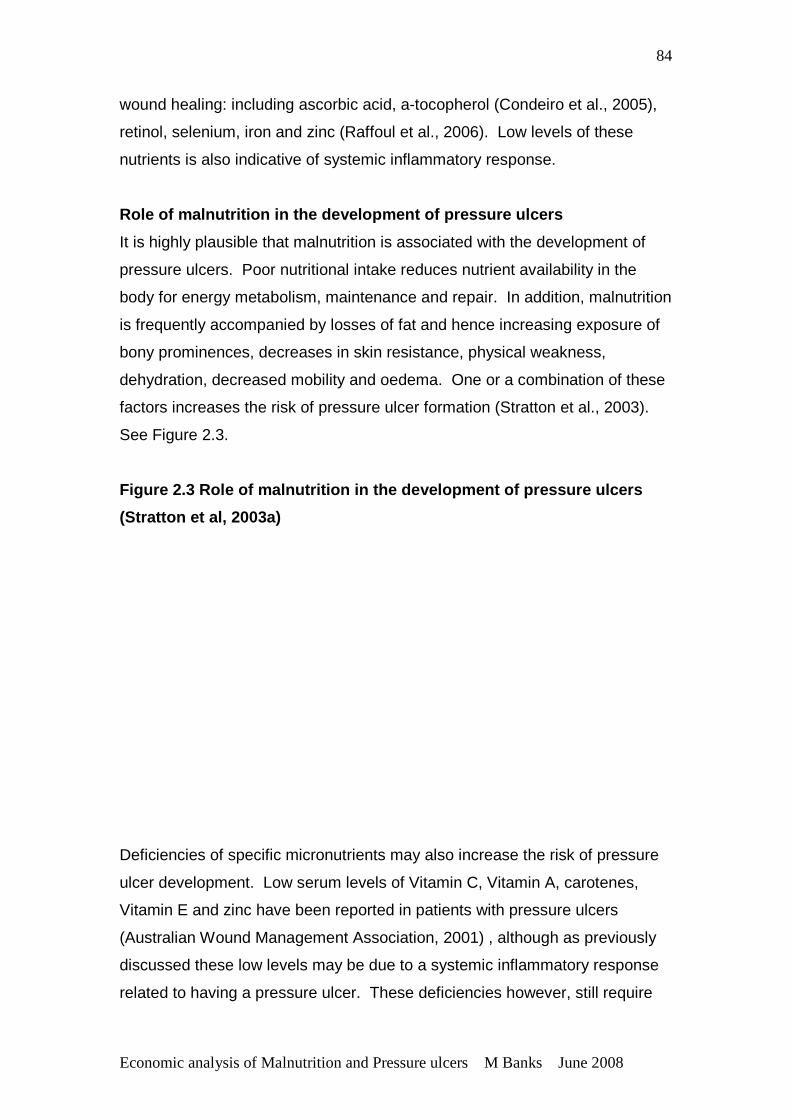
Economic analysis of Malnutrition and Pressure ulcers M Banks June 2008
84
wound healing: including ascorbic acid, a-tocopherol (Condeiro et al., 2005),
retinol, selenium, iron and zinc (Raffoul et al., 2006). Low levels of these
nutrients is also indicative of systemic inflammatory response.
Role of malnutrition in the development of pressure ulcers
It is highly plausible that malnutrition is associated with the development of
pressure ulcers. Poor nutritional intake reduces nutrient availability in the
body for energy metabolism, maintenance and repair. In addition, malnutrition
is frequently accompanied by losses of fat and hence increasing exposure of
bony prominences, decreases in skin resistance, physical weakness,
dehydration, decreased mobility and oedema. One or a combination of these
factors increases the risk of pressure ulcer formation (Stratton et al., 2003).
See Figure 2.3.
Figure 2.3 Role of malnutrition in the development of pressure ulcers
(Stratton et al, 2003a)
Deficiencies of specific micronutrients may also increase the risk of pressure
ulcer development. Low serum levels of Vitamin C, Vitamin A, carotenes,
Vitamin E and zinc have been reported in patients with pressure ulcers
(Australian Wound Management Association, 2001) , although as previously
discussed these low levels may be due to a systemic inflammatory response
related to having a pressure ulcer. These deficiencies however, still require
Economic analysis of Malnutrition and Pressure ulcers M Banks June 2008
85
addressing especially in patients with wounds that require healing (Cordeiro et
al., 2005, Raffoul et al., 2006).
Despite associations, causality between poor nutritional status and the
development of pressure ulcer has not yet been established (Thomas, 2006).
Experimental studies in animal models suggest a biologically plausible
relationship between malnutrition and development of pressure ulcers. When
pressure was applied for four hours to the skin of well nourished animals and
malnourished animals, pressure ulcers occurred equally in both groups.
However, the degree of ischaemic skin destruction was more severe in the
malnourished animals. At three days post injury, epithelialization of the
pressure lesions had occurred in well nourished animals, whereas massive
necrosis of the epidermis was still present in the malnourished animals
(Thomas, 2001). These data suggest that whereas pressure damage may
occur independently of nutritional status, malnourished animals may fail to
initiate healing after a dermal injury.
Summary
The pathogenesis of pressure ulcers is multifactorial, with pressure being the
primary cause, and many other factors either increasing or decreasing the risk
of an ulcer occurring. Many studies have found a number of factors
associated with pressure ulcer presence or development. It is important to
note that many factors found in some studies to be associated with pressure
ulcer development, are not found to be associated in others, and this is true
for nutrition factors . This is most likely due to methodology of studies,
definitions used and sample size. Recent well conducted studies have
demonstrated a strong, independent association between poor nutritional
status and development of pressure ulcers. However, due to the multifactorial
pathogenesis of pressure ulcers and dependence between many factors
associated with the development of pressure ulcer, a causal relationship
between poor nutritional status and pressure ulcers has not been established.
Economic analysis of Malnutrition and Pressure ulcers M Banks June 2008
86
2.11 CONSEQUENCES OF PRESSURE ULCERS
The most common complications related to pressure ulcers are increased
mortality, osteomyelitis and sepsis (Thomas, 2006). Pressure ulcers and
associated complications in turn have implications for length of hospital stay,
convalescence and healthcare costs (Stratton et al., 2003).
2.11.1 Morbidity and mortality
Pressure ulcers have been associated with increased mortality rates in both
acute and long-term care settings. A four-fold increased risk of death was
reported in geriatric patients and those in aged care settings who develop a
pressure ulcer, and the failure of a pressure ulcer to heal was associated with
almost a six times higher death rate (Allman et al., 1986). However, at least
one study has shown that when controlled for confounding of the presence
and severity of coexisting conditions, an association of pressure ulcers with
death (found at the univariate level) was eliminated (Thomas, 2006).
Local and systemic infections (cellulitis, osteomyelitis, sepsis) commonly
occur with pressure ulcers (Stratton et al., 2003). Bacteraemia from pressure
ulcers is low, but probably under estimated (Thomas, 2006). Sepsis is a
serious consequence of pressure ulcers and may be a frequent cause of
death (Thomas, 2006).
2.11.2 Quality of life
Pressure ulcers and the associated morbidity lead to sustained pain,
discomfort and suffering, decreased mobility, burden of requirement for
ongoing care and loss of independence, and even social isolation for the
individual (Versluysen, 1986, Coble Voss et al., 2005).
2.11.3 Length of hospital stay
Some studies have reported that a pressure ulcer extends the length of stay
of an acute hospital admission for patients between two and five times
(Allman et al., 1986, Lapsley and Vogels, 1996, Young et al., 2000). These
studies however did not control for other factors that might influence excess
Economic analysis of Malnutrition and Pressure ulcers M Banks June 2008
87
length of stay (Graves et al., 2005a). A study which controlled for admission
characteristics associated with increased length of stay, found the unadjusted
mean length of stay was almost 18 days or 2.5 times longer (30.4 +24.1 vs
12.8+10.3 days), but the adjusted mean length of stay was 4.0 days longer
(16.9 +11.0 vs 12.9+6.9) (Allman et al., 1999).
Graves et al (2005a) in an Australian (Queensland) tertiary hospital
investigated the independent effect of pressure ulcers on length of hospital
stay. They collected data regarding demographics, all observable risk factors
for excess length of stay, and dates of admission and discharge for 1747
individuals. Excess length of stay was determined in comparison to the
expected DRG length of stay. In the multivariable regression, the presence of
pressure ulcers prolonged length of stay by a median of 4.3 days (95%
confidence interval, 1.8-6.8).
2.11.4 Economic costs of pressure ulcer
In the USA, the Joint Commission for Accreditation of Healthcare
Organisations (JCAHO) estimated that there are 1.3-3 million adults with
pressure ulcer in the USA and that the costs of treatment are $500 to $40 000
per ulcer (JCAHO, 2007). The annual cost of treating pressure ulcers in the
UK was estimated to be approximately £ 750 million (1998 prices) with the
total cost of treatment for a patient with a full thickness ulcer being
approximately £ 30 000 (Stratton et al., 2003). These authors commented on
the magnitude of cost for a condition that is largely preventable, or able to be
halted at stage I.
The opportunity cost of prolonged length of stay in hospital (that is the value of
the beds not available for use by other patients) is another cost which is
significant, especially in health care systems with considerable waiting lists for
surgery. Prolonged length of stay by patients with pressure ulcer may
contribute to lengthening hospital waiting lists as beds are not available for
patients to be admitted (Stratton et al., 2003). In a recent Australian study,
the opportunity cost of prolonged length of hospital stay due to pressure
ulcers was predicted. It was estimated that for 2001-2002 there was a median
Economic analysis of Malnutrition and Pressure ulcers M Banks June 2008
88
of 95 695 cases of pressure ulcer, with a median of 398 432 beds days lost,
incurring median opportunity costs of bed days lost of AU$ 285 million
(Graves et al., 2005b). For Queensland, the corresponding figures were 16
628 (10 575 – 24 369) cases, 69 230 (15 732-180 133) bed days lost,
incurring AU$ 48.5 (11.0-126.1) million. The results from this study
represented only 52% of discharges from Australian public hospitals and
therefore probably underestimate the annual burden imposed by pressure
ulcers in Australia. In addition, only the value of the bed days lost to the
hospital system from pressure ulcers was included. These authors discuss
the need for further work to estimate the changes in cost and health benefits
that would arise from strategies to reduce the risk of pressure ulcers.
Another financial implication of pressure ulcers is the potential threat of
litigation associated with pressure ulcers. A study examining law suits related
to pressure ulcers in long term care facilities between 1999 and 2002 found
that lawsuits were becoming increasingly common and costly for long term
care facility owners (Coble Voss et al., 2005). Residents realized some type
of recovery against the facility in 87% of the cases and were awarded
amounts as high as US$3.12 million in damages. The data also show that
jury awards were highest for pressure ulcers caused by multiple factors and
that the highest awards for pressure ulcer caused by a single factor were seen
when that factor was inadequate nutrition (Coble Voss et al., 2005).
Summary
The consequences of pressure ulcers in terms of patient morbidity, quality of
life, and economic cost are substantial. Pressure ulcers are considered to be
largely preventable, and so there is a need to ensure evidence based, cost
effective systems are in place to reduce the incidence of pressure ulcers. By
preventing pressure ulcers, healthcare organisations have an opportunity to
improve efficiency and the quality of the patient’s experience and health
outcome.
Economic analysis of Malnutrition and Pressure ulcers M Banks June 2008
89
2.12 PREVENTION AND TREATMENT OF PRESSURE ULCERS
2.12.1 Prevention of pressure ulcers
Systematic efforts at education, heightened awareness of pressure ulcer
prevention, and specific interventions by multidisciplinary teams can reduce
the incidence of pressure ulcers (Thomas, 2006). Over time, reductions in
incidence of pressure ulcers of 25% to 50% have been reported in various
studies (Berlowitz et al., 2000, Granick et al., 1998, Sykes and Blanchfield,
2005). Granick et al. (1998) found a reduction in pressure ulcer prevalence
over four years in a USA hospital from 22.6% in 1993 to 8.7% in 1996.
Specifically there was a reduction in the percentage of pressure ulcers that
developed in hospital from 20.1% to 4.3%. This reduction in pressure ulcer
prevalence was attributed to the effectiveness of a multidisciplinary wound
care team overseeing the implementation of pressure ulcer prevention and
treatment guidelines. Similarly, in Australia, the incidence of pressure ulcer in
a southern Sydney area health service decreased from 17% in 1993, to 7.5%
in 2003; and to 5.4% in 2004 (Sykes and Blanchfield, 2005) after the
implementation of standardized guidelines. These studies indicate that a
significant proportion of pressure ulcers are preventable when evidence based
pressure ulcer prevention systems are implemented.
The prevention of pressure ulcers involves a number of strategies designed to
address both extrinsic factors eg. reducing the pressure duration or magnitude
at the skin surface by repositioning or using pressure relieving cushions or
mattresses; and intrinsic factors eg. the ability of the patient’s skin to remain
intact and resist pressure damage by optimising hydration, circulation and
nutrition (Langer et al., 2003). A systematic review by Reddy et al (2006)
found, given current evidence, using support services, repositioning the
patients, optimizing nutritional status and moisturizing sacral skin are
appropriate strategies to prevent pressure ulcers. Focus here is given only to
nutrition in relation to the prevention of pressure ulcers.
Economic analysis of Malnutrition and Pressure ulcers M Banks June 2008
90
Nutrition and prevention of pressure ulcers
A Cochrane systematic review was conducted regarding nutritional
interventions for preventing and treating pressure ulcers (Langer et al., 2003).
For prevention of pressure ulcers, four studies were included (Bourdel-
Marchasson et al., 2000, Delmi et al., 1990, Hartgrink et al., 1998, Houwing et
al., 2003) which all provided ‘mixed’ (consisting of protein, carbohydrates,
lipids, vitamins and minerals) nutritional products, compared to standard care.
Standard care refers to the provision of what is considered a ‘standard oral
diet’ which should provide basic nutritional requirements. Three trials used
oral nutritional supplements and one enteral tube feeding. They concluded
that there was evidence from only one large trial involving 672 patients, that
nutritional supplementation reduced the chance of developing a pressure
ulcer (RR 0.83, 95% CI 0.70-0.99) (Bourdel-Marchasson et al., 2000). This
trial was conducted in elderly critically ill patients. The other three trials were
all conducted in individuals recovering from hip fractures, which all indicated a
reduction in the number of pressure ulcers in the supplemented groups, but
the trials were too small to establish significance. The review authors
concluded that while there was some evidence that nutritional interventions
may be able to reduce the number of people who develop pressure ulcers,
more evidence was needed.
A subsequent systematic review and meta-analysis has been conducted.
Stratton et al. (2005) commented that the Cochrane review by Langer et al.
(2003) was based on evidence from randomized controlled trials (RCTs) only,
missed some relevant information from within the review period, did not
include a meta-analysis and only assessed pressure ulcer incidence (and time
to complete healing for treatment) as outcome measures and not other
clinically relevant parameters such as dietary intake and nutritional status,
complications, mortality and quality of life. Their review intended to address
these issues. For the prevention of pressure ulcers in at risk patients, they
included one other RCT (Ek et al., 1991) to the other four RCTs identified by
Langer et al (2003). Meta-analysis of four RCTs of oral nutrition support (high
protein of unspecified level, 200-500 Kcal/day) (Bourdel-Marchasson et al.,
2000, Delmi et al., 1990, Ek et al., 1991, Houwing et al., 2003) showed that
Economic analysis of Malnutrition and Pressure ulcers M Banks June 2008
91
the development of pressure ulcers was significantly reduced by nutritional
support compared to standard care (odds ratio = 0.75, 95% CI 0.62-0.89,
n=1224). When the RCT of enteral tube feeding (Hartgrink et al., 1998) was
included in the meta-analysis the result remained similar (odds ratio = 0.74,
95% CI 0.62-0.88), 5 RCTs, n=1325). See Figure 2. 4.
Economic analysis of Malnutrition and Pressure ulcers M Banks June 2008
92
Figure 2.4 Prevention of pressure ulcers in at ri sk patients following
nutritional support versus routine (standard) care: a meta-analysis
(Stratton et al, 2005)
Economic analysis of Malnutrition and Pressure ulcers M Banks June 2008
93
However several methodological limitations have been identified with these
studies (Reddy et al., 2006). None of the five studies provided information to
indicate that patients were randomly allocated with concealed allocation. Only
one of the studies provided adequate blinding of participants and outcome
assessors. Although the individual RCTs scored low ratings during quality
assessment for blinding, this is in part to be expected since blinding of
nutritional studies can be difficult (Stratton et al., 2005). The studies included
in the meta-analysis were typically short term (2-4 weeks), involved elderly
patients (mean age >75 years), suffering from a serious underlying condition
(eg. hip fracture, critical illness, bedridden, cognitive impairment, chronic
illness), and nutritional status of patients was not specifically reported. In all
studies the nutrition support was compared to standard care, which could vary
considerably between studies based on variations in practice.
However confidence in the results of the meta-analysis is supported by the
results of the individual studies, all of which reported a decreased incidence of
pressure ulcers with nutritional support. The lack of significance of the
individual studies is most likely to be due to small sample sizes, with the
increased power of the meta-analysis arising mostly from pooling of the data.
Therefore the findings of this meta-analysis despite some methodological
limitations can be considered robust, and given the heterogeneity of subjects
and settings included, are applicable to a large proportion of patients
considered to be at risk for pressure ulcer development, both in the hospital
and community care settings.
2.12.2 Treatment of pressure ulcers
Pressure ulcers are extremely difficult to heal. Once developed, this type of
chronic wound is very resistant to medical therapy. Pressure ulcers fail to
proceed through the normal sequence to produce anatomical or functional
integrity described in healing acute wounds, hence, prevention offers the best
opportunity for management (Thomas, 2006).
The principles of treatment of pressure include assessing severity; reducing
pressure, friction and shear forces; optimizing local wound care; removing
Economic analysis of Malnutrition and Pressure ulcers M Banks June 2008
94
necrotic debris; managing bacterial contamination; and correcting nutritional
deficits (Thomas, 2006). Focus here is given only to nutrition in relation to the
treatment of pressure ulcers.
Nutrition and treatment of pressure ulcers
In the Cochrane systematic review conducted by Langer et al. (2003), only
four RCTs were included in the review regarding the treatment of pressure
ulcers. Two involved treatment with ascorbic acid (Vitamin C) (Taylor et al.,
1974, ter Riet et al., 1995), one with very high protein (Chernoff et al., 1990),
and one with zinc (Norris and Reynolds, 1971).
All studies were considered small and generally of poor methodological
quality. Taylor et al. (1974) randomized 20 surgical patients with pressure
ulcers to receive 500mg ascorbic acid twice daily or a placebo for four weeks.
They found significant effects on the reduction of pressure ulcers area in the
intervention group. ter Riet et al (1995) randomized 88 patients in 11 nursing
homes and 1 hospital with pressure ulcers to 500mg ascorbic acid twice daily
or 10mg ascorbic acid twice daily for 12 weeks. Patients in the control group
had better clinical outcomes at 12 weeks. These results suggest that the
effect of ascorbic acid on the treatment of pressure ulcers seems to be at
least unclear. Chernoff et al (1990) randomized 12 enterally tube fed patients
with pressure ulcers to a high protein (formula consisting of 16% energy from
protein) or very high protein formula (consisting of 25% energy from protein)
and monitored pressure ulcer healing for eight weeks. They reported an
average decrease in ulcer size which was better in the very high protein
group. Norris and Reynolds (1971) performed a randomized, cross over study
with 14 patients with pressure ulcers. Patients received either 3 x 200mg zinc
sulphate per day or placebo for a period of 24 weeks, with cross over at 12
weeks. Only 3 patients completed the study, and they reported no significant
effects. All studies were considered small and generally of poor
methodological quality and the review authors concluded it was not possible
to draw any firm conclusions on the effect of nutrition on the treatment of
pressure ulcers from these studies.
Economic analysis of Malnutrition and Pressure ulcers M Banks June 2008
95
The subsequent systematic review by Stratton et al. (2005) regarding nutrition
support in the prevention and treatment of pressure ulcers included a number
of other studies, but there were insufficient comparable data to allow meta-
analysis in studies either comparing effects of nutritional support versus
routine care, or comparing different types of nutritional formula. Only one
study was included that provided mixed nutritional supplements compared to
standard care. Ek et al. (1991) provided mixed nutritional supplements and
reported that following nutritional support, 42% of pressure ulcers healed and
51% improved, compared with 30 and 41%, respectively, in those patients
receiving standard care, although the results were not statistically significant.
Several studies have been undertaken comparing different types of formulae.
Studies comparing an intervention of very high protein formula to standard
high protein formula (Breslow et al., 1993, Chernoff et al., 1990) reported
improved healing of pressure ulcer in the intervention group. Studies
comparing an intervention of a formula specifically formulated for pressure
ulcer treatment (enriched with arginine, ascorbic acid and zinc) with either
standard care or standard mixed nutritional supplements also report trends
toward improved healing with the disease specific formula (Benati et al., 2001,
Soriano et al., 2004). However both of these studies are considered of poor
methodological quality.
Overall, the review by Stratton et al. (2005) concluded that studies indicate a
trend towards enhanced healing, especially with the use of high protein
formulae (more than 20% of the energy in the formula is from protein) or
formulae developed for use with pressure ulcers (ie. disease-specific
formulae), but the sample sizes in all studies are small and lack statistical
power. Despite aiming to report on other clinically relevant outcome
measures, no studies reported on quality of life, and no conclusions were able
to be made about other outcomes such as complications, mortality, and
dietary intake and nutritional status.
More recently published studies provide more evidence of a positive
association between nutrition intervention and the treatment of pressure
Economic analysis of Malnutrition and Pressure ulcers M Banks June 2008
96
ulcers. A double blinded study conducted in the USA over multiple aged care
centres, randomized 89 residents with stage 2 pressure ulcer or above to
receive standard care plus a concentrated, fortified, collagen protein
hydrolysate supplement or standard care plus a placebo, three times daily for
eight weeks. Wound healing was assessed twice weekly using a validated tool
and after eight weeks there was approximately twice the rate of pressure ulcer
healing in the treatment group compared with the control group. The results
of this high quality study are very promising, however it is not clear if the
results of this trial were attributable to the study product’s amino acid profile,
its hydrolysed form, or the extra protein provided (Lee et al., 2006).
In Australia, a small study was conducted which randomized 16 patients to
receive either the standard hospital diet (Diet A), the standard diet plus two
high protein mixed nutritional supplements daily (Diet B), or the standard diet
plus two pressure ulcer specific formula (enriched with arginine, vitamin C and
zinc) daily (Diet C). Wound healing was assessed weekly for three weeks
using a validated tool. Results showed that patients randomized to the
disease specific formula (Diet C) had a significant improvement after three
weeks, and were significantly better than those randomized to the other diets
(Desneves et al., 2005). However, patients in the disease-specific formula
intervention group (Diet C group) were older and had a significantly lower BMI
(20.6 + 1.5 kg/m2, compared to 25.6 + 0.8 kg/m2 in Diet B group, and 24.4 +
1.0 kg/m2 in Diet A group) and were therefore possibly at more nutritional risk,
and possibly were more likely to receive benefit from nutritional
supplementation on the healing rate of their pressure ulcers.
In an epidemiological study which followed 882 residents of aged care
facilities for 12 weeks, the use of moist dressings ( for stage II, III and IV
pressure ulcers) and the provision of adequate nutritional support which met
estimated nutritional requirements (for stage III and IV pressure ulcers) were
found to be strong predictors of pressure ulcer healing (Bergstrom et al.,
2005).
Economic analysis of Malnutrition and Pressure ulcers M Banks June 2008
97
Studies investigating the nutritional intake of patients with pressure ulcer have
found that protein and energy intake, as well as micronutrient intake do not
meet nutritional requirements and many patients appear to need nutritional
supplementation just to meet standard requirements (Dambach et al., 2005,
Raffoul et al., 2006). Drambach et al (2005) found that the energy
requirements of 29 elderly patients with pressure ulcers was not similar to that
considered a ‘standard’ energy requirement for older adults (that being
approximately 25-30 kilocalories per Kg body weight per day), but their intake
was lower than their energy requirements by approximately 200-500
kilocalories per day, which may represent between 10 and 30% of energy
requirements. Raffoul et al (2006) found in nine patients with lower limb
ulcers or pressure ulcers, an average intake of 76% of energy requirements
being met by meals provided, and that oral nutritional supplements were
required to compensate for insufficient intakes from meals and to meet
micronutrient requirements.
Summary
Until Stratton et al. (2005) recently demonstrated through meta-analysis that
nutritional support can significantly decrease the risk of developing pressure
ulcers by 25%, the general consensus among reviewers was that the data
were still inconclusive regarding the effect of nutrition on the prevention and
treatment of pressure ulcers (Langer et al., 2003). Whilst the data is still
inconclusive regarding the treatment of pressure ulcers, and there is still a
requirement for more studies of high methodological quality, there is
consensus that nutrition is an important factor in the prevention and treatment
of pressure ulcers, as evidenced by its incorporation into pressure ulcer
prevention and treatment guidelines (Australian Wound Management
Association, 2001, RCN & NICE, 2005, EPUAP, 2001). There is sufficient
evidence to justify ensuring all patients at risk of or with pressure ulcers
receive nutritional intervention, probably in the form of nutritional
supplementation. What is unclear is whether nutritional supplementation is
required as nutritional requirements are greater in these individuals, or
whether nutritional supplementation is required to ensure that ‘standard’
nutritional requirements are met. More evidence is also required regarding
Economic analysis of Malnutrition and Pressure ulcers M Banks June 2008
98
the type of nutritional supplementation required, particularly the value of
formulae developed specifically for the prevention and treatment of pressure
ulcers.
2.13 POLICY AND PRACTICES IN IDENTIFICATION, PREVE NTION AND
TREATMENT OF PRESSURE ULCERS
Many countries, including Australia, have guidelines and/or standards
regarding the prevention and management of pressure ulcers. In Australia, the
Australian Wound Management Association (2001) published nationally
recognized clinical practice guidelines for the prediction and prevention of
pressure ulcer. Guidelines recommended for use across Europe are
published by EPUAP, most recently in 2001 (EPUAP, 2001). In the UK, The
Royal College of Nursing and National Institute for Health and Clinical
Excellence have published clinical practice guidelines, (NICE, 2003, RCN &
NICE, 2005). Recently the EPUAP and NPUAP have commenced a
collaboration to develop international pressure ulcer guidelines
(www.pressureulcerguidelines.org).
In the USA, the Joint Commission for Healthcare Organisations (JCAHO) has
included the prevention of pressure ulcers as one of its National Patient
Safety Goals (JCAHO, 2007). The Australian Council on Healthcare
Standards (ACHS) has added into its latest version of standards for
healthcare accreditation a criterion related to pressure ulcer prevention and
management (Austalian Council on Healthcare Standards, 2006). The
inclusion of this criterion in accreditation standards emphasizes the
importance healthcare organisations place on the prevention and
management of pressure ulcer to patients’ health outcomes and quality of life.
In Australia, there is significant evidence of much activity in relation to
improving pressure ulcer prevention and management practice (Dunk and
Trevit, 2005, Manning and Philcox, 2005, McErlean and Thomas, 2005,
Newell, 2005, Queensland Wound Care Association, 2005, Strachan, 2005,
Sykes and Blanchfield, 2005) . Several states have conducted state-wide
Economic analysis of Malnutrition and Pressure ulcers M Banks June 2008
99
prevalence audits (Queensland Wound Care Association, 2005, Strachan,
2005) and most have undertaken projects to implement the national
guidelines (Dunk and Trevit, 2005, McErlean and Thomas, 2005, Newell,
2005, Queensland Wound Care Association, 2005, Strachan, 2005, Sykes
and Blanchfield, 2005).
Current practices related to nutritional care in th e identification,
prevention and treatment of pressure ulcers.
Most, if not all, guidelines on pressure ulcer prevention and management
include some nutritional recommendations but they are usually only general in
nature (Schols and de Jager-v d Ende, 2004). A recent study assessed the
recommendations regarding nutrition in pressure ulcer guidelines from a
number of countries. Thirteen different sets of guidelines were received from
a number of countries (not including Australia). All the guidelines had
nutrition recommendations, but in the majority of cases the nutrition
recommendations were general in nature only, and did not cover the
nutritional cycle from nutrition screening and assessment, through intervention
to evaluation and follow up (Schols and de Jager-v d Ende, 2004). There
was wide variation in the nutritional recommendations in the guidelines: eight
emphasized the importance of performing a nutritional assessment of the
patient with, or at high risk of pressure ulcer; four contained nutritional
recommendations regarding the prevention and treatment of pressure ulcers;
five contained information on the use of nutritional supplementation (when a
patient cannot eat normally or sufficiently); five contained information on the
importance of adequate fluid intake; none had any information on the
measurement of effects of nutrition intervention, or referral to other nutritional
guidelines; only two had information on nutritional follow up; and only three
recommended consultation with a dietitian. These authors concluded that the
importance of nutrition in pressure ulcer guidelines is generally not being
addressed and that nutrition recommendations in pressure ulcer guidelines
could be improved (Schols and de Jager-v d Ende, 2004).
The European Pressure Ulcer Advisory Council has developed separate
nutritional guidelines for pressure ulcer prevention and treatment (Clark,
Economic analysis of Malnutrition and Pressure ulcers M Banks June 2008
100
2003). These guidelines are comprehensive, however if nutritional guidelines
are separate from main guidelines they may be less likely to be implemented
(Schols and de Jager-v d Ende, 2004).
In Australia, the Clinical Practice Guidelines for the Prediction and Prevention
of Pressure Ulcers (Australian Wound Management Association, 2001)
contain fairly general nutrition recommendations: “Maintain a balanced diet in
individuals ‘at risk’. They should be assessed regularly and referred to a
dietitian if their diet is inadequate”. Despite the promotion and wide
implementation of these clinical practice guidelines, which specify referral to a
dietitian, Australian dietitians generally report poor rates of referral for
individuals with or at risk of pressure ulcers (personal experience and
extensive personal communications).
Nutritional risk in pressure ulcer risk assessment
The most commonly used pressure ulcer risk assessment tools include the
Norton Risk Assessment, The Waterlow Pressure Sore Prevention/Treatment
Policy and the Braden Scale (Australian Wound Management Association,
2001, Pancorbo-Hidalgo et al., 2006). The Norton Risk Assessment does not
have any parameters related to assessing nutrition risk. The Braden Scale
(Bergstom et al., 1987) has a nutrition component as part of the scale, that
being usual food intake pattern, from very poor to excellent. Whilst this
provides a potentially useful assessment of current food intake, it doesn’t
include other relevant nutrition risk parameters such as recent weight loss, or
even if underweight or overweight. The Waterlow Pressure Sore
Prevention/Treatment Policy (Waterlow Score) had two nutrition related
components, including build/weight for height, and appetite, although both
components were poorly defined. A recent update of the Waterlow Score
(Waterlow, 2005) has included actual BMI ranges to allow more accurate
determination of being underweight or overweight, and replaced the appetite
section with the Malnutrition Screening Tool (MST) (Ferguson et al., 1999).
The MST scores substitute favourably with the previous appetite score in the
tool, but the score provided is valid with respect to nutritional risk (Correia et
al., 2003, Ferguson et al., 1999). This has been a significant step in getting
Economic analysis of Malnutrition and Pressure ulcers M Banks June 2008
101
nutritional risk assessed as part of pressure ulcer risk. However
implementation of the updated Waterlow Score is still required before it can be
expected that there will be any change in practice with respect to nutritional
care and pressure ulcer prevention or treatment.
Summary
The importance of the prevention and treatment of pressure ulcers is now
recognized and has been elevated to the status of a safety and quality issue
in many countries. However the importance of nutrition status and nutritional
intake in the prevention and treatment of pressure ulcers is generally not
being recognized or actioned within policy, standards or guidelines. There is
a need to elevate the importance of nutrition in policy, standards and
guidelines with respect to the prevention and treatment of pressure ulcers.
This is especially true in the Australian context where malnutrition and its
consequences, and the benefits of nutrition intervention are not yet
recognized as in many other countries.
ECONOMIC EVALUATION IN HEALTH CARE
2.14 PURPOSE OF ECONOMIC EVALUATION
The aim of any health care system is to maximize the health and welfare of
the population within resource constraints. Because resources will always be
scarce in relation to the health care needs, choices must be made. Those
responsible for allocating resources need to prioritize between competing
uses so that maximum benefit (health gain) can be obtained from a given
budget. Economic evaluation provides a decision making framework for
making this prioritization. Economic evaluation is the comparative analysis of
alternative courses of action in terms of both their costs and consequences.
The basic tasks of any economic evaluation are to identify, measure, value
and compare the costs and consequences of alternatives being considered
(Drummond et al., 2005).
Economic analysis of Malnutrition and Pressure ulcers M Banks June 2008
102
The majority of the following sections are sourced from Drummond et al.
(2005), unless otherwise referenced.
2.15 APPROACHES TO ECONOMIC EVALUATION
2.15.1 Cost effectiveness analysis
Cost effectiveness analysis (CEA) is a method of economic evaluation where
both the costs and consequences of health programmes or treatments are
examined. CEA is of most use in situations where a decision-maker,
operating within a given budget, is considering a limited range of options
within a given field. Measures of effectiveness are defined in appropriate
natural units. Some units are final, health-related measures of outcome, such
as ‘life years gained’ or in the case of pressure ulcers ‘episode free days’,
others are expressed as intermediate outcomes, such as ‘cases detected’ or
‘percentage cholesterol reduction’. Intermediate outputs are admissible, as
long as there is an established link between these and a final health outcome,
or that intermediate outputs themselves have value. In CEA, the incremental
cost of a programme from a particular viewpoint is compared to the
incremental health effects of the programme, and results are usually
expressed as a cost per unit of effect eg. cost per episode free day
(Drummond et al, 2005, pp 12-14).
2.15.2 Cost utility analysis
A broader measure of the benefits of health care programmes is utility. Cost
utility analysis (CUA) is a form of evaluation that focuses attention on the
quality of the health outcomes produced or averted by health programmes or
treatment. In CUA, the incremental cost of a programme from a particular
viewpoint is compared to the incremental health improvement attributable to
the programme, where the health improvement is measured in quality
adjusted life years (QALYs) gained, or possibly some variant like healthy
years equivalent (HYEs). The results of CUAs are typically expressed in as a
cost per QALY gained (Drummond et al, 2005, p.14).
Economic analysis of Malnutrition and Pressure ulcers M Banks June 2008
103
Hence, CEA and CUA are similar on the cost side, but differ on the outcomes
side. Outcomes in CEA are single, programme specific, and unvalued. In
contrast, outcomes in CUA may be single or multiple, are general as opposed
to programme specific, and incorporate the notion of value.
2.15.3 Cost benefit analysis
The features that distinguish among economic evaluation approaches are the
way in which the consequences of the health care programme are valued.
Cost benefit analysis is a form of economic evaluation that requires
programme consequences to be valued in monetary units, thus enabling the
analyst to make a direct comparison of the programme’s incremental cost with
its incremental consequences in commensurate units of measure eg. dollars
(Drummond et al, 2005, pp15-16).
2.16 COSTING ANALYSIS
The analysis of the comparative costs of alternative treatments of health care
programmes are common to all forms of economic evaluation. The main
categories of costs of health care programmes or treatments are:
• costs arising from the use of resources within the health sector
• resource use by patients and their families
• resource use in other sectors
• productivity changes
The viewpoint from which the evaluation is occurring will affect the costs
included, because a cost from one point of view may not be considered a cost
from another point of view. For example, patients’ travel costs are a cost from
a patients’ point of view and from society’s point of view, but would not be
from the health department’s point of view. Possible points of view include
those of society, the health department, other government departments, the
state government, the federal government, the patient, the employer and the
agency providing the programme. The broadest point of view and one that is
always relevant is the societal point of view (Drummond et al, 2005, p.55-56).
Economic analysis of Malnutrition and Pressure ulcers M Banks June 2008
104
There are also non market items that may need to be costed, such as
volunteer time. Capital costs or depreciation of capital costs should be
considered. The time period over which costs should be tracked needs to also
be considered eg. one treatment programme may have lower costs initially
compared to another programme, but higher follow up costs over coming
months or years.
Other considerations for the inclusion of costs include (Drummond et al, 2005,
pp. 55-57):
• The relevance of costs. Costs common to programmes under comparison
need not be considered as they will not affect the choice between the
given programme eg. two programmes undertaken in a hospital setting
need not consider all the costs of being in hospital, only what is different
about the hospital admissions.
• The relative magnitude of costs. It is not worth investing a great deal of
time and effort considering costs that, because they are small, are unlikely
to make any difference to the study result. However some justification
should be given for the elimination of such costs.
Once the relevant costs have been identified, the individual items must be
measured and valued. If an economic evaluation is being conducted
alongside a clinical trial, data on the resource quantities may be collected as
part of the study. If the evaluation is free standing, resource quantities may
be estimated by a review of patient charts or other routine data systems
(Drummond et al, 2005, pp 57-71).
The accuracy of costing depends on the purpose of the economic evaluation.
The major factor is the likely quantitative importance of each cost category in
the evaluation. Different levels of precision in costing for hospitals costs can
go from micro-costing of each component of resource uses eg. laboratory
tests, days of stay by ward and drugs, to case mix group costing, or disease
specific daily costs or just daily costs of all categories of patients. For
Economic analysis of Malnutrition and Pressure ulcers M Banks June 2008
105
example, in an evaluation to compare two drug therapies it is likely that the
study result will be sensitive to the costs of the drugs themselves. Therefore it
would be important to record dosages and routes of administration carefully to
facilitate micro-costing. But if the drugs concerned have side effects that may
infrequently cause hospitalizations, it may suffice to use a per day or case-mix
group cost for these. The accuracy of costs for an evaluation will also be
dependent on the degree of detail available on costs of resources. For
example it may not be worthwhile collecting considerable detail on resource
quantities if only average daily costs are available in a given setting.
The pragmatic approach to costing is to use existing market prices unless
there is some particular reason to do otherwise eg. the price is subsidized in
some way by a third party (Drummond et al, 2005, p.57).
The theoretical proper price for a resource is its opportunity cost. Opportunity
cost is the value of forgone benefits because the resource is not available for
its best alternative use (Drummond et al, 2005, p 57).
2.16.1 Costing analysis of occupying a hospital be d
The cost of the admission of an individual to a hospital bed, and the number of
days they stay in hospital can be considered from several viewpoints
(Drummond et al, 2005, p 71-72).
Firstly the actual costs of staying in hospital. These costs can be considered
to consist of two elements: the hotel cost or infrastructure costs of occupying a
bed which is broadly constant over the length of stay; and the treatment cost,
which often peaks in the first few days of admission due to specific
investigations and interventions and then tail off during the length of stay. If
the number of patients being admitted and discharged from hospital increased
due to decreasing the length of stay of patients, this would actually cost the
hospital more. If this was the viewpoint being taken, it would be necessary to
determine these two elements of costing ie hotel costs and treatment costs
per day of stay.
Economic analysis of Malnutrition and Pressure ulcers M Banks June 2008
106
However the other viewpoint of the cost of the admission and the length of
stay is the opportunity cost of the hospital bed day, which is the availability of
hospital beds for patients to be admitted to. This is highly relevant where
there are individuals waiting for treatment and the unavailability of hospital
beds to be admitted to, to enable the treatment, is the factor limiting the
access to the treatment. In this case the average daily cost of a bed would
probably suffice for the analysis (Drummond et al, 2005, p 72).
2.17 EFFECTIVENESS DATA FOR USE IN ECONOMIC ANALYSI S
Data on effectiveness for use in economic analysis may be obtained in a
number of ways. Ideally parameters that describe effectiveness should be
informed by a high quality randomized clinical trials or a meta-analyses of
multiple trials. However, many analyses rely on the best available data and
this can include others sources of evidence (Drummond et al, 2005, pp 104-
109).
2.18 ALLOWING FOR UNCERTAINTY IN THE ESTIMATE OF C OSTS AND
CONSEQUENCES – SENSITIVITY ANALYSIS
Every evaluation contains some degree of uncertainty, imprecision, or
methodological controversy. Regardless of the nature of the data used it is
important to understand the uncertainty around the parameters and
appropriately quantify the effect of that uncertainty on the results of the
analysis (Drummond et al, 2005, pp39-43).
In an economic evaluation conducted concurrently with a clinical trial, patient
level data collected will be stochastic (that is, have an average and variance).
In studies where key model parameters are drawn from a number of sources
the approach for dealing with parameter uncertainty is called sensitivity
analysis. In sensitivity analysis the various parameters in the model are
varied in order to assess how this impacts upon the study results and hence
sensitivity analysis permits the robustness of the results to be tested in light of
variations of key variables (Drummond et al, 2005, p 42).
Economic analysis of Malnutrition and Pressure ulcers M Banks June 2008
107
In principle, all parameters in an analysis are potentially candidates for
sensitivity analysis, and reasons should be given if parameters are not
included. Reasons for ranges specified for parameters should be given.
Plausible ranges could be determined through published literature or using a
specified confidence interval around the mean (for stochastic data). Another
approach is to apply probability distributions to the specified ranges
(Drummond et al, 2005, p 42).
Simple sensitivity analysis entails varying one or more of the components of
an evaluation to see how it affects the results. Although this is one of the most
common forms of sensitivity analysis in the literature, it is now not regarded as
a satisfactory approach for handling parameter uncertainty, because the
overall uncertainty in the cost effectiveness ratio depends on the combined
variability in several factors (Drummond et al, 2005, p 42).
Multi-way analysis recognizes that more than one parameter is uncertain and
that each could vary within its specified range. This approach is more realistic
but unless there are only a few uncertain parameters, the number of potential
combinations becomes very large (Drummond et al, 2005, p 43).
Another approach is scenario analysis where a series of scenarios are
constructed representing a subset of the potential multi-way analyses.
Typically the scenarios will include a base case (best guess) scenario and the
most optimistic (low cost and high effectiveness) and the most pessimistic
(high cost and low effectiveness) scenarios (Drummond et al, 2005, p 43).
Probabilistic sensitivity analysis is a form of sensitivity analysis which assigns
probability distributions to the specified range for key parameters, and
samples are drawn at random from these distributions, by computer
programs, to generate an empirical distribution of the result. The advantage
of this approach is that it can simultaneously deal with a large number of
variables and indicate the degree of confidence that can be attached to the
options (Drummond et al, 2005, p 43; 302-304).
Economic analysis of Malnutrition and Pressure ulcers M Banks June 2008
108
By using sensitivity analysis it is possible to show whether the results of a
particular study are robust over a range of assumptions or hinge on the
accuracy of particular assumptions (Drummond et al, 2005, p 42).
2.19 INCREMENTAL ANALYSIS OF COSTS AND CONSEQUENCE S
In all economic analyses, at least two alternatives are compared, often a new
alternative against existing practice. For comparisons of different health care
programmes to be meaningful, it is necessary to examine the additional costs
that one programme imposes over another, compared with the additional
effects, benefits or utilities it delivers. The difference between the costs of the
two alternatives, divided by the difference between the two effects of the two
alternatives results in an incremental cost effectiveness ratio (ICER). The
alternative with the lowest ICER represents the most efficient choice.
The costs and effects of competing alternatives can be illustrated graphically
on a four quadrant diagram known as the cost-effectiveness plane
(Drummond, et al, 2005, pp 38-39). See Figure 2.5.
Economic analysis of Malnutrition and Pressure ulcers M Banks June 2008
109
Figure 2.5 Cost effectiveness plane (Drummond e t al, 2005, p.40)
The origin usually represents existing practice. Each alternative being
compared is plotted on this plane dependent on its difference in costs and
effects from the alternative at the origin. The gradient of the line drawn from
the origin to the plotted point for an alternative represents the ICER. In
practice the impact of many new alternative interventions falls in quadrant I.
That is, they add to cost but increase effectiveness, when compared with no
intervention. If the alternative falls into quadrant IV, it is both less effective
and more costly than the alternative at the origin, and should therefore not be
implemented. If the alternative falls into quadrant III it is both less effective
and less costly than the alternative at the origin. Consideration should only be
given the implementation of this alternative if budget restraints restricted the
implementation of the alternative at the origin. If an alternative falls into
quadrant II, it would be both less costly and more effective than the alternative
at the origin, and it would be expected that this alternative should be
implemented.
Economic analysis of Malnutrition and Pressure ulcers M Banks June 2008
110
When the alternative falls into quadrant 1 as it often does, the decision to
implement the alternative strategy is not as straight forward had it fallen within
the other quadrants. The choices to be made for alternatives that fall in
quadrant 1 reflect willingness to pay (WTP) for a unit of effect. That is a
threshold line may be drawn representing the maximum that is prepared to be
paid for the desired change in effect eg. cost per QALY, and only alternatives
whose cost effectiveness ratios falls that fall below the threshold line would be
considered (Drummond et al, 2005, pp 38-40).
2.20 ECONOMIC EVALUATION OF NUTRITION STATUS AND O F
NUTRITION INTERVENTIONS
The economic cost of malnutrition was reviewed earlier in Section 2.4.5.
Whilst these studies all indicated significant costs related to malnutrition,
which would be ‘opportunity costs’, all of the studies presented can be
criticized in relation to economic analysis methodology.
Economic analysis of the impact of nutritional interventions has been
undertaken in few studies. Examples of interventions where economic
analysis has been undertaken include: nutrition education programs for
children in developed countries (Waters et al., 2006); nutrition education
programs for low income women (Burney and Haughton, 2002); nutritional
education for hypercholesterolemia and diabetes (Delahanty et al., 2002,
Franz et al., 1996) and effects of nutrition support (Pritchard et al., 2006).
Economic analysis studies of the impact of nutrition support were discussed in
Section 2.5.3. Review of these studies in light of economic analysis quality
methodology indicates most studies fall well short. A review of the economics
literature related to nutrition support found that overall, 16 out of 21
randomized trials reviewed were of poor methodological quality (Pritchard et
al., 2006). There was frequent failure to state the viewpoint of the analysis or
to state or justify the form of economic evaluation used. In general, costing
methods were crude and it appeared that costs were far from comprehensive.
Generally they appeared to be reported for the nutrition supplements, and
then often on the basis of a daily rate, rather than full costs of treatment. On
Economic analysis of Malnutrition and Pressure ulcers M Banks June 2008
111
the outcomes side, there was a failure to measure final endpoints rather than
intermediate clinical endpoints. Most studies failed to make even a minimal
allowance for uncertainty by the use of sensitivity analysis, nor did authors
take advantage of the stochastic nature of the data to present measures of
precision such as confidence intervals (Pritchard et al., 2006).
Enteral versus parenteral was found to be the most common comparison
undertaken in the review by Pritchard et al. (2006), followed by trials of
immune-enhancing supplements. This review highlights a lack of evidence
related to costs and effects of different types of nutrition intervention. These
authors conclude that further research would be valuable to investigate the
costs and effects of different forms of nutrition in different patient groups. The
inclusion of costs in trials of interventions can provide useful information but,
as with the design of the studies themselves, should follow robust methods
(Pritchard et al., 2006).
No published studies were located investigating the economic costs of
pressure ulcers attributable to malnutrition or economic outcomes of nutrition
intervention in the prevention of pressure ulcers.
2.21 ECONOMIC EVALUATION OF PRESSURE ULCERS, AND I N THE
PREVENTION AND TREATMENT OF PRESSURE ULCERS
The economic cost of pressure ulcer reviewed earlier in Section 2.11.4.
Whilst most of these studies indicated significant opportunity costs related to
pressure ulcers, many of these studies were again of poor methodological
quality. Sound methodological quality was however employed in one study
undertaken in Australia. Graves et al. (2005) developed a probabilistic model
to predict the opportunity cost of prolonged length of hospital stay due to
pressure ulcer, which was described in detail in Section 2.11.4.
A few studies have been undertaken that demonstrate a positive cost-benefit
of prevention of pressure ulcer, compared to treating pressure ulcers (Clough,
1994, Thomson and Brooks, 1999). There are also a few studies which have
Economic analysis of Malnutrition and Pressure ulcers M Banks June 2008
112
investigated the cost-effectiveness of different types of pressure ulcer
treatment strategies (Bergemann et al., 1999, Muller et al., 2001). For
example, Bergemann et al. (1999) determined the cost effectiveness of five
currently used wound dressings using a sensitivity analysis approach. They
demonstrated that despite higher material costs of hydroactive wound
dressings in combination with enzymatic wound cleaning (costs between
DM14 to DM180 and DM600 to DM1100 depending on the wound type and
length of treatment), these dressing should be recommended for the treatment
of pressure ulcers and venous leg ulcers, compared with other less expensive
wound dressings, as this therapy brings about significant reductions in total
costs for hospitals because of significant reductions in personnel costs and
the duration of treatment. The cost savings per case were between DM 1196
and DM 9826 (1997 values) using hydroactive wound dressings instead of
gauze dressings.
Only one study was located which estimated the cost-effectiveness of different
interventions to reduce the risk of pressure ulcer development. The cost-
effectiveness of alternating pressure mattresses compared with alternating
pressure overlays for the prevention of pressure ulcers was carried out
alongside a multi-centre pragmatic randomized controlled trial (Iglesias et al.,
2007). The study found that alternating pressure mattresses were associated
with lower overall costs (average £283.6 per patient) mainly due to reduced
length of hospital stay and greater benefits (a delay in time to ulceration of
average 10.64 days). The differences in health benefits and total costs for
hospital stay between alternating pressure mattresses and alternating
overlays were not statistically significant, however, a cost effectiveness plane
indicated an 80% probability of alternating pressure mattresses to be cost
saving compared with alternating overlays. Graves et al. (2005) discussed
the need for more such studies that estimate the changes in cost and health
benefits that would arise from competing strategies to reduce the risk of
pressure ulcers.
Economic analysis of Malnutrition and Pressure ulcers M Banks June 2008
113
2.22 SUMMARY AND LIMITATIONS OF CURRENT RESEARCH
It is likely that malnutrition is highly prevalent in Australia in hospitals,
residential care facilities and other health care institutions and sectors of the
community. Published Australian studies are however limited in number, with
none conducted across multiple centres or in residential aged care facilities.
This is worthy of further valid research using standardized methodology.
Malnutrition has been demonstrated to be independently associated with
adverse clinical outcomes (including pressure ulcers) and costs; however
few studies investigating the consequences of malnutrition have been
conducted in Australia, and none investigating the association with pressure
ulcers.
Despite an association with adverse clinical outcomes, malnutrition continues
to frequently go unrecognized and inadequately treated. This appears to be
largely due to lack of awareness of the problem of malnutrition, and a lack of
overwhelming evidence of outcomes from nutrition interventions. Raising
awareness through research and teaching, of the clinical outcomes and costs
associated with malnutrition and lack of nutritional care is required.
Despite a requirement for high quality randomized controlled studies
investigating nutrition support interventions in the prevention and treatment of
malnutrition, there is evidence to indicate that the provision of nutrition support
interventions to those at risk of malnutrition is beneficial. Similarly, whilst
there is still a requirement for high quality randomized controlled studies, there
is evidence that nutrition support interventions for individuals at risk, reduces
the incidence of developing pressure ulcers.
Pressure ulcers are recognized as a significant burden for patients and the
healthcare system, with adverse effects on quality of life, clinical outcomes
and economic costs. Pressure ulcers are considered largely preventable and
pressure ulcer incidence is considered an indication of quality care and a
patient safety issue. Several countries now have policy or accreditation
Economic analysis of Malnutrition and Pressure ulcers M Banks June 2008
114
standards in place, including Australia, regarding systems to reduce the
incidence of pressure ulcers. However the importance of nutrition status and
nutritional intake in the prevention and treatment of pressure ulcers is
generally not being promoted within policy or guidelines. This is probably due
to a lack of research in this area, particularly economic research. There is a
need to elevate the importance of nutrition in policy, standards and guidelines
with respect to the prevention and treatment of pressure ulcers. This is
especially true in the Australian context where malnutrition and its
consequences, and the benefits of nutrition intervention are not yet
recognized as in many other countries. The demonstration of an independent
association between malnutrition and pressure ulcers, and significant
economic costs and cost effectiveness related to nutrition in the prevention
and treatment of pressure ulcers should influence policy and standard
development in the area of nutrition.
In the USA and Europe, policy, standards and recommendations are in place
regarding the identification, prevention and treatment of malnutrition.
However, a lack of local evidence has yet to get malnutrition on the safety and
quality agenda in Australia. Research such as being conducted in this
research program will contribute to the local evidence base, which should
eventually see malnutrition elevated to a high priority safety and quality issue
in Australian healthcare, similarly to pressure ulcers.
Economic analysis of Malnutrition and Pressure ulcers M Banks June 2008
115
CHAPTER 3: AIMS, OBJECTIVES AND SIGNIFICANCE OF
STUDY PROGRAM
3.1 AIMS
The aims of the study program were to:
1. Determine the prevalence of malnutrition, variables associated with
malnutrition and its association with pressure ulcers in Queensland Health
hospitals and residential aged care facilities.
This aim is addressed by Objectives 1 and 2, and will be referred to as the
‘Epidemiological studies’.
2. Estimate the economic consequences of malnutrition by determining
the costs arising from pressure ulcers attributable to malnutrition; and the
economic outcomes of an intervention to address malnutrition, in the
prevention of pressure ulcers in hospitals.
This aim is addressed by Objectives 3 and 4, and will be referred to as the
‘Economic modelling studies’.
3.2 OBJECTIVES & SIGNIFICANCE:
Objective 1: To determine the prevalence of malnutrition in Que ensland
public acute and residential aged care facilities, and identify variables
which may be associated with malnutrition in these populations .
Significance: There are several papers detailing the significant prevalence of
malnutrition in health care institutions and various other settings from
overseas studies, but very few recently published papers from Australia.
From the outset of the study program it is important to establish the
significance of the issue of malnutrition in Australian health care institutions in
comparison to that reported from overseas. There have been several small
Economic analysis of Malnutrition and Pressure ulcers M Banks June 2008
116
institutional studies reported locally which indicate that it is likely that
malnutrition is a significant problem in health care institutions in Australia, but
this needs to be verified using standardized and validated methodology in a
significant sample of patients.
Expected outcome: Data on the prevalence of malnutrition in Queensland
public facilities, gained from a large pool of patients from multiple hospitals
and residential aged care facilities; and factors associated with malnutrition in
this population.
Objective 2: To determine the effect of nutritional status on t he presence
and severity of pressure ulcers in individuals.
Significance: The consequences of malnutrition are frequently not
recognized. Malnutrition is associated with increased complications, length of
hospital stay and mortality. Malnutrition has also been found to be associated
with the development of pressure ulcers, but there are limited studies as to the
extent of this association and no studies conducted in Australia. Pressure
ulcers are considered to be largely preventable. The consequences of the
development of a pressure ulcer include considerable pain and discomfort to
patient, and considerable costs associated with the treatment and increased
length of hospital stay of the patient. An association between malnutrition
and pressure ulcers will highlight the importance of identification, prevention
and treatment of malnutrition also.
Expected outcome: Australian data on the independent effect of malnutrition
on the presence and severity of pressure ulcers in individuals, presented as
an odds risk, gained from a large pool of patients from multiple Queensland
public hospitals and aged care facilities.
Objective 3: To estimate the economic consequences of malnutrit ion,
by determining the excess length of hospital stay a nd cost arising from
pressure ulcers that are attributable to malnutriti on in the hospital
population.
Economic analysis of Malnutrition and Pressure ulcers M Banks June 2008
117
Significance: Data are available on the economic cost of pressure ulcer from
extended length of stay of hospitalized patients in Australia. The
determination of the proportion of these costs which is attributable to
malnutrition will highlight a proportion of the economic consequences of
malnutrition in Queensland public hospitals. This will provide preliminary
evidence that can be used to make economic arguments that justify the
consideration of the implementation of systems to identify, prevent and treat
malnutrition.
Expected outcome: An estimate of the number of cases of pressure ulcer,
number of bed days lost to pressure ulcer, and the associated economic cost
of these bed days which can be attributed to malnutrition, for a designated
year in Queensland public hospitals.
Objective 4: To estimate the economic outcomes of an intervent ion that
provides intensive nutrition support to nutritional ly at risk patients in
hospital, where ‘cases of pressure ulcer avoided’, ‘number of bed days
not lost to pressure ulcer’ and ‘economic costs’ ar e the relevant
outcomes.
Significance: Economic analysis provides a decision making framework for
comparative analysis of alternative courses of action in terms of their costs
and consequences. The estimation of the economic outcomes of nutrition
support interventions in the prevention of pressure ulcers will provide
preliminary evidence that can be used to make economic arguments that
justify the consideration of the implementation of systems to identify, prevent
and treat malnutrition.
Expected outcome: An estimate of the number of cases of pressure ulcer
prevented, number of bed days not lost to pressure ulcer, and the associated
economic costs if an intensive nutrition support intervention were
implemented, for a designated year in Queensland public hospitals.
Economic analysis of Malnutrition and Pressure ulcers M Banks June 2008
118
CHAPTER 4 METHODS
4.1 OVERVIEW OF APPROACH TO METHODS
The study program was undertaken in two phases. Objective 1 and 2 relating
to Aim 1 of the study program (the epidemiological studies) were undertaken
initially. These studies relied on the analysis of the same dataset and so the
methods for data collection are applicable for both studies, with methods for
data analysis for both studies only described separately. Results for the
epidemiological studies are presented in Chapter 5.
The economic modeling studies, Objective 3 and 4, relating to Aim 2 were
subsequently undertaken. These studies required results obtained from the
epidemiological studies as parameters. The economic model for Objective 4
is closely related to the model used for Objective 3, describing the same
population and hence using many of the same input parameters. Results for
the economic modeling studies are presented in Chapter 6.
4.2 THE EPIDEMIOLOGICAL STUDIES (OBJECTIVES 1 AND 2 )
Objective 1 : To determine the prevalence of malnutrition in Qu eensland
public acute and residential aged care facilities, and identify variables
which may be associated with malnutrition in these populations .
Objective 2: To determine the effect of nutritional status on t he presence
and severity of pressure ulcers in individuals.
4.2.1 Overview
The assessment of nutritional status of subjects was undertaken as part of a
larger study investigating the prevalence of pressure ulcers. The larger study
consisted of cross sectional point prevalence audits of the presence of
pressure ulcers in a convenience sample of Queensland Health hospital
Economic analysis of Malnutrition and Pressure ulcers M Banks June 2008
119
patients and residents of aged care facilities. Data obtained from the audits
was then analysed to determine Objectives 1 and 2.
Sections 4.2.2 – 4.2.6, and 4.3.1 are applicable to both Objectives 1 and 2.
4.2.2 Audit methodology
The audits were conducted in 2002 (Audit 1) and repeated 12 months later in
2003 (Audit 2) after the implementation of pressure ulcer management
guidelines. The audits were conducted in a majority of Queensland Health
facilities, including 98 hospitals and 20 residential aged care facilities. In a
convenience sub sample of 20 hospitals and six residential aged care
facilities, nutritional status was also assessed for subjects in the pressure
ulcer audits. Facility involvement was determined by whether a facility
employed dietitians and whether the dietitians nominated to participate. Four
out of the 20 hospitals and four of the six residential aged care facilities
participated in both nutritional status audits with the other facilities being
involved in either Audit 1 or 2 only. A larger number of acute facilities were
able to participate in assessing nutritional status as part of the second audit.
4.2.3 Nutritional status sample
Audits were conducted on a single day for each facility involved, with all
available subjects on the day being potentially eligible for inclusion. Excluded
from the larger study were patients who were unavailable at the time of audit,
paediatric (<18 years of age) and mental health patients. Maternity and same
day patients were also excluded from the nutritional status audits. Maternity
patients were excluded as this group of patients is generally considered to be
well nourished and inappropriate to include in such an audit. Same day
patients were excluded as this group of patients would not receive specific
intervention for malnutrition in the acute setting. This means the sample was
limited to adult subject groups more likely to be at nutritional risk and available
for the provision of nutrition support if required.
Economic analysis of Malnutrition and Pressure ulcers M Banks June 2008
120
4.2.4 Approval for the study
The project was approved by Queensland Health as a quality improvement
project and as such, no formal ethics approval was required, although
subjects or their next of kin provided written informed consent to be included
in the audits. Participation in the study was dependent on whether dietitians
could undertake the audits, thus the sample for acute facilities was biased
toward larger facilities where patient acuity is higher and to residential aged
care facilities where dietitians were available, and hence where attention to
nutritional care may be greater.
4.2.5 Variables:
A dataset was extracted from the larger study database for the purposes of
this study and the variables available were limited to those collected, or able
to be determined from those collected, for the larger study. Data for maternity
and same day subjects was not extracted from the larger database as these
were excluded from the nutritional status audits.
Variables for each subject included:
• age
• age group
• gender
• facility
• facility type (acute or aged care residential)
• facility location (metropolitan, regional, rural/remote)
• medical specialty (acute only)
• audit year/number (2002/audit 1; 2003/audit 2)
• pressure ulcer - presence, stage and location
• highest stage of pressure ulcer
• number of pressure ulcers
• nutritional status
Age, gender, facility, audit number/year, medical specialty and location and
stage of pressure ulcers were collected by trained audit staff, usually nurses.
Economic analysis of Malnutrition and Pressure ulcers M Banks June 2008
121
Nutritional status was independently collected by dietitians and entered onto
the standardized data collection form before entry into the larger study
database.
Age was categorized to allow for comparisons to be made across the different
age groups of: 40 years or less (18-40), 41- 60 years, 61-80 years, and 81
years or older.
Facility type (acute or residential) was determined by the classification of the
facility by Queensland Health.
Facility location was based on the Rural, Remote and Metropolitan Areas
Classifications, 1991 Census edition (ABS, Canberra) as used by Queensland
Health. Seven categories were collapsed into three for the purposes of this
study: metropolitan, regional and rural/remote.
Medical specialties were categorized from classifications provided by facilities,
however these were not standardized classifications and some
miscategorization may have occurred. Fifteen categories were collapsed into
six for the purposes of this study: medical (general medical, respiratory,
gastrointestinal, renal, neurological, infectious diseases), surgical (general
surgical, orthopaedic, spinal injury), oncology (oncology/haematology,
palliative care), critical care (critical care, burns), rehabilitation and aged care.
Pressure ulcers were assessed using definitions followed by the Australian
Wound Management Association (Australian Wound Management
Association, 2001). Audit staff received standardized training in classifying
pressure ulcers by the Coordinator of the pressure ulcer audits. Presence
(present or not), highest stage and number of pressure ulcers were
determined from stage and location of pressure ulcer data for subjects. The
categories for highest stage of pressure ulcer were: none, stage 1, stage 2
and stage 3 and 4, the latter being categorized together due to small numbers
of both. Similarly the majority of subjects with pressure ulcers have only one
Economic analysis of Malnutrition and Pressure ulcers M Banks June 2008
122
or two, and so pressure ulcer number were categorized as none, one or two,
and three or more.
Nutritional status of subjects was assessed using the Subjective Global
Assessment (SGA) (Detsky et al., 1987b). The SGA is a widely used nutrition
assessment tool which determines nutritional status based upon a medical
assessment and physical examination. The SGA was chosen as it has a high
degree of inter-rater reliability (with assessor agreement of 80-90% and kappa
statistics of 0.75- 0.78) (Correia and Campos, 2003, Detsky et al., 1987b,
Lazarus and Hamlyn, 2005, Middleton et al., 2001, Waitzberg et al., 2001,
Wyszynski et al., 2003), and good predictive and convergent validity
correlating well with measures of morbidity, and traditional objective nutritional
parameters (Detsky et al., 1987a, Duerksen et al., 2000). The SGA has been
found to be a valid nutrition assessment tool in a variety of patient population
settings including: surgery (Detsky et al., 1987b), geriatric (Christensson et
al., 2002, Duerksen et al., 2000, Persson et al., 2002), including in the aged
care setting (Sacks et al., 2000), oncology (Ottery, 1996, Thoresen et al.,
2002), liver transplant (Stephenson et al., 2001), and renal (Cooper et al.,
2001), making it an ideal tool for use in this study, allowing for comparisons to
be made across different population settings. Many recent Australian and
international studies investigating the prevalence of malnutrition have used
the SGA (Beck et al., 2001c, Correia and Campos, 2003, Ferguson et al.,
1997, Kyle et al., 2002, Lazarus and Hamlyn, 2005, Middleton et al., 2001,
Olmos et al., 2005, Persson et al., 2002, Planas et al., 2004, Waitzberg et al.,
2001, Wyszynski et al., 2003, Barreto Penie, 2005). The SGA is also quickly
and easily performed at the bedside. The parameters of the SGA include:
weight change, dietary intake change, gastrointestinal symptoms, evidence of
loss of subcutaneous fat stores, muscle wasting, oedema and ascites. The
features are combined and patients are rated as being well nourished,
moderately malnourished, or severely malnourished. Combining the
proportions of moderately and severely malnourished provides a proportion of
the total malnourished.
Economic analysis of Malnutrition and Pressure ulcers M Banks June 2008
123
Standardized training in performing SGA was conducted for dietitians involved
in the nutritional status audits by the authors (MB, SA). Inter rater reliability
between a convenience sample of fifteen dietitians assessing nine patients
showed good agreement with use of the SGA (Kappa 0.9, p<0.001). Inter
rater reliability was unable to be completed with all dietitians undertaking the
nutritional assessments due to the number and distance between facilities
involved. Case studies completed during training however indicated good
agreement.
4.2.6 Determining if the sample was representativ e:
Demographic variables of the sample were compared to the relevant
Queensland Health population data where available, to determine if the
sample was representative. As population data for residential aged care was
not available, comparison of demographic variables was also made to the
larger pressure ulcer audit study population. Queensland public hospital
population data including the average daily occupied beds, average age and
gender were provided for 2002/2003 by the Client Services Unit, Health
Information Centre, Queensland Health. Data provided for acute facilities
excluded patients aged <18 years old (paediatric), same day, mental health
and maternity patients, as per the sample population.
Data was also obtained from this source for the average daily occupied beds
for individual facilities in Queensland Health (hospitals and residential aged
care), to enable the determination of the proportion of the sample in each
facility and for facility locations, but this data did not exclude bed days for
patients excluded from the study, except for beds from dedicated paediatric
and maternity hospitals.
Comparison of descriptive variables was made using one sample or
independent samples t-tests for continuous variables; and NPar or Pearsons
Chi square tests for categorical variables, depending on whether comparing to
the Queensland Health hospital population or the pressure ulcer audit study
population. The proportion of subjects and demographic data of those who
declined consent or were unavailable for the audit were not available.
Economic analysis of Malnutrition and Pressure ulcers M Banks June 2008
124
As two audits were conducted over two consecutive years, the number of
repeated cases between the two pressure ulcer audits was quantified to
determine the independence of Audit 1 and Audit 2 datasets. Only 0.03% of
acute subjects in the pressure ulcer sample were found to be in both audits.
However 28.2% of aged care residents were found to be in both audits, but
there were no significant differences between demographic variables in each
audit when the duplicate cases were removed. Hence comparison between
the complete datasets for Audit 1 and Audit 2 as independent datasets was
deemed reasonable.
4.2.7 OBJECTIVE 1 ANALYSIS
The percentages of well nourished, moderately, severely and total (sum of
moderately and severely) malnourished subjects were determined for each
facility. An average percentage across facilities was then determined, for
acute and residential aged care facilities for each audit. The average
percentage was weighted by the number of cases in each facility. Results are
reported as means with standard deviations and minimum-maximum values
where data were normally distributed and as medians with minimum and
maximum values where data were not normally distributed.
To determine the effects of available variables on nutritional status in acute
and residential aged care facilities, logistic regression was conducted at the
bivariate level to determine crude odds ratios, and then in a multivariable
model to ascertain their independent influences. The dependent variable was
categorized as binomial (well nourished or total malnourished) and entered
into a logistic regression model.
Results are presented as odds ratios (OR) representing an increase in odds
(OR >1.0) or decrease in odds (if OR <1.0) of being malnourished compared
to the referent category of an independent variable. The most frequent
category of a variable was chosen as the referent, for example, the age group
61-80 years had the most subjects in the sample population and so was
chosen as the referent category for age group. For each OR presented within
Economic analysis of Malnutrition and Pressure ulcers M Banks June 2008
125
an independent variable a significance value is given. A Wald statistic (chi
square) is also presented, which indicates the overall contribution of the
independent variable in the model.
The differences between proportions of nutritional status categories between
Audit 1 and Audit 2 were determined by logistic regression. For the
multivariable logistic regression model it was decided if no significant
difference was found in the proportions of nutritional status categories
between the Audit 1 and Audit 2, data from the two years would be pooled for
acute facilities. However, for residential aged care facilities Audit 1 and Audit 2
data would be compared for differences, but not be pooled even if no change
effect was seen, due to the high percentage of dependent cases between
Audit 1 and Audit 2.
4.3 OBJECTIVE 2 ANALYSIS
The effect of nutritional status on the presence of pressure ulcer was
determined by logistic regression at the bivariate level to determine crude
odds ratios, and then in a multivariable model with other independent,
potentially confounding variables. The independent variables included in the
model were those found at the bivariate level to have a statistically significant
effect on the presence of pressure ulcers, considered clinically significant or
potentially confounding to the model.
The effects of nutritional status on highest stage of pressure ulcer present and
the total number of pressure ulcers were also determined. Multinomial logical
regression was conducted at the multivariable level with the other
independent, potentially confounding variables as established above.
Multinomial logical regression was used as the dependent variables had
multiple categories.
Results are presented as odds ratios (OR) representing an increase in odds
(OR >1.0) or decrease in odds (if OR <1.0) of having a pressure ulcer (or
having a higher stage or greater number of pressure ulcer) compared to the
referent category of an independent variable. The most frequent category of a
Economic analysis of Malnutrition and Pressure ulcers M Banks June 2008
126
variable was chosen as the referent as previously. The effects of nutritional
status are presented for both three levels of nutritional status (well nourished,
moderately malnourished or severely malnourished) and two levels (well
nourished or total malnourished). This enables the determination of different
effects of different severities of nutritional status, but also provides an overall
effect of malnutrition.
The differences between the effects of nutritional status on pressure ulcer
prevalence between Audit 1 and Audit 2 were determined by logistic
regression. For the multivariable logistic and multinominal regression models
it was decided that data from Audit 1 and Audit 2 for acute facilities would be
pooled, if no significant differences were found between the audits in the
effects of nutritional status on pressure ulcer prevalence, but that for
residential aged care facilities Audit 1 and Audit 2 data would not be pooled.
Determining the prevalence of pressure ulcers in the audit population is not
part of the purpose of this study will be reported in detail elsewhere.
4.3.1 Data analyses methods
In all analyses acute care and residential aged care facilities were kept
separate as it was decided that these types of facilities were significantly
different from one another to require separate analysis and interpretation.
Descriptive analyses to test for normality and analyses to determine averages
and variance were carried out using SPSS for Windows (Version 12.0, 2003,
SPSS Inc, Chicago, IL, USA).
Logistic regression analyses were carried out using an analysis of correlated
data approach with SUDAAN statistical package (Version 7.5.2A, 1998,
Research Triangle Institute, Research Triangle Park, NC, USA) to account for
the potential clustering effect of ‘facility’ in the model.
Statistical significance was predetermined at the conventional p<0.05 level.
Economic analysis of Malnutrition and Pressure ulcers M Banks June 2008
127
A clinically significant difference between percentages determined to be
malnourished was predetermined at a >10% difference with >3% difference in
minimum and maximum 95% confidence intervals. This is based on literature
and experience of repeated malnutrition prevalence study results from the
same setting using the same methodology usually achieving results within
10%. A clinically significant difference between odds ratios of having a
pressure ulcer was predetermined at >0.3. This is based on an estimated
proportion of malnutrition being approximately 30%, and a difference of 10%
in the proportion of patients with pressure ulcer who are malnourished being
considered to be a significant difference. This equates to an odds ratio
difference of 0.3.
4.4 THE ECONOMIC MODELLING STUDIES (OBJECTIVES 3 AND 4)
Objective 3: To estimate the economic consequences of malnutrition,
by determining the excess length of hospital stay a nd cost arising from
pressure ulcers that are attributable to malnutriti on in the hospital
population.
4.4.1 Objective 3 - Overview
Data are available on the incidence of pressure ulcers in Queensland public
hospitals, on the extended length of stay arising from pressure ulcers, and the
associated economic cost of this extended length of stay (Graves et al.,
2005a, Graves et al., 2005b). These authors report the independent effect of
pressure ulcers on excess length of stay to be a median of 4.3 days (95% CI
1.85-6.78). In Objective 1 and 2 of this study, the prevalence of malnutrition
and independent effect of malnutrition on pressures have been determined for
Queensland public hospitals, and these data can be used to determine the
fraction of pressure ulcers attributable to malnutrition. In the current analysis,
the above sets of data are used in conjunction with data on the number of
relevant separations from Queensland public hospitals and the daily cost of a
hospital bed. An economic modeling framework was used to estimate the
number of cases of pressure ulcer, total bed days lost to pressure ulcer and
Economic analysis of Malnutrition and Pressure ulcers M Banks June 2008
128
economic cost of these lost bed days, which could be attributed to
malnutrition. Bed days were chosen to describe the economic costs due to
the current pressures on patient bed availability in many public metropolitan
and regional hospitals in Queensland, which is contributing to substantial
waiting lists for individuals requiring treatment (Cresswell, 2007). A reduction
in rates of pressure ulcer should increase hospital throughput and reduce
waiting lists as previously blocked beds would be made available. The value
to the public health system of increased throughput is considered to be
substantial and hence bed days were considered a valuable currency for this
research.
A probabilistic model was developed to predict the following outputs for
Queensland public hospitals in 2002/2003:
• The number of cases of pressure ulcer, and the number of cases of
pressure ulcer attributable to malnutrition
• The total bed days lost to pressure ulcers, and the bed days lost to
pressure ulcer attributable to malnutrition, and
• The dollar value ‘economic cost’ of these lost bed days from pressure
ulcers in total, and those attributable to pressure ulcer.
A probabilistic model assigns probabilistic distributions to the specified range
for input parameters. In probabilistic sensitivity analysis samples are drawn at
random from these distributions, to generate an empirical distribution of the
results. The advantage of this approach is that it can simultaneously deal with
a large number of variables and provides a degree of confidence that can be
attached to the results (Drummond et al, 2005, p 43; 302-304).
4.4.2 Data required for the model
The following input parameters were required for the model:
• The number of relevant separations from public hospitals in Queensland in
2002/2003;
• The incidence rate for pressure ulcers; and
Economic analysis of Malnutrition and Pressure ulcers M Banks June 2008
129
• The attributable fraction of malnutrition in the development of pressure
ulcers
• The independent effect of pressure ulcers on length of stay
• The cost of a bed day
4.4.3 The structure of the model
The model was determined for the Queensland public hospital population for
the 2002/2003 financial year.
Outputs related to pressure ulcers (total):
• The output ‘The number of cases of pressure ulcer in Queensland public
hospitals 2002/2003’ if a function of the multiplication of the following input
parameters:
o The number of relevant separations from public hospitals in
Queensland in 2002/2003;
o The incidence rate for pressure ulcers
• The output ‘The number of bed days lost to pressure ulcer in Queensland
public hospitals 2002/2003’ is a function of the multiplication of the number
of cases of pressure ulcer (as determined immediately above) by the input
parameter:
o The independent effect of pressure ulcers on length of stay
• The output ‘The economic cost of pressure ulcer in Queensland public
hospitals 2002/2003’ is a function of the multiplication of the number of bed
days lost to pressure ulcer (as determined immediately above) by input
parameter:
o The cost of a bed day.
Outputs related to pressure ulcers attributable to malnutrition
• The output ‘The number of cases of pressure ulcer attributable to
malnutrition in Queensland public hospitals 2002/2003’ is a function of the
sequential multiplication of the following input parameters:
Economic analysis of Malnutrition and Pressure ulcers M Banks June 2008
130
o The number of relevant separations from public hospitals in
Queensland in 2002/2003;
o The incidence rate for pressure ulcers; and
o The attributable fraction of malnutrition in the development of
pressure ulcers
• The output ‘The total beds days lost to pressure ulcers attributable to
malnutrition in Queensland public hospitals in 2002/2003’ is a function of
the multiplication of the number of cases of pressure ulcer attributable to
malnutrition (as determined above) by the input parameter:
o The independent effect of pressure ulcers on length of stay
• The output ‘The economic cost of bed days lost to pressure ulcer
attributable to malnutrition in Queensland public hospitals in 2002/2003’ is
a function of the multiplication of the total beds days lost (as determined
above) by the input parameter:
o The cost of a bed day
Figure 4.1 illustrates the model.
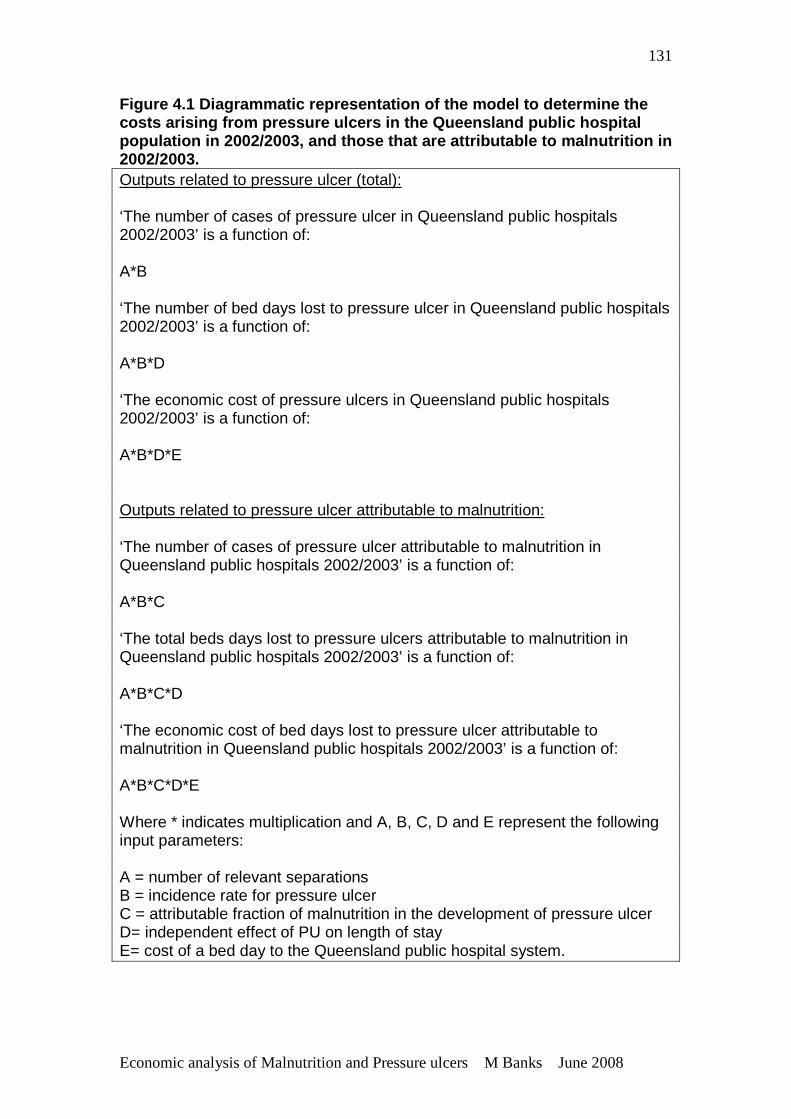
Economic analysis of Malnutrition and Pressure ulcers M Banks June 2008
131
Figure 4.1 Diagrammatic representation of the model to determine the costs arising from pressure ulcers in the Queenslan d public hospital population in 2002/2003, and those that are attribu table to malnutrition in 2002/2003. Outputs related to pressure ulcer (total): ‘The number of cases of pressure ulcer in Queensland public hospitals 2002/2003’ is a function of: A*B ‘The number of bed days lost to pressure ulcer in Queensland public hospitals 2002/2003’ is a function of: A*B*D ‘The economic cost of pressure ulcers in Queensland public hospitals 2002/2003’ is a function of: A*B*D*E Outputs related to pressure ulcer attributable to malnutrition: ‘The number of cases of pressure ulcer attributable to malnutrition in Queensland public hospitals 2002/2003’ is a function of: A*B*C ‘The total beds days lost to pressure ulcers attributable to malnutrition in Queensland public hospitals 2002/2003’ is a function of: A*B*C*D ‘The economic cost of bed days lost to pressure ulcer attributable to malnutrition in Queensland public hospitals 2002/2003’ is a function of: A*B*C*D*E Where * indicates multiplication and A, B, C, D and E represent the following input parameters: A = number of relevant separations B = incidence rate for pressure ulcer C = attributable fraction of malnutrition in the development of pressure ulcer D= independent effect of PU on length of stay E= cost of a bed day to the Queensland public hospital system.
Economic analysis of Malnutrition and Pressure ulcers M Banks June 2008
132
4.4.4 Sources of the input parameters A. Value for the number of relevant separations from Queensland public
hospitals 2002/2003
Separation or discharge data from hospitals provides data related to patient
admissions. The number of separations relevant to this study was determined
for patient groups in which data was available on the incidence of pressure
ulcer and the association between nutritional status and pressure ulcers, and
for which the occurrence of pressure ulcers might result in an increased length
of stay. All overnight separations were considered relevant except mental
health, maternity and paediatric (<18 years of age) patients as no data is
available on either the incidence of pressure ulcer or the association between
malnutrition and pressure ulcer in these groups. Same day separations were
not considered relevant, because if the occurrence of pressure ulcer resulted
in an increased length of stay then these patients would no longer be
classified as same day patients. The total separations for all Queensland
public hospitals for 2002-2003 excluding same day, mental health, maternity
and paediatric separations was obtained from the Queensland Hospital
Admitted Patient Data Collection, supplied by Health Information Services,
Queensland Health.
B. Value for incidence for pressure ulcer in Queensland public hospitals:
The incidence rate of developing pressure ulcers was determined from the
data collected by Graves et al, (2005) which compared the number of cases of
pressure ulcer with the total number of discharges that occurred in a three
month period from 13 October 2002 to January 16 2003 in a Queensland
tertiary public hospital.
C. Value for the attributable fraction of malnutrition in the development of
pressure ulcer
The relative risk or odds risk is a useful measure of the relative importance to
a disease of a risk factor, but it does not tell us the overall importance of that
risk factor. For example a risk factor may have a high relative or odds risk in
relation to a disease, but the prevalence of the risk factor may be low, in which
Economic analysis of Malnutrition and Pressure ulcers M Banks June 2008
133
case its attributable risk overall to the disease may be low. The attributable
fraction is a measure which combines risk and the prevalence of a risk factor,
and measures proportion of cases of disease that are attributable to the risk
factor (Woodward, 1999).
The terms attributable risk, attributable fraction and aetiological fraction were
noted to be used interchangeably in texts. Here, attributable risk refers to the
absolute incidence of disease attributable to the risk factor; and attributable
fraction refers to the proportion of the incidence of disease attributable to the
risk factor.
The fraction of pressure ulcer attributable to malnutrition was estimated using
the following input parameters, in standard epidemiological formulae:
a. the incidence rate of developing pressure ulcer
b. the prevalence of malnutrition in hospitalized patients
c. the odds ratio of developing a pressure ulcer if malnourished
a. The incidence rate of developing a pressure ulcer
This value was determined as previously described in B. above.
b. The prevalence of malnutrition in the population:
The prevalence of malnutrition in Queensland public hospitals as determined
in Objective 1 was used. See Table 4.1 The prevalence of malnutrition is:
a+b/ a+b+c+d.
c. The odds ratio of having a pressure ulcer when malnourished:
The odds ratio of having a pressure ulcer when malnourished in Queensland
public hospitals in 2002/2003, adjusted for potential confounders as
determined in Objective 2 was used.
These input parameters were used in the following formulae to determine
attributable risk (AR) and the attributable fraction (AF) (Schlesselman, 1982):
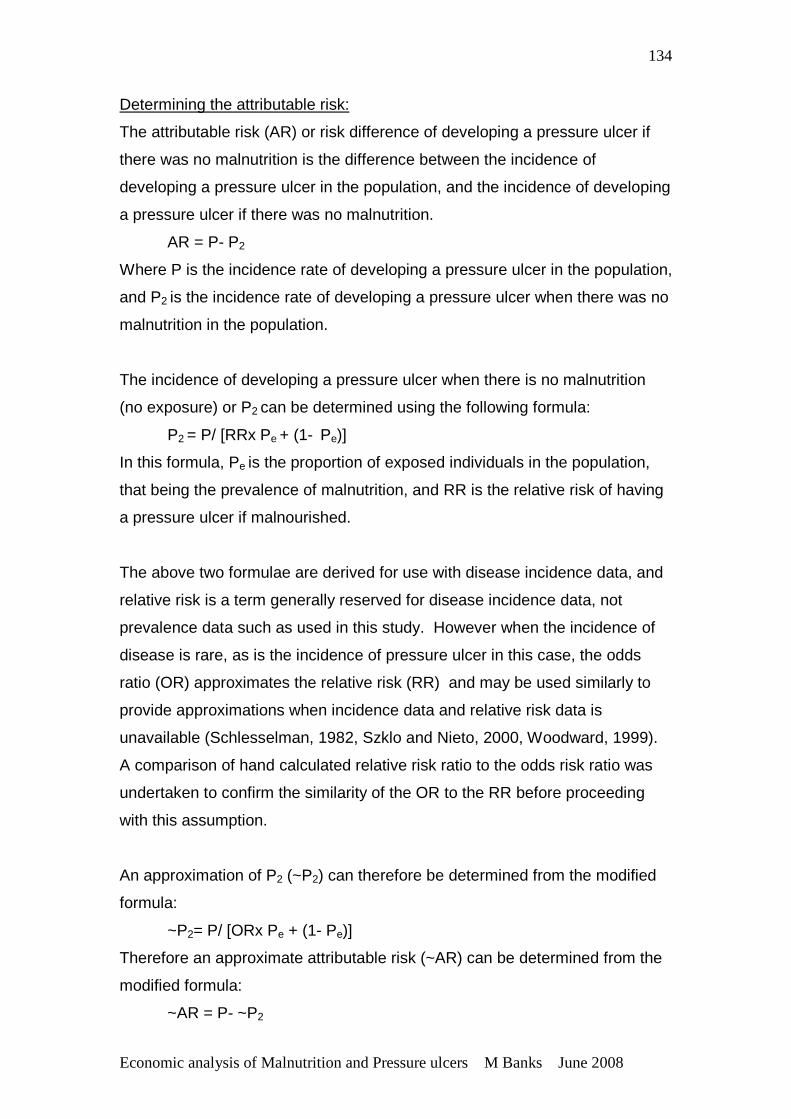
Economic analysis of Malnutrition and Pressure ulcers M Banks June 2008
134
Determining the attributable risk:
The attributable risk (AR) or risk difference of developing a pressure ulcer if
there was no malnutrition is the difference between the incidence of
developing a pressure ulcer in the population, and the incidence of developing
a pressure ulcer if there was no malnutrition.
AR = P- P2
Where P is the incidence rate of developing a pressure ulcer in the population,
and P2 is the incidence rate of developing a pressure ulcer when there was no
malnutrition in the population.
The incidence of developing a pressure ulcer when there is no malnutrition
(no exposure) or P2 can be determined using the following formula:
P2 = P/ [RRx Pe + (1- Pe)]
In this formula, Pe is the proportion of exposed individuals in the population,
that being the prevalence of malnutrition, and RR is the relative risk of having
a pressure ulcer if malnourished.
The above two formulae are derived for use with disease incidence data, and
relative risk is a term generally reserved for disease incidence data, not
prevalence data such as used in this study. However when the incidence of
disease is rare, as is the incidence of pressure ulcer in this case, the odds
ratio (OR) approximates the relative risk (RR) and may be used similarly to
provide approximations when incidence data and relative risk data is
unavailable (Schlesselman, 1982, Szklo and Nieto, 2000, Woodward, 1999).
A comparison of hand calculated relative risk ratio to the odds risk ratio was
undertaken to confirm the similarity of the OR to the RR before proceeding
with this assumption.
An approximation of P2 (~P2) can therefore be determined from the modified
formula:
~P2= P/ [ORx Pe + (1- Pe)]
Therefore an approximate attributable risk (~AR) can be determined from the
modified formula:
~AR = P- ~P2
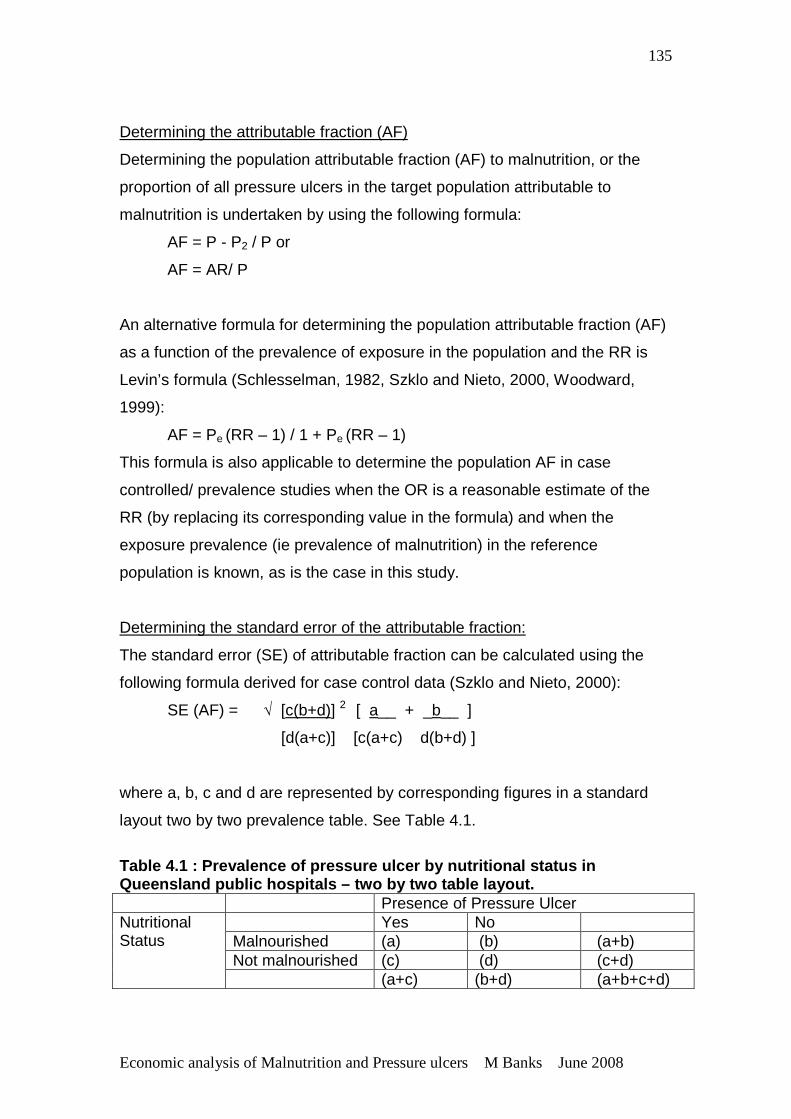
Economic analysis of Malnutrition and Pressure ulcers M Banks June 2008
135
Determining the attributable fraction (AF)
Determining the population attributable fraction (AF) to malnutrition, or the
proportion of all pressure ulcers in the target population attributable to
malnutrition is undertaken by using the following formula:
AF = P - P2 / P or
AF = AR/ P
An alternative formula for determining the population attributable fraction (AF)
as a function of the prevalence of exposure in the population and the RR is
Levin’s formula (Schlesselman, 1982, Szklo and Nieto, 2000, Woodward,
1999):
AF = Pe (RR – 1) / 1 + Pe (RR – 1)
This formula is also applicable to determine the population AF in case
controlled/ prevalence studies when the OR is a reasonable estimate of the
RR (by replacing its corresponding value in the formula) and when the
exposure prevalence (ie prevalence of malnutrition) in the reference
population is known, as is the case in this study.
Determining the standard error of the attributable fraction:
The standard error (SE) of attributable fraction can be calculated using the
following formula derived for case control data (Szklo and Nieto, 2000):
SE (AF) = √ [c(b+d)] 2 [ a__ + _b__ ]
[d(a+c)] [c(a+c) d(b+d) ]
where a, b, c and d are represented by corresponding figures in a standard
layout two by two prevalence table. See Table 4.1.
Table 4.1 : Prevalence of pressure ulcer by nutriti onal status in Queensland public hospitals – two by two table layo ut. Presence of Pressure Ulcer
Yes No Malnourished (a) (b) (a+b) Not malnourished (c) (d) (c+d)
Nutritional Status
(a+c) (b+d) (a+b+c+d)
Economic analysis of Malnutrition and Pressure ulcers M Banks June 2008
136
D. Value for the independent effect of pressure ulcer on length of stay
Estimates of the independent effect of pressure ulcer on length of stay were
reported by Graves et al. (2005a). Their study analyzed cross sectional data
for 1930 separate admissions, which represented 1747 individuals admitted to
an 800 bed tertiary referral hospital in Queensland in a 3 month period from
13 October 2002 to January 16 2003. They established an estimate of the
independent effect of pressure ulcers on length of stay by controlling for a
number of other observable factors that may additionally contribute to
variation in excess length of stay.
E. Values for the cost of a bed day to the Queensland public health system.
The determination of the opportunity cost of a patient bed day was undertaken
as it was decided that the availability of hospital beds for patients to be
admitted to is highly relevant currently to the Queensland public hospital
system, due to the presence of waiting lists for patients to be treated and the
availability of hospital beds if frequently the factor limiting access to treatment.
A low and high value for the cost per patient bed in Queensland public
hospitals 2002/2003 was obtained from Australian Hospital Statistics 2002-03
(AIHW, 2004).
4.4.5 Allowing for uncertainly in the estimates o f the input parameters
In this model, a probabilistic sensitivity analysis approach was undertaken to
allow for uncertainty in the estimates of the input parameters. This approach
consists of assigning probability distributions to the specified ranges for the
key input parameters and samples drawn at random from these distributions
to generate an empirical distribution of the outputs. Probability distributions
for specified input parameters were assigned according to standardized
methodology for statistical modeling (Hastings and Peacock, 1975). The
sampling technique involved random sets of inputs values drawn and the
model run for each set. This sampling technique is referred to as Monte Carlo
simulation. Probabilistic sensitivity analysis provides a statistically sound
method to assess the uncertainty in the model output and hence robustness
of the output, that arises from uncertainty in the inputs.
Economic analysis of Malnutrition and Pressure ulcers M Banks June 2008
137
4.4.6 Model Specification
Microsoft Excel (and Visual Basic programming language) was used to make
1000 Monte Carlo samples from input parameters. See Appendix 2 for Visual
Basic Programming language.
A. Number of relevant separations:
The values for the ‘number of separations’ were obtained from census data
and so are fixed in the model.
B. Incidence rate of pressure ulcer
A Beta distribution was chosen for the ‘incidence of pressure ulcer’ parameter
because this distribution is conjugate with the binomial and so used for
probability data being restricted to values between 0 and 1, and is continuous
(Hastings and Peacock, 1975). A Beta distribution in Excel was specified
using BETAINV (RAND) (α, β), with α representing the ‘number of events’ and
β the ‘number of nonevents’. The number of pressure ulcers reported by
Graves et al (2005a) was used to specify α and the total number of
discharges less the number of pressure ulcers reported was used to specify β.
C. Attributable fraction of malnutrition in the development of pressure ulcer
A Beta distribution was also chosen for the parameter ‘attributable fraction of
malnutrition’ because this distribution is a prior for probabilities, restricted to
values between 0 and 1 and is continuous (Hastings and Peacock, 1975). A
Beta distribution in Excel was specified as described above. The method of
moments for the Beta distribution was used to specify α and β, where
α = ū (ū (1- ū)/ s2 ) – 1 and β = (ū (1- ū )/ s2 – 1) – α (Hastings and Peacock,
1975). The attributable fraction of malnutrition in the development of pressure
ulcers and standard error were used to specify the mean (ū) and variance (s)
respectively.
The method of moments estimates population parameters such as mean,
variance and median by equating sample moments with unobservable
population moments and then solving those equations for the quantities to be
Economic analysis of Malnutrition and Pressure ulcers M Banks June 2008
138
estimated (en.wikipedia.org). In this case, the method of moments was used
with population mean and standard deviation to determine the α and β.
D. Independent effect of pressure ulcer on length of stay
A Gamma distribution was fitted to the parameter that described ‘increase in
length of stay due to pressure ulcers’ because it is constrained on the interval
0 to positive infinity and is appropriate for the skew found in resource use
data, such as length of stay (Hastings and Peacock, 1975). The Gamma
distribution in Excel was specified using GAMMAINV (RAND) (α, β). The
method of moments for the Gamma distribution was used to specify α and β,
where α = ū 2 / s2 and β = s2 / ū (Hastings and Peacock, 1975). The observed
sample statistics reported by Graves et al. (2005a) were used to specify the
mean (ū) and variance (s), respectively for the Gamma distribution.
E. Cost of a bed day to Queensland public hospital system
A uniform distribution was chosen for the parameter ‘cost of a bed day’
because of the equal likelihood of a cost value between the low and high
value. The uniform distribution in Excel was specified using RAND (low value-
high value) + high value.
4.4.7 Presentation of results
The model predicts the total number of cases of pressure ulcer and those
attributable to malnutrition, the bed days lost to pressure ulcers and those
attributable to malnutrition and the monetary value of the bed days lost. The
results represent all separations from Queensland public hospitals (excluding
same day, mental health, maternity and paediatric patients) for the financial
year 2002/2003. The output results are summarized as means, variance and
ranges, and presented graphically as histograms. Comparisons are made to
the total number of patient bed days in Queensland public hospitals in
2002/2003 as provided from Australian Hospital Statistics 2002/2003 (AIHW,
2004).
Economic analysis of Malnutrition and Pressure ulcers M Banks June 2008
139
4.5 OBJECTIVE 4 To estimate the economic outc omes of an
intervention that provides intensive nutrition supp ort to nutritionally at
risk patients in hospital, where ‘cases of pressure ulcer avoided’, ‘
number of bed days not lost to pressure ulcer’ and ‘economic costs’ are
the relevant outcomes.
4.5.1 Objective 4 - Overview
This model was based on the same population as that used for Objective 3,
but this time explored the outcomes if a nutrition support intervention was
provided to patients at risk of developing a pressure ulcer. Stratton et al
(2005) undertook meta-analysis of intensive nutrition support in the prevention
and treatment of pressure ulcers. These authors found that intensive
nutritional support (that being oral nutrition supplements or enteral tube
feeding providing an extra 1000-2000 Kj and associated nutrients per day)
was significantly associated with lower incidence of pressure ulcer
development in at risk patients compared with standard care (OR 0.75, 95%
CI 0.62-0.88, 5 RCTs, n=1325). This study was reviewed in detail in Section
2.12.1. Despite a number of limitations, this study was considered sufficiently
robust to apply these estimates to the current study, given that confidence in
the results of the meta-analysis is supported by the results of the individual
studies, all of which reported a decreased incidence of pressure ulcers with
nutritional support, likely to be indicating the prevention and/or treatment of
malnutrition. The lack of significance of the individual studies is most likely to
be due to small sample sizes, with the increased power of the meta-analysis
arising mostly from pooling of the data. In addition the heterogeneity of
subjects and settings included in the studies included in the meta-analysis is
applicable to a large proportion of patients considered to be at risk for
pressure ulcer development, both in the hospital and community care settings.
Whilst the nutritional status of all subjects in the studies included in the meta-
analysis were not specifically assessed or done in a standardized way, the
authors state that data available for subjects indicated a majority would have
been at risk of being, or malnourished. In the current analysis, the data from
this meta-analysis is applied to the Queensland public hospital population in
2002/2003, for which data are available on the incidence of pressure ulcer,
Economic analysis of Malnutrition and Pressure ulcers M Banks June 2008
140
effect of length of stay and associated costs, and prevalence of malnutrition,
to determine if intensive nutrition support intervention would be a cost
effective approach to reduce the incidence of pressure ulcer compared to
standard clinical (nutrition) care. A rigorous cost-effectiveness analysis was
not able to be undertaken, rather a cost-effectiveness analysis is undertaken
in which a nutritional intervention is evaluated in terms of cost per case of
pressure ulcer avoided. An economic modeling framework was used to
predict potential changes to the incidence of pressure ulcers, bed days related
to pressure ulcer and subsequent related economic (opportunity) costs. The
‘outcome’ in terms of reduced hospital bed days is a resource implication of
the intervention and ultimately contributes to the cost offset.
The existing probabilistic model was extended to predict the following outputs
if an intensive nutrition support intervention was provided to all nutritionally at
risk patients in Queensland public hospitals in 2002/2003, compared to
standard care provided in Queensland public hospitals in 2002/2003. The
outputs are:
• number of cases of pressure ulcer avoided
• number of bed days not lost to pressure ulcer
• change to economic costs
The outputs related to standard care have already been determined in
Objective 3, that being the outputs for pressure ulcer (total).
4.5.2 Data required for model
The following input parameters were required for the model:
• The number of relevant separations from public hospitals in Queensland in
2002/2003;
• The incidence rate for pressure ulcers; and
• The independent effect of pressure ulcers on length of stay
• The cost of a bed day
• The change in risk in developing a pressure ulcer associated with intensive
nutrition support compared to standard care
Economic analysis of Malnutrition and Pressure ulcers M Banks June 2008
141
• The annual cost of the provision of an intensive nutrition support
intervention for at risk patients.
4.5.3 The structure of the model
The model was determined for the Queensland public hospital population for
the 2002/2003 financial year.
Outputs related to intervention of intensive nutrition support:
• The output ‘The number of cases of pressure ulcers avoided in
Queensland public hospitals 2002/2003 if an intervention of intensive
nutrition support was provided to all nutritionally at risk patients’ is a
product of the number of cases of pressure ulcer as determined for
standard care, by the input parameter:
o The change in risk in developing a pressure ulcer associated with
intensive nutrition support
A positive value indicates cases of pressure ulcer avoided.
• The output ‘The number of bed days not lost to pressure ulcer in
Queensland public hospitals 2002/2003 if an intervention of intensive
nutrition support was provided to all nutritionally at risk patients’ is a
function of the multiplication of the number of bed days lost to pressure
ulcer as determined for standard care, by the input parameter:
o The change in risk in developing a pressure ulcer associated with
intensive nutrition support
A positive value indicates bed days not lost or saved.
• The output ‘The economic cost of pressure ulcer in Queensland public
hospitals 2002/2003 if an intervention of intensive nutrition support was
provided to all nutritionally at risk patients’ is a function of the addition of
the following input parameters:
o The annual cost of the provision of an intensive nutrition support
intervention to nutritionally at risk patients.
Economic analysis of Malnutrition and Pressure ulcers M Banks June 2008
142
o The economic cost savings of bed days not lost to pressure ulcer.
This was determined by the multiplication of the economic cost of
pressure ulcer as determined for standard care, by the change in
pressure ulcer incidence rate associated with intensive nutrition
support. As this value was a cost saving, it was considered a
negative value.
A positive value indicates net additional costs and a negative
value net cost savings.
Figure 4.2 illustrates the model.
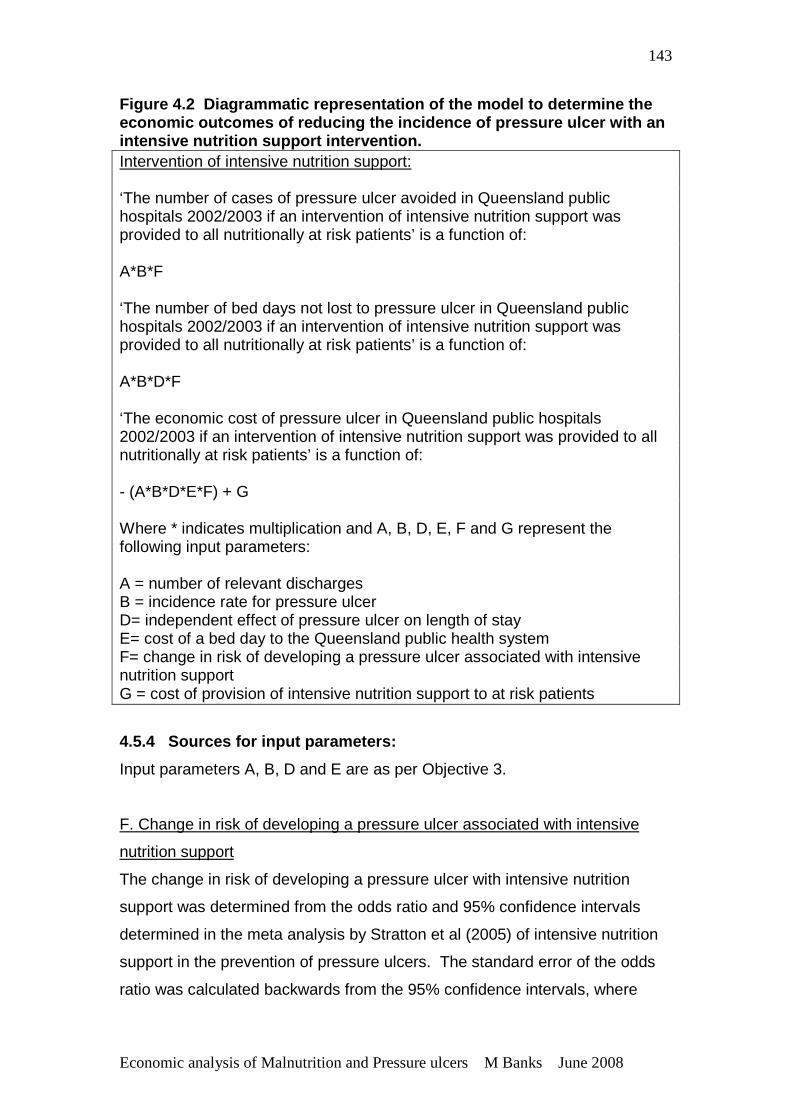
Economic analysis of Malnutrition and Pressure ulcers M Banks June 2008
143
Figure 4.2 Diagrammatic representation of the mode l to determine the economic outcomes of reducing the incidence of pres sure ulcer with an intensive nutrition support intervention. Intervention of intensive nutrition support: ‘The number of cases of pressure ulcer avoided in Queensland public hospitals 2002/2003 if an intervention of intensive nutrition support was provided to all nutritionally at risk patients’ is a function of: A*B*F ‘The number of bed days not lost to pressure ulcer in Queensland public hospitals 2002/2003 if an intervention of intensive nutrition support was provided to all nutritionally at risk patients’ is a function of: A*B*D*F ‘The economic cost of pressure ulcer in Queensland public hospitals 2002/2003 if an intervention of intensive nutrition support was provided to all nutritionally at risk patients’ is a function of: - (A*B*D*E*F) + G Where * indicates multiplication and A, B, D, E, F and G represent the following input parameters: A = number of relevant discharges B = incidence rate for pressure ulcer D= independent effect of pressure ulcer on length of stay E= cost of a bed day to the Queensland public health system F= change in risk of developing a pressure ulcer associated with intensive nutrition support G = cost of provision of intensive nutrition support to at risk patients
4.5.4 Sources for input parameters:
Input parameters A, B, D and E are as per Objective 3.
F. Change in risk of developing a pressure ulcer associated with intensive
nutrition support
The change in risk of developing a pressure ulcer with intensive nutrition
support was determined from the odds ratio and 95% confidence intervals
determined in the meta analysis by Stratton et al (2005) of intensive nutrition
support in the prevention of pressure ulcers. The standard error of the odds
ratio was calculated backwards from the 95% confidence intervals, where
Economic analysis of Malnutrition and Pressure ulcers M Banks June 2008
144
95% confidence intervals = OR + 1.96 x standard error. Rearranged, the
standard error = 95% confidence interval – OR/ 1.96.
G. Cost of provision of intensive nutrition support to at risk patients
Annual costs were estimated given the following assumptions:
• Patients ‘at risk’ of developing pressure ulcers are considered to also be at
risk of, or malnourished. Stratton et al (2005) determined that whilst the
nutritional status of all subjects at risk of pressure ulcer in the studies
included in the meta analysis were not specifically assessed or done in a
standardized way, that data available for subjects indicated a majority
would have been at risk of being, or malnourished.
• The prevalence of malnutrition as determined in Objective 1 is considered
to be equivalent to the prevalence of nutritional risk. Whilst it was
determined that the results from Objective 1 may have overestimated the
true statewide prevalence of malnutrition, due to a bias of tertiary facilities,
this figure does not include patients who may be considered adequately
nourished at a particular point in time, but at risk of malnutrition in the near
future. Hence the assumption that malnutrition indicated nutritional risk
may underestimate the number of patients who may benefit from
nutritional support in the prevention of pressure ulcers, and so the
application of the prevalence of malnutrition at a statewide level is
reasonable.
• All malnourished patients need to receive intensive nutrition support in the
form of additional food or commercial supplements; and assistance and
monitoring of intake. There would however already be a certain proportion
of malnourished patients receiving nutrition support in the form of
additional food or commercial supplements and so only the proportion of
patients not identified as malnourished would require these additionally.
However studies show that assistance and monitoring of intake of patients
is generally very limited, and so it is assumed that all malnourished
patients require assistance and monitoring.
• Additional nutrition support is considered to be additional food or
commercial nutritional products provided over and above standard hospital
Economic analysis of Malnutrition and Pressure ulcers M Banks June 2008
145
food. In the meta-analysis by Stratton (2005) intensive nutrition support
provided an extra 1000-2000 Kilojoules per day. Where patients may
require supplementary or total enteral nutrition support this would replace
food costs and so does not need to be considered, as the daily cost of
standard enteral nutrition formula are similar to food.
• All malnourished patients require, in addition to extra food items or
supplements, encouragement, assistance and monitoring to ensure the
receipt and consumption of the required nutrition support. Whilst this task
may be done to some extent by existing staff, it is not routinely done and is
a current identified gap in the provision of nutrition support to patients.
This assumption was made on the basis of a study that found an increase
in intake (to >75% of requirements) in 62% of patients randomized to
receive intensive nutritional intervention, compared to 36% of patients
receiving standard nutritional care. Nutrition intervention was provided by
a specialized nutrition team consisting of a dietitian and specially trained
nurse, who attended patients and staff for motivation, detailed a nutritional
care plan, assured delivery of prescribed food and gave advice on enteral
and parenteral nutrition (Joansen et al., 2004).
• Additional registered nursing staff time which might be required if more
patients are required to have enteral tube feeding or other higher nursing
care activities is not costed directly in the model as it was decided that the
other additional nutrition/ nursing support time in the model would provide
support for registered nurses freeing up their time for such higher clinical
care duties.
• Systems need to be implemented to ensure at risk patients are being
identified and appropriate nutrition support provided. This would require
the implementation of nutrition screening and support systems and access
to a minimum level of staff qualified in nutrition and dietetics. The
implementation of these systems and minimum staffing infrastructure
whilst essential is not costed directly into this model as this is considered
current minimum practice that should already be in place and not
specifically related to the current intervention. However, the cost of
Economic analysis of Malnutrition and Pressure ulcers M Banks June 2008
146
additional staff qualified in nutrition and dietetics to meet a benchmarked
standards was determined separately and shown in Appendix 4.
• Benefits of the provision of an intensive nutrition support intervention to at
nutritionally at risk patients to reduce the incidence of pressure ulcers
would most likely have other significant patient outcome and cost benefits
not being considered here.
The cost of provision of intensive nutrition support to at risk patients was
determined to include the following input parameters:
a. Cost of extra staffing resources to ensure at risk patients receive and
consume the required nutrition (100% of at risk patients)
b. Cost of additional food and/or commercial nutritional supplements, for
malnourished patients that were not already receiving nutrition support
(50% of at risk patients).
a. Cost of extra staffing resources to ensure at risk patients receive and
consume the required nutrition.
To encourage, assist and monitor receipt and consumption of nutrition support
it is estimated that 4 hours per day of nutrition/nursing support staff time is
required per day for every 10 -12 nutritionally at risk/ malnourished patients
and these hours would need to be provided seven days per week. At an
estimated prevalence of 30% malnutrition/ nutrition risk this equates to
approximately 4 hours per ward. Over seven days per week this equates to
approximately 0.7 full time equivalents (FTE) of staff time based on a 38 hour
week. This additional staffing would provide about 20-25 minutes per day per
patient, but assumes differing levels of assistance and encouragement are
required for different patients, so that some patients would receive more time
as required and others less if not required.
The estimated number of malnourished patients per day across Queensland
public hospitals was determined by multiplying the prevalence of malnutrition
by the daily average number of relevant occupied acute public hospital beds.
The prevalence of malnutrition used was from the pooling of Audit 1 and Audit
2 data, as in Objective 3. The daily average number of relevant occupied
Economic analysis of Malnutrition and Pressure ulcers M Banks June 2008
147
acute public hospital beds for 2002/2003 was obtained from Client Services
Unit, Health Information Services, Queensland Health. This data excluded
patients aged <18 years of age, same day, mental health and maternity
patients and so is considered a relevant population to which this model can be
applied.
The number of nutrition/nursing support staff required to be employed for this
role was determined by dividing the average number of malnourished patients
per day by 10 and 12, and then further dividing the subsequent figures by 0.7
(FTE). The classification of these staff for salary purposes was determined as
being equivalent to the roles of Operational Officer level 3 staff. The annual
salary rates for these staff were determined using the wages rates from 1
June 2002 from the Queensland Public Health Sector Certified Agreement
(No. 5) 2002. Thirty percent on costs were added to the annual salary rates to
cover shift work and leave entitlements as is common practice when
calculating total wage costs for staff that work weekend shifts.
b. Cost of additional food and/or commercial nutritional supplements for
malnourished patients currently not receiving nutrition support.
A study by Middleton et al found that approximately 50% of malnourished
patients are not identified as such and not receiving intensive nutrition
support. The number of patients not receiving nutrition support was therefore
estimated at 50% of the number of malnourished patients per day across
Queensland public hospitals as determined above. In the meta-analysis by
Stratton (2005) intensive nutrition support was characterized by the
consumption of an additional 1000-2000 Kilojoules of energy per day. The
provision of an additional 1000-2000 Kilojoules per day to a patient equates to
approximately 2-3 food based nutritious snacks or commercial nutritional
supplements per day. The average cost of such food based or standard
commercial nutritional supplements is approximately $1 each or an extra $2-
$3 per day in 2007. It might be expected that a small number of patients
might be identified as requiring other forms of nutritional support such as
enteral tube feeding due to an inability to manage adequate oral intake.
Enteral tube feeding which totally replaces food and supplement equates to
Economic analysis of Malnutrition and Pressure ulcers M Banks June 2008
148
approximately the same cost. Supplemental tube feeding in additional to food
may cost up to an extra $5 per day.
A high and low value for each of these input parameters was determined to
provide an overall high and low value for the annual cost of providing an
intensive nutrition support intervention.
4.5.5 Allowing for uncertainty in the estimates o f the input parameters
A probabilistic sensitivity analysis approach was taken, similarly as in
Objective 3 to allow for uncertainty in the estimates of the input parameters.
4.5.6 Model Specification
One thousand 1000 Monte Carlo samples were made from input parameters
following similar methodology to that used in Objective 3.
The values and distributions for the parameters:
A. number of separations
B. incidence of pressure ulcer
D. increase length of stay due to pressure ulcer, and
E. cost of a bed day,
were used as described in Objective 3.
F. Change in risk of developing a pressure ulcer associated with intensive
nutrition support
A lognormal distribution of the odds ratio was chosen for this input parameter
as the distribution of the odds ratio is best approximated by a normal
distribution if a log transformation is applied (Woodward, 1999). The standard
error (SE) of the odds ratio was determined from the provided 95% confidence
intervals by dividing the difference between the two confidence intervals by
1.96. The log of the odds ratio was determined (specified as LN in Excel)
and then a normal distribution specified using NORMINV (RAND) (LN, SE).
Each resample was then transformed back by taking the exponent (specified
by EXP ‘resample’) to provide a value of ‘risk’ of developing a pressure ulcer
associated with intensive nutrition support. The change in risk or ‘risk
Economic analysis of Malnutrition and Pressure ulcers M Banks June 2008
149
reduction’ of developing a pressure ulcer associated with intensive nutrition
support was then specified by subtracting the value of the risk from 1.0 (1.0 -
‘risk’ = risk reduction).
G. Cost of provision of intensive nutrition support to at risk patients
A uniform distribution was chosen for this parameter because of the equal
likelihood of a cost value between the low and high value. The uniform
distribution in Excel was specified using RAND (low value-high value) + high
value.
4.5.7 Presentation of Results
The model predicts the number of cases of pressure ulcer avoided, the bed
days not lost to cases of pressure ulcer and the economic monetary value
associated with the provision of an intensive nutrition support intervention
compared to standard care. The results represent all discharges from
Queensland public hospitals, excluding same day, mental health, maternity
and paediatric (<18 years of age) patients, for the financial year 2002/2003.
Results are summarized as means, variance and ranges. Comparisons are
made to the total number of patient bed days in Queensland public hospitals
in 2002/2003 as provided from Australian Hospital Statistics 2002/2003
(AIHW, 2004). Results for cases of pressure ulcer avoided versus cost, and
bed days not lost to pressure ulcer versus cost are both presented graphically
as scatter plots representing cost effectiveness planes, where the x axis
represents cases of pressure ulcer avoided or days not lost to pressure ulcer,
and the y axis economic cost.
Economic analysis of Malnutrition and Pressure ulcers M Banks June 2008
150
CHAPTER 5 RESULTS – THE EPIDEMIOLOGICAL STUDIES (OBJECTIVE 1 AND 2) OVERVIEW This chapter presents the results of the epidemiological studies, Objective 3
and 4. As the same dataset was used for both studies results regarding data
collection and the study population are applicable to both studies. Results for
the different data analyses are then described separately.
5.1 STUDY POPULATION There were 774 and 1434 acute patients, from eight and 16 hospitals; and
381 and 458 residents, from five residential aged care facilities in Audit 1
(2002) and Audit 2 (2003) respectively.
5.1.1 Representativeness of study population
Table 5.1 details the number of facilities and subjects in the nutritional status
audits, and the proportional representation of subjects from: the pressure
ulcer audit sample; the average daily occupied beds in the facilities involved in
the nutritional status audits; and the total average daily occupied public beds
in Queensland. The nutritional status sample was found to represent: 20.5%
and 38.3.3% of the acute pressure ulcer audit sample, and 27.3% and 37.1%
of the residential pressure ulcer audit sample, for Audits 1 and 2 respectively.
There were 41.8% and 44.0% of all acute and 70.1% and 88.4% of all
residential average daily occupied beds in facilities involved in the nutritional
status audits, for Audits 1 and 2 respectively; and 12.1% and 22.4% of all
acute and 25.2% and 30.3% of all residential average daily occupied public
residential beds in Queensland, in Audit 1 and 2 respectively. These average
daily occupied beds did not exclude bed days used for patients excluded from
the study and so these percentages are an underestimation.
When beds used for same day, paediatric, maternity and mental health
patients were excluded (this could only be done from the total Queensland
Health public acute beds, not at the facility level) there was an average of
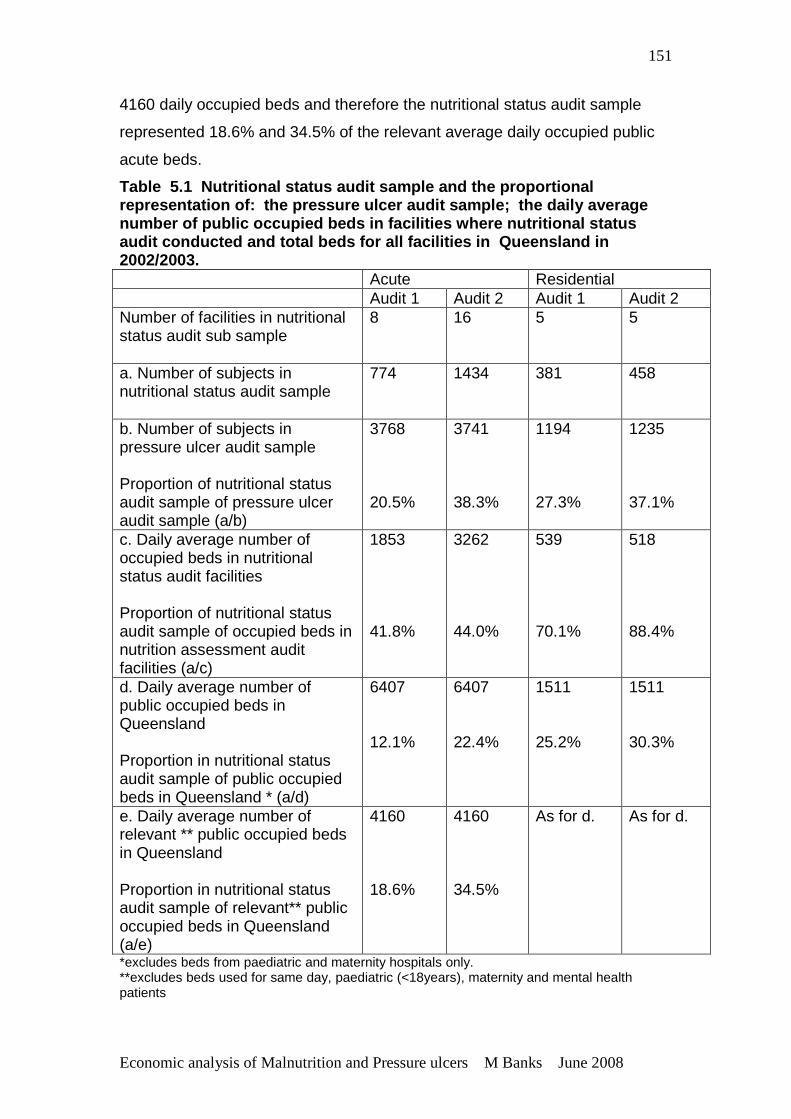
Economic analysis of Malnutrition and Pressure ulcers M Banks June 2008
151
4160 daily occupied beds and therefore the nutritional status audit sample
represented 18.6% and 34.5% of the relevant average daily occupied public
acute beds.
Table 5.1 Nutritional status audit sample and the proportional representation of: the pressure ulcer audit sample ; the daily average number of public occupied beds in facilities where nutritional status audit conducted and total beds for all facilities i n Queensland in 2002/2003. Acute Residential Audit 1 Audit 2 Audit 1 Audit 2 Number of facilities in nutritional status audit sub sample
8 16 5 5
a. Number of subjects in nutritional status audit sample
774 1434 381 458
b. Number of subjects in pressure ulcer audit sample
Proportion of nutritional status audit sample of pressure ulcer audit sample (a/b)
3768 20.5%
3741 38.3%
1194 27.3%
1235 37.1%
c. Daily average number of occupied beds in nutritional status audit facilities
Proportion of nutritional status audit sample of occupied beds in nutrition assessment audit facilities (a/c)
1853 41.8%
3262 44.0%
539 70.1%
518 88.4%
d. Daily average number of public occupied beds in Queensland
Proportion in nutritional status audit sample of public occupied beds in Queensland * (a/d)
6407 12.1%
6407 22.4%
1511 25.2%
1511 30.3%
e. Daily average number of relevant ** public occupied beds in Queensland Proportion in nutritional status audit sample of relevant** public occupied beds in Queensland (a/e)
4160 18.6%
4160 34.5%
As for d. As for d.
*excludes beds from paediatric and maternity hospitals only. **excludes beds used for same day, paediatric (<18years), maternity and mental health patients
Economic analysis of Malnutrition and Pressure ulcers M Banks June 2008
152
Tables 5.2 and 5.3 provide demographic data and comparison to the
Queensland Health population and pressure ulcer audit sample for acute and
residential aged care facilities respectively. Whilst there were no gender
differences, the average age of the nutritional status audit sample was
significantly older than the equivalent Queensland Health acute population by
approximately eight years (66.5+17.8 years compared to 58.0+20.2 years,
p<0.01 for Audit 1; 65.0+18.8 years compared to 58.0+20.1 years, p<0.01).
There were also significantly less acute subjects represented from regional
and rural and remote areas than metropolitan areas as expected (p<0.01 for
both audits). A statistically significant difference was found between the
proportions of medical specialties of the nutritional status audit sample and
pressure ulcer audit sample, although this isn’t clinically significant for either
Audit. Overall the nutritional status audit sample was not found to be
representative of the Queensland Health population and so results obtained
from this sample will not be able to be applied generally across this
population.
For residential aged care subjects, there was significant over representation
from metropolitan areas, as expected, with very poor representation from
regional areas and reasonable representation from rural and remote areas.
The residential aged care sample was otherwise found to be similar to the
pressure ulcer audit sample, which represented over 80% of the Queensland
public residential aged care population. Overall, taking into the account the
differences in facility location representation, this sample was considered to
be representative of the Queensland Health residential aged care population.
Unlike the acute population, where higher acuity would be expected in
metropolitan locations compared to rural/remote locations, it would be
expected that there should be little difference in residential aged care
populations between metropolitan, regional and rural/remote areas.
Whilst investigation of the prevalence of pressure ulcer per se is not the
purpose of this thesis, it is worthy noting in Tables 5.2 and 5.3 a reduction in
the prevalence in pressure ulcers between Audit 1 and Audit 2 for both acute
Economic analysis of Malnutrition and Pressure ulcers M Banks June 2008
153
facilities (from approximately 28% down to 20%) and residential aged care
facilities (from approximately 33% down to 18%).
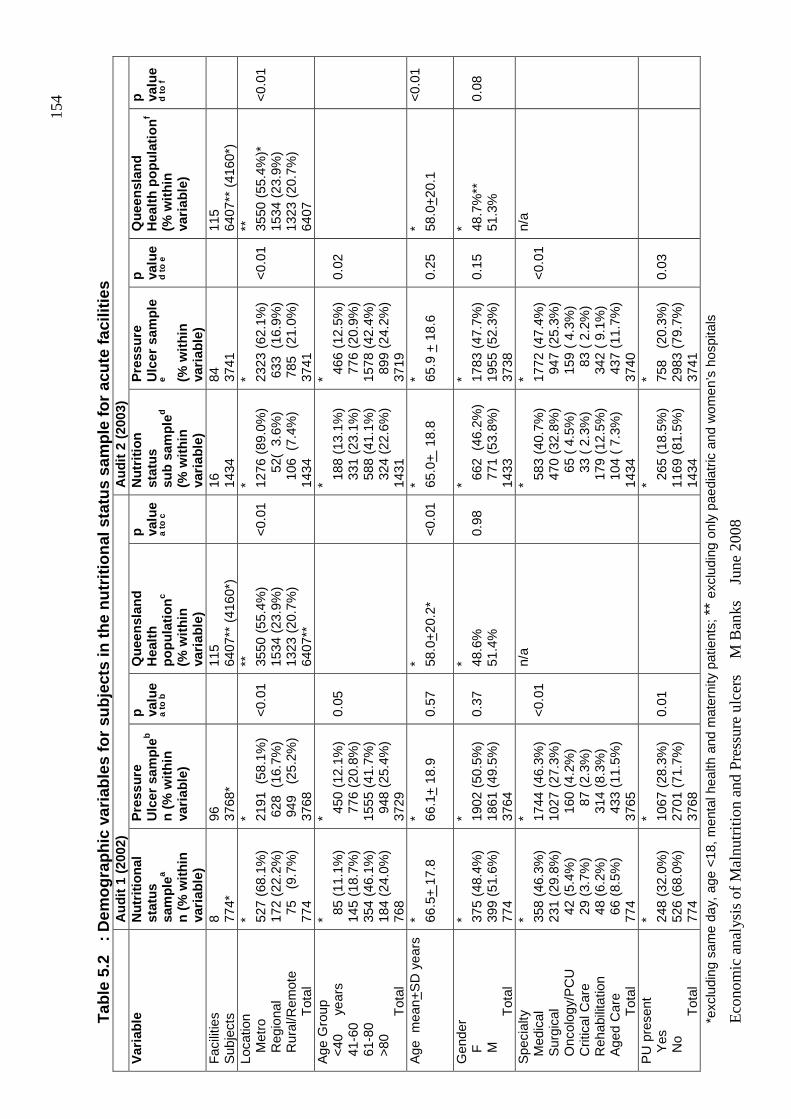
Eco
nom
ic a
naly
sis
of M
aln
utrit
ion
and
Pre
ssur
e ul
cers
M
Ban
ks
Jun
e 2
008
154
Tab
le 5
.2
: Dem
ogra
phic
var
iabl
es fo
r su
bjec
ts in
the
nutr
ition
al s
tatu
s sa
mpl
e fo
r ac
ute
faci
litie
s
A
udit
1 (2
002)
A
udit
2 (2
003)
V
aria
ble
Nut
ritio
nal
stat
us
sam
ple
a
n (%
with
in
varia
ble)
Pre
ssur
e U
lcer
sam
ple
b
n (%
with
in
varia
ble)
p valu
e a
to b
Que
ensl
and
Hea
lth
popu
latio
nc
(% w
ithin
va
riabl
e)
p valu
e
a to
c
Nut
ritio
n st
atus
su
b sa
mpl
ed
(% w
ithin
va
riabl
e)
Pre
ssur
e U
lcer
sam
ple
e (% w
ithin
va
riabl
e)
p valu
e
d to
e
Que
ensl
and
Hea
lth p
opul
atio
nf
(% w
ithin
va
riabl
e)
p valu
e d
to f
Fac
ilitie
s
Sub
ject
s 8
77
4*
96
3768
*
115
6407
** (
4160
*)
16
14
34
84
3741
115
6407
** (
4160
*)
Loca
tion
Met
ro
R
egio
nal
R
ural
/Rem
ote
T
otal
* 527
(68.
1%)
172
(22.
2%)
75
(9.
7%)
774
* 2191
(58
.1%
) 6
28 (
16.7
%)
949
(2
5.2%
) 37
68
<0.
01
**
3550
(55
.4%
) 15
34 (
23.9
%)
1323
(20
.7%
) 64
07**
<0.
01
* 1276
(89
.0%
)
52(
3.6
%)
106
(7.
4%)
1434
* 2323
(62
.1%
) 6
33 (
16.9
%)
785
(21
.0%
) 37
41
<0.
01
**
3550
(55
.4%
)*
1534
(23
.9%
) 13
23 (
20.7
%)
6407
<0.
01
Age
Gro
up
<40
y
ears
4
1-60
6
1-80
>
80
Tot
al
* 85
(11.
1%)
145
(18.
7%)
354
(46.
1%)
184
(24.
0%)
768
* 450
(12
.1%
) 7
76 (
20.8
%)
1555
(41
.7%
) 9
48 (
25.4
%)
3729
0.05
* 188
(13
.1%
) 3
31 (
23.1
%)
588
(41
.1%
) 3
24 (
22.6
%)
1431
* 466
(12
.5%
) 7
76 (
20.9
%)
1578
(42
.4%
) 8
99 (
24.2
%)
3719
0.02
Age
mea
n+S
D y
ears
*
66
.5+
17.
8 * 66
.1+
18.
9 0.
57
* 58.0
+20
.2*
<0.
01
* 65.0
+ 1
8.8
* 65.9
+ 1
8.6
0.25
* 58
.0+
20.1
<
0.01
Gen
der
F
M
Tot
al
* 375
(48.
4%)
399
(51.
6%)
774
* 1902
(50
.5%
) 18
61 (
49.5
%)
3764
0.37
* 48.6
%
51.4
%
0.98
* 6
62 (
46.2
%)
771
(53
.8%
) 14
33
* 1783
(47
.7%
) 19
55 (
52.3
%)
3738
0.15
* 48
.7%
**
51.3
%
0.08
Spe
cial
ty
Med
ical
S
urgi
cal
Onc
olog
y/P
CU
C
ritic
al C
are
Reh
abili
tatio
n A
ged
Car
e
Tot
al
* 358
(46.
3%)
231
(29.
8%)
42
(5.4
%)
29
(3.7
%)
48
(6.2
%)
66
(8.5
%)
774
* 1744
(46
.3%
) 10
27 (
27.3
%)
160
(4.
2%)
8
7 (2
.3%
) 3
14 (
8.3%
) 4
33 (
11.5
%)
3765
<0.
01
n/a
* 5
83 (
40.7
%)
470
(32
.8%
)
65
( 4.
5%)
3
3 (
2.3%
) 1
79 (
12.5
%)
104
( 7
.3%
) 14
34
* 1772
(47
.4%
) 9
47 (
25.3
%)
159
( 4
.3%
)
83
( 2.
2%)
342
( 9
.1%
) 4
37 (
11.7
%)
3740
<0.
01
n/a
PU
pre
sent
Yes
No
T
otal
* 248
(32.
0%)
526
(68.
0%)
774
* 1067
(28
.3%
) 27
01 (
71.7
%)
3768
0.01
* 2
65 (
18.5
%)
1169
(81
.5%
) 14
34
* 758
(20
.3%
) 29
83 (
79.7
%)
3741
0.03
*exc
ludi
ng s
ame
day,
age
<18
, men
tal h
ealth
and
mat
erni
ty p
atie
nts;
**
excl
udin
g on
ly p
aedi
atric
and
wom
en’s
hos
pita
ls
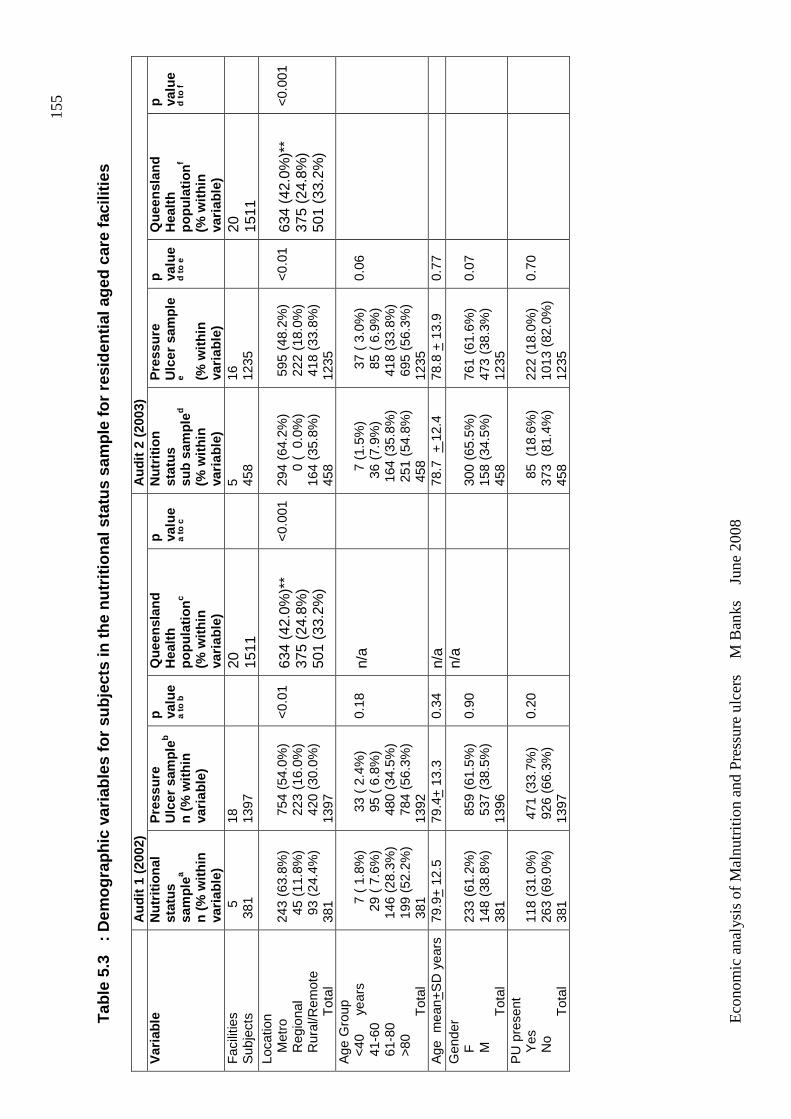
Eco
nom
ic a
naly
sis
of M
aln
utrit
ion
and
Pre
ssur
e ul
cers
M
Ban
ks
Jun
e 2
008
155
Tab
le 5
.3
: Dem
ogra
phic
var
iabl
es fo
r su
bjec
ts in
the
nutr
ition
al s
tatu
s sa
mpl
e fo
r re
side
ntia
l age
d c
are
faci
litie
s
Aud
it 1
(200
2)
Aud
it 2
(200
3)
Var
iabl
e N
utrit
iona
l st
atus
sa
mpl
ea
n (%
with
in
varia
ble)
Pre
ssur
e U
lcer
sam
ple
b
n (%
with
in
varia
ble)
p valu
e a
to b
Que
ensl
and
Hea
lth
popu
latio
nc
(% w
ithin
va
riabl
e)
p valu
e a
to c
Nut
ritio
n st
atus
su
b sa
mpl
ed
(% w
ithin
va
riabl
e)
Pre
ssur
e U
lcer
sam
ple
e (% w
ithin
va
riabl
e)
p valu
e
d to
e
Que
ensl
and
Hea
lth
popu
latio
nf
(% w
ithin
va
riabl
e)
p valu
e d
to f
Fac
ilitie
s
Sub
ject
s
5
381
18
13
97
20
15
11
5
45
8
16
1235
20
15
11
Loca
tion
Met
ro
R
egio
nal
R
ural
/Rem
ote
T
otal
243
(63.
8%)
45
(11.
8%)
93
(24.
4%)
381
754
(54
.0%
) 2
23 (
16.0
%)
420
(30
.0%
) 13
97
<0.
01
634
(42.
0%)*
* 37
5 (2
4.8%
) 50
1 (3
3.2%
)
<0.
001
294
(64.
2%)
0
( 0
.0%
) 16
4 (3
5.8%
) 45
8
595
(48
.2%
) 2
22 (
18.0
%)
418
(33
.8%
) 12
35
<0.
01
634
(42.
0%)*
* 37
5 (2
4.8%
) 50
1 (3
3.2%
)
<0.
001
Age
Gro
up
<40
y
ears
4
1-60
6
1-80
>
80
Tot
al
7
( 1
.8%
)
29 (
7.6
%)
146
(28
.3%
) 1
99 (
52.2
%)
381
33
( 2
.4%
)
95 (
6.8
%)
480
(34
.5%
) 7
84 (
56.3
%)
1392
0.18
n/
a
7
(1.
5%)
36
(7.9
%)
164
(35
.8%
) 2
51 (
54.8
%)
458
37
( 3
.0%
)
85 (
6.9
%)
418
(33
.8%
) 6
95 (
56.3
%)
1235
0.06
Age
mea
n+S
D y
ears
79
.9+
12.
5 79
.4+
13.
3 0.
34
n/a
78
.7 +
12.
4 78
.8 +
13.
9 0.
77
Gen
der
F
M
Tot
al
233
(61.
2%)
148
(38.
8%)
381
859
(61
.5%
) 5
37 (
38.5
%)
1396
0.90
n/
a
300
(65.
5%)
158
(34.
5%)
458
761
(61.
6%)
473
(38.
3%)
1235
0.07
PU
pre
sent
Yes
No
T
otal
118
(31.
0%)
263
(69.
0%)
381
471
(33
.7%
) 9
26 (
66.3
%)
1397
0.20
8
5 (
18.6
%)
373
(81
.4%
) 45
8
222
(18.
0%)
1013
(82
.0%
) 12
35
0.70
Economic analysis of Malnutrition and Pressure ulcers M Banks June 2008
156
5.2 OBJECTIVE 1 ANALYSIS
5.2.1 Prevalence of malnutrition in Queensland hosp itals and residential
aged care facilities
Table 5.4 shows the average percentages of nutritional status classifications
across acute and residential aged care facilities. A mean of 34.7 + 4.0% and
31.4 + 9.5% of acute subjects, and a median of 50% and 49.2% of aged care
subjects were found to be malnourished, in Audits 1 and 2 respectively. There
were however considerable variations in the percentages of nutritional status
classifications across individual facilities, especially for Audit 2 for acute
facilities (0-75%) and for the residential aged care facilities across both audits
(11.1%-56.6%). However there were few acute facilities with prevalence of
malnutrition at the extremes, reflected by acceptable standard deviations
around the mean values; and only one residential aged care facility with a
reported low prevalence of malnutrition, resulting in a skewed graph when
prevalence rates were plotted. Due to the limited number of residential aged
care facilities and the large skew related to the one facility reporting a low
prevalence rate, a median value is reported.
These results also show approximately 20% of the total malnourished subjects
are severely malnourished. The difference in the prevalence of malnutrition
between Audit 1 and Audit 2 for both acute and residential aged care facilities
was not clinically or statistically significant.
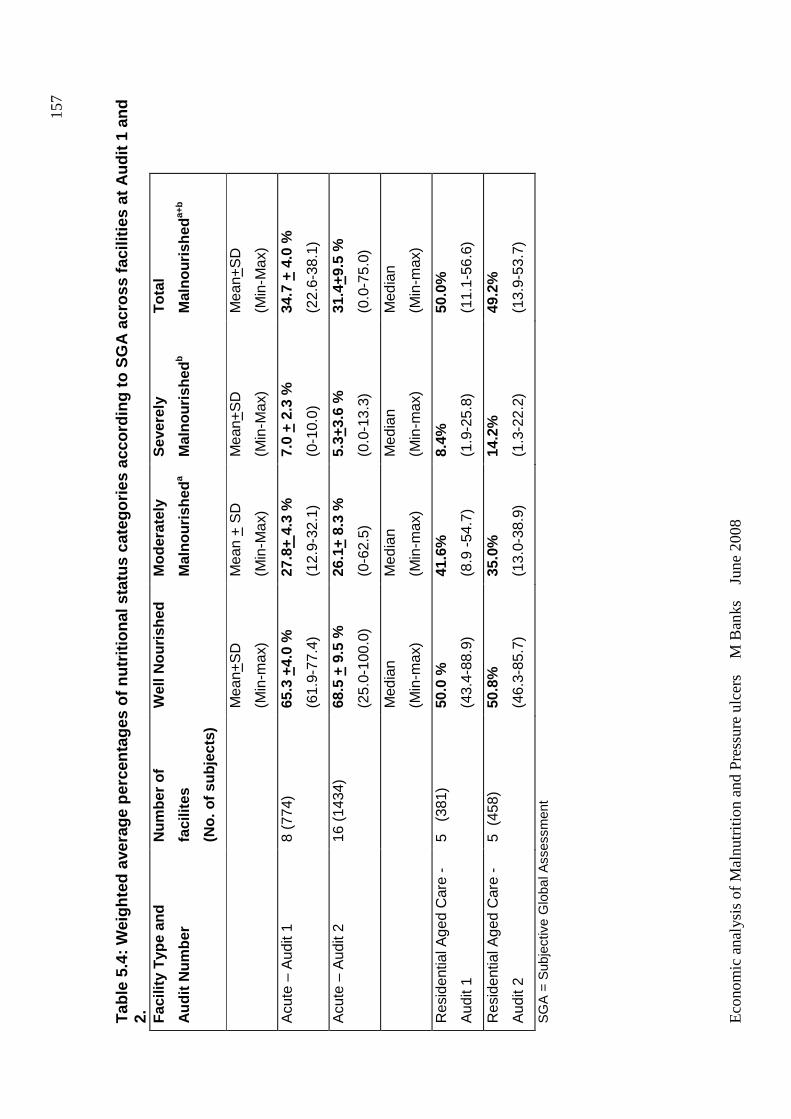
Eco
nom
ic a
naly
sis
of M
aln
utrit
ion
and
Pre
ssur
e ul
cers
M
Ban
ks
Jun
e 2
008
157
Tab
le 5
.4: W
eigh
ted
aver
age
perc
enta
ges
of n
utrit
iona
l sta
tus
cate
gorie
s ac
cord
ing
to S
GA
acr
oss
faci
liti
es a
t Aud
it 1
and
2.
Fac
ility
Typ
e an
d
Aud
it N
umbe
r
Num
ber
of
faci
lites
(No.
of s
ubje
cts)
Wel
l Nou
rishe
d M
oder
atel
y
Mal
nour
ishe
da
Sev
erel
y
Mal
nour
ishe
db
Tot
al
Mal
nour
ishe
da+
b
Mea
n+S
D
(Min
-max
)
Mea
n +
SD
(Min
-Max
)
Mea
n+S
D
(Min
-Max
)
Mea
n+S
D
(Min
-Max
)
Acu
te –
Aud
it 1
8 (7
74)
65.3
+4.
0 %
(61.
9-77
.4)
27.8
+ 4.
3 %
(12.
9-32
.1)
7.0
+ 2.
3 %
(0-1
0.0)
34.7
+ 4
.0 %
(22.
6-38
.1)
Acu
te –
Aud
it 2
16 (
1434
) 68
.5 +
9.5
%
(25.
0-10
0.0)
26.1
+ 8.
3 %
(0-6
2.5)
5.3+
3.6
%
(0.0
-13.
3)
31.4
+9.5
%
(0.0
-75.
0)
Med
ian
(Min
-max
)
Med
ian
(Min
-max
)
Med
ian
(Min
-max
)
Med
ian
(Min
-max
)
Res
iden
tial A
ged
Car
e -
Aud
it 1
5 (
381)
50
.0 %
(43.
4-88
.9)
41.6
%
(8.9
-54
.7)
8.4%
(1.9
-25.
8)
50.0
%
(11.
1-56
.6)
Res
iden
tial A
ged
Car
e -
Aud
it 2
5 (
458)
50
.8%
(46.
3-85
.7)
35.0
%
(13.
0-38
.9)
14.2
%
(1.3
-22.
2)
49.2
%
(13.
9-53
.7)
SG
A =
Sub
ject
ive
Glo
bal A
sses
smen
t
Economic analysis of Malnutrition and Pressure ulcers M Banks June 2008
158
5.2.2 Effect of independent variables on the prese nce of malnutrition
The multivariable relationships of independent variables on nutritional status
for the acute and residential aged care facilities are presented in Table 5.5.
The multivariable (mutually adjusted) models generally strengthened the
relationships established at the bivariate level. As there was no significant
difference in the prevalence of malnutrition between Audits 1 and 2 for acute
facilities, data were combined for bivariate and multivariable analyses to
increase statistical power. Data for residential facilities was not pooled due to
the high percentage of dependent cases between Audit 1 and 2; hence only
results for Audit 1 are presented for this analysis, as similar results were
obtained for Audit 2.
Gender did not have an effect on nutritional status in acute facilities, but it was
in residential aged care facilities. Being male in a residential aged care facility
was shown to have a significant adjusted odds risk of 1.2 (95%CI 1.1-1.3,
p=0.003) compared to being female, although this is not considered clinically
significant in this study. Age group had a significant effect on nutritional status.
Compared to the age group 61-80 years, younger age groups have a lower
odds risk of being malnourished (acute: <40 years OR = 0.6 (95% CI 0.4-0.8,
p<0.001); 41-60 years OR = 0.6 (95% CI 0.5-0.7, p<0.001)), although this did
not reach statistical significance in the residential aged care facilities. Being
aged 81 years or older compared to 61-80 years, had an adjusted odds risk of
being malnourished of 1.7 (95% CI 1.5-2.0, p<0.001) in acute facilities and 1.4
(95% CI 1.2-1.6, p<0.001) in residential aged care facilities. Facility location
also had an effect on nutritional status. In the acute setting, subjects from rural
and remote locations had a significantly lower odds risk of being malnourished
(OR=0.1, 95% CI 0.02-0.5, p=0.007) than those from metropolitan facilities.
This pattern was also demonstrated for regional facilities but did not reach
statistical significance. In the residential aged care setting there also appeared
to be a lower odds risk of being malnourished if from a regional or rural and
remote facility. For regional facilities this pattern reached statistical
significance (OR=0.1, 95% CI 0.01-0.8, p=0.03), but data was only available
from one regional facility and so generalisations about this data cannot be
made. Medical specialty in acute facilities was found to have an effect on
Economic analysis of Malnutrition and Pressure ulcers M Banks June 2008
159
nutritional status. Compared to medical patients, oncology patients had an
adjusted higher odds risk of being malnourished (OR=2.3 (95% CI 1.5-3.8,
p=0.001) as did critical care patients (OR=1.6 (95% CI 1.1-2.3, p=0.02). All
other medical specialties were not considered significantly different from
medical subjects.
In these analyses, significant design effect was established for the variables of
facility location and medical specialty in acute facilities, and facility location in
residential aged care facilities. This means that a clustering effect related to
facility did occur, that is, that individuals from a facility were more likely to be
similar to other individuals from that facility than the rest of the population,
confirming the use of an analysis of correlated data approach.
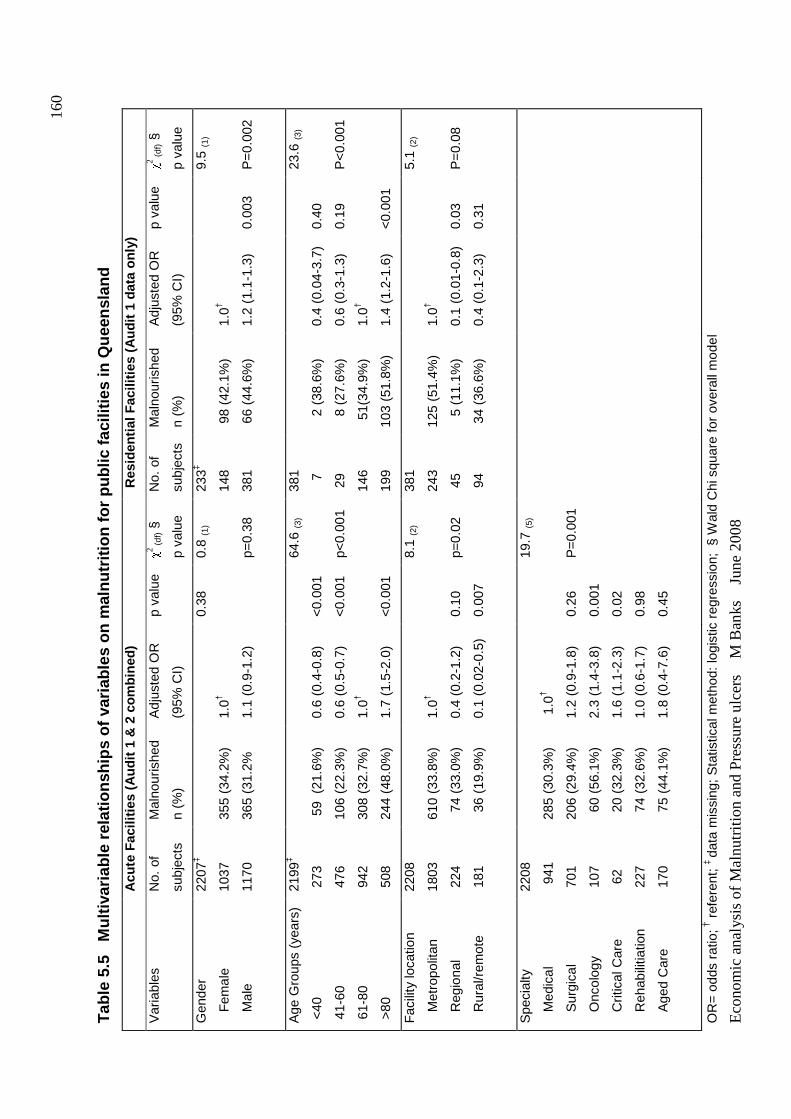
Eco
nom
ic a
naly
sis
of M
aln
utrit
ion
and
Pre
ssur
e ul
cers
M
Ban
ks
Jun
e 2
008
160
Tab
le 5
.5
Mul
tivar
iabl
e re
latio
nshi
ps o
f var
iabl
es
on m
alnu
triti
on fo
r pu
blic
faci
litie
s in
Que
ensl
and
A
cute
Fac
ilitie
s (A
udit
1 &
2 c
ombi
ned)
R
esid
enti
al F
acili
ties
(Aud
it 1
data
onl
y)
Var
iabl
es
No.
of
subj
ects
Mal
nour
ishe
d
n (%
)
Adj
uste
d O
R
(95%
CI)
p va
lue
χ 2 (df) §
p va
lue
No.
of
subj
ects
Mal
nour
ishe
d
n (%
)
Adj
uste
d O
R
(95%
CI)
p va
lue
χ 2 (df) §
p va
lue
Gen
der
F
emal
e
M
ale
2207
‡
1037
1170
355
(34.
2%)
365
(31.
2%
1.0†
1.1
(0.9
-1.2
)
0.38
0.
8 (1
)
p=0.
38
233‡
148
381
98
(42.
1%)
66
(44.
6%)
1.0†
1.2
(1.1
-1.3
)
0.00
3
9.5
(1)
P=
0.00
2
Age
Gro
ups
(yea
rs)
<40
41-
60
61-
80
>80
2199
‡
273
476
942
508
59
(21
.6%
)
106
(22.
3%)
308
(32.
7%)
244
(48.
0%)
0.6
(0.4
-0.8
)
0.6
(0.5
-0.7
)
1.0†
1.7
(1.5
-2.0
)
<0.
001
<0.
001
<0.
001
64.6
(3)
p<0.
001
381
7
29
146
199
2
(38.
6%)
8
(27.
6%)
51(
34.9
%)
103
(51.
8%)
0.4
(0.0
4-3.
7)
0.6
(0.3
-1.3
)
1.0†
1.4
(1.2
-1.6
)
0.40
0.19
<0.
001
23.6
(3)
P<
0.00
1
Fac
ility
loca
tion
M
etro
polit
an
R
egio
nal
R
ural
/rem
ote
2208
1803
224
181
610
(33.
8%)
74
(33.
0%)
36
(19.
9%)
1.0†
0.4
(0.2
-1.2
)
0.1
(0.0
2-0.
5)
0.10
0.00
7
8.1
(2)
p=0.
02
381
243
45
94
125
(51.
4%)
5
(11.
1%)
34
(36.
6%)
1.0†
0.1
(0.0
1-0.
8)
0.4
(0.1
-2.3
)
0.03
0.31
5.1
(2)
P=
0.08
Spe
cial
ty
M
edic
al
S
urgi
cal
O
ncol
ogy
C
ritic
al C
are
R
ehab
ilitia
tion
A
ged
Car
e
2208
941
701
107
62
227
170
285
(30.
3%)
206
(29.
4%)
60
(56.
1%)
20
(32.
3%)
74
(32.
6%)
75
(44.
1%)
1.0
†
1.2
(0.9
-1.8
)
2.3
(1.4
-3.8
)
1.6
(1.1
-2.3
)
1.0
(0.6
-1.7
)
1.8
(0.4
-7.6
)
0.26
0.00
1
0.02
0.98
0.45
19.7
(5)
P=
0.00
1
OR
= o
dds
ratio
; † r
efer
ent;
‡ da
ta m
issi
ng; S
tatis
tical
met
hod:
logi
stic
reg
ress
ion;
§ W
ald
Chi
squ
are
for
over
all m
odel
Economic analysis of Malnutrition and Pressure ulcers M Banks June 2008
161
5.3 OBJECTIVE 2 ANALYSIS
5.3.1 Effect of nutritional status on presence of pressure ulcer
Table 5.6 shows the results of the bivariate relationships between the
potentially confounding independent variables and the presence of pressure
ulcer for Audits 1 and 2 for acute and residential facilities. Nutritional status
and age group were found to have a significant effect on the presence of
pressure ulcer in both acute and residential aged care facilities. Facility
location was found to have a significant effect in residential aged care facilities
in Audit 1 but not in Audit 2 or acute facilities. Medical specialty also had a
significant effect on the presence of pressure ulcers in acute facilities. Gender
did not have an effect on the presence of pressure ulcer. Hence, age group
and facility location were used in the multivariable model to determine the
effect of nutritional status on the presence of pressure ulcer for residential
aged care facilities; and age group, medical specialty and facility location were
used in the multivariable model for acute facilities. Facility location was also
included in the acute facilities model, because it was significant in residential
facilities and was considered to have a potentially confounding effect on the
model.
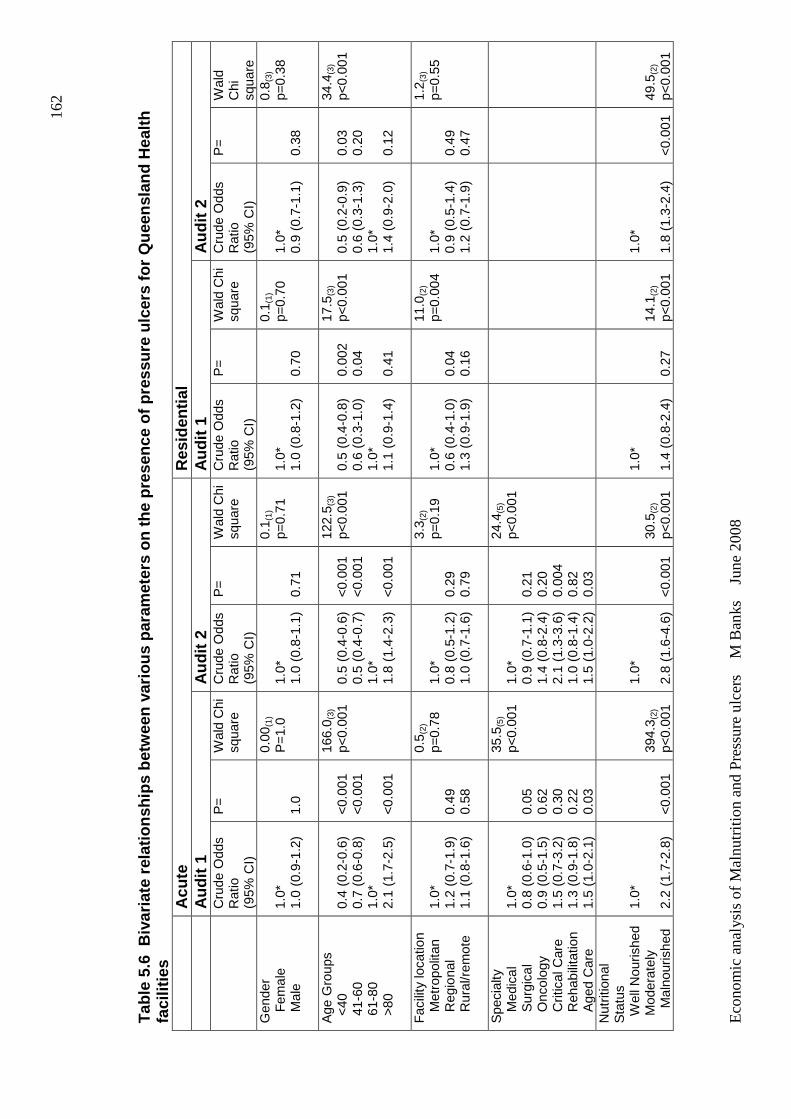
Eco
nom
ic a
naly
sis
of M
aln
utrit
ion
and
Pre
ssur
e ul
cers
M
Ban
ks
Jun
e 2
008
162
Tab
le 5
.6 B
ivar
iate
rel
atio
nshi
ps b
etw
een
vario
us
para
met
ers
on th
e pr
esen
ce o
f pre
ssur
e ul
cers
for
Que
ensl
and
Hea
lth
faci
litie
s
Acu
te
Res
iden
tial
A
udit
1 A
udit
2 A
udit
1 A
udit
2
Cru
de O
dds
R
atio
(9
5% C
I)
P=
W
ald
Chi
sq
uare
C
rude
Odd
s
Rat
io
(95%
CI)
P=
W
ald
Chi
sq
uare
C
rude
Odd
s
Rat
io
(95%
CI)
P=
W
ald
Chi
sq
uare
C
rude
Odd
s
Rat
io
(95%
CI)
P=
W
ald
Chi
sq
uare
G
ende
r
Fem
ale
M
ale
1.0*
1.
0 (0
.9-1
.2)
1.0
0.00
(1)
P=
1.0
1.0*
1.
0 (0
.8-1
.1)
0.71
0.1 (
1)
p=0.
71
1.0*
1.
0 (0
.8-1
.2)
0.70
0.1 (
1)
p=0.
70
1.0*
0.
9 (0
.7-1
.1)
0.38
0.8 (
3)
p=0.
38
Age
Gro
ups
<40
4
1-60
6
1-80
>
80
0.4
(0.2
-0.6
) 0.
7 (0
.6-0
.8)
1.0*
2.
1 (1
.7-2
.5)
<0.
001
<0.
001
<0.
001
166.
0 (3)
p<0.
001
0.5
(0.4
-0.6
) 0.
5 (0
.4-0
.7)
1.0*
1.
8 (1
.4-2
.3)
<0.
001
<0.
001
<0.
001
122.
5 (3)
p<0.
001
0.5
(0.4
-0.8
) 0.
6 (0
.3-1
.0)
1.0*
1.
1 (0
.9-1
.4)
0.00
2 0.
04
0.41
17.5
(3)
p<0.
001
0.5
(0.2
-0.9
) 0.
6 (0
.3-1
.3)
1.0*
1.
4 (0
.9-2
.0)
0.03
0.
20
0.12
34.4
(3)
p<0.
001
Fac
ility
loca
tion
M
etro
polit
an
R
egio
nal
R
ural
/rem
ote
1.0*
1.
2 (0
.7-1
.9)
1.1
(0.8
-1.6
)
0.49
0.
58
0.5 (
2)
p=0.
78
1.0*
0.
8 (0
.5-1
.2)
1.0
(0.7
-1.6
)
0.29
0.
79
3.3 (
2)
p=0.
19
1.0*
0.
6 (0
.4-1
.0)
1.3
(0.9
-1.9
)
0.04
0.
16
11.0
(2)
p=0.
004
1.0*
0.
9 (0
.5-1
.4)
1.2
(0.7
-1.9
)
0.49
0.
47
1.2 (
3)
p=0.
55
Spe
cial
ty
M
edic
al
S
urgi
cal
O
ncol
ogy
C
ritic
al C
are
R
ehab
ilita
tion
A
ged
Car
e
1.0*
0.
8 (0
.6-1
.0)
0.9
(0.5
-1.5
) 1.
5 (0
.7-3
.2)
1.3
(0.9
-1.8
) 1.
5 (1
.0-2
.1)
0.05
0.
62
0.30
0.
22
0.03
35.5
(5)
p<0.
001
1.0*
0.
9 (0
.7-1
.1)
1.4
(0.8
-2.4
) 2.
1 (1
.3-3
.6)
1.0
(0.8
-1.4
) 1.
5 (1
.0-2
.2)
0.21
0.
20
0.00
4 0.
82
0.03
24.4
(5)
p<0.
001
Nut
ritio
nal
Sta
tus
Wel
l Nou
rishe
d M
oder
atel
y
M
alno
uris
hed
1.0*
2.
2 (1
.7-2
.8)
<0.
001
394.
3 (2)
p<0.
001
1.0*
2.
8 (1
.6-4
.6)
<0.
001
30.5
(2)
p<0.
001
1.0*
1.
4 (0
.8-2
.4)
0.27
14.1
(2)
p<0.
001
1.0*
1.
8 (1
.3-2
.4)
<0.
001
49.5
(2)
p<0.
001
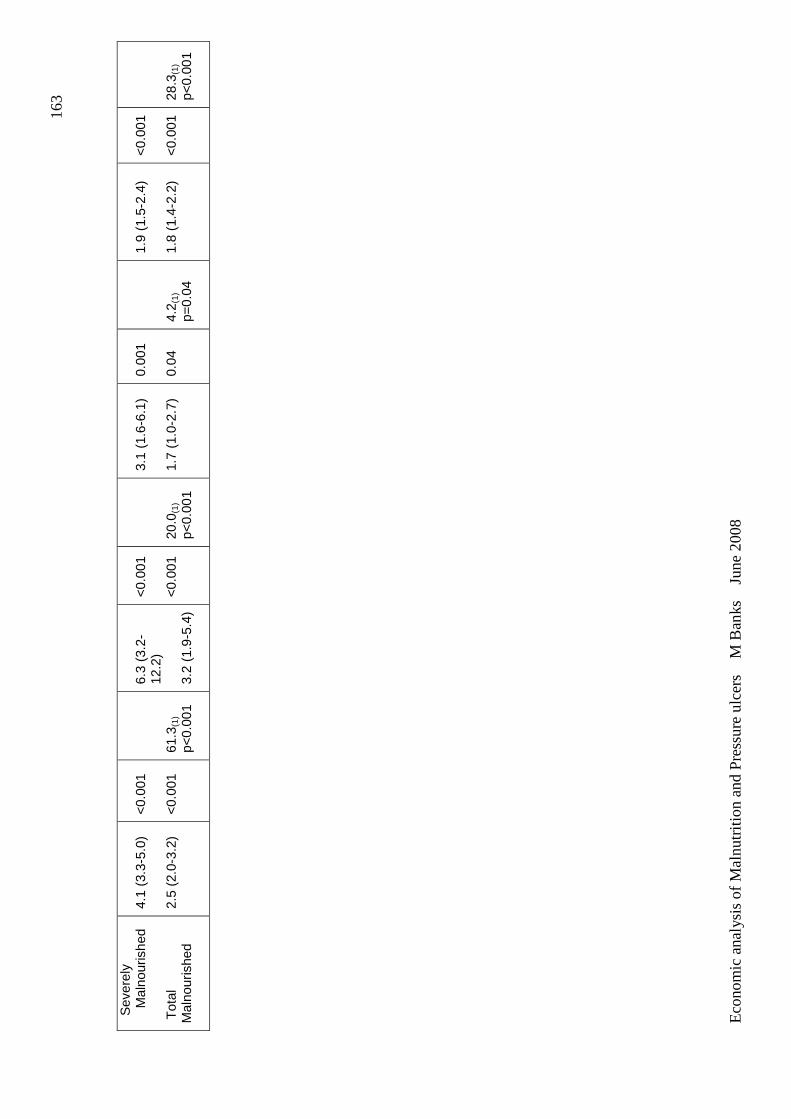
Eco
nom
ic a
naly
sis
of M
aln
utrit
ion
and
Pre
ssur
e ul
cers
M
Ban
ks
Jun
e 2
008
163
Sev
erel
y
M
alno
uris
hed
Tot
al
Mal
nour
ishe
d
4.1
(3.3
-5.0
) 2.
5 (2
.0-3
.2)
<0.
001
<0.
001
61.3
(1)
p<0.
001
6.3
(3.2
-12
.2)
3.2
(1.9
-5.4
)
<0.
001
<0.
001
20.0
(1)
p<0.
001
3.1
(1.6
-6.1
) 1.
7 (1
.0-2
.7)
0.00
1 0.
04
4.2 (
1)
p=0.
04
1.9
(1.5
-2.4
) 1.
8 (1
.4-2
.2)
<0.
001
<0.
001
28.3
(1)
p<0.
001
Economic analysis of Malnutrition and Pressure ulcers M Banks June 2008
164
The effect of nutritional status on the presence of pressure ulcer, adjusted for
other independent variables, for acute facilities and residential aged care
facilities are presented in Table 5.7. The unadjusted odds risk of the effect of
malnutrition on the presence of pressure ulcer in acute facilities appeared to
increase between Audit 1 and Audit 2 (OR=2.5, 95% CI 2.0-3.2 to OR=3.2,
95% CI 1.9-5.4) however this change was found to be non significant, so data
for Audit 1 and 2 for acute facilities for the multivariable model were again
pooled for analysis to increase power. Data for residential facilities was again
not pooled due to the high percentage of dependent cases between Audit 1
and 2; however both audit results are presented for this analysis as the
individual nutritional status results were considered sufficiently different to
require separate presentation, although the overall results for the effect of
malnutrition were similar.
The multivariable (mutually adjusted) model did not significantly change the
effect of nutritional status on the presence of pressure ulcer, established at the
bivariate level. In all cases, malnutrition was significantly associated with an
increased odds risk of having a pressure ulcer, with this odds risk increasing
with the severity of malnutrition.
In acute facilities where data from the two audits were pooled, moderate
malnutrition had an odds risk of 2.2 (95% CI 1.6-3.0, p<0.001) and severe
malnutrition had an odds risk of 4.8 (95% CI 3.2-7.2, p<0.001). The overall
adjusted odds risk of having a pressure ulcer when malnourished (total
malnutrition) in an acute facility was 2.6 (95% CI 1.8-3.5, p<0.001).
In residential facilities, where the audit results are presented separately, the
same pattern applied with moderate malnutrition having an odds risk of 1.7
(95% CI 1.2-2.2, p<0.001) and 2.0 (95% CI 1.5-2.8, p<0.001); and severe
malnutrition having an odds risk of 2.8 (95% CI1.2-6.6, p=0.02) and 2.2 (95%
CI 1.5-3.1, p<0.001), for Audits 1 and 2 respectively. There was no statistical
difference between these odds risk ratios between the audits. The overall
adjusted odds risk of having a pressure ulcer when malnourished (total
Economic analysis of Malnutrition and Pressure ulcers M Banks June 2008
165
malnutrition) in a residential aged care facility was 1.9 (95% CI 1.3-2.7,
p<0.001) and 2.0 (95% CI 1.5-2.7, p<0.001) for Audits 1 and 2 respectively.
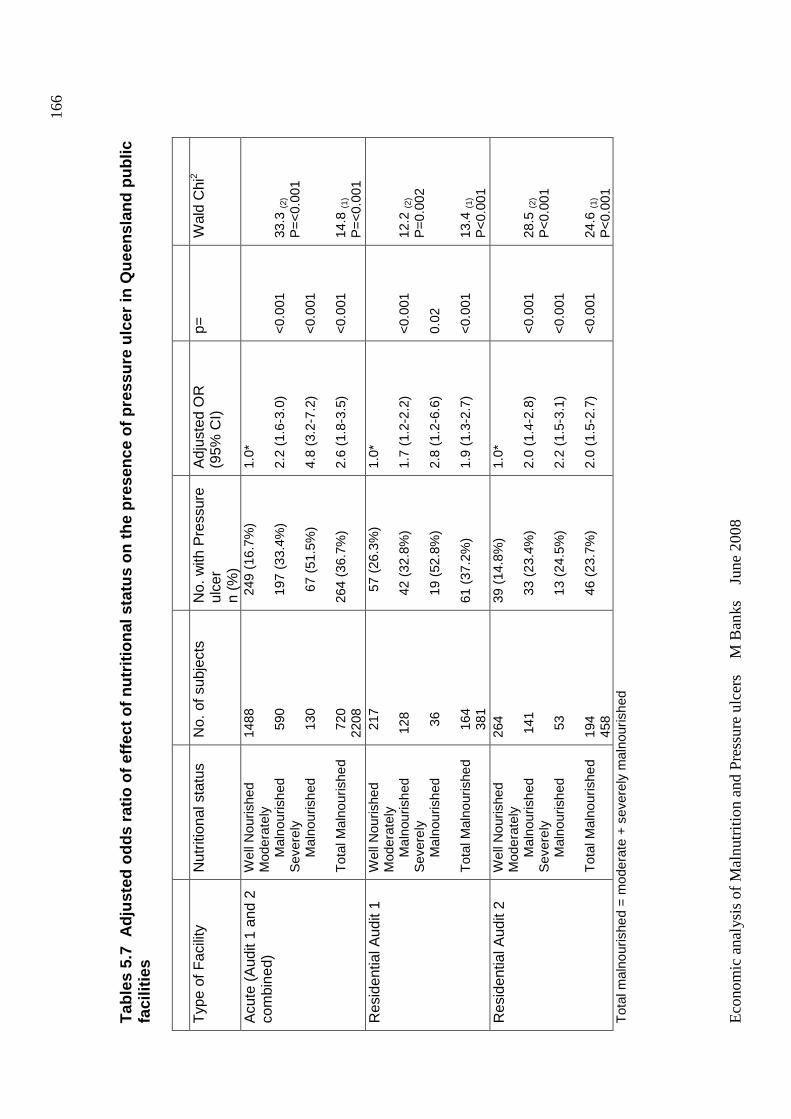
Eco
nom
ic a
naly
sis
of M
aln
utrit
ion
and
Pre
ssur
e ul
cers
M
Ban
ks
Jun
e 2
008
166
Tab
les
5.7
Adj
uste
d od
ds r
atio
of e
ffect
of n
utrit
iona
l sta
tus
on th
e pr
esen
ce o
f pre
ssur
e ul
cer
in Q
ueen
slan
d pu
blic
fa
cilit
ies
T
ype
of F
acili
ty
Nut
ritio
nal s
tatu
s N
o. o
f sub
ject
s
No.
with
Pre
ssur
e ul
cer
n (%
)
Adj
uste
d O
R
(95%
CI)
p=
W
ald
Chi
2
Acu
te (
Aud
it 1
and
2 co
mbi
ned)
W
ell N
ouris
hed
Mod
erat
ely
Mal
nour
ishe
d S
ever
ely
Mal
nour
ishe
d T
otal
Mal
nour
ishe
d
1488
5
90
130
7
20
2208
249
(16
.7%
) 1
97 (
33.4
%)
67
(51
.5%
) 26
4 (3
6.7%
)
1.0*
2.
2 (1
.6-3
.0)
4.8
(3.2
-7.2
) 2.
6 (1
.8-3
.5)
<0.
001
<0.
001
<0.
001
33.3
(2)
P=
<0.
001
14.8
(1)
P=
<0.
001
Res
iden
tial A
udit
1 W
ell N
ouris
hed
Mod
erat
ely
Mal
nour
ishe
d S
ever
ely
Mal
nour
ishe
d T
otal
Mal
nour
ishe
d
217
1
28
36
1
64
381
57
(26
.3%
)
4
2 (3
2.8%
)
1
9 (5
2.8%
) 61
(37
.2%
)
1.0*
1.
7 (1
.2-2
.2)
2.8
(1.2
-6.6
) 1.
9 (1
.3-2
.7)
<0.
001
0.02
<
0.00
1
12.2
(2)
P=
0.00
2 13
.4 (1
) P
<0.
001
Res
iden
tial A
udit
2 W
ell N
ouris
hed
Mod
erat
ely
Mal
nour
ishe
d S
ever
ely
Mal
nour
ishe
d T
otal
Mal
nour
ishe
d
264
141
5
3 19
4 45
8
39 (
14.8
%)
33
(23.
4%)
13
(24.
5%)
46
(23.
7%)
1.0*
2.
0 (1
.4-2
.8)
2.2
(1.5
-3.1
) 2.
0 (1
.5-2
.7)
<0.
001
<0.
001
<0.
001
28.5
(2)
P<
0.00
1 24
.6 (1
) P
<0.
001
Tot
al m
alno
uris
hed
= m
oder
ate
+ s
ever
ely
mal
nour
ishe
d
Economic analysis of Malnutrition and Pressure ulcers M Banks June 2008
167
5.3.2 Effect of nutritional status on the stage of pressure ulcer
Table 5.8 and 5.9 show the adjusted odds ratio of having different stages of
pressure ulcer compared with no pressure ulcer with nutritional status for acute
and residential aged care facilities respectively. Data for acute facilities was
pooled, and both Audit 1 and 2 results are presented for residential aged care
facilities.
In acute facilities, being malnourished was found to be significantly associated
with an increased odds risk of having a higher stage of pressure ulcer, with the
odds risk increasing with severity of malnutrition. The odds risk of having a
Stage I pressure ulcer when moderately malnourished was 1.9 (95% CI 1.4-
2.6, p<0.001), increasing to 2.7 (95%CI 1.7-4.2, p<0.001) of having a Stage III
or IV pressure ulcer. When severely malnourished the odds risk of having a
Stage I pressure ulcer increased to 3.8 (95%CI 2.3-6.3, p<0,001), further
increasing to 7.1 (95% CI 3.6-13.9, p<0.001) of having a Stage III or IV
pressure ulcer.
Similarly, in residential aged care facilities, there was an increased odds risk of
having a higher stage of pressure ulcer when malnourished, with the odds risk
increasing with severity of malnutrition also found, although a clear pattern
such as presented for acute facilities was unable to be established due to a
lack of numbers in either audit. There were insufficient Stage III or IV pressure
ulcers to provide adequate power for analysis in either audit.
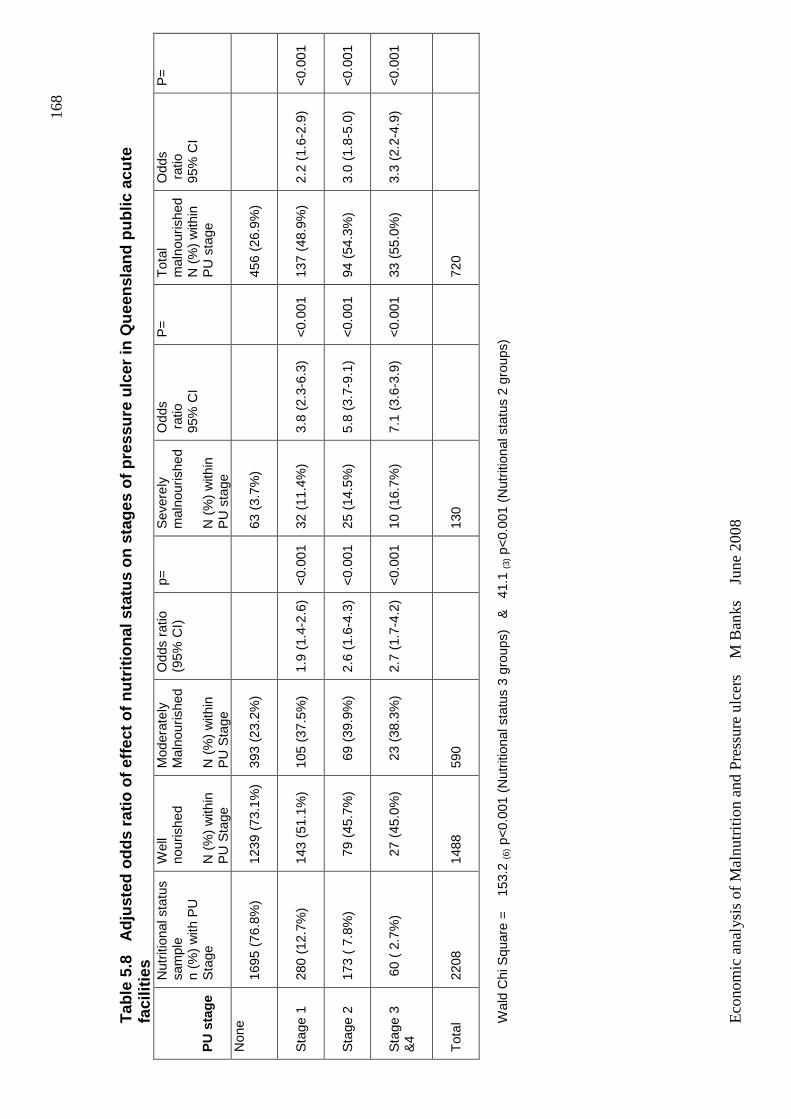
Eco
nom
ic a
naly
sis
of M
aln
utrit
ion
and
Pre
ssur
e ul
cers
M
Ban
ks
Jun
e 2
008
168
Tab
le 5
.8
Adj
uste
d od
ds r
atio
of e
ffect
of n
utrit
iona
l sta
tus
on s
tage
s of
pre
ssur
e ul
cer
in Q
ueen
slan
d pu
blic
acu
te
faci
litie
s P
U s
tage
Nut
ritio
nal s
tatu
s sa
mpl
e n
(%)
with
PU
S
tage
Wel
l no
uris
hed
N (
%)
with
in
PU
Sta
ge
Mod
erat
ely
Mal
nour
ishe
d N
(%
) w
ithin
P
U S
tage
Odd
s ra
tio
(95%
CI)
p=
S
ever
ely
mal
nour
ishe
d
N (
%)
with
in
PU
sta
ge
Odd
s r
atio
95
% C
I
P=
T
otal
m
alno
uris
hed
N (
%)
with
in
PU
sta
ge
Odd
s r
atio
95
% C
I
P=
Non
e 16
95 (
76.8
%)
1239
(73
.1%
) 39
3 (2
3.2%
)
63
(3.
7%)
456
(26.
9%)
Sta
ge 1
280
(12.
7%)
143
(51.
1%)
105
(37.
5%)
1.9
(1.4
-2.6
) <
0.00
1 32
(11
.4%
) 3.
8 (2
.3-6
.3)
<0.
001
137
(48.
9%)
2.2
(1.6
-2.9
) <
0.00
1
Sta
ge 2
173
( 7.
8%)
79
(45.
7%)
69
(39.
9%)
2.6
(1.6
-4.3
) <
0.00
1 25
(14
.5%
) 5.
8 (3
.7-9
.1)
<0.
001
94 (
54.3
%)
3.0
(1.8
-5.0
) <
0.00
1
Sta
ge 3
&
4
60
( 2.
7%)
27
(45.
0%)
23
(38.
3%)
2.7
(1.7
-4.2
) <
0.00
1 10
(16
.7%
) 7.
1 (3
.6-3
.9)
<0.
001
33 (
55.0
%)
3.3
(2.2
-4.9
) <
0.00
1
Tot
al
2208
14
88
590
130
720
Wal
d C
hi S
quar
e =
1
53.2
(6) p
<0.
001
(Nut
ritio
nal s
tatu
s 3
grou
ps)
&
41.1
(3) p
<0.
001
(Nut
ritio
nal s
tatu
s 2
grou
ps)
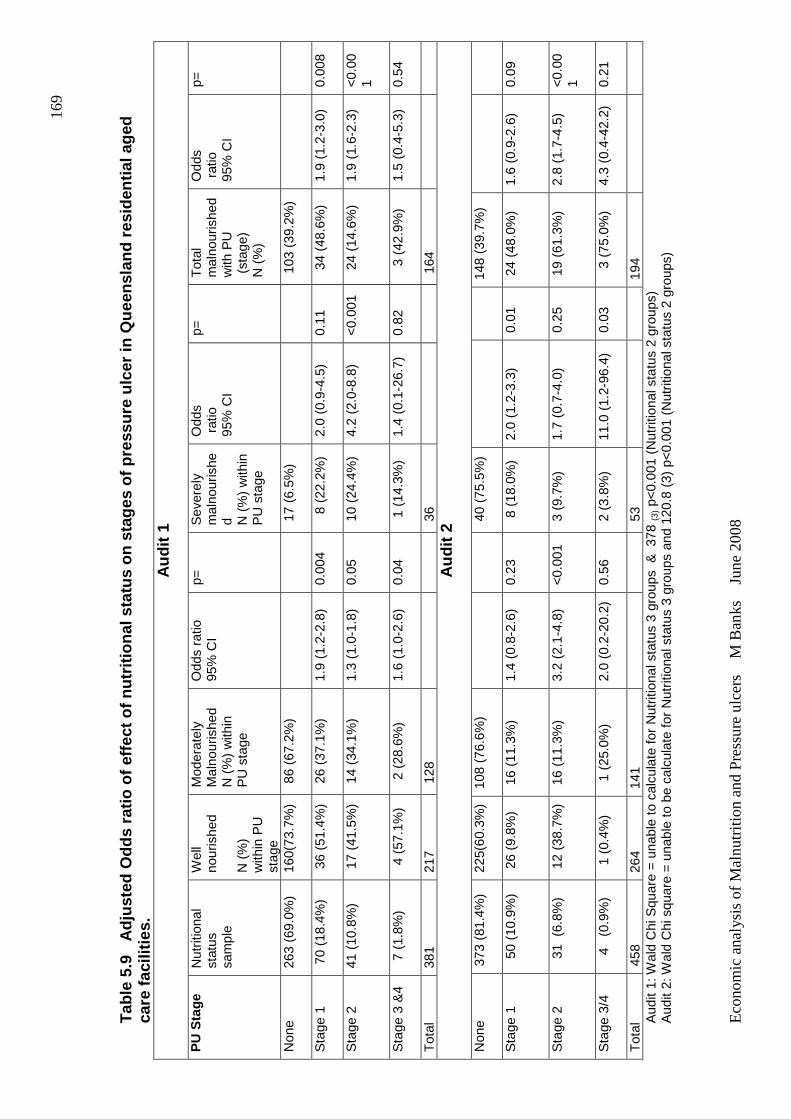
Eco
nom
ic a
naly
sis
of M
aln
utrit
ion
and
Pre
ssur
e ul
cers
M
Ban
ks
Jun
e 2
008
169
Tab
le 5
.9
Adj
uste
d O
dds
ratio
of e
ffect
of n
utrit
iona
l sta
tus
on s
tage
s of
pre
ssur
e ul
cer
in Q
ueen
slan
d re
side
ntia
l age
d ca
re fa
cilit
ies.
Aud
it 1
PU
Sta
ge
Nut
ritio
nal
stat
us
sam
ple
Wel
l no
uris
hed
N (
%)
with
in P
U
stag
e
Mod
erat
ely
Mal
nour
ishe
d N
(%
) w
ithin
P
U s
tage
Odd
s ra
tio
95%
CI
p=
Sev
erel
y m
alno
uris
hed
N
(%
) w
ithin
P
U s
tage
Odd
s r
atio
95
% C
I
p=
Tot
al
mal
nour
ishe
d w
ith P
U
(st
age)
N
(%
)
Odd
s r
atio
95
% C
I
p=
Non
e
263
(69.
0%)
160(
73.7
%)
86
(67.
2%)
17
(6.5
%)
103
(39
.2%
)
Sta
ge 1
7
0 (1
8.4%
) 3
6 (5
1.4%
)
26
(37.
1%)
1.9
(1.2
-2.8
) 0.
004
8
(22.
2%)
2.0
(0.9
-4.5
) 0.
11
34
(48.
6%)
1.9
(1.2
-3.0
) 0.
008
Sta
ge 2
41 (
10.8
%)
17
(41.
5%)
14
(34.
1%)
1.3
(1.0
-1.8
) 0.
05
10
(24.
4%)
4.2
(2.0
-8.8
) <
0.00
1 2
4 (1
4.6%
) 1.
9 (1
.6-2
.3)
<0.
001
Sta
ge 3
&4
7
(1.
8%)
4 (
57.1
%)
2 (
28.6
%)
1.6
(1.0
-2.6
) 0.
04
1 (
14.3
%)
1.4
(0.1
-26.
7)
0.82
3 (4
2.9%
) 1.
5 (0
.4-5
.3)
0.54
Tot
al
381
217
128
3
6
1
64
Aud
it 2
Non
e 37
3 (8
1.4%
)
225(
60.3
%)
108
(76.
6%)
40
(75.
5%)
148
(39.
7%)
Sta
ge 1
50
(10.
9%)
26
(9.8
%)
16
(11.
3%)
1.4
(0.8
-2.6
) 0.
23
8 (
18.0
%)
2.0
(1.2
-3.3
) 0.
01
24
(48.
0%)
1.6
(0.9
-2.6
) 0.
09
Sta
ge 2
31
(6.
8%)
12
(38.
7%)
16
(11.
3%)
3.2
(2.1
-4.8
) <
0.00
1 3
(9.
7%)
1.7
(0.7
-4.0
) 0.
25
19
(61.
3%)
2.8
(1.7
-4.5
) <
0.00
1
Sta
ge 3
/4
4 (
0.9%
) 1
(0.
4%)
1 (
25.0
%)
2.0
(0.2
-20.
2)
0.56
2
(3.
8%)
11.0
(1.
2-96
.4)
0.03
3 (7
5.0%
) 4.
3 (0
.4-4
2.2)
0.
21
Tot
al
458
264
141
53
194
Aud
it 1:
Wal
d C
hi S
quar
e =
una
ble
to c
alcu
late
for
Nut
ritio
nal s
tatu
s 3
grou
ps &
378
(3) p
<0.
001
(Nut
ritio
nal s
tatu
s 2
grou
ps)
Aud
it 2:
Wal
d C
hi s
quar
e =
una
ble
to b
e ca
lcul
ate
for
Nut
ritio
nal s
tatu
s 3
grou
ps a
nd 1
20.8
(3)
p<
0.00
1 (N
utrit
iona
l sta
tus
2 gr
oups
)
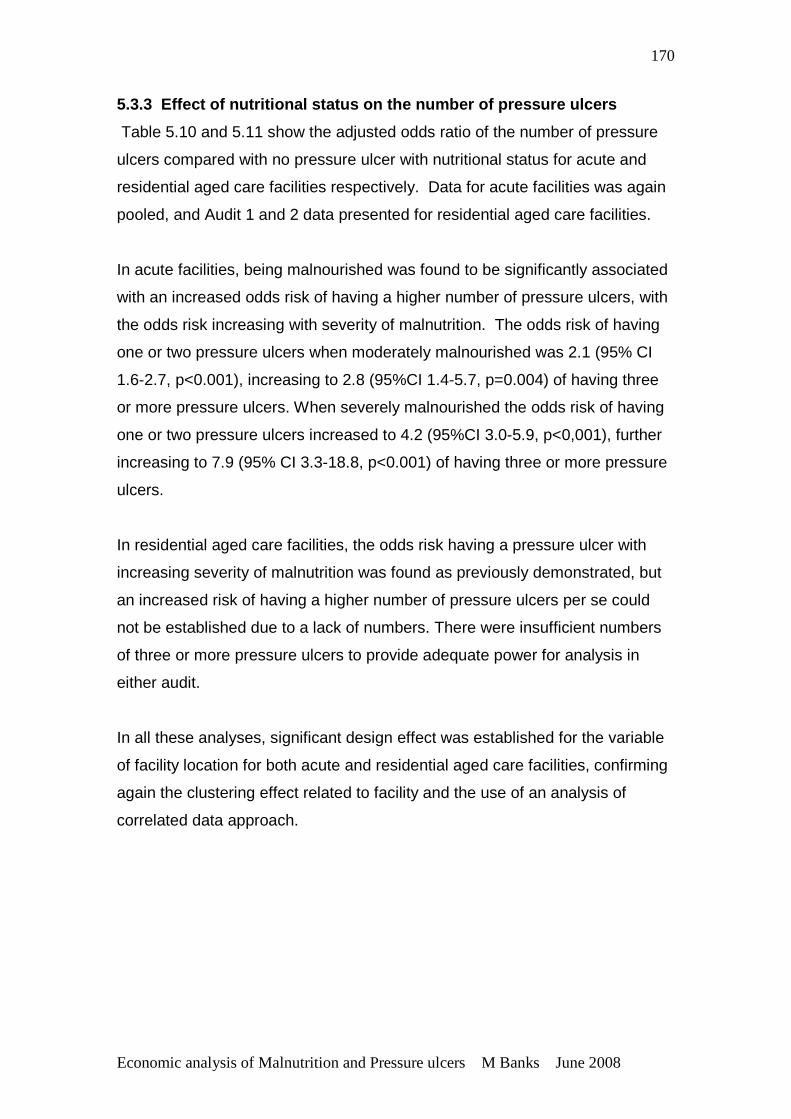
Economic analysis of Malnutrition and Pressure ulcers M Banks June 2008
170
5.3.3 Effect of nutritional status on the number o f pressure ulcers
Table 5.10 and 5.11 show the adjusted odds ratio of the number of pressure
ulcers compared with no pressure ulcer with nutritional status for acute and
residential aged care facilities respectively. Data for acute facilities was again
pooled, and Audit 1 and 2 data presented for residential aged care facilities.
In acute facilities, being malnourished was found to be significantly associated
with an increased odds risk of having a higher number of pressure ulcers, with
the odds risk increasing with severity of malnutrition. The odds risk of having
one or two pressure ulcers when moderately malnourished was 2.1 (95% CI
1.6-2.7, p<0.001), increasing to 2.8 (95%CI 1.4-5.7, p=0.004) of having three
or more pressure ulcers. When severely malnourished the odds risk of having
one or two pressure ulcers increased to 4.2 (95%CI 3.0-5.9, p<0,001), further
increasing to 7.9 (95% CI 3.3-18.8, p<0.001) of having three or more pressure
ulcers.
In residential aged care facilities, the odds risk having a pressure ulcer with
increasing severity of malnutrition was found as previously demonstrated, but
an increased risk of having a higher number of pressure ulcers per se could
not be established due to a lack of numbers. There were insufficient numbers
of three or more pressure ulcers to provide adequate power for analysis in
either audit.
In all these analyses, significant design effect was established for the variable
of facility location for both acute and residential aged care facilities, confirming
again the clustering effect related to facility and the use of an analysis of
correlated data approach.
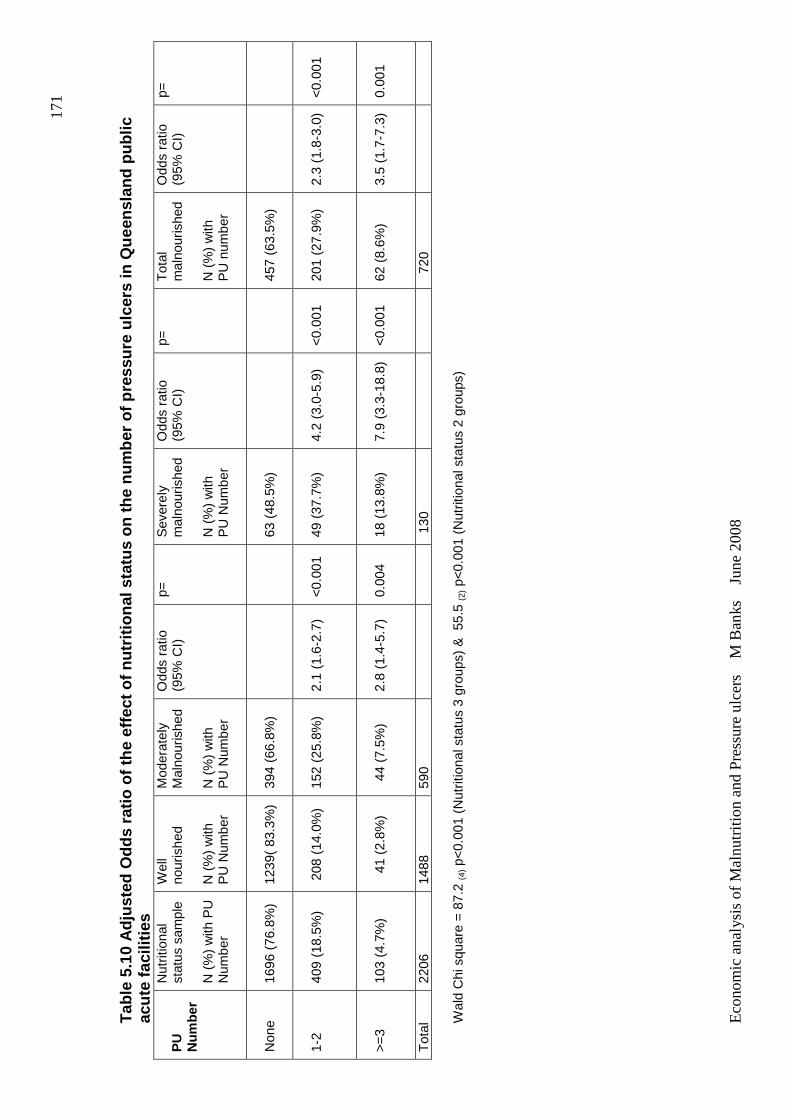
Eco
nom
ic a
naly
sis
of M
aln
utrit
ion
and
Pre
ssur
e ul
cers
M
Ban
ks
Jun
e 2
008
171
Tab
le 5
.10
Adj
uste
d O
dds
ratio
of t
he e
ffect
of n
utrit
iona
l sta
tus
on th
e nu
mbe
r of
pre
ssur
e ul
cers
in Q
ueen
slan
d pu
blic
ac
ute
faci
litie
s P
U
Num
ber
Nut
ritio
nal
stat
us s
ampl
e N
(%
) w
ith P
U
Num
ber
Wel
l no
uris
hed
N
(%
) w
ith
PU
Num
ber
Mod
erat
ely
Mal
nour
ishe
d
N (
%)
with
P
U N
umbe
r
Odd
s ra
tio
(95%
CI)
p=
S
ever
ely
mal
nour
ishe
d
N (
%)
with
P
U N
umbe
r
Odd
s ra
tio
(95%
CI)
p=
T
otal
m
alno
uris
hed
N (
%)
with
P
U n
umbe
r
Odd
s ra
tio
(95%
CI)
p=
Non
e
1696
(76
.8%
) 12
39(
83.3
%)
394
(66.
8%)
63 (
48.5
%)
457
(63.
5%)
1-2
409
(18.
5%)
208
(14
.0%
) 15
2 (2
5.8%
) 2.
1 (1
.6-2
.7)
<0.
001
49 (
37.7
%)
4.2
(3.0
-5.9
) <
0.00
1 20
1 (2
7.9%
) 2.
3 (1
.8-3
.0)
<0.
001
>=
3 10
3 (4
.7%
)
41 (
2.8%
) 4
4 (7
.5%
) 2.
8 (1
.4-5
.7)
0.00
4 18
(13
.8%
) 7.
9 (3
.3-1
8.8)
<
0.00
1 62
(8.
6%)
3.5
(1.7
-7.3
) 0.
001
Tot
al
2206
14
88
590
130
7
20
Wal
d C
hi s
quar
e =
87.
2 (4
) p<
0.00
1 (N
utrit
iona
l sta
tus
3 gr
oups
) &
55.
5 (2
) p<
0.00
1 (N
utrit
iona
l sta
tus
2 gr
oups
)
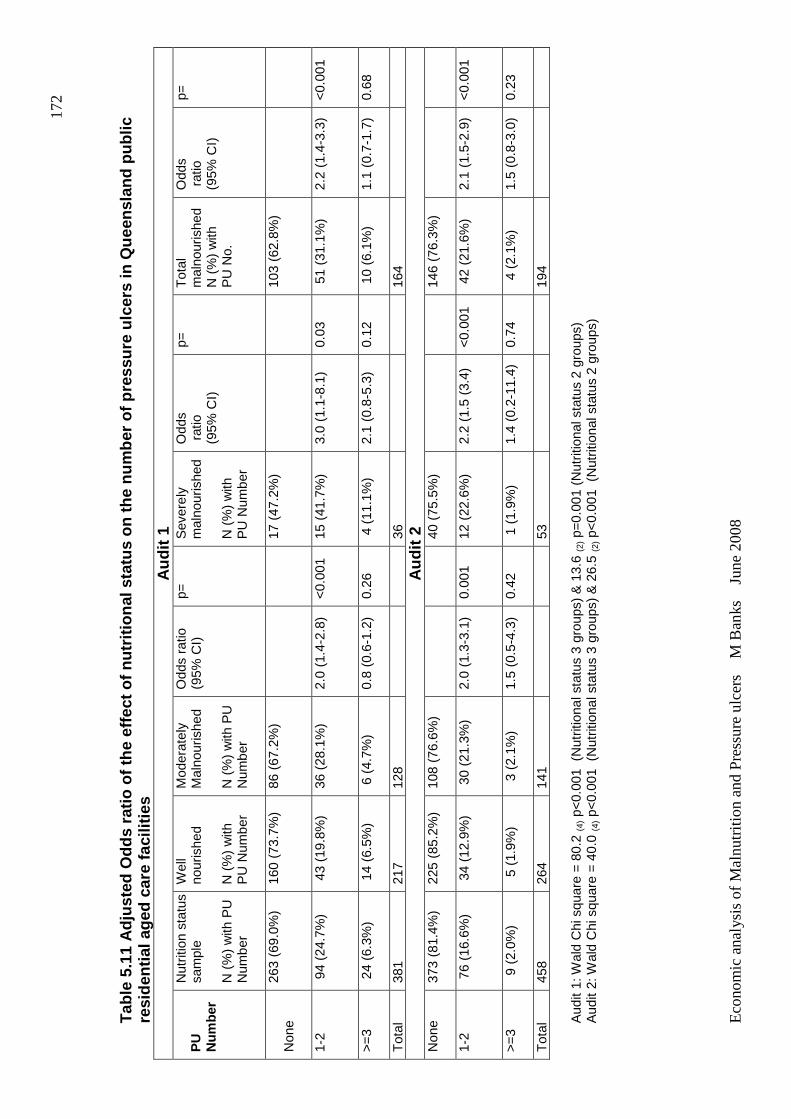
Eco
nom
ic a
naly
sis
of M
aln
utrit
ion
and
Pre
ssur
e ul
cers
M
Ban
ks
Jun
e 2
008
172
Tab
le 5
.11
Adj
uste
d O
dds
ratio
of t
he e
ffect
of n
utrit
iona
l sta
tus
on th
e nu
mbe
r of
pre
ssur
e ul
cers
in Q
ueen
slan
d pu
blic
re
side
ntia
l age
d ca
re fa
cilit
ies
A
udit
1 P
U
Num
ber
Nut
ritio
n st
atus
sa
mpl
e
N (
%)
with
PU
N
umbe
r
Wel
l no
uris
hed
N
(%
) w
ith
PU
Num
ber
Mod
erat
ely
Mal
nour
ishe
d
N (
%)
with
PU
N
umbe
r
Odd
s ra
tio
(95%
CI)
p=
S
ever
ely
mal
nour
ishe
d
N (
%)
with
P
U N
umbe
r
Odd
s r
atio
(9
5% C
I)
p=
Tot
al
mal
nour
ishe
d N
(%
) w
ith
PU
No.
Odd
s r
atio
(9
5% C
I)
p=
Non
e
263
(69.
0%)
160
(73.
7%)
86 (
67.2
%)
17 (
47.2
%)
103
(62.
8%)
1-2
94
(24.
7%)
43
(19.
8%)
36 (
28.1
%)
2.0
(1.4
-2.8
) <
0.00
1 15
(41
.7%
) 3.
0 (1
.1-8
.1)
0.03
5
1 (3
1.1%
) 2.
2 (1
.4-3
.3)
<0.
001
>=
3
24
(6.3
%)
14
(6.5
%)
6 (
4.7%
) 0.
8 (0
.6-1
.2)
0.26
4
(11
.1%
) 2.
1 (0
.8-5
.3)
0.12
1
0 (6
.1%
) 1.
1 (0
.7-1
.7)
0.68
Tot
al
381
217
128
36
164
Aud
it 2
Non
e
373
(81.
4%)
225
(85.
2%)
108
(76.
6%)
40 (
75.5
%)
146
(76.
3%)
1-2
76
(16.
6%)
34
(12.
9%)
30
(21.
3%)
2.0
(1.3
-3.1
) 0.
001
12 (
22.6
%)
2.2
(1.5
(3.
4)
<0.
001
42
(21.
6%)
2.1
(1.5
-2.9
) <
0.00
1
>=
3
9 (
2.0%
) 5
(1.
9%)
3 (
2.1%
) 1.
5 (0
.5-4
.3)
0.42
1
(1.
9%)
1.4
(0.2
-11.
4)
0.74
4
(2.
1%)
1.5
(0.8
-3.0
) 0.
23
Tot
al
458
264
141
53
194
Aud
it 1:
Wal
d C
hi s
quar
e =
80.
2 (4
) p<
0.00
1 (
Nut
ritio
nal s
tatu
s 3
grou
ps)
& 1
3.6
(2) p
=0.
001
(Nut
ritio
nal s
tatu
s 2
grou
ps)
A
udit
2: W
ald
Chi
squ
are
= 4
0.0
(4) p
<0.
001
(N
utrit
iona
l sta
tus
3 gr
oups
) &
26.
5 (2
) p<
0.00
1 (
Nut
ritio
nal s
tatu
s 2
grou
ps)
Economic analysis of Malnutrition and Pressure ulcers M Banks June 2008
173
CHAPTER 6 RESULTS – THE ECONOMIC MODELLING STUDIES (OBJECTIVE 3 AND 4)
This chapter describes the results of the economic modeling studies,
Objective 3 and 4.
6.1 OBJECTIVE 3: To estimate the economic conseque nces of
malnutrition, by determining the excess length of h ospital stay and cost
arising from pressure ulcers that are attributable to malnutrition in the
hospital population.
Results for the values and distributions determined for input parameters for
the model are presented initially, followed by the results for the outputs of the
model.
6.1.1 Values for model input parameters:
A. The number of relevant discharges from Queensland public hospitals
2002/2003
There were 241 415 discharges from Queensland public hospitals in
2002/2003 considered to be relevant for inclusion in the model, due to the
potential to have an increased length of stay in the event of the occurrence of
pressure ulcers. This included all overnight separations except mental
health, maternity and paediatric patients.
B. The incidence of PU in Queensland public hospitals
There were 81 cases of pressure ulcer observed develop during
hospitalization in 1747 individuals, (incidence rate of 4.6%), discharged from
a Queensland tertiary public hospital in a defined three month period during
2002/2003 (Graves et al., 2005a). The values for α and β used to specify the
Beta distribution were therefore 81 and 1666, respectively. See Appendix 3A
for a graph of ‘the incidence of pressure ulcer’ input distribution.
C. The attributable fraction of malnutrition in the development of PU
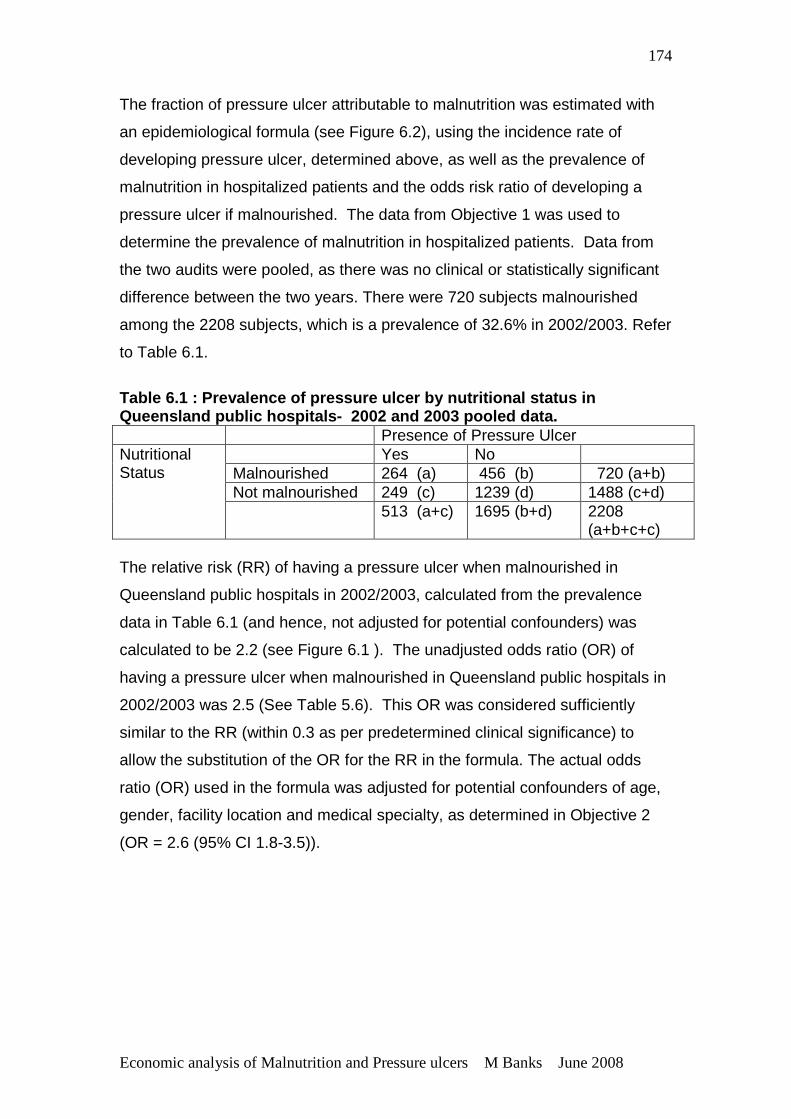
Economic analysis of Malnutrition and Pressure ulcers M Banks June 2008
174
The fraction of pressure ulcer attributable to malnutrition was estimated with
an epidemiological formula (see Figure 6.2), using the incidence rate of
developing pressure ulcer, determined above, as well as the prevalence of
malnutrition in hospitalized patients and the odds risk ratio of developing a
pressure ulcer if malnourished. The data from Objective 1 was used to
determine the prevalence of malnutrition in hospitalized patients. Data from
the two audits were pooled, as there was no clinical or statistically significant
difference between the two years. There were 720 subjects malnourished
among the 2208 subjects, which is a prevalence of 32.6% in 2002/2003. Refer
to Table 6.1.
Table 6.1 : Prevalence of pressure ulcer by nutriti onal status in Queensland public hospitals- 2002 and 2003 pooled data. Presence of Pressure Ulcer
Yes No Malnourished 264 (a) 456 (b) 720 (a+b) Not malnourished 249 (c) 1239 (d) 1488 (c+d)
Nutritional Status
513 (a+c) 1695 (b+d) 2208 (a+b+c+c)
The relative risk (RR) of having a pressure ulcer when malnourished in
Queensland public hospitals in 2002/2003, calculated from the prevalence
data in Table 6.1 (and hence, not adjusted for potential confounders) was
calculated to be 2.2 (see Figure 6.1 ). The unadjusted odds ratio (OR) of
having a pressure ulcer when malnourished in Queensland public hospitals in
2002/2003 was 2.5 (See Table 5.6). This OR was considered sufficiently
similar to the RR (within 0.3 as per predetermined clinical significance) to
allow the substitution of the OR for the RR in the formula. The actual odds
ratio (OR) used in the formula was adjusted for potential confounders of age,
gender, facility location and medical specialty, as determined in Objective 2
(OR = 2.6 (95% CI 1.8-3.5)).
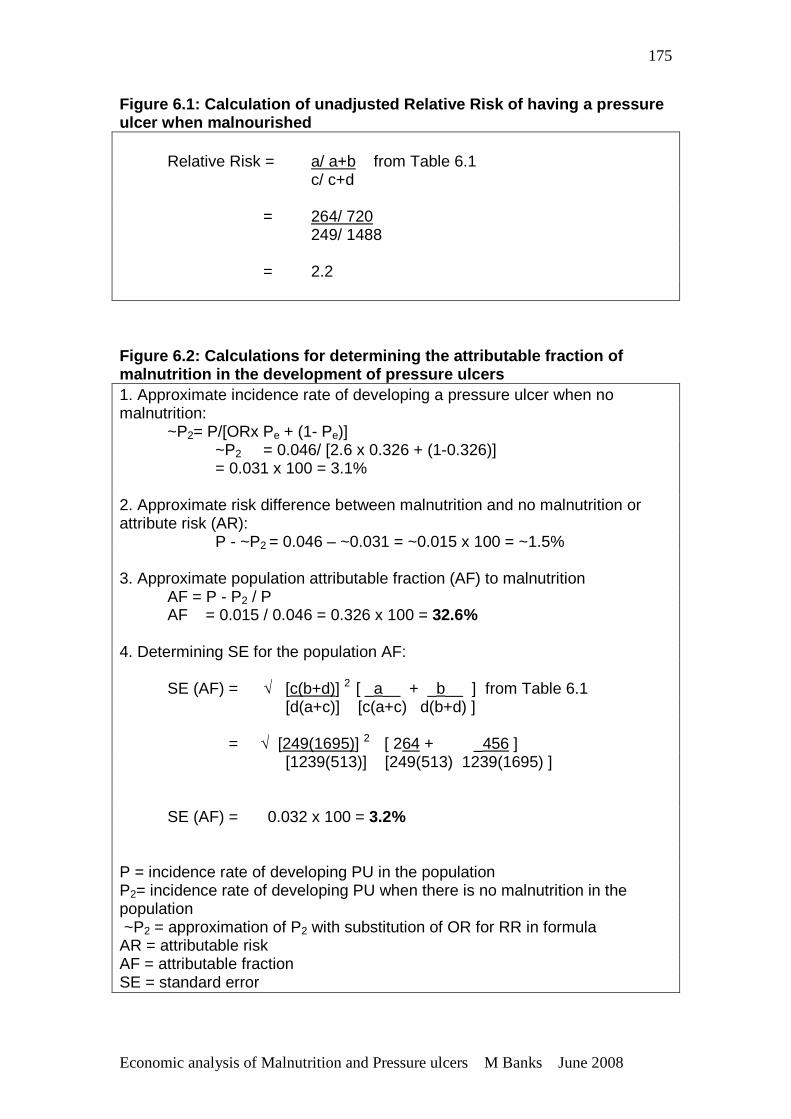
Economic analysis of Malnutrition and Pressure ulcers M Banks June 2008
175
Figure 6.1: Calculation of unadjusted Relative Risk of having a pressure ulcer when malnourished Relative Risk = a/ a+b from Table 6.1 c/ c+d = 264/ 720 249/ 1488 = 2.2
Figure 6.2: Calculations for determining the attrib utable fraction of malnutrition in the development of pressure ulcers 1. Approximate incidence rate of developing a pressure ulcer when no malnutrition: ~P2= P/[ORx Pe + (1- Pe)] ~P2 = 0.046/ [2.6 x 0.326 + (1-0.326)] = 0.031 x 100 = 3.1% 2. Approximate risk difference between malnutrition and no malnutrition or attribute risk (AR): P - ~P2 = 0.046 – ~0.031 = ~0.015 x 100 = ~1.5% 3. Approximate population attributable fraction (AF) to malnutrition AF = P - P2 / P AF = 0.015 / 0.046 = 0.326 x 100 = 32.6% 4. Determining SE for the population AF: SE (AF) = √ [c(b+d)] 2 [ _a__ + _b__ ] from Table 6.1 [d(a+c)] [c(a+c) d(b+d) ] = √ [249(1695)] 2 [ 264 + _456 ] [1239(513)] [249(513) 1239(1695) ] SE (AF) = 0.032 x 100 = 3.2% P = incidence rate of developing PU in the population P2= incidence rate of developing PU when there is no malnutrition in the population ~P2 = approximation of P2 with substitution of OR for RR in formula AR = attributable risk AF = attributable fraction SE = standard error
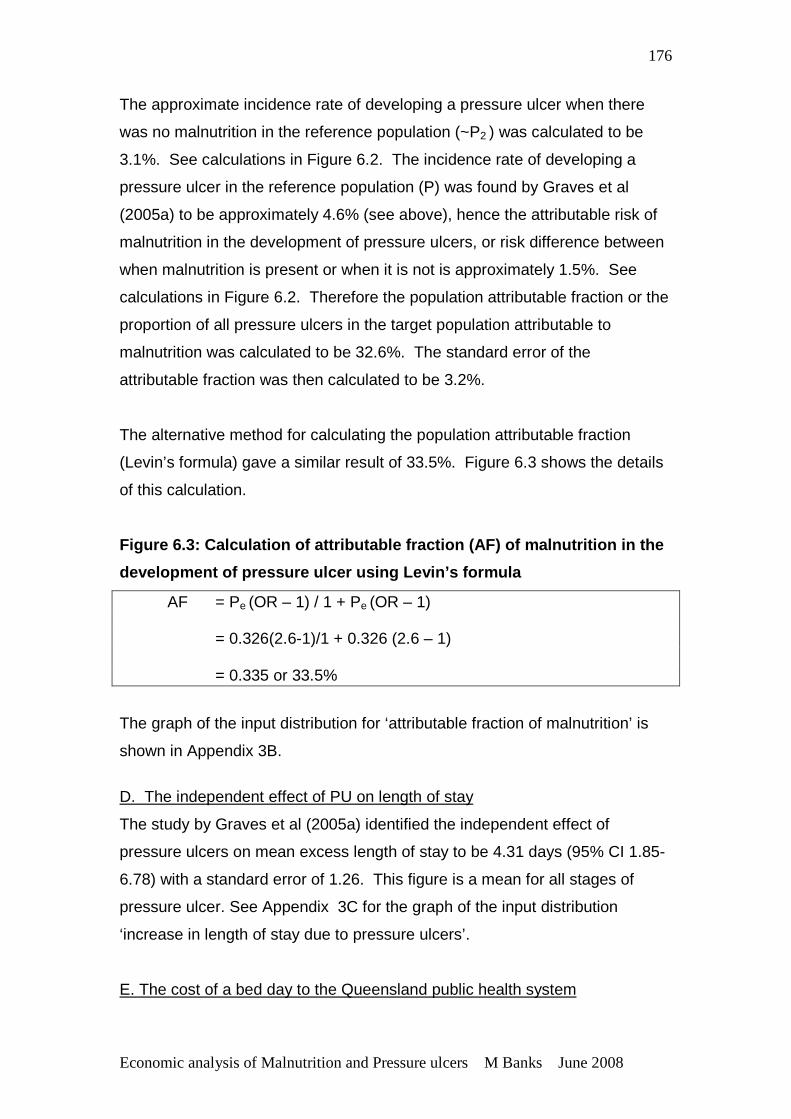
Economic analysis of Malnutrition and Pressure ulcers M Banks June 2008
176
The approximate incidence rate of developing a pressure ulcer when there
was no malnutrition in the reference population (~P2 ) was calculated to be
3.1%. See calculations in Figure 6.2. The incidence rate of developing a
pressure ulcer in the reference population (P) was found by Graves et al
(2005a) to be approximately 4.6% (see above), hence the attributable risk of
malnutrition in the development of pressure ulcers, or risk difference between
when malnutrition is present or when it is not is approximately 1.5%. See
calculations in Figure 6.2. Therefore the population attributable fraction or the
proportion of all pressure ulcers in the target population attributable to
malnutrition was calculated to be 32.6%. The standard error of the
attributable fraction was then calculated to be 3.2%.
The alternative method for calculating the population attributable fraction
(Levin’s formula) gave a similar result of 33.5%. Figure 6.3 shows the details
of this calculation.
Figure 6.3: Calculation of attributable fraction (A F) of malnutrition in the
development of pressure ulcer using Levin’s formula
AF = Pe (OR – 1) / 1 + Pe (OR – 1) = 0.326(2.6-1)/1 + 0.326 (2.6 – 1) = 0.335 or 33.5%
The graph of the input distribution for ‘attributable fraction of malnutrition’ is
shown in Appendix 3B.
D. The independent effect of PU on length of stay
The study by Graves et al (2005a) identified the independent effect of
pressure ulcers on mean excess length of stay to be 4.31 days (95% CI 1.85-
6.78) with a standard error of 1.26. This figure is a mean for all stages of
pressure ulcer. See Appendix 3C for the graph of the input distribution
‘increase in length of stay due to pressure ulcers’.
E. The cost of a bed day to the Queensland public health system
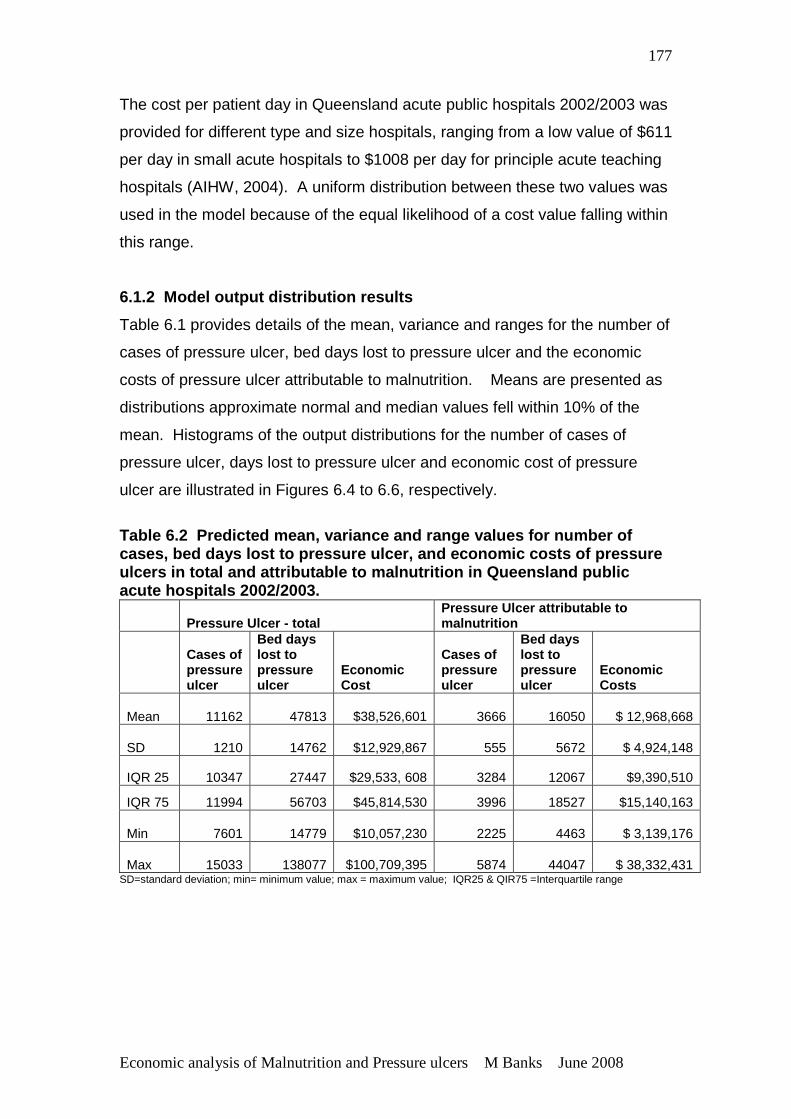
Economic analysis of Malnutrition and Pressure ulcers M Banks June 2008
177
The cost per patient day in Queensland acute public hospitals 2002/2003 was
provided for different type and size hospitals, ranging from a low value of $611
per day in small acute hospitals to $1008 per day for principle acute teaching
hospitals (AIHW, 2004). A uniform distribution between these two values was
used in the model because of the equal likelihood of a cost value falling within
this range.
6.1.2 Model output distribution results
Table 6.1 provides details of the mean, variance and ranges for the number of
cases of pressure ulcer, bed days lost to pressure ulcer and the economic
costs of pressure ulcer attributable to malnutrition. Means are presented as
distributions approximate normal and median values fell within 10% of the
mean. Histograms of the output distributions for the number of cases of
pressure ulcer, days lost to pressure ulcer and economic cost of pressure
ulcer are illustrated in Figures 6.4 to 6.6, respectively.
Table 6.2 Predicted mean, variance and range value s for number of cases, bed days lost to pressure ulcer, and economi c costs of pressure ulcers in total and attributable to malnutrition in Queensland public acute hospitals 2002/2003.
Pressure Ulcer - total Pressure Ulcer attributable to malnutrition
Cases of pressure ulcer
Bed days lost to pressure ulcer
Economic Cost
Cases of pressure ulcer
Bed days lost to pressure ulcer
Economic Costs
Mean 11162 47813
$38,526,601 3666 16050 $ 12,968,668
SD 1210 14762
$12,929,867 555 5672 $ 4,924,148
IQR 25 10347 27447 $29,533, 608 3284 12067 $9,390,510
IQR 75 11994 56703 $45,814,530 3996 18527 $15,140,163
Min 7601 14779
$10,057,230 2225 4463 $ 3,139,176
Max 15033 138077
$100,709,395 5874 44047 $ 38,332,431 SD=standard deviation; min= minimum value; max = maximum value; IQR25 & QIR75 =Interquartile range
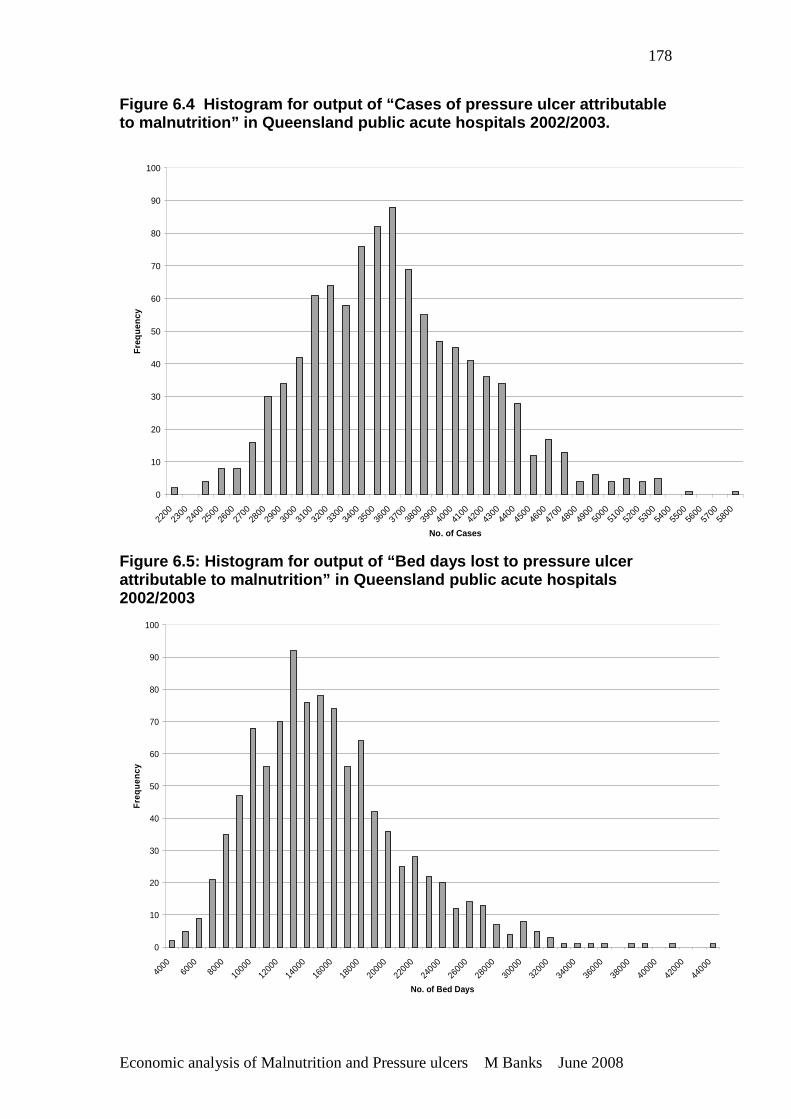
Economic analysis of Malnutrition and Pressure ulcers M Banks June 2008
178
Figure 6.4 Histogram for output of “Cases of pressu re ulcer attributable to malnutrition” in Queensland public acute hospital s 2002/2003.
0
10
20
30
40
50
60
70
80
90
100
2200
2300
2400
2500
2600
2700
2800
2900
3000
3100
3200
3300
3400
3500
3600
3700
3800
3900
4000
4100
4200
4300
4400
4500
4600
4700
4800
4900
5000
5100
5200
5300
5400
5500
5600
5700
5800
No. of Cases
Fre
quen
cy
Figure 6.5: Histogram for output of “Bed days lost t o pressure ulcer attributable to malnutrition” in Queensland public a cute hospitals 2002/2003
0
10
20
30
40
50
60
70
80
90
100
4000
6000
8000
10000
1200
0
14000
16000
1800
0
2000
0
22000
24000
2600
0
28000
30000
3200
0
3400
0
36000
3800
0
40000
4200
0
44000
No. of Bed Days
Fre
quen
cy
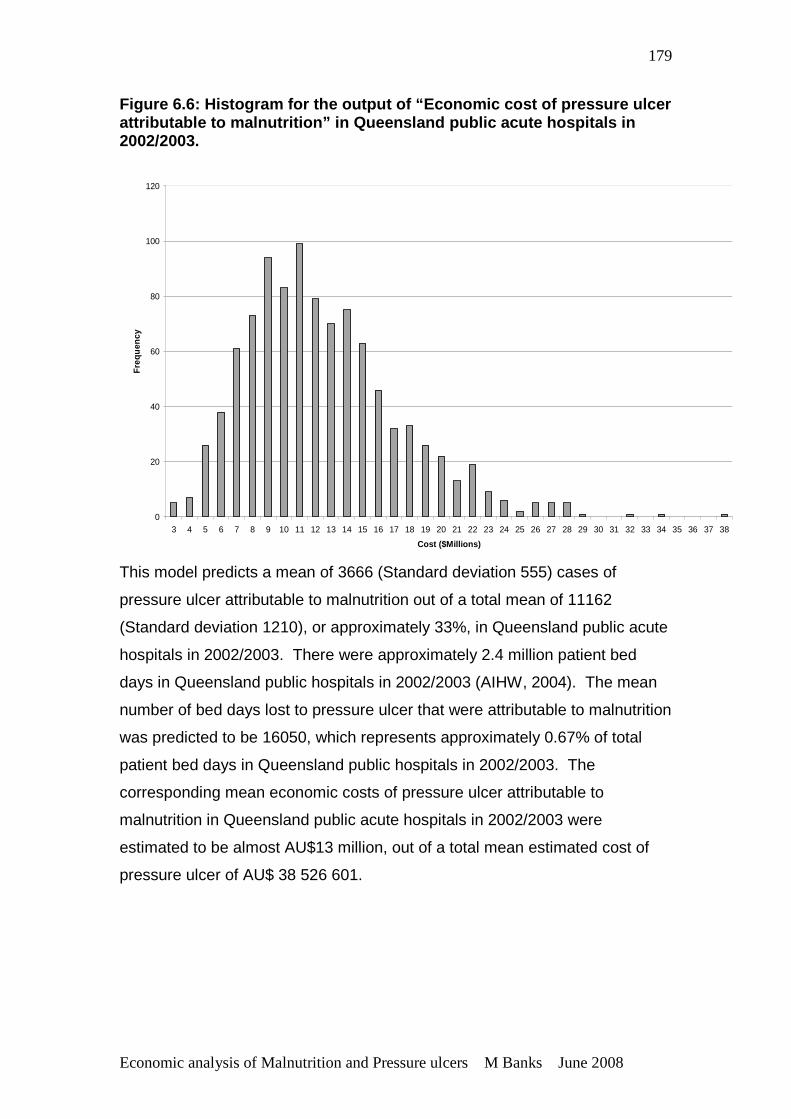
Economic analysis of Malnutrition and Pressure ulcers M Banks June 2008
179
Figure 6.6: Histogram for the output of “Economic c ost of pressure ulcer attributable to malnutrition” in Queensland public a cute hospitals in 2002/2003.
0
20
40
60
80
100
120
3 4 5 6 7 8 9 10 11 12 13 14 15 16 17 18 19 20 21 22 23 24 25 26 27 28 29 30 31 32 33 34 35 36 37 38
Cost ($Millions)
Fre
quen
cy
This model predicts a mean of 3666 (Standard deviation 555) cases of
pressure ulcer attributable to malnutrition out of a total mean of 11162
(Standard deviation 1210), or approximately 33%, in Queensland public acute
hospitals in 2002/2003. There were approximately 2.4 million patient bed
days in Queensland public hospitals in 2002/2003 (AIHW, 2004). The mean
number of bed days lost to pressure ulcer that were attributable to malnutrition
was predicted to be 16050, which represents approximately 0.67% of total
patient bed days in Queensland public hospitals in 2002/2003. The
corresponding mean economic costs of pressure ulcer attributable to
malnutrition in Queensland public acute hospitals in 2002/2003 were
estimated to be almost AU$13 million, out of a total mean estimated cost of
pressure ulcer of AU$ 38 526 601.
Economic analysis of Malnutrition and Pressure ulcers M Banks June 2008
180
6.2 OBJECTIVE 4 To estimate the economic outcomes of an
intervention that provides intensive nutrition supp ort to nutritionally at
risk patients in hospital, where ‘cases of pressure ulcer avoided’,
‘number of bed days not lost to pressure ulcer’ and ‘economic costs’ are
the relevant outcomes.
This model was based on the same population as Objective 3, but this time
explored the outcomes if an intensive nutrition support intervention was
provided to patients at risk of developing a pressure ulcer; hence many of the
input parameters were the same as for Objective 3.
Results for the values and distributions determined for input parameters for
the model are again presented initially, followed by the results for the outputs
of the model.
6.2.1 Values for model input parameters:
The values for input parameters A, B, D, and E are as per Objective 3.
F. Change in risk of developing a pressure ulcer associated with intensive
nutrition support
The odds ratio of developing a pressure ulcer with an intervention of intensive
nutrition support compared with standard care was determined to be 0.74
(95% Confidence Interval 0.62-0.88) using data from five randomized
controlled trials involving 1325 patients (Stratton et al., 2005). The standard
error of the odds ratio, calculated from the 95% confidence intervals was
0.066 (standard error = 95% confidence interval – OR/ 1.96). A graph of the
lognormal distribution of the odds ratio is shown in Appendix 3D however,
each resample was then transformed back by taking the exponent to provide
the risk of developing a pressure ulcer associated with intensive nutrition
support. The actual ‘risk reduction’ was the value of the risk subtracted from
1.0.
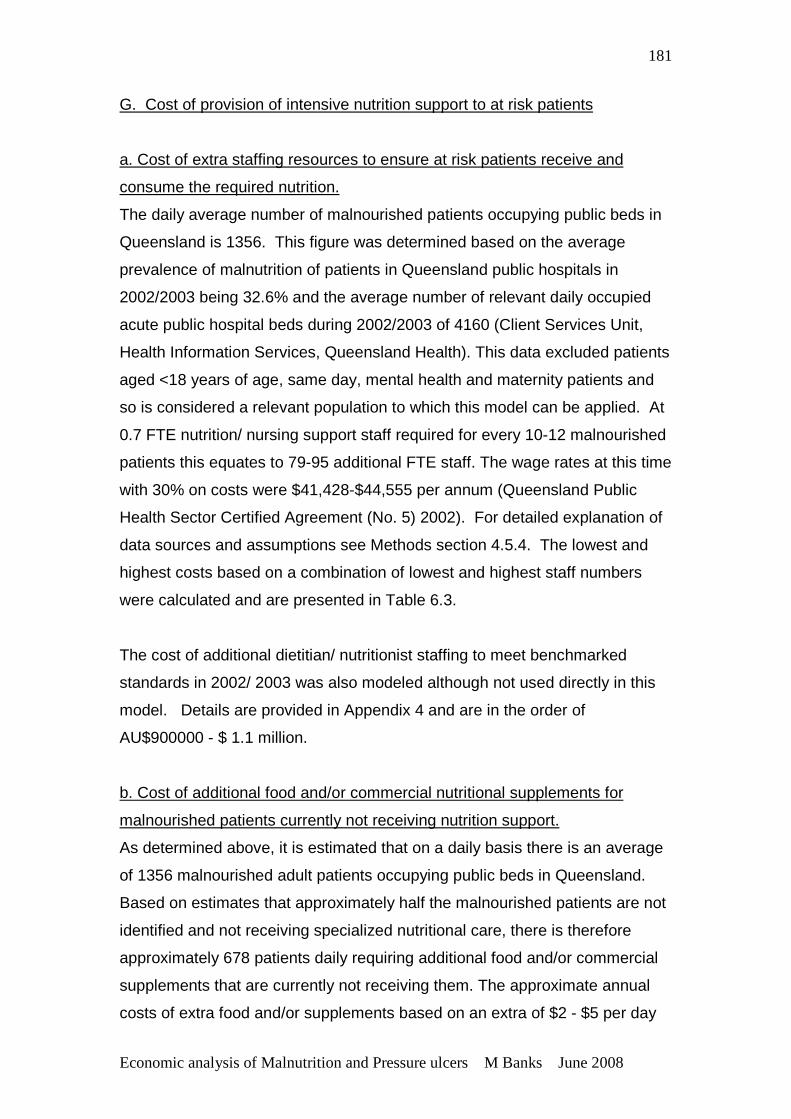
Economic analysis of Malnutrition and Pressure ulcers M Banks June 2008
181
G. Cost of provision of intensive nutrition support to at risk patients
a. Cost of extra staffing resources to ensure at risk patients receive and
consume the required nutrition.
The daily average number of malnourished patients occupying public beds in
Queensland is 1356. This figure was determined based on the average
prevalence of malnutrition of patients in Queensland public hospitals in
2002/2003 being 32.6% and the average number of relevant daily occupied
acute public hospital beds during 2002/2003 of 4160 (Client Services Unit,
Health Information Services, Queensland Health). This data excluded patients
aged <18 years of age, same day, mental health and maternity patients and
so is considered a relevant population to which this model can be applied. At
0.7 FTE nutrition/ nursing support staff required for every 10-12 malnourished
patients this equates to 79-95 additional FTE staff. The wage rates at this time
with 30% on costs were $41,428-$44,555 per annum (Queensland Public
Health Sector Certified Agreement (No. 5) 2002). For detailed explanation of
data sources and assumptions see Methods section 4.5.4. The lowest and
highest costs based on a combination of lowest and highest staff numbers
were calculated and are presented in Table 6.3.
The cost of additional dietitian/ nutritionist staffing to meet benchmarked
standards in 2002/ 2003 was also modeled although not used directly in this
model. Details are provided in Appendix 4 and are in the order of
AU$900000 - $ 1.1 million.
b. Cost of additional food and/or commercial nutritional supplements for
malnourished patients currently not receiving nutrition support.
As determined above, it is estimated that on a daily basis there is an average
of 1356 malnourished adult patients occupying public beds in Queensland.
Based on estimates that approximately half the malnourished patients are not
identified and not receiving specialized nutritional care, there is therefore
approximately 678 patients daily requiring additional food and/or commercial
supplements that are currently not receiving them. The approximate annual
costs of extra food and/or supplements based on an extra of $2 - $5 per day
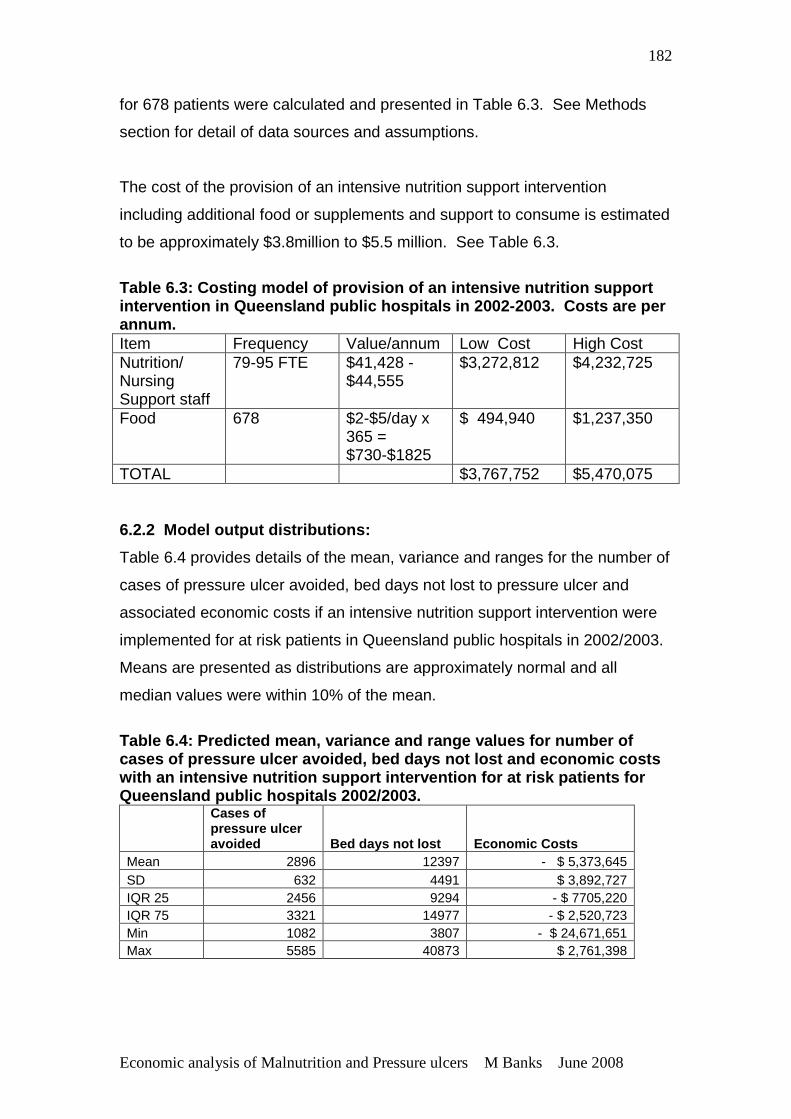
Economic analysis of Malnutrition and Pressure ulcers M Banks June 2008
182
for 678 patients were calculated and presented in Table 6.3. See Methods
section for detail of data sources and assumptions.
The cost of the provision of an intensive nutrition support intervention
including additional food or supplements and support to consume is estimated
to be approximately $3.8million to $5.5 million. See Table 6.3.
Table 6.3: Costing model of provision of an intensi ve nutrition support intervention in Queensland public hospitals in 2002 -2003. Costs are per annum. Item Frequency Value/annum Low Cost High Cost Nutrition/ Nursing Support staff
79-95 FTE $41,428 - $44,555
$3,272,812 $4,232,725
Food 678 $2-$5/day x 365 = $730-$1825
$ 494,940 $1,237,350
TOTAL $3,767,752 $5,470,075 6.2.2 Model output distributions:
Table 6.4 provides details of the mean, variance and ranges for the number of
cases of pressure ulcer avoided, bed days not lost to pressure ulcer and
associated economic costs if an intensive nutrition support intervention were
implemented for at risk patients in Queensland public hospitals in 2002/2003.
Means are presented as distributions are approximately normal and all
median values were within 10% of the mean.
Table 6.4: Predicted mean, variance and range value s for number of cases of pressure ulcer avoided, bed days not lost and economic costs with an intensive nutrition support intervention fo r at risk patients for Queensland public hospitals 2002/2003.
Cases of pressure ulcer avoided Bed days not lost Economic Costs
Mean 2896 12397 - $ 5,373,645 SD 632 4491 $ 3,892,727 IQR 25 2456 9294 - $ 7705,220 IQR 75 3321 14977 - $ 2,520,723 Min 1082 3807 - $ 24,671,651 Max 5585 40873 $ 2,761,398
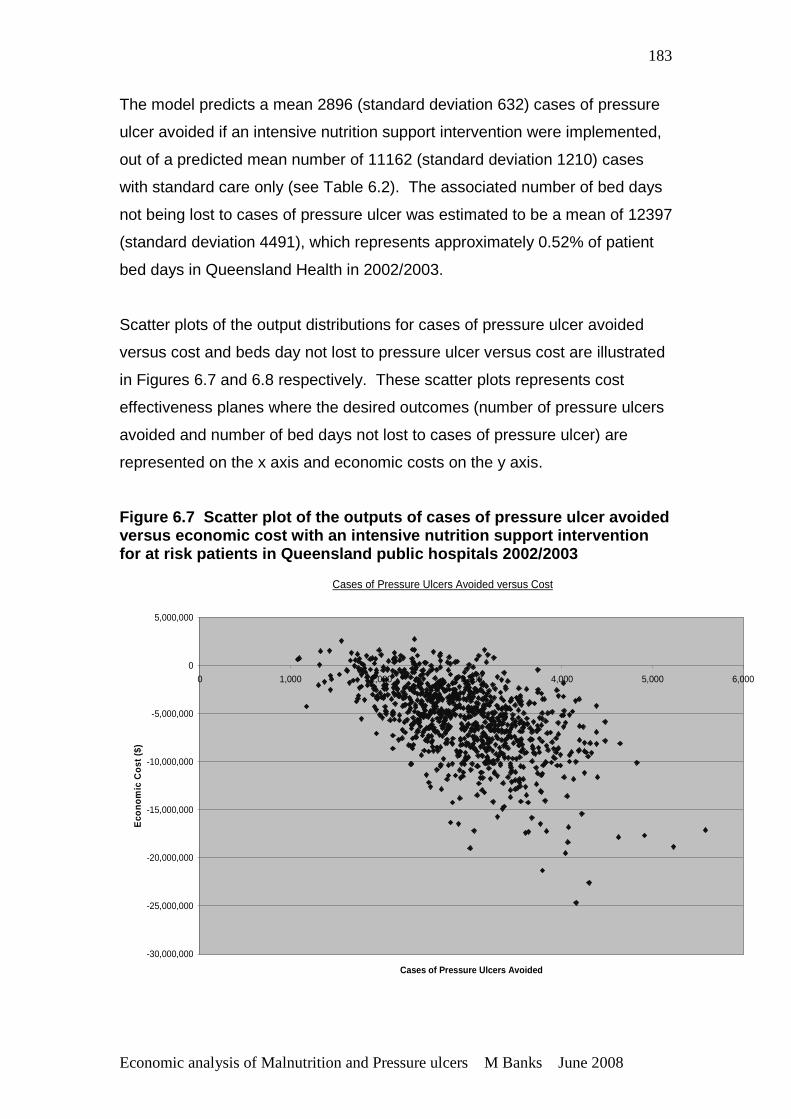
Economic analysis of Malnutrition and Pressure ulcers M Banks June 2008
183
The model predicts a mean 2896 (standard deviation 632) cases of pressure
ulcer avoided if an intensive nutrition support intervention were implemented,
out of a predicted mean number of 11162 (standard deviation 1210) cases
with standard care only (see Table 6.2). The associated number of bed days
not being lost to cases of pressure ulcer was estimated to be a mean of 12397
(standard deviation 4491), which represents approximately 0.52% of patient
bed days in Queensland Health in 2002/2003.
Scatter plots of the output distributions for cases of pressure ulcer avoided
versus cost and beds day not lost to pressure ulcer versus cost are illustrated
in Figures 6.7 and 6.8 respectively. These scatter plots represents cost
effectiveness planes where the desired outcomes (number of pressure ulcers
avoided and number of bed days not lost to cases of pressure ulcer) are
represented on the x axis and economic costs on the y axis.
Figure 6.7 Scatter plot of the outputs of cases of pressure ulcer avoided versus economic cost with an intensive nutrition su pport intervention for at risk patients in Queensland public hospitals 2002/2003
Cases of Pressure Ulcers Avoided versus Cost
-30,000,000
-25,000,000
-20,000,000
-15,000,000
-10,000,000
-5,000,000
0
5,000,000
0 1,000 2,000 3,000 4,000 5,000 6,000
Cases of Pressure Ulcers Avoided
Eco
nom
ic C
ost (
$)
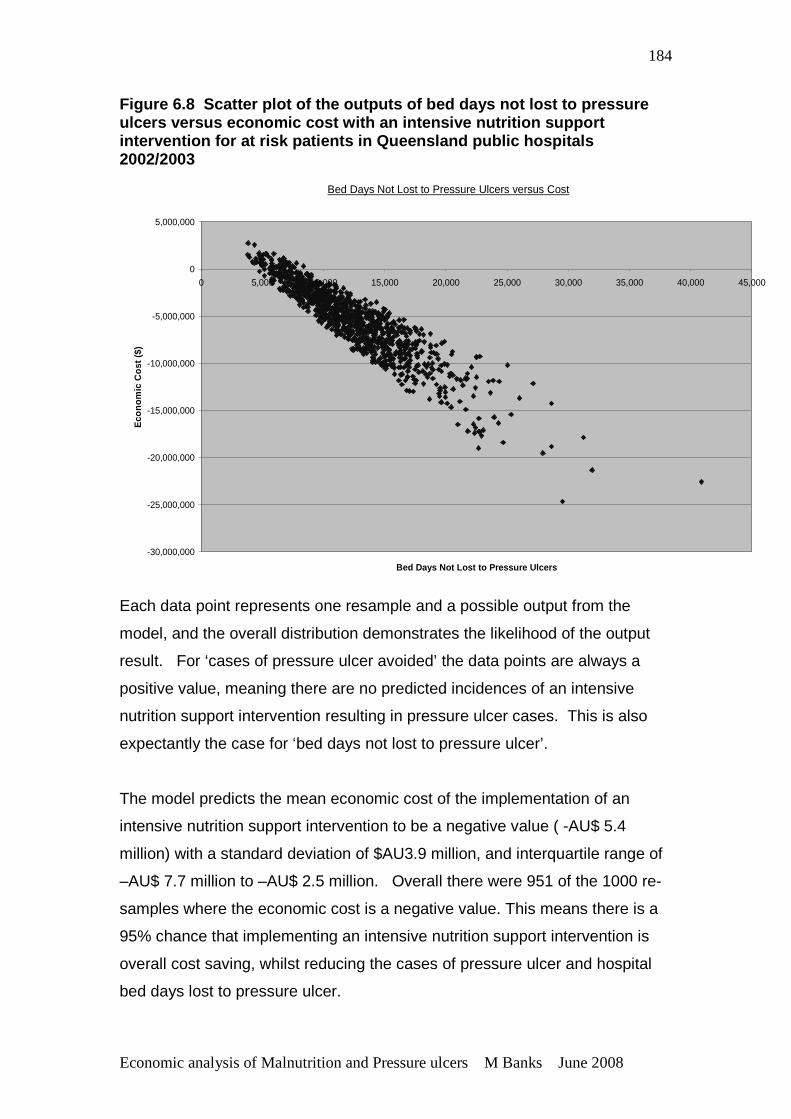
Economic analysis of Malnutrition and Pressure ulcers M Banks June 2008
184
Figure 6.8 Scatter plot of the outputs of bed days not lost to pressure ulcers versus economic cost with an intensive nutri tion support intervention for at risk patients in Queensland pub lic hospitals 2002/2003
Bed Days Not Lost to Pressure Ulcers versus Cost
-30,000,000
-25,000,000
-20,000,000
-15,000,000
-10,000,000
-5,000,000
0
5,000,000
0 5,000 10,000 15,000 20,000 25,000 30,000 35,000 40,000 45,000
Bed Days Not Lost to Pressure Ulcers
Eco
nom
ic C
ost (
$)
Each data point represents one resample and a possible output from the
model, and the overall distribution demonstrates the likelihood of the output
result. For ‘cases of pressure ulcer avoided’ the data points are always a
positive value, meaning there are no predicted incidences of an intensive
nutrition support intervention resulting in pressure ulcer cases. This is also
expectantly the case for ‘bed days not lost to pressure ulcer’.
The model predicts the mean economic cost of the implementation of an
intensive nutrition support intervention to be a negative value ( -AU$ 5.4
million) with a standard deviation of $AU3.9 million, and interquartile range of
–AU$ 7.7 million to –AU$ 2.5 million. Overall there were 951 of the 1000 re-
samples where the economic cost is a negative value. This means there is a
95% chance that implementing an intensive nutrition support intervention is
overall cost saving, whilst reducing the cases of pressure ulcer and hospital
bed days lost to pressure ulcer.
Economic analysis of Malnutrition and Pressure ulcers M Banks June 2008
185
CHAPTER 7 DISCUSSION, STRENGTHS, LIMITATIONS, CONCLUSIONS AND RECOMMENDATIONS 7.1 OVERVIEW OF CHAPTER
This research program aimed to address the following aims and associated
objectives:
1. Determine the prevalence of malnutrition, factors associated with
malnutrition and its association with pressure ulcers in Queensland Health
hospitals and residential aged care facilities.
This aim was addressed by Objectives 1 and 2.
2. Estimate the economic consequences of malnutrition by determining the
cost arising from pressure ulcers attributable to malnutrition; and the
economic outcomes of intervention to address malnutrition, in the prevention
of pressure ulcers in hospitals.
This aim was addressed by Objectives 3 and 4.
This chapter provides an overall discussion of how the findings of the four
studies address the aims and objectives of the research program. The
significance of the research is discussed in light of its contribution to the
current body of knowledge. This chapter also provides a discussion of the
strengths and limitations of the studies, conclusions of the research program
and recommendations for practice and future research.
Economic analysis of Malnutrition and Pressure ulcers M Banks June 2008
186
7.2 DISCUSSION OF STUDY AIMS AND OBJECTIVES FINDIN GS
7.2.1 Objective 1: To determine the prevalence of malnutrition in
Queensland public acute and residential aged care f acilities, and identify
variables which may be associated with malnutrition in these
populations .
Prevalence of Malnutrition in Queensland Hospitals and Residential
Aged Care Facilities
In this observational multi-centre study, the mean prevalence of malnutrition
was 34.7 + 4.0% and 31.4+9.5% of over 2200 patients in 20 acute hospitals;
and a median of 50.0% (11.1-56.6%) and 49.2% (13.9-53.7%) of over 800
residents in six residential aged care public facilities in Queensland (Table
5.4).
These results are consistent with other recent multi-centre studies conducted
overseas using a variety of nutrition assessment methodologies (Barreto
Penie, 2005, Braunschweig et al., 2000, Correia and Campos, 2003,
Dzieniszewski et al., 2005, Edington et al., 2000, Kondrup et al., 2002, Kyle et
al., 2003, Olmos et al., 2005, Pirlich et al., 2006, Planas et al., 2004,
Suominen et al., 2005, Waitzberg et al., 2001, Wyszynski et al., 2003). A
feature of this study compared to other multi-centre studies however is the
determination of weighted average percentages of nutritional status
classifications across facilities instead of a single overall mean figure. This
has provided valuable information on the actual variation in prevalence of
malnutrition between sites, and for acute facilities, allowed the determination
of standard deviations around the mean providing more detail about the likely
variation and hence increasing the robustness of the results. Whilst there was
considerable variation in prevalence of malnutrition between sites, this
variation was largely due to a small number of sites, and the standard
deviations around the mean values for both audits allows a prediction that the
prevalence of malnutrition in acute hospitals in Queensland is highly likely to
be between 22-40%.
Economic analysis of Malnutrition and Pressure ulcers M Banks June 2008
187
The prevalence of malnutrition found in the acute hospital setting is overall
similar to other cross sectional prevalence studies in the literature. In
Australian studies where cross sectional assessments were conducted using
the SGA, the prevalence rates were 36% (Middleton et al, 2001) and 42%
(Lazarus and Hamlyn, 2005), compared to prevalence rates where
assessment had been carried out at admission being 17% (Ferguson et al,
1997) and 12% (Beck et al, 2001). However, the prevalence of malnutrition
found in this study is considerably lower when compared to multi-centre cross
sectional prevalence studies using SGA from overseas, where prevalence
rates have been found to be closer to 50% (Waitzberg et al, 2001, 48% Brazil;
Wyszynski et al, 2003, 47% Argentina; Correia and Campos, 2003, 50%, Latin
America; Olmos et al, 2005, 47%, Spain). The lower prevalence found in this
study is most likely explained by differences in patient populations and
healthcare systems between Australia and these particular countries.
Without similar comparisons being able to be made with countries such as the
USA, UK or other like European countries, it is difficult to generalise that the
prevalence of malnutrition in hospitals, whilst still high, is lower than in other
countries.
Cross sectional prevalence of malnutrition would be expected to be higher as
malnourished patients have longer lengths of hospital stay and so an
‘accumulation’ of malnourished patients is likely (Allison, 2000). A multi centre
study using SGA conducted in Cuba found hospital malnutrition rates
increased in a linear fashion as the surveyed patients accumulated more days
of hospitalisation. The researchers found 36.8% of patients surveyed within
24 hours of admission to be malnourished, increasing to a prevalence of
49.7% if patients had been surveyed after more than 30 days of admission
(Barreto Penie, 2005). In addition, as discussed in detail in the literature
review, a number of studies have also found deterioration in nutritional status
in a large proportion of hospitalised patients over the course of their admission
(Braunschweig et al., 2000, Bruun et al., 1999, Dzieniszewski et al., 2005,
Gariballa, 2001, Incalzi et al., 1998, Kondrup et al., 2002, McWhirter and
Pennington, 1994, Pinchcofsky and Kaminski, 1985, Sullivan et al., 1999,
Economic analysis of Malnutrition and Pressure ulcers M Banks June 2008
188
Weinsier et al., 1979), which would also contribute to a higher prevalence of
malnutrition in cross sectional studies.
The prevalence of malnutrition found in the residential aged care setting in this
study is not dissimilar to the other published studies conducted in this setting,
with results ranging from 26% to 89% (see Table 2.1) (Leslie et al., 2006,
Ruiz-Lopez et al., 2003, Sacks et al., 2000, Suominen et al., 2005, Woo et al.,
2005). However, direct comparison cannot be made with other studies due to
different nutrition assessment methodology and/or the timing of assessments.
The only located published study also using the SGA in this setting found 70%
of 53 residents to be malnourished within two weeks of admission to a USA
aged care facility (Sacks et al., 2000). This level of malnutrition is
considerably higher than in the current study, and was conducted near
admission, therefore it might be expected that if a cross sectional study was
conducted the prevalence would have been higher. Therefore a generalisation
about the prevalence of malnutrition in Queensland residential aged care
facilities compared to other countries cannot be made due to a lack of
comparison studies. In addition, in the current study a wide variation in the
prevalence of malnutrition was found between facilities, which was largely due
to only one facility’s results, however as the total number of facilities was
limited (five in each audit), only a median value was able to be reported. This
belies the ability to provide detail about the likely variation expected in the
prevalence of malnutrition in residential aged care facilities. Overall, however
this study found a higher prevalence of malnutrition in residential aged care
facilities than in the acute hospital setting. This would be expected due to the
increased age of this population and the nature of the high prevalence of
illness and frailty of residents, being the main reason for being in a residential
aged care facility.
Compared to other studies conducted in Australia, this study has been
conducted on a large number of cases across multiple facilities including
residential aged care facilities, and therefore provides the first significant
evidence of the extent of malnutrition in public acute and residential aged care
facilities in Australia.
Economic analysis of Malnutrition and Pressure ulcers M Banks June 2008
189
Effect of variables on the presence of malnutrition
In this study, younger age groups had a lower odds risk of being
malnourished, and those over the age of 80 years had a higher odds risk of
being malnourished compared to those aged 61-80 years (Table 5.5). A
number of studies have found that older age groups have a higher prevalence
of malnutrition than younger age groups. In Brazil, hospitalized patients older
than 60 years had a significantly higher prevalence of malnutrition (52.8%)
compared to patients younger than 60 years (44.7%) (Waitzberg et al, 2001).
In a German study, 43% of patients aged 70 years or older were
malnourished compared to only 7.8% of patients less than 30 years old
(Pirlich et al., 2006). As disease prevalence generally increases with age,
rates of associated malnutrition are also likely to increase in older people
(Stratton et al., 2003). As the average age of the study sample was older than
the Queensland Health acute hospital population it is expected that the level
of malnutrition reported here for acute facilities would be higher than for the
Queensland Health acute population in general. This study confirms however
that the risk of malnutrition increases with age and that the nutritional needs of
older people in hospitals and residential aged care facilities requires greater
attention.
Males in residential aged care facilities had a statistically significant higher
odds risk of being malnourished (Table 5.5). This difference however was not
considered clinically significant and contrasts with the findings of two other
studies conducted in the residential aged care settings which found being
female to be associated with an increased risk of malnutrition (Suominen et
al., 2005, Woo et al., 2005). Woo et al. (2005) suggested that perhaps this is
due to greater inactivity compared with men, or greater co-morbidities or
disabilities affecting dietary intake. The association of gender with nutritional
status in the residential aged care setting needs further exploration. There
are no published studies to indicate that gender is associated with an
increased prevalence of malnutrition in hospitalized patients, and the results
of this study found no effect of gender on the prevalence of malnutrition.
Economic analysis of Malnutrition and Pressure ulcers M Banks June 2008
190
The odds risk of being malnourished was lower in regional and rural or remote
facilities (Table 5.5). Other studies have noted that the prevalence of
malnutrition to be higher in tertiary or teaching hospitals than general
hospitals. In a multi-centre study conducted in UK hospitals, the prevalence
of malnutrition was significantly higher in teaching hospitals (22.4%)
compared with district general hospitals (16.5%) (p=0.03) (Edington et al.,
2000). This is most likely due to the greater acuity of disease, which is the
primary cause of malnutrition in developed countries (Corish and Kennedy,
2000). In addition, the generally smaller size of regional and rural or remote
hospitals may afford greater individual attention to patients which may result in
an improved nutritional status. Due to the bias of this study toward
metropolitan (and therefore tertiary) facilities, it is expected the level of
malnutrition reported here for acute facilities would be higher than for the
Queensland public acute population in general. The lower odds risk of being
malnourished from a regional or rural and remote residential aged care facility
compared with a metropolitan facility was not an expected finding as the level
of illness severity would be expected to be the same across nursing homes
regardless of geographical location. This however requires investigation as
insufficient data are available here to make conclusive findings. One facility
reported a very low prevalence of malnutrition compared to all others, and this
facility was from a regional area. The prevalence of malnutrition reported here
for residential aged care facilities may however be an under estimate of the
true prevalence as facilities involved in the study had regular dietetic services,
which should result in better nutrition practices than facilities without regular
access to nutritional expertise.
Malnutrition has been found to be highly prevalent in most illness related
diagnosis groups, but of particular significance in patients with oncological
disease, respiratory disease, gastrointestinal and liver disease, HIV and AIDS,
neurological disease, renal disease, critical illness, orthopaedic and surgical
patients (Sratton et al, 2003). This is most likely due to patients under these
medical specialties overall having greater metabolic stress. Malnutrition was
highly prevalent among cancer patients and extremely frequent after surgical
treatment in cancer patients in a study conducted in Cuba (Barreto Penie,
Economic analysis of Malnutrition and Pressure ulcers M Banks June 2008
191
2005). That study also found a high rate of malnutrition in geriatrics (56.3%),
critical care (54.8%), nephrology (54.3%), internal medicine (48.0%),
gastroenterology (46.5%) and cardiovascular surgery (44.8%). In a recent
study conducted in Germany (Pirlich et al., 2006) the highest prevalence of
malnutrition was observed in geriatrics (56.2%), oncology (37.6%) and
gastroenterology (32.6%). In Australia, Beck et al. (2001) found malnutrition
to be most prevalent in patients with gastrointestinal, respiratory and cancer
illnesses. The current study found, compared to medical patients, that
oncology and critical care patients had a significantly higher odds risk of
patients being malnourished (Table 5.5). Patients in rehabilitation care have
been reported in other studies to have a higher prevalence of malnutrition
(Compan et al., 1999, Middleton et al., 2001, Neumann et al., 2005), however
this was not demonstrated in this study.
Comparison of prevalence of malnutrition between Au dit 1 and 2
There was no difference found in the prevalence of malnutrition between Audit
1 and Audit 2 for both acute and residential aged care facilities. After Audit 1,
pressure ulcer guidelines were introduced into facilities, which included
referral for nutrition assessment and intervention for subjects with, or at high
risk of, pressure ulcers. An unexpected finding was the unchanged
prevalence of malnutrition between the two audits, when it could be expected
that this would reduce with the introduction of these guidelines. The
guidelines implemented across Queensland Health recommended referral to a
dietitian of patients at high risk or with pressure ulcers for nutrition
assessment and intervention. However, a poor referral rate was reported by
the facility dietitians, which could explain why the prevalence of malnutrition
remained unchanged. This poor referral rate was most likely due to the lack
of awareness and recognition of the problem of malnutrition and its
consequences, as discussed in detail in the literature review. Recent
Australian studies (Lazarus and Hamlyn, 2005, Middleton et al., 2001) found a
majority of patients assessed as malnourished had not been previously
identified or were not documented as such, and were not receiving any
specialized nutrition care. Studies investigating the attitudes and practices of
clinicians regarding the provision of nutritional care have highlighted a low
Economic analysis of Malnutrition and Pressure ulcers M Banks June 2008
192
priority being placed on nutritional care by many clinical staff (Lennard-Jones
et al., 1995, Mowe et al., 2006, Rasmussen et al., 1999).
Reasons for the lack of awareness and recognition of malnutrition and the role
of nutritional care in disease management include: limited training and
knowledge of clinical staff; misbelief that malnutrition is an inevitable part of
the disease process and resistant to therapy; failure to regard nutrition as an
important part of care, scarcity of specialist clinical nutrition appointments,
lack of good practice guidelines and nationally agreed standards, lack of
organisation of nutritional services linking relevant disciplines (Corish and
Kennedy, 2000, Green, 1999).
Has anything changed since the 1970s?
Compared to the first reported studies of malnutrition in the 1970s (Bistrian et
al., 1974, Bistrian et al., 1976, Butterworth, 1974, Hill et al., 1977) it appears
little has changed with respect to the recognition and treatment of malnutrition.
However, in the past 30 years there has been an exponential growth in
medical treatments with significant improvements in morbidity and mortality
and life expectancies. During this period there have been similar
improvements in the provision of nutritional care, particularly with the
developments and adoption of enteral and parenteral nutrition products.
Malnutrition in hospitalised patients in the 1970s may have been more likely
due to a lack of medical and nutritional treatments. Malnutrition today
however is more likely due to advancements in medical treatments with the
ability to prolong the lives of individuals. These individuals are then more
likely to be older and sicker, and therefore more likely to develop disease
associated malnutrition. Other changes since the 1970s include changes to
the roles of health practitioners. One example is the nursing profession and
their role with in provision of nutrition and food services. With advances in
medical treatments the nursing role has increasingly had ‘domestic’ duties
such as serving meals to patients removed. However studies show where
nursing staff are not involved in the provision of the meal service, patients
frequently do not receive the assistance they require to consume their meal,
and nursing staff are not aware of patient’s food and fluid intake (Kowanko,
Economic analysis of Malnutrition and Pressure ulcers M Banks June 2008
193
1997, Carr and Mitchell, 1991). At the same time, the provision of food (and
by definition nutrition) services has become ‘de-medicalized’ and become a
hotel service. Allison (2000) stated that one of the major causes of
malnutrition in institutions is the failure to provide adequate nutrition in a form
appropriate for patients. As detailed in the literature review in Section 2.3.3
several studies have found that many patients do not consume enough food,
but many of the factors associated with this have been found to be modifiable.
Economic and system constraints may result in limited choice and often
unpalatable meals served in a way that makes them unappealing and
inaccessible, in difficult to open containers, often out of reach of incapacitated
patients. The lack of flexibility in hospital food services including restricted
mealtimes and lack of availability of food between meals, especially over
night, contributes to the problem (Corish and Kennedy, 2000). A number of
studies in both the hospital and residential aged care settings demonstrate
that changes to the provision of food and nutrition services to better meet
individual requirements and increased encouragement and assistance with
meals can improve nutritional intake (Barton et al., 2000b, Gall et al., 1998,
Joansen et al., 2004, Nijs et al., 2006, Odlund Olin et al., 2003).
Shortened hospital average length of stay has been frequently used to justify
rationalisation of food (and nutrition) services. However in a study conducted
by this author in a Queensland tertiary public hospital found that while only
approximately 22% of patients stayed four days or more, they represented
75% of the hospitals’ overnight occupied bed days, and this patient group had
an average length of stay of 14.0 days. Additionally, approximately 50% of
overnight bed days are occupied by patients staying 14 days or more, and
these patients have an average length of stay of approximately one month (34
days) (Vivanti and Banks, 2007). Therefore, substantial proportions of
hospital occupied bed days are due to patients admitted for time periods far
greater than reflected by average length of stay. It is most likely that this
group of patients have a high degree of illness severity and are at increased
risk of, or malnourished. This study demonstrated that hospital food services
need to refocus their provision of service toward assisting to prevent and treat
malnutrition.
Economic analysis of Malnutrition and Pressure ulcers M Banks June 2008
194
Today’s patients are therefore highly likely to be older and sicker than the
patients of the 1970s, probably requiring a higher level of nutritional care,
however they are less likely to be receiving it (Allison, 2000, Allison, 2001).
Despite the changes in medical care in the past 30 years, what appears to
have not changed is the awareness and recognition of malnutrition and the
role of nutritional care in disease management.
Summary
This large scale multi-centre study has provided substantive evidence that
malnutrition is common in public acute (between 22-40%) and residential
aged care facilities (approximately 50%) in Queensland, with prevalence
being higher in residential aged care facilities. Being malnourished was found
to be significantly associated with: older age groups, metropolitan location
(compared with regional and rural and remote locations) and medical
specialty, in particular, oncology and critical care patients. Action is required
to increase the recognition, prevention and appropriate treatment of
malnutrition especially in higher risk groups such as the elderly.
This is the first multi-centre study of its type to the author’s knowledge
conducted in Australia, and the first to include residential aged care facilities.
Compared to other multi-centre studies conducted overseas, this study
determined weighted average percentages of nutritional status classifications
across facilities instead of a single overall mean figure which allowed the
determination of likely variation in the prevalence of malnutrition and hence
strengthened the robustness of the results.
7.2.2 Objective 2: To determine the effect of nutr itional status on the
presence and severity of pressure ulcers in individ uals
Nutritional status and presence of pressure ulcers
This study found that being malnourished was significantly associated with the
presence of pressure ulcer in individuals, with an adjusted odds risk of having
Economic analysis of Malnutrition and Pressure ulcers M Banks June 2008
195
a pressure ulcer of 2.6 (95% CI 1.8-3.5) in acute facilities and approximately
2.0 (1.9 95%CI 1.3-2.7 and 2.0 95% CI 1.5-2.7) in residential aged care
facilities. For acute facilities the odds risk dramatically increased with severity
of malnutrition from 2.2 (95% CI 1.6-3.0) for moderate malnutrition to 4.8 (95%
CI 3.2-7.2) for severe malnutrition (Table 5.7). The same pattern of increasing
odds risk being associated with the severity of malnutrition was apparent in
residential aged care facilities, but the odds risks were not as high as for the
acute setting (Table 5.7).
This significant association is consistent with the findings of several other
studies, where malnutrition or other associated factors such as weight loss or
poor food intake have also been found to be independently associated with an
increased risk of developing a pressure ulcer (Allman et al., 1995, Fisher et
al., 2004, Maklebust and Magnan, 1994, Thomas, 1996). Table 2.8 provides
details of these associations. In these studies however, malnutrition or
associated factors were generally poorly defined. The current study
demonstrates an independent association with a valid assessment of
malnutrition.
Nutritional status and stage and number of pressure ulcers
In acute facilities, being malnourished was also associated with an increased
risk of having a higher stage of pressure ulcer, and the odds risk of having a
higher stage of pressure ulcer further increasing with severity of malnutrition.
Severe malnutrition was significantly associated with an odds risk of having a
Stage I pressure ulcer of 3.8 (95% CI 2.3-6.3), increasing to 7.1 (95% CI 3.6-
13.9) of having a Stage III or IV pressure ulcer (Table 5.8). This trend was
also found in residential aged care facilities although a clear pattern such as
found in acute facilities was unable to be established due to a lack of numbers
in either audit (Table 5.9).
In acute facilities, being malnourished was also associated an increased odds
risk of an individual having a higher number of pressure ulcers. The odds risk
of having a higher number of pressure ulcers increased with severity of
malnutrition, with a severely malnourished individual having an odds risk of
Economic analysis of Malnutrition and Pressure ulcers M Banks June 2008
196
7.9 (95% CI 3.3-18.8) of having three or more pressure ulcers (Table 5.10).
There were however insufficient numbers in either audit for residential aged
care facilities to demonstrate this pattern in this setting (Table 5.11).
Comparison of the effect of nutritional status on p ressure ulcers
between Audit 1 and Audit 2
Another interesting finding of this study was no significant difference between
the independent association between nutritional status and pressure ulcers
between the two audits (Table 5.6), when there was a significant reduction in
the prevalence of pressure ulcers between the two audits for both acute and
residential aged care facilities (Table 5.2). These results support the strength
of the association between nutritional status and pressure ulcers being
maintained despite various interventions being implemented, based on the
introduction of guidelines between Audit 1 and 2 to reduce the incidence of
pressure ulcers. Such interventions included, for example, the use of
appropriate supporting surfaces and dressings for patients at high risk or with
pressure ulcers. As noted previously however, due to poor referral, nutrition
interventions were reportedly not routinely implemented for patients at risk of
or with pressure ulcers during this period.
Some authors have argued that the association of nutritional factors and
pressure ulcers have often not been adjusted for co-morbidity or other factors
and may merely indicate that sicker patients are more likely to develop
pressure ulcers (Thomas, 2006). In this study, the association between
nutritional status and pressure ulcers controlled for demographic variables
including age group and gender, type of facility and medical specialty, but not
specifically co-morbidities. However, Horn et al. (2004) adjusted for severity
of illness in a study of factors associated with developing pressure ulcers in
the residential aged care setting, and found oral eating problems and recent
weight loss, strong predictors of malnutrition, remained independent factors
for developing pressure ulcers. Despite independent associations, causality
between poor nutritional status and the development of pressure ulcers has
not yet been established (Thomas, 2006). However, due to the multifactorial
pathogenesis of pressure ulcers and the dependence between many factors
Economic analysis of Malnutrition and Pressure ulcers M Banks June 2008
197
associated with the development of pressure ulcer and malnutrition, it is
unlikely that a direct causal relationship will be able to be established.
However, it can be argued that if malnutrition and pressure ulcer frequently
coexist as definitely demonstrated in this study, that both require addressing.
Nutrition intervention and pressure ulcers
The consequences of pressure ulcers in terms of patient morbidity, quality of
life, and economic cost are substantial. Pressure ulcers are considered to be
largely preventable, and so there is a need to ensure evidence based, cost
effective systems are in place to reduce the incidence of pressure ulcers
(Thomas, 2006, JCAHO, 2007). Stratton et al. (2005) found in a meta-
analysis that the incidence of pressure ulcers to be significantly reduced by
nutritional support (high protein, 200-500 Kcal/day) compared to standard
care (OR = 0.74, 95% CI 0.62-0.88). Using results from all five RCTs, the
number of patients needed to treat was calculated. This analysis suggested
that on average 19.25 patients would need to be given enteral nutritional
support in order to prevent one pressure ulcer (Stratton et al., 2005). The
mechanism by which nutritional support prevents the development of pressure
ulcers is unknown, but it would be expected that it is related to the
improvement in nutritional intake and nutritional status. The relationship
between nutritional intake and nutritional status and pressure ulcers was
reviewed in Section 2.11.
Studies investigating nutrition in the treatment of pressure ulcers indicate a
trend towards enhanced healing although the results are still inconclusive
(Stratton et al, 2005). Studies investigating the nutritional intake of patients
with pressure ulcer have however found that protein and energy intake, as
well as micronutrient intake do not meet nutritional requirements (by an
estimated 10-30%) and many patients appear to need nutritional
supplementation just to meet standard requirements (Dambach et al., 2005,
Raffoul et al., 2006).
There is now sufficient evidence to justify ensuring all patients at risk of or with
pressure ulcers receive nutritional intervention, probably in the form of
Economic analysis of Malnutrition and Pressure ulcers M Banks June 2008
198
nutritional supplementation to meet nutritional requirements. What is unclear
as discussed in the literature review is whether nutritional supplementation is
required as nutritional requirements of all or particular nutrients are greater in
these individuals, or whether nutritional supplementation is required to ensure
that ‘standard’ nutritional requirements are met. More evidence is also
required regarding the type of nutritional supplementation required,
particularly the value of formulae developed specifically for the prevention and
treatment of pressure ulcers.
Summary
The current study is the first study to the author’s knowledge, that has
investigated and established an association between malnutrition and
pressure ulcers using a valid nutrition assessment technique; and is the first
study of its kind to be conducted in Australia, on a large number of cases
across multiple acute and residential aged care facilities. This study therefore
has provided the first significant evidence of the association between
malnutrition and pressure ulcer in public acute and residential aged care
facilities in Australia.
This study has also provided the first evidence of the association between the
severity of malnutrition and the severity of pressure ulcers. There was an
increased odds risk of having a pressure ulcer, having a higher stage
pressure ulcer and a higher number of pressure ulcers with increased severity
of malnutrition.
The independent association of poor nutritional status and pressure ulcers, as
found in this large multi-centre study has provided evidence that the nutritional
status of individuals at risk of, or with pressure ulcers should be addressed in
Queensland public hospitals and residential aged care facilities.
However, as discussed previously, individuals at risk of or with pressure ulcer
appear to not be being routinely referred for, or generally receiving adequate
nutritional care.
Economic analysis of Malnutrition and Pressure ulcers M Banks June 2008
199
7.2.3 Objective 3: To estimate the economic conseq uences of
malnutrition, by determining the excess length of h ospital stay and cost
arising from pressure ulcers that are attributable to malnutrition in the
hospital population.
Pressure ulcers are a huge financial burden on health care systems. The
annual cost of treating pressure ulcers in the UK was estimated to be
approximately £ 750 million (1998 prices) with the total cost of treatment for a
patient with a full thickness ulcer being approximately £ 30 000 (Stratton et al.,
2003). Costs related to treatment and management of pressure ulcers are
attributable to cost of: medication, surgical procedures, wound dressings,
diagnostic procedures (eg x- rays), therapeutic procedures, treatment of
infections, lost productivity, and specialized care by health professions during
prolonged hospital stay or community care (Beckrich and Aronovitch, 1999).
The opportunity cost of prolonged length of stay in hospital is another cost
which is significant, especially in health care systems with considerable
waiting lists for surgery. Prolonged length of stay by patients with pressure
ulcer may contribute to lengthening hospital waiting lists as beds are not
available for patients to be admitted (Stratton et al., 2003). In a recent
Australian study, the opportunity cost of prolonged length of hospital stay due
to pressure ulcers was predicted to be a median AU$ 285 million (2001/2002)
for Australian public hospitals and AU$ 48.5 (11.0-126.1) million for
Queensland public hospitals (Graves et al, 2005b). The results from this
study represented only 52% of discharges from Australian public hospitals
and therefore probably underestimate the annual burden imposed by pressure
ulcers in Australia. In addition, only the value of the bed days lost to the
hospital system from pressure ulcers were included.
The exploratory economic analysis undertaken in this study predicts that
approximately 33% of pressure ulcers were attributable to malnutrition in
Queensland public hospitals in 2002/2003, and that a mean of 16050
(standard deviation 5672) patient bed days were lost to pressure ulcers
attributable to malnutrition (Table 6.2). This mean value represents 0.67% of
the total patient bed days in Queensland public hospitals in 2002/2003 and
Economic analysis of Malnutrition and Pressure ulcers M Banks June 2008
200
corresponding mean economic cost of approximately AU$13 million (standard
deviation AU$ 4.9 million). This does not represent an actual cost savings,
but rather the opportunity cost of patient bed days not available for use by
other patients. Bed days were chosen in this research to describe the
economic costs due to the current pressures on patient bed availability in
many public metropolitan and regional hospitals in Queensland, which is
contributing to substantial waiting lists for individuals requiring treatment
(AIHW, 2007, Cresswell, 2007). A reduction in rates of pressure ulcer would
increase hospital throughput and reduce waiting lists as previously blocked
beds would be made available. Increased throughput would then have
implications for operating costs of the hospital as variable costs would be
expected to increase with increased throughput, as variable costs tend to be
highest at the beginning of patient admissions and then taper off (Drummond
et al, 2005, pp 66-67). However the value to the public health system of
increased throughput is considered to be substantial and hence bed days
were considered a valuable currency for this research.
This model only considers the costs of extended length of stay associated
with pressure ulcers attributable to malnutrition and not other costs associated
with treatment and care or broader patient burden issues. The additional
costs saved from avoided cases of pressure ulcer with respect to treatment
would also be substantial. In the USA, the Joint Commission for Accreditation
of Healthcare Organisations (JCAHO) estimates that the costs of treatment of
pressure ulcers are in the order of US$500 (Stage I and II) to US$ 40 000 per
ulcer (Stage III and IV) (JCAHO, 2007). Hence the results of this study can
only be used to indicate the potential costs of pressure ulcer attributable to
malnutrition, and whilst this may not be able to inform policy directly, it
indicates to decision makers the need to consider nutritional status in the
prevention of pressure ulcers.
In this study, only one value was used for the extended length of stay for all
stages of pressure ulcers, as reported by Graves et al (2005a) due to an
inability to accurately identify stage of pressure ulcer for each patient. It would
be expected that different stages of pressure ulcer would result in differences
Economic analysis of Malnutrition and Pressure ulcers M Banks June 2008
201
in the extended length of stay, with Stage I unlikely to contribute to an
extended length of stay at all and Stage IV pressure ulcers contributing
substantially to extended length of stay. However the figure is reported as a
median for all stages of pressure ulcer and applied in this model accordingly
provides mean costs for all pressure ulcer, no matter what stage
In this study, the opportunity costs of pressure ulcer attributable to malnutrition
are predicted to be substantial at 33% of the total predicted opportunity costs
from extended lengths of stay due to pressure ulcers. This substantial
attributable fraction was estimated using an epidemiological approach based
on an assumed causal pathway in which malnutrition causes pressure ulcer.
However as discussed in the previous section, causality between malnutrition
and the development of pressure ulcers has yet to be established. This is
largely due to the multifactorial pathogenesis of pressure ulcers and the
dependence between many factors associated with the development of
pressure ulcers and malnutrition. There is also the potential of reverse
causality of pressure ulcers causing malnutrition. This is a recognized
limitation of this study. However, interestingly the results of the estimated
attributable fraction are supported by the results of the Stratton et al (2005)
meta-analysis study where the development of pressure ulcers in individuals
was significantly reduced by nutritional support compared to standard care
(OR = 0.74, 95% CI 0.62-0.88). The meta-analysed studies provided a
nutrition support intervention, and hence were likely resulting in the prevention
and/or treatment of malnutrition.
The estimated opportunity cost savings described in this study represent a
maximum value that might be achieved if there were no malnutrition. It is
unlikely however that there would ever be no malnutrition, as malnutrition
develops secondary to various disease states. But it is likely that in a large
number of cases malnutrition can be prevented or the signs, symptoms and
effects reduced if treated more appropriately, and this would have a large
impact on the incidence of pressure ulcers (and other complications), and
subsequent economic costs.
Economic analysis of Malnutrition and Pressure ulcers M Banks June 2008
202
Other studies have examined the impact of poor nutritional status on clinical
outcome and extended length of hospital stays on the subsequent economic
costs and found in all cases that malnutrition is associated with increased
economic costs (Robinson et al., 1987, Reilly et al., 1988, Chima et al., 1997,
Correia and Waitzberg, 2003, Braunschweig et al., 2000). However all of
these studies can be criticized in relation to economic analysis methodology.
No published studies were located investigating the economic costs of
pressure ulcers attributable to malnutrition for comparative purposes. This is
the first research to the author’s knowledge, using sound economic analysis
methodology to determine the economic consequences attributable to
malnutrition, and in the case of pressure ulcers has found these economic
consequences to be substantial.
Summary
This study estimated approximately one third of pressure ulcers may be
attributable to malnutrition in Queensland public hospitals in 2002/2003. This
represents a substantial number (approximate mean of 16000) of patient bed
days lost to pressure ulcers attributable to malnutrition, corresponding to a
mean economic cost of approximately AU$13 million for 2002/2003 in
Queensland public hospitals.
This study is the first to the author’s knowledge using sound economic
analysis methodology, despite its exploratory nature, to determine the
economic cost of pressure ulcers attributable to malnutrition, and therefore
has provided the first sound economic evidence to justify the consideration of
the implementation of systems to identify, prevent and treat malnutrition, at
least in the case of pressure ulcers.
7.2.4 Objective 4: To estimate the economic outco mes of an
intervention that provides intensive nutrition supp ort to nutritionally at
risk patients in hospital, where ‘cases of pressure ulcer avoided’,
‘number of bed days not lost to pressure ulcer’ and ‘economic costs’ are
the relevant outcomes.
Economic analysis of Malnutrition and Pressure ulcers M Banks June 2008
203
In this study the economic model undertaken predicts that a mean of 2896
(standard deviation 632) cases of pressure ulcer could have been avoided, if
an intensive nutrition support intervention was provided to all at risk patients in
Queensland Health in 2002/2003. This corresponds to a mean of 12397
(standard deviation 4491) patient bed days (or approximately 0.5% of total
patient bed days) that could have been used for purposes other than patients
staying in hospital for an extended period of time with pressure ulcers.
Importantly, there were no predicted additional cases of pressure ulcer or bed
days lost to pressure ulcer from this model, with a minimum number of cases
and bed days saved being 1082 and 3807 respectively. See Table 6.4 and
related Figures 6.7 and 6.8.
The economic cost of implementing an intensive nutrition support intervention
for nutritionally at risk patients was predicted to be overall cost saving with a
mean of –AU$ 5.4 million (standard deviation AU$ 3.9 million), and a 95%
chance of the model chosen being economically cost saving whilst reducing
the incidence of pressure ulcers and freeing up valuable bed days for use by
other patients. Of course, evaluation of the implementation of such an
intervention is required to test whether the economic outcomes predicted are
accurate. These economic estimates rely on effect estimates from a meta-
analysis of intensive nutrition support in the prevention of pressure ulcers,
where nutrition support was significantly associated with lower incidence of
pressure ulcer development in at risk patients compared with standard care
(OR 0.75, 95% CI 0.62-0.88, 5 RCTs, n=1325). The limitations of this meta-
analysis are detailed in Section 2.12.1 and Section 7.5 Strength and
Limitations. The meta-analysis effect estimates were considered sufficiently
robust and applicable to use in the currently study, However, the effect
estimates of this meta-analysis are substantial, although as discussed in the
previous section, are similarly supported by the estimated attributable fraction
of malnutrition to pressure ulcer. However, if the effect estimates of the meta-
analysis are indeed smaller than reported by Stratton et al (2005) due to
limitations of this meta-analysis, the economic cost of implementing intensive
nutrition support it is still likely to be overall cost savings, due to the very high
chance (95%) and substantial cost savings found using the current model.
Economic analysis of Malnutrition and Pressure ulcers M Banks June 2008
204
No published studies were located investigating the economic outcomes of
nutrition intervention for comparative purposes. A study which estimated the
cost-effectiveness of alternating pressure mattresses compared with
alternating pressure overlays for the prevention of pressure ulcers (Iglesias et
al., 2007) found that alternating pressure mattresses were associated with
lower overall costs (average £283.6 per patient) mainly due to reduced length
of hospital stay. Comparison of these economic outcomes with economic
outcomes of the current study however cannot be made due to different
methodological approaches. However it appears the prevention of pressure
ulcers is overall associated with significant positive economic outcomes.
Economic cost savings in this study again do not represent actual monetary
savings, rather the opportunity costs of patient bed days not available for
alternative use. Potential cost savings of treatment and care or broader
patient burden issues associated with pressure ulcers have also not been
considered. The value to the public health system of increased throughput is
again considered the most relevant factor, but the additional costs saved from
avoided cases of pressure ulcer with respect to treatment would also be
substantial. In addition it would be expected that there might be other health
and economic benefits other than those associated with pressure ulcer if an
intensive nutrition support intervention were implemented for at risk patients
(Stratton et al., 2003). Other potential benefits of such an intervention have
also not been considered here. Hence the results of this study can only be
used to indicate the potential of nutrition intervention, but do provide data to
indicate to decision makers the need to consider nutrition intervention in the
prevention of pressure ulcers.
The nutrition support intervention chosen relied on the provision of additional
food or commercial supplements to patients at nutritional risk not likely to be
receiving additional nutrition supplements, and also additional nutrition/
nursing support staffing to encourage and assist patients to consume the
required nutrition. In this model it was assumed additional nutrition/nursing
support staff were required to specifically undertake this task, although in fact
Economic analysis of Malnutrition and Pressure ulcers M Banks June 2008
205
this task could possibly be achieved within existing resources with a change in
care models and emphasis on the importance of patients achieving nutritional
intakes. However, the model of additional nutrition/ nursing support staffing
was chosen based on the results of a study by Joansen et al., (2005) where
patients receiving intensive nutrition intervention consisting of a dietitian and
specially trained nurse had a significantly improved intake (62% achieved
>75% of requirements) compared to patients receiving standard care (36%
achieved >75% of requirements). The intervention team attended patients
for motivation, provided a detailed nutritional care plan, assured delivery of
and assistance with prescribed food and gave advice on other forms of
nutrition support such as enteral feeding.
The cost of the intensive nutrition intervention model chosen was between
AU$ 3.8 million - AU$ 5.5 million (2002/2003 prices) which would be
considered a substantial investment in nutritional care in the Queensland
public hospital system, if made. However the most effective way of spending
such funds to ensure optimal nutritional care is provided is not clear at this
stage and requires further investigation. The model did not include costs
associated with the potential requirement for additional registered nurses
which may be required if more patients required enteral tube feeding or other
higher nursing care activities; nor did it include costs for additional dietitian/
nutritionist staff to ensure nutrition screening and support systems were in
place. This is because it was decided that the additional nutrition/ nursing
support time in the model would provide support for registered nurses freeing
up their time for such higher clinical care duties; and that a minimum dietitian/
nutritionist staffing infrastructure should already be in place. However the
modelled costs could be spent alternatively or possibly in addition on other
resources if determined necessary, as the current predicted economic savings
allow substantial scope for more funds to be spent if necessary on the
nutrition support intervention. The cost of additional dietitian/ nutritionist
staffing to meet benchmarked standards in 2002/2003 is modelled in
Appendix 4 and is between AU$ 900 000 - $ 1.1 million. This cost if added to
the current model cost is predicted to make little difference to the overall
Economic analysis of Malnutrition and Pressure ulcers M Banks June 2008
206
economic cost outcome of the model with respect to it still being a positive
economic cost.
Unfortunately the economic analyses undertaken in this study could not be
extended to aged care residents as there is no data available on the
economic cost of pressure ulcers in this setting. A different type of economic
model would also need to be undertaken as the currency used in this study of
extended length of stay does not have the same value in the residential aged
care setting.
Economic analysis of the impact of nutrition intervention has been undertaken
in a few studies detailed in section 2.5.3, all indicating large economic
benefits. Tucker and Miguel (1996) predicted potential cost savings of over
US$1 million per average hospital if early nutrition intervention was provided
to patients. Stratton et al. (2003a) estimated a mean cost savings of between
£352 and £8179 per patient if nutritional supplements were provided to
nutritionally at risk patients. In the UK potential cost savings of £266 million
(1992 prices) were calculated if appropriate nutrition support was given to
malnourished patients, thus reducing hospital stay by 5 days in 10% of
hospital patients (Lennard-Jones, 1992). However, a review of the economics
literature related to nutrition support found that overall, 16 out of 21
randomized trials reviewed were of poor methodological quality (Pritchard et
al., 2006). Overall, this review identified very few studies with a health
economics component and of the studies identified many were inadequately
designed and collected only rudimentary figures associated only with the cost
of the nutrition intervention, rather than considering the wider economic
benefits, such as an associated decrease in length of stay or reduction in
infectious complications postoperatively. This is perhaps the reason why
previous studies have so far failed to broadly influence change in nutritional
care practice, as the results of these studies in terms of opportunity costs
would appear on the surface too good to resist.
The lack of economic evidence for nutrition could in part be due to the ethical
issues associated with conducting clinical studies in the area, as discussed
Economic analysis of Malnutrition and Pressure ulcers M Banks June 2008
207
previously (Pritchard et al., 2006). Alternatively, nutrition has often been
overlooked as a potential cost effective strategy because its benefits are
affected by many confounders and not always visible (Tucker & Miguel, 1996).
This is the first study to the author’s knowledge, using sound economic
analysis methodology to determine the economic outcomes of nutrition
intervention in the prevention of pressure ulcers or indeed other medical
conditions for which poor nutritional status is a risk factor.
Summary
This exploratory economic modeling study predicted that investment in
intensive nutrition support to at risk patients has the potential to realize
substantial opportunity cost savings for the health system, with respect to the
prevention of pressure ulcers.
This study is the first to the author’s knowledge using sound economic
analysis methodology to determine the economic outcomes of nutrition
intervention in the prevention of pressure ulcers and builds on the economic
evidence determined in Objective 3, to justify the consideration of the
implementation of systems to identify, prevent and treat malnutrition, at least
in the case of pressure ulcers.
7.3 IMPLICATIONS OF THIS RESEARCH FOR POLICY AND
STANDARDS OF CARE
Pressure Ulcer Policy, Standards and Guidelines
In health care practice, the demand for the establishment of appropriate
pressure ulcer policy has become more important because the incidence and
prevalence of pressure ulcers increasingly are considered parameters of
quality of care.
As discussed in Section 2.13 many countries have adopted or are developing
pressure ulcer guidelines (Australian Wound Management Association, 2001,
EPUAP, 2001, NICE, 2003, RCN & NICE, 2005) or have standards related to
the prevention and treatment of pressure ulcers. In the USA, the Joint
Economic analysis of Malnutrition and Pressure ulcers M Banks June 2008
208
Commission for Healthcare Organisations (JCAHO) has included the
prevention of pressure ulcers as one of its National Patient Safety Goals
(JCAHO, 2007). The purpose of these goals is to promote specific
improvements in patient safety. As with standards, organisations seeking
accreditation by JCAHO are evaluated for continuous compliance with these
goals.
Recently, the Australian Council on Healthcare Standards (ACHS) added into
its latest version of standards for healthcare accreditation a criterion related to
pressure ulcers. Criterion 1.5.3 of the 4th edition standards of Evaluation and
Quality Improvement Program (EQuIP 4) is “The incidence and impact of
pressure ulcers are minimized through a pressure ulcer prevention and
management strategy”. This criterion is one of six under Standard 1.5 “The
organisation provides safe care and services” (Austalian Council on
Healthcare Standards, 2006). The inclusion of this criterion in the
accreditation standards emphasizes the importance Australian healthcare
organisations place on the prevention and management of pressure ulcer to
patients’ health outcomes and quality of life. Whilst there is currently no
published data on clinical practice in comparison to the national guidelines,
the requirement to address the criterion to achieve accreditation should
ensure most organisations in Australia will improve their practice to comply.
In Queensland, Queensland Health has established a state-wide Pressure
Ulcer Collaborative under the Patient Safety Centre (Patient Safety Centre,
2007). This resourced Collaborative is charged with overseeing the promotion
of, and activities related to the prevention and management of pressure
ulcers.
Malnutrition policy, standards and guidelines
In Australia, malnutrition has yet to gain the same notoriety as pressure
ulcers. For hospitals, there is currently no policy, accreditation standards or
even recommendations regarding malnutrition and nutritional care from either
government bodies or even the independent nutrition organizations for
hospitalised patients. For residential aged care facilities, the relevant
Economic analysis of Malnutrition and Pressure ulcers M Banks June 2008
209
accrediting organisation, The Aged Care Standards and Accreditation Agency
Ltd, has one standard related to nutrition: Standard 2.10 Nutrition and
Hydration: Residents receive adequate nutrition and hydration
(www.accreditation.org.au/AccreditationStandards). The types of measures
that are required to be observed to meet this standard include: monitoring
records for ensuring residents receive adequate nourishment and hydration;
access to specialists including dietitians and speech pathologists; consultation
regarding residents individual meal preferences; fluid and nutrition charts;
weight charts; availability of nutritional supplements; presentation of meals
including pureed meals (www.accreditation.org.au/AssessmentModule7).
Whilst these standards are useful they are not specific enough with regard to
the need for systems to identify, prevent and treat malnutrition.
This research program has demonstrated an independent association
between malnutrition and pressure ulcers, on a background of a high
prevalence of malnutrition, providing evidence to justify the elevation of
malnutrition to a safety and quality issue for Australian healthcare
organisations, similarly to pressure ulcers. In addition this research provides
preliminary economic evidence to justify the consideration of the requirement
for healthcare policy, standards and guidelines regarding systems to identify,
prevent and treat malnutrition, at least in the case of pressure ulcers in
Australia.
A number of countries have policy, standards or guidelines related to
malnutrition and nutrition care. In the USA, nutrition screening and nutrition
care planning in hospitals is required for accreditation by the Joint
Commission on Accreditation of Health Care Organizations (JCAHO, 2003).
In addition, the USA Medicare system is a prospective payment system,
whereby nutrition departments can receive reimbursements for providing
nutrition services to patients classified as malnourished as a co-morbidity or
complication (Smith and Smith, 1992, Smith and Smith, 1993, Sayarath, 1993,
Christensen, 1986, Trimble, 1992). Because of accreditation requirements
and funding incentives there is an emphasis on and existence of nutrition
screening, assessment and management in USA hospitals.
Economic analysis of Malnutrition and Pressure ulcers M Banks June 2008
210
Several other continents or countries also have health policy in place which
either mandates or recommends nutrition screening and management
strategies.
In 1999, the Council of Europe collected information to review the current
practice regarding nutritional programmes in hospitals to highlight any
deficiencies and to issue recommendations to improve the nutritional care and
support of hospitalised patients. The data showed that the use of nutritional
risk screening and assessment, and of nutritional support and counselling was
sparse and inconsistent, and that the responsibilities in these contexts were
unclear (Beck et al., 2002, Beck et al., 2001a). In response to these findings
the Council of Europe, Committee of Ministers passed a resolution on food
and nutritional care in hospitals (Council of Europe, 2003). The Council
recommended governments of member states draw up and implement
national recommendations on food and nutritional care based on the detailed
principles and measures set out in the appendix of the resolution. These
principles, with an example of measures include:
1. Nutritional assessment and treatment in hospitals
1.1 Nutritional risk screening eg. should be undertaken routinely prior or on
admission and repeated regularly
1.2 Identification and prevention of causes of under-nutrition (malnutrition) eg.
‘nil by mouth’ regimens should not be used routinely
1.3 Nutritional support eg. should be considered systematically as part of
treatment
1.4 Ordinary food eg. good practices to ensure the intake of ordinary food by
patients
1.5 Artificial nutrition support eg. standards of practice established
2. Nutritional care providers
2.1 Distribution of responsibilities for nutritional care in hospitals eg.
responsibilities of different staff with respect to nutritional care and support
should be clearly assigned.
Economic analysis of Malnutrition and Pressure ulcers M Banks June 2008
211
2.2 Communication eg. organisational research should be conducted to
assess and improve the co-operation of different staff groups
2.3 Education and nutritional knowledge at all levels eg. clinical nutrition
should be included in under- and post-graduate education of physicians, and
education of nurses in clinical nutrition, with special emphasis on nutritional
risk and monitoring, and feeding techniques should be improved.
3. Food service practices
3.1 Organisation of hospital food service eg. hospital managers give proper
attention to food service policy and nutritional support
3.2 Contract food services eg. contracts should be sufficiently detailed and
they should cover special diets on medical and personal indications, energy
and protein dense menus and provision of snacks and/or maintained on or
near ward level.
3.3 Meal service and eating environment eg. the hospital eating environment
should be improved with a focus on surroundings and presence of personnel
and free from unpleasant odours.
3.4 Food temperature and hygiene eg. all patients should receive hospital
food, which has been stored, prepared and transported in a way as to ensure
the hygiene, safety, palatability, gastronomy, and nutrient content of the food
remains at a high level.
3.5 Specific improvements in food service practice to prevent undernutrition
eg. close collaboration between the patient, medical, nursing, dietetic and
food service staff is required to get the patient to eat.
4. Hospital food
4.1 Hospital menus and diets on medical indications eg. good practice should
be established through the development of national guidelines for food
provision in hospitals to meet the needs of all categories of patients including
special diet indications, vegetarian, texture modified and energy and protein
dense menus.
4.2 Meal pattern eg. serving hours should be reviewed to ensure that there is
sufficient time between each meal for in between snacks in the morning,
afternoon and late evening.
Economic analysis of Malnutrition and Pressure ulcers M Banks June 2008
212
4.3 Monitoring food intake eg. the level of food intake should be used to
assess the patients’ need for nutritional support.
4.4 Informing and involving the patient eg. the positive role of nutrition as
treatment should be made known to the public to engender awareness and
support.
5. Health economics
5.1 Cost effectiveness and cost benefit considerations eg. calculations of
cost-benefit and cost-effectiveness of nutritional support should also be done
at a hospital level.
5.2 Food service and food wastage costs eg. the influence of food service
practice on food wastage should be examined.
The Recommendations for Food in Public Institutions in Denmark, issued by
the Danish Ministry of Food and Agriculture include recommendations for
nutrition risk screening and care plans (Kondrup et al., 2003b).
In Brazil, governmental regulations for nutrition screening and therapy
became mandatory (Correia and Campos, 2003) after the presentation of
results of a Brazilian national hospital malnutrition survey (Waitzberg et al.,
2001). Similar policy is reported for Costa Rica (Correia and Campos, 2003).
In the UK there are standards and guidelines which recommend monitoring
patient’s nutritional status to identify those at risk (Department of Health
(DOH), 2001).
In addition to or alternatively, country or continent based nutritional
organizations have recommendations regarding nutrition screening and
treatment programs. Examples include: The European Society for Parenteral
and Enteral Nutrition (ESPEN); The British Society for Parenteral and Enteral
Nutrition (MAG (BAPEN), 2003); American Society for Parenteral and Enteral
Nutrition (ASPEN) (ASPEN Board of Directors, 2002); American Dietetic
Association (American Dietetic Association (ADA), 1994); The Latin American
Federation of Parenteral and Enteral Nutrition (FELANDE) (Correia and
Economic analysis of Malnutrition and Pressure ulcers M Banks June 2008
213
Campos, 2003); The Brazilian Society of Parenteral and Enteral Nutrition
(SBPNE) (Waitzberg et al., 2001).
Guidelines however do not seem enough. At the 2007 European Society for
Clinical Nutrition and Metabolism (ESPEN) conference in Prague
(www.espen.org), a special session on malnutrition was held in response to a
lack of implementation of the Council of Europe declaration made in 2003.
“The Prague Declaration: A call for action to fight malnutrition in Europe” was
launched calling upon the EU institutions – the European Parliament, the
European Commission and the European Council of Ministers – as well as on
national governments, providers of health services and other relevant bodies
to:
• Acknowledge that malnutrition and obesity are both results of poor nutrition
with significant consequences for health outcomes and healthcare
expenditures;
• Recognise malnutrition as a clinical pathology and its nutritional support as
an integral part of each medical treatment;
• Affirm that access to proper nutritional care and support is a fundamental
human right;
• Offer political direction and support for all stakeholders involved in the fight
against malnutrition
• Provide coherent reimbursement policy for nutritional support across
health and social care systems; and
• Develop nutrition care plans for all healthcare settings and promote the
implementation of existing solutions to fight malnutrition for the benefit of
patients, healthcare systems and society.
In Australia, there is a need for policy, standards and guidelines related to the
identification, prevention and treatment of malnutrition in hospitals and
residential aged care facilities. Policy could take the form of the requirement
to implement similar principles and measures as recommended by the Council
of Europe detailed above, including requirements for nutrition screening and
management systems, and food services to meet the needs of a nutritionally
Economic analysis of Malnutrition and Pressure ulcers M Banks June 2008
214
at risk population. In addition to, or alternately, standards related to a
requirement for systems which ensure the identification, prevention and
treatment of malnutrition should be introduced by health care accreditation
organisations such as the Australian Council for Healthcare Standards
(ACHS); or strengthened in the case of The Aged Care Standards and
Accreditation Agency Ltd.
Nutrition risk screening
As part of policy related to identification, prevention and treatment of
malnutrition, there is a need for the introduction of routine nutrition screening
in hospitals and residential aged care facilities, as the first step in the
identification of the risk of malnutrition. This is of particular importance in
metropolitan hospitals and residential aged care facilities, in older patients or
residents, and medical specialties such as oncology, where the risk of
malnutrition was found to be higher.
Ferguson & Capra (1998) conducted a survey in 1995 of Australian dietitians
and found fewer than 5% of Australian hospitals (n=124) conducted nutrition
screening (Ferguson and Capra, 1998). Since the development and
publishing of the Malnutrition Screening Tool (MST) (Ferguson et al., 1999) in
Australia it is likely that malnutrition risk screening is occurring more frequently
than found in 1995 by Ferguson & Capra (1998). The implementation of
nutrition screening using the MST by dietitians in an Australian hospital
described by Beck, et al (2001) found 72% of eligible patients screened with a
resultant improved timeliness of nutrition intervention. The implementation of
routine nutrition screening and assessment processes highlighted differences
in the prevalence of malnutrition between different clinical areas which
assisted in better allocation of dietetic resources to where they were most
needed (Beck et al., 2001c). Studies demonstrate that the implementation of
comprehensive nutrition screening and intervention programs decreases the
prevalence of malnutrition (Brugler et al., 1999, O'Flynn et al., 2005). O’Flynn
et al (2005) showed a significant reduction in the prevalence of malnutrition
over a five year period from 1998 (23.5%) to 2003 (19.1%) (p= 0.001),
associated with the implementation of nutrition screening, improvements in
Economic analysis of Malnutrition and Pressure ulcers M Banks June 2008
215
food service and nutrition education. There was a significant increase in the
number of malnourished patients receiving nutritional care from 56.5% in 1998
to 71.2% in 2003 (p= 0.003).
An unpublished survey of dietitians in Queensland Health hospitals and
residential aged care facilities was conducted by this author to obtain
information regarding nutrition screening practices (Banks, 2003). Of the 37
institutions for which a survey was completed, 17 responded that nutrition
screening occurred, although in two instances this was not actually the case
from the method of screening described. The survey found that malnutrition
screening has generally not been able to be successfully implemented in
Queensland Health institutions. Results included:
• The majority of institutions have not attempted to introduce nutrition
screening, particularly at institutions without dietitians.
• Of the institutions which have attempted to implement nutrition screening,
the majority report it has not been successful as screening frequently is not
completed and/or there is no referral or follow up action.
• Nutrition screening has only been successfully implemented where
diet/nutrition assistant positions exist, and these staff have been given this
role.
• Where nutrition screening has been attempted to be implemented through
nursing practice (ie as part of total risk assessment on admission and
regular assessment) it has not been successful.
Barriers to successful implementation of nutrition screening cited in the survey
included:
• Medical and nursing staff awareness of the problem of malnutrition and
acceptance that screening and treatment should occur.
• Nursing staff not carrying out screening because: it is seen as extra work,
‘not their job’, resistance to change
• Lack of resources ie dietetic and/or dietetic assistant
Economic analysis of Malnutrition and Pressure ulcers M Banks June 2008
216
This data confirms not only the need for policy and standards regarding
malnutrition, but also the requirement for increased awareness of the issue.
However, if policy and standards were introduced regarding the identification,
prevention and treatment of malnutrition, this would increase the awareness of
the issue as has occurred with pressure ulcers.
Nutrition in pressure ulcer guidelines
Most, if not all, guidelines on pressure ulcer prevention and management
include some nutritional recommendations but they are usually only general in
nature (Schols and de Jager-v d Ende, 2004); and the most commonly used
current pressure ulcer risk assessment tools including the Norton Risk
Assessment, The Waterlow Pressure Sore Prevention/Treatment Policy and
the Braden Scale (Australian Wound Management Association, 2001,
Pancorbo-Hidalgo et al., 2006) do not contain parameters specifically related
to nutritional risk. Hence the importance of nutritional status in the prevention
and treatment of pressure ulcers is generally not being addressed (Schols and
de Jager-v d Ende, 2004). Australian dietitians generally report poor rates of
referral for individuals with or at risk of pressure ulcers (personal experience
and extensive personal communications).
Specific nutritional recommendations should be integral in pressure ulcer
guidelines, including: nutritional risk screening and/or assessment; correction
of nutritional deficiencies with appropriate diet to meet requirements;
supplementary nutrition by oral supplements or tube feeding if nutritional
requirements cannot be met
Summary
The importance of the prevention and treatment of pressure ulcers is now
recognized and has been elevated to the status of a safety and quality issue
for institutions in many countries, including Australia. Malnutrition, like
pressure ulcers, is largely preventable and associated with poor outcomes for
individuals and healthcare organisations alike, including an associated
increased risk of pressure ulcers. Yet the importance of preventing and
treating malnutrition, even in relation to the prevention and treatment of
Economic analysis of Malnutrition and Pressure ulcers M Banks June 2008
217
pressure ulcers, has not received the recognition required in healthcare policy,
standards or guidelines.
This research program has demonstrated an independent association
between malnutrition and pressure ulcers, on a background of a high
prevalence of malnutrition, providing evidence to justify the elevation of
malnutrition to a safety and quality issue for Australian healthcare
organisations, similarly to pressure ulcers. In addition this research provides
preliminary economic evidence to justify the consideration of the requirement
for healthcare policy, standards and guidelines regarding systems to identify,
prevent and treat malnutrition, at least in the case of pressure ulcers in
Australia.
7.4 WHY IS THERE A LACK OF STRONG EVIDENCE FOR NU TRITION
INTERVENTION?
One of the main reasons provided for a lack of recognition of malnutrition
and/or nutrition intervention in disease states is a lack of strong evidence for
nutrition intervention. Jeejeebhoy (2003) discussed how it was surprising that
controlled clinical trials of nutrition support had not clearly shown that nutrition
support independently improves outcomes in hospital patients, especially
when Correia and Waitzberg (2003) demonstrated that malnutrition is
independently associated with morbidity, mortality, length of stay and costs.
There are a number of reasons why such a discrepancy exists in the
literature:
• Nutrition support is not given to only malnourished patients. It is likely any
benefit of nutrition support in malnourished patients is counteracted by no
benefit or even complications of unnecessary nutrition support in well
nourished/ obese patients (Jeejeebhoy, 2003).
• The type of nutrition support. Many studies have used parenteral nutrition
as the form of nutrition support, which is associated with greater
complications than other forms of nutrition support, and is more costly
(Gallagher-Allred et al., 1996). Other studies have compared enteral
versus parenteral nutrition and have not included a control group receiving
Economic analysis of Malnutrition and Pressure ulcers M Banks June 2008
218
standard care. The difference between the two different routes of nutrition
support does not prove that either is necessary or better than no therapy
(Jeejeebhoy, 2003).
• Delay in providing nutrition support until deterioration is advanced,
rendering malnutrition more time consuming and expensive to correct than
if nutrition support had been implemented earlier (Gallagher-Allred, Voss
et al 1996).
• Insufficient amounts of nutrition support provided to meet patient’s needs,
or for suitable lengths of time (Gallagher-Allred, Voss et al 1996).
• Excessive amounts of nutrition support that result in metabolic
complications (Gallagher-Allred, Voss et al 1996; Jeejeebhoy 2003).
• Failure to adequately implement the nutrition prescription and monitor
compliance (Capra et al., 2002).
• Failure to examine certain relevant outcomes (Capra et al., 2002). For
example, Isenring et al. (2004) found that weight maintenance led to
beneficial outcomes in oncology patients undergoing radiotherapy and
suggest that this, rather than weight gain, as often examined in other
studies, may be a more appropriate aim of nutrition support in this patient
population. Another study in oncology patients made the same conclusion
after finding improved survival duration and quality of life associated with
weight stabilisation (Davidson et al., 2004). Albumin and pre-albumin are
frequently used as outcome measures however they have been
demonstrated to be poor indicators of improvements in nutritional status in
the hospital setting (Vanderkroft et al., 2007). Length of stay and mortality
are effected by many non-nutritional confounding factors and care must be
taken with using them as overall outcome measures (Vanderkroft et al.,
2007).
• Nutrition related interventions are much more complex than, for example,
pharmaceutical interventions involving an active and placebo medication.
There will always be an element of clinical diversity with nutrition related
interventions. As soon as a food or component of a diet is added or
removed, the entire ‘diet’ is affected. This makes it difficult to provide all
participants with an identical intervention in the same study, and even
Economic analysis of Malnutrition and Pressure ulcers M Banks June 2008
219
more difficult to provide comparable interventions in separate studies
(Vanderkroft et al., 2007).
To show that nutritional support in malnourished patients improves outcome it
is necessary to randomize specifically malnourished individuals to standard
therapy or nutritional support and avoid overfeeding. However it is not ethical
to randomize malnourished patients to a starvation control group.
“Unfortunately the question of ethical justification results in a circular argument
in which the beneficial effects of nutrition on the outcome of patients remains
controversial, requiring controlled clinical trials and yet such trials cannot be
done and therefore proof cannot be obtained” (Jeejeebhoy 2003). However
due to the high proportion of malnourished patients not receiving adequate
nutrition there is still an opportunity to compare what is existing standard care
with nutritional support interventions (Correia and Waitzberg, 2003). Many
researchers employ this approach to nutrition support studies.
Joansen et al. (2004) randomized 212 malnourished patients to receive either
intense nutritional intervention or standard nutritional care. Nutrition
intervention was provided by a specialized nutrition team consisting of a
dietitian and specially trained nurse, who attended patients and staff for
motivation, detailed a nutritional care plan, assured delivery of prescribed food
and gave advice on enteral and parenteral nutrition. This intervention led to
an intake of >75% of requirements in 62% of intervention patients, as
compared with 36% of control patients, and a shorter length of hospital stay
among intervention patients with complications compared with control patients
(Joansen et al., 2004).
Isenring, et al. (2004) randomized 60 patients with cancer of the
gastrointestinal or head and neck areas commencing radiotherapy, to receive
either intensive nutrition intervention or standard nutrition care. Intensive
nutrition intervention included regular nutrition counselling by a Dietitian and
oral supplements if required, whereas standard care involved general advice
from nurses and a nutrition information booklet. They found that early and
intensive nutrition intervention clinically and statistically beneficial in terms of
Economic analysis of Malnutrition and Pressure ulcers M Banks June 2008
220
minimizing weight loss, deterioration in nutritional status and in quality of life.
Clinically, but not statistically significant differences in fat free mass were
observed between the groups (Isenring et al., 2004).
The studies by Isenring et al. (2004) and Joansen et al. (2004) are of
particular interest as these studies demonstrate improved outcomes with
nutrition intervention comprised not just of oral nutritional supplements or
enteral feeds as in many other studies, but intensive dietitian and/or nurse
intervention of an individualized nutrition care plan. These studies
recommend nutritional supplements or enteral tube feeding for patients when
required. These studies demonstrate that nutrition support is more than just
the prescription of nutritional products. The failure to adequately implement
the nutrition prescription and monitor compliance is given as a significant
reason by Capra et al. (2002) as to why many nutrition support studies do not
demonstrate the outcomes expected. More studies of this nature need to be
undertaken.
Studies need to observe nutrition support outcomes associated with both
specific and multiple disorders, and these studies should focus on determining
clinically relevant outcomes such as morbidity, changes in lean body mass,
functional status (activities of daily living, health related quality of life and
muscle function), patient satisfaction, length of stay and mortality (Akner and
Cederholm, 2001, Jeejeebhoy, 2003, Capra et al., 2002, Vanderkroft et al.,
2007). In addition, the inclusion of sound economic analysis in trials of
interventions can provide useful information regarding economic outcomes
(Pritchard et al., 2006).
Overall however, reviews of nutrition support conclude that there is evidence
for the benefits of nutrition support, especially oral supplements in
malnourished patients (Milne et al., 2005, Stratton et al., 2003, Vanderkroft et
al., 2007). In a recent ‘A review of reviews: a new look at the evidence for oral
nutritional supplements in clinical practice’ Stratton and Elia (2007) concluded
that there is increasing evidence to support the use of oral nutritional
Economic analysis of Malnutrition and Pressure ulcers M Banks June 2008
221
supplements in clinical practice, particularly in acutely ill and older patients
(Stratton and Elia, 2007).
Summary
The lack of strong evidence for nutrition intervention is due to a large number
of studies of poor methodological quality, the measurement of inappropriate
outcomes and difficulties associated with undertaking nutrition research.
More recent studies however have addressed and are addressing these
issues and the body of evidence regarding nutrition intervention is gradually
growing stronger, although more high quality studies are still required.
7.5 STRENGTHS AND LIMITATIONS OF THIS RESEARCH
The strengths of this research include the large numbers assessed from
multiple facilities in the epidemiological studies, including both acute and
residential aged care facilities; controlling for potential demographic
confounders in the analyses; and the standardized validated nutrition
assessment and pressure ulcer assessment methodology.
In addition, the strength of the economic modeling studies lay in access to
relevant local data to inform the input parameters, and the use of sound
epidemiological and economic analysis methodology. This is the first
research to the author’s knowledge, using sound economic analysis
methodology to determine the economic consequences of malnutrition and its
treatment, in relation to pressure ulcers.
Potential limitations and how these were addressed include:
• The use of a convenience sample which for the acute sample was not
found to be representative of the Queensland acute public population (was
significantly older and hence may have overestimated the prevalence of
malnutrition); and there was difficulty determining if the residential aged
care sample was representative. It is therefore difficult to apply these
results to Australian public hospitals and residential aged care facilities in
Economic analysis of Malnutrition and Pressure ulcers M Banks June 2008
222
general. However this research represents the only published large multi-
centre study of the prevalence of malnutrition in Australia.
• The unavailability of data on subjects who declined or were unavailable for
the audits, although this was minimized as a limitation by determining the
representativeness of the sample.
• The number of dietitians assessing nutritional status and the inability to
conduct inter-rater reliability with all dietitians undertaking the nutritional
assessments was a potential limitation, but was minimized through
standardized training, which has been shown to result in good inter-rater
reliability (Detsky et al., 1987b)
• Misclassification of subjects’ medical specialty and the collapsing of
medical specialties into fewer categories to ensure adequate numbers in
categories, may have resulted in altering or masking the effects of some
medical specialties.
• The inability to pool data from residential aged care facilities across the
two audits due to significant proportion of dependent cases which reduced
the power for data analysis.
• The number of clinicians assessing pressure ulcers was a potential
limitation, but was minimized through standardized training and
demonstrated competency.
• The difficulty in accurately staging pressure ulcers, especially Stage III and
IV has been documented in some studies (Defloor et al., 2006), and so the
numbers of these may have been under reported.
• The potential influence of the presence of pressure ulcer on the
classification of nutritional status; however dietitians assessed nutritional
status independently and were generally unaware of the patient’s pressure
ulcer status, although this was not a requirement of the study
methodology.
• Data for the incidence of pressure ulcers during admission used in the
economic models came from 1747 individuals admitted to one Queensland
tertiary hospital over a three month period, and so may not be
representative of the true incidence rate for Queensland public hospitals.
Graves et al (2005a) report that the cases of pressure ulcer were assumed
Economic analysis of Malnutrition and Pressure ulcers M Banks June 2008
223
to be incident for the hospital admission, but they were unable to confirm
whether this was correct. The incidence rate (4.6%) is at the lower end of
the 5-10% range reported in most other recently published studies, and
may in fact have led to an under estimate of the total number of pressure
ulcers predicted and hence opportunity costs.
• The results were not able to be adjusted for co-morbidities and so
associations between malnutrition and pressure ulcers may be reflecting
that sicker patients are more likely to be malnourished and be at risk of
developing pressure ulcer. However it can be argued that if malnutrition
and pressure ulcer frequently coexist as demonstrated in this study, that
both require addressing.
• Data for the prevalence of malnutrition used in determining the attributable
fraction of malnutrition in the development of pressure ulcers was that
obtained from Objective 1. This data was found to not be representative of
the public acute care population and may have led to an over estimate of
the attributable fraction.
• The attributable fraction of malnutrition in the development of pressure
ulcers is based on an assumed causal pathway in which malnutrition
causes pressure ulcers. However a direct causality between malnutrition
and the development of pressure ulcers has yet to be established. This is
largely due to the multifactorial pathogenesis of pressure ulcers and the
dependence between many factors associated with the development of
pressure ulcers and malnutrition. There is also the potential of reverse
causality of pressure ulcers causing malnutrition. This is a limitation of this
study and one that cannot be specifically addressed. However,
interestingly the results of the estimated attributable fraction are supported
by the results of the Stratton et al (2005) meta-analysis study where the
development of pressure ulcers in individuals was significantly reduced by
nutritional support compared to standard care (OR = 0.74, 95% CI 0.62-
0.88). The meta-analysed studies provided a nutrition support intervention,
and hence were likely resulting in the prevention and/or treatment of
malnutrition.
Economic analysis of Malnutrition and Pressure ulcers M Banks June 2008
224
• The economic analyses undertaken were unable to be extended to aged
care residents as there is no data available on the economic cost of
pressure ulcers in this setting. A different type of economic model would
also need to be considered as the currency used in this study of extended
length of stay does not have the same value in the residential aged care
setting.
• Only one value was used for the extended length of stay for all stages of
pressure ulcers, as reported by Graves et al (2005a). It would be
expected that different stages of pressure ulcer would result in differences
in the extended length of stay, with Stage I unlikely to contribute to an
extended length of stay at all. However this figure is reported as a median
for all stages of pressure ulcer and applied in this model accordingly to
provide mean costs for all stages of pressure ulcer.
• Only the value of patient bed days lost to the hospital system from
pressure ulcers was determined, and not other factors associated with
treatment and care and lost productivity, and so the actual economic cost
arising from pressure ulcers is likely to be underestimated. In addition
other outcomes such as potential gains in survival and quality of life were
not considered, and no comparisons were able to be made with other
potential interventions to prevent pressure ulcers. Hence the results of this
study can only be used to indicate the potential of nutrition; but do provide
data to indicate to decision makers the need to consider nutritional status
and nutrition intervention in the prevention of pressure ulcers.
• The meta-analysis used as the basis of evidence for a reduction in the
incidence of pressure ulcer with nutrition support, was based on five
randomized controlled studies for which all but one did not provide
significant evidence of a reduction in the incidence of pressure ulcer.
None of the five studies provided information to indicate that patients were
randomly allocated with concealed allocation. Only one of the studies
provided adequate blinding of participants and outcome assessors.
Although the individual RCTs scored low ratings during quality assessment
for blinding, this is in part to be expected since blinding of nutritional
studies can be difficult. The studies included in the meta-analysis were
Economic analysis of Malnutrition and Pressure ulcers M Banks June 2008
225
typically short term (2-4 weeks), involved elderly patients (mean age >75
years), suffering from a serious underlying condition (eg. hip fracture,
critical illness, bedridden, cognitive impairment, chronic illness), and
nutritional status was not specifically reported. In all studies the nutrition
support was compared to standard care, which could vary considerably
between studies based on variations in practice. However confidence in
the results of the meta-analysis is supported by the results of the individual
studies, all of which reported a decreased incidence of pressure ulcers
with nutritional support, which was likely to be indicating the treatment
and/or prevention of malnutrition. The lack of significance of the individual
studies is most likely to be due to small sample sizes, with the increased
power of the meta-analysis arising mostly from pooling of the data. In
addition, whilst the Therefore the findings of this meta-analysis despite
some methodological limitations can be considered robust, and given the
heterogeneity of subjects and settings included, are applicable to a large
proportion of patients considered to be at risk for pressure ulcer
development, both in the hospital and community care settings.
• Patients ‘at risk’ of developing pressure ulcers were considered to also be
at risk of, or malnourished. Stratton et al (2005) determined that whilst the
nutritional status of all subjects at risk of pressure ulcer in the studies
included in the meta analysis were not specifically assessed or done in a
standardized way, that data available for subjects indicated a majority
would have been at risk of being, or malnourished. There are many
factors associated with being at risk of malnutrition that are also factors for
being at risk of pressure ulcer, such as age, functional capacity, diagnoses
and severity of illness, so this assumption is considered to be reasonable.
• The assumption that the prevalence of malnutrition as determined in
Objective 1 is equivalent to the prevalence of nutritional risk may under
estimate nutritional risk and hence the number of patients who may benefit
from nutritional support.
• The assumption that all malnourished/ nutritionally at risk patients require
additional food or commercial products as nutrition support may in fact not
be so as some patients may just require assistance to consume the food
Economic analysis of Malnutrition and Pressure ulcers M Banks June 2008
226
they are already provided. This may have led to over estimation of the
cost of additional supplements.
• The assumption that 50% of patients are currently not identified as being
malnourished/ at nutritional risk and so are not receiving nutrition support
is from the results of another Australian study (Middleton et al, 2001) as
there is no local data. This is more likely to have led to an over estimation
of the cost of additional supplements than an under estimation.
• The assumption made regarding the requirement for nutrition/ nursing
support time may have resulted in an over estimation of intervention costs
as it could be argued that this task is already being/ supposed to be
carried out. However in the development of this model it was decided that
it was necessary to include additional time for this task to ensure the
implementation of the intervention.
• The amount of nutrition/ nursing support time estimated to be required for
the model was based on expert opinion and may have resulted in an under
or over estimate of intervention costs, but was considered a reasonable
estimate.
• The lack of costs that may be required for additional registered nurse time,
however it was decided that the additional nutrition/ nursing support time in
the model would provide support for registered nurses freeing up their time
for such higher clinical care duties; and lack of additional dietitian/
nutritionist staff time because a minimum dietitian/ nutritionist staffing
infrastructure is considered current minimum practice that should already
be in place. Both of these assumptions may have resulted in an
underestimation of the costs of the model, but the current predicted
economic savings allow substantial scope for more funds to be spent if
necessary on the implementation of other factors which might be required
for a nutrition support intervention.
7.6 CONCLUSION & CONTRIBUTIONS TO KNOWLEDGE
Firstly, this large scale multi-centre study has provided substantive evidence
that malnutrition is common in public acute (between 22-40%) and residential
Economic analysis of Malnutrition and Pressure ulcers M Banks June 2008
227
aged care facilities (approximately 50%) in Queensland, with prevalence
being higher in residential aged care facilities. This level of evidence on the
prevalence of malnutrition has not been available previously in the Australian
setting. Being malnourished was found to be significantly associated with:
older age groups, metropolitan location (compared with regional and rural and
remote locations) and medical specialty, in particular, oncology and critical
care patients.
Objective 2 of this research program demonstrated that being malnourished
increased the risk of the presence of pressure ulcer by more than two times,
with the risk increasing with severity of malnutrition. This study has provided
the first significant evidence of the association between malnutrition and
pressure ulcer in public acute and residential aged care facilities in Australia.
The independent association of poor nutritional status and pressure ulcers, as
found in this large multi-centre study has provided evidence that the nutritional
status of individuals at risk of, or with pressure ulcers should be addressed in
Queensland public hospitals and residential aged care facilities.
Objective 3 of this research program demonstrated that malnutrition
potentially has significant economic consequences for the Queensland public
health system with respect to patients with pressure ulcers occupying beds
that are not available for treatment of other patients. This study estimated
approximately one third of pressure ulcers attributable to malnutrition in
Queensland public hospitals in 2002/2003. This represents a substantial
number (approximate mean of 16000) of patient bed days lost to pressure
ulcers attributable to malnutrition, corresponding to a mean economic cost of
approximately AU$13 million for 2002/2003 in Queensland public hospitals.
Objective 4 of this research program demonstrated that the implementation of
an intervention of intensive nutrition support to nutritionally at risk patients is
predicted to be a cost effective approach to reduce the incidence of pressure
ulcers. This economic modeling study predicted that investment in intensive
nutrition support to at risk patients has the potential to realize substantial
opportunity cost savings for the health system, with respect to the prevention
of pressure ulcers and hence freeing up more bed days for the treatment of
Economic analysis of Malnutrition and Pressure ulcers M Banks June 2008
228
patients with other conditions. These economic modelling studies are the first
to the author’s knowledge to have used sound economic analysis
methodology to determine the economic costs of pressure ulcer attributable to
malnutrition, and the economic outcomes of nutrition intervention in the
prevention of pressure ulcers. These studies provide preliminary economic
evidence to justify the consideration of the implementation of systems to
identify, prevent and treat malnutrition, at least in the case of pressure ulcers.
In summary, this research program has demonstrated an independent
association between malnutrition and pressure ulcers, on a background of a
high prevalence of malnutrition, providing evidence to justify the elevation of
malnutrition to a safety and quality issue for Australian healthcare
organisations, similarly to pressure ulcers. In addition this research provides
preliminary economic evidence to justify the consideration of the requirement
for healthcare policy, standards and guidelines regarding systems to identify,
prevent and treat malnutrition, at least in the case of pressure ulcers in
Australia.
7.7 RECOMMENDATIONS FOR PRACTICE
The findings from these studies in conjunction with review of the literature
have identified aspects of practice that should be addressed. These include
the development of policies, standards and guidelines, along the lines of
those recommended by the Council of Europe, Committee of Ministers
(Council of Europe, 2003) and resources provided for implementation of the
following:
1. Systems which ensure that malnutrition or the risk of malnutrition is
identified and appropriate nutrition intervention implemented into hospitals and
residential aged care facilities. These include:
• Implementation of nutrition risk screening on admission and at regular
intervals. This should be integrated as part of an overall risk assessment of
individuals and the outcomes influence the patient care plan. Ideally
nutrition risk screening and pressure ulcer risk screening should be done

Economic analysis of Malnutrition and Pressure ulcers M Banks June 2008
229
in conjunction, with the outcomes of nutrition risk screening being
demonstrated to be integral to pressure ulcer risk.
• Nutrition care guidelines or pathways should be developed dependent on
nutritional risk including recommended diet and/or other form of nutrition
intervention and required type and level of monitoring required. Pathways
should include action to be taken if patients fail to meet nutritional goals
eg. when different forms of artificial nutrition support should be
implemented and associated processes.
2. Systems to minimize activities which may contribute to increasing an
individual’s risk of poor nutritional status, including:
• Avoidance of missing meals or prolonged periods of nutritionally
inadequate diets unless completely necessary.
• Undertaking activities at mealtimes which may reduce an individuals desire
to eat eg. changing dressings
3. Systems to ensure that a high quality and flexible food and nutrition service
are available to meet the needs of sick individuals, including:
• Access to a range of nutritious food and fluids based on patient
preferences at and between meal times.
• Ability to make up for missed meals.
• Assistance and encouragement with selection and consumption of food
and fluids or supplements is available.
4. Review of education of all clinical staff to include basic principles of
nutritional care of patients. This would lead to an increase in awareness of
nutritional issues of the sick and residents of care facilities and increase
nutrition knowledge and skills.
5. Guidelines for prevention and treatment of pressure ulcers include more
emphasis on the importance of nutritional status in pressure ulcer and provide
detailed guidelines with respect to nutrition screening linked to pressure ulcer
risk screening, nutritional intervention and monitoring of nutritional status.
Economic analysis of Malnutrition and Pressure ulcers M Banks June 2008
230
7.8 RECOMMENDATIONS FOR FUTURE RESEARCH
Recommendations for future research include:
• More high quality research investigating the relationship between intensive
nutritional support and the prevention and treatment of pressure ulcers.
Whilst the meta-analysis used demonstrated a significant reduction in the
incidence of pressure ulcer with intensive nutrition support compared with
standard care, only one of the five studies individually demonstrated
significance and several methodological limitations were identified.
• More high quality research investigating the relationship between intensive
nutrition support and the treatment of pressure ulcers. Studies indicate a
trend towards enhanced healing especially with the use of high protein
formulae (more than 20% protein of the energy in the formula is from
protein) or formulae developed specifically for use with pressure ulcers
(enriched with arginine, Vitamin C and zinc) but sample sizes in all studies
are small or methodology is otherwise poor.
• The cost effectiveness of other interventions to prevent pressure ulcers eg.
pressure ulcer relieving mattresses, and in comparison to intensive
nutrition support should be investigated to assist with decision making
regarding the best use of resources to reduce the incidence of pressure
ulcers.
• Economic evaluation of nutritional status in other disease states or
conditions should be undertaken to determine the economic
consequences of poor nutrition.
• The cost effectiveness of nutrition interventions in other disease states or
conditions should also be undertaken to determine the relative economic
value of nutrition intervention, and compared to other current or potential
interventions. For example, nutrition intervention versus drug therapy.
Economic analysis of Malnutrition and Pressure ulcers M Banks June 2008
231
CHAPTER 8 - REFERENCES
ABBASI, A. A. & RUDMAN, D. (1994) Undernutriton in the Nursing Home: Prevalence, Consequences, Causes and Prevention. Nutrition Reviews, 52, 113-122.
AIHW (2004) Australian Hospital Statistics 2002/2003, Canberra, Austalian Institute of Health and Welfare.
AIHW (2007) Australian Hospital Statistics 2005-2006, Canberra, Australian Institute of Health and Welfare.
AKNER, G. & CEDERHOLM, T. (2001) Treatment of protein-energy malnutrition in chronic nonmalignant disorders. American Journal of Clinical Nutrition, 74, 6-24.
ALLISON, S. P. (2000) Malnutrition, Disease, and Outcome. Nutrition, 16, 590-593. ALLISON, S. P. (2001) Hospital Food as Treatment, in Artificial Nutrition Support in
Clinical Practice, London, Greenwich Medical. ALLMAN, R. M., GOODE, P. S., BURST, N., BARTOLUCCI, A. A. & THOMAS,
D. R. (1999) Pressure ulcers, hospital complicaitons, and disease severity: impact on hospital costs and length of stay. Advances in Wound Care, 12, 22-30.
ALLMAN, R. M., GOODE, P. S., PATRICK, M. M., BURST, N. & BAROCLUCCI, A. A. (1995) Pressure ulcer risk factors among hospitalized patients with activity limitation. Journal of the American Medical Association, 273, 865-870.
ALLMAN, R. M., LAPRADE, C. A., NOEL, L. B., WALKER, J. M., MOORER, C. A., DEAR, M. R. & SMITH, C. R. (1986) Pressure sores among hospitalised patients. Annals of Internal Medicine, 105, 337-342.
AMERICAN DIETETIC ASSOCIATION (ADA) (1994) ADA's definitions for nutrition screening and nutrition assessment. Journal of the American Dietetic Association, 94, 838-839.
ANDERSON, G. F. & STEINBERG, E. P. (1986) DRGs and Specialized Nutrition Support. Prospective Payment and Nutritional Support: The Need for Reform. Journal of Parenteral and Enteral Nutrition, 10, 3-8.
ARNAUD-BATTANDIER, F., MALVY, D., JEANDEL, C., SCHMITT, C., AUSSAGE, P., BEAUFRÉRE, B. & CYNOBER, L. (2004) Use of oral supplements in malnourished elderly patients living in the community: a pharmaco-economic study. Clinical Nutrition, in press.
ASKEW, A. R., SUI, S., GREEN, M. K., REIBELT, L. D., GALL, K. L. & BALDERSON, G. A. (1982) Evaluation of the nutritional state of surgical patients in Brisbane. Australian New Zealand Journal of Surgery, 52, 117-120.
ASPEN BOARD OF DIRECTORS (2002) Nutrition Assessment - Adults. Journal of Parenteral and Enteral Nutrition, 26 (1), supplement, 9SA-12SA.
AUSTALIAN COUNCIL ON HEALTHCARE STANDARDS (2006) Table of EQuIP 4 Functions, Standards and Criteria. www.achs.org.au/pdf/E4A3_poster.mandcriteria.pdf.
AUSTRALIAN WOUND MANAGEMENT ASSOCIATION (2001) Clinical practice guidelines for the prediction and prevention of pressure ulcers. , West Leederville, W.A, Cambridge Publishing.
Economic analysis of Malnutrition and Pressure ulcers M Banks June 2008
232
AVENELL, A. & HANDOLL, H. H. (2006) Nutritional supplementation for hip fracture aftercare in older people. The Cochrane Database of Systematic Reviews, Issue 4, Art. No. CD001880. DOI: 10.1002/14651858.pub4.
AZAD, N., MURPHY, J., AMOS, S. S. & TOPPAN, J. (1999) Nutrition survey in an elderly population following admission to a tertiary care hospital. Canadian Medical Association Journal, 161, 511-515.
BALDWIN, C., PARSONS, T. & LOGAN, S. (2007) Dietary advice for illness-related malnutrition in adults. Cochrane Database of Systematic Reviews, Issue 1, Art No.: CD002008. DOI: 10.1002/14651858.CD002008.pub2.
BANKS, M. (1995) Nutrition Screening and Prevalence of Malnutrition in an Australian Public Hospital: Validation of a level 1 admission screen. School of Public Health. Brisbane, Queensland University of Technology.
BANKS, M. (2003) Screening for Malnutrition in Queensland Health Institutions - Barriers and Strategies (unpublished report). Brisbane, Queensland University of Technology (QUT).
BARRETO PENIE, J. B. (2005) Cuban Group for the study of hospital malnutrition: State of malnutrition in Cuban hospitals. Nutrition, 21, 487-497.
BARTON, A. D., BEIGG, C. L., MACDONALD, I. A. & ALLISON, S. P. (2000a) High food wastage and low nutritional intakes in hospital patients. Clinical Nutrition, 19, 445-449.
BARTON, A. D., BEIGG, C. L., MACDONALD, I. A. & ALLISON, S. P. (2000b) A recipe for improving food intake in elderly hospitalized patients. Clinical Nutrition, 19, 451-454.
BASTOW, M. D., RAWLINGS, J. & ALLISON, S. P. (1983) Benefits of supplementary tube feeding after fractured neck of femur: a randomised controlled trial. British Medical Journal, 287, 1589-1592.
BAUER, J., CAPRA, S. & FERGUSON, M. (2002) Use of the scored Patient Generated Subjective Global Assessment (PG-SGA) as a nutrition assessment tool in patients with cancer. European Journal of Clinical Nutrition, 56, 1-7.
BECK, A. M., BALKNAS, U. N., CAMILO, M. E., FURST, P., GENTILE, M. G., HASUNEN, K., JONES, L., JONKERS-SCHUITEMA, C. F., KELLER, U., MELCHIOR, J.-C., MIKKELSEN, B. E., PAVCIC, M., SCHAUDER, P., SIVONEN, L., ZINCK, O., OIEN, H. & OVESEN, L. (2002) Practices in relation to nutritional care and support - report from the Council of Europe. Clinical Nutrition, 21, 351-354.
BECK, A. M., BALKNAS, U. N., FURST, P., HASUNEN, K., JONES, L., KELLER, U., MELCHIOR, J.-C., MIKKELSEN, B. E., SCHAUDER, P., SIVONEN, L., ZINCK, O., OIEN, H. & OVESEN, L. (2001a) Food and nutritional care in hospitals: how to prevent undernutrition - report and guidelines from the Council of Europe. Clinical Nutrition, 20, 455-460.
BECK, A. M., OVESEN, L. & OSLER, M. (1999) The Mini Nutritional Assessment (MNA) and the Determine Your Nutritional Health Checklist (NSI Checklist) as predictors of morbidity and mortality in an elderly Danish population. British Journal of Nutrition, 81, 31-36.
BECK, A. M., OVESEN, L. & SCHROLL, M. (2001b) A six months' prospective follow up of 65+ year old patients from general practice classified according to nutritional risk by the Mini Nutritional Assessment. European Journal of Clinical Nutrition, 55, 1028-1033.
BECK, E., PATCH, C., MILOSAVLJEVIC, M., MASON, S., WHITE, C., CARRIER, M. & LAMBERT, K. (2001c) Implementation of malnutrition
Economic analysis of Malnutrition and Pressure ulcers M Banks June 2008
233
screening and assessment by dietitians: malnutrition exists in acute and rehabilitation settings. Australian Journal of Nutrition and Dietetics, 58, 92-97.
BECKRICH, K. & ARONOVITCH, A. (1999) Hospital-acquired pressure ulcers: A comparison of costs in medical and surgical patietns. Nursing Economics, 17, 263-271.
BENATI, G., DELVECCHIO, S., CILLA, D. & PEDONE, V. (2001) Impact on pressure ulcer healing with an arginine-enriched nutritional solutions in patient swith severe cognitive impairment. Archives of Gerontology and Geriatrics, 33 (Suppl. 7), 43-47.
BERGEMANN, R., LAUTERBACH, K. W., VANSCHEIDT, W., NEANDER, K.-D. & ENGST, R. (1999) Economic evaluation of the treatment of chronic wounds. Pharmacoeconomics, 16, 367-377.
BERGSTOM, N., BRADEN, B., LAZUAZZA, A. & HOLMAN, V. (1987) The Braden scale for predicting pressure sore risk. Nursing Clinics of North America, 22, 417-428.
BERGSTROM, N., HORN, S. D., SMOUT, R. J., BENDER, S. A., FERGUSON, M. L., TALER, G., SAUER, A. C., SHARKEY, S. S. & COBLE VOSS, A. (2005) The national pressure ulcer long-term care study: Outcomes of pressure ulcer treatments in long-term care. Journal of the American Geriatrics Society, 53, 1721-1729.
BERLOWITZ, D. R., BEZERRA, H. Q., BRANDEIS, G. H., KADER, B. & ANDERSON, J. J. (2000) Are we improving the quality of nursing home care: The case of pressure ulcers. Journal of the American Geriatrics Society, 48, 59-62.
BERNSTEIN, L. H., SHAW-STIFFEL, T. A., SCHOROW, M. & BROUILLETTE, R. (1993) Financial Implications of Malnutrition. Clinics in Laboratory Medicine, 13, 491-507.
BISTRIAN, B. R. (1984) Nutritional Assessment of the Hospitalized patient: A Practical Approach. IN WRIGHT, R. A. & HEYMSFIELD, S. (Eds.) Nutritional Assessment. USA, Blackwell Scientific Publications.
BISTRIAN, B. R., BLACKBURN, G. L., HALLOWELL, E. & HEDDLE, R. (1974) Protein status of General Surgical Patients. Journal of the American Medical Association, 230, 858-860.
BISTRIAN, B. R., BLACKBURN, G. L., VITALE, J., COCHRAN, D. & NAYLOR, J. (1976) Prevalence of Malnutrition in General Medical Patients. Journal of the American Medical Association, 235, 1567-1570.
BLACKBURN, G. L. & AHMAD, A. (1995) Skeleton in the Hospital Closet - Then and Now. Nutrition, 11 (supplement), 193-195.
BOURDEL-MARCHASSON, I., BARATEAU, M., RONDEAU, V., DEQUAE-MERCHADOU, L., SALLES-MONTAUDON, N., EMERIAU, J.-P., MANCIET, G. & DARIGUES, J.-F. (2000) A multi-centre trial of the effects of oral nutritional supplementation in critically ill older inpatients. Nutrition, 16, 1-5.
BRADEN, B. & BERGSTROM, N. (1987) A conceptual scheme for the study of the etiology of pressure sores. Rehabilitation Nursing, 12.
BRANTERVIK, A. M., JACOBSSON, I. E., GRIMBY, A., WALLEN, T. C. E. & BOSAEUS, I. G. (2005) Older hospitalised patients at risk of malnutrition: correlation with quality of life, aid from the social welfare system and length of stay? Age and Ageing, 34, 444-449.
Economic analysis of Malnutrition and Pressure ulcers M Banks June 2008
234
BRAUNSCHWEIG, C., GOMEZ, S. & SHEEAN, P. M. (2000) Impact of declines in nutritional status on outcomes in adult patients hospitalized for more than 7 days. Journal of the American Dietetic Association, 100, 1316-1322.
BRESLOW, R. A. & BERGSTROM, N. (1994) Nutritional prediction of pressure ulcers. Journal of the American Dietetic Association, 94, 1301-1304.
BRESLOW, R. A., HALLFRISHCH, J., GUY, D. G., CRAWLEY, B. & GOLDBERG, A. P. (1993) The importance of dietary protein in healing pressure ulcers. Journal of the American Geriatrics Society, 41, 357-362.
BROWNIE, S. (2006) Why are elderly individuals at risk of nutritional deficiency? International Journal of Nursing Practice, 12, 110-118.
BRUGLER, L., DIPRINZIO, M. J. & BERNSTEIN, L. H. (1999) The five-year evolution of a malnutrition treatment program in a community hospital. Joint Commission Journal of Quality Improvement, 25, 191-206.
BRUUN, L. I., BOSAEUS, I., BERGSTAD, I. & NYGAARD, K. (1999) Prevalence of malnutrition in surgical patients: evaluation of nutritional support and documentation. Clinical Nutrition, 18, 141-147.
BURGE, K. & GAZIBARICH, B. (1999) Nutritional risk among a sample of community-living elderly attending senior citizens' centres. Australian Journal of Nutrition and Dietetics, 56, 137-143.
BURNEY, J. & HAUGHTON, B. (2002) EFNEP: A nutrition education program that demonstrates cost-benefit. Journal of the American Dietetic Association, 102, 39-45.
BURNS, J. T. & JENSEN, G. L. (1995) Malnutrition Among Geriatric Patients Admitted to Medical and Surgical Services in a Tertiary Care Hospital: Frequency, Recognition, and Associated Disposition and Reimbursement Outcomes. Nutrition, 11 (supplement), 245-249.
BUTTERWORTH, C. E. (1974) The Skeleton in the Hospital Closet. Nutrition Today, March/April, 4-8.
BUTTERWORTH, C. E. & BLACKBURN, G. L. (1975) Hospital Malnutrition. Nutrition Today, March/April, 8-18.
CAMPBELL, K. L., ASH, S., BAUER, J. & DAVIES, P. (2007) Critical review of nutrition assessment tools to measure malnutrition in chronic kidney disease. Nutrition and Dietetics, 64, 23-30.
CAPON, A., PAVONI, N., MASTROMATTEI, A. & DI LALLO, D. (2007) Pressure ulcer risk in long-term units: prevalence and associated factors. Journal of Advanced Nursing, 58, 263-272.
CAPRA, S. (2007) Nutrition assessment or nutrition screening - How much information is enough to make a diagnosis of malnutrition in acute care? Nutrition, 23, 356-357.
CAPRA, S., BAUER, J., DAVIDSON, W. & ASH, S. (2002) Nutritional therapy for cancer-induced weight loss. Nutrition in Clinical Practice, 17, 210-213.
CARR, E. K. & MITCHELL, J. R. A. (1991) A comparison of the mealtime care given to patients by nurses using two different meal delivery systems. International Journal Nursing Studies, 28, 19-25.
CARRIER, N., OUELLET, D. & WEST, G. (2007) Nursing Home Food Services: Linked with Risk of Malnutrition. Canadian Journal of Dietetic Practice and Research, 68, 14-20.
CASIMIRO, C., GARCIA-DE-LORENZO, A. & USAN, L. (2002) Prevalence of Decubitus Ulcer and Associated Risk Factors in an Institutionalized Spanish Elderly Population. Nutrition, 18, 408-414.
Economic analysis of Malnutrition and Pressure ulcers M Banks June 2008
235
CHARLIER, C. (2001) Prevalence, incidence and risk: a study of pressure ulcers at a rural base hospitals. Primary Intention, 9, 12-21.
CHERNOFF, R. S., MILTON, K. Y. & LIPSCHITZ, D. A. (1990) The effect of a very high protein liquid formula on decubitus ulcers healingin long term tube fed institutionalized patients. Journal of the American Dietetic Association, 90, A - 130.
CHIMA, C. S., BARCO, K., DEWITT, M. L. A., MAEDA, M., TERAN, J. C. & MULLEN, K. D. (1997) Relationship of nutritional status to length of stay, hospital costs, and discharge status of patients hospitalized in the medicine service. Journal of the American Dietetic Association, 97, 975-978.
CHRISTENSEN, K. S. (1986) Hospitalwide screenng increases revenue under prospective payment system. Journal of the American Dietetic Association, 86, 234.
CHRISTENSEN, K. S. & GSTUNDTNER, K. M. (1985) Hospital-wide screening improves basis for nutrition intervention. Journal of the American Dietetic Association, 85, 704-706.
CHRISTENSSON, L., UNOSSON, M. & EK, A. (2002) Evaluation of nutritional assessment techniques in elderly people newly admitted to municipal care. European Journal of Clinical Nutrition, 56, 810-818.
CLARK, M. (2003) Nutritional guidelines for pressure ulcer prevention and treatment. IN WWW.EPUAP.ORG/GUIDELINES/INDEX.HTML (Ed.).
CLARK, M., BENBOW, M., BUTCHER, M., GEBHARDT, K., TEASLEY, G. & ZOLLER, J. (2002) Collecting pressure ulcer prevention and management outcomes: 1. British Journal of Nursing, 11, 230-238.
CLOUGH, N. P. (1994) The cost of pressure area management in an intensive care unit. Journal of Wound Care, 3, 33-35.
COATS, K. G., MORGAN, S. L., BARTOLUCCI, A. A. & WEISNER, R. L. (1993) Hospital-associated malnutrition: A reevaluation 12 years later. Journal of the American Dietetic Association, 93, 27-33.
COBLE VOSS, A., BENDER, S. A., FERGUSON, M. L., SAUER, A. C., BENNETT, R. G. & HAHN, P. W. (2005) Long-term care liability for pressure ulcers. Journal of the American Geriatrics Society, 53, 1587-1592.
COMPAN, B., DI CASTRI, A., PLAZE, J. M. & ARNAUD-BATTANDIER, F. (1999) Epidemiological study of malnutrition in elderly patients in acute, sub-acute and long-term care using the MNA. Journal of Nutrition, Health & Aging, 3, 146-151.
COOPER, B. A., BARTLETT, L. H., ASLANI, A., ALLEN, B. J., IBELS, L. S. & POLLOCK, C. A. (2001) Validity of Subjective Global Assessment as a Nutritional Marker in End-Stage Renal Disease. American Journal of Kidney Diseases, 40, 126-132.
CORDEIRO, M. B. C., ANTONELLI, E. J., DA CUNHA, D. F., JORDAO, A. A., RODRIGUES, V. & VANNUCCHI, H. (2005) Oxidative stress and acute-phase response in patients with pressure sores. Nutrition, 21, 901-907.
CORISH, C. A. & KENNEDY, N. P. (2000) Protein-energy malnutrition in hospital in-patients. British Journal of Nutrition, 83, 575-591.
CORREIA, M. I. T. D. & CAMPOS, A. C. L. (2003) Prevalence of Hospital Malnutrition in Latin America: The Multicenter ELAN Study. Nutrition, 19, 823-825.
Economic analysis of Malnutrition and Pressure ulcers M Banks June 2008
236
CORREIA, M. I. T. D., MARTINS, C. A. & AMARAL, T. F. (2003) Efficiency of MST- Malnutrition Screening Tool - in elderly hospitalised patients. Clinical Nutrition, 22 Supp 1, S10.
CORREIA, M. I. T. D. & WAITZBERG, D. L. (2003) The impact of malnutrition on morbidity, mortality, length of hospital stay and costs evaluated through a multivariate model analysis. Clinical Nutrition, 22, 235-239.
COUNCIL OF EUROPE (2003) Resolution ResAP(2003)3E on food and nutritional care in hospitals. www.coe.int.
COVINSKY, K. E., MARTIN, G. E., BEYTH, R. J., JUSTICE, A. C., SEHGAL, A. R. & LANGEFELD, C. S. (1999) The relationship between clinical assessments of nutritional status and adverse outcomes in older hospitalized medical patients. Journal of the American Geriatrics Society, 47, 532-538.
CRESSWELL, A. (2007) Wait for elective surgery getting longer by the year. The Australian Newspaper 31/05/07. National.
DAMBACH, B., SALLE, A., MARTEAU, C., MOUZET, J.-B., GHALI, A., FAVREAU, A.-M., BERRUT, G. & RITZ, P. (2005) Energy requirements are not greater in elderly patients suffering from pressure ulcers. Journal of the American Geriatrics Society, 53, 478-482.
DAVIDSON, W., ASH, S., CAPRA, S. & BAUER, J. (2004) Weight stabilisation is associated with improved survival duration and quality of life in unresectable pancreatic cancer. Clinical Nutrition, 23, 239-247.
DEFLOOR, T., SCHOONHOVEN, L., KATRIEN, V., WESTRATE, J. & MYNY, D. (2006) Reliability of the European Pressure Ulcer Advisory Panel classification system. Journal of Advanced Nursing, 54, 189-198.
DELAHANTY, L. M., SONNENBERG, L. M., HAYDEN, D. & NATHAN, D. M. (2002) Clinical and cost outcomes of medical nutrition therapy for hypercholesterolaemia; a controlled trial. Journal of the American Dietetic Association, 101, 1012-1023.
DELHEY, D. M., ANDERSON, E. J. & LARAMEE, S. H. (1989) Implications of malnutrition and diagnosis-related groups (DRGs). Journal of the American Dietetic Association, 89, 1448-1451.
DELMI, M., RAPIN, C. H., BENGOA, J. M., DELMAS, P. D., VASEY, H. & BONJOUR, J. P. (1990) Dietary supplementation in elderly patients with fractured neck of the femur. The Lancet, 335, 1013-1016.
DEPARTMENT OF HEALTH (DOH) (2001) The Single Assessment Process Assessment Tools and Scales, London, HMSO.
DESNEVES, K. J., TODOROVIC, B. E., CASSAR, A. & CROWE, T. C. (2005) Treatment with supplementary arginine, vitamin C and zinc in patients with pressure ulcers: A ranomised controlled trial. Clinical Nutrition, 24, 979-987.
DETSKY, A. S., BAKER, J. P., O'ROURKE, K., JOHNSTON, N., WHITWELL, J., MENDELSON, R. A. & JEEJEEBHOY, K. N. (1987a) Predicting Nutrition-Associated Complications for Patients Undergoing Gastrointestinal Surgery. Journal of Parenteral and Enteral Nutrition, 11, 440-446.
DETSKY, A. S., MCLAUGHLIN, J. R., BAKER, J. P., JOHNSTON, N., WHITTAKER, S., MENDELSON, R. A. & JEEJEEBHOY, K. N. (1987b) What is Subjective Global Assessment of Nutritional Status? Journal of Parenteral and Enteral Nutrition, 11, 8-13.
DONINI, L. M., ROSANO, A., DE FELICE, M. R., TASSI, L., DE BERNARDINI, L., PINTO, A., GIUSTI, A. M. & CANNELLA, C. (2003) MNA predictive
Economic analysis of Malnutrition and Pressure ulcers M Banks June 2008
237
value in the follow up of geriatric patients. Journal of Nutrition, Health & Aging, 75, 282-293.
DREBLOW, D. M., ANDERSON, C. F. & MOXNESS, K. (1981) Nutritional Assessment of Orthopaedic Patients. Mayo Clinic Proceedings, 56, 51-54.
DRUMMOND, M. F., SCULPHER, M. J., TORRANCE, G. W., O'BRIEN, B. J. & STODDART, G. L. (2005) Methods for Economic Evaluation 3rd Edition, Oxford University Press.
DUERKSEN, D. R., YEO, T. A., SIEMENS, J. L. & O'CONNOR, M. P. (2000) The validity and Reproducibility of Clinical Assessment of Nutritional Status in the Elderly. Nutrition, 16, 740-744.
DUNK, A.-M. & TREVIT, C. (2005) How the AWMA Clinical Practice Guidelines for Prediction and Prevention of Pressure Ulcers are being used across the ACT. Primary Intention, 13, 121.
DUPERTIUIS, Y. M., KOSSOVSKY, M. P., KYLE, U. G., RAGUSO, C. A., GENTON, L. & PICHARD, C. (2003) Food intake in 1707 hospitalized patients: a prospective comprehensive hospital survey. Clinical Nutrition, 22, 115-123.
DZIENISZEWSKI, J., JAROSZ, M., SZCZYGIEL, B., DIUGOSZ, J., MARLICZ, K., LINKE, K., LACHOWICZ, A., RYZKO-SKIBA, M. & ORZESZKO, M. (2005) Nutritional status of patients hospitalised in Poland. European Journal of Clinical Nutrition, 59, 552-560.
EDINGTON, J., BOORMAN, J., DURRANT, E. R., PERKINS, A., GIFFIN, C. V., JAMES, R., THOMSON, J. M., OLDROYD, J. C., SMITH, J. C., TORRANCE, A. D., BLACKSHAW, V., GREEN, S., HILL, C. J., BERRY, C., MCKENZIE, C., VICCA, N., WARD, J. E. & COLES, S. J. (2000) Prevalence of malnutrition on admission to four hospitals in England. Clinical Nutrition, 19, 191-195.
EDINGTON, J., KON, P. & MARTYN, C. N. (1997) Prevalence of malnutrition after major surgery. Journal of Human Nutrition and Dietetics, 10, 111-116.
EK, A., UNOSSON, M., LARSSON, J., VON SCHENCK, H. & BJURULF, P. (1991) The development and healing of pressure sores related to the nutritional state. Clinical Nutrition, 10.
ELIA, M. (2006) Nutrition and health economics. Nutrition 22, 576-578. ELMORE, M. F., WAGNER, D. R., KNOLL, D. M., EIZEMBER, L., OSWALT, M.
A., GLOWINSKI, E. A. & RAPP, P. A. (1994) Developing an effective adult nutrition screening tool for a community hospital. Journal of the American Dietetic Association, 94, 113-1118,1121.
EPUAP (2001) European Pressure Ulcer Advisory Panel. Pressure ulcer prevention guidelines and pressure ulcer treatment guidelines. . Available at: www.epuap.org.
EPUAP (2003) European Pressure Ulcer Advisory Panel. www.epuap.org.uk. FARTHING, M. J. G. (1994) Malnutrition in the Wards of the World. Nutrition, 10,
434-425. FERGUSON, M. (1999) Determination of the impact of nutrition screening and
support of outcomes in adult acute hospital inpatients with malnutrition. Centre for Public Health Research. Brisbane, Queensland University of Technology.
FERGUSON, M. & CAPRA, S. (1998) Nutrition screening practices in Australian hospitals. Australian Journal of Nutrition and Dietetics, 55, 157-161.
Economic analysis of Malnutrition and Pressure ulcers M Banks June 2008
238
FERGUSON, M., CAPRA, S., BAUER, J. & BANKS, M. (1997) Coding for malnutrition enhances reimbursement under casemix-based funding. Australian Journal of Nutrition and Dietetics, 54, 102-108.
FERGUSON, M., CAPRA, S., BAUER, J. & BANKS, M. (1999) Development of a valid and reliable malnutrition screening tool for adult acute hospital patients. Nutrition, 15, 458-464.
FERREIRA, I. M., BROOKS, D., LACASSE, Y., GOLDSTEIN, R. S. & WHITE, J. (2005) Nutritional supplementation for stable chronic obstructive pulmonary disease. Cochrane Database of Systematic Reviews, Issue 2, Art. No: CD000998. DOI: 10.1002/14651858.pub2.
FISHER, A. R., WELLS, G. & HARRISON, M. B. (2004) Factors associated with pressure ulcers in adults in acute care hospitals. Advances in Skin and Wound Care, 17, 80-90.
FRANZ, M. J., SPLETT, P. L., MONK, A., BARRY, B., MCCLAIN, K., WEAVER, T., UPHAM, P., BERGENSTAL, R. & MAZZE, R. S. (1996) Cost-effectiveness of medical nutrition therapy provided by dietitians for persons with non-insulin-dpendent diabetes mellitus. Journal of the American Dietetic Association, 95, 1018-1024.
FRIEDMANN, J. M., JENSEN, G. L., SMICIKLAS-WRIGHT, H. & MCCAMISH, M. A. (1997) Predicting early nonelective hospital readmission in nutritionally compromised older adults. American Journal of Clinical Nutrition, 65, 1714-1720.
GALL, K. L., GRIMBLE, G. K., REEVES, N. J. & THOMAS, S. J. (1998) Effect of providing fortified meals and between meal snacks on energy and protein intake of hospital patients. Clinical Nutrition
17, 259-264. GALLAGHER-ALLRED, C. R., VOSS, A. C., FINN, S. C. & MCCAMISH, M. A.
(1996) Malnutrition and clinical outcomes: The case for medical nutrition therapy. Journal of the American Dietetic Association, 96, 361-366,369.
GARIBALLA, S. E. (2001) Malnutrition in hospitalized elderly patients: when does it matter? Clinical Nutrition, 20, 487-491.
GAZZOTTI, C., ALBERT, A., PEPINSTER, A. & PETERMANS, J. (2000) Clinical usefulness of the mini nutritional assessment (MNA) scale in geriatric medicine. Journal of Nutrition, Health & Aging, 4, 176-181.
GIBSON, R. S. (1990) Principles of Nutrition Assessment, Oxford University Press. GINER, M., LAVIANO, A., MEGUID, M. M. & GLEASON, J. R. (1995) In 1995 a
correlation between malnutrition and poor outcome in critically ill patients still exists. Nutrition, 12, 23-29.
GOSNELL, D. J., JOHANNSEN, J. & AYRES, M. (1992) Pressure ulcer incidence and severity in a community hospitals. Decubitus, 5, 56-62.
GRANICK, M. S., MCGOWAN, E. & LONG, C. D. (1998) Outcome assessment of an in-hospital cross functional wound care team. Plastic and Reconstructive Surgery, 101, 1243-1247.
GRAVES, N., BIRRELL, F. A. & WHITBY, M. (2005a) Effect of Pressure Ulcers on length of hospital stay. Infection Control and Hospital Epidemiology, 26, 293-297.
GRAVES, N., BIRRELL, F. A. & WHITBY, M. (2005b) Modeling the economic losses from pressure ulcers among hospitalized patients in Australia. Wound Repair and Regeneration, 13, 462-467.
Economic analysis of Malnutrition and Pressure ulcers M Banks June 2008
239
GREEN, C. J. (1999) Existence, causes and consequences of disease-related malnutrition in the hospital and the community, and clinical and financial benefits of nutritional intervention. Clinical Nutrition, 18 (Supplement), 3-28.
GREY, J. E., ENOCH, S. & HARDING, K. G. (2006) ABC of wounding healing: Pressure Ulcers. British Medical Journal, 332.
GUIGOZ, Y., VELLAS, B. & GARRY, P. J. (1996) Assessing the Nutritional Status of the Elderly: The Mini Nutritional Assessment as Part of the Geriatric Evaluation. Nutrition Reviews, 54, S59-S65.
HALL, K., WHITING, S. & COMFORT, B. (2000) Low nutrient intake contributes to adverse clinical outcomes in hospitalized elderly patients. Nutrition Reviews, 58, 214-217.
HARTGRINK, H. H., WILLE, J., KONIG, P., HERMANS, J. & BRESLAU, P. J. (1998) Pressure sores and tube feeding in patients with a fracture of the hip: a randomized clinical traial. Clinical Nutrition, 17, 287-292.
HASTINGS, N. A. J. & PEACOCK, J. B. (1975) Statistical Distributions. A handbook for students and practitioners, Butterworths. London.
HILL, G. L., BLACKETT, R. L., PICKFORD, I., BURKINSHAW, L., YOUNG, G. A., WARREN, J. V., SCHORAH, C. J. & MORGAN, D. B. (1977) Malnutrition in Surgical Patients: An unrecognized Problem. The Lancet, March 26, 689-692.
HORN, S. D., BENDER, S. A., FERGUSON, M. L., SMOUT, R. J., BERGSTROM, N., TALER, G., COOK, A. S., SHARKEY, S. S. & COBLE VOSS, A. (2004) The national pressure ulcer long-term care study: pressure ulcer development in long-term care residents. Journal of the American Geriatrics Society, 52.
HOUWING, R. H., RZENDAAL, M., WOUTERS-WESSELING, W., BEULENS, J. W. J., BUSKENS, E. & HAALBROOM, J. R. (2003) A randomised, double-blind assessment of the effect of nutritional supplementation on the prevention of pressure ulcers in hip-fracture patients. Clinical Nutrition, 22, 401-405.
HUANG, Y.-C. (2001) Malnutrition in the Critically Ill. Nutrition, 17, 745-746. HUNT, D. R., MASLOVITZ, A., ROWLANDS, B. J. & BROOKS, B. (1985) A
simple nutrition screening procedure for hospital patients. Journal of the American Dietetic Association, 85, 332-335.
IGLESIAS, C., NIXON, J., CRANNY, G., NELSON, E. A., HAWKINS, K., PHILLIPS, A., TORGERSON, D., MASON, S., CULLUM, N. & GROUP, A. P. T. (2007) Pressure relieveing support surfaces (PRESSURE) trial: cost-effectiveness analysis. British Medical Journal, in press.
INCALZI, A. R., CAPPARELLA, O., GEMMA, A., LANDI, F., PAGANO, F., CIPRIANI, L. & CARBONIN, P. (1998) Inadequate caloric intake: a risk factor for mortality of geriatric patients in the acutre-care hospital. Age and Ageing, 27, 303-310.
ISENRING, E., BAUER, J. & CAPRA, S. (2003) The scored Patient-generated Subjective Global Assessment (PG-SGA) and its association with quality of life in ambulatory patients receiving radiotherapy. European Journal of Clinical Nutrition, 57, 305-309.
ISENRING, E., CAPRA, S. & BAUER, J. (2004) Nutrition intervention is beneficial in oncology outpatients receiving radiotherapy to the gastrointestinal or head and neck areas. British Journal of Cancer, in press.
IZAWA, S., KUZUYA, M., OKIDA, K., ENOKI, H., KOIKE, T., KANDA, S. & IGUCHI, A. (2006) The nutritional status of frail elderly with care needs according to the mini-nutritional assessment. Clinical Nutrition, 25, 962-967.
Economic analysis of Malnutrition and Pressure ulcers M Banks June 2008
240
JCAHO (2003) Joint Commission on Accreditation of Healthcare Organisations: Comprehensive Accreditation Manual for Hospitals. , Chicago, Il.
JCAHO (2007) National Patient Safety Goals. Available at: www.jointcommission.org/PatientSafety/NationalPatientSafetyGoals.
JEEJEEBHOY, K. N. (2000) Nutritional Assessment. Nutrition, 16, 585-589. JEEJEEBHOY, K. N. (2003) Hospital malnutrition: is a disease or lack of food.
Clinical Nutrition, 22, 219-220. JOANSEN, N., KONDRUP, J., PLUM, L. M., BAK, L., NORREGAARD, P.,
BUNCH, E., BAERNTHSEN, H., ANDERSON, J. R., LARSEN, I. H. & MARTINSEN, A. (2004) Effect of nutritional support on clinical outcome in patients at nutritional risk. Clinical Nutrition, in press.
JORDAN, S., SNOW, D., HAYES, C. & WILLIAMS, A. (2003) Introducing a nutrition screening tool: an exploratory study in a district general hospital. Journal of Advanced Nursing, 44, 12-23.
KAMATH, S. K., LAWLER, M., SMITH, A. E., KALAT, T. & OLSON, R. (1986) Hospital malnutrition: A 33-hospital screening study. Journal of the American Dietetic Association, 86, 203-206.
KELLY, I. E., TESSIER, S., CAHILL, A., MORRIS, S. E., CRUMLEY, A., MCLAUGHLIN, D., MCKEE, R. F. & LEAN, M. E. J. (2000) Still hungry in hospital: identifying malnutrition in acute hospital admissions. Quality Journal Medicine, 93, 93-98.
KONDRUP, J., ALLISON, S. P., ELIA, M., VELLAS, B. & PLAUTH, M. (2003a) ESPEN Guidelines for Nutrition Screening 2002. Clinical Nutrition, 22, 415-421.
KONDRUP, J., JOHANSEN, N., PLUM, L. M., BAK, L., HOJLUND LARSEN, I., MARTINSEN, A., ANDERSON, J. R., BAERNTHSEN, H., BUNCH, E. & LAUESEN, N. (2002) Incidence of nutritional risk and causes of inadequate nutritional care in hospitals. Clinical Nutrition, 21, 461-468.
KONDRUP, J., RASMUSSEN, H. H., HAMBERG, O. & STANGA, Z. (2003b) Nutritional risk screening (NRS 2002): a new method based on an analysis of controlled clinical trials. Clinical Nutrition, 22, 321-336.
KOWANKO, I. (1997) The role of the nurse in food service: A literature review and recommendations. International Journal of Nursing Practice, 3, 73-78.
KRUIZENGA, H. M., WIERDSMA, N. J., VAN BOKHORST, M. A. E., VAN DER SCHUEREN, D., HOLLANDER, H. J., JONKERS-SCHUITEMA, C. F., VAN DER HEIJDEN, E., MELIS, G. C. & VAN STAVEREN, W. A. (2003) Screening of nutritional status in The Netherlands. Clinical Nutrition, 22, 147-152.
KUZUYA, M., KANDA, S., KOIKE, T., SUZUKI, Y., SATAKE, S. & IGUCHI, A. (2005) Evaluation of Mini-Nutritional Assessment for Japanse frail elderly. Nutrition, 21, 498-503.
KYLE, U. G., PIRLICH, M., SCHEUTZ, T., LUEBKE, H. J., LOCHS, H. & PICHARD, C. (2003) Prevalence of malnutrition in 1760 patients at hospital admission: a controlled population study of body composition. Clinical Nutrition, 22, 473-481.
KYLE, U. G., UNGER, P., MENSI, N., GENTON, L. & PICHARD, C. (2002) Nutrition Status in Patients Younger and Older Than 60 y at Hospital Admission: A Controlled Population Study in 995 Subjects. Nutrition, 18, 463-469.
Economic analysis of Malnutrition and Pressure ulcers M Banks June 2008
241
LAHMANN, N., HALFENS, R. J. G. & DASSEN, T. (2006) Effect of non-response bias in pressure ulcer prevalence studies. Journal of Advanced Nursing, 55, 230-236.
LANGEMO, D. K., OLSON, B., HUNTER, S., HANSON, D., BURD, C. & CATHCART-SILBERBERG, T. (1991) Incidence and prediction of pressure ulcers in five patient care settings. Decubitus, 4, 25-32.
LANGER, G., SCHLOEMER, G., KNERR, A., KUSS, O. & BEHRENS, J. (2003) Nutritional interventions for preventing and treating pressure ulcers The Cochrane Database of Systematic Reviews, Art. No.: CD003216. DOI: 10.1002/14651858. CD003216.
LAPSLEY, H. M. & VOGELS, R. (1996) Cost and prevention of pressure ulcers in an acute teaching hospital. International Journal for Quality in Health Care, 8, 61-66.
LARSSON, J., AKERLIND, I., PERMERTH, J. & HORNQVIST, J. O. (1994) The Relation Between Nutritional State and Quality of Life in Surgical Patients. European Journal of Surgery, 160, 329-334.
LAZARUS, C. & HAMLYN, J. (2005) Prevalence and documentation of malnutrition in hospitals: A case study in a large private hospital setting. Nutrition and Dietetics, 62, 41-47.
LEE, S. K., POSTHAUER, M. E., DORNER, B., REDOVIAN, V. & MALONEY, M. J. (2006) Pressure ulcer healing with a concentrated, fortified, collagen protein hydrolysate supplement: A randomized controlled trial. Advances in Skin and Wound Care, 19, 92-96.
LENNARD-JONES, J. E. (1992) A Positive Approach to Nutrition as Treatment, The King's Fund Centre.
LENNARD-JONES, J. E., ARROWSMITH, H., DAVISON, C., DENHAM, A. F. & MICKLEWRIGHT, A. (1995) Screening by nurses and junior doctors to detect malnutrition when patients are first assessed in hospital. Clinical Nutrition, 14, 336-340.
LESLIE, W. S., LEAN, M. E. J., WOODWARD, M., WALLACE, F. A. & HANKEY, C. R. (2006) Unidentified under-nutrition: dietary intake and anthropometric indices in a residential care home population. Journal of Human Nutrition and Dietetics, 19, 343-347.
LINDGREN, M., UNOSSON, M., KRANTZ, A. & EK, A. (2005) Pressure ulcer risk factors in patients undergoing surgery. Journal of Advanced Nursing, 50, 605-612.
LINDORFF-LARSEN, K., RASMUSSEN, H. H., KONDRUP, J., STAUN, M. & LADEFOGED, K. (2007) Management and perception of hospital undernutrition - A positive change among Danish doctors and nurses. Clinical Nutrition, in press.
LIPSKI, P. S. (1996) Australian Nutrition Screening Initiative. Australian Journal on Ageing, 15, 14-15.
LUMBERS, M. L., DRIVER, L. T., HOWLAND, R. J., OLDER, M. W. J. & WILLIAMS, C. M. (1996) Nutritional status and clinical outcome in elderly female surgical orthopaedic patients. Clinical Nutrition, 15, 101-107.
MAG (BAPEN) (2003) Malnutrition Advisory Group (MAG): A Standing Committee of the British Association for Parenteral and Enteral Nutrition (BAPEN) The'MUST' Explanatory Book. A Guide to the 'Malnutrition Universal Screening Tool' ('MUST') for Adults, Worcs, United Kingdom, BAPEN.
Economic analysis of Malnutrition and Pressure ulcers M Banks June 2008
242
MAKLEBUST, J. & MAGNAN, M. A. (1994) Risk factors associated with having a pressure ulcer: A secondary data analysis. Advances in Wound Care, 7, 25-42.
MANNING, J. & PHILCOX, P. (2005) Pressure ulcer prediction and prevention awareness in South Australia - South Australian Wound Management Association Activities. Primary Intention, 13, 128.
MARCUS, E. L. & BERRY, E. M. (1998) Refusal to Eat in the elderly. Nutrition Reviews, 56, 163-171.
MARSHMAN, R., FISHER, M. M. & COUPLAND, G. A. E. (1980) Nutritional status and postoperative complications in an Australian hospital. Australian New Zealand Journal of Surgery, 50, 516-519.
MCERLEAN, B. & THOMAS, L. (2005) South Australian Pressure Ulcer initiatives. Primary Intention, 13, 131-132.
MCWHIRTER, J. P. & PENNINGTON, C. R. (1994) Incidence and recognition of malnutrition in hospital. British Medical Journal, 308, 945-8.
MESSNER, R. L., STEPHENS, N., WHEELER, W. E. & HAWES, M. C. (1991) Effect of Nutritional Status of Length of Hospital Stay. Gastroenterology Nursing, Spring, 202-205.
MIDDLETON, M. H., NAZARENKO, G., NIVISON-SMITH, I. & SMERDELY, P. (2001) Prevalence of malnutrition and 12-month incidence of mortality in two Sydney teaching hospitals. Internal Medicine Journal, 31, 455-461.
MILNE, A. C., POTTER, J. & AVENELL, A. (2005) Protein and energy supplementation in elderly people at risk from malnutrition. The Cochrane Database of Systematic Reviews, Issue 1, Art.No: CD003288.DOI: 10,1002/14651858. CD003288.pub2
MOWE, M., BOSAEUS, I., RASMUSSEN, H. H., KONDRUP, J., UNOSSON, M. &
IRTUN, O. (2006) Nutritional routines and attitutes among doctors and nurses in Scandinavia: A questionnaire based survey. Clinical Nutrition, 25.
MULLEN, J. L., BUZBY, G. P. & WALDMAN, M. T. (1979a) Prediction of operative morbidity and mortality by preoperative nutritional assessment. Surgical Forum, 30, 80-82.
MULLEN, J. L., GERTNER, M. H., BUZBY, G. P., GOODHART, G. L. & ROSATO, E. F. (1979b) Implications of Malnutrition in the Surgical Patient. Archives of Surgery, 114, 121-125.
MULLER, E., VAN LEEN, M. W. F. & BERGEMANN, R. (2001) Economic evaluation of collagense-containing ointment and hydrocolloid dressings in the treatment of pressure ulcers. Pharmacoeconomics, 19, 1209-1216.
MURPHY, M. C., BROOKS, C. N., NEW, S. A. & LUMBERS, M. L. (2000) The use of the Mini-Nutritional Assessment (MNA) tool in elderly orthopaedic patients. European Journal of Clinical Nutrition, 54, 555-562.
NABER, T. H. J., TJARD, S., DE BREE, A., NUSTELING, K., LIESBETH, E., KRUIMEL, J. W., BAKKEREN, J., VAN HEEREVELD, H. & KATAN, M. B. (1997) Prevalence of malnutrition in nonsurgical hospitalized patients and its association with disease complications. American Journal of Clinical Nutrition, 66, 1232-1239.
NATIONAL OBESITY TASKFORCE (2003) Healthy Weight 2008 - Australia's Future. The National Action Agenda for Children and Young People and Their Families, Canberra, Commonwealth Department of Health and Ageing.
Economic analysis of Malnutrition and Pressure ulcers M Banks June 2008
243
NEUMANN, S., MILLER, M., DANIELS, L. & CROTTY, M. (2005) Nutritional status and clinical outcomes of older patients in rehabilitation. Journal of Human Nutrition and Dietetics, 18, 129-136.
NEWELL, N. (2005) Western Australia pressure ulcer initiatives. Pressure ulcer risk assessment and management system project (PURAMS) Primary Intention, 13, 138.
NHMRC (1997) Acting on Australia's Weight - a strategic plan for the prevention of overweight and obesity, Canberra, National Health and Medical Research Council.
NICE (2003) National Institute for Clinical Excellence. Pressure ulcer risk assessment and prevention. Available at: www.nice.org.uk.
NIGHTINGALE, J. M. D. & REEVES, J. (1999) Knowledge about the assessment and management of undernutrition: a pilot questionaire in a UK teaching hospital. Clinical Nutrition, 18, 23-27.
NIJS, K. A. N. D., DE GRAAF, C., SIEBELINK, E., BLAUW, Y., VANNESTE, V., KOK, F. J. & VAN STAVEREN, W. A. (2006) Effect of Family-Style Meals on Energy Intake and Risk of Malnutrition in Dutch Nursing Home Residents: A Randomized Controlled Trial. Journal of Gerontology, 61A, 935-942.
NORRIS, J. R. & REYNOLDS, R. E. (1971) The effect of oral zinc sulfate therapy on decubitus ulcers. Journal of the American Geriatrics Society, 19, 793-797.
NPUAP (2007) Pressure ulcer stages revised by NPUAP. Available at: www.npuap.org/pr2.htm.
NUTRITION SCREENING INITIATIVE (1992) The nutritional intervention manual for professionals caring for older Americans., Washington, DC, Nutrition Screening Initiative.
O'FLYNN, J., PEAKE, H., HICKSON, M., FOSTER, D. & FROST, G. (2005) The prevalence of malnutrition in hospitals can be reduced: Results from three consecutive cross-sectional studies. Clinical Nutrition, 24, 1078-1088.
OCKENGA, J., FREUDENREICH, M., ZAKONSKY, R., NORMAN, K., PIRLICH, M. & LOCHS, H. (2005) Nutritional assessment and management in hospitalised patients: Implication for DRG-based reimbursement and health care quality. Clinical Nutrition, 24, 913-919.
ODLUND OLIN, A., ARMYR, I., SOOP, M., JERSTROM, S., CLASSON, I., CEDERHOLM, T., LJUNGGREN, G. & LJUNGQVIST, O. (2003) Energy-dense meals improve energy intake in elderly residents in a nursing home. Clinical Nutrition
22, 125-131. ODLUND OLIN, A., KOOCHEK, A., LJUNGQVIST, O. & CEDERHOLM, T.
(2005) Nutritional status, well-being and functional ability in frail elderly service flat residents. European Journal of Clinical Nutrition, 59, 263-270.
OLMOS, M., VAZQUEZ, M., LOPEZ, M. & DEL CAMPO PEREZ, V. (2005) Nutritional status study of inpatients in hospitals of Galicia. European Journal of Clinical Nutrition, 59, 938-946.
OOT-GIROMINI, B., BIDWELL, F. C., HELLER, N. B., PARKS, M. L., PREBISH, E. M., WICKS, P. & WILLIAMS, P. M. (1989) Pressure ulcer prevention versus treatment, comparative product cost study. Decubitus, 2, 42-54.
OTTERY, F. (1996) Definition of standardized nutritional assessment and interventional pathways in oncology. Nutrition, 12 (supp 1), S15-S19.
PANCORBO-HIDALGO, P. L., GARCIA-FERNANDEZ, F. P., LOPEZ-MEDINA, I. M. & ALVAREZ-NIETO, C. (2006) Risk assessment scales for pressure
Economic analysis of Malnutrition and Pressure ulcers M Banks June 2008
244
ulcer prevention: a systematic review. Journal of Advanced Nursing, 54, 94-110.
PATIENT SAFETY CENTRE (2007) Prevention Ulcer Prevention Project. www.health.qld.gov.au/patientsafety/pupp/webpages/pupp.asp.
PENNINGTON, C. R. (1998) Disease-associated malnutrition in the year 2000. Postgraduate Medical Journal, 74, 65-71.
PERSSON, M. D., BRISMAR, K. E., KATZARSKI, K. S., NORDENSTROM, J. & CEDERHOLM, T. (2002) Nutritional Status Using Mini Nutritional Assessment and Subjective Global Assessment Predict Mortality in Geriatric Patients. Journal of the American Geriatrics Society, 50, 1996-2002.
PICHARD, C., KYLE, U. G., MORABIA, A., PERRIER, A., VERMEULEN, B. & UNGER, P. (2004) Nutritional assessment: lean body mass depletion at hospital admission is associated with an increased length of stay. American Journal of Clinical Nutrition, 79, 613-618.
PINCHCOFSKY, G. D. & KAMINSKI, M. V. (1985) Increasing Malnutrition During Hospitalization: Documentation by a Nutrition Screening Program. Journal of the American College of Nutrition, 4, 471-479.
PIRLICH, M., SCHUTZ, T., NORMAN, K., GASTELL, S., LUBKE, H. J., BISCHOFF, S. C., BOLDER, U., FRIELING, T., GULDENZOPH, H., HAHN, K., JAUCH, K., SCHINDLER, K., STEIN, J., VOLKERT, D., WEIMANN, A., WERNER, H., WOLF, C., ZURCHER, G., BAUER, P. & LOCHS, H. (2006) The German hospital malnutrition study. Clinical Nutrition, 25, 563-572.
PLANAS, M., AUDIVERT, S., PEREZ-PORTABELLA, C., BURGOS, R., PUIGGROS, C., CASANELLES, J. M. & ROSSELLO, J. (2004) Nutritional status among adult patients admitted to a university-affiliated hospital in Spain at the time of genoma. Clinical Nutrition, 23, 1016-1024.
PORBEN, S. S. (2006) The state of the provision of nutritional care to hospitalized patients - Results from the Elan-Cuba Study. Clinical Nutrition, 25, 1015-1029.
POSNER, B. M., JETTE, A. M., SMITH, K. W. & MILLER, D. R. (1993) Nutrition and health risks in the elderly: the nutrition screening initiative. American Journal of Public Health 83, 972-978.
PRITCHARD, C., DUFFY, S., EDINGTON, J. & PANG, F. (2006) Enteral nutrition and oral nutrition supplements: A review of the economics literature. Journal of Parenteral and Enteral Nutrition, 30, 52-59.
QUEENSLAND WOUND CARE ASSOCIATION (2005) Queensland Wound Care Association: Improved prevention and management of pressure ulcers across Queensland Health. Primary Intention, 13, 126-127.
RAFFOUL, W., FAR, M. S., CAYEXU, M.-C. & BERGER, M. M. (2006) Nutritional status and food intake in nine patients with chronic low-limb ulcers and pressure ulcers: importance of oral supplements. Nutrition, 22, 82-88.
RAJA, R., LIM, A. V., LIM, Y. P., LIM, G., CHAN, S. P. & VU, C. K. F. (2004) Malnutrition screening in hospitalised patients and its implication on reimbursement. Internal Medicine Journal, 34, 176-181.
RASMUSSEN, H. H., KONDRUP, J., LADEFOGED, K. & STAUN, M. (1999) Clinical nutrition in Danish hospitals: a questionaire-based investigation among doctors and nurses. Clinical Nutrition, 18, 153-158.
Economic analysis of Malnutrition and Pressure ulcers M Banks June 2008
245
RASMUSSEN, H. H., KONDRUP, J., STAUN, M., LADEFOGED, K., KRISTENSEN, H. & WENGLER, A. (2004) Prevalence of patients at nutritional risk in Danish hospitals. Clinical Nutrition, 23, 1009-1015.
RCN & NICE (2005) Royal College of Nursing and National Institute for Clinical Excellence. The management of pressure ulcers in primary and secondary care. A clinical practice guideline. available at: www.nice.org.uk
REDDY, M., GILL, S. S. & ROCHON, P. A. (2006) Preventing pressure ulcers: A
systematic review. Journal of the American Medical Association, 296 (8), 974-984.
REILLY, J. J., HULL, S. F., ALBERT, N., WALLER, A. & BRINGARDENER, S. (1988) Economic impact of Malnutrition: A Model System for Hospitalized Patients. Journal of Parenteral and Enteral Nutrition, 12, 371-376.
ROBINSON, G., GOLDSTEIN, M. & LEVINE, G. M. (1987) Impact of Nutritional Status on DRG Length of Stay. Journal of Parenteral and Enteral Nutrition, 11, 49-51.
ROUBENOFF, R., ROUBENOFF, R. A., PRETO, J. & BALKE, W. (1987) Malnutrition Among Hospitalized Patients. Archives of Internal Medicine, 147, 1462-1465.
RUBENSTEIN, L. Z., HARKER, J. L., SALVA, A., GUIGOZ, Y. & VELLAS, B. (2001) Screening for Undernutrition in Geriatric Practice: Developing the Short-Form Mini-Nutritional Assessment (MNA-SF). Journal of Gerontology, 56A, M366-M372.
RUIZ-LOPEZ, M. D., ARTACHO, R., OLIVA, P., MORENO-TORRES, R., BOLANOS, J., DE TERESA, C. & LOPEZ, M. C. (2003) Nutritional risk in Institutionalized Older Women Determined by the Mini Nutritional Assessment Test: What are the main factors? Nutrition 19, 767-771.
SACKS, G. S., DEARMAN, K., REPLOGLE, W. H., CORA, V. L., MEEKS, M. & CANADA, T. (2000) Use of subjective global assessment to identify nutrition associated complications and death in geriatric long term care facility residents. Journal of the American College of Nutrition, 19, 570-577.
SALETTI, A., JOHANSSON, L., YIFTER-LINDGREN, E., WISSING, U., OSTERBERG, K. & CEDERHOLM, T. (2005) Nutritional status and a 3-year follow up in elderly receiving support at home. Gerontology, 51, 192-198.
SAYARATH, V. G. (1993) Nutrition screening for malnutrition: Potential economic impact at a community hospital. Journal of the American Dietetic Association, 93, 1440-1442.
SCHLESSELMAN, J. J. (1982) Case-Control Studies. Design, Conduct, Analysis, Oxford University Press.
SCHOLS, J. M. G. A. & DE JAGER-V D ENDE, M. A. (2004) Nutritional intervention in pressure ulcer guidelines: an inventory. Nutrition 20, 548-553.
SCHOONHOVEN, L., GROBBEE, D. E., DONDERS, A. R. T., ALGRA, A., GRYPDONCK, M. H., BOUSEMA, M. T., SCHRIJVERS, A. J. P. & BUSKENS, E. (2006) Prediction of pressure ulcer development in hospitalized patients: a tool for risk assessment. Quality and Safety in Health Care, 15, 65-70.
SINGH, H., WATT, K., VEITCH, R., CANTOR, M. & DUERKSEN, D. R. (2006) Malnutrition is prevalent in hospitalized medical patients: Are housestaff identifying the malnourished patients? Nutrition
22, 350-354.
Economic analysis of Malnutrition and Pressure ulcers M Banks June 2008
246
SMITH, A. E. & SMITH, P. E. (1992) Reimbursement for clinical nutrition services: A 10 year experience. Journal of the American Dietetic Association, 92, 1385-1388.
SMITH, D. M. (1995) Pressure ulcers in the nursing home. Annals of Internal Medicine, 123, 433-442.
SMITH, P. E. & SMITH, A. E. (1993) Nutritional intervention influences the bottom line. Healthcare Financial Management, 47, 30-36.
SOINI, H., ROUTASALO, P. & LAGSTROM, H. (2004) Characteristics of the Mini-Nutritional Assessment in elderly home-care patients. European Journal of Clinical Nutrition, 58, 64-70.
SORIANO, L. F., VAZQUEZ, M. A. L., MARISTANY, C. P.-P., GRAUPERA, J.-M. X., WESSELING, W. W. & WAGENAAR, L. (2004) The effectiveness of oral nutritional supplementation in the healing of pressure ulcers. Journal of Wound Care, 13, 319-323.
STEPHENSON, G. R., MORETTI, E. W., EL-MOALEM, H., CLAVIEN, P. A. & TUTTLE-NEWHALL, J. E. (2001) Malnutrition in liver tranplant patients. Transplantation, 72, 666-670.
STRACHAN, V. (2005) Victorian pressure ulcer initiatives: The Victorian Quality Council's contribution to reducing patient harm from pressure ulcers. Primary Intention, 13, 135-136.
STRATTON, R., EK, A., MOORE, M. E. Z., RIGBY, P., WOLFE, R. & ELIA, M. (2005) Enteral nutritional support in prevention and treatment of pressure ulcers: A systematic review and meta-analysis. Ageing Research Reviews, 4, 422-450.
STRATTON, R. & ELIA, M. (2007) A review of reviews: A new look at the evidence for oral nutritional supplements in clinical practice. Clinical Nutrition, Supplement 2, 5-23.
STRATTON, R., GREEN, C. J. & ELIA, M. (2003) Disease-related Malnutrition: an Evidence-Based approach to treatment, Wallingford UK, CABI Publishing.
SULLIVAN, D. H., SUN, S. & WALLS, R. C. (1999) Protein-Energy Undernutrition Among Elderly Hospitalized Patients: A Prospective Study. Journal of the American Medical Association, 281, 2013-2019.
SUOMINEN, M., MUURINEN, S., ROUTASALO, P., SOINI, H., SUUR-USKI, I., PEIPONEN, A., FINNE-SOVERI, H. & PITKALA, K. (2005) Malnutrition and associated factors among aged residents in all nursing homes in Helsinki. European Journal of Clinical Nutrition, 59, 578-583.
SYKES, G. & BLANCHFIELD, D. (2005) New South Wales pressure ulcer initiatives: South Eastern Sydney Illawarra Area Health Service (Southern Sector): Taking the pressure off. Primary Intention, 13, 122-123.
SZKLO, M. & NIETO, F. J. (2000) Epidemiology. Beyond the Basics, ASPEN Publishers, Gaithersburg, Maryland.
TAYLOR, T. V., RIMMER, S., DAY, B., BUTCHER, J. & DYMOCK, I. W. (1974) Ascorbic acid supplementation in the treatment of pressure sores. Lancet, 2, 544-546.
TER RIET, G., KESSELS, A. G. & KNIPSCHILD, P. G. (1995) Randomized clinical trial of ascorbic acid in the treatment of pressure ulcers. Journal of Clinical Epidemiology, 48, 1453-1460.
THOMAS, D. R. (1996) Hospital acquired pressure ulcers and risk of death. Journal of the American Geriatrics Society, 44, 1435 - 1437.
Economic analysis of Malnutrition and Pressure ulcers M Banks June 2008
247
THOMAS, D. R. (2001) Improving outcome of pressure ulcers with nutritional interventions: A review of the evidence. Nutrition, 17, 121-125.
THOMAS, D. R. (2002) Malnutrition in subacute care. American Journal of Clinical Nutrition, 75, 308-313.
THOMAS, D. R. (2006) Prevention and Treatment of Pressure Ulcers. Journal of the American Medical Directors Association, 7, 46-59.
THOMPSON, J. S., BURROUGH, C. A., GREEN, J. L. & BROWN, G. L. (1984) Nutritional screening in surgical patients. Journal of the American Dietetic Association, 84, 337-338.
THOMSON, J. S. & BROOKS, R. G. (1999) The economics of preventing and treating pressure ulcers: a pilot study. Journal of Wound Care, 8, 312-316.
THORESEN, L., FJELDSTAD, I., KROGSTAD, K., KAASA, S. & FALKMER, U. G. (2002) Nutritional status of patients with advanced cancer: the value of using the subjective global assessment of nutritional status as a screening tool. Palliative Medicine, 16, 33-42.
THORSDOTTIR, I., ERIKSEN, B. & EYSTEINSDOTTIR, S. (1999) Nutritional status at submission for dietetic services and screening for malnutrition at admission to hospital. Clinical Nutrition, 18, 15-21.
TOBIAS, A. L. & VAN ITALLIE, T. B. (1977) Nutritional problems of hospitalized patients. Research, 71, 253-257.
TRIMBLE, J. M. (1992) Reimbursement enhancement in a New Jersey hospital: Coding for malnutrition in prospective payment systems. Journal of the American Dietetic Association, 92, 737-738.
TUCKER, H. N. & MIGUEL, S. G. (1996) Cost containment Through Nutrition Intervention. Nutrition Reviews, 54, 111-121.
VAN NES, M. C., HERRMANN, F. R., GOLD, G., MICHEL, J. P. & RIZZOLI, R. (2001) Does the Mini Nutritional Assessment predict hospitalization outcomes in older people? Age and Ageing, 30, 221-226.
VANDERKROFT, D., COLLINS, C. E., FITZGERALD, M., LEWIS, S., NEVE, M. & CAPRA, S. (2007) Minimising undernutrition in the older inpatient. International Journal of Evidence Based Healthcare, 5, 110-182.
VELLAS, B., GUIGOZ, Y., BAUMGARTNER, M., GARRY, P. J., LAUQUE, S. & ALBAREDE, J.-L. (2000) Relationships between nutritional markers and the Mini Nutritional Assessment in 155 Older Persons. Journal of the American Geriatrics Society, 48, 1300-1309.
VELLAS, B., GUIGOZ, Y., GARRY, P. J., NOURHASHEMI, F., BENNAHUM, D., LAUQUE, S. & ALBAREDE, J.-L. (1999) The Mini Nutritional Assessment (MNA) and Its Use in Grading the Nutritional State of Elderly Patients. Nutrition, 15, 116-122.
VERSLUYSEN, M. (1986) How elderly patients with femoral fracture develop pressure sores in hospital. British Medical Journal, 292, 1311-1313.
VISVANATHAN, R., MACINTOSH, C., CALLARY, M., PENHALL, R., HOROWITZ, M. & CHAPMAN, I. (2003) The nutritional status of 250 older Australian recipients of domicillary care services and its association with outcomes at 12 months. Journal of the American Geriatrics Society, 51, 1007-1011.
VISVANATHAN, R., PENHALL, R. & CHAPMAN, I. (2004) Nutritional screening of older people in a sub-acute care facility in Australia and its relation to discharge outcomes. Age and Ageing, 33, 260-265.
Economic analysis of Malnutrition and Pressure ulcers M Banks June 2008
248
VISVANATHAN, R., ZAITON, A., SHERINA, M. S. & MUHAMAD, Y. A. (2005) The nutritional status of 1081 elderly people residing in publicly funded shelter homes in Peninsular Malaysia. European Journal of Clinical Nutrition, 59, 318-324.
VIVANTI, A. & BANKS, M. (2007) Length of stay patterns for patients of an acute care hospital: implications for nutrition and food services. Australian Health Review, 31, 282-287.
WAITZBERG, D. L., CAIAFFA, W. T. & CORREIA, M. I. T. D. (2001) Hospital Malnutrition: The Brazilian National Survey (IBRANUTRI): A Study of 4000 Patients. Nutrition, 17, 573-580.
WARNOLD, I. & LUNDHOLM, K. (1984) Clinical Significance of Preoperative Nutritional Status in 215 Noncancer Patients. Annals of Surgery, 199, 299-305.
WATERLOW, J. (2005) Waterlow Pressure Ulcer Risk Score Card. www.judy_waterlow.co.uk.
WATERS, H. R., E, P. M., CREED-KANASHIRO, H. M., ROBERT, R. C., NARRO, R., WILLIS, J., CAULFIELD, L. E. & BLACK, R. E. (2006) The cost-effectiveness of a child nutrition education programme in Peru. Health Policy and Planning, 21, 257-264.
WEEKES, C. E., ELIA, M. & EMERY, P. W. (2004) The development, validation and reliability of a nutrition screening tool based on the recommendations of the British Association for Parenteral and Enteral Nutrition (BAPEN). Clinical Nutrition, in press.
WEINSIER, R. L., HUNKER, P. H. E. M., KRUMDIECK, C. L. & BUTTERWORTH, C. E. (1979) Hospital malnutrtion: A prospective evaluation of general medical patients during the course of hospitalization. American Journal of Clinical Nutrition, 32, 418-426.
WESTERGREN, A., KARLSSON, S., OHLSSON, O. & HALLBERG, I. R. (2001) Eating difficulties, need for assisted eating, nutritional status and pressure ulcers in patients admitted for stroke rehabiliation. Journal of Clinical Nursing, 10, 257-269.
WILLARD, M. D., GILSDORF, R. B. & PRICE, R. A. (1980) Protein-Calorie Malnutrition in a Community Hospital. Journal of the American Medical Association, 243, 1720-1722.
WOLINSKY, F. D., COE, R. M., MCINTOSH, W. M. A., KUBENA, K. S., PRENDERGAST, J. M., CHAVEZ, M. N., MILLER, D. K., ROMEIS, J. C. & LANDMANN, W. A. (1990) Progress in the Development of a Nutritional Risk Index. Journal of Nutrition, 120, 1549-1553.
WOO, J., CHI, I., HUI, E., CHAN, F. & SHAM, A. (2005) Low staffing level is associated with malnutritoin in long-term residential care homes. European Journal of Clinical Nutrition, 59, 474-479.
WOOD, B., KELLEHER, D., LO, L., CLEARLY, J., BURNS, E., THIEN, C. & BONTOFT, J. (1985) Nutritional status in hospital inpatients: Implications for nutritional support services. Australian New Zealand Journal of Medicine, 15, 435-441.
WOODWARD, M. (1999) Epidemiology. Study Design and Data Analysis, Chapman & Hall/CRC, London.
WYSZYNSKI, D. F., PERMAN, M. & CRIVELLI, A. (2003) Prevalence of Hospital Malnutrition in Argentina: Preliminary Results of a Population-Based Study. Nutrition, 19, 115-119.
Economic analysis of Malnutrition and Pressure ulcers M Banks June 2008
249
YOUNG, J., MOREY, P., BROWNE, R. & NIKOLETTI, S. (2000) A study on the incidence of pressure ulcers in the acute orthopaedic setting. Primary Intention, 8, 142-147.
ZADOR, D. A. & TRUSWELL, A. S. (1987) Nutritional status on admission to a general surgical ward in a Sydney Hospital. Australian New Zealand Journal of Medicine, 17, 234-240.
Economic analysis of Malnutrition and Pressure ulcers M Banks June 2008
250
CHAPTER 9 - APPENDICES Appendix 1 - Summary of most commonly referenced nutrition screening
tools Appendix 2 - Visual Basic Programming language used to make 1000 Monte
Carlo resamples from input parameters Appendix 3 – Graphs of Input Distributions Appendix 4 - Extra staffing resources to ensure nutrition risk screening
systems implemented and appropriate nutrition support provided.
Appendix 5 – Manuscripts and peer reviewed conference abstracts related to
the thesis
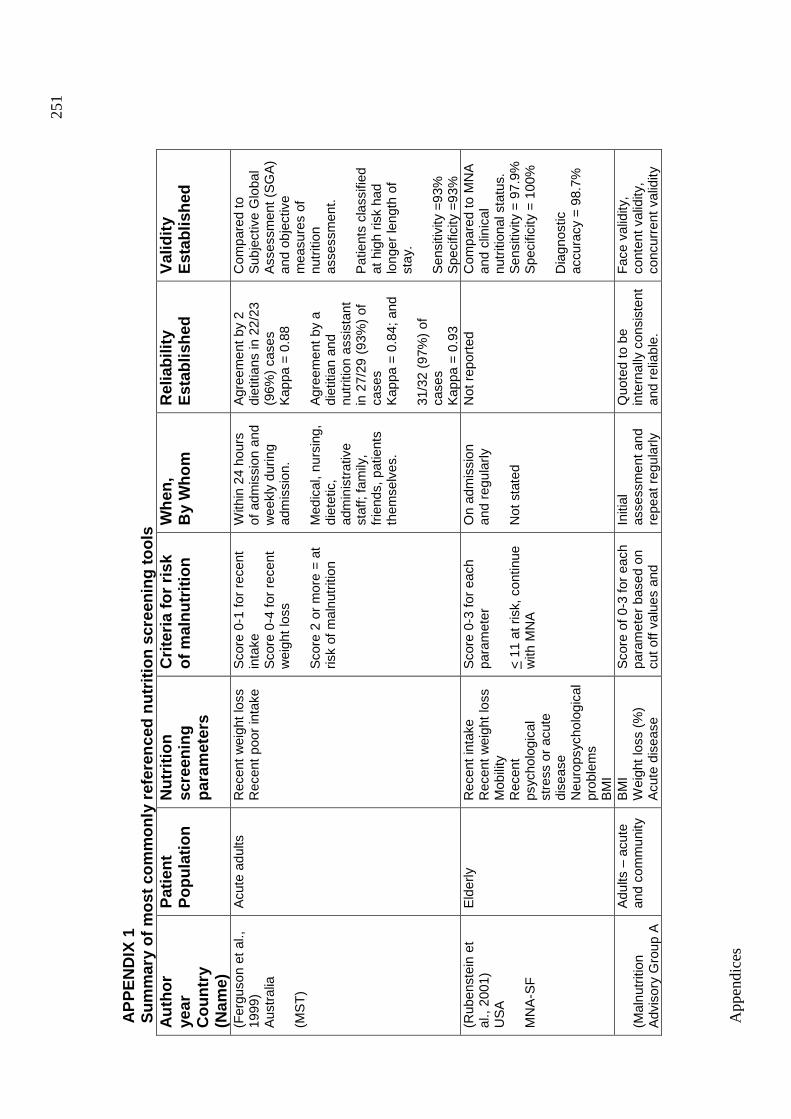
App
endi
ces
251
AP
PE
ND
IX 1
Sum
mar
y of
mos
t com
mon
ly r
efer
ence
d nu
triti
on s
cree
ning
tool
s A
utho
r ye
ar
Cou
ntry
(N
ame)
Pat
ient
P
opul
atio
n
Nut
ritio
n sc
reen
ing
para
met
ers
Crit
eria
for
risk
of m
alnu
triti
on
Whe
n,
By
Who
m
Rel
iabi
lity
Est
ablis
hed
Val
idity
E
stab
lishe
d
(Fer
guso
n et
al.,
19
99)
Aus
tral
ia
(MS
T)
Acu
te a
dults
Rec
ent w
eigh
t los
s R
ecen
t poo
r in
take
S
core
0-1
for
rece
nt
inta
ke
Sco
re 0
-4 fo
r re
cent
w
eigh
t los
s
Sco
re 2
or
mor
e =
at
risk
of m
alnu
triti
on
With
in 2
4 ho
urs
of a
dmis
sion
and
w
eekl
y du
ring
adm
issi
on.
Med
ical
, nur
sing
, di
etet
ic,
adm
inis
trat
ive
staf
f; fa
mily
, fr
iend
s, p
atie
nts
them
selv
es.
Agr
eem
ent b
y 2
diet
itian
s in
22/
23
(96%
) ca
ses
K
appa
= 0
.88
A
gree
men
t by
a di
etiti
an a
nd
nutr
ition
ass
ista
nt
in 2
7/29
(93
%)
of
case
s K
appa
= 0
.84;
and
31
/32
(97%
) of
ca
ses
Kap
pa =
0.9
3
Com
pare
d to
S
ubje
ctiv
e G
loba
l A
sses
smen
t (S
GA
) an
d ob
ject
ive
mea
sure
s of
nu
triti
on
asse
ssm
ent.
Pat
ient
s cl
assi
fied
at h
igh
risk
had
long
er le
ngth
of
stay
. S
ensi
tivity
=93
%
Spe
cific
ity =
93%
(R
uben
stei
n et
al
., 20
01)
US
A
MN
A-S
F
Eld
erly
R
ecen
t int
ake
Rec
ent w
eigh
t los
s M
obili
ty
Rec
ent
psyc
holo
gica
l st
ress
or
acut
e di
seas
e N
euro
psyc
holo
gica
l pr
oble
ms
BM
I
Sco
re 0
-3 fo
r ea
ch
para
met
er
< 1
1 at
ris
k, c
ontin
ue
with
MN
A
On
adm
issi
on
and
regu
larly
N
ot s
tate
d
Not
rep
orte
d C
ompa
red
to M
NA
an
d cl
inic
al
nutr
ition
al s
tatu
s.
Sen
sitiv
ity =
97.
9%
Spe
cific
ity =
100
%
Dia
gnos
tic
accu
racy
= 9
8.7%
(Mal
nutr
ition
A
dvis
ory
Gro
up A
Adu
lts –
acu
te
and
com
mun
ity
BM
I W
eigh
t los
s (%
) A
cute
dis
ease
Sco
re o
f 0-3
for
each
pa
ram
eter
bas
ed o
n cu
t off
valu
es a
nd
Initi
al
asse
ssm
ent a
nd
repe
at r
egul
arly
Quo
ted
to b
e in
tern
ally
con
sist
ent
and
relia
ble.
Fac
e va
lidity
, co
nten
t val
idity
, co
ncur
rent
val
idity
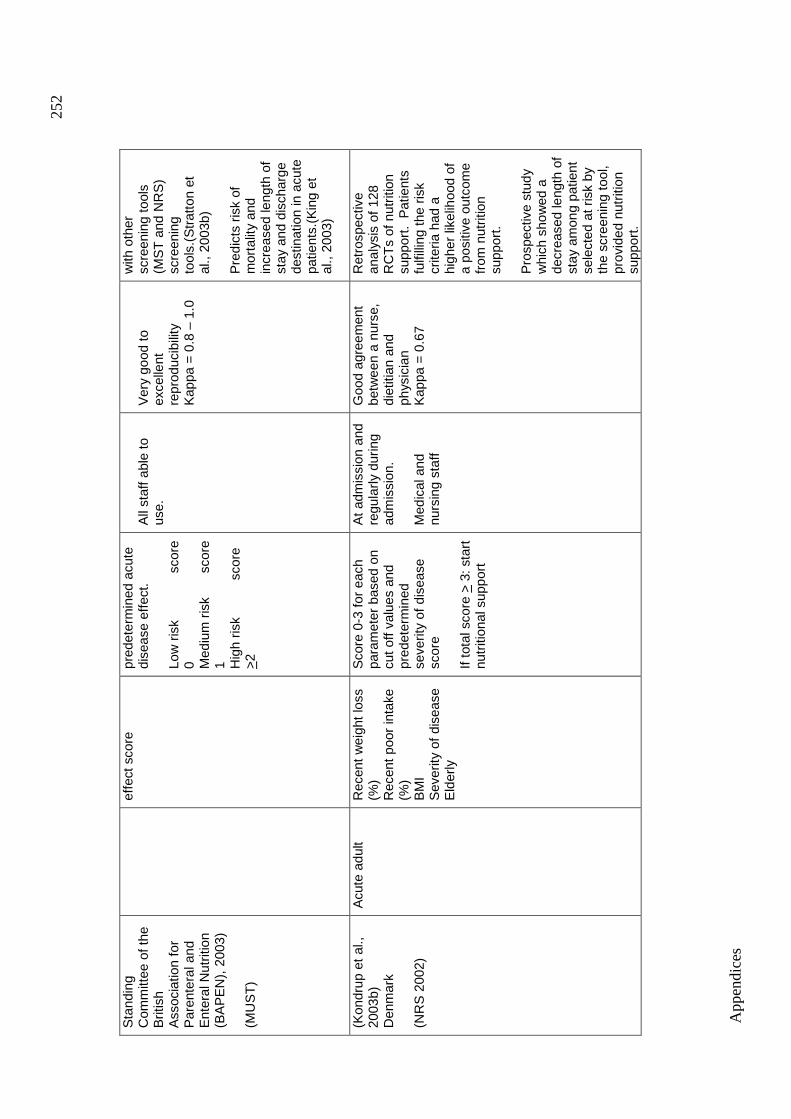
App
endi
ces
252
Sta
ndin
g C
omm
ittee
of t
he
Brit
ish
Ass
ocia
tion
for
Par
ente
ral a
nd
Ent
eral
Nut
ritio
n (B
AP
EN
), 2
003)
(M
US
T)
ef
fect
sco
re
pred
eter
min
ed a
cute
di
seas
e ef
fect
. Lo
w r
isk
sc
ore
0 Med
ium
ris
k sc
ore
1 Hig
h ris
k
scor
e >
2
All
staf
f abl
e to
us
e.
Ver
y go
od to
ex
celle
nt
repr
oduc
ibili
ty
Kap
pa =
0.8
– 1
.0
with
oth
er
scre
enin
g to
ols
(MS
T a
nd N
RS
) sc
reen
ing
tool
s.(S
trat
ton
et
al.,
2003
b)
Pre
dict
s ris
k of
m
orta
lity
and
incr
ease
d le
ngth
of
stay
and
dis
char
ge
dest
inat
ion
in a
cute
pa
tient
s.(K
ing
et
al.,
2003
)
(Kon
drup
et a
l.,
2003
b)
Den
mar
k (N
RS
200
2)
Acu
te a
dult
Rec
ent w
eigh
t los
s (%
) R
ecen
t poo
r in
take
(%
) B
MI
Sev
erity
of d
isea
se
Eld
erly
Sco
re 0
-3 fo
r ea
ch
para
met
er b
ased
on
cut o
ff va
lues
and
pr
edet
erm
ined
se
verit
y of
dis
ease
sc
ore
If to
tal s
core
> 3
: sta
rt
nutr
ition
al s
uppo
rt
At a
dmis
sion
and
re
gula
rly d
urin
g ad
mis
sion
. M
edic
al a
nd
nurs
ing
staf
f
Goo
d ag
reem
ent
betw
een
a nu
rse,
di
etiti
an a
nd
phys
icia
n K
appa
= 0
.67
Ret
rosp
ectiv
e an
alys
is o
f 128
R
CT
s of
nut
ritio
n su
ppor
t. P
atie
nts
fulfi
lling
the
risk
crite
ria h
ad a
hi
gher
like
lihoo
d of
a
posi
tive
outc
ome
from
nut
ritio
n su
ppor
t. P
rosp
ectiv
e st
udy
whi
ch s
how
ed a
de
crea
sed
leng
th o
f st
ay a
mon
g pa
tient
se
lect
ed a
t ris
k by
th
e sc
reen
ing
tool
, pr
ovid
ed n
utrit
ion
supp
ort.
Appendices
253
The Malnutrition Screening Tool (MST) was developed in Australia for use in
acute adult hospitalised patients (Ferguson et al., 1999). It was developed by
determining which of 21 possible nutrition screening parameter questions had
the highest sensitivity and specificity at predicting malnutrition as determined
by the Subjective Global Assessment (Detsky et al., 1987b). The MST
consists of two questions regarding appetite and unintentional weight loss,
which are scored. A score of 2 or more indicates a patient is at nutritional risk.
The scoring system allows for the prioritization of patients. Subjects who were
at risk of malnutrition according to the MST had significantly lower mean
values for the objective nutrition parameters and longer lengths of hospital
stay than subjects not at risk of malnutrition. The inter-relater reliability of the
MST was high (93-97%) and the sensitivity and specificity was 93%. The
MST has subsequently been validated by other authors. Correia et al (2003)
evaluated the MST against the SGA and MNA in 137 elderly acute patients
and found: the sensitivity of MST to be 91.7% and 92.1%; specificity to be
60.7% and 71.6%; positive predictive value to be 55.7% and 73.4%; negative
predictive value to be 93.1% and 91.4%; agreement in 71.5% and 81% of
cases; and kappa of 0.46 and 0.63, with SGA and MNA respectively. They
concluded that the MST was suitable for screening under-nutrition in
hospitalized elderly patients (Correia et al., 2003). Malnutrition screening and
assessment studies undertaken at a Queensland tertiary hospital indicates
similar levels of sensitivity and specificity (unpublished data). Allison (2000) in
reviewing the MST suggested that MST defines the “minimum data set” for
nutrition screening.
In 2003 the Malnutrition Advisory Group (MAG) of British Association of
Parenteral and Enteral Nutiriton (BAPEN) published the Malnutrition
Universal Screening Tool (MUST) for adults (MAG (BAPEN), 2003). The
MUST tool includes the parameters of BMI and weight loss and acute disease
effect. It is documented to have a high degree of reliability, content validity
and practicability of application. The tool was originally developed for use in
the community but has now been extended to other health care settings,
including hospitals, where it has been found to have high inter-relater
reliability, concurrent validity with other tools and predictive validity (length of
Appendices
254
hospital stay, mortality and discharge destination) (Stratton et al., 2003b, King
et al., 2003). The MUST tool is currently recommended by BAPEN for
screening of adults. It is also recommended by the European Society for
Parenteral and Enteral Nutrition (ESPEN) for screening adults in the
community, as part of the ESPEN Guidelines for Nutrition Screening (Kondrup
et al., 2003a).
Rubenstein et al. (2001) developed the six item Mini Nutritional Assessment –
Short Form (MNA-SF) from the original 18 item MNA to use as a nutrition
screening tool for the elderly. The selected parameters are: recent poor
intake; recent weight loss; BMI; mobility; recent psychological stress or acute
disease; neuropsychological problems. The MNA-SF was found to have very
high sensitivity and specificity when compared to the full MNA assessment
and clinical nutrition status (Rubenstein et al., 2001). The MNA-SF is
currently recommended by ESPEN for screening the elderly as part of the
ESPEN Guidelines for Nutrition Screening (Kondrup et al., 2003a).
Kondrup et al. (2003) developed a nutrition screening tool based on an
analysis of controlled clinical trials so the screening tool would be able to
detect patients who might benefit clinically from nutrition support (Kondrup et
al., 2003b). They claim that available screening systems have not been
validated with respect to clinical outcome. In developing such a tool it was
likely that patients may be included who are not malnourished at the time, but
at risk of doing so because of disease and/or its treatment. The NRS 2002
tool comprises three variables: recent weight loss, recent poor intake and
body mass index as used in most screening tool, and “have a reasonable
evidence base in the literature” (Kondrup et al., 2003b). A score from these
nutrition variables is then combined with a score for disease severity. After
the validation study was done, an additional variable for being elderly was
also added. The predictive validity of the tool has been documented by
applying it to a retrospective analysis of 128 randomized controlled trials
(RCT) of nutrition support, with patients fulfilling the risk criteria having a
higher likelihood of a positive outcome from nutrition support than RCTs of
patients who did not fulfil the criteria. In addition it has been applied
Appendices
255
prospectively in a controlled trial of 212 hospitalized patients (Kondrup et al.,
2002), selected according to this screening method, which showed a
decreased length of hospital stay among patients with complications in the
intervention group. Its practicality was demonstrated by the finding that 99%
of 750 newly admitted patients could be screened successfully (Kondrup et
al., 2003a). This nutrition screening system has been included in national
recommendations for food in hospitals in Denmark, and is gradually being
introduced into hospitals throughout Denmark. This system is currently
recommended by ESPEN for screening the acute elderly as part of the
ESPEN Guidelines for Nutrition Screening (Kondrup et al., 2003a), together
with the MUST system in the community and the MNA-SF in institutionalized
elderly.
All of these tools are in fact relatively similar. They consist of generally the
same few parameters and are score based and categorize patients as low,
moderate or high risk of malnutrition. The majority of tools commonly use
recent weight loss, recent poor intake/ appetite and body weight for height (or
BMI) as parameters and most tools also now suggest a nutrition action plan,
of varying detail, attached to the various levels of nutritional risk. Differences
in the tools lie in their complexity of implementation and subsequent sensitivity
and specificity and these factors may need to be traded off. For example, a
tool with more parameters and/or parameters which require calculations or
clinical expertise may have a higher specificity, but are more likely time
consuming and subject to error, and may result in them not being
implemented effectively (Capra, 2007). Overall, a screening tool needs to
achieve a high sensitivity (that is, identify all at risk), even if this is at the
expense of a high specificity (majority identified are at risk with low rate of
false positives) as screening is only the first step to identify those that require
assessment (Capra, 2007). Tools which require severity of disease to be
determined cannot be used by non technical staff which may be
disadvantageous. Tools which require BMI or percentage weight loss to be
calculated, rather than just actual weight change, may be completed less
often, as found researchers in the UK using the MNA (Cook et al., 2005).
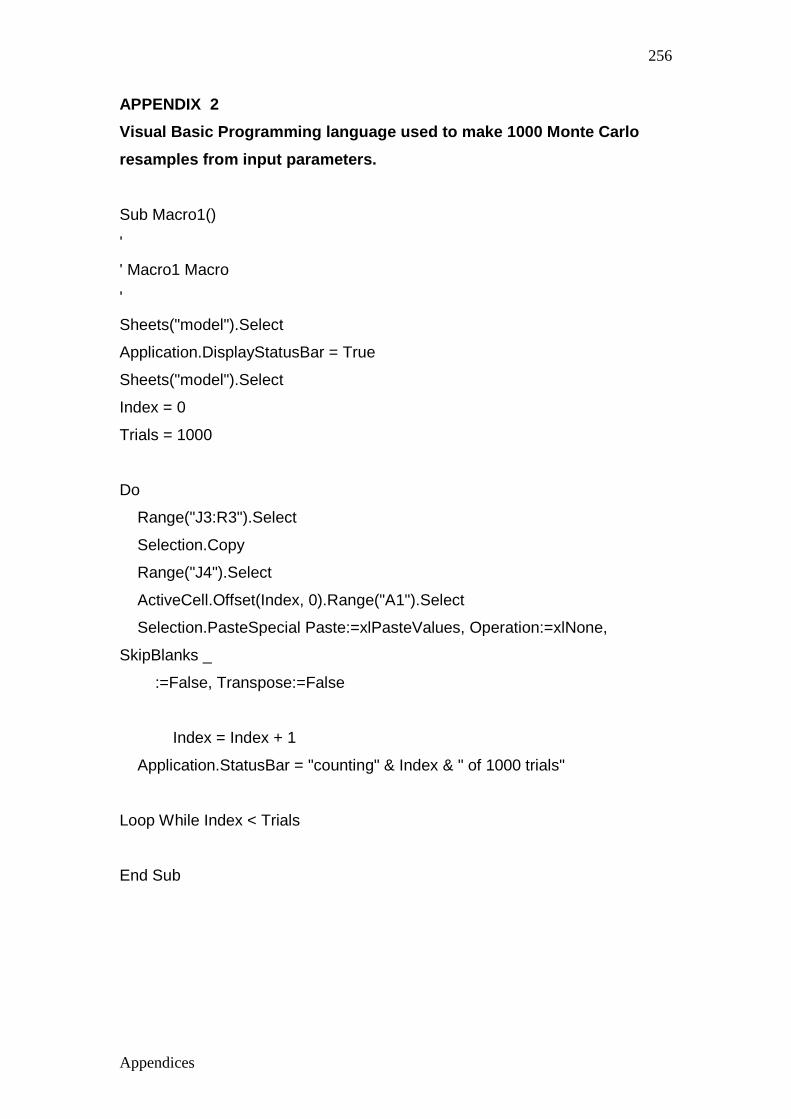
Appendices
256
APPENDIX 2
Visual Basic Programming language used to make 1000 Monte Carlo
resamples from input parameters.
Sub Macro1()
'
' Macro1 Macro
'
Sheets("model").Select
Application.DisplayStatusBar = True
Sheets("model").Select
Index = 0
Trials = 1000
Do
Range("J3:R3").Select
Selection.Copy
Range("J4").Select
ActiveCell.Offset(Index, 0).Range("A1").Select
Selection.PasteSpecial Paste:=xlPasteValues, Operation:=xlNone,
SkipBlanks _
:=False, Transpose:=False
Index = Index + 1
Application.StatusBar = "counting" & Index & " of 1000 trials"
Loop While Index < Trials
End Sub
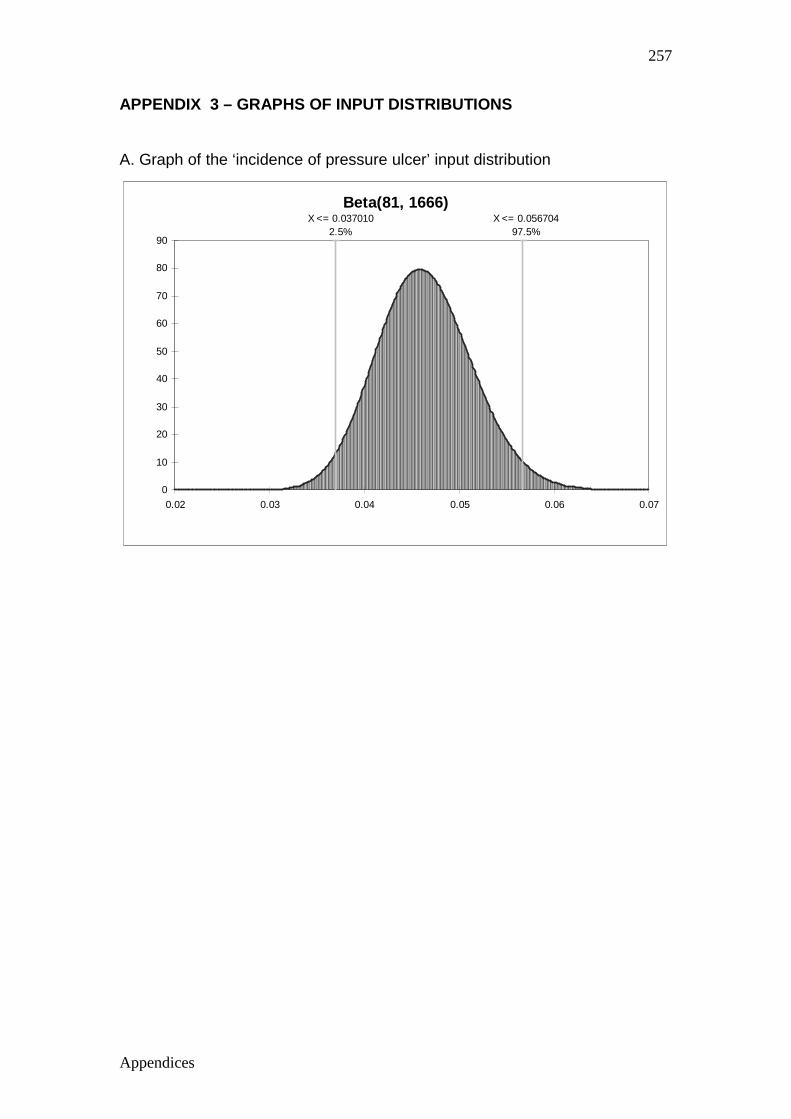
Appendices
257
APPENDIX 3 – GRAPHS OF INPUT DISTRIBUTIONS
A. Graph of the ‘incidence of pressure ulcer’ input distribution
Beta(81, 1666)X <= 0.056704
97.5%X <= 0.037010
2.5%
0
10
20
30
40
50
60
70
80
90
0.02 0.03 0.04 0.05 0.06 0.07
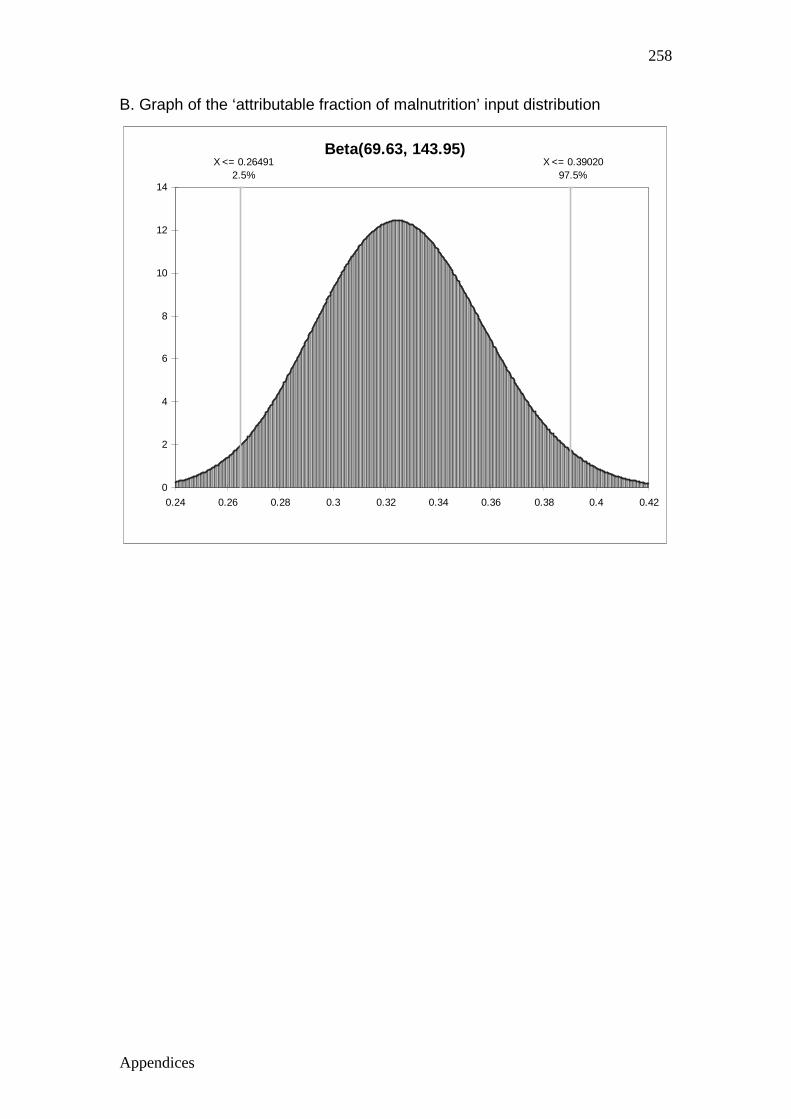
Appendices
258
B. Graph of the ‘attributable fraction of malnutrition’ input distribution
Beta(69.63, 143.95)X <= 0.39020
97.5%X <= 0.26491
2.5%
0
2
4
6
8
10
12
14
0.24 0.26 0.28 0.3 0.32 0.34 0.36 0.38 0.4 0.42
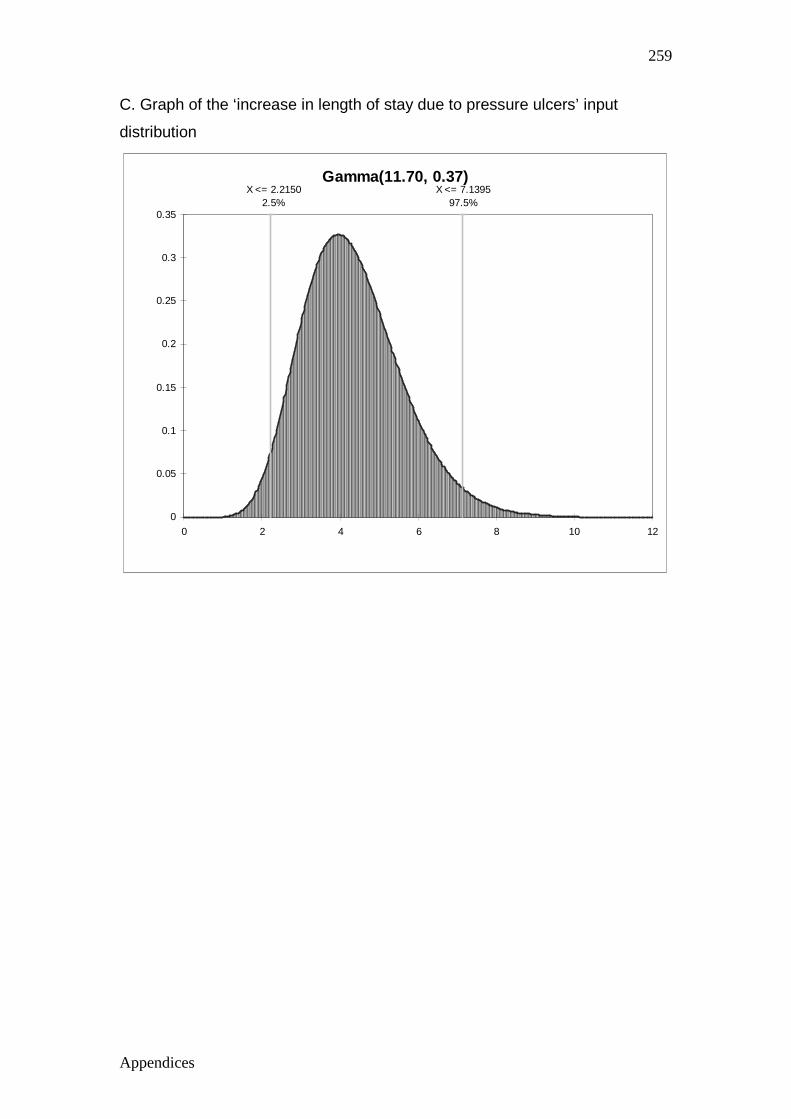
Appendices
259
C. Graph of the ‘increase in length of stay due to pressure ulcers’ input
distribution
Gamma(11.70, 0.37)X <= 7.1395
97.5%X <= 2.2150
2.5%
0
0.05
0.1
0.15
0.2
0.25
0.3
0.35
0 2 4 6 8 10 12
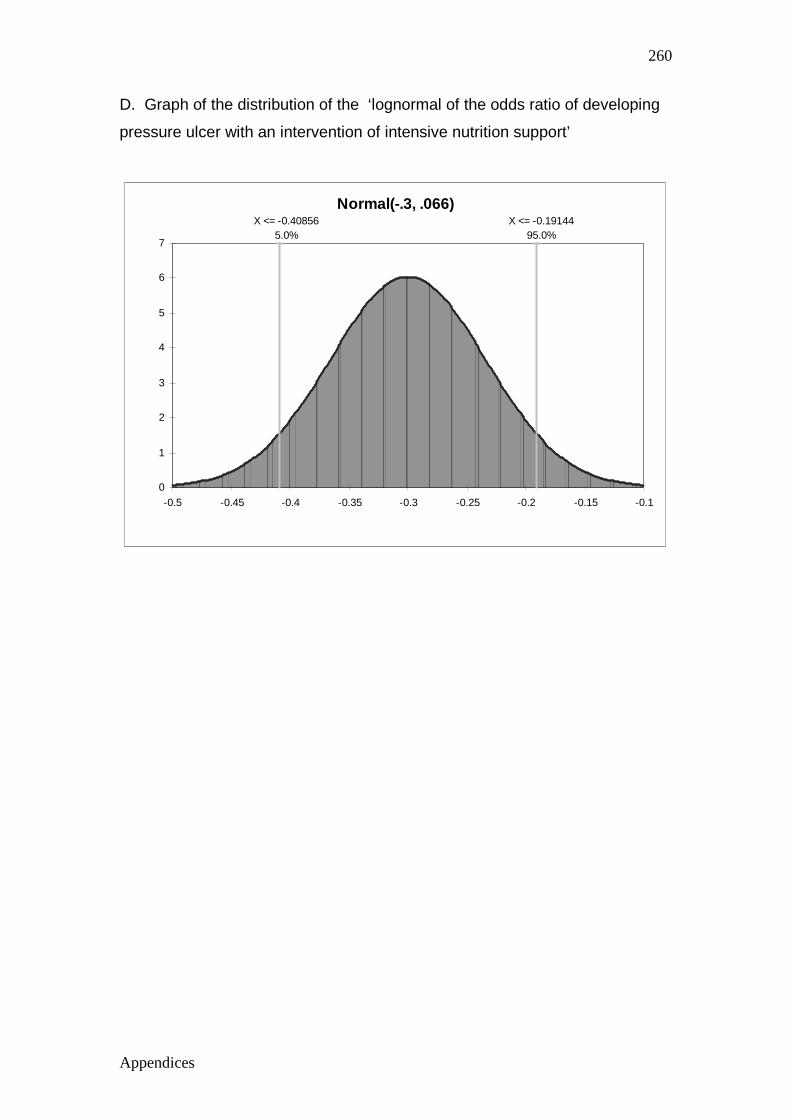
Appendices
260
D. Graph of the distribution of the ‘lognormal of the odds ratio of developing
pressure ulcer with an intervention of intensive nutrition support’
Normal(-.3, .066)X <= -0.19144
95.0%X <= -0.40856
5.0%
0
1
2
3
4
5
6
7
-0.5 -0.45 -0.4 -0.35 -0.3 -0.25 -0.2 -0.15 -0.1
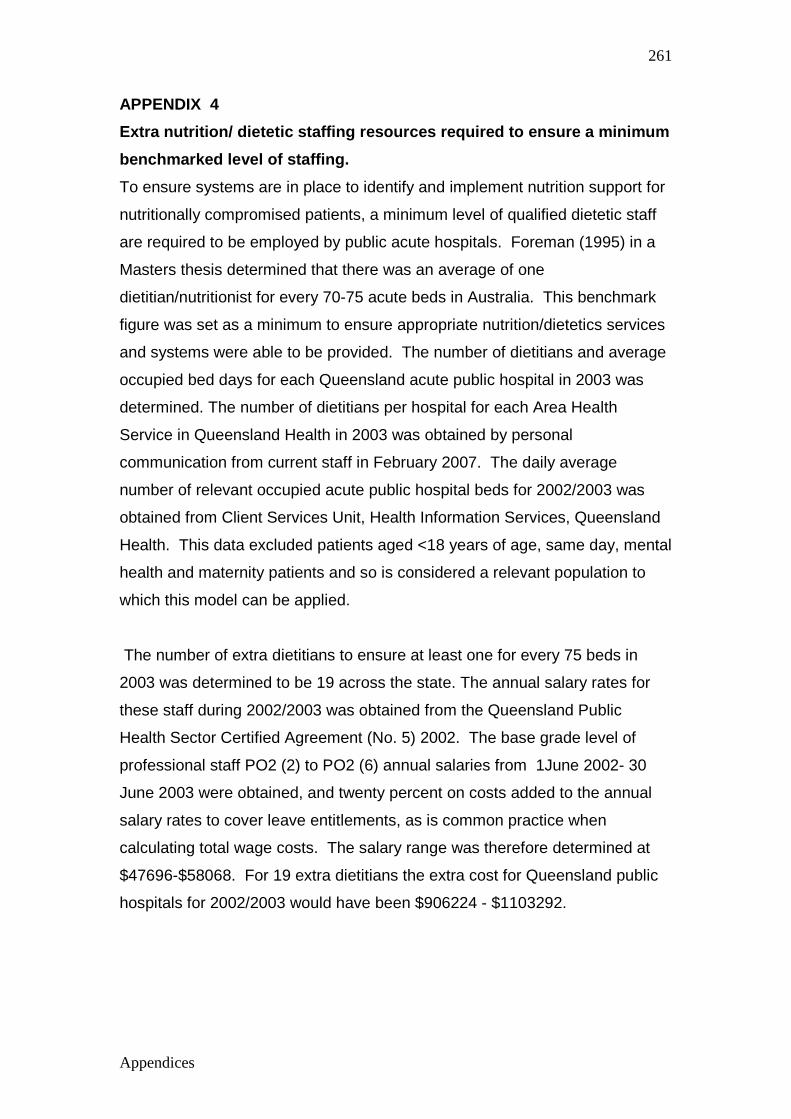
Appendices
261
APPENDIX 4
Extra nutrition/ dietetic staffing resources requir ed to ensure a minimum
benchmarked level of staffing.
To ensure systems are in place to identify and implement nutrition support for
nutritionally compromised patients, a minimum level of qualified dietetic staff
are required to be employed by public acute hospitals. Foreman (1995) in a
Masters thesis determined that there was an average of one
dietitian/nutritionist for every 70-75 acute beds in Australia. This benchmark
figure was set as a minimum to ensure appropriate nutrition/dietetics services
and systems were able to be provided. The number of dietitians and average
occupied bed days for each Queensland acute public hospital in 2003 was
determined. The number of dietitians per hospital for each Area Health
Service in Queensland Health in 2003 was obtained by personal
communication from current staff in February 2007. The daily average
number of relevant occupied acute public hospital beds for 2002/2003 was
obtained from Client Services Unit, Health Information Services, Queensland
Health. This data excluded patients aged <18 years of age, same day, mental
health and maternity patients and so is considered a relevant population to
which this model can be applied.
The number of extra dietitians to ensure at least one for every 75 beds in
2003 was determined to be 19 across the state. The annual salary rates for
these staff during 2002/2003 was obtained from the Queensland Public
Health Sector Certified Agreement (No. 5) 2002. The base grade level of
professional staff PO2 (2) to PO2 (6) annual salaries from 1June 2002- 30
June 2003 were obtained, and twenty percent on costs added to the annual
salary rates to cover leave entitlements, as is common practice when
calculating total wage costs. The salary range was therefore determined at
$47696-$58068. For 19 extra dietitians the extra cost for Queensland public
hospitals for 2002/2003 would have been $906224 - $1103292.

Appendices
262
APPENDIX 5 MANUSCRIPTS AND PEER REVIEWED CONFERENCE ABSTRACTS
1
PREVALENCE OF MALNUTRITION IN ADULTS IN QUEENSLAND PUBLIC HOSPITALS AND RESIDENTIAL AGED CARE FACILITIES Running Title: Malnutrition in adults in Queensland health facilities Merrilyn Banks 1,2 , Susan Ash1,2 , Judy Bauer 1,3, Deanne Gaskill 1 1 Institute of Health and Biomedical Innovation, Queensland University of Technology, Kelvin Grove, QLD 4059 2 Department of Nutrition & Dietetics, Royal Brisbane & Women’s Hospital, Herston, QLD 4029 3 The Wesley Hospital & Wesley Research Institute, Toowong, QLD 4066 MB initiated the study, participated in data collection, obtained the dataset and carried out the statistical analysis, interpreted and wrote the manuscript; SA participated in data collection and assisted in interpretation and writing of the manuscript; JB and DG assisted in interpretation and writing of the manuscript. Correspondence: Merrilyn Banks Department of Nutrition & Dietetics, Royal Brisbane & Women’s Hospital HERSTON 4029 Email: [email protected] Ph: (07) 3636 7997 Fax: (07) 3636 1874 This paper is published in: Nutrition & Dietetics: 64: 172-178 The definitive version of this paper is available at: www.blackwell-synergy.com
2
PREVALENCE OF MALNUTRITION IN ADULTS IN QUEENSLAND PUBLIC HOSPITALS AND RESIDENTIAL AGED CARE FACILITIES ABSTRACT Aims: To determine the prevalence of malnutrition in Queensland public acute and residential aged care facilities, and explore effects of variables associated with malnutrition in these populations. Methods: A multi-centre, cross sectional audit of a convenience sample of subjects was carried out as part of a larger audit of pressure ulcers in Queensland public acute and residential aged care facilities in 2002 and again in 2003. Dietitians in twenty hospitals and six aged care facilities conducted single day nutritional status audits of 2208 acute and 839 aged care subjects using the Subjective Global Assessment, in either or both audits. Subjects excluded were obstetric, same day, paediatric and mental health patients. Weighted average proportions of nutritional status categories for acute and residential aged care facilities across the two audits were determined and compared. The effects of gender, age, facility location and medical specialty on malnutrition were determined via logistic regression. Results: A mean of 34.7+4.0% and 31.4+9.5% of acute subjects and a median of 50.0% and 49.2% of residents of aged care facilities were found to be malnourished in Audits 1 and 2 respectively. Variables found to be significantly associated with an increased odds risk of malnutrition included: older age groups, male (in residential aged care facilities), metropolitan location of facility and medical specialty, in particular, oncology and critical care. Conclusion: Malnutrition is significant in public acute and residential aged care facilities in Queensland. Action must be taken to increase the recognition, prevention and treatment of malnutrition especially in high risk groups. Key Words: Aged, hospitalization, malnutrition, Subjective Global Assessment
3
INTRODUCTION In Australia, disorders related to ‘overnutrition’ are now a national health priority.1 There is however limited awareness of the existence and extent of the other extreme, undernutrition or malnutrition as referred to in this manuscript. Studies from the 1970’s reported malnutrition to be present in 40-50% of hospitalised medical and surgical patients. 2-4 The first reported study in 1980 on the prevalence of malnutrition in Australia found 35% of surgical patients were malnourished in a Sydney hospital. 5 Numerous studies investigating the prevalence of malnutrition and its consequences have since been published internationally 6-25 , and from Australia. 26-35 The majority of studies have been undertaken in hospital settings, with relatively few in the community or residential care facilities. In several countries, large multi centre studies of the prevalence of malnutrition have been undertaken.9-10,12-19 Stratton et al 36 provided a comprehensive international review of the prevalence of malnutrition in patients with different disease groups, mixed diagnoses, across different age groups and in different settings. They concluded that malnutrition was common in hospitals (10-60%), in residential aged care facilities (up to 50% or more) and in free living individuals with severe or multiple disease (>10%). Australian studies 5,26-35 are generally limited in number, with none conducted across multiple centres, only one conducted in a community setting 32 and none conducted in residential aged care facilities. There is significant variation in the reported prevalence of malnutrition in these few Australian studies, with 12% to 42% in acute settings and 6% to 49% in rehabilitation settings. The wide variation in the reported prevalence of malnutrition in studies is due to variation in the methodology and criteria used to assess nutritional status, diagnoses of patients and setting eg. hospital or community. These variables make it difficult to compare studies and to ascertain the actual prevalence of malnutrition in hospitals, residential care facilities or the community 37, or to apply these findings to the Australian setting in general. The purpose of this study was to determine the prevalence of malnutrition in Queensland public acute and residential aged care facilities, and identify variables which may be associated with malnutrition in these populations. METHODS The study involved the collection of nutritional status data of subjects participating in a larger study investigating the prevalence of pressure ulcers. The multi-centre audits were conducted initially in 2002 (Audit 1) and repeated 12 months later (Audit 2), after the implementation of pressure ulcer guidelines in 20 hospitals and six residential aged care facilities. Facility involvement in the nutritional status audits was determined by whether a facility employed dietitians and whether the dietitians nominated to participate. Four of the 20 hospitals and four of the six residential aged care facilities participated in both nutritional status audits with other facilities being involved in either Audit 1 or Audit 2 only. A larger number of acute facilities were able to participate in Audit 2.
4
Nutritional status sample: Audits were conducted on a single day for each facility involved, with all available subjects potentially eligible for inclusion. Exclusions included : obstetric, paediatric, mental health and same day patients. The project was approved by Queensland Health as a quality improvement project and as such, no formal ethics approval was required, although subjects or their next of kin provided informed written consent to be included in the audits. Participation in the study was dependent on whether dietitians could undertake the audits , thus the sample for acute facilities was biased toward larger facilities where patient acuity is greater. Variables: A dataset was extracted from the larger study database for the purposes of this study program, and the variables available were limited to those collected for the larger study. Variables for each subject included: audit number/year, facility, age, gender and medical specialty (acute only). These variables were collected by trained audit staff, usually nurses. Nutritional status data was independently collected by dietitians and entered on to the standardized data collection form before entry into the database. Nutritional status of subjects was assessed using the Subjective Global Assessment (SGA). 38 The SGA is a widely used nutrition assessment tool which determines nutritional status based upon a medical assessment and physical examination. The SGA was chosen as it has been found to have a high degree of inter-rater reliability (with assessor agreement of 80-90% and kappa statistics of 0.75- 0.78), 10,12-13, 31,34, 38, and good predictive and convergent validity correlating well with measures of morbidity, and traditional objective nutritional parameters. 39-40 The SGA has been found to be a valid nutrition assessment tool in a variety of patient population settings including: surgery38, geriatric21,40-42, oncology43-44, and renal45, making it an ideal tool for use in this study, allowing for comparisons to be made across different population settings. Many recent Australian and international studies investigating the prevalence of malnutrition have also used the SGA. 10,12-13,16-
17,19-21,29-31,34 The SGA is also quickly and easily performed at the bedside. The parameters of the SGA include: weight change, dietary intake change, gastrointestinal symptoms, evidence of loss of subcutaneous fat stores, muscle wasting, oedema and ascites. The features are combined and patients are rated as being well nourished, moderately malnourished, or severely malnourished. Combining the proportions of moderately and severely malnourished provides a proportion of the total malnourished . Standardized training in performing SGA was conducted for dietitians involved in the nutritional status audits by the authors (MB, SA). Inter-rater reliability
5
between a convenience sample of fifteen dietitians assessing nine patients showed good agreement with the use of the SGA (Kappa 0.9, p<0.001). Inter-rater reliability was unable to be completed with all dietitians undertaking the nutritional status audits due to the number and distance between facilities involved. Case studies completed during training however indicated good agreement. Medical specialties were categorized from classifications provided by facilities. Fifteen categories were collapsed into six for the purposes of this study: medical (general medical, respiratory, gastrointestinal, renal, neurological, infectious diseases), surgical (general surgical, orthopaedic, spinal injury), oncology (oncology/ haematology, palliative care), critical care (critical care, burns), rehabilitation and aged care. In addition to the above variables extracted from the larger study database, the variables of facility type, facility location and age group were determined. Facility type (acute or residential) was determined by the classification of the facility by Queensland Health. Facility location was based on the Rural, Remote and Metropolitan Areas Classifications, 1991 Census edition (ABS, Canberra), as used by Queensland Health. Seven categories were collapsed into three: metropolitan, regional and rural/remote. Age was categorized to allow for comparisons to be made across the different age groups of: 40 years or less, 41-60 years, 61-80 years, 81 years or older. Determining a representative sample: Demographic variables of the sample were compared to the relevant Queensland public health facility population data where available, to determine if the sample was representative. As population data for residential aged care was not available, comparison of demographic variables was made to the larger pressure ulcer audit study population. Queensland Health (public) facility population data including the average daily occupied beds for all facilities, average age and gender for the populations being studied, were provided for 2003 by Health Information Services (Queensland Health). Comparison of descriptive variables was made using t-tests for continuous variables and Chi square tests for categorical variables. The proportion of subjects and demographic data of those who declined consent or were unavailable was not available. The number of repeated cases between the two audits was quantified with only 0.03% of acute subjects and 28.2% of aged care residents found to be in both audits. There were no significant differences between demographic variables in each audit for residential aged care when the duplicate cases were removed. Hence comparison between Audit 1 and Audit 2 as independent datasets was deemed reasonable. Data analyses:
6
The percentage of well nourished, moderately, severely and total (addition of moderately and severely) malnourished subjects were determined for each facility. An average percentage across facilities was then determined, for acute and residential aged care facilities for each audit. The average percentage was weighted by the number of cases in each facility. Results are reported as means with standard deviations and minimum and maximum values where data were normally distributed and as medians with minimum and maximum values where data were not normally distributed. This analysis and descriptive analyses were carried out using SPSS for Windows (Version 12.0, 2003, SPSS Inc, Chicago, IL, USA) To determine the effects of available variables on nutritional status in acute and residential aged care facilities, logistic regression was conducted at the bivariate level to determine crude odds ratios, and then in a multivariable model to ascertain their independent influences. The potential clustering effect of facility was accounted for in the model using an analysis of correlated data approach with SUDAAN statistical package (Version 7.5.2A, 1998, NC, USA). Significant design effect was established for the variables of facility location and medical specialty in acute facilities, and facility location in residential aged care facilities, confirming the use of this approach. Statistical significance was predetermined as the conventional p<0.05 level. In all analyses, acute care and residential aged care facilities were kept separate as it was decided that these types of facilities were significantly different from one another to require separate analysis and interpretation. For logistic regression it was decided that data from Audit 1 and Audit 2 for acute facilities would be pooled, if no significant difference was found in the proportions of nutritional status categories between the two years, but that only Audit 1 data would be used for residential aged care facilities because it would be inappropriate to pool Audit 1 and Audit 2 data, due to the high percentage of dependent cases between audits. For comparison within variables, the most frequent category of a variable was chosen as the referent. The association between nutritional status and pressure ulcers was not investigated here, but will be the subject of a future study. RESULTS There were 774 and 1434 acute patients, from eight and 16 hospitals; and 381 and 458 residents from five residential aged care facilities in Audit 1 and 2 respectively. This represents approximately 40% and 80% of the average daily occupied beds for the acute and residential aged care facilities, respectively, that were involved in the audits. Table 1 shows the demographic data for the sample. Whilst there were no gender differences, the average age of the sample was significantly older than the equivalent Queensland Health acute population by approximately eight years. There were also significantly fewer acute subjects represented from regional and rural and remote areas than
7
metropolitan areas as expected. For residential aged care subjects, there were significantly fewer represented from regional areas, but adequate representation from rural and remote areas. The residential aged care sample was otherwise found to be similar to the larger study sample, which represented over 80% of the Queensland public residential aged care population. Table 2 shows the average percentages of nutritional status classifications across acute and residential aged care facilities. A mean of 34.7 + 4.0% and 31.4 + 9.5% of acute subjects, and a median of 50% and 49.2% of aged care subjects were found to be malnourished, in Audits 1 and 2 respectively. Approximately 20% of malnourished subjects are severely malnourished. The difference in the prevalence of malnutrition between Audit 1 and Audit 2 for both acute and residential aged care facilities was not clinically or statistically significant. The multivariable relationships of various parameters on nutritional status for the acute and residential aged care facilities are presented in Table 3. The multivariable (mutually adjusted) models generally strengthened the relationships established at the bivariate level. As there was no significant difference in the prevalence of malnutrition between Audits 1 and 2 for acute facilities, data were combined for bivariate and multivariable analyses. Gender did not have an effect on nutritional status in acute facilities, but did in residential aged care facilities. Being male in a residential aged care facility was shown to have an adjusted odds risk of 1.2 (95%CI 1.1-1.3, p=0.003) compared to being female. Age group had a significant effect on nutritional status. Compared to the age group 61-80 years, younger age groups have a lower odds risk of being malnourished (acute: <40 years OR = 0.6 (95% CI 0.4-0.8, p<0.001); 41-60 years OR = 0.6 (95% CI 0.5-0.7, p<0.001)), although this did not reach statistical significance in the residential aged care facilities. Being aged 81 years or older compared to 61-80 years, had an adjusted odds risk of being malnourished of 1.7 (95% CI 1.5-2.0, p<0.001) in acute facilities and 1.4 (95% CI 1.2-1.6, p<0.001) in residential aged care facilities. Facility location also had an effect on nutritional status. In the acute setting, subjects from rural and remote locations had a significantly lower odds risk of being malnourished (OR=0.1, 95% CI 0.02-0.5, p=0.007) than those from metropolitan facilities. This pattern was also demonstrated for regional facilities but did not reach statistical significance. In the residential aged care setting there was a lower odds risk of being malnourished if from a regional facility (OR=0.1, 95% CI 0.01-0.8, p=0.03). Again this pattern was demonstrated for rural and remote facilities, but did not reach statistical significance. Medical specialty in acute facilities was found to have an effect on nutritional status. Compared to medical patients, oncology patients had an adjusted higher odds risk of being malnourished (OR=2.3 (95% CI 1.5-3.8, p=0.001) as did critical care patients (OR=1.6 (95% CI 1.1-2.3, p=0.02). All other medical specialties were not considered significantly different from medical subjects.
8
DISCUSSION In this observational multi centre study, malnutrition was found to be present in approximately 30% of over 2200 acute patients, and 50% of over 800 aged care residents in a number of public facilities in Queensland. These results are consistent with other recent studies conducted both overseas and in Australia 6-
35, and are not dissimilar to those first reported in the 1970s and 1980s. 2-5 This study however has been conducted on a large number of cases across 20 acute and six residential aged care facilities, and therefore provides the first significant evidence of the extent of malnutrition in public acute and residential aged care facilities in Australia. The prevalence of malnutrition found in this study is similar to other across admission studies conducted in Australian hospitals, that is, about 30-50%. 26, 31,
34 Studies of nutritional status conducted at admission tend to indicate a prevalence of malnutrition in the order of 12-20%.28-30 Studies show that the prevalence of malnutrition increases as the length of stay of patients studied increases. 17 This is because patients who stay longer in hospital are more likely to be malnourished due to severity of illness, and that individual patients’ nutritional status declines during admission, as demonstrated in several studies. 6,11,46 There was no difference found in the prevalence of malnutrition between Audit 1 and Audit 2 for both acute and residential aged care facilities. After Audit 1, pressure ulcer guidelines were introduced into facilities, which included referral for nutrition assessment and intervention for subjects with, or at high risk of, pressure ulcers. An unexpected finding was the unchanged prevalence of malnutrition between the two audits, when it could be expected that this would reduce with the introduction of these guidelines. Poor referral for nutrition assessment and intervention was reported by the facility dietitians, which could explain this finding. Other studies have shown that the implementation of a comprehensive nutrition screening and intervention program decreases the prevalence of malnutrition and improves patient outcomes.47-48 In this study, younger age groups had a lower odds risk of being malnourished, and those over the age of 80 years had a higher odds risk of being malnourished compared to those aged 61-80 years. This has also been demonstrated in other studies.19-20 As disease prevalence generally increases with age, rates of associated malnutrition are also likely to increase in older people. 36 As the average age of the sample was older than the Queensland Health acute population it is expected that the level of malnutrition reported here for acute facilities would be higher than for the Queensland Health acute population in general. However, this study demonstrates that the nutritional needs of older people in hospitals and residential aged care facilities require greater attention. Males in residential aged care facilities had a higher odds risk
9
of being malnourished. This however contrasts with the findings of another study in Finland which found that female aged care residents had a higher risk of malnutrition.25 The association of gender with nutritional status needs further exploration. The odds risk of being malnourished was lower in regional and rural and remote facilities. Other studies have noted that the prevalence of malnutrition is greater in tertiary hospitals than general hospitals. 9 This is most likely due to the greater acuity of disease, which is the primary cause of malnutrition in developed countries. 36-37 Due to the bias of this study toward being undertaken in metropolitan (and therefore tertiary) facilities, it is expected the level of malnutrition reported here for acute facilities would be higher than for the Queensland public acute population in general. The lower odds risk of being malnourished from a regional or rural and remote residential aged care facility compared with a metropolitan facility was not an expected finding and requires more investigation as insufficient data are available here to make conclusive findings. The prevalence of malnutrition reported here for residential aged care facilities may be an under estimate of the true prevalence as facilities involved in the study had regular dietetic services which should mean better nutrition practices than facilities without regular access to nutritional expertise. Malnutrition has been identified as a significant problem in patients with respiratory disease, gastrointestinal and liver disease, HIV and AIDS, malignancy, neurological diseases, renal disease, critical illness, orthopaedic and surgical patients. 36 This study found, compared to medical patients, that oncology and critical care patients had a significantly higher odds risk of patients being malnourished. This is most likely due to patients under these medical specialties overall having greater metabolic stress. Patients in rehabilitation care have been reported in other studies to have a higher prevalence of malnutrition, 23,31,35 however this was not demonstrated in this study. Malnutrition is independently associated with adverse clinical outcomes and costs. 7,49-51 and there is evidence that nutrition intervention results in statistically significantly and clinically relevant improvements on mortality, complications and length of stay. 36 However many studies have demonstrated that malnutrition continues to frequently go unrecognized and untreated. 6,12,16,31,34,37 Recent Australian studies 31,34 found a majority of patients assessed as malnourished had not been previously identified or were not documented as such, and were not receiving any specialized nutrition care. Reasons for the lack of awareness and recognition of malnutrition include: limited training and knowledge of clinical staff; misbelief that malnutrition is an inevitable part of the disease process and resistant to therapy; failure to regard nutrition as an important part of care, scarcity of specialist clinical nutrition appointments, lack of good practice guidelines and nationally agreed standards, lack of organisation of nutritional services linking relevant disciplines. 51-52
10
Limitations of this study include: the use of a convenience sample which for the acute sample was not found to be representative of the Queensland acute public population, and difficulty determining if the residential aged care sample was representative, and therefore it is difficult to apply these results to Australian public hospitals and residential aged care facilities in general; the unavailability of data on subjects who declined or were unavailable for the audits, although this was minimized as a limitation by determining the representativeness of the sample; the number of clinicians determining nutritional status was also a potential limitation of this study, but was minimized through standardized training, which has been shown to result in good inter-rater reliability; misclassification of subjects’ medical specialty was another potential limitation of this study and the collapsing of medical specialties into fewer categories to ensure adequate numbers in categories may have resulted in altering or masking the effects of some medical specialties. The strengths of this study include the large numbers across multiple facilities with the inclusion of residential aged care facilities, and the standardized nutrition assessment methodology. Conclusion This large scale multi centre study provides evidence that malnutrition is significant in public acute and residential aged care facilities in Queensland. Being malnourished was found to be significantly associated with: older age groups, male gender (in residential aged care facilities), metropolitan location (compared to regional and rural and remote locations) and medical specialty, in particular, oncology and critical care patients. Action must be taken to increase the recognition, prevention and appropriate treatment of malnutrition especially in higher risk groups.
11
ACKNOWLEDGEMENTS The nutritional status audits were in part funded by the Queensland Health Pressure Ulcer Prevention Project. We thank project team members, and in particular Nancy Magazinovich, Project Manager, for including the nutritional status component of the audits We acknowledge the many dietitians in Queensland Health who undertook to participate in the nutritional status audits, especially Denise Cruickshank for assisting with the organization. Acknowledgment is also made to the late Associate Professor Carla Patterson for her initial assistance with this study.
12
REFERENCES 1. NHMRC. Acting on Australia's Weight - a strategic plan for the prevention of
overweight and obesity. Canberra: National Health and Medical Research Council; 1997.
2. Bistrian BR, Blackburn GL, Hallowell E, Heddle R. Protein status of general surgical Patients. JAMA 1974; 230: 858-860.
3. Bistrian BR, Blackburn GL, Vitale J, et al. Prevalence of malnutrition in general medical patients. JAMA 1976; 235: 1567-1570.
4. Hill GL, Blackett RL, Pickford I, et al. Malnutrition in surgical patients: An unrecognized problem. The Lancet 1977; March 26: 689-692.
5. Marshman R, Fisher MM, Coupland GAE. Nutritional status and postoperative complications in an Australian hospital. Aust NZ J Surg 1980; 50:516-519.
6. McWhirter JP, Pennington CR. Incidence and recognition of malnutrition in hospital. BMJ 1994; 308:945-8.
7. Chima CS, Barco K, Dewitt MLA, et al. Relationship of nutritional status to length of stay, hospital costs, and discharge status of patients hospitalized in the medicine service. J Am Diet Assoc 1997; 97:975-978.
8. Bruun LI, Bosaeus I, Bergstad I, Nygaard K. Prevalence of malnutrition in surgical patients: evaluation of nutritional support and documentation. Clin Nutr 1999;18(3):141-147.
9. Edington J, Boorman J, Durrant ER, et al. Prevalence of malnutrition on admission to four hospitals in England. Clin Nutr 2000; 19:191-195.
10. Waitzberg DL, Caiaffa WT, Correia MITD. Hospital Malnutrition: The Brazilian National Survey (IBRANUTRI): A study of 4000 Patients. Nutrition 2001;17:573-580.
11. Kondrup J, Johansen N, Plum LM, et al. Incidence of nutritional risk and causes of inadequate nutritional care in hospitals. Clin Nutr 2002; 21:461-468.
12. Correia MITD, Campos ACL. Prevalence of hospital malnutrition in Latin America: The Multicenter ELAN Study. Nutrition 2003; 19:823-825.
13. Wyszynski DF, Perman M, Crivelli A. Prevalence of hospital malnutrition in Argentina: Preliminary results of a population-based study. Nutrition 2003;19:115-119.
14. Kruizenga HM, Wierdsma NJ, van Bokhorst MAE et al. Screening of nutritional status in The Netherlands. Clin Nutr 2003;22(2):147-152.
15. Rasmussen HH, Kondrup J, Staun M, et al. Prevalence of patients at nutritional risk in Danish hospitals. Clin Nutr 2004;23(5):1009-1015.
13
16. Planas M, Audivert S, Perez-Portabella C, et al. Nutritional status among adult patients admitted to a university-affiliated hospital in Spain at the time of genoma. Clin Nutr 2004; 23(5):1016-1024
17. Penie JB. State of malnutrition in Cuban hospitals. Nutrition 2005; 21:487-497.
18. Dzieniszewski J, Jarosz M, Szczygiel B, et al. Nutritional status of patients hospitalised in Poland. Eur J Clin Nutr 2005;59:552-560.
19. Olmos M, Vazquez M, Lopez M, del Campo Perez V. Nutritional status study of inpatients in hospitals of Galicia. Eur J Clin Nutr 2005;59:938-946.
20. Kyle UG, Unger P, Mensi N, Genton L, Pichard C. Nutrition status in patients younger and older than 60 years at hospital admission: A controlled population study in 995 subjects. Nutrition 2002;18:463-469.
21. Persson MD, Brismar KE, Katzarski KS, Nordenstrom J, Cederholm T. Nutritional status using Mini Nutritional Assessment and Subjective Global Assessment predict mortality in geriatric patients. J Am Geriatr Soc 2002;50(12):1996-2002.
22. Donini LM, Rosano A, De Felice MR, et al. MNA predictive value in the follow up of geriatric patients. J Nutr Health Aging 2003;75(5):282-293.
23. Compan B, Di Castri A, Plaze JM, Arnaud-Battandier F. Epidemiological study of malnutrition in elderly patients in acute, sub-acute and long-term care using the MNA. J Nutr Health Aging 1999;3(3):146-151.
24. Thomas DR. Malnutrition in subacute care. Am J Clin Nutr 2002;75:308-313.
25. Suominen M, Muurinen S, Routasalo P, et al. Malnutrition and associated factors among aged residents in all nursing homes in Helsinki. Eur J Clin Nutr 2005;59:578-583.
26. Askew AR, Sui S, Green MK, et al. Evaluation of the nutritional state of surgical patients in Brisbane. Aust NZ J Surg 1982;52(2):117-120.
27. Wood B, Kelleher D, Lo L, et al. Nutritional status in hospital inpatients: Implications for nutritional support services. Aust NZ J Med 1985; 15:435-441.
28. Zador DA, Truswell AS. Nutritional status on admission to a general surgical ward in a Sydney Hospital. Aust NZ J Med 1987;17:234-240.
29. Ferguson M, Capra S, Bauer J, Banks M. Coding for malnutrition enhances reimbursement under casemix-based funding. Aust J Nutr Diet 1997; 54:102-108.
30. Beck E, Patch C, Milosavljevic M, et al. Implementation of malnutrition screening and assessment by dietitians: malnutrition exists in acute and rehabilitation settings. Aust J Nutr Diet 2001; 58:92-97.
31. Middleton MH, Nazarenko G, Nivison-Smith I, Smerdely P. Prevalence of malnutrition and 12-month incidence of mortality in two Sydney teaching hospitals. Intern Med J 2001; 31:455-461.
14
32. Visvanathan R, Macintosh C, Callary M, et al. The nutritional status of 250 older Australian recipients of domicillary care services and its association with outcomes at 12 months. J Am Geriatr Soc 2003; 51:1007-1011.
33. Visvanathan R, Penhall R, Chapman I. Nutritional screening of older people in sub-acute care facility in Australia and its relation to discharge outcomes. Age Aging 2004; 33:260-265
34. Lazarus C, Hamlyn J. Prevalence and documentation of malnutrition in hospitals: A case study in a large private hospital setting. Nutr Diet 2005; 62:41-47.
35. Neumann S, Miller M, Daniels L, Crotty M. Nutritional status and clinical outcomes of older patients in rehabilitation. J Hum Nutr Dietet 2005;18:129-136.
36. Stratton R, Green CJ, Elia M. Disease-related malnutrition: an evidence-based approach to treatment. Wallingford UK: CABI Publishing; 2003.
37. Corish CA, Kennedy NP. Protein-energy malnutrition in hospital in-patients. Br J Nutr 2000; 83:575-591.
38. Detsky AS, McLaughlin JR, Baker JP, et al. What is Subjective Global Assessment of nutritional status? JPEN 1987;11(1):8-13.
39. Detsky AS, Baker JP, O'Rourke K, et al. Predicting nutrition-associated complications for patients undergoing gastrointestinal surgery. JPEN 1987; 11:440-446.
40. Duerksen DR, Yeo TA, Siemens JL, O'Connor MP. The validity and reproducibility of clinical assessment of nutritional status in the elderly. Nutrition 2000;16:740-744.
41. Christensson L, Unosson M, Ek A. Evaluation of nutritional assessment techniques in elderly people newly admitted to municipal care. Eur J Clin Nutr 2002;56:810-818.
42. Sacks GS, Dearman K Replogle, WH et al. Use of Subjective Global Assessment to identify nutrition-associated complications and death in geriatric long-term care facility residents. J Am Coll Nutr 2000; 19: 570-577
43. Thoresen L, Fjeldstad I, Krogstad K, et al. Nutritional status of patients with advanced cancer: the value of using the Subjective Global Assessment of nutritional status as a screening tool. Pall Med 2002; 16:33-42
44. Isenring E, Bauer J, Capra S. The scored Patient-generated Subjective Global Assessment (PG-SGA) and its association with quality of life in ambulatory patients receiving radiotherapy. Eur J Clin Nutr 2003;57:305-309.
45. Cooper BA, Bartlett LH, Aslani A, et al. Validity of Subjective Global Assessment as a nutritional marker in end-Ssage renal disease. Am J Kidney Dis 2001; 40:126-132.
46. Sullivan DH, Sun S, Walls RC. Protein-energy undernutrition among elderly hospitalized patients: A prospective study. JAMA 1999; 281(21):2013-2019.
15
47. O'Flynn J, Peake H, Hickson M, Foster D, Frost G. The prevalence of malnutrition in hospitals can be reduced: Results from three consecutive cross-sectional studies. Clinical Nutrition 2005;24:1078-1088.
48. Brugler L, DiPrinzio MJ, Bernstein LH. The five-year evolution of a malnutrition treatment program in a community hospital. Joint Commission Journal of Quality Improvement 1999;25(4):191-206.
49. Correia MITD, Waitzberg DL. The impact of malnutrition on morbidity, mortality, length of hospital stay and costs evaluated through a multivariate model analysis. Clin Nur 2003; 22:235-239.
50. Green CJ. Existence, causes and consequences of disease-related malnutrition in the hospital and the community, and clinical and financial benefits of nutritional intervention. Clin Nutr 1999;18 (Supplement):3-28.
51. Covinsky KE, Martin GE, Beyth RJ, Justice AC, Sehgal AR, Langefeld CS. The relationship between clinical assessments of nutritional status and adverse outcomes in older hospitalized medical patients. J Am Geriatr Soc 1999;47(5):532-538.
52. Pennington CR. Disease-associated malnutrition in the year 2000. Postgrad Med J 1998;74:65-71.
53. Guigoz Y, Vellas B, Garry PJ. Assessing the nutritional status of the elderly: The Mini Nutritional Assessment as part of the geriatric evaluation. Nutr Rev 1996;54(1):S59-S65.
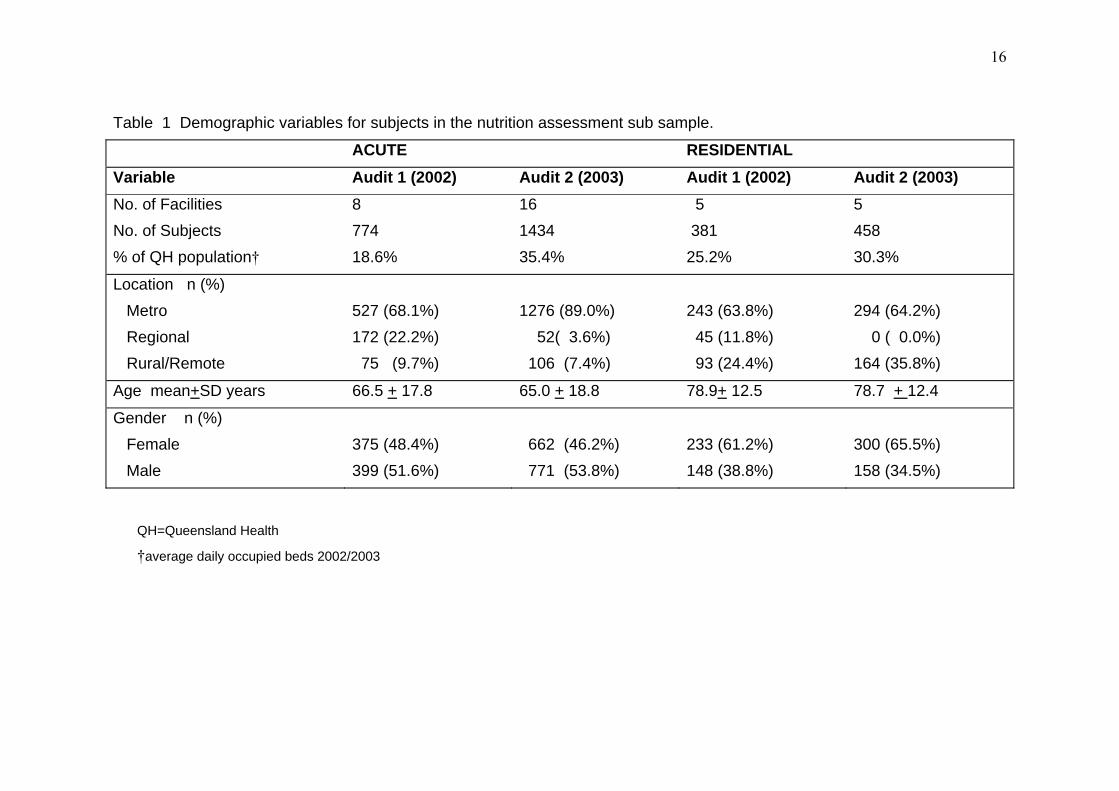
16
Table 1 Demographic variables for subjects in the nutrition assessment sub sample. ACUTE RESIDENTIAL Variable Audit 1 (2002) Audit 2 (2003) Audit 1 (2002) Audit 2 (2003) No. of Facilities No. of Subjects % of QH population†
8 774 18.6%
16 1434 35.4%
5 381 25.2%
5 458 30.3%
Location n (%) Metro Regional Rural/Remote
527 (68.1%) 172 (22.2%) 75 (9.7%)
1276 (89.0%) 52( 3.6%) 106 (7.4%)
243 (63.8%) 45 (11.8%) 93 (24.4%)
294 (64.2%) 0 ( 0.0%) 164 (35.8%)
Age mean+SD years 66.5 + 17.8 65.0 + 18.8 78.9+ 12.5 78.7 + 12.4
Gender n (%) Female Male
375 (48.4%) 399 (51.6%)
662 (46.2%) 771 (53.8%)
233 (61.2%) 148 (38.8%)
300 (65.5%) 158 (34.5%)
QH=Queensland Health
†average daily occupied beds 2002/2003
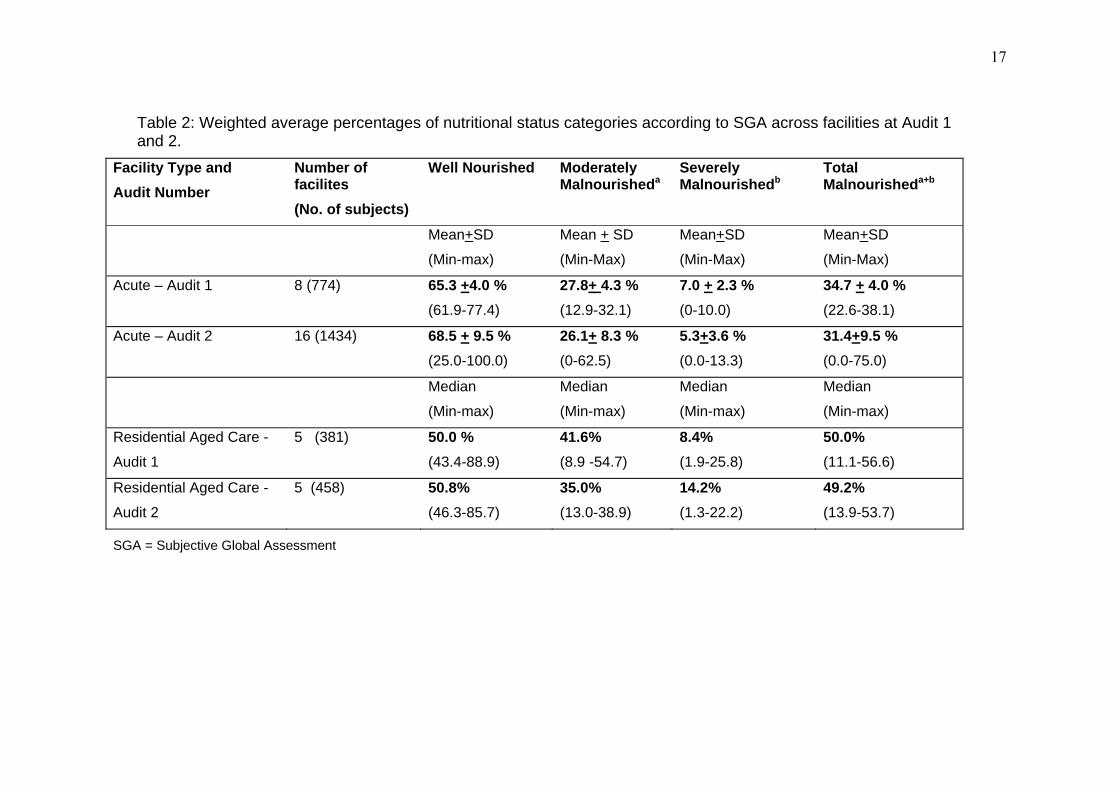
17
Table 2: Weighted average percentages of nutritional status categories according to SGA across facilities at Audit 1 and 2.
Facility Type and Audit Number
Number of facilites (No. of subjects)
Well Nourished Moderately Malnourisheda
Severely Malnourishedb
Total Malnourisheda+b
Mean+SD
(Min-max)
Mean + SD
(Min-Max)
Mean+SD
(Min-Max)
Mean+SD
(Min-Max)
Acute – Audit 1
8 (774) 65.3 +4.0 %
(61.9-77.4) 27.8+ 4.3 % (12.9-32.1)
7.0 + 2.3 % (0-10.0)
34.7 + 4.0 % (22.6-38.1)
Acute – Audit 2 16 (1434) 68.5 + 9.5 % (25.0-100.0)
26.1+ 8.3 % (0-62.5)
5.3+3.6 % (0.0-13.3)
31.4+9.5 % (0.0-75.0)
Median
(Min-max)
Median
(Min-max)
Median
(Min-max)
Median
(Min-max)
Residential Aged Care -
Audit 1
5 (381) 50.0 % (43.4-88.9)
41.6% (8.9 -54.7)
8.4% (1.9-25.8)
50.0% (11.1-56.6)
Residential Aged Care -
Audit 2
5 (458) 50.8% (46.3-85.7)
35.0% (13.0-38.9)
14.2% (1.3-22.2)
49.2% (13.9-53.7)
SGA = Subjective Global Assessment
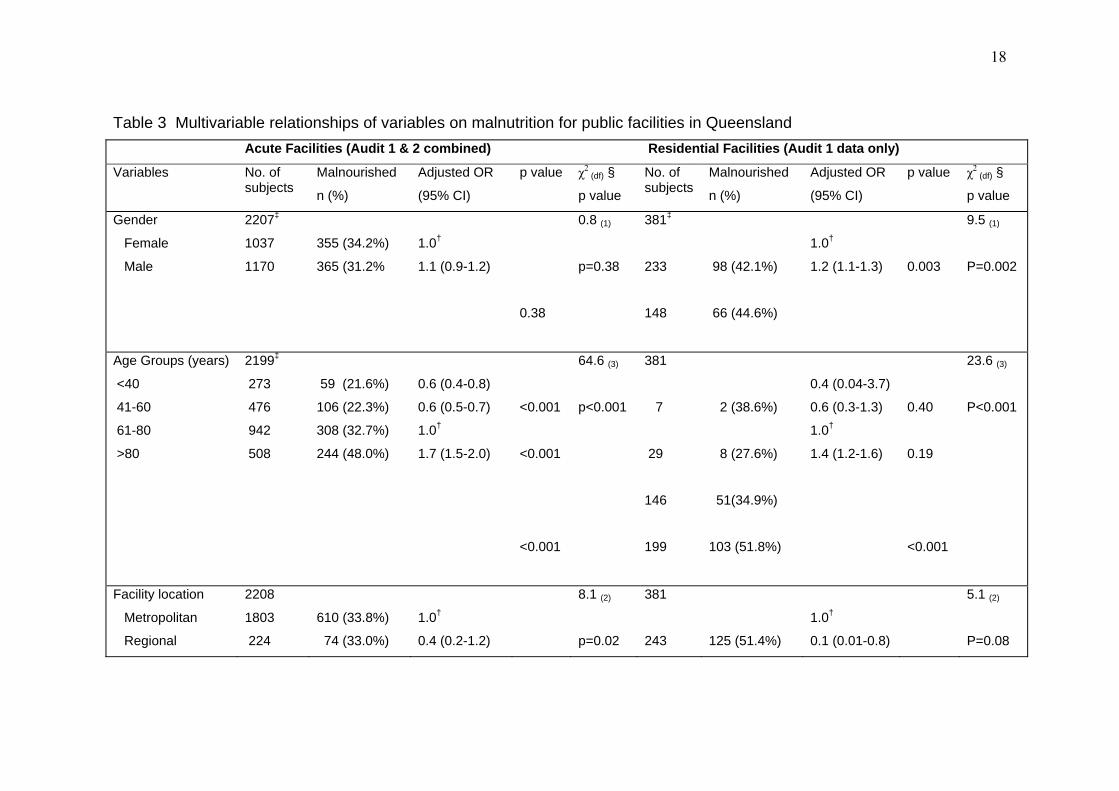
18
Table 3 Multivariable relationships of variables on malnutrition for public facilities in Queensland Acute Facilities (Audit 1 & 2 combined) Residential Facilities (Audit 1 data only)
Variables No. of subjects
Malnourished
n (%)
Adjusted OR
(95% CI)
p value χ2(df) §
p value
No. of subjects
Malnourished
n (%)
Adjusted OR
(95% CI)
p value χ2(df) §
p value
Gender
Female
Male
2207‡
1037
1170
355 (34.2%)
365 (31.2%
1.0†
1.1 (0.9-1.2)
0.38
0.8 (1)
p=0.38
381‡
233
148
98 (42.1%)
66 (44.6%)
1.0†
1.2 (1.1-1.3)
0.003
9.5 (1)
P=0.002
Age Groups (years)
<40
41-60
61-80
>80
2199‡
273
476
942
508
59 (21.6%)
106 (22.3%)
308 (32.7%)
244 (48.0%)
0.6 (0.4-0.8)
0.6 (0.5-0.7)
1.0†
1.7 (1.5-2.0)
<0.001
<0.001
<0.001
64.6 (3)
p<0.001
381
7
29
146
199
2 (38.6%)
8 (27.6%)
51(34.9%)
103 (51.8%)
0.4 (0.04-3.7)
0.6 (0.3-1.3)
1.0†
1.4 (1.2-1.6)
0.40
0.19
<0.001
23.6 (3)
P<0.001
Facility location
Metropolitan
Regional
2208
1803
224
610 (33.8%)
74 (33.0%)
1.0†
0.4 (0.2-1.2)
8.1 (2)
p=0.02
381
243
125 (51.4%)
1.0†
0.1 (0.01-0.8)
5.1 (2)
P=0.08
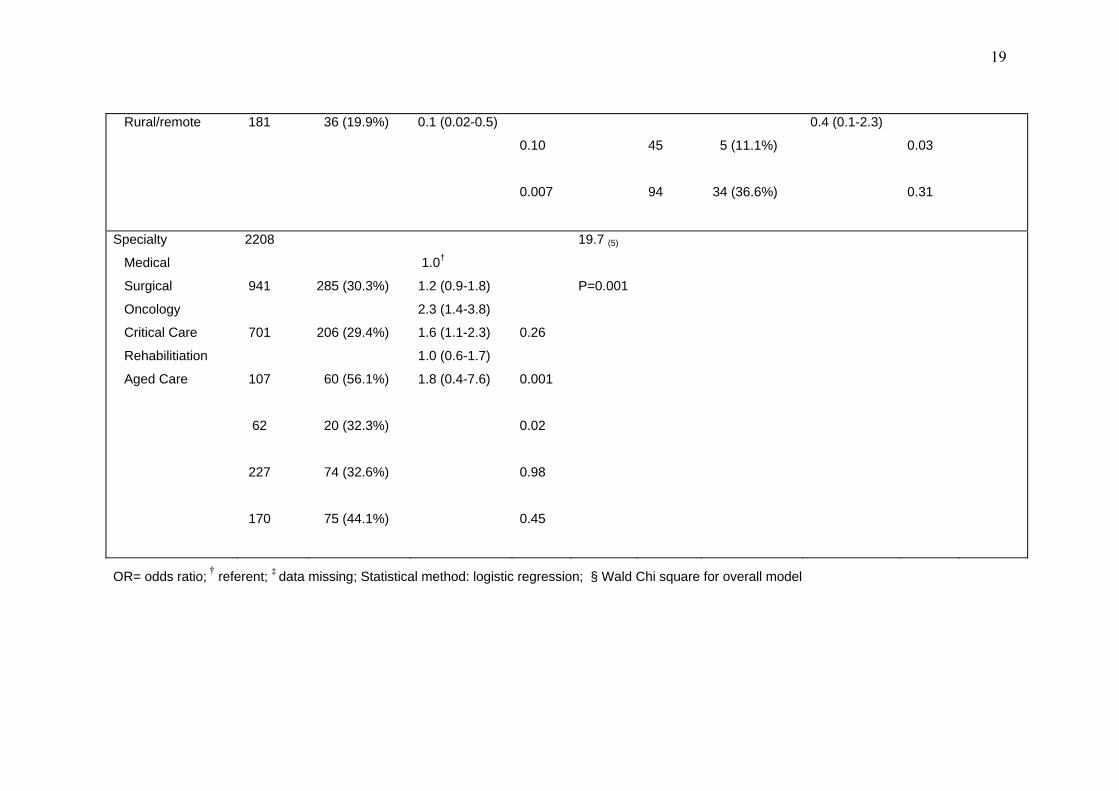
19
Rural/remote 181 36 (19.9%) 0.1 (0.02-0.5)
0.10
0.007
45
94
5 (11.1%)
34 (36.6%)
0.4 (0.1-2.3)
0.03
0.31
Specialty
Medical
Surgical
Oncology
Critical Care
Rehabilitiation
Aged Care
2208
941
701
107
62
227
170
285 (30.3%)
206 (29.4%)
60 (56.1%)
20 (32.3%)
74 (32.6%)
75 (44.1%)
1.0†
1.2 (0.9-1.8)
2.3 (1.4-3.8)
1.6 (1.1-2.3)
1.0 (0.6-1.7)
1.8 (0.4-7.6)
0.26
0.001
0.02
0.98
0.45
19.7 (5)
P=0.001
OR= odds ratio; † referent; ‡ data missing; Statistical method: logistic regression; § Wald Chi square for overall model
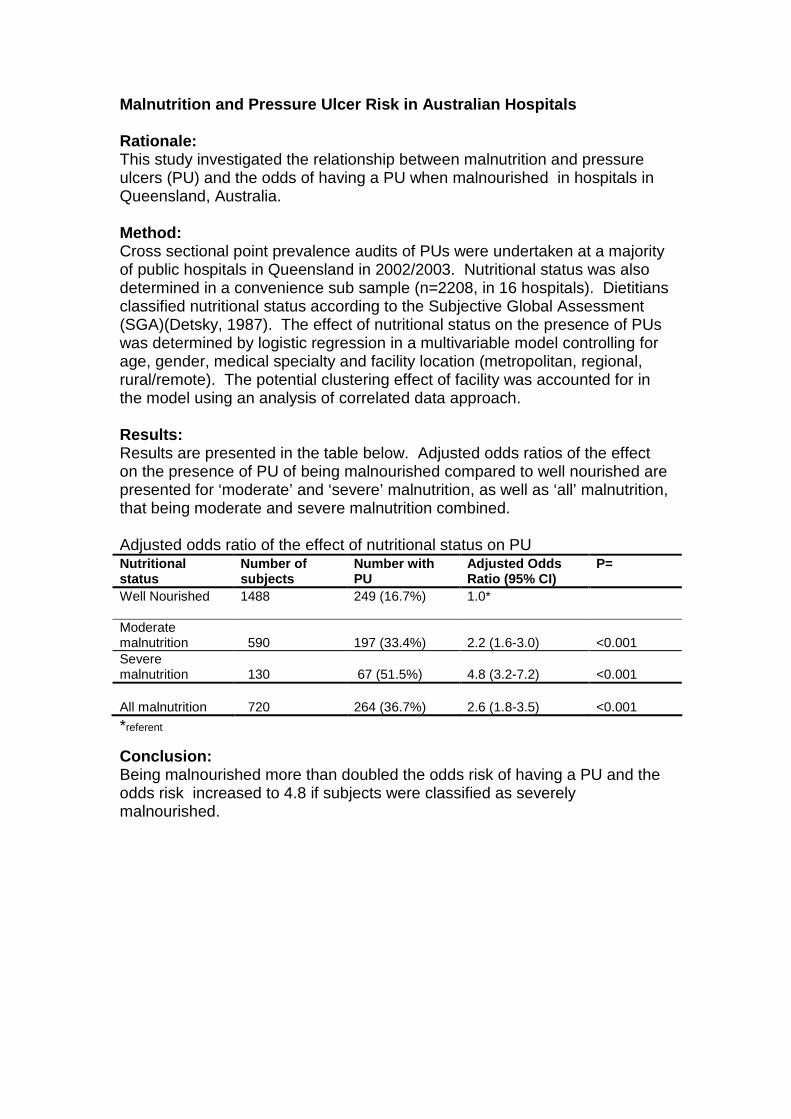
Malnutrition and Pressure Ulcer Risk in Australian Hospitals Rationale: This study investigated the relationship between malnutrition and pressure ulcers (PU) and the odds of having a PU when malnourished in hospitals in Queensland, Australia. Method: Cross sectional point prevalence audits of PUs were undertaken at a majority of public hospitals in Queensland in 2002/2003. Nutritional status was also determined in a convenience sub sample (n=2208, in 16 hospitals). Dietitians classified nutritional status according to the Subjective Global Assessment (SGA)(Detsky, 1987). The effect of nutritional status on the presence of PUs was determined by logistic regression in a multivariable model controlling for age, gender, medical specialty and facility location (metropolitan, regional, rural/remote). The potential clustering effect of facility was accounted for in the model using an analysis of correlated data approach. Results: Results are presented in the table below. Adjusted odds ratios of the effect on the presence of PU of being malnourished compared to well nourished are presented for ‘moderate’ and ‘severe’ malnutrition, as well as ‘all’ malnutrition, that being moderate and severe malnutrition combined. Adjusted odds ratio of the effect of nutritional status on PU Nutritional status
Number of subjects
Number with PU
Adjusted Odds Ratio (95% CI)
P=
Well Nourished 1488
249 (16.7%) 1.0*
Moderate malnutrition
590
197 (33.4%)
2.2 (1.6-3.0)
<0.001
Severe malnutrition
130
67 (51.5%)
4.8 (3.2-7.2)
<0.001
All malnutrition
720
264 (36.7%)
2.6 (1.8-3.5)
<0.001
*referent
Conclusion: Being malnourished more than doubled the odds risk of having a PU and the odds risk increased to 4.8 if subjects were classified as severely malnourished.
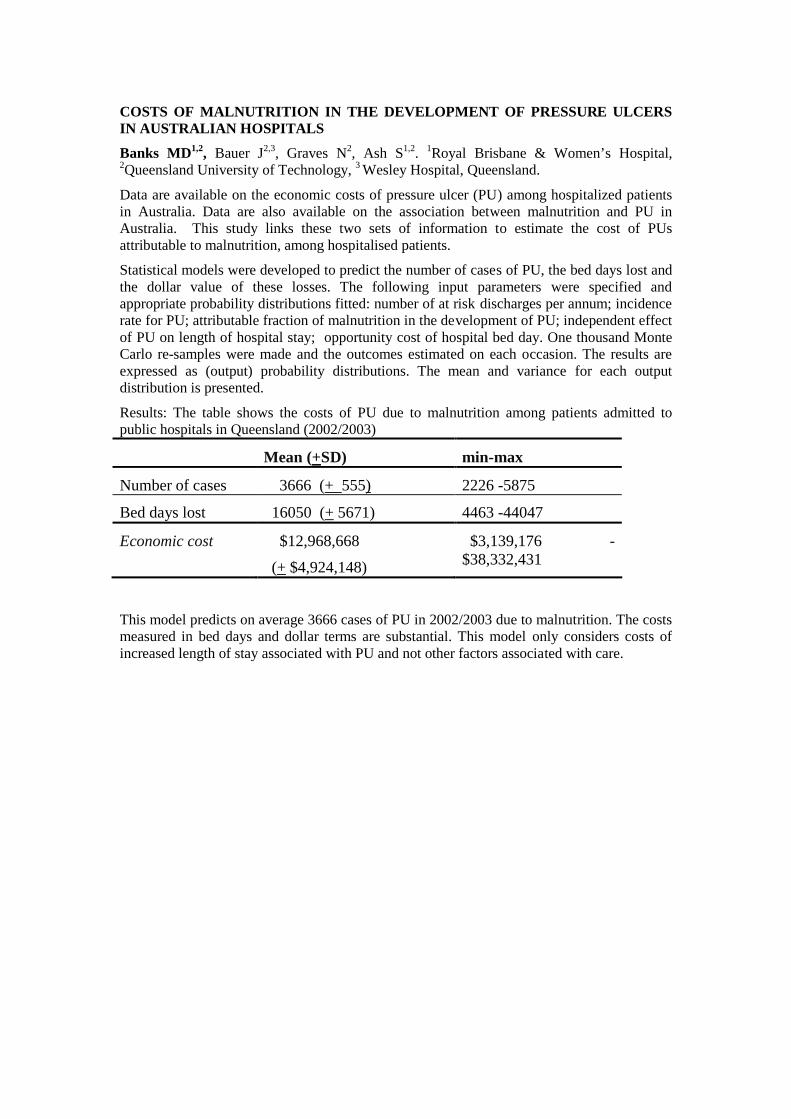
COSTS OF MALNUTRITION IN THE DEVELOPMENT OF PRESSURE ULCERS IN AUSTRALIAN HOSPITALS
Banks MD1,2, Bauer J2,3, Graves N2, Ash S1,2. 1Royal Brisbane & Women’s Hospital, 2Queensland University of Technology, 3 Wesley Hospital, Queensland.
Data are available on the economic costs of pressure ulcer (PU) among hospitalized patients in Australia. Data are also available on the association between malnutrition and PU in Australia. This study links these two sets of information to estimate the cost of PUs attributable to malnutrition, among hospitalised patients.
Statistical models were developed to predict the number of cases of PU, the bed days lost and the dollar value of these losses. The following input parameters were specified and appropriate probability distributions fitted: number of at risk discharges per annum; incidence rate for PU; attributable fraction of malnutrition in the development of PU; independent effect of PU on length of hospital stay; opportunity cost of hospital bed day. One thousand Monte Carlo re-samples were made and the outcomes estimated on each occasion. The results are expressed as (output) probability distributions. The mean and variance for each output distribution is presented.
Results: The table shows the costs of PU due to malnutrition among patients admitted to public hospitals in Queensland (2002/2003)
Mean (+SD) min-max
Number of cases 3666 (+ 555) 2226 -5875
Bed days lost 16050 (+ 5671) 4463 -44047
Economic cost $12,968,668
(+ $4,924,148)
$3,139,176 -$38,332,431
This model predicts on average 3666 cases of PU in 2002/2003 due to malnutrition. The costs measured in bed days and dollar terms are substantial. This model only considers costs of increased length of stay associated with PU and not other factors associated with care.
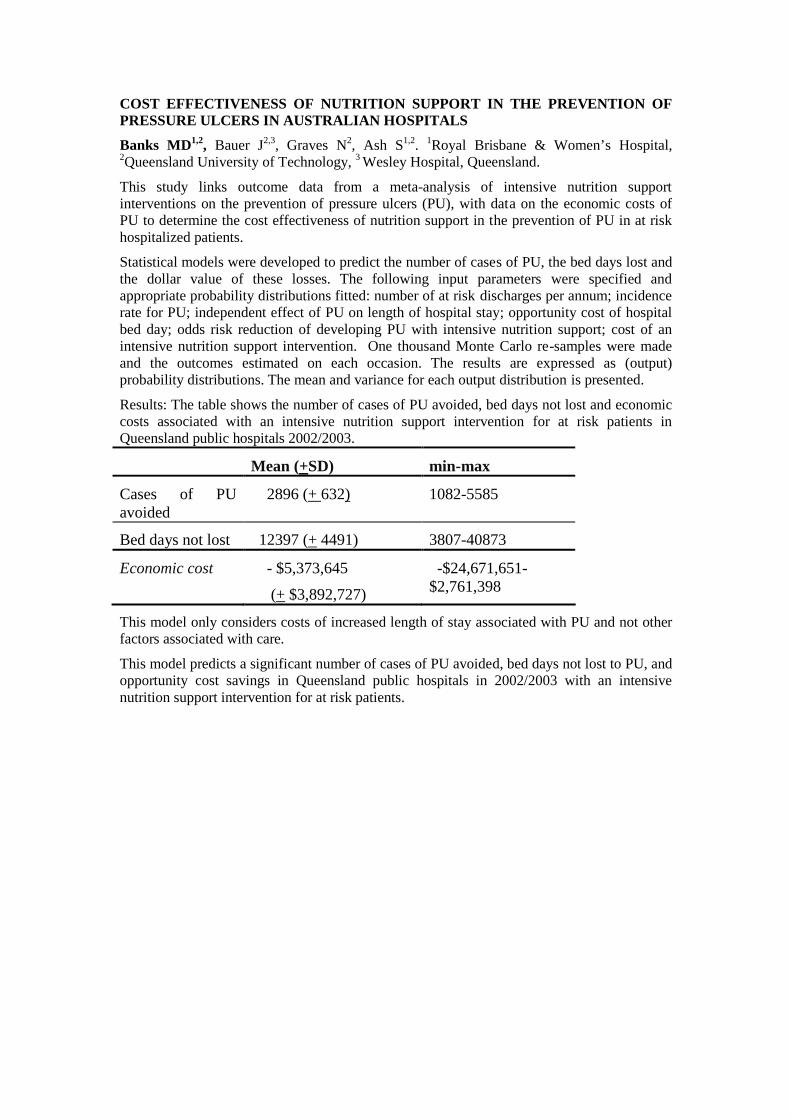
COST EFFECTIVENESS OF NUTRITION SUPPORT IN THE PREVENTION OF PRESSURE ULCERS IN AUSTRALIAN HOSPITALS
Banks MD1,2, Bauer J2,3, Graves N2, Ash S1,2. 1Royal Brisbane & Women’s Hospital, 2Queensland University of Technology, 3 Wesley Hospital, Queensland.
This study links outcome data from a meta-analysis of intensive nutrition support interventions on the prevention of pressure ulcers (PU), with data on the economic costs of PU to determine the cost effectiveness of nutrition support in the prevention of PU in at risk hospitalized patients.
Statistical models were developed to predict the number of cases of PU, the bed days lost and the dollar value of these losses. The following input parameters were specified and appropriate probability distributions fitted: number of at risk discharges per annum; incidence rate for PU; independent effect of PU on length of hospital stay; opportunity cost of hospital bed day; odds risk reduction of developing PU with intensive nutrition support; cost of an intensive nutrition support intervention. One thousand Monte Carlo re-samples were made and the outcomes estimated on each occasion. The results are expressed as (output) probability distributions. The mean and variance for each output distribution is presented.
Results: The table shows the number of cases of PU avoided, bed days not lost and economic costs associated with an intensive nutrition support intervention for at risk patients in Queensland public hospitals 2002/2003.
Mean (+SD) min-max
Cases of PU avoided
2896 (+ 632) 1082-5585
Bed days not lost 12397 (+ 4491) 3807-40873
Economic cost - $5,373,645
(+ $3,892,727)
-$24,671,651-$2,761,398
This model only considers costs of increased length of stay associated with PU and not other factors associated with care.
This model predicts a significant number of cases of PU avoided, bed days not lost to PU, and opportunity cost savings in Queensland public hospitals in 2002/2003 with an intensive nutrition support intervention for at risk patients.