Embed Size (px)
Citation preview

Vital SignsVital Signs
20212021Economic & Social Economic & Social
Indicators for Indicators for New HampshireNew Hampshire
2015-20192015-2019
State of New Hampshire Christopher T. Sununu, Governor
New Hampshire Employment Security
George N. Copadis, Commissioner
Economic and Labor Market Information Bureau
Brian J. Gottlob, Director
JUNE JUNE 20212021
State of New Hampshire Christopher T. Sununu, Governor
New Hampshire Employment Security
George N. Copadis, Commissioner
Economic and Labor Market Information Bureau
Brian J. Gottlob, Director
JUNE JUNE 20212021

New Hampshire Employment SecurityEconomic & Labor Market Information Bureau | i
Economic & Social Indicators for New Hampshire, 2015-2019 | VITAL SIGNS 2020
TABLE OF CONTENTS
Introduction iii
Key Economic Indicators v
1. Population 1
2. Income & Wages 8
3. Labor Force & Unemployment 13
4. Employment by Industry 19
5. Occupational Trends 24
6. Private Enterprise 32
7. Transportation & Traffic 37
8. Energy 42
9. Production 47
10. Trade and Tourism 53
11. Construction & Housing 59
12. Education 66
13. Health 77
14. Crime & Crashes 84
15. Environment 89
Glossary and Index 95
TABLE OF CONTENTS
New Hampshire Employment SecurityEconomic & Labor Market Information Bureau | iii
Economic & Social Indicators for New Hampshire, 2015-2019 | VITAL SIGNS 2020
This annual review of the economic and social conditions of New Hampshire highlights fifteen different indicators that describe the state’s economic, social, environmental, and cultural character. Each chapter of Vital Signs compiles five years of available data, analyzing emerging trends at the local, regional, and national levels where appropriate. Whenever possible, 2019 updates have been included in the summary analysis.
Attention should be paid to notations within the tables that describe data details such as sample size, time intervals, or rank order. Additionally, readers should note that throughout the text, proper titles of specific data elements (i.e. industry sectors such as retail trade and publication titles) are italicized to distinguish them from recurring ordinary usage. Readers are also encouraged to review the glossary and index on page 95 to become familiar with the different terminology used throughout the report.
The information presented in Vital Signs has been drawn from print and internet-based media reports, trade publications, academic journals, and the records of a wide variety of state and federal agencies and private organizations. Sources used in the text are identified with footnotes, and sources used in the tables are noted below each table. While all sources are believed to be reliable, no guarantee is made as to the correctness, sufficiency, or completeness of their information.
Some of the data tables are available by substate areas of New Hampshire. If you seek additional information, please contact the Economic and Labor Market Information Bureau at [email protected] or (603) 228-4124.
We are indebted to the numerous individuals who contributed special information or provided advice on evaluating reported data. The observations expressed in this report do not necessarily reflect those of New Hampshire Employment Security, and no official endorsement should be inferred.
INTRODUCTION
INTRODUCTION
Note on Coronavirus:The articles in this publication are primarily focused on the years 2015-2019. Although the coronavirus pandemic falls outside of this time frame, it has been difficult to ignore when discussing social and economic trends in New Hampshire. As a result, many chapters in this publication also address impacts of the coronavirus, and overall trends in 2020. Much of the data from 2020 is preliminary, and subject to revision once more complete data is available. Wherever possible, data in this publication has been updated to reflect the latest available numbers, including the 2020 benchmarking of Current Employment Statistics data. However, significant revisions to 2020 data are possible in the future.
The 2022 edition of Vital Signs will provide more data about economic trends throughout 2020 and the economic effects of the coronavirus pandemic.

New Hampshire Employment SecurityEconomic & Labor Market Information Bureau | v
Economic & Social Indicators for New Hampshire, 2015-2019 | VITAL SIGNS 2020
CHANGE IN KEY ECONOMIC INDICATORS
2017-2018 2018-2019
CH
AP
TER
NET
CH
AN
GE
PER
CEN
T C
HA
NG
E
NET
CH
AN
GE
PER
CEN
T C
HA
NG
E
Population 4,700 0 3% 6,200 0 5% 1Income, per capita personal (not adjusted for inflation) $2,990 5 1% $2,451 4 0% 2
Wages, average weekly (private) $32 3 0% $39 3 5% 2Labor force 9,550 1 3% 8,880 1 2% 3Employment 10,510 1 4% 8,970 1 2% 3Unemployment -960 -4 5% -100 -0 5% 3Nonfarm jobs - total all industries 5,000 0 7% 6,500 1 0% 4Non-current loans and leases ($ millions) $4 9 65 4% -$4 0 -32 0% 6
Retail sales of electricity (million KWH) 259 2 4% -355 -3 2% 8
Gross domestic product by state (current dollars-millions) $3,564 4 4% $4,131 4 9% 9
Gross domestic product by state (chained 2012 dollars-millions) $1,714 2 3% $2,040 2 7% 9
Export sales to the world ($ millions) $158 3 1% $523 9 8% 9
Accomodations Rentals (Includes Motor Vehicle Rentals) ($ millions) $59 9 3% $17 2 4% 10
School enrollment, public and private (includes preschool)
-1,220 -0 6% -1,527 -0 8% 12
Violent crime index (Rate per 100,000 population) -18 1 -9 2% -25 1 -14 1% 14
Property crime index (Rate per 100,000 population) -103 4 -7 5% -61 7 -4 9% 14
Traffic crashes -2,507 -6 8% -582 -1 7% 14
KEY ECONOMIC INDICATORS
KEY ECONOMIC INDICATORS

New Hampshire Employment SecurityEconomic & Labor Market Information Bureau POPULATION | 1
Economic & Social Indicators for New Hampshire, 2015-2019 | VITAL SIGNS 20201
POPULATIONThe Impact of COVID-19 on the Workforce by Gender in New HampshireThe COVID-19 pandemic led to a sharp decline in female employment. Workers who lose employment during a recession often continue to have lower earnings long after the recession is over. This impact of a recession is particularly noticeable on women because of the gender wage gap and gender-based job prospects in the labor market.
New Hampshire is among 40 states that have a larger female population than male. The male to female ratio is 98:100. Table-1 shows the state’s total and gender-based population count.
The male-female employment distribution in the workforce presents the opposite scenario. Employment data from the Current Population Survey (CPS) shows that over the previous six years, employment has been higher for males than females. Figure 1 illustrates the inequality between male and female employment numbers during the last six years. This inequality has increased during the pandemic, which highlights the issue of lower labor force participation by women. This study focuses on a sector-based comparison of female and male employment, comparing aggregate data from 2015-2019 to year-to-date data from 2020, to illustrate the impact of coronavirus on the female workforce.
Employment Status Even though males make up a larger share of the total labor force, the unemployment rate for women was lower over the last five years (2015-2019). The average unemployment rate over the last five years for males age 20 and older was
3.76 percent and for females age 20 and older, the average rate was 2.84 percent. During the pandemic, the unemployment rate for females has been higher than the unemployment rate for
- 50,000
100,000 150,000 200,000 250,000 300,000 350,000 400,000 450,000
2015 2016 2017 2018 2019 2020
Figure-1 Employment by Gender
Male Female
FIG 1. EMPLOYMENT STATUS, MALE vs FEMALE
Source: U.S. Census Bureau, 2015 – 2019 American Community Survey 5-Year Estimate
1 U.S. Census Bureau, 2015 – 2019 American Community Survey 5-Year Estimate.
Table-2: Employed Persons by Sex, 2020 Month Total Male Female DifferenceJanuary 757,014 393,050 363,964 29,086
February 745,453 390,404 355,049 35,355
March 723,770 382,840 340,930 41,910
April 606,177 328,567 277,610 50,957
May 654,895 359,502 295,393 64,109
June 685,464 372,532 312,932 59,600
July 716,686 379,144 337,542 41,602
August 722,763 360,890 361,873 -983
September 715,822 375,270 340,552 34,718
October 725,672 376,425 349,247 27,178
-
100,000
200,000
300,000
400,000
500,000
600,000
700,000
800,000
Jan Feb Mar Apr May Jun Jul Aug Sep Oct
Figure 2. Employed Persons by Gender, Jan-Oct 2020
Total Employed Male Female
FIG 2. EMPLOYMENT PERSONS BY SEX, JAN - OCT 2020
Source: U.S. Census Bureau, unpublished Current Population Survey data, 2015 - 2020
Table-1: 2019-2020 Population by Gender1 Total population in New Hampshire 1,359,711Male Population 672,960
Female Population 686,751
New Hampshire Employment SecurityEconomic & Labor Market Information Bureau2 | POPULATION
VITAL SIGNS 2020 | Economic & Social Indicators for New Hampshire, 2015-20191
2 U.S. Census Bureau, unpublished Current Population Survey data, 2015 - 2020.
males each month. This is a clear indicator that more women lost jobs during the pandemic than men. The average unemployment rate between January and October for males was 6.6 percent and for females it was 7.4 percent, which was 0.8 percentage points higher.2
Table 2 and Figure 2 show how employment for women decreased more than employment for men during 2020.
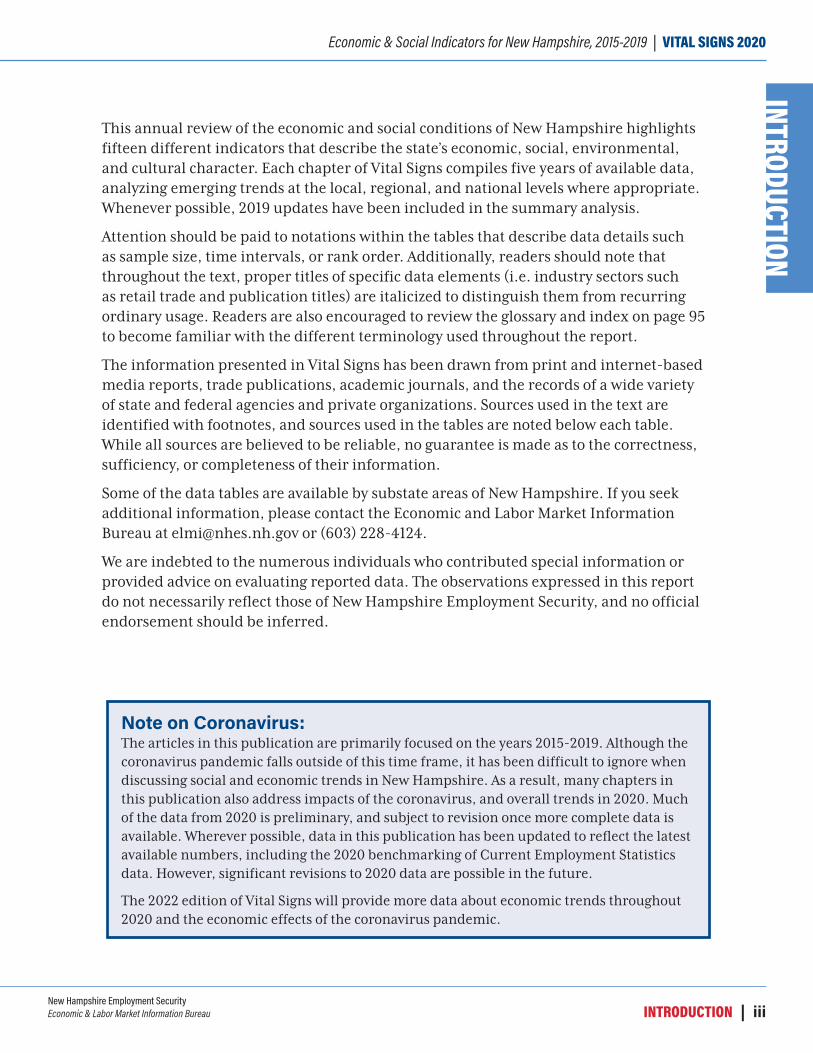
Labor Force Distribution of the Male and Female Workforce by Occupational GroupThe side-by-side charts show the average labor force distribution of males and females in the workforce over the last five years (2015-2019), compared with the year 2020 (Jan-Oct). The workforce numbers show how COVID-19 significantly affected all major occupational groups.
29,925 5,671
33,086 14,846
23,374 610 559
59,485 509
1,459 35,902
21,512 38,820
40,263 67,375
49,330
75,096 103,154
75,141 58,111
M A L E F E M A L E
2015-2019 AVERAGE EMPLOYMENT BY OCCUPATIONAL GROUP
Transporta�on and material moving occupa�ons
Produc�on occupa�ons
Installa�on, maintenance, and repair occupa�ons
Construc�on and extrac�on occupa�ons
Farming, fishing, and forestry occupa�ons
Office and administra�ve support occupa�ons
Sales and related occupa�ons
Service occupa�ons
Professional and related occupa�ons
Management, business, and financial occupa�ons
2020 (JAN-OCT) AVERAGE EMPLOYMENT BY OCCUPATIONAL GROUP
Transporta�on and material moving occupa�ons
Produc�on occupa�ons
Installa�on, maintenance, and repair occupa�ons
Construc�on and extrac�on occupa�ons
Farming, fishing, and forestry occupa�ons
Office and administra�ve support occupa�ons
Sales and related occupa�ons
Service occupa�ons
Professional and related occupa�ons
Management, business, and financial occupa�ons
35,833 6,806
30,749 14,096 599
19,253 547 449 2,571 33,053 60,021
15,408 34,462 33,212
46,692 58,390
80,551 93,796
74,538 64,340
M A L E F E M A L E
2015-2019 AVERAGE EMPLOYMENT BY OCCUPATIONAL GROUP
2020 (JAN-OCT) AVERAGE EMPLOYMENT BY OCCUPATIONAL GROUP
Source: U.S. Census Bureau, U.S. Census Bureau, unpublished Current Population Survey data, 2015 - 2020
New Hampshire Employment SecurityEconomic & Labor Market Information Bureau POPULATION | 3
Economic & Social Indicators for New Hampshire, 2015-2019 | VITAL SIGNS 20201
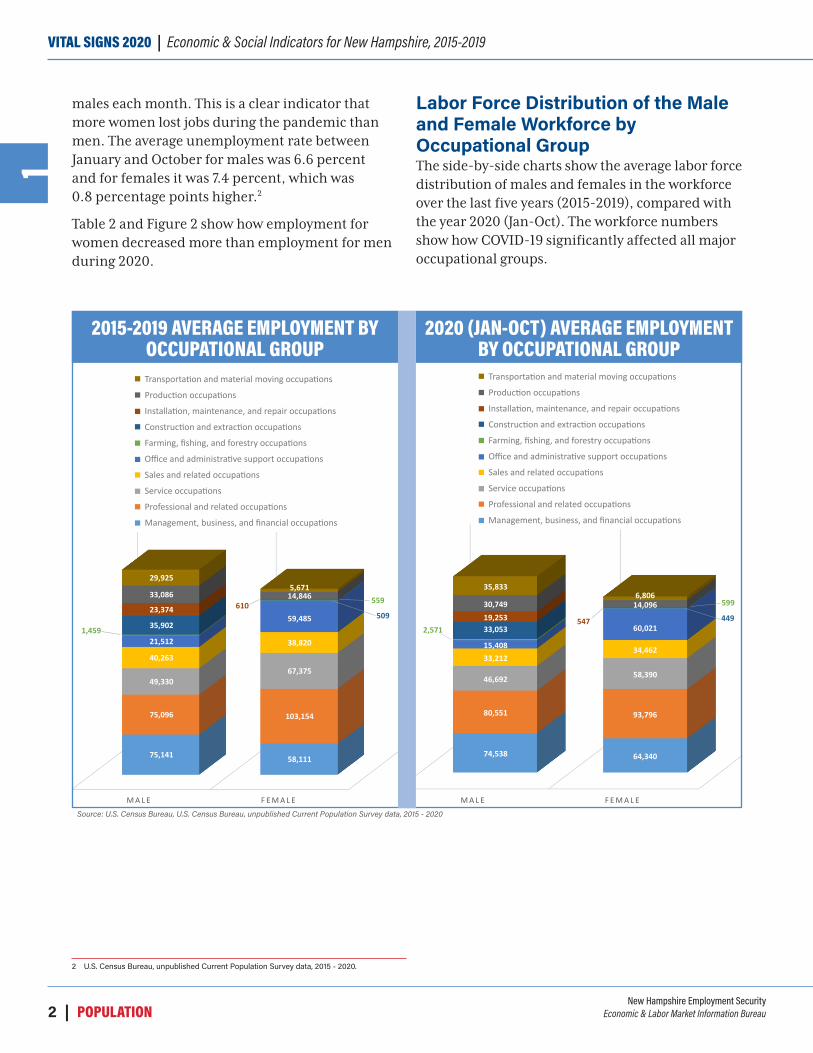
Table 3 compares 2019 employment to 2020 (Jan-Oct) employment by each major occupational group and reveals the over-the-year impact of the economic shutdown.
COVID-19 Effect on Each Major Occupational Group:
Management, business, and financial occupations: the male workforce decreased by ten percent and the female workforce increased by four percent.
Professional and related occupations: the male workforce increased one percent and the female workforce decreased by 12 percent.
Service occupations: the number of working males and females both decreased, by 13 percent and 11 percent, respectively.
Sales and related occupations: both the male and female workforce declined, by 12 percent and 11 percent, respectively.
Office and administrative support occupations: this group saw a 38 percent decline in the male workforce and a decrease of two percent in the female workforce.
Farming, fishing, and forestry occupations: this group had an increase in both the female and male workforce. However, this sector has a seasonal workforce, and employment data from November and December 2020 is not yet available; when including the full
year of employment, there would likely be a different result.
Construction and extraction occupations: this occupational group is traditionally male dominated. During the coronavirus pandemic, this occupational group showed a decline in both the male and female workforce, by 14 percent and 21 percent respectively.
Installation, maintenance, and repair occupations: this occupational group is also traditionally male dominated. There was an 11 percent decline in the male workforce and a 32 percent decline in the female workforce.
Production occupations: in this occupational group, there was a decline of 11 percent in the male workforce and a five percent increase in the female workforce.
Transportation and material moving occupations: this group was one of the few benefitting from the economic shutdown, with an increase of both the male and female workforce, by 22 percent and 7 percent, respectively.
Table 3: Comparison of Employment by Occupational Group, 2019 and 2020 2019 2020 2019 2020
Major Occupational Group Male Male Female Female
Total, Management, business, and financial occupations 83,186 74,538 61,744 64,340
Total, Professional and related occupations 79,399 80,551 106,327 93,796
Total, Service occupations 53,863 46,692 65,873 58,390
Total, Sales and related occupations 37,680 33,212 38,929 34,462
Total, Office and administrative support occupations 24,760 15,408 61,003 60,021
Total, Farming, fishing, and forestry occupations 936 2,571 321 599
Total, Construction and extraction occupations 38,314 33,053 566 449
Total, Installation, maintenance, and repair occupations 21,536 19,253 807 547
Total, Production occupations 34,744 30,749 13,426 14,096
Total, Transportation and material moving occupations 29,329 35,833 6,369 6,806Source: U.S. Census Bureau, U.S. Census Bureau, unpublished Current Population Survey data, 2015 - 2020

New Hampshire Employment SecurityEconomic & Labor Market Information Bureau4 | POPULATION
VITAL SIGNS 2020 | Economic & Social Indicators for New Hampshire, 2015-20191
The Effect of the Coronavirus Pandemic on Occupational Groups with a Larger Female WorkforceIn major occupational groups where the female workforce was larger than the male workforce, the pandemic caused a sharper decline for female employment when compared to males in the early phase of economic shutdown.
In service occupations, which includes the food service industry, hospitality, and tourism, females traditionally have held a higher share of employment than males (Figure 3). Figure 4 shows how sharply female employment declined in April, when the economic restrictions to slow the effect of the pandemic began.
Professional and related occupations include management, business and financial, healthcare
practitioners and technical occupations, and education and training occupations. These groups traditionally have more female workers than male (Figure 5). Figure 6 illustrates how the workforce in this group declined during the pandemic.
Sales and related occupations include occupations such as retail sales workers and cashiers, and had more female than male workers before the pandemic (Figure 7). Figure 8 shows that, similar to the service-related employment, female workers in these occupations struggled to stay on the job during the pandemic.
Office and administrative support was another occupational group where women were employed at higher levels than the men prior to the COVID-19 pandemic (Figure 19). Figure 10 shows that this group follows a similar trend of sharply declining female employment observed in previous occupational groups.
- 20,000 40,000 60,000 80,000
100,000 120,000 140,000
Jan Feb Mar Apr May Jun Jul Aug Sep Oct
Figure 4. Service Occupation Employment, Jan-Oct, 2020
Total Male Female
FIG 4. SERVICE OCCUPATIONS JAN-OCT, 2020
Source: U.S. Census Bureau, unpublished Current Population Survey data, 2015 - 2020
- 10,000 20,000 30,000 40,000 50,000 60,000 70,000 80,000
2015 2016 2018 2019 2020
Figure 3. Service Occupation Employment, 2015-2020
Male Female
2017
FIG 3. SERVICE OCCUPATIONS (2015-2020)
Source: U.S. Census Bureau, unpublished Current Population Survey data, 2015 - 2020 -
50,000
100,000
150,000
200,000
250,000
Jan Feb Mar Apr May Jun Jul Aug Sep Oct
Figure 6: Professional and Related Occupation Employment, Jan-Oct, 2020
Total Male Female
FIG 6. PROFESSIONAL AND RELATED OCCUPATIONS, JAN-OCT 2020
Source: U.S. Census Bureau, unpublished Current Population Survey data, 2015 - 2020
-
20,000
40,000
60,000
80,000
100,000
120,000
2015 2016 2017 2018 2019 2020
Figure 5: Professional and Related Occupation Employment, 2015-2020
Male Female
FIG 5. PROFESSIONAL AND RELATED OCCUPATIONS (2015-2020)
Source: U.S. Census Bureau, unpublished Current Population Survey data, 2015 - 2020

New Hampshire Employment SecurityEconomic & Labor Market Information Bureau POPULATION | 5
Economic & Social Indicators for New Hampshire, 2015-2019 | VITAL SIGNS 20201
3 Alon et al., “This Time It’s Different: The Role of Women’s Employment in a Pandemic Recession,” National Bureau of Economic Research. https://www.nber.org/papers/w27660. 4 Alon, et al., “Impact of the Covid-19 Crisis on Women’s Employment,”Econofact. https://econofact.org/impact-of-the-covid-19-crisis-on-womens-employment.5 Sarah Mattson Dustin, J.D., “The Status of Women in New Hampshire”, New Hampshire Women’s Foundation. https://nhwomensfoundation.org/wp-content/uploads/2018/10/Final-
SoW-2018-PDF-for-Website.pdf.6 U.S. Bureau of Labor Statistics, “Supplemental data measuring the effects of the coronavirus (COVID-19) pandemic on the labor market.” https://www.bls.gov/cps/effects-of-the-
coronavirus-covid-19-pandemic.htm.
1. Childcare: The closure of schools and day care facilities has had the greatest impact on childcare needs, which typically has a larger impact on women’s ability to work. The increase in childcare responsibilities affected the female workforce more than the male workforce, as there are more single or stay-at-home mothers than single or stay-at-home fathers.3 More specifically, school and day care closings resulted in an increase in the amount of time spent on childcare for parents with young children.4
2. Unequal pay: Based on a study by the New Hampshire Women’s Foundation, published in 2018, women who work full time
earn 79¢ for every $1 that men earn. The wage gap can be bigger or smaller based on marital status, race, and ethnicity. Unequal pay is another reason which made women more likely to leave the labor force during the pandemic.5
3. Type of employment: The U.S. Bureau of Labor Statistics reported that workers who were usually employed part-time were more likely to be laid off or furloughed during the pandemic than full-time workers.6 More than 60 percent of part-time jobs in New Hampshire were filled by female workers, meaning women would be disproportionately impacted by declines in part-time employment. In addition, some industries that tend to employ more women,
-
20,000
40,000
60,000
80,000
100,000
Jan Feb Mar Apr May Jun Jul Aug Sep Oct
Figure 8: Sales and Related Occupation Employment, Jan-Oct, 2020
Total Male Female
FIG 8. SALES AND RELATED OCCUPATIONS, JAN-OCT, 2020
Source: U.S. Census Bureau, unpublished Current Population Survey data, 2015 - 2020
Figure 7. Sales and Related Occupa�on Employment, 2015-2020
50,000
40,000
30,000
20,000
10,000
-2015 2016 2017
Male
2018 2019 2020
Female
FIG 7. SALES AND RELATED OCCUPATIONS (2015-2020)
Source: U.S. Census Bureau, unpublished Current Population Survey data, 2015 - 2020
-
20,000
40,000
60,000
80,000
100,000
Jan Feb Mar Apr May Jun Jul Aug Sep Oct
Figure 10: Office and Administrative Support Occupation Employment, Jan-Oct, 2020
Total Male Female
FIG 10. OFFICE AND ADMIN SUPPORT OCCUPATIONS, JAN-OCT, 2020
Source: U.S. Census Bureau, unpublished Current Population Survey data, 2015 - 2020
Figure 9. Office and Administra�ve Support Occupa�on Employment, 2015 - 2020
70,000
60,000
50,000
40,000
30,000
20,000
10,000
-2015 2016 2017
Male
2018 2019 2020
Female
FIG 9. OFFICE AND ADMIN SUPPORT OCCUPATIONS (2015-2020)
Source: U.S. Census Bureau, unpublished Current Population Survey data, 2015 - 2020
Reasons for women to leave the labor force during the COVID-19 pandemic:

New Hampshire Employment SecurityEconomic & Labor Market Information Bureau6 | POPULATION
VITAL SIGNS 2020 | Economic & Social Indicators for New Hampshire, 2015-20191
such as accommodation and food services, which had a 57 percent female workforce in 2019, were severely affected by the pandemic. Social distancing and other measures to slow the spread of the coronavirus have forced businesses in these sectors to shut down or reduce capacity, which had a greater impact on female employment.7
4. Utilization of Unemployment Insurance benefits: Unemployment insurance benefit changes enacted early in the pandemic allowed self-employed and gig workers to have access to benefits, and allowed people who were not actively looking for work due to pandemic-related reasons to remain eligible for benefits as well. This allowed women who left the workforce during the pandemic to take care of their children to receive unemployment benefits, even if they were not actively looking for work.
The reasons listed above beget the question: what measures can business leaders, stakeholders, employers, and policymakers consider to minimize a similar crisis in the future during another recession or pandemic?
Women with younger children are more likely to look for jobs with flexible work hours. Limited availability of affordable childcare can lead more women to work multiple jobs, or longer hours. During the pandemic, the lack
7 New Hampshire Employment Security, New Hampshire 2018 Workforce Analysis - In Review. https://www.nhes.nh.gov/elmi/products/documents/workforce-analysis-2018.pdf8 Madgavkar et al. “Covid-19 and gender inequality: Countering the regressive effect.” https://www.mckinsey.com/featured-insights/future-of-work/covid-19-and-gender-equality-countering-
the-regressive-effects.9 Ibid.
of childcare during led more women to quit their jobs. Policies that are family-friendly, or flexible programs to support female workers who experience an increased childcare burden during a pandemic, would increase female labor force participation.8 Employers could offer daycare support either in the workplace or other benefits for employees with children, such as subsidized childcare expenses, flexible hours, or paid family leave. This could ensure working mothers are able to work without worrying about childcare considerations.
During the coronavirus pandemic, working virtually with the help of digital technologies grew exponentially. Many jobs transitioned to allow workers to work from home. Many businesses have migrated to online platforms. Training in digital technologies for female workers could lead to a larger percentage of the female workforce being able to work remotely. Training and access to digital devices and software could create more opportunities for jobs for women in the future as well. Employers play key roles in creating infrastructure and support for such digital technologies.9
A change in the societal mindset to more equal sharing of childcare responsibilities between mothers and fathers would lead to more women participating in the workforce.
– Nusrat Jahan
RESIDENT POPULATION 2015 2016 2017 2018 2019Population, July 1st 1,336,350 1,342,307 1,348,787 1,353,465 1,359,711Annual percent change 0.2% 0.4% 0.5% 0.3% 0.5%United States rank of annual percent change (including District of Columbia) 39 27 21 23 21
Population by GenderPopulation, Males 661,455 664,650 667,781 670,773 673,793Population, Females 674,895 677,657 681,006 682,692 685,918

New Hampshire Employment SecurityEconomic & Labor Market Information Bureau POPULATION | 7
Economic & Social Indicators for New Hampshire, 2015-2019 | VITAL SIGNS 20201
RESIDENT POPULATION (continued...) 2015 2016 2017 2018 2019Distribution by AgeUnder 5 years 4.8% 4.8% 4.8% 4.7% 4.7%5 to 17 years 15.0% 14.8% 14.5% 14.3% 14.1%18 to 24 years 9.7% 9.6% 9.5% 9.3% 9.1%25 to 44 years 23.5% 23.5% 23.7% 23.9% 24.2%45 to 64 years 30.6% 30.4% 30.1% 29.7% 29.2%65 years and over 16.4% 16.9% 17.5% 18.0% 18.7%
Median AgeUnited States 37.8 37.9 38.0 38.2 38.4New Hampshire 42.7 42.8 42.9 43.0 43.1Connecticut 40.8 40.9 40.9 41.0 41.1Maine 44.4 44.6 44.8 44.9 45.0Massachusetts 39.3 39.4 39.4 39.4 39.6Rhode Island 39.9 39.9 40.0 40.0 40.1Vermont 42.7 42.8 42.8 42.9 43.0
Components of Population Change (annual)Natural increase rate (per 1,000 population) 0.3 0.4 -0.1 -0.3 -0.1Net migration rate (per 1,000 population) 2.1 4.1 4.9 3.8 4.7
Source: Population Division, U.S. Census Bureau, ELMI Analysis. Last Update 7/22/2020
VITAL STATISTICS 2015 2016 2017 2018 2019Marriages 9,234 9,319 9,445 9,405 9,030Marriage rate (per 1,000 population) 6.9 6.9 7.0 6.9 6.6
Divorces 4,481 4,607 4,262 4,217 4,180Divorce rate (per 1,000 population) 3.4 3.4 3.2 3.1 3.1
Live births 12,495 12,350 12,064 11,977 11,826Birth rate (per 1,000 population) 9.4 9.2 8.9 8.8 8.7
Births to teenage mothers (less than 20 years old) 475 409 370 346 285
Percent of total live births 3.8% 3.3% 3.1% 2.9% 2.4%Non-marital births (percent of live births) 34.6% 34.5% 33.3% 33.5% 32.6%
Resident deaths 11,987 12,182 12,480 12,779 12,740Crude death rate (per 1,000 population) 9.0 9.1 9.3 9.4 9.4Infant death rate (per 1,000 live births) 4.2 3.6 4.2 3.6 3.2
Source: Division of New Hampshire Vital Records Administration, ELMI Analysis. Last Update 7/22/2020
Prepared by: New Hampshire Employment Security, Economic and Labor Market Information Bureau
www.nhes.nh.gov/elmi | (603) 228-4124

New Hampshire Employment SecurityEconomic & Labor Market Information Bureau8 | INCOME & WAGES
VITAL SIGNS 2020 | Economic & Social Indicators for New Hampshire, 2015-20192
Per Capita Personal IncomePer capita personal income rose in New Hampshire by 4.0 percent in 2019 over the previous year. This was the smallest increase since 2014, although, adjusted for inflation, it was still an increase of 2.4 percent. New Hampshire ranked 8th among all states in per capita personal income for the third year in a row.1
On a county level, per capita personal income was highest in Rockingham County, $76,902, and lowest in Coös County, $44,399. Commuting pattern data from the U.S. Census Bureau shows that in 2018, more than one quarter of employed Rockingham County residents commuted to Massachusetts for work, and were able to take advantage of the higher wages paid there.2 Per capita personal income in Massachusetts was $74,187 in 2019, second highest in the U.S. Roughly half of Rockingham County residents who worked in Massachusetts were employed in Middlesex and Suffolk counties, which had per capita income even higher than the Massachusetts average, at $87,192 and $83,490, respectively.
Income DistributionIncome is not distributed evenly for all residents. The Gini index measures income equality on a scale from 0 to 1, with a 0 indicating perfect equality, where there is equal distribution of income. A Gini index of 1 indicates perfect inequality, where one household has all the income.3
New Hampshire’s Gini coefficient was 0.4384 in 2019, the 4th lowest of any state in the U.S. It had a lower Gini coefficient, and less income inequality, than
1 Income includes earnings from employment, as well as other sources of income, including interest and dividends, social security, child support, and money from rental income.2 U.S. Bureau of Labor Statistics, Quarterly Census of Employment and Wages, 2018. https://www.bls.gov/cew/data.htm3 U.S. Census Bureau, Household Income: 2018. https://www.census.gov/content/dam/Census/library/publications/2019/acs/acsbr18-01.pdf.4 Retired workers still earn incomes, as income includes non-employment related income such as social security, and interest and dividends from investments.
INCOME & WAGES
GINI INDEX, 2010 – 2019
0.38
0.4
0.42
0.44
0.46
0.48
0.5
0.52
2019201820172016201520142013201220112010
Gini Index, 2010 - 2019
NH U.S. CT ME MA RI VT
Source: U.S. Census Bureau, American Community Survey 5-Year Estimates
any other state in New England. In both the U.S. and in New Hampshire, Gini coefficients have increased slightly since 2010. New Hampshire’s Gini coefficient was 0.4210 in 2010, while the U.S. Gini coefficient increased from 0.4670 in 2010 to 0.4823 in 2019.
In New Hampshire, the increase is at partially attributable to demographic shifts. Older and younger individuals tend to have lower incomes, as one group begins their careers, and the other retires and leaves the workforce.4 Recent demographic changes in New Hampshire have increased the size of these two groups. New Hampshire’s population is aging, and the share of the population that is retirement age is increasing. In addition, migration in recent years has led to a net increase in residents in their 20s and 30s.
Median EarningsAmong New Hampshire residents who were employed full-time, year-round in 2019 (this accounted for roughly 65 percent of all individuals

New Hampshire Employment SecurityEconomic & Labor Market Information Bureau INCOME & WAGES | 9
Economic & Social Indicators for New Hampshire, 2015-2019 | VITAL SIGNS 20202
- 20,000 40,000 60,000 80,000 100,000 120,000
$14,999 or less(including loss)
$15,000 to $24,999
$25,000 to $34,999
$35,000 to $49,999
$50,000 to $64,999
$65,000 to $74,999
$75,000 to $99,999
$100,000 or more
2019 Earnings for Full-Time, Year-Round Workers in New Hampshire
2019 EARNINGS FOR FULL-TIME, YEAR-ROUND WORKERS IN NEW HAMPSHIRE
Source: U.S. Census Bureau, American Community Survey, 2019 1-Year Estimate
5 The U.S. Department of Labor does not have a standard definition of “full-time” employment. Typically this determination is made by employers. 6 Average weekly wages is not an earnings measure, but is the quarterly total of compensation paid, including bonuses, stock options, severance pay, profit distributions, the cash value of
meals and lodging, tips and other gratuities, divided by average quarterly employment, then divided by 13 weeks.
age 16 or older who had earnings in 2019), median annual earnings were $55,283. The largest cohort of full-time year-round New Hampshire workers, 20 percent, earned between $35,000 and $49,999 annually, followed by 19 percent who earned more than $100,000.
An estimated 15,500 workers, three percent of full-time, year-round workers, earned less than $15,000. Since an individual working 40 hours per week at federal minimum wage would earn $15,080 annually, workers earning less than $15,000 may earn less than minimum wage, although some may work fewer than 40 hours per week.5 Workers in this earnings category include self-employed individuals with an earnings loss over the previous 12 months. In addition, there are a few groups of workers, including some tipped employees, some workers with disabilities, and some agricultural workers, to whom the federal minimum wage doesn’t apply.
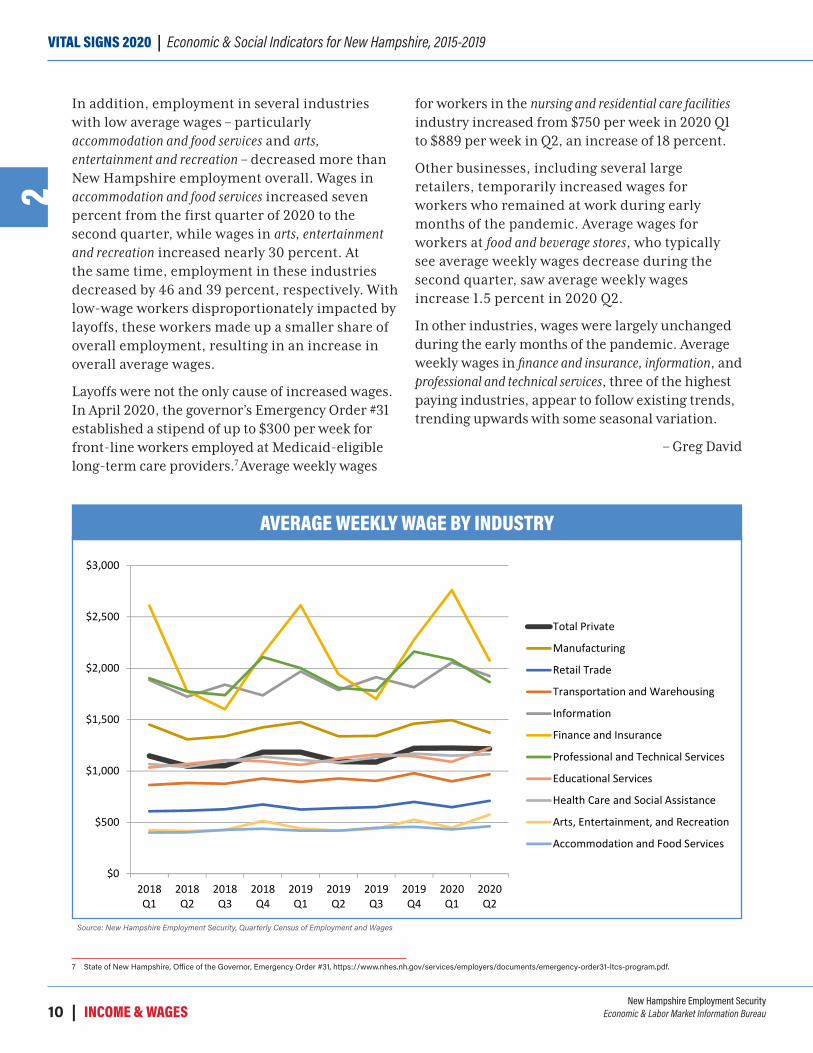
Average Weekly Wages By IndustryThe average weekly wage in New Hampshire was $1,145 in 2019, a 3.5 percent increase over the previous year.6 Average weekly wages have grown by more than three percent in each of the last four years. Average weekly wages vary significantly by industry. The finance and insurance industry had the highest average wages in 2019, with $2,134 per week, nearly double the overall average. The industry with the lowest average wage was accommodation and food services, where the average was $435 per week.
The coronavirus pandemic caused thousands of New Hampshire residents to lose their jobs, either temporarily or permanently. Many other workers had their salaries or hours reduced. The change in
average weekly wages over the first two quarters of 2020 shows how wages in different industries were impacted by the pandemic.
For total private employment, seasonal factors typically cause average weekly wages to be lower in the second and third quarters, and higher in the first and fourth. In 2020, average weekly wages fell from $1,223 in Q1 to $1,215 in Q2, a decline of 0.6 percent. This was a smaller decline than in 2018 and 2019, when the average weekly wage fell an average of eight percent from Q1 to Q2.
The smaller decline in total wages in 2020, relative to previous years, is likely the result of layoffs caused by the pandemic, rather than wages increasing year-over-year for workers. Job losses were more likely to impact newly hired workers, who are typically laid off before more experienced staff, and who earn less than their more experienced colleagues.
New Hampshire Employment SecurityEconomic & Labor Market Information Bureau10 | INCOME & WAGES
VITAL SIGNS 2020 | Economic & Social Indicators for New Hampshire, 2015-20192
7 State of New Hampshire, Office of the Governor, Emergency Order #31, https://www.nhes.nh.gov/services/employers/documents/emergency-order31-ltcs-program.pdf.
In addition, employment in several industries with low average wages – particularly accommodation and food services and arts, entertainment and recreation – decreased more than New Hampshire employment overall. Wages in accommodation and food services increased seven percent from the first quarter of 2020 to the second quarter, while wages in arts, entertainment and recreation increased nearly 30 percent. At the same time, employment in these industries decreased by 46 and 39 percent, respectively. With low-wage workers disproportionately impacted by layoffs, these workers made up a smaller share of overall employment, resulting in an increase in overall average wages.
Layoffs were not the only cause of increased wages. In April 2020, the governor’s Emergency Order #31 established a stipend of up to $300 per week for front-line workers employed at Medicaid-eligible long-term care providers.7 Average weekly wages
$0
$500
$1,000
$1,500
$2,000
$2,500
$3,000
2018Q1
2018Q2
2018Q3
2018Q4
2019Q1
2019Q2
2019Q3
2019Q4
2020Q1
2020Q2
Average Weekly Wage by Industry
Total Private
Manufacturing
Retail Trade
Transportation and Warehousing
Information
Finance and Insurance
Professional and Technical Services
Educational Services
Health Care and Social Assistance
Arts, Entertainment, and Recreation
Accommodation and Food Services
AVERAGE WEEKLY WAGE BY INDUSTRY
Source: New Hampshire Employment Security, Quarterly Census of Employment and Wages
for workers in the nursing and residential care facilities industry increased from $750 per week in 2020 Q1 to $889 per week in Q2, an increase of 18 percent.
Other businesses, including several large retailers, temporarily increased wages for workers who remained at work during early months of the pandemic. Average wages for workers at food and beverage stores, who typically see average weekly wages decrease during the second quarter, saw average weekly wages increase 1.5 percent in 2020 Q2.
In other industries, wages were largely unchanged during the early months of the pandemic. Average weekly wages in finance and insurance, information, and professional and technical services, three of the highest paying industries, appear to follow existing trends, trending upwards with some seasonal variation.
– Greg David

New Hampshire Employment SecurityEconomic & Labor Market Information Bureau INCOME & WAGES | 11
Economic & Social Indicators for New Hampshire, 2015-2019 | VITAL SIGNS 20202
TOTAL PERSONAL INCOME 2015 2016 2017 2018 2019New Hampshire ($ millions) $73,212.4 $75,816.7 $78,822.1 $83,142.6 $86,858.7Components:Net Earningsa 67.5% 67.5% 67.7% 67.2% 67.2%Dividends, interest, rent 17.8% 17.5% 17.4% 17.9% 17.6%Transfer payments 14.7% 15.0% 14.9% 14.9% 15.3%
a Earnings (wages and salaries, other income, and proprietors’ income) by place of work, less personal social insurance by place of work, adjusted for place of residence.
Per Capita Personal IncomeNew Hampshire $54,788 $56,482 $58,439 $61,429 $63,880United States rank (excluding D.C.) 9 7 8 8 8Annual percent change 4.0% 3.1% 3.5% 5.1% 4.0%Percent change after adjusting for inflation using CPI 5.2% 4.0% 3.7% 4.3% 2.4%
Per Capita Disposable IncomeNew Hampshire $48,987 $50,333 $52,026 $54,991 $57,295United States rank (excluding D.C.) 8 7 7 7 8Annual percent change 3.4% 2.7% 3.4% 5.7% 4.2%Percent change after adjusting for inflation using CPI 4.6% 3.6% 3.7% 5.0% 2.3%
Source: Bureau of Economic Analysis; ELMI Analysis. Last Update 9/23/2020
MEDIAN HOUSEHOLD INCOME (in current dollars) 2015 2016 2017 2018 2019
New Hampshire $75,675 $76,260 $75,630 $81,346 $86,900Connecticut $72,889 $75,923 $74,304 $72,812 $87,291Maine $50,756 $50,856 $53,316 $58,663 $66,546Massachusetts $67,861 $72,266 $76,243 $86,345 $87,707Rhode Island $55,701 $61,528 $65,401 $62,266 $70,151Vermont $59,494 $60,837 $63,682 $70,066 $74,305Source: CPS Annual Social and Economic Supplement. Last Update 9/28/2020
AVERAGE WEEKLY EARNINGS OF ALL EMPLOYEES, IN DOLLARS 2015 2016 2017 2018 2019
Earnings of Production Workers in Manufacturing $821.18 $866.07 $914.57 $937.01 $955.40Average Weekly Earnings of All Employees $836.64 $869.34 $891.57 $888.11 $901.80
Source: US DOL, Bureau of Labor Statistics - Current Employment Statistics. Last update 7/22/2020
U.S. PRICE INDICES 2015 2016 2017 2018 2019CONSUMER PRICE INDEX, All Urban Consumers, Year End (Not-seasonally Adjusted)Annual Average (U.S., 1982-1984 = 100) 237.017 240.007 245.120 251.107 255.657Over-the-Year Change in Annual Average 0.1% 1.3% 2.1% 2.4% 1.8%
Northeast Urban Region CPI-U, Year End (Not-seasonally Adjusted)Annual Average (U.S., 1982-1984 = 100) 252.185 254.850 259.538 265.139 269.392Over-the-Year Change in Annual Average -0.1% 1.1% 1.8% 2.2% 1.6%
Source: US DOL, Bureau of Labor Statistics - Consumer Price Index; ELMI Analysis. Last update 7/22/2020

New Hampshire Employment SecurityEconomic & Labor Market Information Bureau12 | INCOME & WAGES
VITAL SIGNS 2020 | Economic & Social Indicators for New Hampshire, 2015-20192
WAGES 2015 2016 2017 2018 2019TOTAL WAGES, workers covered by unemployment compensation (millions)Private and public employers $33,466 $34,675 $36,032 $37,409 $39,038Annual percent change 4.4% 3.6% 3.9% 3.8% 4.4%
AVERAGE WEEKLY WAGE in employment covered by unemployment compensationAll Private industries (annual average) $1,011 $1,043 $1,074 $1,106 $1,145Annual percent change 1.4% 3.2% 3.0% 3.0% 3.5%
Agriculture, Forestry, Fishing, and Hunting $681 $678 $697 $698 $733Mining $1,113 $1,125 $1,214 $1,215 $1,278Utilities $1,983 $1,981 $2,140 $2,245 $2,126Construction $1,101 $1,132 $1,183 $1,205 $1,248Manufacturing $1,286 $1,313 $1,355 $1,379 $1,404Wholesale Trade $1,742 $1,729 $1,762 $1,805 $1,870Retail Trade $591 $596 $608 $631 $653Transportation and Warehousing $811 $819 $846 $889 $926Information $1,591 $1,641 $1,695 $1,800 $1,870Finance and Insurance $1,830 $1,941 $1,943 $2,032 $2,134Real Estate and Rental and Leasing $978 $1,002 $1,023 $1,059 $1,143Professional and Technical Services $1,674 $1,707 $1,807 $1,881 $1,940Management of Companies and Enterprises $2,049 $1,993 $2,103 $1,966 $2,046Administrative and Waste Services $869 $888 $914 $955 $995Educational Services $1,029 $1,040 $1,041 $1,075 $1,119Health Care and Social Assistance $1,000 $1,022 $1,052 $1,085 $1,123Arts, Entertainment, and Recreation $417 $413 $426 $443 $453Accommodation and Food Services $373 $387 $401 $418 $435Other Services, except Public Admin $680 $691 $705 $729 $755
Total Government $937 $946 $968 $994 $1,014Data are not adjusted for inflation.
Source: New Hampshire Employment Security; ELMI Analysis. Last Update 9/23/2020
Prepared by: New Hampshire Employment Security, Economic and Labor Market Information Bureau
www nhes nh gov/elmi | (603) 228-4124

New Hampshire Employment SecurityEconomic & Labor Market Information Bureau LABOR FORCE & UNEMPLOYMENT | 13
Economic & Social Indicators for New Hampshire, 2015-2019 | VITAL SIGNS 20203
Understanding Labor Force Statistics during the first nine months of the Coronavirus PandemicPrior to the coronavirus pandemic, New Hampshire’s labor force statistics had been steady for more than four years. The unemployment rate was 2.9 percent in January 2016, reached a low of 2.5 percent in September 2018 and was 2.6 percent in February 2020. During that time, both the labor force and the number of employed residents increased almost every month. Although statewide action to contain the coronavirus began in the third week of March 2020, labor force statistics were not significantly affected until April. New Hampshire’s seasonally adjusted unemployment rate reached a historic high of 16.0 percent in April, the eighth highest rate in the country. The unemployment rate rapidly declined thereafter to 3.8 percent in December.
The calculation of state labor force statistics during 2020 was a challenge for the Bureau of
LABOR FORCE & UNEMPLOYMENT
Labor Statistics. The magnitude of employment disruptions caused by the coronavirus pandemic, which resulted in more volatile month-to-month estimates of the seasonally adjusted series than in prior years, necessitated modifications to the seasonal adjustment process.1 However, the underlying trends indicated progress over the course of the year. As of December 2020, three-quarters of the lost employment had been recovered and approximately half of those residents who exited the labor force were participating once again.
Unemployment rate estimates throughout the country were subjected to significant scrutiny and criticism throughout 2020. The rates were often expected to be much higher based on the magnitude of unemployment benefit claims, and fell rapidly in contrast to continuing
1 U.S. Bureau of Labor Statistics. 2020. Frequently asked questions: The impact of the coronavirus (COVID-19) pandemic on the Employment Situation for April 2020. May 8. Accessed January 8, 2021. https://www.bls.gov/covid19/employment-situation-covid19-faq-april-2020.htm.
0
200,000
400,000
600,000
800,000
1,000,000
1,200,000
Employment Status of New Hampshire Residents 2019-2020
Employed Unemployed Not In Labor Force
EMPLOYMENT STATUS OF NEW HAMPSHIRE RESIDENTS, 2019-2020
Source: New Hampshire Employment Security, Local Area Unemployment Statistics

New Hampshire Employment SecurityEconomic & Labor Market Information Bureau14 | LABOR FORCE & UNEMPLOYMENT
VITAL SIGNS 2020 | Economic & Social Indicators for New Hampshire, 2015-20193
2 U.S. Bureau of Labor Statistics. 2020. How the Government Measures Unemployment. Accessed January 8, 2021. https://www.bls.gov/cps/cps_htgm.htm.3 U.S. Bureau of Labor Statistics. 2020. Frequently asked questions: The impact of the coronavirus (COVID-19) pandemic on the Employment Situation for April 2020. May 8. Accessed January
8, 2021. https://www.bls.gov/covid19/employment-situation-covid19-faq-april-2020.htm.4 116th Congress. 2020. “H.R.748 - CARES Act.” CONGRESS.GOV. March 27. Accessed January 15, 2021. https://www.congress.gov/bill/116th-congress/house-bill/748.
unemployment claims, which decreased much more slowly. Unemployment claims and the unemployment rate measure two related but different populations. The criteria for measuring the unemployment rate is firmly established, while the criteria for unemployment claims is subject to legislative changes. The expansion of unemployment benefit eligibility and payment amounts to provide a stronger safety net for job losers during the coronavirus pandemic increased the divergence between the two populations.
The Bureau of Labor Statistics classifies people as unemployed if they did not have a job, were available for work and had actively searched for work in the prior four weeks. Workers who expected a recall from a temporary layoff are an exception, as they were not required to perform a job search during their short-term layoff. In addition to the number of people who had lost jobs, the unemployed also include people who had quit their jobs to look for other work and those individuals who looked for a job upon entering or re-entering the labor force.2 The key point is that, with the exception of temporary layoffs, an active job search is required to be classified as unemployed. Individuals who were neither employed nor unemployed were classified as not in the labor force, regardless of their receipt of unemployment benefits.
April 2020 labor force estimates indicated that there were approximately 133,000 fewer New Hampshire residents employed and 97,500 more unemployed than in February. The difference of approximately 35,500 represented the number individuals who exited the labor force, and were classified as neither employed nor unemployed. The shift from employment to unemployment was directly or indirectly influenced by a number of factors including health concerns, coronavirus mitigating actions taken by employers and government officials, temporary changes to the supply and demand for goods and services, the expanded availability of unemployment benefits
and increases to weekly benefit payments, and other factors. Expanded unemployment benefits provided workers and employers with the opportunity to reduce the risk of exposure to the coronavirus while maintaining an income stream for workers’ living expenses. Many of the residents who were no longer in the labor force expected a long-term or permanent separation from their previous employment or self-employment and were not looking for work. Health concerns, reduced job opportunities, mandatory closures and stay-at-home orders due to the coronavirus pandemic were the driving force behind this exodus.3
Self-EmploymentThe treatment of self-employed individuals regarding unemployment benefit compensation compared to labor force statistics also differs. The official unemployment rate includes self-employed individuals as employed. Individuals who ceased self-employment and searched for work were classified as unemployed labor force entrants. In most cases, these individuals were not eligible for unemployment benefits. Prior to the coronavirus pandemic, monthly unemployment estimates exceeded claims due to the inclusion of the unemployed who were not eligible for unemployment benefits due to a variety of reasons.
The Coronavirus Aid, Relief, and Economic Security (CARES) Act extended unemployment benefits to self-employed individuals who were unable to conduct business due to the coronavirus pandemic.4 This extension of benefits to those not typically eligible changed the relationship between unemployment claim levels and official unemployment estimates. Unemployment claim levels during the pandemic not only included former self-employed individuals who became unemployed due to pandemic-related reasons, but also those who exited the labor force and those who continued to operate their businesses at a reduced capacity. The official unemployment rate classifies
New Hampshire Employment SecurityEconomic & Labor Market Information Bureau LABOR FORCE & UNEMPLOYMENT | 15
Economic & Social Indicators for New Hampshire, 2015-2019 | VITAL SIGNS 20203
5 U.S. Bureau of Labor Statistics. 2020. The Employment Situation – April 2020. USDL-20-0815, May 8.
individuals who continued to perform tasks for their businesses as employed regardless of whether the businesses were profitable or operating at reduced capacity.
Labor Force MisclassificationThe Bureau of Labor Statistics (BLS) caused significant discussion of an “error” in the national unemployment rate with the publication of a technical note entitled “Coronavirus (COVID-19) Impact on March 2020 Establishment and Household Survey Data” in the April 3, 2020 release of The Employment Situation - March 2020. This was related to a subcategory of the employed, which includes those who were not at work during the week for which Current Population Survey data were collected. This subcategory is further parsed into the various reasons for absence from work, including vacation or personal days, own illness or injury, child care problems, family or personal obligations, maternity or paternity leave, labor dispute, weather affected job, school or training, civic or military duty and “other.” The BLS detected a large increase in the number of individuals
included in the “other” category. A worst-case scenario calculation was performed in which all of those in this category above a typical March estimate were assumed to be unemployed rather than employed. This assumption was based on the possibility that survey respondents misunderstood the questions, and did not respond appropriately. The BLS estimated that the U.S. unemployment rate would have been nearly one percentage point higher in March. A subsequent calculation for the April estimate determined that the unemployment rate would have been almost five percentage points higher based on this assumption.5
Although this was frequently referred to as an “error” in the BLS estimates, it simply represented a worst-case scenario if all other possible explanations were invalid. It is reasonable to assume that this “other” category may have also included misclassified individuals who were on vacation but couldn’t travel due to the coronavirus, misclassified individuals who had exited the labor force on a temporary leave without pay, and misclassified individuals who were working
Government - Federal2%
Government - State3%
Government - Local6%
Private, For Profit69%
Private, Nonprofit10%
Self-Employed, Incorporated4%
Self-Employed, Unincorporated6%
NEW HAMPSHIRE LABOR FORCE IN 2020 BY CLASS OF WORKER
EMPLOYMENT STATUS OF NEW HAMPSHIRE RESIDENTS, 2019-2020
Source: U.S. Census Bureau, unpublished Current Population Survey data (12 Months Average)
New Hampshire Employment SecurityEconomic & Labor Market Information Bureau16 | LABOR FORCE & UNEMPLOYMENT
VITAL SIGNS 2020 | Economic & Social Indicators for New Hampshire, 2015-20193
from home. Such misunderstandings and misclassifications would have been possible in every month of the survey; however the uncertainty caused by the coronavirus pandemic increased the probability that these response errors may have occurred.
State level data for this analysis are not readily available and are not statistically reliable. Furthermore, since official state labor force statistics are not derived directly from Current Population Survey data, any misclassification estimate produced would not be comparable to monthly state labor force statistics.
Unemployment Insurance Claims by IndustryUnemployment claims and benefit data are not comparable to unemployment estimates produced for statistical purposes by the Bureau of Labor Statistics and the Bureau of the Census. Unemployment claims data include employed individuals who are considered partially unemployed for benefit purposes, while excluding those unemployed individuals who have exhausted benefits or are otherwise ineligible for benefits. However, unemployment insurance claim and benefit data are regularly used in economic analyses.
Industry data for those claimants who filed for continuing weeks of unemployment are incomplete, however they provide an indication of the industries that had experienced the greatest impact to their workforces from the coronavirus pandemic and efforts to contain it. Compared to the first week of March 2020, unemployment claims from workers formerly employed in the accommodation and food services sector increased by 14,310 percent in late April. By the end of December, these claims remained 4,500 percent higher than they were for the week ending March 7, 2020. The health care and social assistance claim level soared to 5,680 percent above the pre-pandemic level. Retail trade claims reached 3,610 percent above pre-pandemic levels with over 11,000 claimants during the first week of May. The arts, entertainment and recreation sector and the transportation and warehousing sector experienced similar percentage increases to retail trade. Manufacturing claims rose by 2,350 percent above the early March level, but remained at that elevated level for three months. As of the last week of December 2020, unemployment insurance claim levels for all industry sectors remained significantly higher than the pre-pandemic levels.
– Robert Cote
UNEMPLOYMENT INSURANCE 2015 2016 2017 2018 2019Weeks compensated for unemployment (UI) 230,528 192,427 166,663 148,512 133,805Benefits paid, unemployment insurance (thousands) $67,344 $57,923 $52,698 $47,799 $43,252Annual percent change -18.8% -14.0% -9.0% -9.3% -9.5%Average duration, benefit payments (weeks) 13.2 12.8 12.6 12.5 12.1United States average 15.5 15.5 15.4 15.3 14.8United States ranka (1=longest duration) 39 43 41 41 41
Average weekly benefit amountNew Hampshire $305.82 $313.57 $328.39 $335.16 $335.36United States $328.85 $344.34 $350.95 $356.20 $368.88
a Ranks include D.C., Virgin Islands, and Puerto Rico
Source: U.S Department of Labor, Employment and Training Administration; ELMI Analysis. Last Update 7/29/2020

New Hampshire Employment SecurityEconomic & Labor Market Information Bureau LABOR FORCE & UNEMPLOYMENT | 17
Economic & Social Indicators for New Hampshire, 2015-2019 | VITAL SIGNS 20203
610%
40%
440%
500%
2,350%
1,290%
3,610%
3,370%
1,330%
520%
2,080%
1,070%
1,800%
1,110%
5,040%
5,680%
3,560%
14,310%
6,570%
1,920%
0% 2,000% 4,000% 6,000% 8,000% 10,000% 12,000% 14,000% 16,000%
Agriculture, Forestry, Fishing and Hunting
Mining, Quarrying, and Oil and Gas Extraction
Utilities
Construction
Manufacturing
Wholesale Trade
Retail Trade
Transportation and Warehousing
Information
Finance and Insurance
Real Estate and Rental and Leasing
Professional and Technical Services
Management of Companies and Enterprises
Administrative and Waste Services
Educational Services
Health Care and Social Assistance
Arts, Entertainment, and Recreation
Accommodation and Food Services
Other Services, Except Public Administration
Public Administration
Peak percentage increase in New Hampshire continued claims filed compared to pre-pandemic levels by industry sector
PEAK PERCENTAGE INCREASE IN NEW HAMPSHIRE CONTINUED CLAIMS FILED COMPARED TO PRE-PANDEMIC LEVELS BY INDUSTRY SECTOR
Source: New Hampshire Employment Security, Unemployment Insurance Claim data
ALTERNATIVE MEASURES OF LABOR UNDERUTILIZATION 2015 2016 2017 2018 2019
U-1: persons unemployed 15 weeks or longer, as a percent of the civilian labor forceNew Hampshire 1.3% 1.0% 0.9% 0.9% 0.8%United States 2.3% 2.0% 1.7% 1.4% 1.3%
U-2: job losers and persons who completed temporary jobs, as a percent of the civilian labor forceNew Hampshire 1.9% 1.5% 1.5% 1.2% 1.1%United States 2.6% 2.3% 2.1% 1.8% 1.7%
U-3: total unemployed, as a percent of the civilian labor force (this is the definition used for the official unemployment rate)New Hampshire 3.4% 2.8% 2.8% 2.6% 2.6%United States 5.3% 4.9% 4.4% 3.9% 3.7%
U-4: total unemployed plus discouraged workers, as a percent of the civilian labor force plus discouraged workersNew Hampshire 3.7% 3.0% 2.9% 2.7% 2.7%United States 5.7% 5.2% 4.6% 4.1% 3.9%
U-5: total unemployed, plus discouraged workers, plus all other marginally attached workers, as a percent of the civilian labor force plus all marginally attached workers
New Hampshire 4.2% 3.6% 3.5% 3.0% 3.1%United States 6.4% 5.9% 5.3% 4.8% 4.5%
U-6: total unemployed, plus all marginally attached workers, plus total employed part time for economic reasons, as a percent of the civilian labor force plus all marginally attached workers
New Hampshire 8.0% 6.4% 6.2% 5.6% 5.2%United States 10.4% 9.6% 8.5% 7.7% 7.2%
Source: Bureau of Labor Statistics, Current Population Survey; ELMI Analysis. Last Update 7/29/2020
New Hampshire Employment SecurityEconomic & Labor Market Information Bureau18 | LABOR FORCE & UNEMPLOYMENT
VITAL SIGNS 2020 | Economic & Social Indicators for New Hampshire, 2015-20193
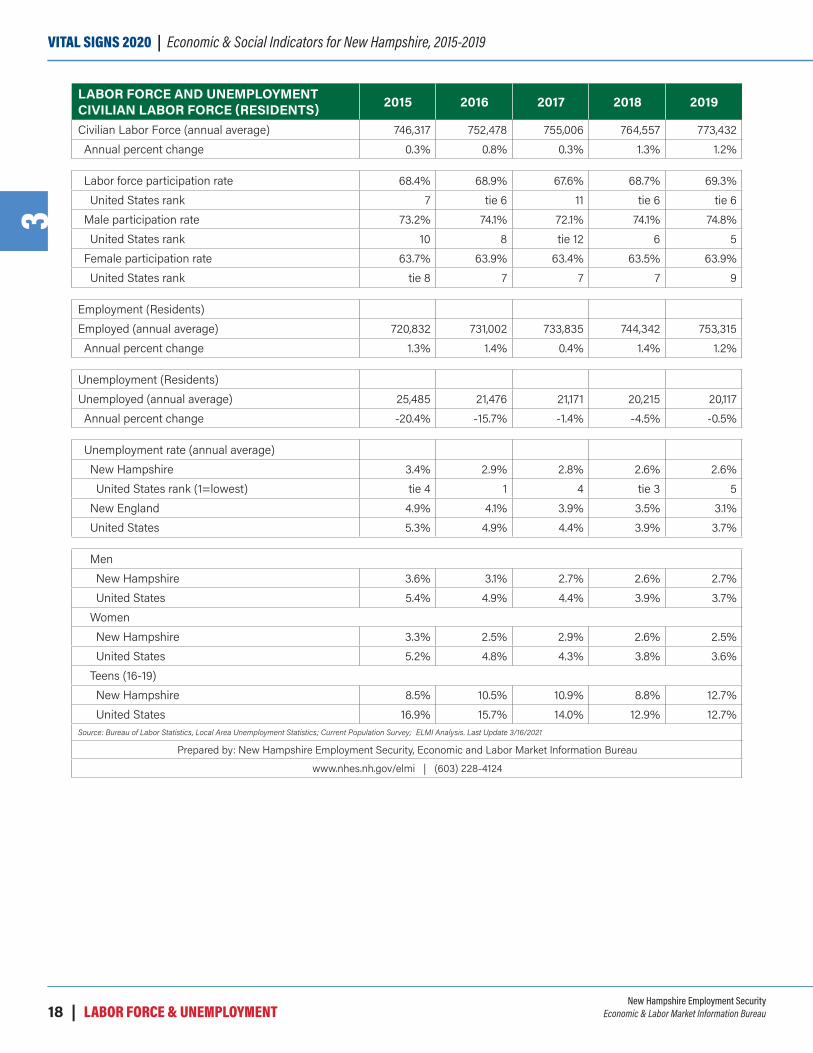
LABOR FORCE AND UNEMPLOYMENT CIVILIAN LABOR FORCE (RESIDENTS) 2015 2016 2017 2018 2019
Civilian Labor Force (annual average) 746,317 752,478 755,006 764,557 773,432Annual percent change 0.3% 0.8% 0.3% 1.3% 1.2%
Labor force participation rate 68.4% 68.9% 67.6% 68.7% 69.3%United States rank 7 tie 6 11 tie 6 tie 6
Male participation rate 73.2% 74.1% 72.1% 74.1% 74.8%United States rank 10 8 tie 12 6 5
Female participation rate 63.7% 63.9% 63.4% 63.5% 63.9%United States rank tie 8 7 7 7 9
Employment (Residents)Employed (annual average) 720,832 731,002 733,835 744,342 753,315Annual percent change 1.3% 1.4% 0.4% 1.4% 1.2%
Unemployment (Residents)Unemployed (annual average) 25,485 21,476 21,171 20,215 20,117Annual percent change -20.4% -15.7% -1.4% -4.5% -0.5%
Unemployment rate (annual average)New Hampshire 3.4% 2.9% 2.8% 2.6% 2.6%United States rank (1=lowest) tie 4 1 4 tie 3 5
New England 4.9% 4.1% 3.9% 3.5% 3.1%United States 5.3% 4.9% 4.4% 3.9% 3.7%
MenNew Hampshire 3.6% 3.1% 2.7% 2.6% 2.7%United States 5.4% 4.9% 4.4% 3.9% 3.7%
WomenNew Hampshire 3.3% 2.5% 2.9% 2.6% 2.5%United States 5.2% 4.8% 4.3% 3.8% 3.6%
Teens (16-19)New Hampshire 8.5% 10.5% 10.9% 8.8% 12.7%United States 16.9% 15.7% 14.0% 12.9% 12.7%
Source: Bureau of Labor Statistics, Local Area Unemployment Statistics; Current Population Survey; ELMI Analysis. Last Update 3/16/2021
Prepared by: New Hampshire Employment Security, Economic and Labor Market Information Bureau
www.nhes.nh.gov/elmi | (603) 228-4124

New Hampshire Employment SecurityEconomic & Labor Market Information Bureau EMPLOYMENT BY INDUSTRY | 19
Economic & Social Indicators for New Hampshire, 2015-2019 | VITAL SIGNS 20204
1 Data from the Current Employment Statistics (CES) program measure employment by place of work. CES data estimate the number of workers who are employed in New Hampshire, regardless of where they reside, and do not include the self-employed, unpaid family members, or agricultural workers.
2 On an over-the-month basis, changes to employment reflect both changes in economic conditions and seasonal patterns of employment growth and decline. All industries experience seasonal changes to some degree, although these patterns tend to be more obvious in leisure and hospitality; trade, transportation, and utilities and construction. Employment estimates can be seasonally adjusted, to eliminate the part of the over-the-month change attributable to normal seasonal variation and make it possible to observe cyclical and other nonseasonal movements from month to month. For data that has not been seasonally adjusted, the most appropriate method of comparison is to compare the estimates for the same month in different years; this will minimize the effect of seasonal employment patterns on observed changes.
EMPLOYMENT BY INDUSTRYEmployment Growth, 2015 to 2019Average annual nonfarm employment in New Hampshire grew 1.0 percent from 2018 to 2019, slightly faster than the 0.7 percent growth during the previous year.1 Between 2015 and 2019, employment in New Hampshire grew by 4.7 percent, an increase of 30,400 jobs. Employment in the construction sector grew 15.3 percent between 2015 and 2019, faster than any other sector. Construction employment increased by 3,700 jobs. Transportation, warehousing, and utilities and private educational services employment also experienced double-digit growth between 2015 and 2019, growing by 11.7 percent and 12.3 percent, respectively. Transportation, warehousing, and utilities added 1,800 jobs during the period, while educational services added 3,400 jobs.
Employment declined in two sectors between 2015 and 2019. Retail trade employment decreased by 900 jobs, a decrease of 0.9 percent, while information lost 100 jobs, a decrease of 0.8 percent.
95
100
105
110
115
120
100
= 20
15 E
mpl
oym
ent L
evel
Industry Growth Index, 2015 - 2019
Total Non-Farm ConstructionTransportation, Warehousing, and Utilities Educational ServicesRetail Trade Information
INDUSTRY GROWTH INDEX, 2015 – 2019
Source: New Hampshire Employment Security, Current Employment Statistics
Seasonally Adjusted Nonfarm Employment, 20202 After increasing every year since 2011, preliminary nonfarm employment estimates for New Hampshire fell in 2020, as a result of the coronavirus pandemic and efforts to contain it. Employment decreased from 687,200 in January 2020 to 572,600 in April, for a loss of 114,600 jobs. Through December, a total of 66,700 jobs have been recovered.
Eight private industry supersectors also experienced their lowest level of employment in April. Construction employment decreased by 2,900 from January to April, but by December had recovered 2,400 jobs compared to the level in April. Private education and health services lost 800 jobs between August and December, but had still recovered 10,400 of the jobs lost in April. The leisure and hospitality supersector was hit hardest by the pandemic, with 39,200 jobs lost by April. By December, the supersector had recovered 25,000

New Hampshire Employment SecurityEconomic & Labor Market Information Bureau20 | EMPLOYMENT BY INDUSTRY
VITAL SIGNS 2020 | Economic & Social Indicators for New Hampshire, 2015-20194
jobs. Trade, transportation, and utilities hit a low of 119,100 employed in April, a loss of 20,900 from January. Since May, this supersector recovered 17,600 jobs, primarily in retail trade. Manufacturing employment fell by 6,300 jobs by April, and by December had gained 1,900 of those jobs back. Professional and business services lost 9,700 positions by June. By December, employment in this supersector had increased by 5,100 jobs, but remained 4,300 below the January level. Financial activities suffered a loss of only 700 positions as of April, and had regained 400 of those jobs by December. Other services lost about one-third of its employment as of April, with 9,400 jobs lost. By December, this supersector had recovered 5,700 jobs.
Two supersectors experienced their lowest level of employment after April, as secondary effects of the coronavirus impacted these industries in subsequent months. Employment in the information sector fell to 11,400 jobs in June, 1,000 jobs lower than it had been in January. Employment in information remained at that level for most of the second half of 2020. Government employment decreased 7,600 jobs from January to April, before recovering 4,600 jobs over the next four months.
However, the sector dropped 7,700 jobs between September and December, a total decline of 10,700 since January. The majority of the employment decline was concentrated in state government, which declined by 5,700 jobs.
Not Seasonally Adjusted Nonfarm Employment, 2020Estimates for December 2020 show that total nonfarm employment decreased by 50,800 jobs since December 2019. Employment losses were experienced in all but one supersector over-the-year, professional and business services, which had 600 more positions than in December 2019. Leisure and hospitality experienced the largest decrease, with 15,800 fewer jobs than in December 2019. Trade, transportation, and utilities employment decreased by 4,400, while manufacturing shed 4,600 jobs.
Private education and health services lost 12,300 positions over-the-year, while information employment declined by 1,000. Construction employment decreased by 200 from December 2019 to December 2020, and government employment decreased by 9,300.
- Robert Cote and Greg David
-60.0%
-50.0%
-40.0%
-30.0%
-20.0%
-10.0%
0.0%
10.0%
Jan-20 Feb-20 Mar-20 Apr-20 May-20 Jun-20 Jul-20 Aug-20 Sep-20 Oct-20 Nov-20 Dec-20
Over-the-Year Change in Employment by Industry
Professional and Business Svcs, 0.7%Financial Activi�es, -0.3%Construction, -0.7%Trade, Transporta�on, and Utili�e,s -3.1%Manufacturing , -6.5%Total Nonfarm, -7.3%Information, -8.1%Educa�on and Health Svcs, -9.5%Government, -9.9%Leisure and Hospitality, -22.6%
OVER-THE-YEAR CHANGE IN EMPLOYMENT BY INDUSTRY
Source: New Hampshire Employment Security, Current Employment Statistics
New Hampshire Employment SecurityEconomic & Labor Market Information Bureau EMPLOYMENT BY INDUSTRY | 21
Economic & Social Indicators for New Hampshire, 2015-2019 | VITAL SIGNS 20204
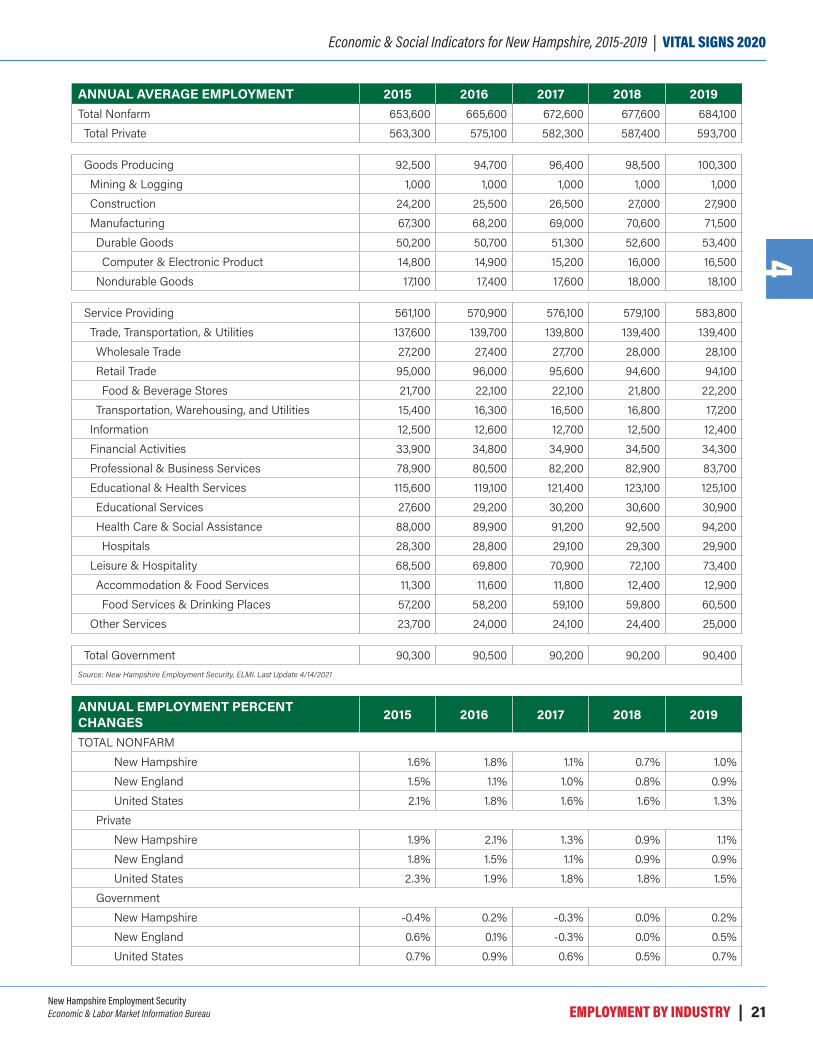
ANNUAL AVERAGE EMPLOYMENT 2015 2016 2017 2018 2019Total Nonfarm 653,600 665,600 672,600 677,600 684,100Total Private 563,300 575,100 582,300 587,400 593,700
Goods Producing 92,500 94,700 96,400 98,500 100,300Mining & Logging 1,000 1,000 1,000 1,000 1,000Construction 24,200 25,500 26,500 27,000 27,900Manufacturing 67,300 68,200 69,000 70,600 71,500Durable Goods 50,200 50,700 51,300 52,600 53,400Computer & Electronic Product 14,800 14,900 15,200 16,000 16,500
Nondurable Goods 17,100 17,400 17,600 18,000 18,100
Service Providing 561,100 570,900 576,100 579,100 583,800Trade, Transportation, & Utilities 137,600 139,700 139,800 139,400 139,400Wholesale Trade 27,200 27,400 27,700 28,000 28,100Retail Trade 95,000 96,000 95,600 94,600 94,100Food & Beverage Stores 21,700 22,100 22,100 21,800 22,200
Transportation, Warehousing, and Utilities 15,400 16,300 16,500 16,800 17,200Information 12,500 12,600 12,700 12,500 12,400Financial Activities 33,900 34,800 34,900 34,500 34,300Professional & Business Services 78,900 80,500 82,200 82,900 83,700Educational & Health Services 115,600 119,100 121,400 123,100 125,100Educational Services 27,600 29,200 30,200 30,600 30,900Health Care & Social Assistance 88,000 89,900 91,200 92,500 94,200Hospitals 28,300 28,800 29,100 29,300 29,900
Leisure & Hospitality 68,500 69,800 70,900 72,100 73,400Accommodation & Food Services 11,300 11,600 11,800 12,400 12,900Food Services & Drinking Places 57,200 58,200 59,100 59,800 60,500
Other Services 23,700 24,000 24,100 24,400 25,000
Total Government 90,300 90,500 90,200 90,200 90,400Source: New Hampshire Employment Security, ELMI. Last Update 4/14/2021
ANNUAL EMPLOYMENT PERCENT CHANGES 2015 2016 2017 2018 2019
TOTAL NONFARMNew Hampshire 1.6% 1.8% 1.1% 0.7% 1.0%New England 1.5% 1.1% 1.0% 0.8% 0.9%United States 2.1% 1.8% 1.6% 1.6% 1.3%
PrivateNew Hampshire 1.9% 2.1% 1.3% 0.9% 1.1%New England 1.8% 1.5% 1.1% 0.9% 0.9%United States 2.3% 1.9% 1.8% 1.8% 1.5%
GovernmentNew Hampshire -0.4% 0.2% -0.3% 0.0% 0.2%New England 0.6% 0.1% -0.3% 0.0% 0.5%United States 0.7% 0.9% 0.6% 0.5% 0.7%
New Hampshire Employment SecurityEconomic & Labor Market Information Bureau22 | EMPLOYMENT BY INDUSTRY
VITAL SIGNS 2020 | Economic & Social Indicators for New Hampshire, 2015-20194
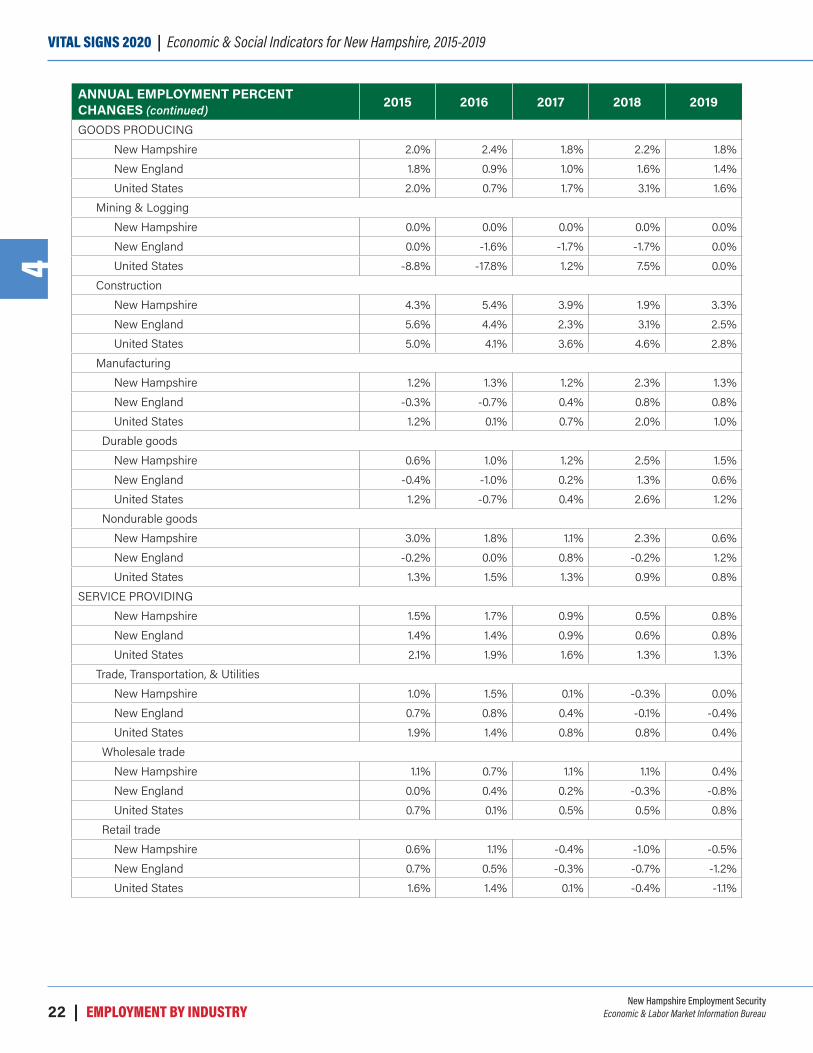
ANNUAL EMPLOYMENT PERCENT CHANGES (continued)
2015 2016 2017 2018 2019
GOODS PRODUCINGNew Hampshire 2.0% 2.4% 1.8% 2.2% 1.8%New England 1.8% 0.9% 1.0% 1.6% 1.4%United States 2.0% 0.7% 1.7% 3.1% 1.6%
Mining & LoggingNew Hampshire 0.0% 0.0% 0.0% 0.0% 0.0%New England 0.0% -1.6% -1.7% -1.7% 0.0%United States -8.8% -17.8% 1.2% 7.5% 0.0%
ConstructionNew Hampshire 4.3% 5.4% 3.9% 1.9% 3.3%New England 5.6% 4.4% 2.3% 3.1% 2.5%United States 5.0% 4.1% 3.6% 4.6% 2.8%
ManufacturingNew Hampshire 1.2% 1.3% 1.2% 2.3% 1.3%New England -0.3% -0.7% 0.4% 0.8% 0.8%United States 1.2% 0.1% 0.7% 2.0% 1.0%
Durable goodsNew Hampshire 0.6% 1.0% 1.2% 2.5% 1.5%New England -0.4% -1.0% 0.2% 1.3% 0.6%United States 1.2% -0.7% 0.4% 2.6% 1.2%
Nondurable goodsNew Hampshire 3.0% 1.8% 1.1% 2.3% 0.6%New England -0.2% 0.0% 0.8% -0.2% 1.2%United States 1.3% 1.5% 1.3% 0.9% 0.8%
SERVICE PROVIDINGNew Hampshire 1.5% 1.7% 0.9% 0.5% 0.8%New England 1.4% 1.4% 0.9% 0.6% 0.8%United States 2.1% 1.9% 1.6% 1.3% 1.3%
Trade, Transportation, & UtilitiesNew Hampshire 1.0% 1.5% 0.1% -0.3% 0.0%New England 0.7% 0.8% 0.4% -0.1% -0.4%United States 1.9% 1.4% 0.8% 0.8% 0.4%
Wholesale tradeNew Hampshire 1.1% 0.7% 1.1% 1.1% 0.4%New England 0.0% 0.4% 0.2% -0.3% -0.8%United States 0.7% 0.1% 0.5% 0.5% 0.8%
Retail tradeNew Hampshire 0.6% 1.1% -0.4% -1.0% -0.5%New England 0.7% 0.5% -0.3% -0.7% -1.2%United States 1.6% 1.4% 0.1% -0.4% -1.1%
New Hampshire Employment SecurityEconomic & Labor Market Information Bureau EMPLOYMENT BY INDUSTRY | 23
Economic & Social Indicators for New Hampshire, 2015-2019 | VITAL SIGNS 20204
ANNUAL EMPLOYMENT PERCENT CHANGES (continued)
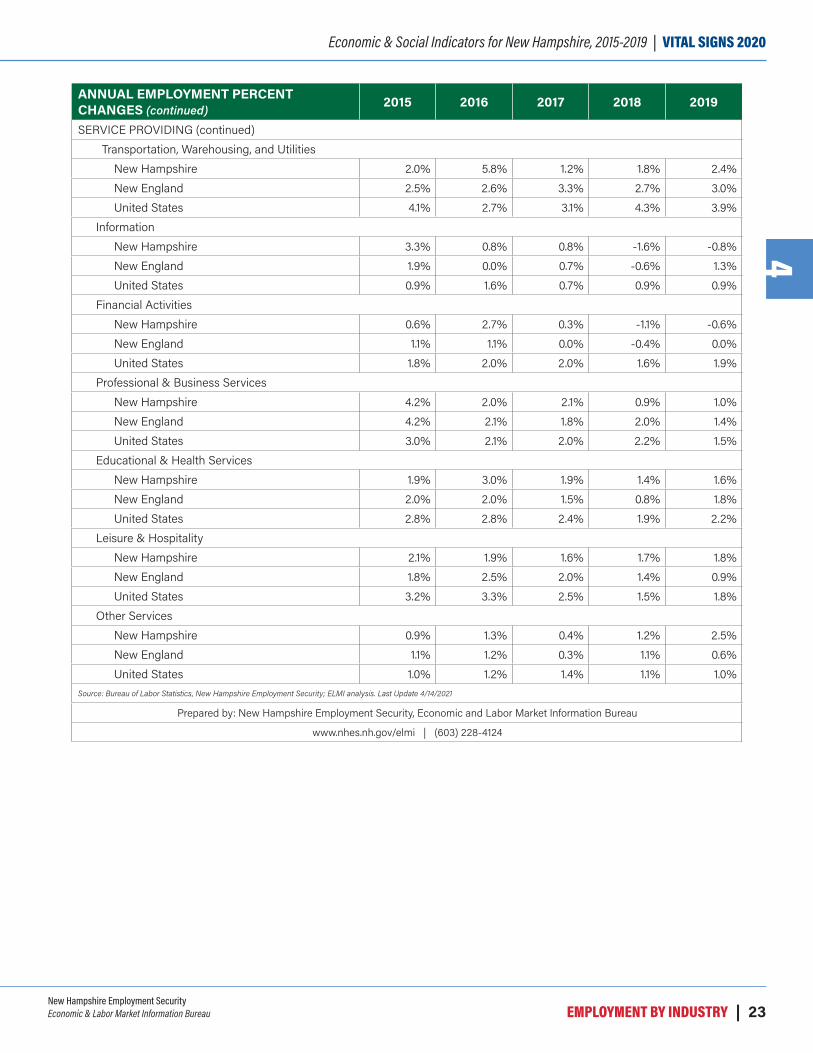
2015 2016 2017 2018 2019
SERVICE PROVIDING (continued)Transportation, Warehousing, and Utilities
New Hampshire 2.0% 5.8% 1.2% 1.8% 2.4%New England 2.5% 2.6% 3.3% 2.7% 3.0%United States 4.1% 2.7% 3.1% 4.3% 3.9%
InformationNew Hampshire 3.3% 0.8% 0.8% -1.6% -0.8%New England 1.9% 0.0% 0.7% -0.6% 1.3%United States 0.9% 1.6% 0.7% 0.9% 0.9%
Financial ActivitiesNew Hampshire 0.6% 2.7% 0.3% -1.1% -0.6%New England 1.1% 1.1% 0.0% -0.4% 0.0%United States 1.8% 2.0% 2.0% 1.6% 1.9%
Professional & Business ServicesNew Hampshire 4.2% 2.0% 2.1% 0.9% 1.0%New England 4.2% 2.1% 1.8% 2.0% 1.4%United States 3.0% 2.1% 2.0% 2.2% 1.5%
Educational & Health ServicesNew Hampshire 1.9% 3.0% 1.9% 1.4% 1.6%New England 2.0% 2.0% 1.5% 0.8% 1.8%United States 2.8% 2.8% 2.4% 1.9% 2.2%
Leisure & HospitalityNew Hampshire 2.1% 1.9% 1.6% 1.7% 1.8%New England 1.8% 2.5% 2.0% 1.4% 0.9%United States 3.2% 3.3% 2.5% 1.5% 1.8%
Other ServicesNew Hampshire 0.9% 1.3% 0.4% 1.2% 2.5%New England 1.1% 1.2% 0.3% 1.1% 0.6%United States 1.0% 1.2% 1.4% 1.1% 1.0%
Source: Bureau of Labor Statistics, New Hampshire Employment Security; ELMI analysis. Last Update 4/14/2021
Prepared by: New Hampshire Employment Security, Economic and Labor Market Information Bureau
www.nhes.nh.gov/elmi | (603) 228-4124
New Hampshire Employment SecurityEconomic & Labor Market Information Bureau24 | OCCUPATIONAL TRENDS
VITAL SIGNS 2020 | Economic & Social Indicators for New Hampshire, 2015-20195
OCCUPATIONAL TRENDS
1 New Hampshire long-term projections designate four categories of potential job outlook based on projected growth and openings, with “Very Favorable” assigned to occupations with the best prospects.
2 U.S. Bureau of Labor Statistics, “Nursing Assistants and Orderlies,” https://www.bls.gov/ooh/healthcare/nursing-assistants.htm#tab-6
Growing Occupations in the 2018 to 2028 ProjectionsOverall, employment in New Hampshire was projected to grow by 5.3 percent from 2018 to 2028, adding more than 37,250 jobs. By itself, that number may be impressive, but is not very useful for many users of projections reports and related products.
Career counselors and students, job seekers and job changers, education and training specialists, and policy specialists are more interested in the details of which occupations are growing and are expected to have the best career prospects in the next ten years. It is also useful to examine the “why” of growth and what causes an increase in demand for particular occupations. Examples of factors causing occupational growth include an aging population, which is a driver in the growth of healthcare and related occupations; change in the relative employment of an occupation, such as the employment of more physician assistants as a lower-cost alternative to physicians; and changes in technology, such as cloud-based applications, which require new expertise.
In looking ahead, it is also useful to look back at the labor force of ten years ago. Some occupations that had few workers in 2008 have experienced significant growth, increasing more than two or threefold. “Trending occupations” are identified as those with an increase of more than 100 percent from 2008 to 2018 and having better-than-average growth for 2018 to 2028.
Another type of occupation to consider is occupations that did not exist in the 2008 occupational classification system. The federal government maintains a Standard Occupational Coding (SOC) system to classify workers for statistical purposes and disseminating data. Detailed occupations are grouped by job duties, skills, and education requirements. The 2018 version of the SOC includes several new occupations, with significant revisions to information technology and healthcare occupations.
Some newly classified occupations have strong potential for employment increases between 2018 and 2028.1 Some of these emerging occupations were classified as part of another occupational code in prior SOC classifications, but are now broken out into a separate SOC code. This action recognizes the changing scope of occupational duties caused by technology, business practices, or changes in demand and consumer behavior.
Trends in Healthcare OccupationsEmployment of nursing assistants is projected to grow by nearly eight percent in New Hampshire between 2018 and 2028, matching the national trend, adding 650 jobs. More nursing assistants will be needed to care for an aging baby-boom population in long-term care facilities, hospitals, and in the homes of care recipients, which is driven by the shift to home and community-based long-term care. Additionally, there will be a need to replace workers that leave the occupation by retiring, returning to school, caring for family, or changing careers. In fact, most of the openings will be for that reason due to the relatively low pay – an average of $16.67 per hour in 2020 – and burnout found in this occupation.2 Entering this occupation requires completion of a state-approved education program and licensure by the New Hampshire Board of Nursing.
Classified in the same SOC code as registered nurses prior to 2010, three occupations were broken out into separate codes as of the 2010 SOC revision: nurse anesthetists, nurse practitioners, and nurse midwives. These occupations are all Advanced Practice Registered Nurses (ARPN), who must attain a registered nurse license, complete a Master’s degree, and meet advanced educational and clinical practice requirements. Licensure from the New Hampshire Board of Nursing is also required, including maintaining a New Hampshire registered nurse license.

New Hampshire Employment SecurityEconomic & Labor Market Information Bureau OCCUPATIONAL TRENDS | 25
Economic & Social Indicators for New Hampshire, 2015-2019 | VITAL SIGNS 20205
3 O*Net Online Summary Report, https://www.onetonline.org/link/summary/29-1171.004 O*Net Online Summary Report, https://www.onetonline.org/link/summary/29-1151.005 O*Net Online Summary Report, https://www.onetonline.org/link/summary/29-1161.00
Nurse practitioners work independently or as part of the healthcare team in hospitals, clinics, and doctor’s offices and may provide primary and specialty healthcare.3 Nurse anesthetists assist anesthesiologists, other physicians or dentists, and may administer anesthesia and oversee patient recovery from anesthesia.4 Nurse midwives specialize in childbirth, diagnosing and coordinating all aspects of the birthing process, either independently or as part of a healthcare team.5 Nurse practitioners are projected to grow by 30 percent over ten years, much faster than the statewide average, driven by their expanded role in primary healthcare. Overall, more than 100 annual openings are projected for 2018 to 2028 for nurse practitioners. Nurse anesthetists, projected to grow by 17 percent, are expected to have 16 job openings annually. Demand for nurse midwives is not
as strong, and although the occupation is expected to grow by 19 percent, only four job openings are projected annually.
Opioid abuse remains a problem in New Hampshire, creating demand for substance abuse, behavioral disorder, and mental health counselors that is much higher than average, with growth of more than 27 percent from 2018 to 2018 projected. Total employment in this occupation is projected to increase by more than 510 jobs through 2028. Demand is expected to continue as states and communities provide treatment and counseling as alternatives to jail time for drug offenders. Treatment programs have been found to be cost-effective and can reduce repeat offenses.6 Workers in this occupation are employed in ambulatory health care services, such as clinics and community health
459
408
2670
769
36
498
377
45
150
681
3965
175
35 51
280
230
100
200
300
400
500
600
700
800
900
Nursing Assistants Registered Nurses Nurse Practitioners Substance abuse, behavioraldisorder, and mental health
counselors
personal care aides Home health aides
Projected Openings for Healthcare Occupations, 2018 to 2028
Exits Transfers Growth
PROJECTED OPENINGS FOR HEALTHCARE OCCUPATIONS, 2018 TO 2028
Source: New Hampshire Employment Security, Long-Term Occupational Projections

New Hampshire Employment SecurityEconomic & Labor Market Information Bureau26 | OCCUPATIONAL TRENDS
VITAL SIGNS 2020 | Economic & Social Indicators for New Hampshire, 2015-20195
6 U.S. Bureau of Labor Statistics, “Community and Social Service Occupations,” https://www.bls.gov/ooh/community-and-social-service/. 7 Job Outlook and Locator by Industry and Occupation, https://www.nhes.nh.gov/elmi/products/documents/job-locator-oct2020.pdf.
centers, nursing and residential care facilities, and social assistance industries.7 Workers in this occupation must be licensed by the New Hampshire Board of Licensing for Alcohol and Other Drug Use Professionals, and educational requirements vary from Associate’s degree to Master’s degree, depending on the employer and type of counseling.
Trends in IT OccupationsThe SOC coding structure of information technology occupations is constantly changing to accommodate new duties and processes performed by those employed in this field. One of the occupations expected to grow faster than any other occupation between 2018 and 2028 is information security analysts. As the demand for cloud-based
services increases and the need for solutions to cyberattacks grows, workers in this occupation create innovative solutions to prevent hackers from gaining access to computer systems, and to protect resources related to computer networks. Demand for workers in this occupation is projected to increase by 34 percent over the ten-year projection period. Generally, a Bachelor’s degree is required, along with related work experience. Other computer-related occupations with very favorable employment prospects include network architects, network support specialists, and web developers.
Upward Trending Occupations Another occupational trend illustrated in the latest employment projections are those occupations
7
42
6
63
19
131
25
219
4 13 4
34
0
50
100
150
200
250
Database Administrators Network and Computer SystemsAdministrators
Computer Network Architects Computer User Support Specialists
Projected Openings for IT Occupations, 2018 to 2028
Exits Transfers Growth
PROJECTED OPENINGS FOR IT OCCUPATIONS, 2018 TO 2028
Source: New Hampshire Employment Security, Long-Term Occupational Projections

New Hampshire Employment SecurityEconomic & Labor Market Information Bureau OCCUPATIONAL TRENDS | 27
Economic & Social Indicators for New Hampshire, 2015-2019 | VITAL SIGNS 20205
8 Holly, Robert, “Home Health Aides Feel Like ‘Replaceable Parts,’ Lack Agency Emotional Support.” Home Health Care News. https://homehealthcarenews.com/2018/08/home-health-aides-feel-like-replaceable-parts-lack- agency-emotional-support/.
that had a relatively low level of employment in the 2008 projections, but have had substantial growth in the last ten years and are projected to have high growth through 2028.
In 2008, there were approximately 3,500 personal and home care aides. With the 2010 revision of the Standard Occupational Classification (SOC), this occupation was redefined as personal care aides. These workers provide personal care and activities of daily living support to people impaired by illness or disabilities.
Home health aides may provide similar daily living assistance, but also are qualified to monitor an individual’s health status under the direction of licensed nursing staff, including taking blood pressure, temperature, and respiration rates and may help clients with prescribed exercise and medications. Currently, no occupational license is required in New Hampshire, but most workers are employed by a home care or hospice provider. This was a relatively small occupation with fewer than 600 employed in 2018, but is projected to grow by more than 40 percent through 2028.
Personal care aides have similar duties but are generally limited in scope to providing non-medical services such as cleaning, cooking, or providing transportation for clients. More than 9,000 workers were employed in this occupation in 2018. There will be job openings for more than 1,700 workers annually from 2018 to 2028, due to the need to replace workers in an occupation with high turnover due to low pay - an average of $13.71 per hour in 2020 - and high emotional demands.8 Demand for personal care aides will be driven by an aging population and the desire for families to rely on home care as an alternative to a long-term care facility.
Factors Influencing Occupational ChangeOccupational change occurs for many reasons— the need of an aging population for healthcare that is close to home and affordable is but one reason. These are some of the other factors driving occupational trends in the 2018 to 2028 projections:
Changes in business practices, emergence of new types of business, and changing consumer tastes will have a positive impact on several occupations through 2028. Market research analysts and marketing specialists (22.5 percent growth from 2018 to 2028) benefit from the increased use of large data sets and analytical processes to assist in business decision making. Increased participation in sports and physical activities into middle age and beyond, along with demand for sports programs in schools, has created need for more athletic trainers, with employment projected to increase from 2018 to 2028.
Industries expected to grow in New Hampshire include chemical manufacturing (16.1 percent increase from 2018 to 2028) and scientific research and development services (18.5 percent increase). These industries are the main employers of biological technicians, chemical technicians, and biochemists and biophysicists. While small in number, demand for these occupations is expected to grow through 2028.
– Michael Argiropolis

New Hampshire Employment SecurityEconomic & Labor Market Information Bureau28 | OCCUPATIONAL TRENDS
VITAL SIGNS 2020 | Economic & Social Indicators for New Hampshire, 2015-20195
New Hampshire Occupational Employment Projections 2018 - 2028 Average Annual Openings
SOC Code Occupational Group
2018
Bas
e
2028
Pr
ojec
ted
Num
eric
C
hang
e
Perc
ent
Cha
nge
Ann
ual
Gro
wth
Exits
Tran
sfer
s
Tota
l
Total, All Occupations 704,622 741,886 37,264 5.3% 0.5% 31,750 50,876 86,352
11-0000 Management Occupations 46,359 50,052 3,693 8.0% 0.8% 1,253 2,799 4,421
13-0000 Business and Financial Operations Occupations 30,830 33,254 2,424 7.9% 0.8% 889 2,144 3,275
15-0000 Computer and Mathematical Occupations 22,313 25,590 3,277 14.7% 1.4% 388 1,351 2,067
17-0000 Architecture and Engineering Occupations 14,584 15,948 1,364 9.4% 0.9% 363 833 1,332
19-0000 Life, Physical, and Social Science Occupations 4,412 4,929 517 11.7% 1.1% 88 362 502
21-0000 Community and Social Services Occupations 10,453 12,019 1,566 15.0% 1.4% 402 805 1,364
23-0000 Legal Occupations 3,993 4,294 301 7.5% 0.7% 107 174 311
25-0000 Education, Training, and Library Occupations 43,828 45,243 1,415 3.2% 0.3% 1,878 2,186 4,206
27-0000 Arts, Design, Entertainment, Sports, and Media Occupations 9,651 10,000 349 3.6% 0.4% 389 705 1,129
29-0000 Healthcare Practitioners and Technical Occupations 40,589 45,642 5,053 12.4% 1.2% 1,103 1,278 2,886
31-0000 Healthcare Support Occupations 17,514 19,743 2,229 12.7% 1.2% 939 1,179 2,341
33-0000 Protective Service Occupations 11,972 12,362 390 3.3% 0.3% 455 674 1,168
35-0000 Food Preparation and Serving Related Occupations 60,151 65,548 5,397 9.0% 0.9% 4,266 6,535 11,341
37-0000 Building and Grounds Cleaning and Maintenance Occupations 25,871 27,641 1,770 6.8% 0.7% 1,452 2,018 3,647
39-0000 Personal Care and Service Occupations 29,866 34,696 4,830 16.2% 1.5% 2,222 2,527 5,232
41-0000 Sales and Related Occupations 82,601 82,736 135 0.2% 0.0% 4,650 7,114 11,778
43-0000 Office and Administrative Support Occupations 111,142 109,841 -1,301 -1.2% -0.1% 5,461 7,626 12,957
45-0000 Farming, Fishing, and Forestry Occupations 1,850 1,851 1 0.1% 0.0% 73 227 300
47-0000 Construction and Extraction Occupations 25,621 27,892 2,271 8.9% 0.9% 868 2,064 3,159
49-0000 Installation, Maintenance, and Repair Occupations 26,223 27,689 1,466 5.6% 0.5% 833 1,810 2,790
51-0000 Production Occupations 46,975 45,275 -1,700 -3.6% -0.4% 1,838 3,508 5,176
53-0000 Transportation and Material Moving Occupations 37,824 39,641 1,817 4.8% 0.5% 1,832 2,959 4,973
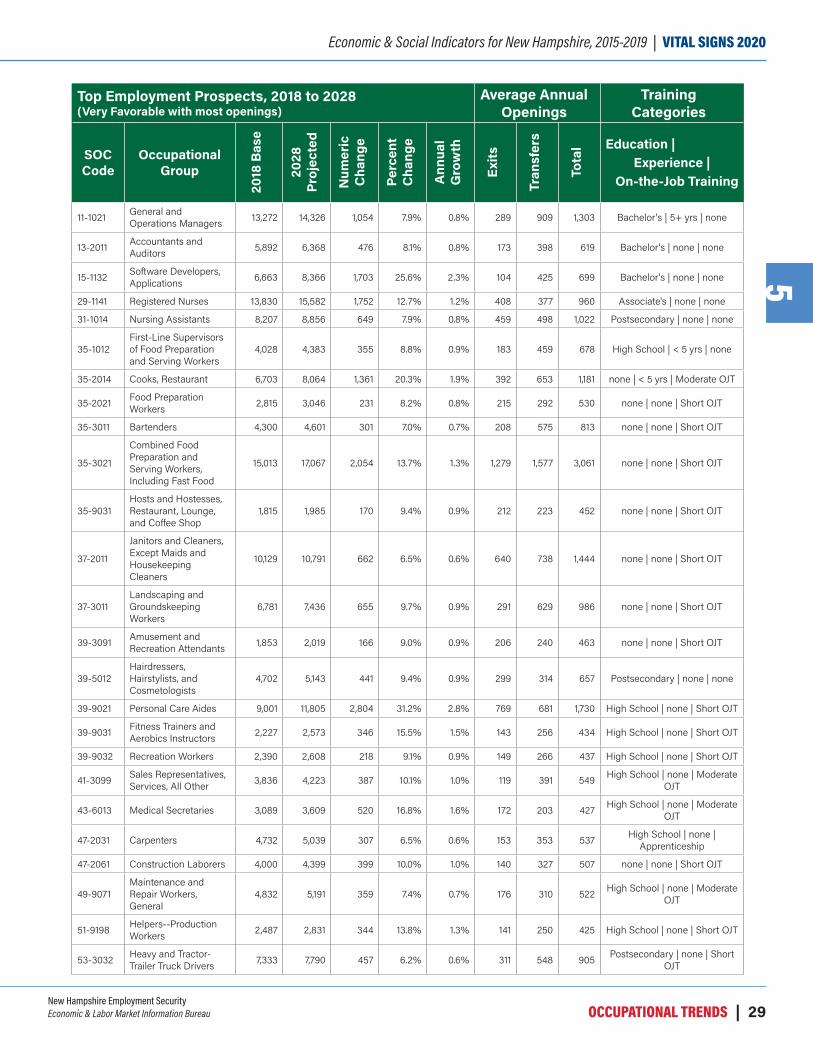
New Hampshire Employment SecurityEconomic & Labor Market Information Bureau OCCUPATIONAL TRENDS | 29
Economic & Social Indicators for New Hampshire, 2015-2019 | VITAL SIGNS 20205
Top Employment Prospects, 2018 to 2028 (Very Favorable with most openings)
Average Annual Openings
Training Categories
SOC Code
Occupational Group
2018
Bas
e
2028
Pr
ojec
ted
Num
eric
C
hang
e
Perc
ent
Cha
nge
Ann
ual
Gro
wth
Exits
Tran
sfer
s
Tota
l Education | Experience |
On-the-Job Training
11-1021 General and Operations Managers 13,272 14,326 1,054 7.9% 0.8% 289 909 1,303 Bachelor's | 5+ yrs | none
13-2011 Accountants and Auditors 5,892 6,368 476 8.1% 0.8% 173 398 619 Bachelor's | none | none
15-1132 Software Developers, Applications 6,663 8,366 1,703 25.6% 2.3% 104 425 699 Bachelor's | none | none
29-1141 Registered Nurses 13,830 15,582 1,752 12.7% 1.2% 408 377 960 Associate's | none | none
31-1014 Nursing Assistants 8,207 8,856 649 7.9% 0.8% 459 498 1,022 Postsecondary | none | none
35-1012First-Line Supervisors of Food Preparation and Serving Workers
4,028 4,383 355 8.8% 0.9% 183 459 678 High School | < 5 yrs | none
35-2014 Cooks, Restaurant 6,703 8,064 1,361 20.3% 1.9% 392 653 1,181 none | < 5 yrs | Moderate OJT
35-2021 Food Preparation Workers 2,815 3,046 231 8.2% 0.8% 215 292 530 none | none | Short OJT
35-3011 Bartenders 4,300 4,601 301 7.0% 0.7% 208 575 813 none | none | Short OJT
35-3021
Combined Food Preparation and Serving Workers, Including Fast Food
15,013 17,067 2,054 13.7% 1.3% 1,279 1,577 3,061 none | none | Short OJT
35-9031Hosts and Hostesses, Restaurant, Lounge, and Coffee Shop
1,815 1,985 170 9.4% 0.9% 212 223 452 none | none | Short OJT
37-2011
Janitors and Cleaners, Except Maids and Housekeeping Cleaners
10,129 10,791 662 6.5% 0.6% 640 738 1,444 none | none | Short OJT
37-3011Landscaping and Groundskeeping Workers
6,781 7,436 655 9.7% 0.9% 291 629 986 none | none | Short OJT
39-3091 Amusement and Recreation Attendants 1,853 2,019 166 9.0% 0.9% 206 240 463 none | none | Short OJT
39-5012Hairdressers, Hairstylists, and Cosmetologists
4,702 5,143 441 9.4% 0.9% 299 314 657 Postsecondary | none | none
39-9021 Personal Care Aides 9,001 11,805 2,804 31.2% 2.8% 769 681 1,730 High School | none | Short OJT
39-9031 Fitness Trainers and Aerobics Instructors 2,227 2,573 346 15.5% 1.5% 143 256 434 High School | none | Short OJT
39-9032 Recreation Workers 2,390 2,608 218 9.1% 0.9% 149 266 437 High School | none | Short OJT
41-3099 Sales Representatives, Services, All Other 3,836 4,223 387 10.1% 1.0% 119 391 549 High School | none | Moderate
OJT
43-6013 Medical Secretaries 3,089 3,609 520 16.8% 1.6% 172 203 427 High School | none | Moderate OJT
47-2031 Carpenters 4,732 5,039 307 6.5% 0.6% 153 353 537 High School | none | Apprenticeship
47-2061 Construction Laborers 4,000 4,399 399 10.0% 1.0% 140 327 507 none | none | Short OJT
49-9071Maintenance and Repair Workers, General
4,832 5,191 359 7.4% 0.7% 176 310 522 High School | none | Moderate OJT
51-9198 Helpers--Production Workers 2,487 2,831 344 13.8% 1.3% 141 250 425 High School | none | Short OJT
53-3032 Heavy and Tractor-Trailer Truck Drivers 7,333 7,790 457 6.2% 0.6% 311 548 905 Postsecondary | none | Short
OJT

New Hampshire Employment SecurityEconomic & Labor Market Information Bureau30 | OCCUPATIONAL TRENDS
VITAL SIGNS 2020 | Economic & Social Indicators for New Hampshire, 2015-20195
Occupations with the highest number of average annual openings, 2018 to 2028, by entry-level education
Average Annual Openings
SOC Code Occupational Group
2018
Bas
e
2028
Pr
ojec
ted
Num
eric
C
hang
e
Perc
ent
Cha
nge
Exits
Tran
sfer
s
Tota
l
Entry-level education: no formal educational credential
35-3021 Combined Food Preparation and Serving Workers, Including Fast Food 15,013 17,067 2,054 13.7% 1,279 1,577 3,061
35-3031 Waiters and Waitresses 12,923 13,628 705 5.5% 921 1,627 2,618
37-2011 Janitors and Cleaners, Except Maids and Housekeeping Cleaners 10,129 10,791 662 6.5% 640 738 1,444
41-2011 Cashiers 22,543 21,688 -855 -3.8% 1,974 2,198 4,086
41-2031 Retail Salespersons 24,912 24,632 -280 -1.1% 1,424 2,195 3,591
Entry-level education: High School Diploma or Equivalent
39-9021 Personal Care Aides 9,001 11,805 2,804 31.2% 769 681 1,730
43-4051 Customer Service Representatives 11,299 11,044 -255 -2.3% 536 952 1,462
43-5081 Stock Clerks and Order Fillers 14,031 14,568 537 3.8% 724 1,180 1,958
43-6014 Secretaries and Administrative Assistants, Except Legal, Medical, and Executive 12,130 11,138 -992 -8.2% 596 706 1,203
43-9061 Office Clerks, General 16,109 15,793 -316 -2.0% 892 1,018 1,878
Entry-level education: Some College, No Degree
15-1151 Computer User Support Specialists 3,266 3,610 344 10.5% 63 219 316
25-9041 Teacher Assistants 9,324 9,453 129 1.4% 498 491 1,002
43-3031 Bookkeeping, Accounting, and Auditing Clerks 8,636 8,437 -199 -2.3% 519 475 974
43-4151 Order Clerks 536 528 -8 -1.5% 22 39 60
49-2011 Computer, Automated Teller, and Office Machine Repairers 642 646 4 0.6% 18 50 68
Entry-level education: Postsecondary Non-Degree Award
31-1014 Nursing Assistants 8,207 8,856 649 7.9% 459 498 1,022
31-9092 Medical Assistants 2,577 3,128 551 21.4% 111 203 369
39-5012 Hairdressers, Hairstylists, and Cosmetologists 4,702 5,143 441 9.4% 299 314 657
49-3023 Automotive Service Technicians and Mechanics 4,092 4,178 86 2.1% 112 290 411
53-3032 Heavy and Tractor-Trailer Truck Drivers 7,333 7,790 457 6.2% 311 548 905
Entry-level education: Associate's Degree
23-2011 Paralegals and Legal Assistants 1,181 1,326 145 12.3% 42 91 147
25-2011 Preschool Teachers, Except Special Education 3,218 3,453 235 7.3% 132 203 359
29-1141 Registered Nurses 13,830 15,582 1,752 12.7% 408 377 960
29-2021 Dental Hygienists 1,380 1,520 140 10.1% 60 37 111
29-2056 Veterinary Technologists and Technicians 865 1,048 183 21.2% 28 50 96

New Hampshire Employment SecurityEconomic & Labor Market Information Bureau OCCUPATIONAL TRENDS | 31
Economic & Social Indicators for New Hampshire, 2015-2019 | VITAL SIGNS 20205
Occupations with the highest number of average annual openings, 2018 to 2028, by entry-level education (continued...)
Average Annual Openings
SOC Code Occupational Group
2018
Bas
e
2028
Pr
ojec
ted
Num
eric
C
hang
e
Perc
ent
Cha
nge
Exits
Tran
sfer
s
Tota
l
Entry-level education: Bachelor's Degree
11-1021 General and Operations Managers 13,272 14,326 1,054 7.9% 289 909 1,303
11-3031 Financial Managers 3,698 4,331 633 17.1% 87 223 373
13-2011 Accountants and Auditors 5,892 6,368 476 8.1% 173 398 619
15-1132 Software Developers, Applications 6,663 8,366 1,703 25.6% 104 425 699
25-2021 Elementary School Teachers, Except Special Education 5,577 5,608 31 0.6% 174 238 415
Entry-level education: Master's Degree
11-9032 Education Administrators, Elementary and Secondary School 1,458 1,479 21 1.4% 38 76 116
21-1012 Educational, Guidance, School, and Vocational Counselors 1,829 1,966 137 7.5% 62 133 209
25-4021 Librarians 963 1,006 43 4.5% 53 45 102
25-9031 Instructional Coordinators 967 1,029 62 6.4% 42 51 99
29-1171 Nurse Practitioners 1,170 1,520 350 29.9% 26 45 106
Entry-level education: Doctorate or Professional Degree
23-1011 Lawyers 2,304 2,459 155 6.7% 51 63 130
25-1011 Business Teachers, Postsecondary 568 657 89 15.7% 22 28 59
25-1071 Health Specialties Teachers, Postsecondary 742 896 154 20.8% 30 38 83
29-1069 Physicians and Surgeons, All Other 1,446 1,578 132 9.1% 25 19 57
29-1123 Physical Therapists 1,437 1,727 290 20.2% 29 37 95Source: New Hampshire Employment Security, Long-Term Occupational Projections; Updated: 4/22/2021
Prepared by: New Hampshire Employment Security, Economic and Labor Market Information Bureau
www.nhes.nh.gov/elmi | (603) 228-4124

New Hampshire Employment SecurityEconomic & Labor Market Information Bureau32 | PRIVATE ENTERPRISE
VITAL SIGNS 2020 | Economic & Social Indicators for New Hampshire, 2015-20196
PRIVATE ENTERPRISE
1 In firms by size data, “firms” are considered a single business entity regardless of the number of separate worksites and data for each firm includes all employment and wages paid for all worksites. For example, a firm with four locations in New Hampshire would be counted as one firm, with data for the four worksites summed. Thus, a firm with several worksites having low employment may be categorized into a larger size class when all worksite employment is summed.
2 Firms by Size 2020 Q1, Economic and Labor Market Information Bureau, NH Employment Security. 3 US Census Bureau, Nonemployer Statistics for the U.S., States, Counties, Metropolitan Areas, and Combined Statistical Areas, by Legal Form of Organization and Sales, Value of Shipments,
or Revenue Size for Selected Geographies, 2018. Table NS1800NOEMP. https://www.census.gov/programs-surveys/nonemployer-statistics.html4 Business Formation Statistics are an experimental data product of the U.S. Census Bureau developed in research collaboration with economists affiliated with Board of Governors of the
Federal Reserve System, Federal Reserve Bank of Atlanta, University of Maryland, and University of Notre Dame. https://www.census.gov/econ/bfs/index.html
New Hampshire is a state that prides itself on being a good place to do business. The state is home to businesses engaged in producing goods and providing services in every industry sector. The majority of New Hampshire business firms1 (95 percent) employ less than 50 workers; three-quarters of firms employ less than ten workers.2 Firms with less than 50 workers employed 229,833 workers in the first quarter of 2020, paying over $3.4 billion in total compensation, including bonuses, stock options, severance pay, profit distributions, the cash value of meals and lodging, tips and other gratuities.
New Hampshire has 31 firms with 1,000 or more workers, 23 of which were in three industry sectors: manufacturing, retail trade, and health care and social assistance. Altogether, establishments with 1,000 or more workers employed 82,318 workers in the first quarter of 2020, paying over $1.45 billion in total compensation.
In addition to business entities with employees, there are also a substantial number of businesses without paid employees or payroll. In 2018, there were 108,327 nonemployer establishments in New Hampshire, with a total of $6.4 billion in sales, value of shipments, or revenue.3 Nonemployer
establishments are defined as business entities subject to federal income taxes, and having receipts of $1,000 or more during the calendar year ($1 or more for the construction sector.)
Census Business Formation StatisticsA new, experimental data product from the U.S. Census Bureau, Business Formation Statistics4 are a measure of business applications based on applications for an Employer Identification Number (EIN). According to the Census Bureau, the series provides data on actual and projected business formations originating from business applications based on the record of first payroll tax liability for an EIN. Business formation data include: Business Applications: The core business
applications series that corresponds to a subset of all EIN applications. Includes all applications for an EIN, except for applications for tax liens, estates, trusts, or certain financial filings, applications with no state-county geocodes, applications from certain agricultural and public administration entities that have low transition rates, and applications in certain industries (e.g. private households, civic and social organizations).
High-Propensity Business Applications: A subset of business applications that contains all applications with a high-propensity of turning into a business with a payroll, based on various factors.
Business Applications with Planned Wages: A subset of high-propensity business applications containing all applications that indicate a planned date for paying wages.
Business Applications from Corporations: A subset of high-propensity business applications that contains all applications that come from a corporation or a personal service corporation.
0
50
100
150
200
250
300
350
1 3 5 7 9 11 13 15 17 19 21 23 25 27 29 31 33 35 37 39 41 43 45 47 49 51week
New Hampshire Business Applications
2019 2020
NEW HAMPSHIRE BUSINESS APPLICATIONS
Source: Business Fomation Statistics. U.S. Census Bureau
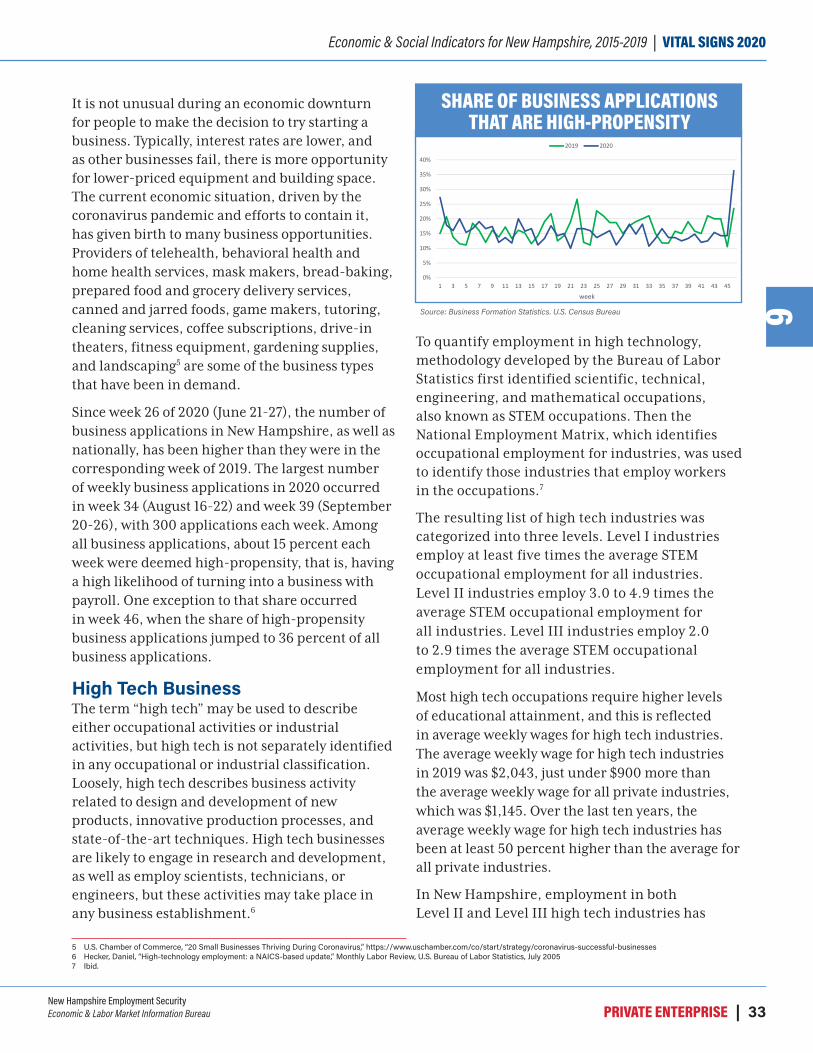
New Hampshire Employment SecurityEconomic & Labor Market Information Bureau PRIVATE ENTERPRISE | 33
Economic & Social Indicators for New Hampshire, 2015-2019 | VITAL SIGNS 20206
5 U.S. Chamber of Commerce, “20 Small Businesses Thriving During Coronavirus,” https://www.uschamber.com/co/start/strategy/coronavirus-successful-businesses6 Hecker, Daniel, “High-technology employment: a NAICS-based update,” Monthly Labor Review, U.S. Bureau of Labor Statistics, July 20057 Ibid.
It is not unusual during an economic downturn for people to make the decision to try starting a business. Typically, interest rates are lower, and as other businesses fail, there is more opportunity for lower-priced equipment and building space. The current economic situation, driven by the coronavirus pandemic and efforts to contain it, has given birth to many business opportunities. Providers of telehealth, behavioral health and home health services, mask makers, bread-baking, prepared food and grocery delivery services, canned and jarred foods, game makers, tutoring, cleaning services, coffee subscriptions, drive-in theaters, fitness equipment, gardening supplies, and landscaping5 are some of the business types that have been in demand.
Since week 26 of 2020 (June 21-27), the number of business applications in New Hampshire, as well as nationally, has been higher than they were in the corresponding week of 2019. The largest number of weekly business applications in 2020 occurred in week 34 (August 16-22) and week 39 (September 20-26), with 300 applications each week. Among all business applications, about 15 percent each week were deemed high-propensity, that is, having a high likelihood of turning into a business with payroll. One exception to that share occurred in week 46, when the share of high-propensity business applications jumped to 36 percent of all business applications.
High Tech BusinessThe term “high tech” may be used to describe either occupational activities or industrial activities, but high tech is not separately identified in any occupational or industrial classification. Loosely, high tech describes business activity related to design and development of new products, innovative production processes, and state-of-the-art techniques. High tech businesses are likely to engage in research and development, as well as employ scientists, technicians, or engineers, but these activities may take place in any business establishment.6
To quantify employment in high technology, methodology developed by the Bureau of Labor Statistics first identified scientific, technical, engineering, and mathematical occupations, also known as STEM occupations. Then the National Employment Matrix, which identifies occupational employment for industries, was used to identify those industries that employ workers in the occupations.7
The resulting list of high tech industries was categorized into three levels. Level I industries employ at least five times the average STEM occupational employment for all industries. Level II industries employ 3.0 to 4.9 times the average STEM occupational employment for all industries. Level III industries employ 2.0 to 2.9 times the average STEM occupational employment for all industries.
Most high tech occupations require higher levels of educational attainment, and this is reflected in average weekly wages for high tech industries. The average weekly wage for high tech industries in 2019 was $2,043, just under $900 more than the average weekly wage for all private industries, which was $1,145. Over the last ten years, the average weekly wage for high tech industries has been at least 50 percent higher than the average for all private industries.
In New Hampshire, employment in both Level II and Level III high tech industries has
0%
5%
10%
15%
20%
25%
30%
35%
40%
1 3 5 7 9 11 13 15 17 19 21 23 25 27 29 31 33 35 37 39 41 43 45week
Share of Business Applications that are High-Propensity
2019 2020
SHARE OF BUSINESS APPLICATIONS THAT ARE HIGH-PROPENSITY
Source: Business Formation Statistics. U.S. Census Bureau

New Hampshire Employment SecurityEconomic & Labor Market Information Bureau34 | PRIVATE ENTERPRISE
VITAL SIGNS 2020 | Economic & Social Indicators for New Hampshire, 2015-20196
increased since 2010, growing by 7.4 percent and 9.0 percent, respectively. Employment in Level I industries, however, has increased much more rapidly, growing by 34.8 percent between 2010 and 2019. In comparison, total private employment in New Hampshire grew by 13.1 percent over the same time period. In 2019, high tech employment represented about 13 percent of total private employment.
– Katrina Evans
$0
$500
$1,000
$1,500
$2,000
$2,500
2010 2011 2012 2013 2014 2015 2016 2017 2018 2019
Average Weekly Wage(not adjusted for inflation)
Total Private High Tech
AVERAGE WEEKLY WAGE (not adjusted for inflation)
Source: ELMI, NH Employment Security, Quarterly Census of Employment and Wages
05,000
10,00015,00020,00025,00030,00035,00040,00045,00050,000
2010 2011 2012 2013 2014 2015 2016 2017 2018 2019
Average Employment, High Tech Industries
Level I Level II Level III
AVERAGE EMPLOYMENT, HIGH TECH INDUSTRIES
Source: ELMI, NH Employment Security, Quarterly Census of Employment and Wages

New Hampshire Employment SecurityEconomic & Labor Market Information Bureau PRIVATE ENTERPRISE | 35
Economic & Social Indicators for New Hampshire, 2015-2019 | VITAL SIGNS 20206
FIRMS BY SIZE* 2016 2017 2018 2019 2020Total Number of Firms with employment 36,218 36,617 37,092 37,704 38,180
1 - 4 employees 21,276 21,539 21,921 22,270 22,7855 - 9 employees 6,342 6,373 6,318 6,445 6,37210 - 19 employees 4,063 4,101 4,159 4,271 4,32720 - 49 employees 2,791 2,833 2,910 2,891 2,87750 - 99 employees 979 976 979 1,019 1,007100 - 249 employees 506 528 537 540 536250 - 499 employees 161 164 171 168 177500 - 999 employees 71 72 67 68 681,000 & over employees 29 31 30 32 31
Over-the-year Change in Number of Firms 651 399 475 612 476
Net Annual Change in Number of Employees 11,455 8,350 4,874 7,576 1,6621 - 4 employees 528 210 774 392 6785 - 9 employees 121 196 -270 746 -63310 - 19 employees 1,286 435 722 1,483 81020 - 49 employees 2,128 1,000 2,728 -41 -63650 - 99 employees 3,708 -511 12 2,722 -784100 - 249 employees 2,424 2,955 1,066 1,478 -566250 - 499 employees -527 391 3,104 -1,887 2,342500 - 999 employees -1,169 888 -1,957 -236 651,000 & over employees 2,956 2,786 -1,305 2,919 386
Percent of Total Employment1 - 4 employees 7.3% 7.3% 7.3% 7.3% 7.4%5 - 9 employees 7.7% 7.6% 7.5% 7.5% 7.4%10 - 19 employees 10.1% 10.0% 10.0% 10.1% 10.3%20 - 49 employees 15.4% 15.3% 15.7% 15.4% 15.3%50 - 99 employees 12.4% 12.1% 12.0% 12.3% 12.2%100 - 249 employees 14.0% 14.3% 14.4% 14.5% 14.3%250 - 499 employees 10.3% 10.3% 10.7% 10.3% 10.6%500 - 999 employees 8.6% 8.6% 8.2% 8.1% 8.0%1,000 & over employees 13.9% 14.2% 14.5% 14.1% 14.5%
* Firms by size numbers are based on March covered employment data, in each calendar year.
Source: New Hampshire Employment Security, ELMI. Last Update 9/22/2020
FIRMS SUBJECT TO UNEMPLOYMENT COMPENSATION 2015 2016 2017 2018 2019
Total Firms 42,020 42,478 43,118 43,720 44,616New firms 5,436 5,509 5,687 6,060 6,033Terminated firms 4,744 4,943 4,941 5,319 5,013
Source: New Hampshire Employment Security. Last Update 9/29/2020

New Hampshire Employment SecurityEconomic & Labor Market Information Bureau36 | PRIVATE ENTERPRISE
VITAL SIGNS 2020 | Economic & Social Indicators for New Hampshire, 2015-20196
PERCENT OF ESTABLISHMENTS WITH 100+ WORKERS (Ranked from highest among 50 states and D.C.)
2015 2016 2017 2018 2019
New Hampshire 2.3% 2.4% 2.3% 2.3%United States rank 27 26 29 30
Connecticut 2.6% 2.7% 2.7% 2.7%United States rank 12 11 11 15
MAINE 1.8% 1.8% 1.7% 1.7%United States rank 46 45 46 47
Massachusetts 2.8% 2.9% 2.9% 2.9%United States rank 5 5 6 6
Rhode Island 2.3% 2.3% 2.3% 2.3%United States rank 29 27 30 27
Vermont 1.7% 1.7% 1.6% 1.6%United States rank 47 47 48 48
Source: County to County Business Patterns, U.S. Census Bureau, ELMI Analysis. Last Update 9/23/2020
HIGH TECH BY NAICS 2015 2016 2017 2018 2019Total Units 5,606 5,705 5,819 6,363 6,782Level I Units 3,282 3,368 3,441 3,750 4,091Level II Units 1,386 1,398 1,442 1,652 1,792Level III Units 939 939 936 961 899
Total Annual Average Employment 66,422 67,154 71,114 73,701 74,927Level I Annual Average Employment 38,391 39,061 42,751 44,568 45,967Level II Annual Average Employment 12,162 12,026 12,069 12,661 13,033Level III Annual Average Employment 15,869 16,067 16,294 16,472 15,927
Total Wages (in millions) $6,342.9 $6,487.1 $7,159.3 $7,571.9 $7,959.5Level I Wages $3,766.6 $3,895.9 $4,465.7 $4,791.4 $5,067.1Level II Wages $1,144.7 $1,150.0 $1,179.5 $1,291.6 $1,362.0Level III Wages $1,431.7 $1,441.3 $1,514.1 $1,488.9 $1,530.4
Average Weekly Wage $1,836 $1,858 $1,936 $1,976 $2,043Level I Average Weekly Wage $1,887 $1,918 $2,009 $2,067 $2,120Level II Average Weekly Wage $1,810 $1,839 $1,879 $1,962 $2,010Level III Average Weekly Wage $1,735 $1,725 $1,787 $1,738 $1,848
Definitions of High Tech Level I, Level II, and Level III can be found at: http://www.nhes.nh.gov/elmi/products/documents/ec-high-tech-10.pdf
Source: New Hampshire Employment Security, ELMI. Last Update 9/23/2020
NON-CURRENT LOANS AND LEASES ($ Millions) 2015 2016 2017 2018 2019
FDIC commercial banks, Dec. 31st totals (Millions) $17 $11 $8 $13 $9Percent change from previous year -14.0% -30.9% -34.2% 65.4% -32.0%Source: Federal Deposit Insurance Corporation, ELMI Analysis. Last Update 9/23/2020
Prepared by: New Hampshire Employment Security, Economic and Labor Market Information Bureau
www.nhes.nh.gov/elmi | (603) 228-4124

New Hampshire Employment SecurityEconomic & Labor Market Information Bureau TRANSPORTATION & TRAFFIC | 37
Economic & Social Indicators for New Hampshire, 2015-2019 | VITAL SIGNS 20207
TRANSPORTATION AND TRAFFIC
1 New Hampshire Department of Transportation, 1999-2019 20-Year Growth Data, https://www.nh.gov/dot/org/operations/traffic/documents.htm. 2 Poovey, Jason, Human Mobility and COVID-19 Transmission Dashboard, https://public.tableau.com/profile/jason.poovey#!/vizhome/MobilityDashboardPublic/MobilityDashboard.
Driver’s Licenses and Motor Vehicle RegistrationsNew Hampshire drivers held 1,161,665 driver’s licenses in 2018. This includes drivers who hold more than one type of license, such as a commercial or motorcycle license, in addition to a standard license. The number of licenses increased by nearly 90,000 from 2014 to 2018, faster than overall population growth, which increased by only 20,000 over the same time period.
Younger residents have become less likely to get driver’s licenses. While New Hampshire’s age 15 to 19 population declined by less than 1,000 from 2014 to 2018, the number of licenses held by drivers age 19 and under decreased by 9,200. At the other end of the age spectrum, the number of active licenses for drivers age 65 and over increased by 79,000 from 2014 to 2018. Population over age 65 increased by 36,000 from 2014 to 2018.
Motor vehicle registrations increased from 1,310,000 in 2014 to 1,346,000 in 2018. Registration of light trucks, which include minivans and SUVs, increased by 85,000 over that time, while the number of automobiles decreased by 52,000.
Motorcycle and bus registrations increased by 2,900 and 230, respectively.
Traffic VolumeTraffic volume declined in the southwestern region of the state by less than 0.1 percent in 2019.1 In all other regions of New Hampshire, traffic volume increased by between 1.0 and 2.4 percent. Traffic levels have gradually increased since the Great Recession, but this trend is expected to stop in 2020. As a result of the coronavirus pandemic, thousands of New Hampshire residents who used to commute every day worked from home, and thousands more were out of work. As a result, workplace-related traffic decreased. Workplace-related travel in April dropped by as much as 51 percent, after a stay-at-home order was issued in late March.2 Workplace travel increased throughout 2020, but by October, workplace-related travel during the week was still down roughly 25 percent.
Other reasons for travel dropped as well. Retail and recreation-related travel fell by more than 40 percent in April, although it returned to roughly
- 20,000 40,000 60,000 80,000
100,000 120,000 140,000 160,000 180,000
Monthly Passenger Traffic at Manchester Airport
2018 2019 2020
MONTHLY PASSENGER TRAFFIC AT MANCHESTER AIRPORT
Source: Manchester-Boston Regional Airport, Passenger and Cargo Statistics
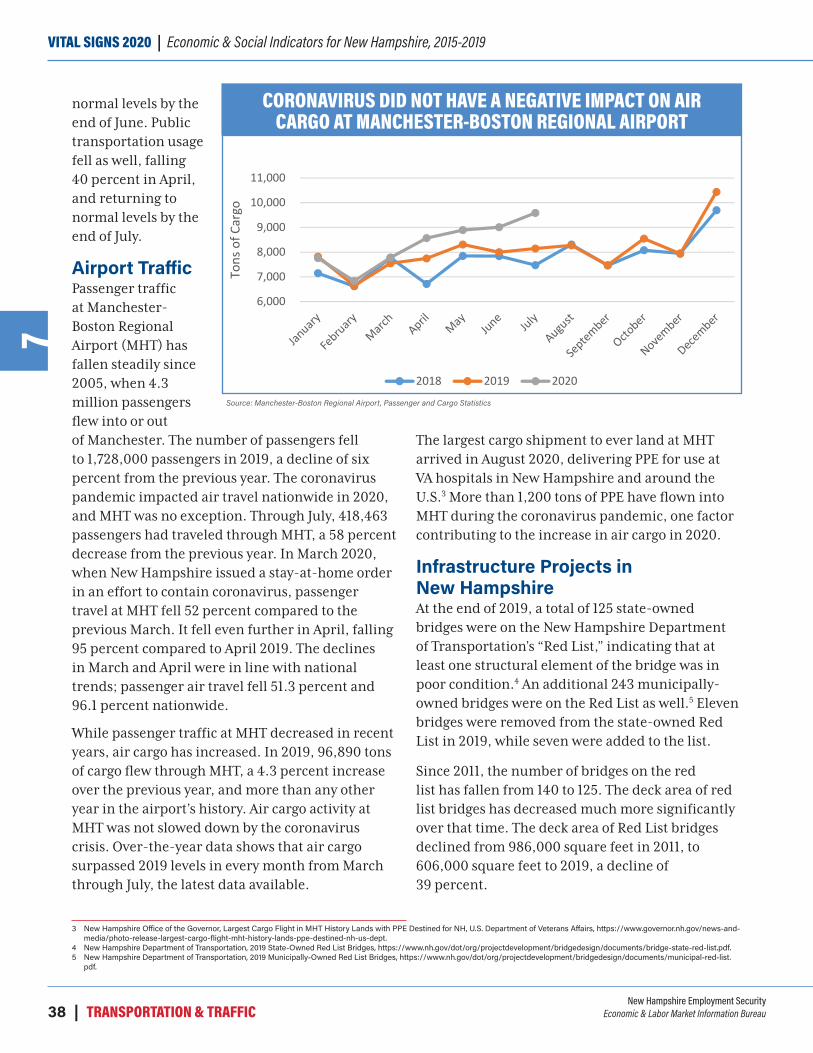
New Hampshire Employment SecurityEconomic & Labor Market Information Bureau38 | TRANSPORTATION & TRAFFIC
VITAL SIGNS 2020 | Economic & Social Indicators for New Hampshire, 2015-20197
3 New Hampshire Office of the Governor, Largest Cargo Flight in MHT History Lands with PPE Destined for NH, U.S. Department of Veterans Affairs, https://www.governor.nh.gov/news-and-media/photo-release-largest-cargo-flight-mht-history-lands-ppe-destined-nh-us-dept.
4 New Hampshire Department of Transportation, 2019 State-Owned Red List Bridges, https://www.nh.gov/dot/org/projectdevelopment/bridgedesign/documents/bridge-state-red-list.pdf.5 New Hampshire Department of Transportation, 2019 Municipally-Owned Red List Bridges, https://www.nh.gov/dot/org/projectdevelopment/bridgedesign/documents/municipal-red-list.
pdf.
normal levels by the end of June. Public transportation usage fell as well, falling 40 percent in April, and returning to normal levels by the end of July.
Airport TrafficPassenger traffic at Manchester-Boston Regional Airport (MHT) has fallen steadily since 2005, when 4.3 million passengers flew into or out of Manchester. The number of passengers fell to 1,728,000 passengers in 2019, a decline of six percent from the previous year. The coronavirus pandemic impacted air travel nationwide in 2020, and MHT was no exception. Through July, 418,463 passengers had traveled through MHT, a 58 percent decrease from the previous year. In March 2020, when New Hampshire issued a stay-at-home order in an effort to contain coronavirus, passenger travel at MHT fell 52 percent compared to the previous March. It fell even further in April, falling 95 percent compared to April 2019. The declines in March and April were in line with national trends; passenger air travel fell 51.3 percent and 96.1 percent nationwide.
While passenger traffic at MHT decreased in recent years, air cargo has increased. In 2019, 96,890 tons of cargo flew through MHT, a 4.3 percent increase over the previous year, and more than any other year in the airport’s history. Air cargo activity at MHT was not slowed down by the coronavirus crisis. Over-the-year data shows that air cargo surpassed 2019 levels in every month from March through July, the latest data available.
The largest cargo shipment to ever land at MHT arrived in August 2020, delivering PPE for use at VA hospitals in New Hampshire and around the U.S.3 More than 1,200 tons of PPE have flown into MHT during the coronavirus pandemic, one factor contributing to the increase in air cargo in 2020.
Infrastructure Projects in New HampshireAt the end of 2019, a total of 125 state-owned bridges were on the New Hampshire Department of Transportation’s “Red List,” indicating that at least one structural element of the bridge was in poor condition.4 An additional 243 municipally-owned bridges were on the Red List as well.5 Eleven bridges were removed from the state-owned Red List in 2019, while seven were added to the list.
Since 2011, the number of bridges on the red list has fallen from 140 to 125. The deck area of red list bridges has decreased much more significantly over that time. The deck area of Red List bridges declined from 986,000 square feet in 2011, to 606,000 square feet to 2019, a decline of 39 percent.
6,000
7,000
8,000
9,000
10,000
11,000
Tons
of C
argo
Coronavirus Did Not Have a Negative Impact on Air Cargo at Manchester-Boston Regional Airport
2018 2019 2020
CORONAVIRUS DID NOT HAVE A NEGATIVE IMPACT ON AIR CARGO AT MANCHESTER-BOSTON REGIONAL AIRPORT
Source: Manchester-Boston Regional Airport, Passenger and Cargo Statistics
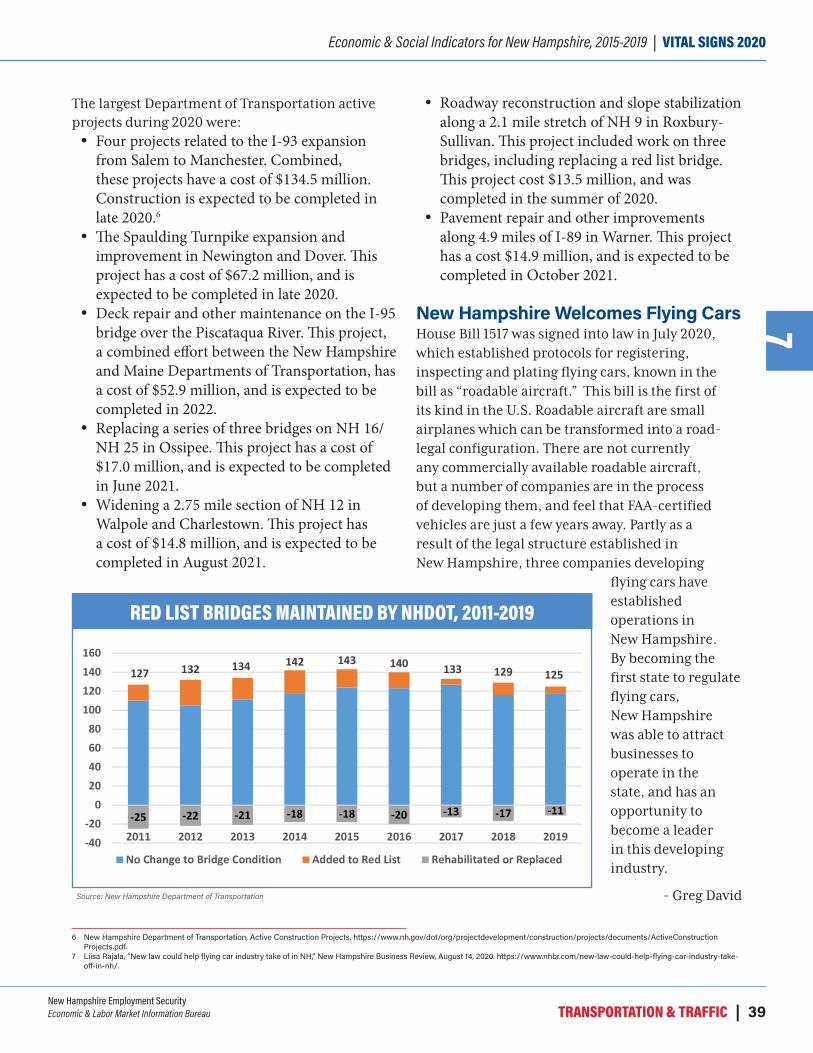
New Hampshire Employment SecurityEconomic & Labor Market Information Bureau TRANSPORTATION & TRAFFIC | 39
Economic & Social Indicators for New Hampshire, 2015-2019 | VITAL SIGNS 20207
6 New Hampshire Department of Transportation, Active Construction Projects, https://www.nh.gov/dot/org/projectdevelopment/construction/projects/documents/ActiveConstruction Projects.pdf.
7 Liisa Rajala, “New law could help flying car industry take of in NH,” New Hampshire Business Review, August 14, 2020. https://www.nhbr.com/new-law-could-help-flying-car-industry-take-off-in-nh/.
The largest Department of Transportation active projects during 2020 were: Four projects related to the I-93 expansion
from Salem to Manchester. Combined, these projects have a cost of $134.5 million. Construction is expected to be completed in late 2020.6
The Spaulding Turnpike expansion and improvement in Newington and Dover. This project has a cost of $67.2 million, and is expected to be completed in late 2020.
Deck repair and other maintenance on the I-95 bridge over the Piscataqua River. This project, a combined effort between the New Hampshire and Maine Departments of Transportation, has a cost of $52.9 million, and is expected to be completed in 2022.
Replacing a series of three bridges on NH 16/NH 25 in Ossipee. This project has a cost of $17.0 million, and is expected to be completed in June 2021.
Widening a 2.75 mile section of NH 12 in Walpole and Charlestown. This project has a cost of $14.8 million, and is expected to be completed in August 2021.
Roadway reconstruction and slope stabilization along a 2.1 mile stretch of NH 9 in Roxbury-Sullivan. This project included work on three bridges, including replacing a red list bridge. This project cost $13.5 million, and was completed in the summer of 2020.
Pavement repair and other improvements along 4.9 miles of I-89 in Warner. This project has a cost $14.9 million, and is expected to be completed in October 2021.
New Hampshire Welcomes Flying CarsHouse Bill 1517 was signed into law in July 2020, which established protocols for registering, inspecting and plating flying cars, known in the bill as “roadable aircraft.” This bill is the first of its kind in the U.S. Roadable aircraft are small airplanes which can be transformed into a road-legal configuration. There are not currently any commercially available roadable aircraft, but a number of companies are in the process of developing them, and feel that FAA-certified vehicles are just a few years away. Partly as a result of the legal structure established in New Hampshire, three companies developing
flying cars have established operations in New Hampshire. By becoming the first state to regulate flying cars, New Hampshire was able to attract businesses to operate in the state, and has an opportunity to become a leader in this developing industry.
- Greg David
127 132 134 142 143 140 133 129 125
-25 -22 -21 -18 -18 -20 -13 -17 -11
-40-20
020406080
100120140160
2011 2012 2013 2014 2015 2016 2017 2018 2019
Red List Bridges Maintained by NHDOT, 2011-2019
No Change to Bridge Condition Added to Red List Rehabilitated or Replaced
RED LIST BRIDGES MAINTAINED BY NHDOT, 2011-2019
Source: New Hampshire Department of Transportation
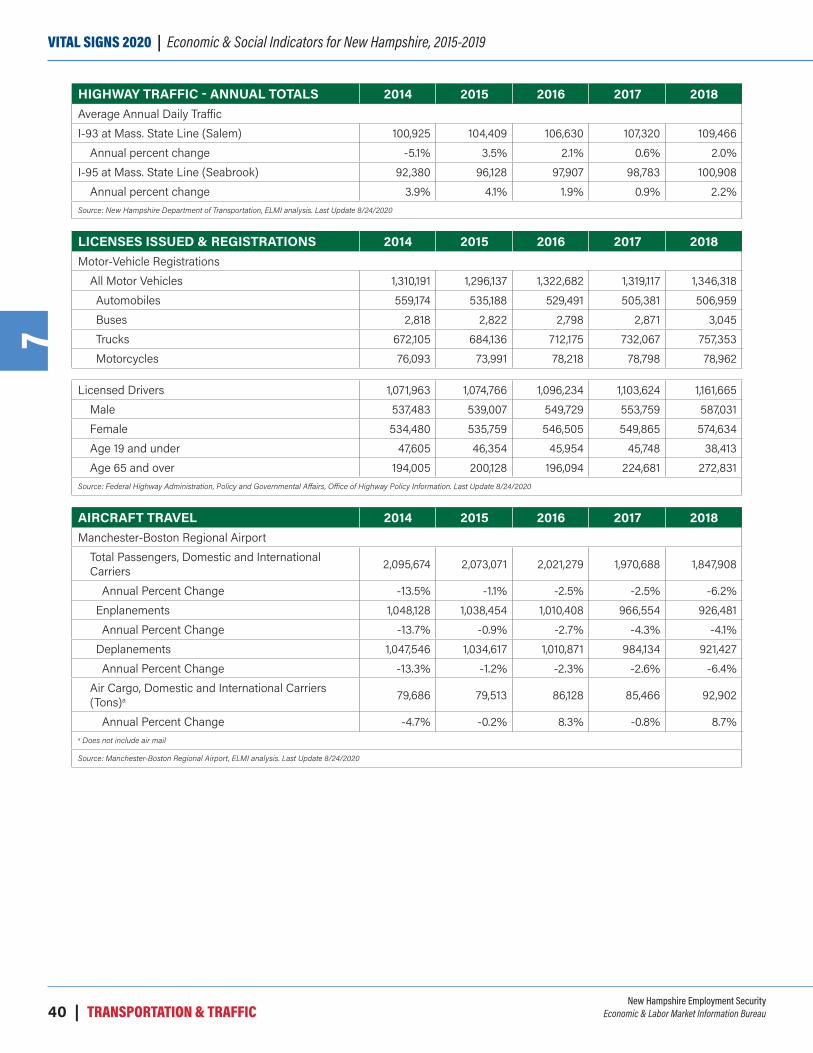
New Hampshire Employment SecurityEconomic & Labor Market Information Bureau40 | TRANSPORTATION & TRAFFIC
VITAL SIGNS 2020 | Economic & Social Indicators for New Hampshire, 2015-20197
HIGHWAY TRAFFIC - ANNUAL TOTALS 2014 2015 2016 2017 2018Average Annual Daily TrafficI-93 at Mass. State Line (Salem) 100,925 104,409 106,630 107,320 109,466
Annual percent change -5.1% 3.5% 2.1% 0.6% 2.0%I-95 at Mass. State Line (Seabrook) 92,380 96,128 97,907 98,783 100,908
Annual percent change 3.9% 4.1% 1.9% 0.9% 2.2%Source: New Hampshire Department of Transportation, ELMI analysis. Last Update 8/24/2020
LICENSES ISSUED & REGISTRATIONS 2014 2015 2016 2017 2018Motor-Vehicle Registrations
All Motor Vehicles 1,310,191 1,296,137 1,322,682 1,319,117 1,346,318 Automobiles 559,174 535,188 529,491 505,381 506,959 Buses 2,818 2,822 2,798 2,871 3,045 Trucks 672,105 684,136 712,175 732,067 757,353 Motorcycles 76,093 73,991 78,218 78,798 78,962
Licensed Drivers 1,071,963 1,074,766 1,096,234 1,103,624 1,161,665 Male 537,483 539,007 549,729 553,759 587,031 Female 534,480 535,759 546,505 549,865 574,634 Age 19 and under 47,605 46,354 45,954 45,748 38,413 Age 65 and over 194,005 200,128 196,094 224,681 272,831
Source: Federal Highway Administration, Policy and Governmental Affairs, Office of Highway Policy Information. Last Update 8/24/2020
AIRCRAFT TRAVEL 2014 2015 2016 2017 2018Manchester-Boston Regional Airport
Total Passengers, Domestic and International Carriers 2,095,674 2,073,071 2,021,279 1,970,688 1,847,908
Annual Percent Change -13.5% -1.1% -2.5% -2.5% -6.2%Enplanements 1,048,128 1,038,454 1,010,408 966,554 926,481Annual Percent Change -13.7% -0.9% -2.7% -4.3% -4.1%
Deplanements 1,047,546 1,034,617 1,010,871 984,134 921,427Annual Percent Change -13.3% -1.2% -2.3% -2.6% -6.4%
Air Cargo, Domestic and International Carriers (Tons)a 79,686 79,513 86,128 85,466 92,902
Annual Percent Change -4.7% -0.2% 8.3% -0.8% 8.7%a Does not include air mail
Source: Manchester-Boston Regional Airport, ELMI analysis. Last Update 8/24/2020

New Hampshire Employment SecurityEconomic & Labor Market Information Bureau TRANSPORTATION & TRAFFIC | 41
Economic & Social Indicators for New Hampshire, 2015-2019 | VITAL SIGNS 20207
PORTSMOUTH HARBOR FREIGHT TRAFFIC 2014 2015 2016 2017 2018Total (thousands of short tons) 2,803 2,788 2,353 2,627 2,869
Annual percent change 4.6% -0.5% -15.6% 11.6% 9.2%Domestic 488 475 365 386 689
Annual percent change -5.7% -2.6% -23.2% 5.7% 78.5%Foreign Imports 2,144 2,306 1,959 2,240 2,179
Annual percent change 7.0% 7.5% -15.1% 14.4% -2.7%Foreign Exports 171 7 29 1 0
Annual percent change 8.4% -96.1% 344.1% -96.6% -100.0%Source: US Army Corp of Engineers - Navigational Data Center, ELMI analysis. Last Update 8/24/2020
Prepared by: New Hampshire Employment Security, Economic and Labor Market Information Bureau
www.nhes.nh.gov/elmi | (603) 228-4124

New Hampshire Employment SecurityEconomic & Labor Market Information Bureau42 | ENERGY
VITAL SIGNS 2020 | Economic & Social Indicators for New Hampshire, 2015-20198
ENERGY
1 U.S. Census Bureau, Building Permits Survey, https://www.census.gov/construction/bps/stateannual.html2 U.S. Energy Information Administration, Use of Energy Explained. https://www.eia.gov/energyexplained/use-of-energy/homes.php3 The industrial sector includes manufacturing, construction, agriculture, forestry, fishing and hunting, and mining, including oil and gas extraction. Sector output is measured by GDP, using
chained 2012 dollars.
Energy Usage and Production in New Hampshire
Energy Consumption Total energy consumption in New Hampshire increased in 2018 by 2.4 percent over the previous year. After reaching a high point in 2005, when users consumed 331.1 trillion BTUs of energy, energy consumption fell, due to a combination of improved energy efficiency measures and decreased economic activity during the Great Recession. Energy consumption in 2018 was 324.7 trillion BTUs, the highest since 2006.
While overall energy consumption has increased since 2012, not every sector of New Hampshire’s economy has increased energy usage in recent years. Compared to 2007 levels, energy consumption in the Industrial and Transportation sectors decreased, both by roughly four percent. Commercial energy consumption increased by five percent from 2007 to 2018. Residential energy consumption was the largest contributor to the increase in New Hampshire’s energy consumption, increasing by 19 percent from 2007 to 2018. Part of this increase is a result of population growth and an increase in the number of housing units in the state.
New Hampshire’s population increased by 4.5 percent from 2005 to 2012, and housing stock increased by seven percent.1 Increased demand for appliances, air conditioners, and electronic devices (phones, tablets, etc.) also contributed to the increase in overall residential energy consumption.2
Retail Sales of ElectricityTotal retail electricity sales in New Hampshire peaked in 2005, at 11.3 billion kWh, and have fallen slightly since then. Electricity sales in 2019 were 10.7 billion kWh, a decrease of 3.2 percent from 2018 levels. While overall electricity sales fell, residential electricity sales increased since 2005, reaching a high of 4.6 billion kWh in 2018. Residential electricity sales fell 3.0 percent from 2018 to 2019, but remain slightly above 2005 levels.
Electricity sales in the Commercial and Industrial sectors have decreased since 2005. Commercial electricity fell 6.1 percent from 2005 to 2019, from 4.6 billion kWh to 4.3 billion kWh.
Industrial electricity sales fell 12 percent, part of a trend of falling industrial electricity sales dating back to 2000. Part of this decline was related to a decline in overall industrial sector output3 in New Hampshire, which decreased by 16 percent between 2004 and 2009. Since 2009, industrial sector GDP increased by 34 percent,
0
20
40
60
80
100
120
2004 2005 2006 2007 2008 2009 2010 2011 2012 2013 2014 2015 2016 2017 2018
Trill
ions
of B
TUs
Energy Consumption by Sector
Residential Commercial Industrial Transportation
ENERGY CONSUMPTION BY SECTOR
Source: U.S. Energy Information Administration

New Hampshire Employment SecurityEconomic & Labor Market Information Bureau ENERGY | 43
Economic & Social Indicators for New Hampshire, 2015-2019 | VITAL SIGNS 20208
4 U.S. Energy Information Administration, Short-Term Energy Outlook. https://www.eia.gov/outlooks/steo/report/5 New Hampshire Public Utilities Commission, Electric Renewable Portfolio Standard, https://www.puc.nh.gov/Sustainable%20Energy/Renewable_Portfolio_Standard_Program.htm6 Hydroelectric power is not considered renewable in comparing Renewable Portfolio Standards because there is not a universal definition that would allow for comparison across states.
while electricity sales grew by just four percent. Industrial electricity sales fell in 2017 and 2019, even as industrial sector GDP increased by ten percent over that time.
The U.S. Energy Information Administration (EIA) expects overall electricity consumption to fall 2.2 percent in 2020.4 Commercial and Industrial sales are expected to fall by around six percent each, while residential consumption is expected to increase by 3.2 percent.
The coronavirus pandemic had a significant impact on this shift in electricity consumption; the decline of overall economic activity, and a shift to more people working and going to school from home caused commercial and industrial electricity consumption to decrease, while causing residential consumption to rise.
Electricity GenerationPower producers in New Hampshire generate more electricity than customers in the state consume. In 2019, electricity consumers in New Hampshire purchased 10.7 billion kWh of electricity, while 18.0 billion kWh were generated.
New Hampshire belongs to Independent System Operator-New England (ISO-NE) a New England-wide network that distributes electricity throughout the region. Electricity that is not used
in New Hampshire is distributed to other users throughout New England.
The amount of electricity generated in New Hampshire was five percent higher in 2019 than in the previous year, although it has fallen about one quarter since 2005. Nuclear power produced 61 percent of electricity generated in New Hampshire. The amount of electricity generated by nuclear power has remained fairly constant over the last 20 years, but this has accounted for a larger percentage of the total generated, as the total amount of electricity generated in New Hampshire deceased. Electricity generated from coal, natural gas, and petroleum have all declined as New Hampshire gradually moves towards an electrical generation system that is less dependent on fossil fuels.
Renewable Portfolio StandardA renewable portfolio standard (RPS) is a regulatory mandate to use renewable energy sources for a certain percentage of total energy production. New Hampshire’s RPS mandates that electricity providers must obtain 25.2 percent of electricity supplied to New Hampshire consumers from renewable energy sources by 2025, including at least 0.7 percent from solar.5 This goal also includes 9.5 percent from biomass/methane and small-scale hydroelectric.6
80
85
90
95
100
105
2005 2006 2007 2008 2009 2010 2011 2012 2013 2015 2016 2017 2018 2019Elec
trici
ty S
ales
Inde
x 200
5 =
100
Index of Retail Electicity Sales by Sector
Total Retail Sales Residential
Commercial Industrial
2014
100.2
95.1
93.6
87.6
INDEX OF RETAIL ELECTRICITY SALES BY SECTOR
Source: U.S. Energy Information Administration

New Hampshire Employment SecurityEconomic & Labor Market Information Bureau44 | ENERGY
VITAL SIGNS 2020 | Economic & Social Indicators for New Hampshire, 2015-20198
7 ISO-NE, Resource Mix, https://www.iso-ne.com/about/key-stats/resource-mix/8 EIA calculation only includes electricity generated by utility-scale producers. Electricity generated by small-scale solar arrays is not included in this figure. 9 David Brooks, Concord Monitor, “Long-disputed N.H. Wind Farm is Finally Finished”, 2/4/2020. https://granitegeek.concordmonitor.com/2020/02/04/long-disputed-n-h-wind-farm-is-
finally-finished/10 Solar Energy Industries Association, State Solar Spotlight, New Hampshire. https://www.seia.org/sites/default/files/2020-09/New%20Hampshire.pdf11 Annie Roepeik, NHPR, “Regulators Approve N.H.’s First Large Solar Array, Planned by NextEra in Fitzwilliam”, 10/19/2020. https://www.nhpr.org/post/regulators-approve-nhs-first-large-
solar-array-planned-nextera-fitzwilliam#stream/0
Although 25.2 percent is a significant increase from current renewable energy usage, that goal is below what other New England states require.7 Rhode Island has the second lowest RPS, requiring 36.5 percent of electricity to come from renewable sources by 2035. Vermont has the highest goal, requiring 75 percent of electricity to come from renewable sources by 2035, although Vermont includes hydroelectric power, which the RPS in other New England states do not.
Renewable Energy in New HampshireRenewable energy sources accounted for ten percent of electricity generated in New Hampshire in 2019. A majority, 77 percent, came from biomass, with wind energy accounting for the rest.8 Wind energy produced 408.9 thousand MWh of electricity in New Hampshire in 2019. The amount of wind-generated electricity produced has been relatively constant since 2014, with between 406 and 432 thousand MWh produced annually. A new wind energy project, Antrim Wind, was completed in February 2020,9 with the capacity to generate an additional 29 MW, roughly a 14 percent increase in statewide wind energy capacity.
The EIA considers electricity producers with a capacity of five MW or greater as utility-scale. Currently, there are no utility-scale solar electricity producers in New Hampshire. Solar energy production in New Hampshire has been driven by small-scale producers, who typically use “net metering,” which reimburses these producers for the amount of electricity they produce, but generally don’t produce electricity to sell to other users. Currently, New Hampshire has a one MW
cap on solar arrays eligible to use net metering. Producers over that size are paid the lower wholesale rate for energy they produce, which makes projects over one MW less economically viable. Proposals to increase the cap to five MW were vetoed by the Governor in 2018, 2019 and 2020. Small-scale solar electricity producers generated 130 thousand MWh of electricity in 2019, a 20 percent increase over the previous year. The Solar Energy Industries Association projects that New Hampshire’s solar capacity will triple over the next five years, increasing the share of solar-generated electricity in New Hampshire from a little less than one percent to roughly two percent.10
One utility-scale solar plant is currently under development in New Hampshire, the 30 MW Chinook Solar Project in Fitzwilliam, NH. New Hampshire Public Utility Commission’s Site Evaluation Committee approved the proposed plan in October 2020.11 NextEra Energy Resources LLC, the project’s developer, hopes to have the solar array generating electricity in late 2021. Chinook Solar would be the largest solar array in New Hampshire by a wide margin, and would increase New Hampshire’s solar energy production capacity by roughly 20 percent. - Greg David
70
80
90
100
110
120
130
100
= 20
00 Le
vels
Industrial Sector Electricity Sales and GDP
Retail Manufacturing Electricity Sales Industrial Sector GDP
INDUSTRIAL SECTOR ELECTRICITY SALES AND GDP
Source: U.S. Energy Information Administration, Federal Reserve Bank of St. Louis
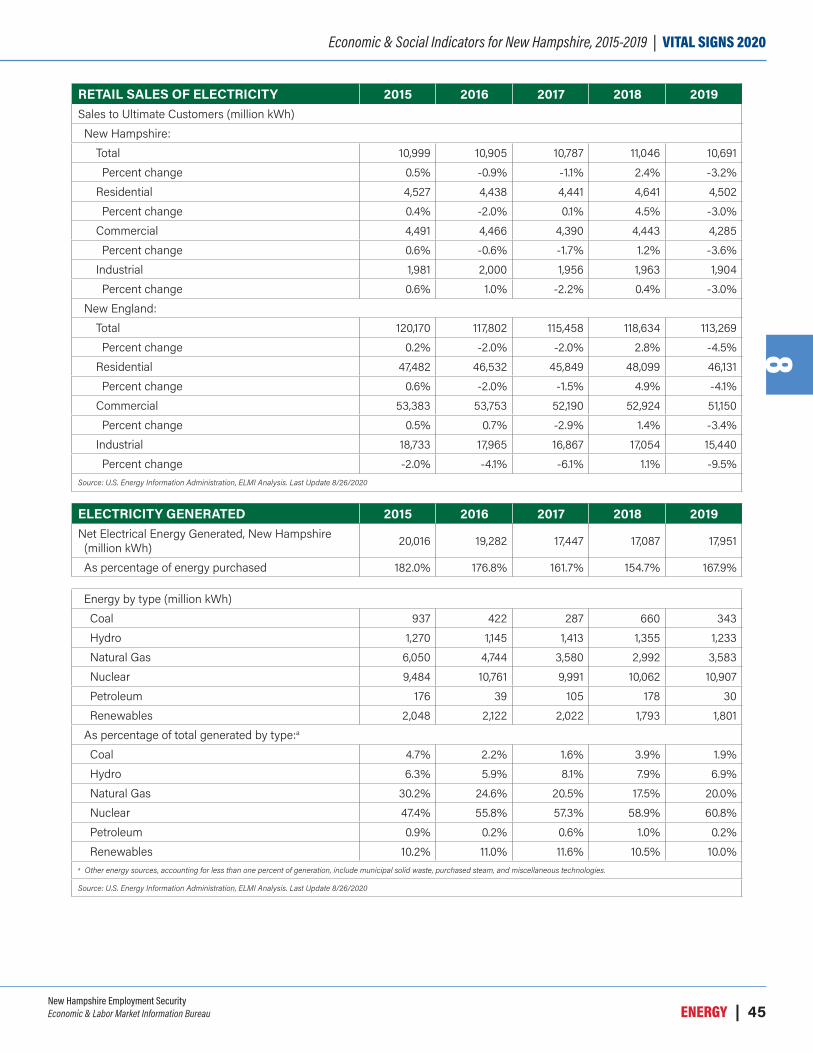
New Hampshire Employment SecurityEconomic & Labor Market Information Bureau ENERGY | 45
Economic & Social Indicators for New Hampshire, 2015-2019 | VITAL SIGNS 20208
RETAIL SALES OF ELECTRICITY 2015 2016 2017 2018 2019Sales to Ultimate Customers (million kWh)New Hampshire:
Total 10,999 10,905 10,787 11,046 10,691Percent change 0.5% -0.9% -1.1% 2.4% -3.2%
Residential 4,527 4,438 4,441 4,641 4,502Percent change 0.4% -2.0% 0.1% 4.5% -3.0%
Commercial 4,491 4,466 4,390 4,443 4,285Percent change 0.6% -0.6% -1.7% 1.2% -3.6%
Industrial 1,981 2,000 1,956 1,963 1,904Percent change 0.6% 1.0% -2.2% 0.4% -3.0%
New England:Total 120,170 117,802 115,458 118,634 113,269Percent change 0.2% -2.0% -2.0% 2.8% -4.5%
Residential 47,482 46,532 45,849 48,099 46,131Percent change 0.6% -2.0% -1.5% 4.9% -4.1%
Commercial 53,383 53,753 52,190 52,924 51,150Percent change 0.5% 0.7% -2.9% 1.4% -3.4%
Industrial 18,733 17,965 16,867 17,054 15,440Percent change -2.0% -4.1% -6.1% 1.1% -9.5%
Source: U.S. Energy Information Administration, ELMI Analysis. Last Update 8/26/2020
ELECTRICITY GENERATED 2015 2016 2017 2018 2019Net Electrical Energy Generated, New Hampshire (million kWh) 20,016 19,282 17,447 17,087 17,951
As percentage of energy purchased 182.0% 176.8% 161.7% 154.7% 167.9%
Energy by type (million kWh)Coal 937 422 287 660 343Hydro 1,270 1,145 1,413 1,355 1,233Natural Gas 6,050 4,744 3,580 2,992 3,583Nuclear 9,484 10,761 9,991 10,062 10,907Petroleum 176 39 105 178 30Renewables 2,048 2,122 2,022 1,793 1,801
As percentage of total generated by type:a
Coal 4.7% 2.2% 1.6% 3.9% 1.9%Hydro 6.3% 5.9% 8.1% 7.9% 6.9%Natural Gas 30.2% 24.6% 20.5% 17.5% 20.0%Nuclear 47.4% 55.8% 57.3% 58.9% 60.8%Petroleum 0.9% 0.2% 0.6% 1.0% 0.2%Renewables 10.2% 11.0% 11.6% 10.5% 10.0%
a Other energy sources, accounting for less than one percent of generation, include municipal solid waste, purchased steam, and miscellaneous technologies.
Source: U.S. Energy Information Administration, ELMI Analysis. Last Update 8/26/2020

New Hampshire Employment SecurityEconomic & Labor Market Information Bureau46 | ENERGY
VITAL SIGNS 2020 | Economic & Social Indicators for New Hampshire, 2015-20198
ENERGY AND FUEL CONSUMPTION 2015 2016 2017 2018 2019Energy Consumption Total consumption (trillion BTU) 314.9 305.8 317.2 324.7Annual percent change 0.9% -2.9% 3.7% 2.4%United States rank 46 46 46 46
Types of energy consumption (percent of total)Residential 32.1% 30.8% 31.4% 33.0%Commercial 22.9% 23.1% 22.1% 22.5%Industrial 13.3% 13.3% 14.5% 13.0%Transportation 31.8% 32.8% 32.0% 31.5%
Fuel Consumed to Generate Electricity (In equivalent barrels of oil )New Hampshire total (thousand barrels) 7,537,245 25,123,903 22,330,614 21,661,228 23,826,900Oil 291 67 163 298 49Coal 1,314 631 432 943 509Gas 7,535,640 5,998,430 4,597,817 3,817,685 4,502,044Nuclear 0 19,124,775 17,732,202 17,842,302 19,324,298
Source: U.S. Energy Information Administration, ELMI Analysis. Last Update 8/26/2020
These data are made available every two years
ENERGY EXPENDITURES AND PRICES 2015 2016 2017 2018 2019Energy Expenditures Per Capita 3,938 3,504 3,849 4,313United States rank (including DC) 34 31 33 32
Energy Prices ($ per million BTU) $22.63 $21.04 $22.29 $24.54United States rank (including DC) (1 = lowest) 48 47 47 47
Petroleum prices ($ per million BTU) $19.72 $17.68 $19.50 $22.00United States rank (including DC) (1 = lowest) 40 44 39 34
Electric prices ($ per million BTU) $46.95 $45.88 $47.39 $49.87United States rank (including DC) (1 = lowest) 46 46 46 46
Source: U.S. Energy Information Administration, ELMI Analysis. Last Update 8/26/2020
These data are made available every two years
Prepared by: New Hampshire Employment Security, Economic and Labor Market Information Bureau
www.nhes.nh.gov/elmi | (603) 228-4124

New Hampshire Employment SecurityEconomic & Labor Market Information Bureau PRODUCTION | 47
Economic & Social Indicators for New Hampshire, 2015-2019 | VITAL SIGNS 20209
PRODUCTION
1 GDP by state estimates the value of the goods and services produced in each state and the District of Columbia. Real GDP estimates have been adjusted to remove the effects of inflation over time, and percent change from the previous period is annualized to allow comparison. Estimates are revised as more complete data become available.
2 Quarterly gross domestic product growth rate data are adjusted to an annualized rate to reflect the amount a variable would have changed over a year’s time had it continued to grow at the given rate. Growth rate data are annualized to allow comparison over time.
In the second quarter of 2020, real gross domestic product (GDP)1 for all industries in New Hampshire was estimated at nearly $68.3 billion. This was $8.3 billion lower than the estimate for first quarter 2020, and $8.8 billion lower than the second quarter 2019 estimate.
Real GDP for New Hampshire decreased by an annualized rate2 of 36.9 percent, while the nation decreased by 31.4 percent. Every state and the District of Columbia experienced a decrease in real GDP in second quarter 2020, ranging from -20.4 percent in District of Columbia to -42.2 percent in Hawaii. The dramatic decrease in real GDP resulted from steps taken to slow the
spread of coronavirus, such as stay-at-home orders, non-essential business closures, and remote work and school.
In New Hampshire, the temporary closure of lodging, food services, and arts and entertainment establishments contributed to the losses in industries with the largest decrease in real GDP. Accommodation and food services decreased at an annualized rate of 95.3 percent, and arts, entertainment and recreation at an annualized rate of 99.4 percent. Only two industries did not decrease in real GDP from 2020 Q1 to Q2: finance and insurance, which increased at an annualized rate of 11.6 percent, and federal civilian government, which grew by 6.3 percent.
-11.9%
21.2%
3.4%
1.7%
-3.7%
0.0%
0.2%
28.1%
-10.6%
-23.2%
6.8%
2.1%
-0.6%
3.8%
-12.7%
-5.0%
18.3%
-2.0%
-0.1%
Wholesale trade
Utilities
Transportation and warehousing
Retail trade
Real estate and rental and leasing
Professional, scientific, technical services
Other services (except government)
Mining, quarrying, oil/gas extraction
Manufacturing
Management of companies and enterprises
Information
Health care and social assistance
Finance and insurance
Educational services
Construction
Arts, entertainment, and recreation
Agriculture, forestry, fishing and hunting
Administrative/support and waste…
Accommodation and food services
2019:Q1-:Q2
-36.7%
-7.0%
-64.1%
-41.0%
-9.0%
-31.7%
-58.2%
-22.4%
-41.5%
-9.7%
-4.1%
-48.7%
11.6%
-31.6%
-32.9%
-99.4%
-24.2%
-46.7%
-95.3%
2020:Q1-:Q2
Real GDP by Industry for New HampshirePercent Change from Preceding Period (Annualized)
REAL GDP BY INDUSTRY FOR NEW HAMPSHIREPERCENT CHANGE FROM PRECEDING PERIOD (ANNUALIZED)
Source: US Bureau of Economic Analysis
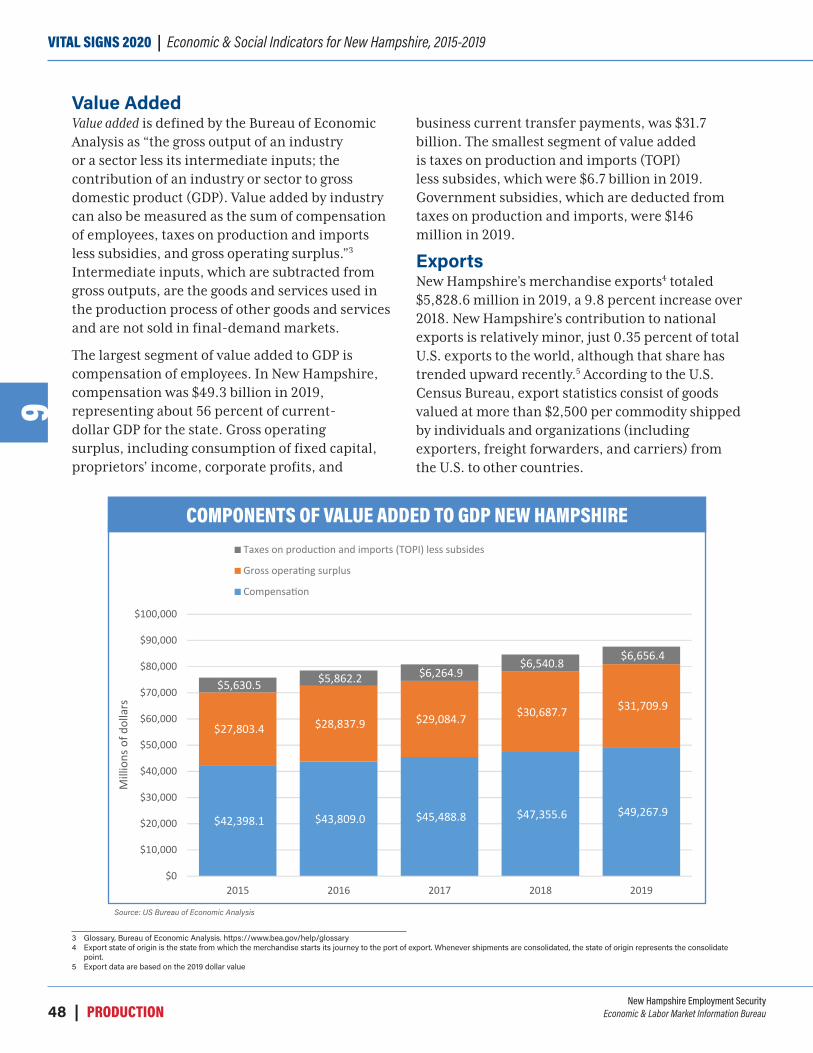
New Hampshire Employment SecurityEconomic & Labor Market Information Bureau48 | PRODUCTION
VITAL SIGNS 2020 | Economic & Social Indicators for New Hampshire, 2015-20199
3 Glossary, Bureau of Economic Analysis. https://www.bea.gov/help/glossary4 Export state of origin is the state from which the merchandise starts its journey to the port of export. Whenever shipments are consolidated, the state of origin represents the consolidate
point.5 Export data are based on the 2019 dollar value
Value AddedValue added is defined by the Bureau of Economic Analysis as “the gross output of an industry or a sector less its intermediate inputs; the contribution of an industry or sector to gross domestic product (GDP). Value added by industry can also be measured as the sum of compensation of employees, taxes on production and imports less subsidies, and gross operating surplus.”3 Intermediate inputs, which are subtracted from gross outputs, are the goods and services used in the production process of other goods and services and are not sold in final-demand markets.
The largest segment of value added to GDP is compensation of employees. In New Hampshire, compensation was $49.3 billion in 2019, representing about 56 percent of current-dollar GDP for the state. Gross operating surplus, including consumption of fixed capital, proprietors’ income, corporate profits, and
business current transfer payments, was $31.7 billion. The smallest segment of value added is taxes on production and imports (TOPI) less subsides, which were $6.7 billion in 2019. Government subsidies, which are deducted from taxes on production and imports, were $146 million in 2019.
ExportsNew Hampshire’s merchandise exports4 totaled $5,828.6 million in 2019, a 9.8 percent increase over 2018. New Hampshire’s contribution to national exports is relatively minor, just 0.35 percent of total U.S. exports to the world, although that share has trended upward recently.5 According to the U.S. Census Bureau, export statistics consist of goods valued at more than $2,500 per commodity shipped by individuals and organizations (including exporters, freight forwarders, and carriers) from the U.S. to other countries.
$42,398.1 $43,809.0 $45,488.8 $47,355.6 $49,267.9
$27,803.4 $28,837.9 $29,084.7 $30,687.7 $31,709.9 $5,630.5 $5,862.2 $6,264.9
$6,540.8 $6,656.4
$0
$10,000
$20,000
$30,000
$40,000
$50,000
$60,000
$70,000
$80,000
$90,000
$100,000
2015 2016 2017 2018 2019
Mill
ions
of d
olla
rs
Components of Value Added to New Hampshire GDP
Taxes on produc�on and imports (TOPI) less subsides
Gross opera�ng surplus
Compensa�on
COMPONENTS OF VALUE ADDED TO GDP NEW HAMPSHIRE
Source: US Bureau of Economic Analysis

New Hampshire Employment SecurityEconomic & Labor Market Information Bureau PRODUCTION | 49
Economic & Social Indicators for New Hampshire, 2015-2019 | VITAL SIGNS 20209Exports by Industry. In 2019, 96 percent of total
exports from New Hampshire to the world were from the manufacturing industry. The top export industry was transportation equipment, with merchandise exports just under $1.5 billion, surpassing computer and electronic products, which had exports valued at $1.35 billion. Machinery, except electrical, with export value of $812 million, chemicals, export value $618 million, and electrical equipment, appliances, and components, export value $354 million, rounded out the top five largest exporting industries from New Hampshire.
The computer and electronic products industry had ranked first in value of merchandise exports since 1999, but declined over-the-year for four of the last five years. The value of exports in this industry was 3.4 percent lower in 2019 than 2018. Transportation equipment exports from New Hampshire have been steadily growing, and the value of merchandise exports increased by 51.5 percent over-the-year from 2018 to 2019.
Export Destination. In 2019, New Hampshire businesses exported merchandise to 178 different countries, and for the second consecutive year, Germany was the top destination for exports originating in New Hampshire. Exports to Germany totaled $991.8 million in 2019, a 43.4 percent increase over 2018. After Germany, the top destinations for exports originating in New Hampshire were Canada, Ireland, Mexico, Japan, and China.
The highest value of merchandise exports to Germany and Canada was products from the transportation equipment industry. The highest value of exports to Ireland was products from
the chemicals industry, while computer and electronics products had the highest value of merchandise exports to Mexico and Japan. Exports to China with the highest value were from the machinery, except electrical industry.
- Katrina Evans
0.0%
0.1%
0.2%
0.3%
0.4%
0.5%
$0
$1,000
$2,000
$3,000
$4,000
$5,000
$6,000
$7,000
2014 2015 2016 2017 2018 2019
Mill
ions
of d
olla
rs
Total New Hampshire Exports and Share of U.S. Total
Total New Hampshire Exports Share of U.S. Total (percent)
TOTAL NEW HAMPSHIRE EXPORTS AND SHARE OF U.S. TOTAL
Source: Foreign Trade Division, U.S. Census Bureau.
$58.81
$103.67
$129.69
$176.79
$269.58
$354.37
$618.04
$812.05
$1,351.18
$1,488.96
$74.51
$102.93
$130.81
$168.39
$343.36
$286.17
$537.55
$805.50
$1,399.16
$982.78
Printed Matter and Related Products,Not Elsewhere Specified or Included
Waste and Scrap
Plastics and Rubber Products
Miscellaneous ManufacturedCommodities
Fabricated Metal Products, NotElsewhere Specified or Included
Electrical Equipment,Appliances, and Components
Chemicals
Machinery, Except Electrical
Computer and Electronic Products
Transportation Equipment
Millions of Dollars
Top Merchandise Exports from New Hampshireto the World, 2018 - 2019
2018 2019
TOP MERCHANDISE EXPORTS FROM NEW HAMPSHIRE TO THE WORLD, 2018-2019
Source: Foreign Trade Division, U.S. Census Bureau.

New Hampshire Employment SecurityEconomic & Labor Market Information Bureau50 | PRODUCTION
VITAL SIGNS 2020 | Economic & Social Indicators for New Hampshire, 2015-20199
$15.7
$17.3
$89.1
$96.5
$42.4
$47.7
$78.5
$103.6
$39.7
$40.2
$61.4
$160.9
$8.2
$33.5
$48.5
$375.4
$55.1
$99.8
$110.3
$222.6
$28.0
$39.1
$81.1
$747.6
$0 $100 $200 $300 $400 $500 $600 $700 $800
Fish, Fresh/Chilled/Frozen & Other Marine Products
Electrical Equipment, Appliances & Components
Computer And Electronic Products
Machinery, Except Electrical
Machinery, Except Electrical
Electrical Equipment, Appliances & Components
Transportation Equipment
Computer And Electronic Products
Machinery, Except Electrical
Miscellaneous Manufactured Commodities
Transportation Equipment
Computer And Electronic Products
Machinery, Except Electrical
Computer And Electronic Products
Electrical Equipment, Appliances & Components
Chemicals
Electrical Equipment, Appliances & Components
Computer And Electronic Products
Machinery, Except Electrical
Transportation Equipment
Fabricated Metal Products, NESOI
Computer And Electronic Products
Machinery, Except Electrical
Transportation Equipment
Chin
aJa
pan
Mex
icoIre
land
Cana
daGe
rman
y
Millions of Dollars
VALUE OF MERCHANDISE EXPORTS FROM NEW HAMPSHIRE BY COUNTRY AND INDUSTRY, 2019
Source: Foreign Trade Division, U.S. Census Bureau.
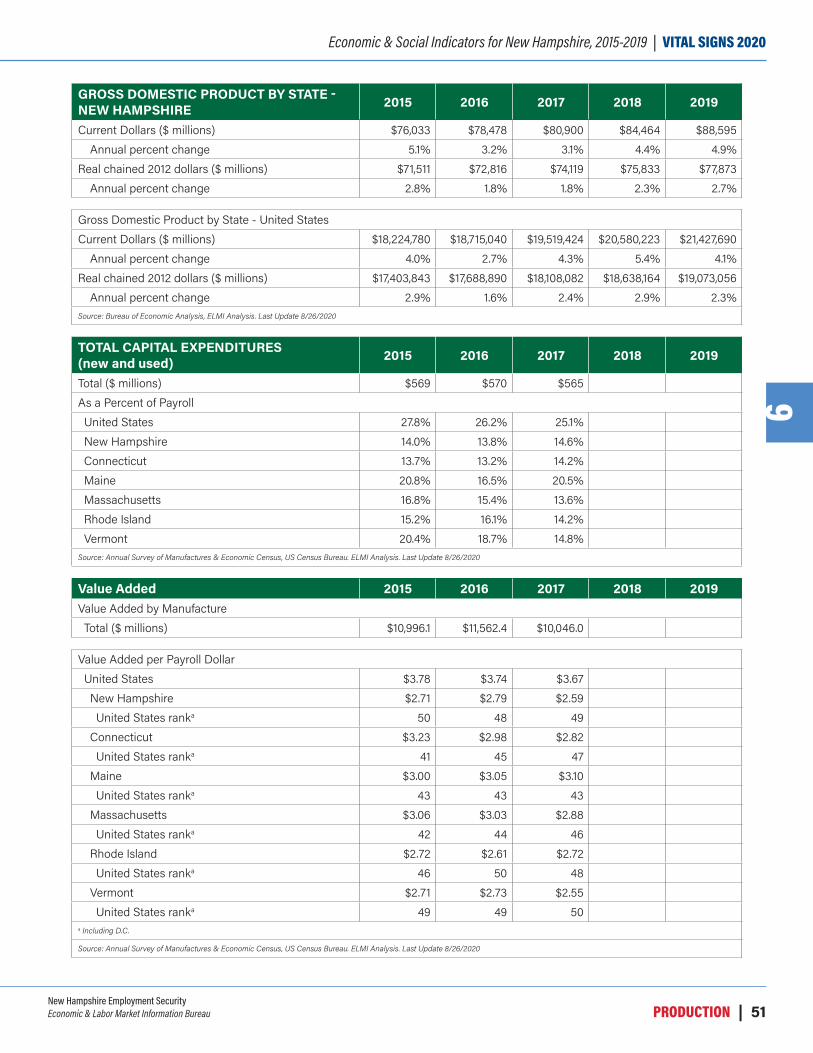
New Hampshire Employment SecurityEconomic & Labor Market Information Bureau PRODUCTION | 51
Economic & Social Indicators for New Hampshire, 2015-2019 | VITAL SIGNS 20209
GROSS DOMESTIC PRODUCT BY STATE - NEW HAMPSHIRE 2015 2016 2017 2018 2019
Current Dollars ($ millions) $76,033 $78,478 $80,900 $84,464 $88,595Annual percent change 5.1% 3.2% 3.1% 4.4% 4.9%
Real chained 2012 dollars ($ millions) $71,511 $72,816 $74,119 $75,833 $77,873Annual percent change 2.8% 1.8% 1.8% 2.3% 2.7%
Gross Domestic Product by State - United StatesCurrent Dollars ($ millions) $18,224,780 $18,715,040 $19,519,424 $20,580,223 $21,427,690
Annual percent change 4.0% 2.7% 4.3% 5.4% 4.1%Real chained 2012 dollars ($ millions) $17,403,843 $17,688,890 $18,108,082 $18,638,164 $19,073,056
Annual percent change 2.9% 1.6% 2.4% 2.9% 2.3%Source: Bureau of Economic Analysis, ELMI Analysis. Last Update 8/26/2020
TOTAL CAPITAL EXPENDITURES (new and used) 2015 2016 2017 2018 2019
Total ($ millions) $569 $570 $565As a Percent of PayrollUnited States 27.8% 26.2% 25.1%New Hampshire 14.0% 13.8% 14.6%Connecticut 13.7% 13.2% 14.2%Maine 20.8% 16.5% 20.5%Massachusetts 16.8% 15.4% 13.6%Rhode Island 15.2% 16.1% 14.2%Vermont 20.4% 18.7% 14.8%
Source: Annual Survey of Manufactures & Economic Census, US Census Bureau. ELMI Analysis. Last Update 8/26/2020
Value Added 2015 2016 2017 2018 2019Value Added by Manufacture Total ($ millions) $10,996.1 $11,562.4 $10,046.0
Value Added per Payroll DollarUnited States $3.78 $3.74 $3.67New Hampshire $2.71 $2.79 $2.59United States ranka 50 48 49
Connecticut $3.23 $2.98 $2.82United States ranka 41 45 47
Maine $3.00 $3.05 $3.10United States ranka 43 43 43
Massachusetts $3.06 $3.03 $2.88United States ranka 42 44 46
Rhode Island $2.72 $2.61 $2.72United States ranka 46 50 48
Vermont $2.71 $2.73 $2.55United States ranka 49 49 50
a Including D.C.
Source: Annual Survey of Manufactures & Economic Census, US Census Bureau. ELMI Analysis. Last Update 8/26/2020

New Hampshire Employment SecurityEconomic & Labor Market Information Bureau52 | PRODUCTION
VITAL SIGNS 2020 | Economic & Social Indicators for New Hampshire, 2015-20199
EXPORT SALES TO THE WORLD 2015 2016 2017 2018 2019Total ($ millions) $4,001 $4,143 $5,148 $5,306 $5,829Annual percent change -5.5% 3.6% 24.2% 3.1% 9.8%
Industry Share of Total Exportsb
Transportation Equipment 4.7% 8.3% 11.9% 18.5% 25.5%Computer and Electronic Products 38.1% 30.9% 31.7% 26.4% 23.2%Machinery, Except Electrical 17.8% 17.4% 13.0% 15.2% 13.9%Chemicals 4.0% 6.1% 8.7% 10.1% 10.6%Electrical Equipment, Appliances & Components 9.5% 9.4% 11.5% 5.4% 6.1%Fabricated Metal Products, NESOI 4.6% 6.1% 5.0% 6.5% 4.6%Miscellaneous Manufactured Commodities 3.6% 3.8% 3.1% 3.2% 3.0%Plastics & Rubber Products 3.7% 3.8% 2.4% 2.5% 2.2%Waste and Scrap 2.1% 2.2% 1.8% 1.9% 1.8%Printed Matter and Related Products, NESOI 1.0% 1.2% 2.0% 1.4% 1.3%Agriculture and Livestock Products 1.4% 1.5% 1.3% 1.6% 1.2%Food Manufactures 1.9% 1.5% 1.5% 1.4% 1.0%
b International Trade Administration, U.S. Department of Commerce, Trade Stats Express™ Home, National Trade Data Home
Source: International Trade Administration, U.S. Department of Commerce, ELMI Analysis. Last Update 8/28/2020
DEFENSE CONTRACTS ($ millions) 2015 2016 2017 2018 2019Total - Federal Fiscal (October 1 - September 30) $1,167.4 $1,159.6 $1,824.8 $1,988.6 $2,202.8
Source: USAspending.gov. Last Update 8/27/2020
Prepared by: New Hampshire Employment Security, Economic and Labor Market Information Bureau
www.nhes.nh.gov/elmi | (603) 228-4124
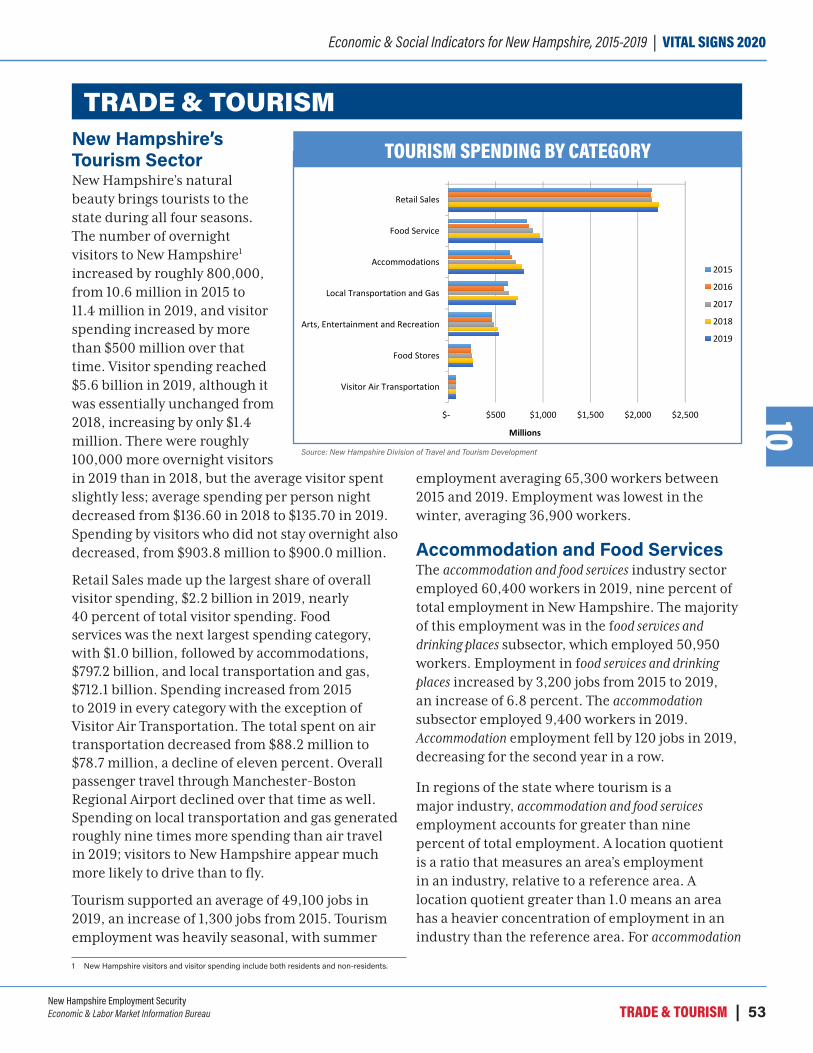
New Hampshire Employment SecurityEconomic & Labor Market Information Bureau TRADE & TOURISM | 53
Economic & Social Indicators for New Hampshire, 2015-2019 | VITAL SIGNS 202010
TRADE & TOURISM
1 New Hampshire visitors and visitor spending include both residents and non-residents.
New Hampshire’s Tourism SectorNew Hampshire’s natural beauty brings tourists to the state during all four seasons. The number of overnight visitors to New Hampshire1 increased by roughly 800,000, from 10.6 million in 2015 to 11.4 million in 2019, and visitor spending increased by more than $500 million over that time. Visitor spending reached $5.6 billion in 2019, although it was essentially unchanged from 2018, increasing by only $1.4 million. There were roughly 100,000 more overnight visitors in 2019 than in 2018, but the average visitor spent slightly less; average spending per person night decreased from $136.60 in 2018 to $135.70 in 2019. Spending by visitors who did not stay overnight also decreased, from $903.8 million to $900.0 million.
Retail Sales made up the largest share of overall visitor spending, $2.2 billion in 2019, nearly 40 percent of total visitor spending. Food services was the next largest spending category, with $1.0 billion, followed by accommodations, $797.2 billion, and local transportation and gas, $712.1 billion. Spending increased from 2015 to 2019 in every category with the exception of Visitor Air Transportation. The total spent on air transportation decreased from $88.2 million to $78.7 million, a decline of eleven percent. Overall passenger travel through Manchester-Boston Regional Airport declined over that time as well. Spending on local transportation and gas generated roughly nine times more spending than air travel in 2019; visitors to New Hampshire appear much more likely to drive than to fly.
Tourism supported an average of 49,100 jobs in 2019, an increase of 1,300 jobs from 2015. Tourism employment was heavily seasonal, with summer
employment averaging 65,300 workers between 2015 and 2019. Employment was lowest in the winter, averaging 36,900 workers.
Accommodation and Food Services The accommodation and food services industry sector employed 60,400 workers in 2019, nine percent of total employment in New Hampshire. The majority of this employment was in the food services and drinking places subsector, which employed 50,950 workers. Employment in food services and drinking places increased by 3,200 jobs from 2015 to 2019, an increase of 6.8 percent. The accommodation subsector employed 9,400 workers in 2019. Accommodation employment fell by 120 jobs in 2019, decreasing for the second year in a row.
In regions of the state where tourism is a major industry, accommodation and food services employment accounts for greater than nine percent of total employment. A location quotient is a ratio that measures an area’s employment in an industry, relative to a reference area. A location quotient greater than 1.0 means an area has a heavier concentration of employment in an industry than the reference area. For accommodation
$- $500 $1,000 $1,500 $2,000 $2,500
Retail Sales
Food Service
Accommodations
Local Transportation and Gas
Arts, Entertainment and Recreation
Food Stores
Visitor Air Transportation
Millions
Tourism Spending by Category
2015
2016
2017
2018
2019
TOURISM SPENDING BY CATEGORY
Source: New Hampshire Division of Travel and Tourism Development

New Hampshire Employment SecurityEconomic & Labor Market Information Bureau54 | TRADE & TOURISM
VITAL SIGNS 2020 | Economic & Social Indicators for New Hampshire, 2015-201910
and food services employment, Belknap, Carroll, Coös, Grafton, and Rockingham counties all had a location quotient greater than 1.0. Carroll County had the highest location quotient, 2.5, meaning the concentration of accommodation and food services employment was 2.5 times higher in Carroll County than in New Hampshire as a whole. With a location quotient of 1.7, Coös County also had a much heavier concentration of accommodation and food services employment than New Hampshire overall. Accommodation and food services sector employment accounted for 22.4 percent of all employment in Carroll County, and 15.9 percent in Coös County.
Along with arts, entertainment and recreation, accommodation and food services was one the industry sectors most impacted by coronavirus and by efforts to slow its spread. In April 2020, employment in accommodation and food services was 54 percent lower than employment in April 2019. Although employment in this sector began to increase again in May, it remained well below 2019 levels. By December 2020, employment was still down 17 percent over-the-year.
With the exception of Grafton County, counties with a high location quotient for accommodation and
food services employment had higher unemployment rates than the rest of the state, particularly early in the pandemic, when dining at restaurants and lodging occupancy was heavily restricted. While New Hampshire’s unemployment rate was 16.1 percent in April, the unemployment rate was 24.3 percent in Carroll County, and 22.2 percent in Coös County.
Retail TradeIn 2019, retail trade employment decreased slightly for the third year in a row, falling from 95,920 workers in 2016 to 94,020 in 2019. Between 2002 and 2018, retail trade employment was higher than any other industry, but was passed by health care and social assistance employment, which increased to 94,100 workers in 2019. The coronavirus pandemic had a significant impact on retail trade employment; in April 2020, there were 17,400 fewer workers than in April 2019, a decrease of 18 percent.
Employment in one subsector of retail trade did not decline through the pandemic. Building material and garden supply stores employment increased by 40 workers from March to April 2020, although this was a much smaller increase than seen in the previous year, when employment increased by 470
00.5
11.5
22.5
3
Location Quotient for Accommodation and Food Services Employment, 2019
County Location Quotient New Hampshire Average
LOCATION QUOTIENT FOR ACCOMMODATION AND FOOD SERVICES EMPLOYMENT, 2019
Source: New Hampshire Employment Security, Quarterly Census of Employment and Wages

New Hampshire Employment SecurityEconomic & Labor Market Information Bureau TRADE & TOURISM | 55
Economic & Social Indicators for New Hampshire, 2015-2019 | VITAL SIGNS 202010
jobs from March to April. Building material and garden supply stores employment increased in May and June 2020 as well, and was 4.9 percent higher than it had been the previous June, a gain of slightly over 500 jobs.
The coronavirus pandemic impacted job postings for the retail trade sector as well. Job posting data from Burning Glass Technologies’ Labor Insight tool indicated that, although retail trade employment declined during the pandemic, job postings for retail trade workers between April and November 2020 actually increased 45 percent compared to the same period one year earlier.
The types of occupations requested in job postings changed from 2019 to 2020 as well. Retail salespersons were the most frequently requested job postings in both years, although they accounted for a smaller percentage of postings in 2020. Postings for laborers and freight, stock, and material movers, hand and stock clerks and order fillers increased from seven percent of postings in 2019 to 29 percent of postings in 2020.
0% 10% 20% 30% 40%
Retail Salespersons
First-Line Supervisors of Retail Sales Workers
Stock Clerks and Order Fillers
Cashiers
Merchandise Displayers andWindow Trimmers
Pharmacy Technicians
Customer Service Representatives
Sales Representatives, Wholesale and Manufacturing
Laborers and Freight, Stock, andMaterial Movers, Hand
Driver/Sales Workers
Retail Trade Job Postings, 2019 and 2020
April - November 2019 April - November 2020
RETAIL TRADE JOB POSTINGS, 2019 AND 2020
Source: Burning Glass Technologies, Labor Insight
With less foot traffic in stores, but more online sales and curbside pickup, these occupations were in high demand.
Although employment has remained below 2019 levels, retail sales rebounded during the summer. According to the U.S. Census Bureau’s monthly retail trade data, retail sales in New Hampshire increased over-the-year in June and July 2020. Retail sales in June 2020 were 1.5 percent higher than in June 2019, and sales in July 2020 were 3.3 percent higher than in the previous year. (The margin of error for these data, +/- 6.5 and +/- 6.8, respectively, was larger than the over-the-year gains). Monthly retail sales in August 2020 were 2.1 percent below sales the previous August, possibly an indication that Federal Pandemic Unemployment Compensation payments, paying unemployed individuals an extra $600 per week, contributed to strong retail sales before the program ended in July.
- Greg David
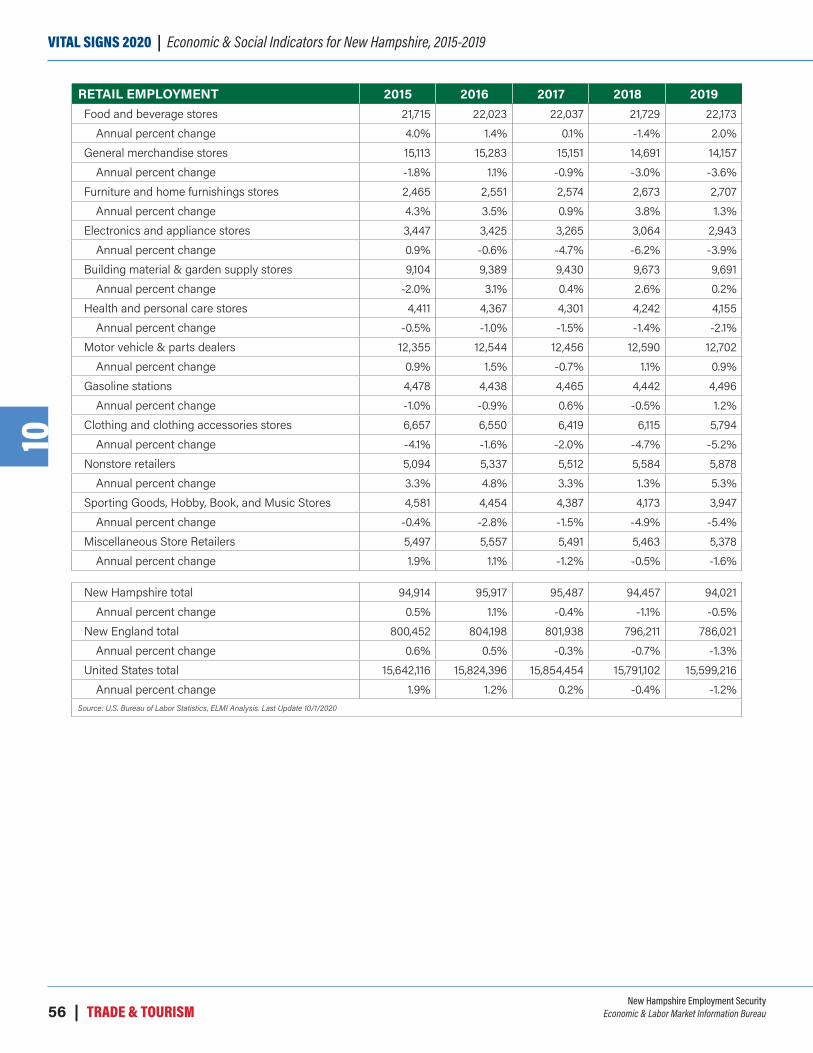
New Hampshire Employment SecurityEconomic & Labor Market Information Bureau56 | TRADE & TOURISM
VITAL SIGNS 2020 | Economic & Social Indicators for New Hampshire, 2015-201910
RETAIL EMPLOYMENT 2015 2016 2017 2018 2019Food and beverage stores 21,715 22,023 22,037 21,729 22,173
Annual percent change 4.0% 1.4% 0.1% -1.4% 2.0%General merchandise stores 15,113 15,283 15,151 14,691 14,157
Annual percent change -1.8% 1.1% -0.9% -3.0% -3.6%Furniture and home furnishings stores 2,465 2,551 2,574 2,673 2,707
Annual percent change 4.3% 3.5% 0.9% 3.8% 1.3%Electronics and appliance stores 3,447 3,425 3,265 3,064 2,943
Annual percent change 0.9% -0.6% -4.7% -6.2% -3.9%Building material & garden supply stores 9,104 9,389 9,430 9,673 9,691
Annual percent change -2.0% 3.1% 0.4% 2.6% 0.2%Health and personal care stores 4,411 4,367 4,301 4,242 4,155
Annual percent change -0.5% -1.0% -1.5% -1.4% -2.1%Motor vehicle & parts dealers 12,355 12,544 12,456 12,590 12,702
Annual percent change 0.9% 1.5% -0.7% 1.1% 0.9%Gasoline stations 4,478 4,438 4,465 4,442 4,496
Annual percent change -1.0% -0.9% 0.6% -0.5% 1.2%Clothing and clothing accessories stores 6,657 6,550 6,419 6,115 5,794
Annual percent change -4.1% -1.6% -2.0% -4.7% -5.2%Nonstore retailers 5,094 5,337 5,512 5,584 5,878
Annual percent change 3.3% 4.8% 3.3% 1.3% 5.3%Sporting Goods, Hobby, Book, and Music Stores 4,581 4,454 4,387 4,173 3,947
Annual percent change -0.4% -2.8% -1.5% -4.9% -5.4%Miscellaneous Store Retailers 5,497 5,557 5,491 5,463 5,378
Annual percent change 1.9% 1.1% -1.2% -0.5% -1.6%
New Hampshire total 94,914 95,917 95,487 94,457 94,021 Annual percent change 0.5% 1.1% -0.4% -1.1% -0.5%
New England total 800,452 804,198 801,938 796,211 786,021 Annual percent change 0.6% 0.5% -0.3% -0.7% -1.3%
United States total 15,642,116 15,824,396 15,854,454 15,791,102 15,599,216 Annual percent change 1.9% 1.2% 0.2% -0.4% -1.2%
Source: U.S. Bureau of Labor Statistics, ELMI Analysis. Last Update 10/1/2020

New Hampshire Employment SecurityEconomic & Labor Market Information Bureau TRADE & TOURISM | 57
Economic & Social Indicators for New Hampshire, 2015-2019 | VITAL SIGNS 202010
ACCOMMODATION AND FOOD SERVICES EMPLOYMENT 2015 2016 2017 2018 2019
Accommodation 9,441 9,478 9,537 9,527 9,411 Annual percent change 2.7% 0.4% 0.6% -0.1% -1.2%
Food Services and Drinking Places 47,709 48,664 49,416 50,162 50,950 Annual percent change 2.0% 2.0% 1.5% 1.5% 1.6%
New Hampshire total 57,150 58,142 58,952 59,689 60,362 Annual percent change 2.1% 1.7% 1.4% 1.3% 1.1%
New England 610,445 624,405 635,732 643,282 649,445 Annual percent change 1.7% 2.3% 1.8% 1.2% 1.0%
United States total 12,939,965 13,318,703 13,606,761 13,831,140 14,022,813 Annual percent change 3.3% 2.9% 2.2% 1.6% 1.4%
Source: U.S. Bureau of Labor Statistics, ELMI Analysis. Last Update 10/1/2020
HOSPITALITY: ESTIMATED SALES ($ millions) 2015 2016 2017 2018 2019
Meals $2,798.8 $2,982.8 $3,093.9 $3,256.7 $3,384.6 Annual percent change 6.9% 6.6% 3.7% 5.3% 3.9%
Rentals (Includes Motor Vehicle Rentals) $574.4 $598.4 $636.0 $695.3 $711.8 Annual percent change 7.8% 4.2% 6.3% 9.3% 2.4%
Source: New Hampshire Office of Strategic Initiatives, ELMI Analysis. Last Update 8/28/2020
LIQUOR SALES (State Fiscal Year – July 1 to June 30) 2014-15 2015-16 2016-17 2017-18 2018-19
Retail & Wholesale Gross Sales ($ millions) $646.9 $682.4 $702.7 $712.4 $729.2 Fiscal year percent change 3.2% 5.5% 3.0% 1.4% 2.4%
Retail & Wholesale Net Salesa ($ millions) $631.1 $665.7 $684.8 $691.9 $706.1 Fiscal year percent change 3.2% 5.5% 3.0% 1.4% 2.4%
Gross Profit From Sales ($ millions) $185.4 $195.0 $200.0 $200.8 $200.5 Fiscal year percent change 4.5% 5.2% 2.6% 0.4% -0.1%
a Total sales less discounts and fees
Source: New Hampshire Liquor Commission, ELMI Analysis. Last Update 8/28/2020
HUNTING AND FISHING 2015 2016 2017 2018 2019Hunting Licenses, Tags, Permits and Stamps Resident 47,599 47,073 45,893 45,590 Non-resident 10,500 10,599 10,108 9,972
Moose Hunt LotteryApplications 11,056 9,590 8,261 6,142 5,875 Permits Drawn 105 71 51 51 49
Fishing Licenses, Tags, Permits and StampsResident 111,013 106,910 105,872 106,242 Non-resident 49,566 49,657 50,128 50,239
Source: New Hampshire Department of Fish and Game. Last Update 8/28/2020
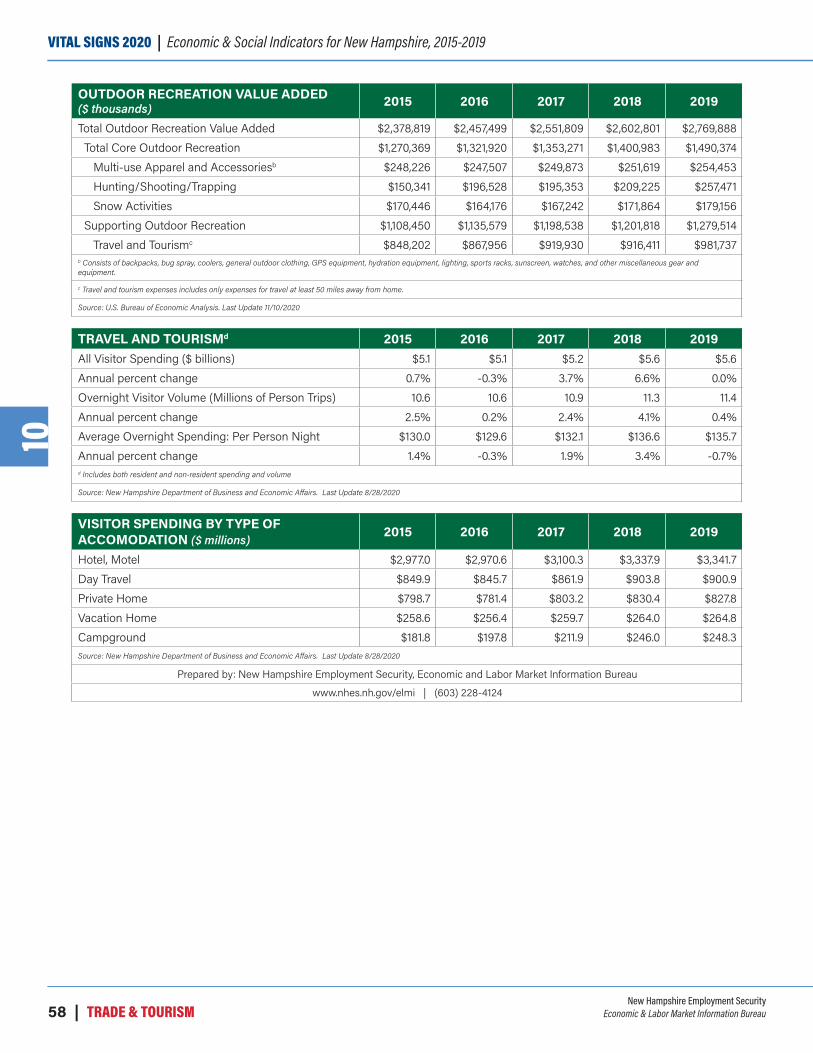
New Hampshire Employment SecurityEconomic & Labor Market Information Bureau58 | TRADE & TOURISM
VITAL SIGNS 2020 | Economic & Social Indicators for New Hampshire, 2015-201910
OUTDOOR RECREATION VALUE ADDED ($ thousands) 2015 2016 2017 2018 2019
Total Outdoor Recreation Value Added $2,378,819 $2,457,499 $2,551,809 $2,602,801 $2,769,888 Total Core Outdoor Recreation $1,270,369 $1,321,920 $1,353,271 $1,400,983 $1,490,374 Multi-use Apparel and Accessoriesb $248,226 $247,507 $249,873 $251,619 $254,453 Hunting/Shooting/Trapping $150,341 $196,528 $195,353 $209,225 $257,471 Snow Activities $170,446 $164,176 $167,242 $171,864 $179,156 Supporting Outdoor Recreation $1,108,450 $1,135,579 $1,198,538 $1,201,818 $1,279,514 Travel and Tourismc $848,202 $867,956 $919,930 $916,411 $981,737b Consists of backpacks, bug spray, coolers, general outdoor clothing, GPS equipment, hydration equipment, lighting, sports racks, sunscreen, watches, and other miscellaneous gear and equipment.
c Travel and tourism expenses includes only expenses for travel at least 50 miles away from home.
Source: U.S. Bureau of Economic Analysis. Last Update 11/10/2020
TRAVEL AND TOURISMd 2015 2016 2017 2018 2019All Visitor Spending ($ billions) $5.1 $5.1 $5.2 $5.6 $5.6Annual percent change 0.7% -0.3% 3.7% 6.6% 0.0%Overnight Visitor Volume (Millions of Person Trips) 10.6 10.6 10.9 11.3 11.4Annual percent change 2.5% 0.2% 2.4% 4.1% 0.4%Average Overnight Spending: Per Person Night $130.0 $129.6 $132.1 $136.6 $135.7Annual percent change 1.4% -0.3% 1.9% 3.4% -0.7%d Includes both resident and non-resident spending and volume
Source: New Hampshire Department of Business and Economic Affairs. Last Update 8/28/2020
VISITOR SPENDING BY TYPE OF ACCOMODATION ($ millions)
2015 2016 2017 2018 2019
Hotel, Motel $2,977.0 $2,970.6 $3,100.3 $3,337.9 $3,341.7Day Travel $849.9 $845.7 $861.9 $903.8 $900.9Private Home $798.7 $781.4 $803.2 $830.4 $827.8Vacation Home $258.6 $256.4 $259.7 $264.0 $264.8Campground $181.8 $197.8 $211.9 $246.0 $248.3Source: New Hampshire Department of Business and Economic Affairs. Last Update 8/28/2020
Prepared by: New Hampshire Employment Security, Economic and Labor Market Information Bureau
www.nhes.nh.gov/elmi | (603) 228-4124

New Hampshire Employment SecurityEconomic & Labor Market Information Bureau CONSTRUCTION & HOUSING | 59
Economic & Social Indicators for New Hampshire, 2015-2019 | VITAL SIGNS 202011
CONSTRUCTION & HOUSING
1 New Hampshire Housing Finance Authority, Housing Market Snapshot, June/July 2020. https://www.nhhfa.org/wp-content/uploads/2020/06/HMS-June-July-2020.pdf. 2 New Hampshire Housing Finance Authority, 2020 New Hampshire Residential Rent Survey Report. https://www.nhhfa.org/wp-content/uploads/2020/07/2020-Rental-Survey-Report.pdf.
Construction SectorEmployment in the construction industry sector decreased by 8,000 jobs during the Great Recession, a loss of more than 25 percent of the construction workforce. Employment increased steadily since 2010, but average construction employment in 2019 was still lower than in 2005 by 1,500 jobs.
Construction employment follows a seasonal pattern, with relatively low employment during winter months, when cold, snowy weather impacts construction projects, and higher employment in the summer. Employment in the first quarter of 2020 remained strong, with over-the-year growth of more than 1,000 jobs in January, February and March. Construction employment decreased in April, as efforts to contain the coronavirus impacted New Hampshire’s labor force. In April, construction employment decreased by 2,000 jobs, a decline of 7.4 percent. Employment increased again starting in May, but remained below 2019 employment levels. Still, employment in the construction sector has fared better than most sectors. In December 2020, construction employment was 0.7 percent lower than it had been in December 2019, while total nonfarm employment was 6.6 percent lower.
New Hampshire’s Housing Market The supply of homes for sale or rent in New Hampshire has declined since 2007, when the housing bubble collapsed. This decline steepened in 2017, and real estate markets, particularly in southeastern New Hampshire, have been increasingly competitive in recent years. Supply and demand for rental housing are generally considered balanced when the vacancy rate is around five percent.1 The rental unit vacancy rate fell to 0.8 percent in 2019.2 Vacancy rates were particularly low in Grafton and Rockingham counties, which had vacancy rates of 0.3 percent and 0.4 percent, respectively. Low vacancy rates lead to increased competition for rental housing and can cause rent to increase. Median rent increased 6.3 percent from 2018 to 2019, to $1,251 per month.
The market for home sales also appears to have greater demand than supply. The average single family house for sale was on the market for 56 days in 2019, a decrease of 53 percent from 2012, when home sales and prices started to recover following the Great Recession. Sale prices for single family homes have increased more than six percent in four of the last five years, reaching a median price
of $300,000 in 2019.
In spite of the coronavirus pandemic, housing sales remained strong in 2020. The number of home sales fell in the second quarter of 2020, but by the end of the third quarter, sales volume was down only two percent compared to the first three quarters of 2019. The price of homes sold increased, particularly in the third quarter of 2020. The median sale price for single family homes
22,000
23,000
24,000
25,000
26,000
27,000
28,000
29,000
30,000
Jan Feb Mar Apr May Jun Jul Aug Sep Oct Nov Dec
Construction Employment in New Hampshire
2016 2017 2018 2019 2020
CONSTRUCTION EMPLOYMENT IN NEW HAMPSHIRE
Source: New Hampshire Employment Security, Current Employment Statistics
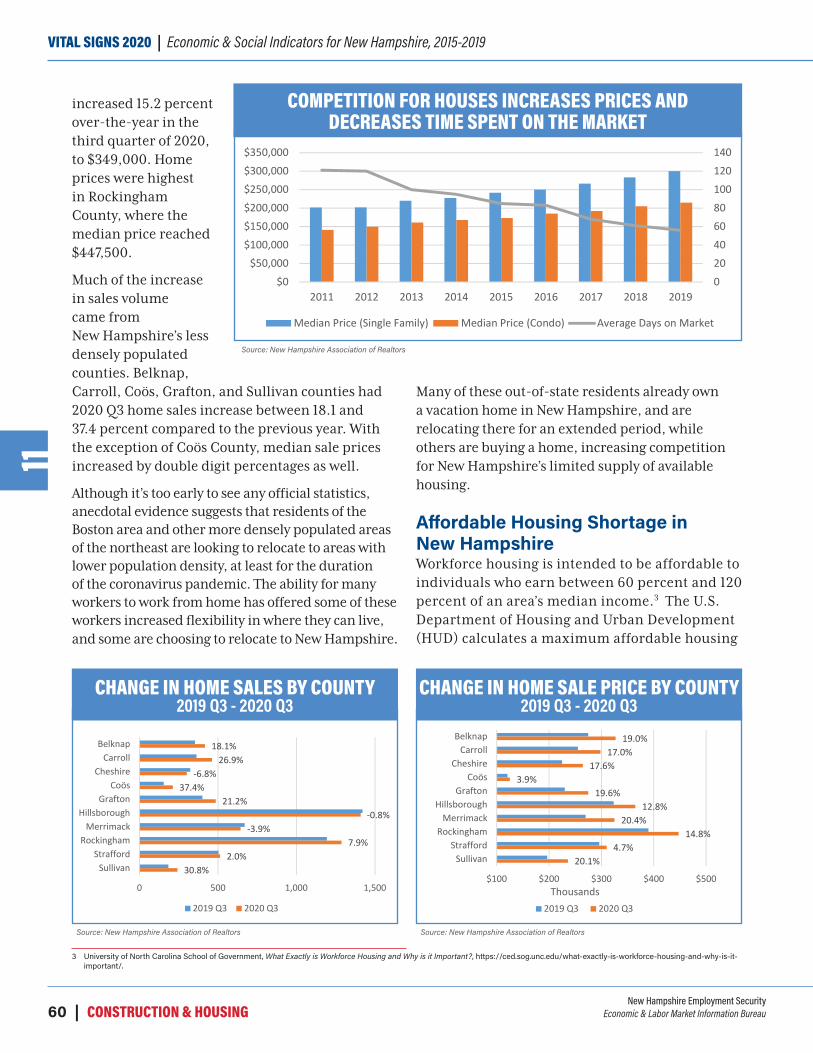
New Hampshire Employment SecurityEconomic & Labor Market Information Bureau60 | CONSTRUCTION & HOUSING
VITAL SIGNS 2020 | Economic & Social Indicators for New Hampshire, 2015-201911
3 University of North Carolina School of Government, What Exactly is Workforce Housing and Why is it Important?, https://ced.sog.unc.edu/what-exactly-is-workforce-housing-and-why-is-it-important/.
increased 15.2 percent over-the-year in the third quarter of 2020, to $349,000. Home prices were highest in Rockingham County, where the median price reached $447,500.
Much of the increase in sales volume came from New Hampshire’s less densely populated counties. Belknap, Carroll, Coös, Grafton, and Sullivan counties had 2020 Q3 home sales increase between 18.1 and 37.4 percent compared to the previous year. With the exception of Coös County, median sale prices increased by double digit percentages as well.
Although it’s too early to see any official statistics, anecdotal evidence suggests that residents of the Boston area and other more densely populated areas of the northeast are looking to relocate to areas with lower population density, at least for the duration of the coronavirus pandemic. The ability for many workers to work from home has offered some of these workers increased flexibility in where they can live, and some are choosing to relocate to New Hampshire.
Many of these out-of-state residents already own a vacation home in New Hampshire, and are relocating there for an extended period, while others are buying a home, increasing competition for New Hampshire’s limited supply of available housing.
Affordable Housing Shortage in New HampshireWorkforce housing is intended to be affordable to individuals who earn between 60 percent and 120 percent of an area’s median income.3 The U.S. Department of Housing and Urban Development (HUD) calculates a maximum affordable housing
020406080100120140
$0$50,000
$100,000$150,000$200,000$250,000$300,000$350,000
2011 2012 2013 2014 2015 2016 2017 2018 2019
Competition for Houses Increased Prices and Time Spent on the Market Decreased
Median Price (Single Family) Median Price (Condo) Average Days on Market
COMPETITION FOR HOUSES INCREASES PRICES AND DECREASES TIME SPENT ON THE MARKET
Source: New Hampshire Association of Realtors
18.1%26.9%
-6.8%37.4%
21.2%-0.8%
-3.9%7.9%
2.0%30.8%
0 500 1,000 1,500
BelknapCarroll
CheshireCoös
GraftonHillsborough
MerrimackRockingham
StraffordSullivan
Change in Home Sales by County, 2019 Q3 - 2020 Q3
2019 Q3 2020 Q3
CHANGE IN HOME SALES BY COUNTY 2019 Q3 - 2020 Q3
Source: New Hampshire Association of Realtors
19.0%17.0%
17.6%3.9%
19.6%12.8%
20.4%14.8%
4.7%20.1%
$100 $200 $300 $400 $500
BelknapCarroll
CheshireCoös
GraftonHillsborough
MerrimackRockingham
StraffordSullivan
Thousands
Change in Home Sale Price by County, 2019 Q3 - 2020 Q3
2019 Q3 2020 Q3
CHANGE IN HOME SALE PRICE BY COUNTY 2019 Q3 - 2020 Q3
Source: New Hampshire Association of Realtors
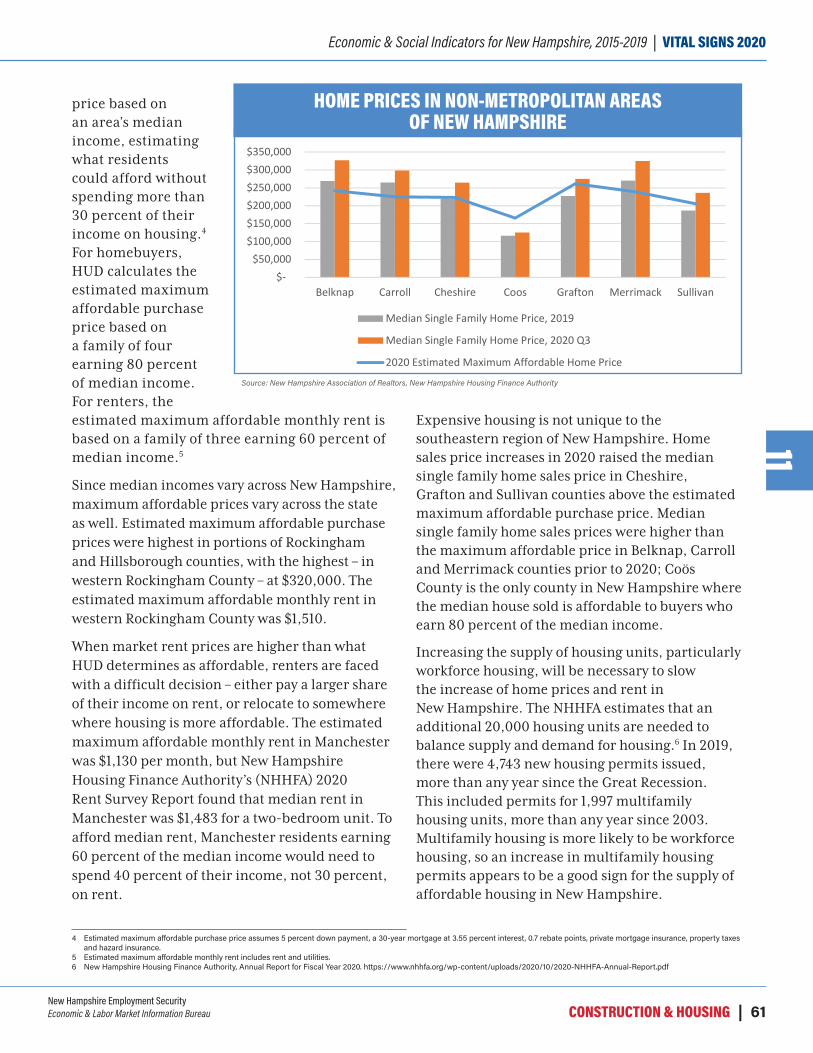
New Hampshire Employment SecurityEconomic & Labor Market Information Bureau CONSTRUCTION & HOUSING | 61
Economic & Social Indicators for New Hampshire, 2015-2019 | VITAL SIGNS 202011
4 Estimated maximum affordable purchase price assumes 5 percent down payment, a 30-year mortgage at 3.55 percent interest, 0.7 rebate points, private mortgage insurance, property taxes and hazard insurance.
5 Estimated maximum affordable monthly rent includes rent and utilities.6 New Hampshire Housing Finance Authority, Annual Report for Fiscal Year 2020. https://www.nhhfa.org/wp-content/uploads/2020/10/2020-NHHFA-Annual-Report.pdf
price based on an area’s median income, estimating what residents could afford without spending more than 30 percent of their income on housing.4 For homebuyers, HUD calculates the estimated maximum affordable purchase price based on a family of four earning 80 percent of median income. For renters, the estimated maximum affordable monthly rent is based on a family of three earning 60 percent of median income.5
Since median incomes vary across New Hampshire, maximum affordable prices vary across the state as well. Estimated maximum affordable purchase prices were highest in portions of Rockingham and Hillsborough counties, with the highest – in western Rockingham County – at $320,000. The estimated maximum affordable monthly rent in western Rockingham County was $1,510.
When market rent prices are higher than what HUD determines as affordable, renters are faced with a difficult decision – either pay a larger share of their income on rent, or relocate to somewhere where housing is more affordable. The estimated maximum affordable monthly rent in Manchester was $1,130 per month, but New Hampshire Housing Finance Authority’s (NHHFA) 2020 Rent Survey Report found that median rent in Manchester was $1,483 for a two-bedroom unit. To afford median rent, Manchester residents earning 60 percent of the median income would need to spend 40 percent of their income, not 30 percent, on rent.
Expensive housing is not unique to the southeastern region of New Hampshire. Home sales price increases in 2020 raised the median single family home sales price in Cheshire, Grafton and Sullivan counties above the estimated maximum affordable purchase price. Median single family home sales prices were higher than the maximum affordable price in Belknap, Carroll and Merrimack counties prior to 2020; Coös County is the only county in New Hampshire where the median house sold is affordable to buyers who earn 80 percent of the median income.
Increasing the supply of housing units, particularly workforce housing, will be necessary to slow the increase of home prices and rent in New Hampshire. The NHHFA estimates that an additional 20,000 housing units are needed to balance supply and demand for housing.6 In 2019, there were 4,743 new housing permits issued, more than any year since the Great Recession. This included permits for 1,997 multifamily housing units, more than any year since 2003. Multifamily housing is more likely to be workforce housing, so an increase in multifamily housing permits appears to be a good sign for the supply of affordable housing in New Hampshire.
$- $50,000
$100,000 $150,000 $200,000 $250,000 $300,000 $350,000
Belknap Carroll Cheshire Coos Grafton Merrimack Sullivan
Home Prices in Non-Metropolitan Areas of New Hampshire
Median Single Family Home Price, 2019
Median Single Family Home Price, 2020 Q3
2020 Estimated Maximum Affordable Home Price
HOME PRICES IN NON-METROPOLITAN AREAS OF NEW HAMPSHIRE
Source: New Hampshire Association of Realtors, New Hampshire Housing Finance Authority

New Hampshire Employment SecurityEconomic & Labor Market Information Bureau62 | CONSTRUCTION & HOUSING
VITAL SIGNS 2020 | Economic & Social Indicators for New Hampshire, 2015-201911
From 2015 to 2019, the existing supply of housing in New Hampshire increased by almost 20,000 units. Nearly three quarters of that increase came from multifamily units, particularly buildings with five or more units. The supply of two-unit
- 1,000 2,000 3,000 4,000 5,000 6,000 7,000 8,000 9,000
10,000
Residential Building Permits
Single-Family Residential Permits Multi-Family Residential Permits
RESIDENTIAL BUILDING PERMITS
Source: U.S. Census Bureau, Building Permits Survey
buildings and one-unit attached houses (townhouses) decreased by around 4,300 units, while the supply of one-unit detached homes increased by around 7,500 units.
- Greg David

New Hampshire Employment SecurityEconomic & Labor Market Information Bureau CONSTRUCTION & HOUSING | 63
Economic & Social Indicators for New Hampshire, 2015-2019 | VITAL SIGNS 202011
CONTRACT VALUE INDICES (base = 1980) December (not seasonally adjusted)
2015 2016 2017 2018 2019
Total constructionNew Hampshire 263.6 253.0 350.0 317.0 279.9New England 342.6 427.5 424.0 447.2 487.0United States 388.6 387.8 444.9 413.4 481.8Nonbuilding constructionNew Hampshire 291.8 74.1 450.1 207.3 290.2New England 256.4 362.9 536.4 426.2 307.0United States 408.9 239.9 555.5 432.6 445.6
Nonresidential constructionNew Hampshire 246.0 319.7 536.1 680.2 350.1New England 424.4 390.1 454.1 588.2 655.1United States 355.1 431.5 414.8 426.8 508.9
Residential constructionNew Hampshire 261.4 292.9 201.3 159.2 235.8New England 319.1 493.2 339.2 339.2 440.4United States 406.0 426.3 413.7 392.6 477.7
Residential construction (seasonally adjusted)New Hampshire 311.4 371.7 268.7 219.8 331.7New England 362.4 560.3 377.9 388.1 490.3United States 456.4 488.0 482.3 465.3 572.4
Source: Federal Reserve Bank of Boston, ELMI Analysis. Last Update 10/1/2020
HOUSING PERMITS AUTHORIZED (not seasonally adjusted) 2015 2016 2017 2018 2019
Total New Hampshire 3,763 3,796 3,625 4,445 4,743Annual percent change 10.6% 0.9% -4.5% 22.6% 6.7%
Total New England 33,109 32,595 33,160 34,375 35,923Annual percent change 14.3% -1.6% 1.7% 3.7% 4.5%
Total United States 1,178,138 1,206,642 1,281,977 1,328,827 1,386,048Annual percent change 12.6% 2.4% 6.2% 3.7% 4.3%
Single Family Units, New Hampshire 2,200 2,680 2,711 2,710 2,746Annual percent change 0.5% 21.8% 1.2% 0.0% 1.3%
Single Family Units, New England 16,323 17,935 18,016 18,159 16,883Annual percent change -2.6% 9.9% 0.5% 0.8% -7.0%
Single Family Units, United States 690,084 750,796 819,976 855,332 862,084Annual percent change 12.6% 2.4% 6.2% 3.7% 4.3%
Source: US Census Bureau, ELMI Analysis. Last Update 10/2/2020
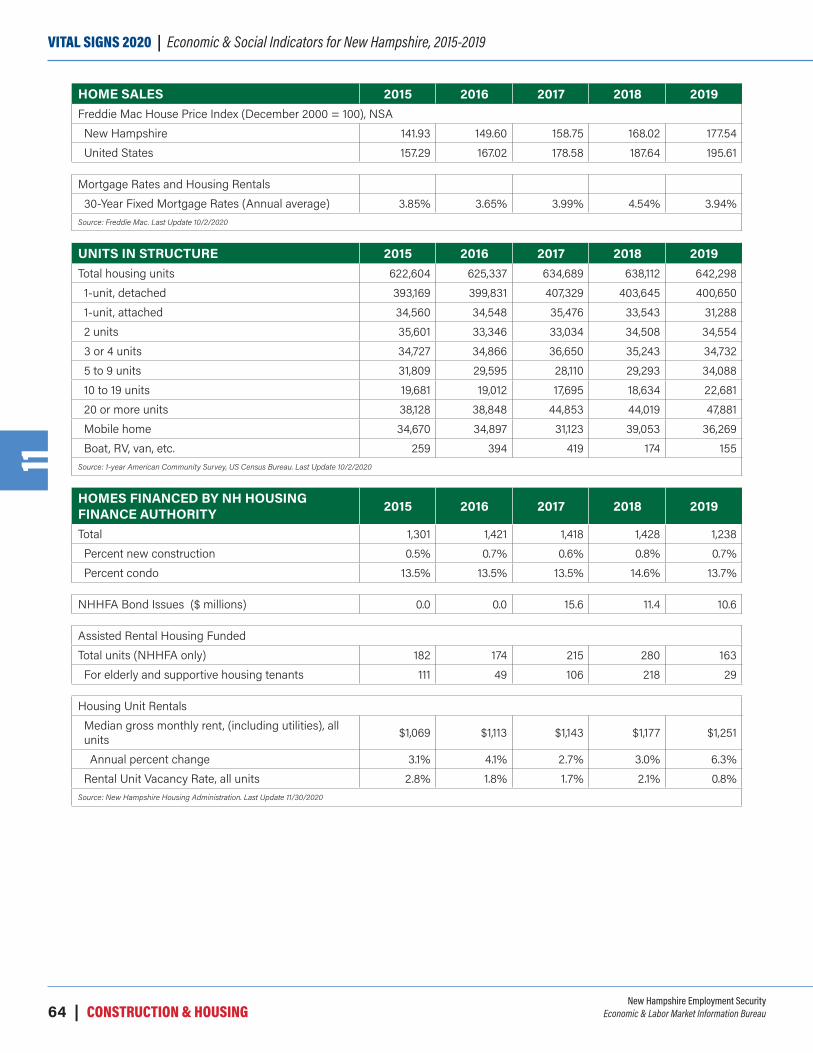
New Hampshire Employment SecurityEconomic & Labor Market Information Bureau64 | CONSTRUCTION & HOUSING
VITAL SIGNS 2020 | Economic & Social Indicators for New Hampshire, 2015-201911
HOME SALES 2015 2016 2017 2018 2019Freddie Mac House Price Index (December 2000 = 100), NSANew Hampshire 141.93 149.60 158.75 168.02 177.54United States 157.29 167.02 178.58 187.64 195.61
Mortgage Rates and Housing Rentals30-Year Fixed Mortgage Rates (Annual average) 3.85% 3.65% 3.99% 4.54% 3.94%
Source: Freddie Mac. Last Update 10/2/2020
UNITS IN STRUCTURE 2015 2016 2017 2018 2019Total housing units 622,604 625,337 634,689 638,112 642,2981-unit, detached 393,169 399,831 407,329 403,645 400,6501-unit, attached 34,560 34,548 35,476 33,543 31,2882 units 35,601 33,346 33,034 34,508 34,5543 or 4 units 34,727 34,866 36,650 35,243 34,7325 to 9 units 31,809 29,595 28,110 29,293 34,08810 to 19 units 19,681 19,012 17,695 18,634 22,68120 or more units 38,128 38,848 44,853 44,019 47,881Mobile home 34,670 34,897 31,123 39,053 36,269Boat, RV, van, etc. 259 394 419 174 155
Source: 1-year American Community Survey, US Census Bureau. Last Update 10/2/2020
HOMES FINANCED BY NH HOUSING FINANCE AUTHORITY 2015 2016 2017 2018 2019
Total 1,301 1,421 1,418 1,428 1,238Percent new construction 0.5% 0.7% 0.6% 0.8% 0.7%Percent condo 13.5% 13.5% 13.5% 14.6% 13.7%
NHHFA Bond Issues ($ millions) 0.0 0.0 15.6 11.4 10.6
Assisted Rental Housing FundedTotal units (NHHFA only) 182 174 215 280 163For elderly and supportive housing tenants 111 49 106 218 29
Housing Unit RentalsMedian gross monthly rent, (including utilities), all units $1,069 $1,113 $1,143 $1,177 $1,251
Annual percent change 3.1% 4.1% 2.7% 3.0% 6.3%Rental Unit Vacancy Rate, all units 2.8% 1.8% 1.7% 2.1% 0.8%
Source: New Hampshire Housing Administration. Last Update 11/30/2020

New Hampshire Employment SecurityEconomic & Labor Market Information Bureau CONSTRUCTION & HOUSING | 65
Economic & Social Indicators for New Hampshire, 2015-2019 | VITAL SIGNS 202011
NEW HAMPSHIRE MULTIPLE LISTING SERVICE DATA ON SALES OF EXISTING HOMESa
2015 2016 2017 2018 2019
Regional Sales and Price Activity - December to DecemberMedian sale priceSingle Family - residential $241,500 $249,800 $266,000 $283,000 $300,000Condominium $173,450 $185,000 $192,000 $205,000 $215,000
Percent change in Price from Prior YearSingle Family - residential 6.2% 3.4% 6.5% 6.4% 6.0%Condominium 3.2% 6.7% 3.8% 6.8% 4.9%
Total Units Sold - 12-Month AverageSingle Family - residential 1,324 1,464 1,482 1,463 1,468Condominium 343 369 405 406 404
a Copyright 2012 Northern New England Real Estate Network, Inc. The reproduction of these statistics is done with the permission of NNEREN. The statistics referenced herein are based solely upon listings submitted to themultiple listing service database of NNEREN and do not include all properties sold and marketed for sale. ALL INFORMATION DEEMED RELIABLE BUT NOT GUARANTEED. Any analysis or commentary related to these statistics is that of the commentator, and not that of NNEREN.
Source: Northern New England Real Estate Network. Last Update 10/2/2020
Prepared by: New Hampshire Employment Security, Economic and Labor Market Information Bureau
www.nhes.nh.gov/elmi | (603) 228-4124
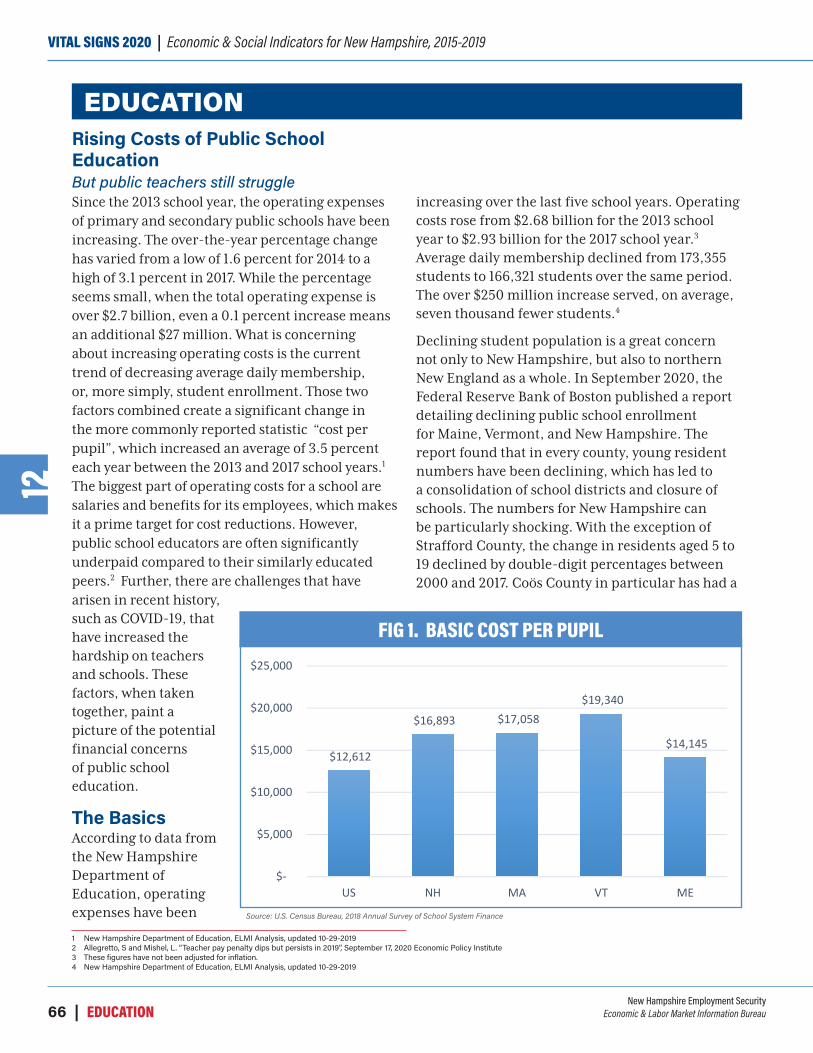
New Hampshire Employment SecurityEconomic & Labor Market Information Bureau66 | EDUCATION
VITAL SIGNS 2020 | Economic & Social Indicators for New Hampshire, 2015-201912
EDUCATION
1 New Hampshire Department of Education, ELMI Analysis, updated 10-29-20192 Allegretto, S and Mishel, L. “Teacher pay penalty dips but persists in 2019”, September 17, 2020 Economic Policy Institute3 These figures have not been adjusted for inflation.4 New Hampshire Department of Education, ELMI Analysis, updated 10-29-2019
Rising Costs of Public School EducationBut public teachers still struggleSince the 2013 school year, the operating expenses of primary and secondary public schools have been increasing. The over-the-year percentage change has varied from a low of 1.6 percent for 2014 to a high of 3.1 percent in 2017. While the percentage seems small, when the total operating expense is over $2.7 billion, even a 0.1 percent increase means an additional $27 million. What is concerning about increasing operating costs is the current trend of decreasing average daily membership, or, more simply, student enrollment. Those two factors combined create a significant change in the more commonly reported statistic “cost per pupil”, which increased an average of 3.5 percent each year between the 2013 and 2017 school years.1 The biggest part of operating costs for a school are salaries and benefits for its employees, which makes it a prime target for cost reductions. However, public school educators are often significantly underpaid compared to their similarly educated peers.2 Further, there are challenges that have arisen in recent history, such as COVID-19, that have increased the hardship on teachers and schools. These factors, when taken together, paint a picture of the potential financial concerns of public school education.
The BasicsAccording to data from the New Hampshire Department of Education, operating expenses have been
increasing over the last five school years. Operating costs rose from $2.68 billion for the 2013 school year to $2.93 billion for the 2017 school year.3 Average daily membership declined from 173,355 students to 166,321 students over the same period. The over $250 million increase served, on average, seven thousand fewer students.4
Declining student population is a great concern not only to New Hampshire, but also to northern New England as a whole. In September 2020, the Federal Reserve Bank of Boston published a report detailing declining public school enrollment for Maine, Vermont, and New Hampshire. The report found that in every county, young resident numbers have been declining, which has led to a consolidation of school districts and closure of schools. The numbers for New Hampshire can be particularly shocking. With the exception of Strafford County, the change in residents aged 5 to 19 declined by double-digit percentages between 2000 and 2017. Coös County in particular has had a
$12,612
$16,893 $17,058 $19,340
$14,145
$-
$5,000
$10,000
$15,000
$20,000
$25,000
US NH MA VT ME
Figure 1: Basic Cost per Pupil
FIG 1. BASIC COST PER PUPIL
Source: U.S. Census Bureau, 2018 Annual Survey of School System Finance

New Hampshire Employment SecurityEconomic & Labor Market Information Bureau EDUCATION | 67
Economic & Social Indicators for New Hampshire, 2015-2019 | VITAL SIGNS 202012
5 Sullivan, Riley. “The Challenge of Declining K–12 Enrollment in Northern New England”. Federal Reserve Bank of Boston. https://www.bostonfed.org/publications/new-england-public-policy-center-regional-briefs/2020/challenge-declining-k-12-enrollment-northern-new-england.aspx
6 U.S. Census Bureau, “2018 Annual Survey of School System Finance”. https://www.census.gov/programs-surveys/school-finances.html7 New Hampshire Department of Education, “Teacher Average Salary in Public School Districts 2013-2019” https://www.education.nh.gov/who-we-are/division-of-educator-and-analytic-
resources/bureau-of-education-statistics/financial-reports
29.2 percent decline in the number of residents age 5 to 19. The numbers are not much better in Maine or Vermont.5 The increase in operating costs and decrease in student populations, while individually meaningful, have a greater significance when taken together as part of cost per pupil.
Cost per pupil is a simple proxy often used to show how much it costs for one year of an average student’s education. The statistic takes operating costs divided by student population, showing the average amount it costs for each student to receive a year of education within an area. In 2018, the United States had a total cost per pupil of $12,612 while New Hampshire, eighth highest in the nation, had a cost per pupil of $16,893. As shown in Figure 1, New Hampshire is not the only New England state above the United States average. In fact, all of New Hampshire’s direct neighbors are also above the United States’ average cost per pupil. Figure 2 breaks down the total into two categories: Instruction and Support Services. Instruction primarily includes the salaries and wages, as well as employee benefits, for the regular, special, and vocational programs offered in both the
regular school year and summer school. Supplies, materials, and other contractual services related to the instruction of students are also included, but make up a minority of the costs. Support Services refer to supporting the instructional needs, student services, and day-to-day necessities of maintaining the school. This includes training, administrative requirements, student services such as nurses, psychologists, and classroom support, and expenses related to the principal and school board. Further detail, including a full breakdown of every category, is in the supplemental Cost Per Pupil tables at the end of this chapter. As Figure 2 shows, New Hampshire and neighboring states remain above the U.S. average in both Instruction and Support Services. As the graph shows, instruction represents the vast majority of costs.6
Teacher SalaryThe salary and benefit costs of teachers were the largest part of school expenditures for public schools in New Hampshire and its neighbors. In the 2018 to 2019 school year, the average teacher salary in public school districts in New Hampshire ranged between $23,671 and $79,076, with a statewide
Figure 2: Detailed Cost per Pupil
$25,000
$19,340 $20,000
$16,893 $17,058
$14,145 $15,000 $12,612
$11,583 $10,586 $10,677
$10,000$7,650 $7,925
$5,000
$US NH
Total for Instruc�on
MA
Total for Support Services
VT
Total Cost per Pupil
ME
FIG 2. DETAILED COST PER PUPIL
Source: U.S. Census Bureau, 2018 Annual Survey of School System Finance

New Hampshire Employment SecurityEconomic & Labor Market Information Bureau68 | EDUCATION
VITAL SIGNS 2020 | Economic & Social Indicators for New Hampshire, 2015-201912
8 Allegretto, S and Mishel, L. “Teacher pay penalty dips but persists in 2019”, September 17, 2020 Economic Policy Institute9 Economic Policy Institute, “Public K-12 Education Employment has collapsed, The Teacher Gap”. Data: https://www.epi.org/chart/jobs-day-the-teacher-gap-public-k-12-education-
employment-has-collapsed-local-public-education-employment-and-employment-needed-to-keep-up-with-enrollment-2003-2020-2/10 U.S. Department of Education. “Teacher Shortage Areas: Data Set New Hampshire 2013 to 2019” https://tsa.ed.gov/#/reports11 Reaching Higher NH, “The Whole Picture of Public Education”, Page 26. https://reachinghighernh.org/wp-content/uploads/2020/01/RHNH_WPOPE.pdf
average of $59,198. The state average salary has been increasing steadily, as shown in Figure 3, over the last five years of data reported.7
As teacher salaries and benefits are the largest portion of costs, it could be low hanging fruit for cutting costs. However, there is already a significant weekly wage penalty for teachers. A wage penalty measures the difference between one occupation’s workers, in this case teachers, and other workers with similar experience, education, and other characteristics. The United States weekly wage penalty for public school teachers is about 20.0 percent while New Hampshire, which ranks twenty-sixth in the weekly wage penalty by state, sits at 18.2 percent.8 This means that, on average, a college graduate working as a teacher in New Hampshire will earn 18.2 percent less than working as a professional in another job of similar educational requirements. Decreasing teacher salaries would strain an already underpaid occupation, exacerbating teacher shortages.
Since 2008, there has been a teacher shortage across the nation. The great recession caused significant issues within education employment
through fallout of the economic crash.9 As shown in Figure 4, local public education employment decreased noticeably from 2008 to 2012. While employment gains started in 2014, the gap between the number of jobs needed to match student enrollment and the number of jobs filled is still hundreds of thousands large. Employment as of September 2019 was still below 2008 levels. New Hampshire has had its fair share of teacher and other instructional staff shortages. Of particular note was a lack of math, science, and foreign language teachers in both primary and secondary schools.10
In many ways, the lack of high wages but many available opportunities makes adjusting teacher wages an ineffective tool for cost savings. If a teacher finds the wages in their district insufficient, there are likely ample opportunities for higher paid employment elsewhere. A study conducted in 2020 by Reaching Higher NH looked at influences on student learning in New Hampshire. The study found that there was no relationship between teacher salary and cost per student. There was, however, a strong
$54,712
$55,986
$56,616
$57,522
$58,278
$52,000
$53,000
$54,000
$55,000
$56,000
$57,000
$58,000
$59,000
2013-2014 2014-2015 2015-2016 2016-2017 2017-2018School Year
Figure 3: Average New Hampshire PublicSchool Teacher Salary
FIG 3. AVERAGE NEW HAMPSHIRE PUBLIC SCHOOL TEACHER SALARY
Source: New Hampshire Department of Education, Teacher Average Salary in Public School Districts 2013-2019

New Hampshire Employment SecurityEconomic & Labor Market Information Bureau EDUCATION | 69
Economic & Social Indicators for New Hampshire, 2015-2019 | VITAL SIGNS 202012
12 State of New Hampshire, Emergency Orders 31, #19, and #32, https://www.governor.nh.gov/news-and-media/covid-19-emergency-orders-202013 Southerton, M. “Testimony to GOFERR Legislative Advisory Board”, New Hampshire Alliance Public Charter Schools. https://www.goferr.nh.gov/sites/g/files/ehbemt366/files/inline-
documents/sonh/20200826-alliance-testimony.pdf14 While not the same as other public schools, the information works as a reasonable comparison.15 Hart Research Associates, “Parents’ and Teachers’ views on Reopening Schools”. Aug/Sep 2020. https://www.aft.org/sites/default/files/survey_school-reopening_augsept2020.pdf
correlation between teacher salary and student outcomes: students in districts with higher-paid teachers had higher math and reading scores, and lower dropout rates. Based upon the nature of school budgets, administrators often cannot offer higher salaries and instead will face educator attrition to other districts or opportunities.11 These concerns are normally troubling, but 2020 has highlighted how much public schools and teachers continue to struggle.
COVID-19, online, and other concernsThe spread of the novel coronavirus resulted in the Governor of New Hampshire ordering public kindergarten through grade 12 schools to transition to remote instruction and support and, on April 16, ordering remote instruction through the end of each district’s school year.12 While initially intended to be a temporary measure, the beginning of the 2020 to 2021 school year saw many schools continuing remote instruction or transitioning to a hybrid —partially remote and partially in person — status rather than returning to exclusive in-person instruction.
Many changes were required in order to make the transition to remote instruction successful. These
changes included the purchase of laptops for students, hiring of additional staff for sanitation, medical, and support services, updates to building ventilation systems, and personal protection equipment, otherwise known as PPE. The New Hampshire Alliance of Public Charter Schools surveyed public charter schools regarding the increased costs for adjustment to the pandemic. The survey found that charter schools had increases of five to ten percent in operating costs over budget.13, 14 In many ways, the pandemic was a perfect storm, straining the financial stability of many schools, but the increased cost was not the only problem.
What is arguably worse is the panic caused by the pandemic. Not only has the situation caused significant concern among parents, but teachers as well. Harts Research Associations conducted a survey of teachers and families of public schools in August and September, looking for information on the coronavirus and the 2020 to 2021 school year. Teachers are responding to the pandemic in interesting ways. Roughly one-third of teachers feel more likely to leave teaching or retire early due to pandemic concerns. This statistic has much to do with age, tenure, and geographic location,
8.09
8.017.92
7.80 7.77 7.777.84 7.85
7.92 7.937.97 8.03
8.11 8.13 8.15 8.17 8.19 8.21 8.24 8.26 8.28 8.30 8.32
7.40
7.50
7.60
7.70
7.80
7.90
8.00
8.10
8.20
8.30
8.40
Sept. 2008 Sept. 2009 Sept. 2010 Sept. 2011 Sept. 2012 Sept. 2013 Sept. 2014 Sept. 2015 Sept. 2016 Sept. 2017 Sept. 2018 Sept. 2019
Num
ber o
f Job
s (M
illio
ns)
Figure 4 Education Employment to Need Sept. 2008 to 2019
Local public education employment
Local public education employment needed to keep up with student enrollment
Local public education employment at 2008 levels
FIG 4. ACTUAL AND NEEDED EDUCATION EMPLOYMENT, SEPT. 2008 TO 2019
Source: Economic Policy Institute Public K-12 Education Employment has collapsed, The Teacher Gap

New Hampshire Employment SecurityEconomic & Labor Market Information Bureau70 | EDUCATION
VITAL SIGNS 2020 | Economic & Social Indicators for New Hampshire, 2015-201912
16 Economic Policy Institute, “Public K-12 Education Employment has collapsed, The Teacher Gap”. Data: https://www.epi.org/chart/jobs-day-the-teacher-gap-public-k-12-education-employment-has-collapsed-local-public-education-employment-and-employment-needed-to-keep-up-with-enrollment-2003-2020-2/
17 ELMI, Current Employment Statistics, New Hampshire Nonfarm Employment by Supersector, Not Seasonally Adjusted, 2018, 2019, 2020.18 McLerath, Keven. August 26,2020. “Schooling During the COVID-19 Pandemic”. https://www.census.gov/library/stories/2020/08/schooling-during-the-covid-19-pandemic.html19 U.S. Census Bureau Household Pulse Survey, Week 1 through 12. https://www.census.gov/programs-surveys/household-pulse-survey/data.html20 It should be noted that the Household Pulse survey does not differential between public and private schools.
but reflects that the vast majority of teachers, 76 percent, feel at least somewhat worried about infection at work.15 This potential for substantial teacher departures is complicated by a significant gap between the number of educational employment jobs currently available and the number needed to keep up with class sizes. This gap, while particularly high post-2008, became a crevasse in 2020. In March 2020, there were 8.04 million jobs in local public education employment nationwide, compared to projected student enrollment needs of 8.34 million jobs. In April 2020, there were 7.60 million jobs for local public education employment compared to projected student enrollment needs of 8.34 million jobs. Figure 5 shows 2020 education employment data up until September, which was the most recent data at time of release.16 New Hampshire in particular had a large drop in educational employment from March 2020 to April 2020 (-9.0 percent) when compared to minor gains in 2019 (0.8 percent) and 2018 (0.8 percent).17 That loss, both nationally and locally, coincided with the implementation
of restrictions on public schools intended to slow the spread of the coronavirus. In New Hampshire, public schools were closed for a week in March 2020, then transitioned to remote instruction for the duration of the 2019 to 2020 school year.
Remote instruction, or distance learning, either by itself or as a hybrid model, continues to be a primary method of teaching in the 2020 to 2021 school year. Phase 1 of the Household Pulse Survey by the U.S. Census Bureau found that “nearly 93 percent of people in households with school-age children engaged in some form of ‘distance learning’….”18 The survey results showed that New Hampshire families averaged 11.4 hours per week on all teaching activities with their children and 4.6 hours per week in virtual contact between students and their teachers from April 16 to June 16, 2020. Students completed much of their work using online resources, but students also used paper materials sent home from school, as shown in Figure 6.19, 20 The change to make distance learning happen is not without its costs, particularly in labor.
8.04 8.04 8.04
7.60
7.317.37
7.55
7.69
7.46
8.33 8.33 8.34 8.34 8.34 8.34 8.34 8.34 8.35
7.007.107.207.307.407.507.607.707.807.908.008.108.208.308.408.50
Jan-20 Feb-20 Mar-20 Apr-20 May-20 Jun-20 Jul-20 Aug-20 Sep-20
Num
ber o
f Job
s (M
illio
ns)
Figure 5 Education Employment to Need in 2020
Local public education employment
Local public education employment needed to keep up with student enrollment
FIG 5. ACTUAL AND NEEDED EDUCATION EMPLOYMENT IN 2020
Source: Economic Policy Institute Public K-12 Education Employment has collapsed, The Teacher Gap

New Hampshire Employment SecurityEconomic & Labor Market Information Bureau EDUCATION | 71
Economic & Social Indicators for New Hampshire, 2015-2019 | VITAL SIGNS 202012
21 Hart Research Associates, “Parents’ and Teachers’ views on Reopening Schools”. Aug/Sep 2020. https://www.aft.org/sites/default/files/survey_school-reopening_augsept2020.pdf22 Sarah Gibson. “N.H.’s Private Schools See Uptick in Interest During Pandemic”. NHPR Aug 31 2020. https://www.nhpr.org/post/nhs-private-schools-see-uptick-interest-during-
pandemic#stream/023 Josie Albertson-Grove. “NH districts see more children homeschooled”. New Hampshire Union Leader October 25,2020 https://www.unionleader.com/news/education/nh-districts-see-
more-children-homeschooled/article_b0c32ec9-95a7-5cdf-81a3-dc2f271fcfd2.html
Teachers have found that teaching with distance learning, or the hybrid teaching method require more work than in-person instruction. The hybrid style is more work, or a lot more work, according to the Harts Research Association survey, with 84 percent of responding teachers finding the method more work than in-person alone, and 74 percent of teachers consider distance learning to be more work than in-person instruction. The vast majority of teachers surveyed, 79 percent, have felt that online instruction has not worked as well as in-person instruction, while 57 percent of parents felt it had worked at least as well.21 The struggle in using distance learning, and the pandemic as a whole, has forced the question on how well families feel their school is handling the changes in teaching during a pandemic or other emergency response. This has led to an interesting dynamic shift.
The pandemic has created significant changes to the methodology of teaching and the tools available to do so. Private schools have seen a significant increase in interest. In general, private schools can provide three things that are helpful in reducing risk in this pandemic: more space, smaller student population, and fewer decision-makers. Non-public schools, such as residential schools and Catholic schools, have seen increased interest from parents, as they were more likely to re-open for in-person instruction.22 Homeschooling has
also become a more popular alternative to public school. Manchester, New Hampshire, had 754 students who were homeschooled in June 2020, but more than 1,100 starting the 2020-2021 school year. In Manchester, the change to homeschooling has been much more common for kindergarten-age children. An increase in homeschooling has also been seen in rural areas and small school districts. Factors that influenced the decision to homeschool were strength of home internet connections, how engaged parents felt their children were in remote learning, and pandemic concerns.23 Each of these changes has culminated in a change in the number of students attending public school. As parents shift to private or homeschooling, the total expense of public education will spread across a smaller number of students, possibly resulting in a loss of formula-based Federal funding. A smaller number of students attending will put greater pressure on school systems and teachers even as the pandemic comes to a close.
Future considerationsIn a normal time, concerns with the cost of public schooling are a common and relentless occurrence. New Hampshire has a history of battling over educational funding, particularly in how tax revenue and government funding provides revenue. However, these are not normal times. The coronavirus pandemic has created unusual
0
50,000
100,000
150,000
200,000
250,000
Week 1 Week 2 Week 3 Week 4 Week 5 Week 6 Week 7 Week 8 Week 9 Week 10 Week 11 Week 12
Fam
ilies
with
stud
ents
in
dist
ance
lear
ning
Figure 6 Use of Materials in Distance Learning in New Hampshire
Using online resources Using paper materials sent home
FIG 6. USE OF MATERIALS IN DISTANCE LEARNING IN NEW HAMPSHIRE
Source: U.S. Census Bureau Household Pulse Survey, Week 1 to 12.
New Hampshire Employment SecurityEconomic & Labor Market Information Bureau72 | EDUCATION
VITAL SIGNS 2020 | Economic & Social Indicators for New Hampshire, 2015-201912
24 Sullivan, Riley. “The Challenge of Declining K–12 Enrollment in Northern New England”. Federal Reserve Bank of Boston. https://www.bostonfed.org/publications/new-england-public-policy-center-regional-briefs/2020/challenge-declining-k-12-enrollment-northern-new-england.aspx
25 U.S. Census Bureau, 2018 Annual Survey of School System Finance
situations that have taxed schools and teachers beyond normal means. The education that students receive today is functioning outside the norm, for better and worse. However, the costs of public education are increasing, and will continue to do so. Changes will not be easy. The industry is already offering wages below the market rate and shortages are already an issue. Seeking to lower the cost of public education through reducing teacher salaries is unlikely to achieve the desired result. Many students have made transitions away from public schools. Some may switch back when
the pandemic ends, but others may continue through private or home schooling. With low wages unlikely to change, there may not be enough future young professionals willing to be public teachers. Consolidation of schools may be inevitable, as the Federal Reserve Bank of Boston predicts,24 but that may not be enough to change the outcome. The continuing hardships for teachers is a reflection of the continuing difficulties of the public education system. Change needs to happen and it will not come easy.
– Marek Rivero
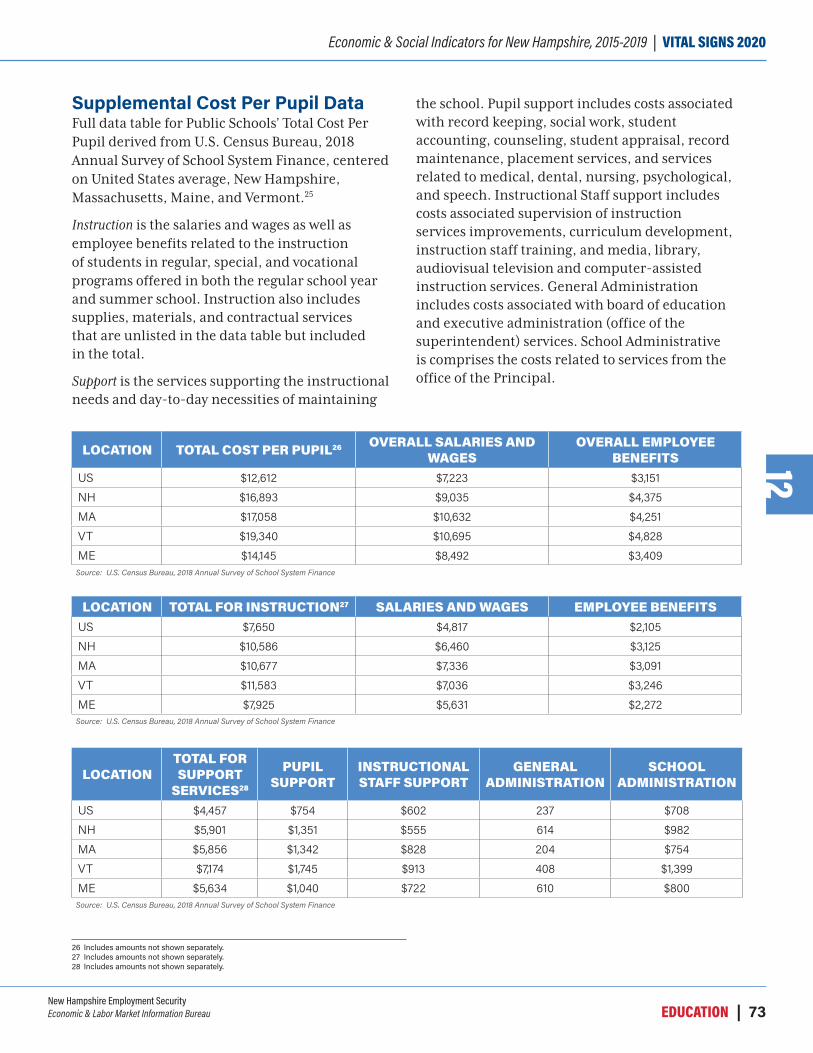
New Hampshire Employment SecurityEconomic & Labor Market Information Bureau EDUCATION | 73
Economic & Social Indicators for New Hampshire, 2015-2019 | VITAL SIGNS 202012
26 Includes amounts not shown separately. 27 Includes amounts not shown separately. 28 Includes amounts not shown separately.
LOCATION TOTAL COST PER PUPIL26 OVERALL SALARIES AND WAGES
OVERALL EMPLOYEE BENEFITS
US $12,612 $7,223 $3,151 NH $16,893 $9,035 $4,375 MA $17,058 $10,632 $4,251 VT $19,340 $10,695 $4,828 ME $14,145 $8,492 $3,409
LOCATION TOTAL FOR INSTRUCTION27 SALARIES AND WAGES EMPLOYEE BENEFITSUS $7,650 $4,817 $2,105 NH $10,586 $6,460 $3,125 MA $10,677 $7,336 $3,091 VT $11,583 $7,036 $3,246 ME $7,925 $5,631 $2,272
Source: U.S. Census Bureau, 2018 Annual Survey of School System Finance
Source: U.S. Census Bureau, 2018 Annual Survey of School System Finance
LOCATIONTOTAL FOR SUPPORT
SERVICES28
PUPIL SUPPORT
INSTRUCTIONAL STAFF SUPPORT
GENERAL ADMINISTRATION
SCHOOL ADMINISTRATION
US $4,457 $754 $602 237 $708 NH $5,901 $1,351 $555 614 $982 MA $5,856 $1,342 $828 204 $754 VT $7,174 $1,745 $913 408 $1,399 ME $5,634 $1,040 $722 610 $800
Source: U.S. Census Bureau, 2018 Annual Survey of School System Finance
Supplemental Cost Per Pupil DataFull data table for Public Schools’ Total Cost Per Pupil derived from U.S. Census Bureau, 2018 Annual Survey of School System Finance, centered on United States average, New Hampshire, Massachusetts, Maine, and Vermont.25
Instruction is the salaries and wages as well as employee benefits related to the instruction of students in regular, special, and vocational programs offered in both the regular school year and summer school. Instruction also includes supplies, materials, and contractual services that are unlisted in the data table but included in the total.
Support is the services supporting the instructional needs and day-to-day necessities of maintaining
the school. Pupil support includes costs associated with record keeping, social work, student accounting, counseling, student appraisal, record maintenance, placement services, and services related to medical, dental, nursing, psychological, and speech. Instructional Staff support includes costs associated supervision of instruction services improvements, curriculum development, instruction staff training, and media, library, audiovisual television and computer-assisted instruction services. General Administration includes costs associated with board of education and executive administration (office of the superintendent) services. School Administrative is comprises the costs related to services from the office of the Principal.

New Hampshire Employment SecurityEconomic & Labor Market Information Bureau74 | EDUCATION
VITAL SIGNS 2020 | Economic & Social Indicators for New Hampshire, 2015-201912
FALL ENROLLMENTS, NEW HAMPSHIRE PUBLIC AND PRIVATE SCHOOLS
2015-16 2016-17 2017-18 2018-19 2019-20
Total public school enrollments (includes preschool) 181,339 179,734 178,328 177,365 176,168
Total nonpublic school enrollments 17,042 16,852 16,422 16,165 15,835Total, all elementary and secondary enrollments 198,381 196,586 194,750 193,530 192,003
Annual percent change, all enrollments -1.4% -0.9% -0.9% -0.6% -0.8%
First grade enrollments, total public 12,898 12,377 12,678 12,351 12,501First grade nonpublic enrollments 773 762 758 699 643Total first grade enrollments 13,671 13,139 13,436 13,050 13,144 Annual percent change, first grade all enrollments -2.3% -3.9% 2.3% -2.9% 0.7%
Twelfth grade enrollments, total public 13,752 13,338 13,235 13,073 13,187Twelfth grade nonpublic enrollments 1,995 2,096 1,984 1,931 1,975Total twelfth grade enrollments 15,747 15,434 15,219 15,004 15,162Annual percent change, twelfth grade all enrollments 0.5% -2.0% -1.4% -1.4% 1.1%
Source: New Hampshire Department of Education, ELMI Analysis. Last Update 9/1/2020
SCHOLASTIC ASSESSMENT TEST 2015-16 2016-17 2017-18 2018-19 2019-20SAT Scores of College-Bound Seniorsa
Evidence-Based Reading and Writing (formerly Critical Reading)New Hampshire 527 532 535 533 531United States 494 533 536 531 528
Math New Hampshire 531 520 528 526 524United States 508 527 531 528 523
Percent of high school graduates taking the SATNew Hampshire * 96.0% 96.0% 95.0% 93.0%United States * 48.0% 58.0% 60.0%
Source: The College Board and National Center for Educational Statistics. Last Update 11/20/2020
a Reflects mean score for all graduates from an academic year who took the SAT at any point during high school. If a student took the SAT more than once, only the most recent result is included in mean score.
* statistics not released due to change in SAT test format
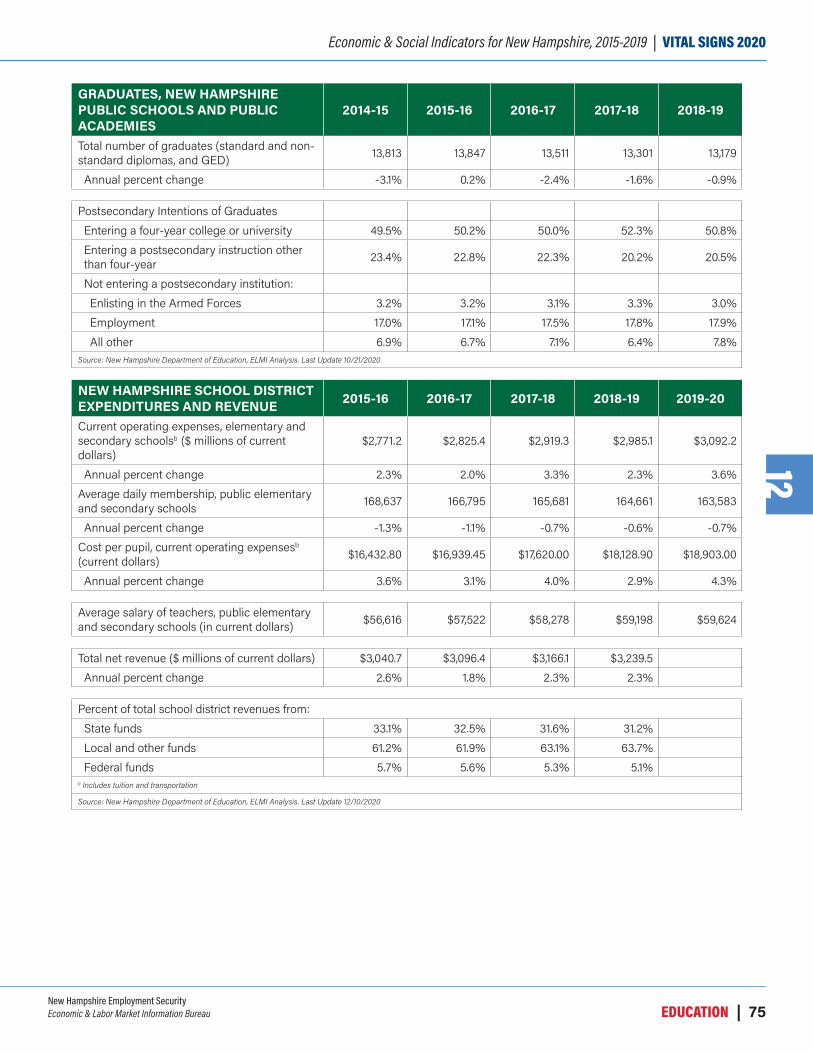
New Hampshire Employment SecurityEconomic & Labor Market Information Bureau EDUCATION | 75
Economic & Social Indicators for New Hampshire, 2015-2019 | VITAL SIGNS 202012
GRADUATES, NEW HAMPSHIRE PUBLIC SCHOOLS AND PUBLIC ACADEMIES
2014-15 2015-16 2016-17 2017-18 2018-19
Total number of graduates (standard and non-standard diplomas, and GED) 13,813 13,847 13,511 13,301 13,179
Annual percent change -3.1% 0.2% -2.4% -1.6% -0.9%
Postsecondary Intentions of GraduatesEntering a four-year college or university 49.5% 50.2% 50.0% 52.3% 50.8%Entering a postsecondary instruction other than four-year 23.4% 22.8% 22.3% 20.2% 20.5%
Not entering a postsecondary institution:Enlisting in the Armed Forces 3.2% 3.2% 3.1% 3.3% 3.0%Employment 17.0% 17.1% 17.5% 17.8% 17.9%All other 6.9% 6.7% 7.1% 6.4% 7.8%
Source: New Hampshire Department of Education, ELMI Analysis. Last Update 10/21/2020
NEW HAMPSHIRE SCHOOL DISTRICT EXPENDITURES AND REVENUE 2015-16 2016-17 2017-18 2018-19 2019-20
Current operating expenses, elementary and secondary schoolsb ($ millions of current dollars)
$2,771.2 $2,825.4 $2,919.3 $2,985.1 $3,092.2
Annual percent change 2.3% 2.0% 3.3% 2.3% 3.6%Average daily membership, public elementary and secondary schools 168,637 166,795 165,681 164,661 163,583
Annual percent change -1.3% -1.1% -0.7% -0.6% -0.7%Cost per pupil, current operating expensesb (current dollars) $16,432.80 $16,939.45 $17,620.00 $18,128.90 $18,903.00
Annual percent change 3.6% 3.1% 4.0% 2.9% 4.3%
Average salary of teachers, public elementary and secondary schools (in current dollars) $56,616 $57,522 $58,278 $59,198 $59,624
Total net revenue ($ millions of current dollars) $3,040.7 $3,096.4 $3,166.1 $3,239.5Annual percent change 2.6% 1.8% 2.3% 2.3%
Percent of total school district revenues from:State funds 33.1% 32.5% 31.6% 31.2%Local and other funds 61.2% 61.9% 63.1% 63.7%Federal funds 5.7% 5.6% 5.3% 5.1%
b Includes tuition and transportation
Source: New Hampshire Department of Education, ELMI Analysis. Last Update 12/10/2020
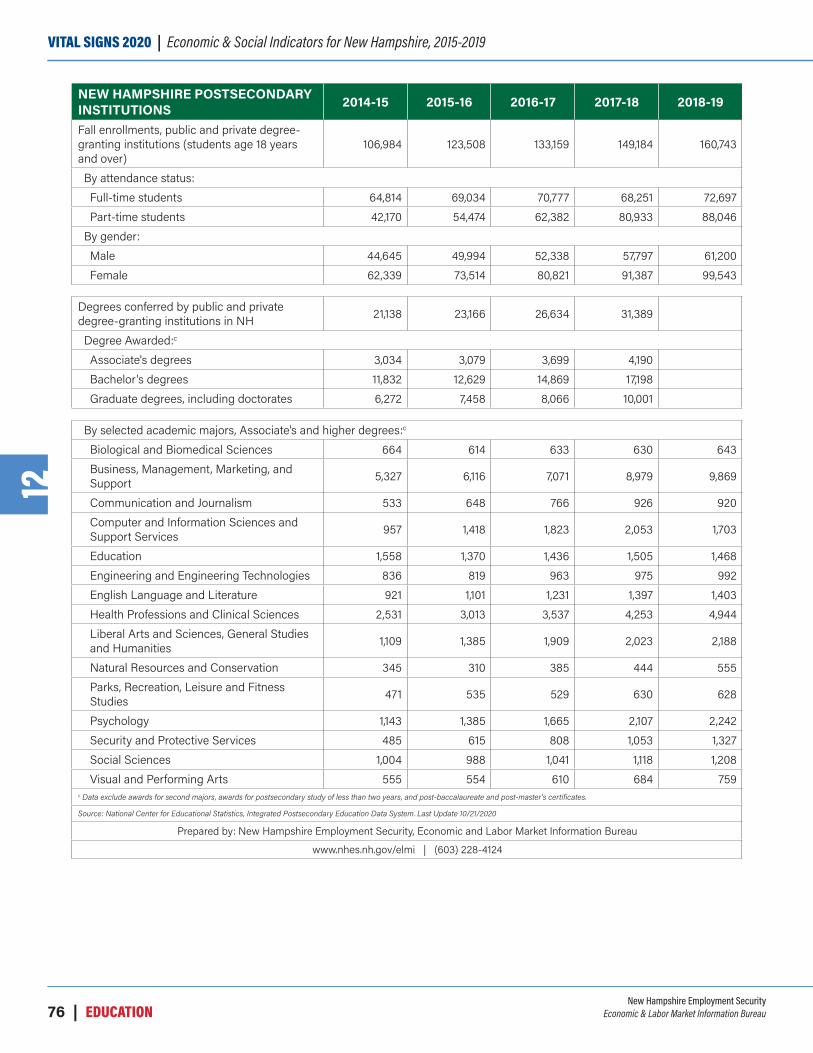
New Hampshire Employment SecurityEconomic & Labor Market Information Bureau76 | EDUCATION
VITAL SIGNS 2020 | Economic & Social Indicators for New Hampshire, 2015-201912
NEW HAMPSHIRE POSTSECONDARY INSTITUTIONS 2014-15 2015-16 2016-17 2017-18 2018-19
Fall enrollments, public and private degree-granting institutions (students age 18 years and over)
106,984 123,508 133,159 149,184 160,743
By attendance status:Full-time students 64,814 69,034 70,777 68,251 72,697Part-time students 42,170 54,474 62,382 80,933 88,046
By gender:Male 44,645 49,994 52,338 57,797 61,200Female 62,339 73,514 80,821 91,387 99,543
Degrees conferred by public and private degree-granting institutions in NH 21,138 23,166 26,634 31,389
Degree Awarded:c
Associate's degrees 3,034 3,079 3,699 4,190Bachelor's degrees 11,832 12,629 14,869 17,198Graduate degrees, including doctorates 6,272 7,458 8,066 10,001
By selected academic majors, Associate's and higher degrees:c
Biological and Biomedical Sciences 664 614 633 630 643 Business, Management, Marketing, and Support 5,327 6,116 7,071 8,979 9,869
Communication and Journalism 533 648 766 926 920 Computer and Information Sciences and Support Services 957 1,418 1,823 2,053 1,703
Education 1,558 1,370 1,436 1,505 1,468 Engineering and Engineering Technologies 836 819 963 975 992 English Language and Literature 921 1,101 1,231 1,397 1,403 Health Professions and Clinical Sciences 2,531 3,013 3,537 4,253 4,944 Liberal Arts and Sciences, General Studies and Humanities 1,109 1,385 1,909 2,023 2,188
Natural Resources and Conservation 345 310 385 444 555 Parks, Recreation, Leisure and Fitness Studies 471 535 529 630 628
Psychology 1,143 1,385 1,665 2,107 2,242 Security and Protective Services 485 615 808 1,053 1,327 Social Sciences 1,004 988 1,041 1,118 1,208 Visual and Performing Arts 555 554 610 684 759
c Data exclude awards for second majors, awards for postsecondary study of less than two years, and post-baccalaureate and post-master's certificates.
Source: National Center for Educational Statistics, Integrated Postsecondary Education Data System. Last Update 10/21/2020
Prepared by: New Hampshire Employment Security, Economic and Labor Market Information Bureau
www.nhes.nh.gov/elmi | (603) 228-4124

New Hampshire Employment SecurityEconomic & Labor Market Information Bureau HEALTH | 77
Economic & Social Indicators for New Hampshire, 2015-2019 | VITAL SIGNS 202013
HEALTH
1 Families USA, The COVID-19 Pandemic and Resulting Economic Crash Have Caused the Greatest Health Insurance Losses in American History, https://www.familiesusa.org/wp-content/uploads/2020/07/COV-254_Coverage-Loss_Report_7-17-20.pdf.
2 Binge drinking is defined as having at least four (for women) or five (for men) drinks on one occasion during the previous 30 days. Chronic drinking is defined as having at least eight (for women) or fifteen (for men) drinks per week.
Health Insurance CoverageThe number of uninsured individuals in New Hampshire increased in 2019, for the first time since 2012. Uninsured individuals rose from 68,200 to 84,600 residents, or from 5.2 percent to 6.4 percent of the population. The increase in uninsured population was associated with a decrease in the number of individuals receiving insurance through an employer, and from a decrease in the number receiving insurance through Medicaid. More than half of New Hampshire residents, 57 percent, received health insurance through an employer, followed by those enrolled in Medicare, 16 percent, and Medicaid, 14 percent.
With the majority of New Hampshire residents receiving insurance through an employer, the coronavirus pandemic, which led to increased unemployment during the public health crisis, increased the number of uninsured residents in the state. Individuals with employer-based health insurance who lost their jobs during the pandemic also lost access to employer-based health insurance. Many of these individuals were able to remain insured, through either COBRA, a spouse’s employer, a marketplace-based insurance policy, or through a public plan such as Medicare or Medicaid. But not everyone was able to take advantage of one of these options. A study by Families USA estimated that in May 2020, there
were 96,000 uninsured adults age 19-64 in New Hampshire, an increase of 23,000 from 2019.1
Health RankingsThe UnitedHealth Foundation (UHF) ranked New Hampshire as the 6th healthiest state in 2019. This was the second year in a row that New Hampshire ranked 6th. Overall, New England performed well in the UHF rankings, as Vermont was rated the healthiest state, with Massachusetts (2nd) and Connecticut (4th) at top of the list as well.
New Hampshire performed well in metrics evaluating air quality, rates of child poverty, violent crime, and infant mortality. New Hampshire’s ranking in the excessive drinking measure improved from 40th in 2018 to 27th in 2019, as the percentage of residents who reported engaging in binge drinking or chronic drinking declined from 20.7 percent in 2018 to 18.2 percent in 2019.2
New Hampshire did not perform well in every measure. Among adults, 13.8 percent reported
0%
10%
20%
30%
40%
50%
60%
70%
80%
90%
100%
2010 2011 2012 2013 2014 2015 2016 2017 2018 2019
Insurance Coverage by Plan Type
Uninsured
VA/Military
Medicare
Medicaid
Non-Group
Employer
INSURANCE COVERAGE BY PLAN TYPE
Source: Kaiser Family Foundation

New Hampshire Employment SecurityEconomic & Labor Market Information Bureau78 | HEALTH
VITAL SIGNS 2020 | Economic & Social Indicators for New Hampshire, 2015-201913
3 Drug death rates used in this measure were a 3-year average, covering 2015-2017 deaths.
frequent mental distress – indicating their mental health was not good 14 or more days within the past 30 days. This was higher than the previous year, when 12 percent reported frequent mental distress. Both New Hampshire and the U.S. as a whole have reported increased rates of frequent mental distress since 2015, although distress increased at a faster rate in New Hampshire; the Granite State’s ranking in this measure fell from 19th in 2015 to 33rd in 2019.
New Hampshire ranked 42nd in disparity in health status, which measures the difference between the percentage of adults ages 25 and older with at least a high school education compared with those without who reported their health is very good or excellent. The gap between these populations in New Hampshire was 30.9 percent. For almost all gender, racial/ethnic, educational attainment and earnings categories, residents of New Hampshire reported very good or excellent health at a higher rate than the U.S. overall. But the gap between those with a high school degree and those without was larger than in the U.S. overall.
Among New Hampshire residents without a high school diploma, 27.1 percent reported having very good or excellent health, 3.1 percentage points higher than in the U.S. overall. High school graduates in the U.S. reported having very good or
excellent health 40.1 percent of the time, 16.1 percentage points higher than individuals without a high school diploma, while in New Hampshire, the gap between these groups was 21.5 percentage points. Among college graduates in New Hampshire, 70.5 percent reported very good or excellent health, 43.4 percentage points higher than residents without a high school diploma. Nationwide, the gap between these groups was 40.8 percentage points.
Drug Deaths and Opioid AbuseNew Hampshire had one of the highest rates of drug deaths in the U.S, ranking 48th in UHF’s rankings for this measure. While this ranking was actually an improvement from 49th in 2018, the rate of drug deaths increased, from 31.9 deaths per 100,000 residents to 35.2 deaths.3 Per capita drug deaths were below the U.S. average for residents age 55 to 74, but above average for every population group between ages 15 and 54. The drug death rate was highest for residents age 25 to 34, with 91.4 deaths per 100,000 residents.
Drug death rates were highest among white residents, 36.8 deaths per 100,000, and male residents, 49.1 deaths per 100,000. The death rate for Hispanic residents was 36 percent lower than the rate for white residents, 23.6, but was more
0% 10% 20% 30% 40% 50% 60% 70% 80%
New Hampshire
U.S.
New Hampshire
U.S.
New Hampshire
U.S.
New Hampshire
U.S.
Less
Than
High
Scho
ol
High
Scho
olDi
plom
aSo
me
Colle
ge
Colle
geGr
adua
te(2
- or
4-Ye
ar)
Percentage of Population Reporting Very Good or Excellent Health
PERCENTAGE OF POPULATION REPORTING VERY GOOD OR EXCELLENT HEALTH
Source: UnitedHealth Foundation

New Hampshire Employment SecurityEconomic & Labor Market Information Bureau HEALTH | 79
Economic & Social Indicators for New Hampshire, 2015-2019 | VITAL SIGNS 202013
4 National Institute on Drug Abuse, New Hampshire: Opioid-Involved Deaths and Related Harms. https://www.drugabuse.gov/drug-topics/opioids/opioid-summaries-by-state/new-hampshire-opioid-involved-deaths-related-harms.
5 Centers for Disease Control and Prevention, High School Youth Risk Behavior Survey, 2019, https://nccd.cdc.gov/youthonline/App/Results.aspx
than 2 ½ times higher than the national drug death rate for the Hispanic population.
The majority of drug-related deaths in New Hampshire were the result of opioid overdoses. Opioid overdoses were responsible 412 deaths in 2018, 33.1 deaths per 100,000 residents.4 This was actually a slight decrease from the previous year, when there were 424 opioid overdose-related deaths. 2018 was the second year in a row that opioid overdose deaths declined slightly, but deaths remain far above pre-2014 levels. Overdose deaths increased dramatically in 2014, as synthetic opioids, such as fentanyl, became the primary cause of opioid overdose deaths, while overdose deaths caused by prescription opioids and heroin have declined.
Tobacco and NicotineSmoking is the leading cause of preventable deaths in the U.S., responsible for 480,000 deaths per year. According to UHF’s rankings, New Hampshire ranked 21st in the nation in percentage of adults who smoke, with 15.6 percent of adults smoking frequently in 2019. Although the percentage of
adults who smoke has decreased in recent years, the percentage of teenagers who use tobacco products, particularly e-cigarettes, has increased substantially in New Hampshire in recent years.
A CDC survey in 2019 reported that 9.5 percent of high school students in New Hampshire used e-cigarettes daily, the second highest rate of any state surveyed after West Virginia (data were not available for 3 states).5 In 2017, this survey reported only four percent of New Hampshire high school students used e-cigarettes daily.
New Hampshire’s fiscal year 2020-2021 budget, passed in September 2019, raised the minimum age to purchase tobacco and e-cigarettes from 18 to 19. This change was scheduled to take effect on January 1, 2020. However, before this increase took effect, the federal government raised the minimum age to 21, effective December 20, 2019.
Public health experts hope that raising the minimum age to purchase tobacco products to 21 will significantly reduce access to these products for adolescents. The American Lung Association
All Opioids Prescrip�on Opioids Heroin Synthe�c Opioids500 450 412400 386350 300 250 200 150 100
50 430
19992000
20012002
20032004
20052006
20072008
20092010
20112012
20132014
20152016
20172018
DRUG DEATH RATES
Source: National Institute on Drug Abuse
New Hampshire Employment SecurityEconomic & Labor Market Information Bureau80 | HEALTH
VITAL SIGNS 2020 | Economic & Social Indicators for New Hampshire, 2015-201913
6 American Lung Association, Tobacco 21 Laws: Raising the Minimum Sales Age for All Tobacco Products to 21, https://www.lung.org/policy-advocacy/tobacco/prevention/tobacco-21-laws.
estimates that the increased minimum age will reduce smoking among individuals age 15 to 17 by 25 percent, and reduce smoking among individuals age 18 to 20 by 15 percent.6
CoronavirusThe SARS-CoV-2 coronavirus has infected millions of Americans, and killed more than 500,000 so far. Many more Americans have been hospitalized, or have suffered long-lasting side-effects including fatigue, shortness of breath, joint and muscle pain, memory and concentration issues, loss of taste and smell, and more.
As 2021 begins, three coronavirus vaccines have been approved on an emergency basis, and New Hampshire is in the early stages of vaccinating its population. Hopefully, as the population achieves herd immunity, when enough people become immune to a disease to make its spread unlikely, restrictions on public activities can be safely lifted, and the economy will be able to
operate without restriction. But even after herd immunity has been achieved, there will be long-lasting effects of the coronavirus pandemic.
Since the pandemic began, many New Hampshire residents have struggled with high levels of stress, isolation, and poor mental health. Food and housing insecurity have been issues for many as well, and public health experts worry that the pandemic has increased drug and alcohol abuse.
Residents who lost health insurance coverage may not be able to afford treatment for health issues. Even with health insurance, residents may have avoided medical treatment for serious conditions during the pandemic, avoiding health care settings due to fear of potential virus exposure. All of these issues have the potential to negatively impact health outcomes for New Hampshire residents long after the coronavirus pandemic ends.
- Greg David

New Hampshire Employment SecurityEconomic & Labor Market Information Bureau HEALTH | 81
Economic & Social Indicators for New Hampshire, 2015-2019 | VITAL SIGNS 202013
HOSPITAL INSURANCE 2015 2016 2017 2018 2019HOSPITAL INSURANCEOriginal Medicare 244,829 249,623 250,636 251,956 243,076Medicare Advantage & Other Health Plans 18,832 22,752 30,354 38,222 55,665
263,661 272,375 280,990 290,178 298,741
PRESCRIPTION DRUG (Medicare Part D)Prescription Drug Plans 148,836 157,561 160,943 163,105 162,971Medicare Advantage Prescription Drug 14,395 18,299 23,910 31,454 40,241
Yearly Aged and Disabled Enrollment Aged Total 217,110 225,360 233,852 243,236 252,385Disabled Total 46,552 47,015 47,138 46,941 46,357
Source: Centers for Medicare & Medicaid Services. Last Update 9/4/2020
MEDICAID INSURANCE 2014 2015 2016 2017 2018Total Medicaid Enrollees 206,997 204,458 200,850 Federal Share, Medicaid Expenditures (Millions) $2,087.4 $3,669.7 $4,715.1 $4,616.2 $4,742.9 New Hampshire Share, Medicaid Expenditures (Millions) $1,948.4 $2,144.5 $2,435.2 $2,523.4 $2,707.0
Source: Centers for Medicare & Medicaid Services. Last Update 9/8/2020
MEDICARE UTILIZATION 2014 2015 2016 2017 2018SKILLED NURSING FACILITIES (Medicare)Total Persons With Utilization*New Hampshire 11,184 11,190 10,812 10,745 10,162United States 1,831,387 1,844,209 1,802,182 1,763,018 1,703,381
Covered Admissions Per 1,000 Original Medicare Part A EnrolleesNew Hampshire 63 62 59 58 55United States 68 68 66 65 62
Covered Days of Care Per 1,000 Original Medicare Part A EnrolleesNew Hampshire 1,609 1,566 1,436 1,392 1,339United States 1,843 1,812 1,693 1,623 1,559
Program Payments Per Covered DayNew Hampshire 473 472 481 486 490United States 422 434 446 459 471
*Utilization expresses the number of services used per year or per number of persons eligible for the services
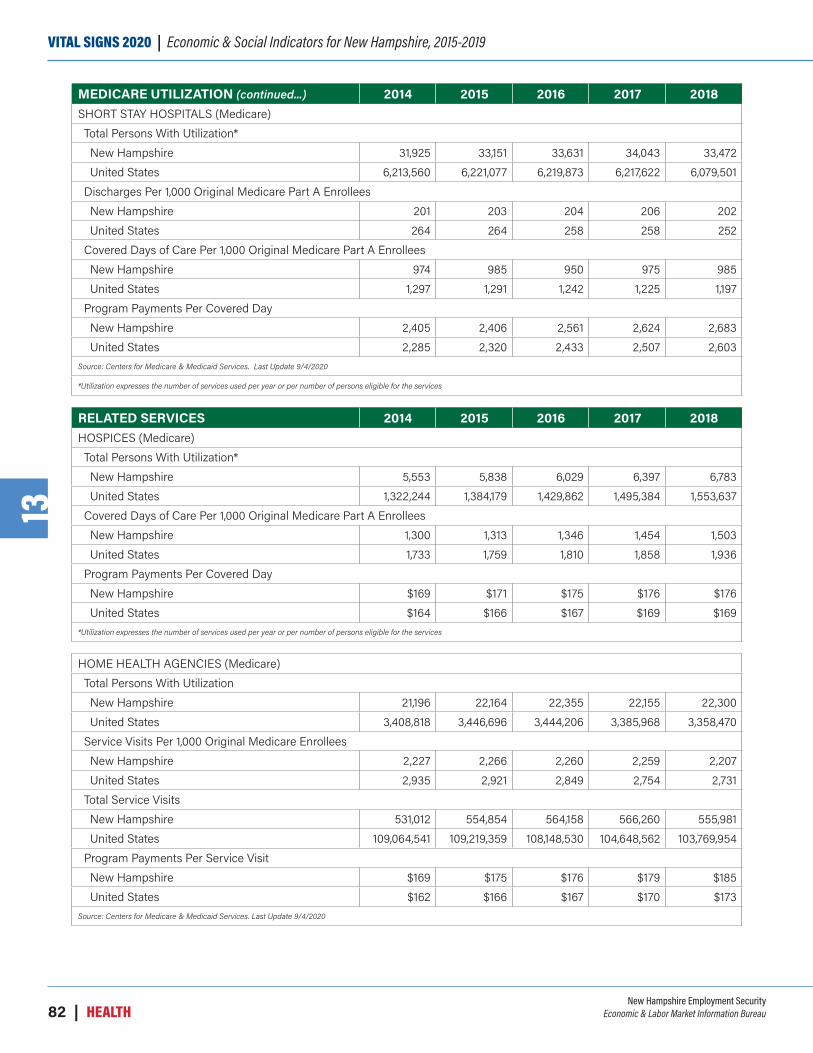
New Hampshire Employment SecurityEconomic & Labor Market Information Bureau82 | HEALTH
VITAL SIGNS 2020 | Economic & Social Indicators for New Hampshire, 2015-201913
MEDICARE UTILIZATION (continued...) 2014 2015 2016 2017 2018SHORT STAY HOSPITALS (Medicare)Total Persons With Utilization*New Hampshire 31,925 33,151 33,631 34,043 33,472United States 6,213,560 6,221,077 6,219,873 6,217,622 6,079,501
Discharges Per 1,000 Original Medicare Part A EnrolleesNew Hampshire 201 203 204 206 202United States 264 264 258 258 252
Covered Days of Care Per 1,000 Original Medicare Part A EnrolleesNew Hampshire 974 985 950 975 985United States 1,297 1,291 1,242 1,225 1,197
Program Payments Per Covered DayNew Hampshire 2,405 2,406 2,561 2,624 2,683United States 2,285 2,320 2,433 2,507 2,603
Source: Centers for Medicare & Medicaid Services. Last Update 9/4/2020
*Utilization expresses the number of services used per year or per number of persons eligible for the services
RELATED SERVICES 2014 2015 2016 2017 2018HOSPICES (Medicare)Total Persons With Utilization*New Hampshire 5,553 5,838 6,029 6,397 6,783United States 1,322,244 1,384,179 1,429,862 1,495,384 1,553,637
Covered Days of Care Per 1,000 Original Medicare Part A EnrolleesNew Hampshire 1,300 1,313 1,346 1,454 1,503United States 1,733 1,759 1,810 1,858 1,936
Program Payments Per Covered DayNew Hampshire $169 $171 $175 $176 $176United States $164 $166 $167 $169 $169
*Utilization expresses the number of services used per year or per number of persons eligible for the services
HOME HEALTH AGENCIES (Medicare)Total Persons With UtilizationNew Hampshire 21,196 22,164 22,355 22,155 22,300United States 3,408,818 3,446,696 3,444,206 3,385,968 3,358,470
Service Visits Per 1,000 Original Medicare EnrolleesNew Hampshire 2,227 2,266 2,260 2,259 2,207United States 2,935 2,921 2,849 2,754 2,731
Total Service VisitsNew Hampshire 531,012 554,854 564,158 566,260 555,981United States 109,064,541 109,219,359 108,148,530 104,648,562 103,769,954
Program Payments Per Service VisitNew Hampshire $169 $175 $176 $179 $185United States $162 $166 $167 $170 $173
Source: Centers for Medicare & Medicaid Services. Last Update 9/4/2020
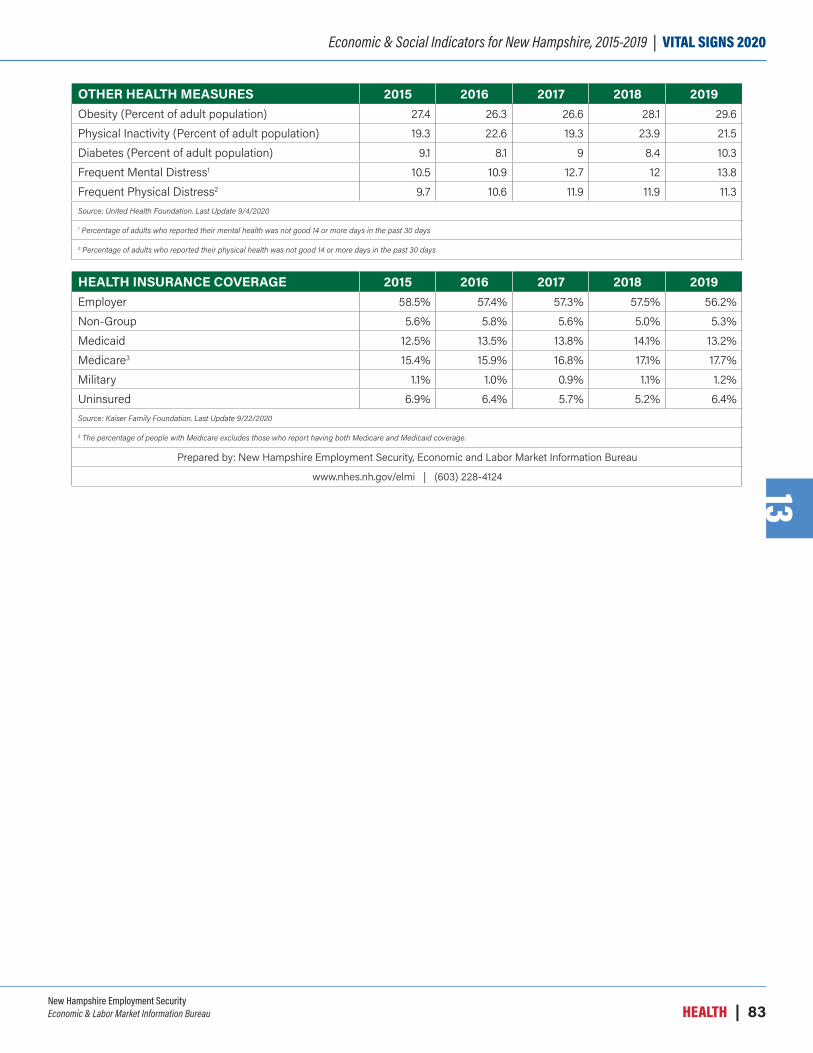
New Hampshire Employment SecurityEconomic & Labor Market Information Bureau HEALTH | 83
Economic & Social Indicators for New Hampshire, 2015-2019 | VITAL SIGNS 202013
OTHER HEALTH MEASURES 2015 2016 2017 2018 2019Obesity (Percent of adult population) 27.4 26.3 26.6 28.1 29.6Physical Inactivity (Percent of adult population) 19.3 22.6 19.3 23.9 21.5Diabetes (Percent of adult population) 9.1 8.1 9 8.4 10.3Frequent Mental Distress1 10.5 10.9 12.7 12 13.8Frequent Physical Distress2 9.7 10.6 11.9 11.9 11.3Source: United Health Foundation. Last Update 9/4/2020
1 Percentage of adults who reported their mental health was not good 14 or more days in the past 30 days
2 Percentage of adults who reported their physical health was not good 14 or more days in the past 30 days
HEALTH INSURANCE COVERAGE 2015 2016 2017 2018 2019Employer 58.5% 57.4% 57.3% 57.5% 56.2%Non-Group 5.6% 5.8% 5.6% 5.0% 5.3%Medicaid 12.5% 13.5% 13.8% 14.1% 13.2%Medicare3 15.4% 15.9% 16.8% 17.1% 17.7%Military 1.1% 1.0% 0.9% 1.1% 1.2%Uninsured 6.9% 6.4% 5.7% 5.2% 6.4%Source: Kaiser Family Foundation. Last Update 9/22/2020
3 The percentage of people with Medicare excludes those who report having both Medicare and Medicaid coverage.
Prepared by: New Hampshire Employment Security, Economic and Labor Market Information Bureau
www.nhes.nh.gov/elmi | (603) 228-4124
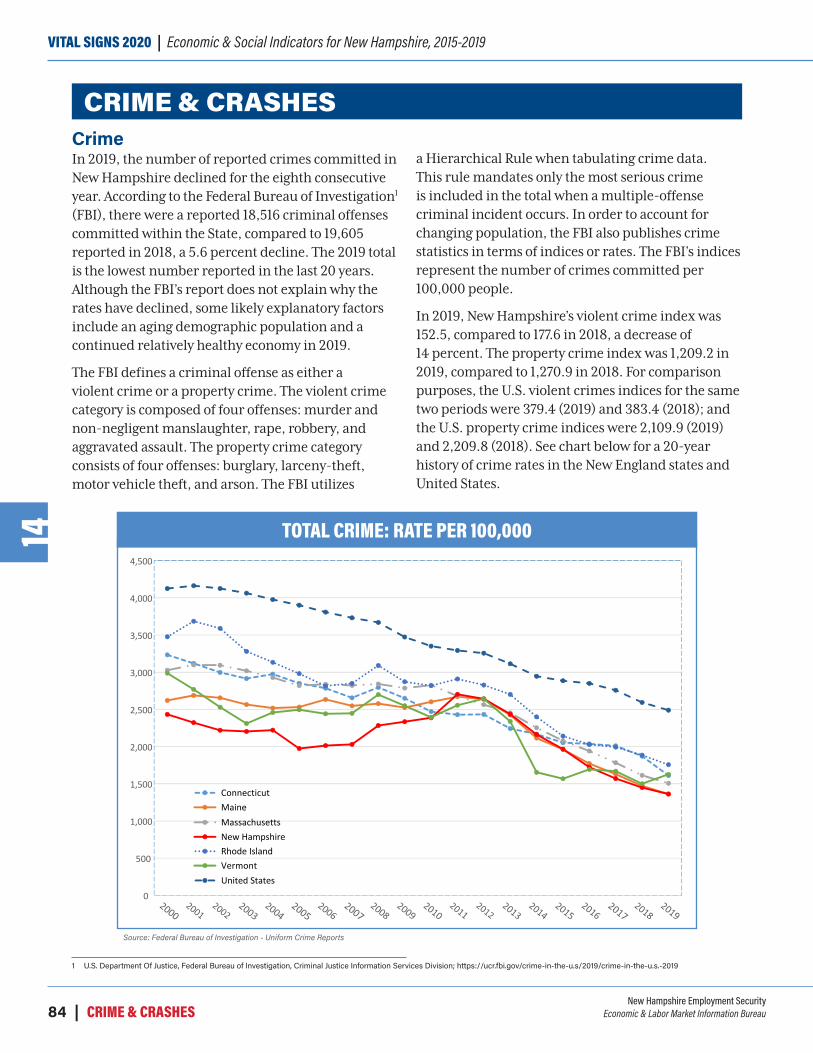
New Hampshire Employment SecurityEconomic & Labor Market Information Bureau84 | CRIME & CRASHES
VITAL SIGNS 2020 | Economic & Social Indicators for New Hampshire, 2015-201914
CRIME & CRASHES
1 U.S. Department Of Justice, Federal Bureau of Investigation, Criminal Justice Information Services Division; https://ucr.fbi.gov/crime-in-the-u.s/2019/crime-in-the-u.s.-2019
CrimeIn 2019, the number of reported crimes committed in New Hampshire declined for the eighth consecutive year. According to the Federal Bureau of Investigation1 (FBI), there were a reported 18,516 criminal offenses committed within the State, compared to 19,605 reported in 2018, a 5.6 percent decline. The 2019 total is the lowest number reported in the last 20 years. Although the FBI’s report does not explain why the rates have declined, some likely explanatory factors include an aging demographic population and a continued relatively healthy economy in 2019.
The FBI defines a criminal offense as either a violent crime or a property crime. The violent crime category is composed of four offenses: murder and non-negligent manslaughter, rape, robbery, and aggravated assault. The property crime category consists of four offenses: burglary, larceny-theft, motor vehicle theft, and arson. The FBI utilizes
a Hierarchical Rule when tabulating crime data. This rule mandates only the most serious crime is included in the total when a multiple-offense criminal incident occurs. In order to account for changing population, the FBI also publishes crime statistics in terms of indices or rates. The FBI’s indices represent the number of crimes committed per 100,000 people.
In 2019, New Hampshire’s violent crime index was 152.5, compared to 177.6 in 2018, a decrease of 14 percent. The property crime index was 1,209.2 in 2019, compared to 1,270.9 in 2018. For comparison purposes, the U.S. violent crimes indices for the same two periods were 379.4 (2019) and 383.4 (2018); and the U.S. property crime indices were 2,109.9 (2019) and 2,209.8 (2018). See chart below for a 20-year history of crime rates in the New England states and United States.
0
500
1,000
1,500
2,000
2,500
3,000
3,500
4,000
4,500
Total Crime: Rate per 100,000
ConnecticutMaineMassachusettsNew HampshireRhode IslandVermontUnited States
TOTAL CRIME: RATE PER 100,000
Source: Federal Bureau of Investigation - Uniform Crime Reports

New Hampshire Employment SecurityEconomic & Labor Market Information Bureau CRIME & CRASHES | 85
Economic & Social Indicators for New Hampshire, 2015-2019 | VITAL SIGNS 202014
2 U.S Department of Health and Human Services, Substance Abuse and Mental Health Services Administration, Center for Behavioral Health Statistics and Quality, “Results from the 2013 National Survey on Drug Use and Health: Summary of National Findings”; https://www.samhsa.gov/data/sites/default/files/NSDUHresultsPDFWHTML2013/Web/NSDUHresults2013.pdf
3 U.S. Center for Disease Control and Prevention, Morbidity and Mortality Weekly Report, “Alcohol-Impaired Driving Among Adults – United States, 2012”; https://www.cdc.gov/mmwr/preview/mmwrhtml/mm6430a2.htm
4 American Automotive Association; https://newsroom.aaa.com/2018/10/new-vehicle-technologies-double-repair-bills-minor-collisions/
ArrestsWith fewer violent and property crimes committed year-over-year, the total number of arrests during 2019 declined by 5.3 percent. Juvenile arrests in 2019 were lower than the previous year by 1.2 percent. Despite these declining trends, the number of driving under the influence (DUI) arrests increased by 1.2 percent year-over-year. Even more disturbing was the fact that juvenile DUI arrests increased 17.2 percent in 2019 from 2018 levels.
In 2019, there were 5,116 DUI arrests within the State of New Hampshire. These individuals accounted for just under one-half of one percent of the population 18 years or older. On first appearance, this seems to be a relatively small percentage of the population. However, this statistic represents only those individuals arrested by law enforcement when driving under the influence. The results of a survey published by the U.S. Department of Health and Human Services2 (HHS) helps put this estimate in context. According to this HHS study, an estimated 10.9 percent of the U.S. population aged 12 and over operated a motor vehicle under the influence of alcohol during 2013. (Note: results by state were not available.) Survey results from the Center for Disease Control and Prevention3 (CDC) provide further evidence of the DUI problem. According to the CDC study, during 2012, there were an estimated 313 impaired driving episodes in New Hampshire per 1,000 adults. Although we do not know the total number of individuals who drove while under the influence of alcohol in 2019, based on these two studies, it is almost certainly more than the number of individuals arrested. Because of the potentially devastating impact of impaired driving, it is disturbing to see an increase in the DUI rate in 2019.
Traffic CrashesFor the second year in a row, the number of reported vehicle crashes in New Hampshire
declined in 2019. Fatal vehicle crashes declined to a five-year low in 2019. Despite fewer crashes, the total value of auto insurance claims increased to over $620 million dollars during this same period. Many new vehicles are equipped with Advanced Driver Assistance Systems (ADAS). ADAS equipped vehicles utilize sensors, which alert drivers to a potential crash. These systems reduce the risk of automobile accidents. A study, released by the American Automobile Association (AAA), indicated the repair cost to an ADAS equipped vehicle can cost almost two and half times the repair cost of a vehicle without these safety systems.4 When an ADAS equipped vehicle is damaged, it is very expensive to repair. This may partially explain why the total value of claims increased by nearly four and one half percent in 2019 despite the fact that there were fewer vehicle crashes.
COVID-19 Impact The year 2020 will forever be remembered for the coronavirus pandemic. As 2020 ends, COVID-19 cases continued to cause havoc across the state. Once the year is complete, researchers and analysts can start to tabulate and investigate the effects of COVID-19 on the citizens of New Hampshire. It certainly caused disruption to many parts of society. In an attempt to limit the spread of COVID-19, Governor Sununu issued a number of Emergency Orders in the spring of 2020. Two of these Emergency Orders affected nearly all residents. On March 16, Emergency Order 1 required all public K-12 school districts to transition from classroom to remote instruction. Ten days later, on March 26, Emergency Order 17 mandated all businesses and other organizations that did not provide essential services to close their facilities to workers, customers, and the public. Included in this latter restriction was a stay-at-home order.
Due to these Emergency Order restrictions, many New Hampshire residents stayed home and drove

New Hampshire Employment SecurityEconomic & Labor Market Information Bureau86 | CRIME & CRASHES
VITAL SIGNS 2020 | Economic & Social Indicators for New Hampshire, 2015-201914
5 National Public Radio website: https://www.npr.org/sections/coronavirus-live-updates/2020/04/06/828187071/some-auto-insurers-are-sending-refunds-to-customers-as-crash-rate-falls6 U.S. Department Of Justice, Federal Bureau of Investigation: https://www.fbi.gov/news/pressrel/press-releases/overview-of-preliminary-uniform-crime-report-january-june-2020
less than they had previously. Public schools maintained remote learning through the end of the school year in June. With fewer motorists on the road, the number of accidents decreased during this period. Data from New Hampshire’s Department of Transportation provide clear evidence of the dramatic decrease in automobile traffic on state toll roads. Traffic volume decreased substantially after the Governor imposed the stay-at-home order in March 2020. In the following month, April, traffic volume declined to 4.3 million vehicles. This was a year-over-year decrease of over 50 percent from the April 2019 volume of 9.6 million vehicles. The chart below displays the impact that the coronavirus pandemic had on automotive traffic on the toll roads within the state of New Hampshire.
Some insurance companies issued rebates in March and April due to the decline in automobile
accidents.5 Despite a reduction in the number of accidents, not all reports were positive. According to an article in the December 7, 2020, issue of the New Hampshire Union Leader, the number of pedestrians struck and killed by motor vehicles in New Hampshire nearly doubled in 2020 compared to the previous year. There are some indications that with fewer vehicles on our roads, some drivers drove faster and more recklessly. Although no individual state data were available, crime appeared to decline nationwide during the coronavirus pandemic as well. According to the FBI’s Preliminary Uniform Crime Report January-June 2020,6 the number of violent and property crimes in the U.S. declined for the first six months of 2020 when compared with the first six months of 2019.
- David Mikelson
12.3 12
.7
10.8 11.1
9.7
9.3
9.2
8.8
7.1
4.3
6.2
8.2
9.9 10
.3
9.3
9.2
7.3
6.3
0
2
4
6
8
10
12
14
July Aug Sept Oct Nov Dec Jan Feb March April May June July Aug Sept Oct Nov Dec
2019 2020
Mill
ions
of V
ehic
les
Total New Hampshire Toll Road Traffic
TOTAL NEW HAMPSHIRE TOLL ROAD TRAFFIC
Source: New Hampshire Department of Revenue Administration, Monthly Traffic & Revenue (T&R) Reports

New Hampshire Employment SecurityEconomic & Labor Market Information Bureau CRIME & CRASHES | 87
Economic & Social Indicators for New Hampshire, 2015-2019 | VITAL SIGNS 202014
CRIME OFFENSES 2015 2016 2017 2018 2019Total crime offenses 26,145 22,991 21,192 19,605 18,516
Annual percent change -9.0% -12.1% -7.8% -7.5% -5.6%Violent crime offenses 2,692 2,668 2,642 2,404 2,074Annual percent change 2.6% -0.9% -1.0% -9.0% -13.7%
Property crime offenses 23,453 20,323 18,550 17,201 16,442Annual percent change -10.1% -13.3% -8.7% -7.3% -4.4%
Total Crime Index (Rate per 100,000 population)United States 2,885.1 2,849.1 2,757.8 2,593.2 2,489.3New Hampshire 1,965.6 1,722.1 1,570.0 1,448.5 1,361.7Connecticut 2,051.7 2,036.0 2,010.1 1,871.5 1,610.2Maine 1,962.2 1,770.9 1,629.3 1,471.2 1,360.8Massachusetts 2,078.3 1,940.4 1,781.9 1,613.9 1,507.4Rhode Island 2,141.2 2,027.2 1,993.3 1,885.2 1,755.9Vermont 1,567.0 1,693.4 1,668.7 1,500.1 1,626.4
Violent Crime Index (Rate per 100,000 population)United States 384.6 397.5 394.9 383.4 379.4New Hampshire 202.4 199.8 195.7 177.6 152.5Connecticut 221.4 227.7 229.2 209.6 183.6Maine 129.8 124.0 120.6 112.0 115.2Massachusetts 389.9 380.7 354.3 340.3 327.6Rhode Island 243.0 239.1 234.2 219.8 221.1Vermont 119.3 136.5 173.3 185.0 202.0
Property Crime Index (Rate per 100,000 population)United States 2,500.5 2,451.6 2,362.9 2,209.8 2,109.9 New Hampshire 1,763.2 1,522.3 1,374.3 1,270.9 1,209.2 Connecticut 1,830.3 1,808.3 1,780.9 1,661.9 1,426.6 Maine 1,832.4 1,646.9 1,508.7 1,359.2 1,245.6 Massachusetts 1,688.4 1,559.7 1,427.6 1,273.6 1,179.8 Rhode Island 1,898.2 1,788.1 1,759.1 1,665.4 1,534.8 Vermont 1,447.7 1,556.9 1,495.4 1,315.1 1,424.4
Source: Federal Bureau of Investigation, ELMI Analysis. Last Update 10/28/2020
AUTO INSURANCE CLAIMS LOSS - PERSONAL AND COMMERCIAL 2015 2016 2017 2018 2019
Total Claims ($ millions) $519.4 $547.6 $595.0 $593.9 $620.3Annual percent change 2.6% 5.4% 8.7% -0.2% 4.4%
Personal Claims ($ millions) $447.4 $481.2 $505.6 $518.4 $534.0Annual percent change 0.0% 7.6% 5.1% 2.5% 3.0%Percent Personal 86.1% 87.9% 85.0% 87.3% 86.1%
Commercial Claims ($ millions) $72.0 $66.4 $89.4 $75.6 $86.3Annual percent change 23.2% -7.8% 34.8% -15.5% 14.2%
Source: New Hampshire Insurance Department. Last Update 11/2/2020

New Hampshire Employment SecurityEconomic & Labor Market Information Bureau88 | CRIME & CRASHES
VITAL SIGNS 2020 | Economic & Social Indicators for New Hampshire, 2015-201914
CRIMINAL ARRESTS 2015 2016 2017 2018 2019Total Arrests 44,368 47,282 47,516 46,413 43,960
Annual percent change -3.9% 6.6% 0.5% -2.3% -5.3%Total Drug Abuse Violations 7,371 8,346 7,656 6,522 5,584Annual percent change 18.4% 13.2% -8.3% -14.8% -14.4%
Total DUI Offenses 4,746 4,874 4,805 5,053 5,116Annual percent change 4.8% 2.7% -1.4% 5.2% 1.2%
Juvenile Total 3,421 3,564 3,529 3,283 3,243Annual percent change -18.5% 4.2% -1.0% -7.0% -1.2%
Total Drug Abuse Violations 579 637 507 344 337Annual percent change -4.6% 10.0% -20.4% -32.1% -2.0%
Total DUI Offenses 36 42 36 29 34Annual percent change -18.2% 16.7% -14.3% -19.4% 17.2%
Source: Federal Bureau of Investigation, ELMI Analysis. Last Update 10/28/2020
STATE PRISON POPULATION 2015 2016 2017 2018 2019Number of sentenced prisoners in state and federal prisonsa 2,897 2,818 2,750 2,722 2,691
New Hampshire's incarceration rate 218 210 204 201 197Number of sentenced male prisoners 2,661 2,591 2,524 2,491 2,463Number of sentenced female prisoners 236 227 226 231 228Sentenced prisoners admitted 1,578 1,538 1,338 1,327 1,292Sentenced prisoners released 1,660 1,601 1,409 1,351 1,339
Adults on Probation 3,861 3,939 3,914 3,916Adults on Parole 2,451 2,436 2,436 2,367U.S. incarceration rate (federal and state jurisdiction) 458 450 440 432 419State jurisdiction incarceration rate 402 397 390 382 371Federal jurisdiction incarceration rate 55 53 51 50 48
a Sentenced prisoners are the number of inmates on December 31st sentenced for more than one year.
Source: U.S. Bureau of Justice Statistics. Last Update 10/30/2020
TRAFFIC CRASHES 2015 2016 2017 2018 2019Total crashes reportedb 29,605 29,862 36,681 34,174 33,592Annual percent change 4.3% 0.9% 22.8% -6.8% -1.7%
Seat belt use 69.5% 70.2% 67.6% 76.4% 70.7%Fatal motor vehicle crashes 103 130 98 134 90 Fatal motor crashes as a share of total 0.35% 0.44% 0.27% 0.39% 0.27%Number of fatalities 114 136 102 147 101Number of alcohol-impaired driving fatalitiesc 32 40 27 48 37Percent of alcohol-impaired driving fatalitiesc 28% 29% 27% 33% 37%Fatalities per 100 million vehicle miles 0.87 1.01 0.75 1.07
b Reported crashes and injuries involving $1,000 or more in property or injury damages.
c Based on a highest driver Blood Alcohol Concentration (BAC) of 0.8 g/dL (grams per deciliter) or higher.
Source: NH Department of Safety. National Highway Traffic Safety Administration. Last Update 9/1/2020
Prepared by: New Hampshire Employment Security, Economic and Labor Market Information Bureau
www.nhes.nh.gov/elmi | (603) 228-4124

New Hampshire Employment SecurityEconomic & Labor Market Information Bureau ENVIRONMENT | 89
Economic & Social Indicators for New Hampshire, 2015-2019 | VITAL SIGNS 202015
ENVIRONMENT
1 Adam Drapcho, “Orchards a popular and safe way to do fall,” Concord Monitor, October 13, 2020. Accessed on January 26, 2021 at https://www.concordmonitor.com/Orchards-popular-safe-way-to-enjoy-fall-36773544
2 Tyrol / Thorn Mountain closed to the public. The Conway Daily Sun, November 27, 20203 Take the 5 Hikes Challenge This Fall. New Hampshire Magazine, September 21, 2020. Accessed on February 2, 2021 at https://www.nhmagazine.com/take-the-5-hikes-challenge 4 New Hampshire Department of Natural & Cultural Resources release on September 25, 2020. Accessed on February 2, 2021 at https://www.dncr.nh.gov/news_events/2020_gov_
proclamation_bans_open_fires_smoking/ 5 White Mountain National Forest Rescinds Fire Restrictions, Associated Press, October 25, 2020. Accessed on February 2, 2021 at https://www.nhpr.org/post/white-mountain-national-
forest-rescinds-fire-restrictions#stream/0 6 Emergency Drought Assistance to Low-Income Residential Well Owners, posted on October 25, 2020. Accessed on February 2, 2021 at https://www4.des.state.nh.us/nh-dwg-trust/?p=1557
Environment & AgricultureDuring 2020, New Hampshire’s open land and forests have proven to be an important asset in terms of a way to get some relief from the stress and isolation caused by the coronavirus pandemic. During these stressful times, more people decided to reconnect with nature. Outdoor excursions to New Hampshire’s farms were viewed as relatively safe activities for families to pursue in the COVID-19 era. Cutting and taking pictures of sunflowers, exploring corn mazes, and apple picking were popular family activities during late summer and fall.1 Similarly, in the latter part of the 2020, Christmas tree farmers saw a surge in demand for live Christmas trees as more families are staying home for the holidays instead of traveling to relatives.
This increase in the number of people participating in outdoor recreation as an outlet for dealing with coronavirus pandemic cabin fever did result in some crowding at trailheads and increased stress on the environment. One local newspaper even had a printed ad announcing the closure of private land due to “trash and vandalism” created by increased outdoor recreation.2 Other evidence was a high volume of cars at the trailheads – especially at some popular hiking trails either in the White Mountains National Forest or at favorite local recreational paths.
The Society for the Protection of New Hampshire Forests responded to the increased interest in outdoor social–distancing activities by organizing a hike-it-yourself autumn adventure campaign called “Take the 5 Hikes Challenge.”3 The idea was to promote hikes on Forest Society properties in the local community. Registration fees for this do-it-yourself challenge helped support the continued stewardship of these open outdoor spaces.
The 2020 Drought In fall of 2020, a large portion of New Hampshire’s land was impacted by drought. There was very little rainfall in spring and early summer, leading to the drought conditions. Some improvements occurred over the summer but the severity of drought conditions returned in early September. New Hampshire experienced similar drought conditions in the fall of 2016.
High alerts to prevent forest fires were issued as the drought persisted into the fall. The drought created dangerous conditions with high risk of wildfires, causing the Governor of New Hampshire to issue a proclamation prohibiting open fires and smoking in and near forested land.4
Large wildfires on the West Coast and in Colorado heightened awareness of the dangers from forest fires, but in New Hampshire, the elevated risk of wildfires dissipated by late October.5 Other negative impacts from the drought, however, continued into the late fall, especially the risk of residential wells running dry.
In October 2020, the Drinking Water and Groundwater Advisory Commission6 approved funding of $1.5 million to the Drought Assistance Program for Low-Income Residential Well Owners. The program aids low-income residential well owners in one of two ways: by assisting immediately with bottled water for household cooking and drinking needs, or by mitigating the cost of well improvement projects. According to the New Hampshire Department of Environmental Services, nearly half of New Hampshire’s residents get their water supply from a private well.
By mid-November the drought situation improved somewhat, however, the southeastern part of New Hampshire was still in severe drought. With

New Hampshire Employment SecurityEconomic & Labor Market Information Bureau90 | ENVIRONMENT
VITAL SIGNS 2020 | Economic & Social Indicators for New Hampshire, 2015-201915
Sep 8 Sep 15 Sep 22 Sep 29 Oct 6 Oct 13 Oct 20 Oct 27 Nov 3 Nov 10 Nov 17 Nov 24 Dec 1 Dec 8 Dec 15D0-D4 100 100 100 100 100 100 100 100 100 100 100 100 100 68.56 62.21D1-D4 100 100 100 100 99.66 99.66 99.66 99.66 99.67 99.67 99.67 99.67 57.48 37.3 40.04D2-D4 28.31 72.39 88.54 95.06 95.06 75.11 33.23 33.23 16.76 16.76 18.91 18.91 18.91 9.66 9.66D3-D4 0 0 8.47 10.59 21.99 21.99 16.73 16.73 7.47 7.47 11.01 11.01 9.36 0 0D4 0 0 0 0 0 0 0 0 0 0 0 0 0 0 0
DROUGHT MONITOR CHART
Source: The National Drought Mitigation Center, University of Nebraska-Lincoln
How to read this chart: Areas of New Hampshire are considered in drought conditions when listed as Abnormally Dry (D0). From the beginning of September to December 1, 2020, all (100 percent) of New Hampshire was considered to be Abnormally Dry (D0). Until November 24, 2020 all of New Hampshire was also considered to be in Moderate Drought (D1). In addition, some areas were now also considered to be in more severe drought conditions, such as Severe Drought (D2) and Extreme Drought (D3). During the entire period, no area in New Hampshire was considered to be in Exceptional Drought (D4).
Source: The National Drought Mitigation Center, University of Nebraska-Lincoln

New Hampshire Employment SecurityEconomic & Labor Market Information Bureau ENVIRONMENT | 91
Economic & Social Indicators for New Hampshire, 2015-2019 | VITAL SIGNS 202015
7 KC Downey, “No Parts of New Hampshire are seeing extreme drought,” WMUR, December 10, 2020. Accessed on February 2, 2021 at https://www.wmur.com/article/new-hampshire-drought-update-december-10-2020/34929529
8 Jason Schreiber, “Three farms survived drought, prepare for thriving business,” Union Leader, November 23, 2020.9 Lori Tyler Gula, PhD, “2020 Severe Drought Likely to Slow Tree Growth Next Year,” NH Agricultural Experiment Station, University of New Hampshire, October 26, 2020. Accessed on
February 2, 2021 at https://www.colsa.unh.edu/nhaes/article/2020/10/2020drought
relatively mild weather and significant rain amounts towards the end of November, the drought monitor showed some improvement. By early December, the New Hampshire Department of Environmental Services (NHDES) was still concerned about the possibility of a multi-year drought.7 With a substantial snow and rain event (Nor’easter) occurring over the weekend of December 5-6, 2020, the drought situation improved greatly for most of New Hampshire, and no area was still in extreme drought. For the first time since August 2020, close to a third of New Hampshire was no longer listed
as experiencing any drought. (Abnormally dry is considered a drought condition.)
Another consequence of the drought was the negative impact on fruit size and crop yield. A quantitative measure is hard to assess at the current time. Some Christmas tree farm owners complained that some of their young trees were lost.8 Also, researchers at the University of New Hampshire publicized the risk of slow tree growth in the coming year, especially to red oak and white pine.9 Mature trees had already completed most of their growth for this year when the drought was at its worst.
INTENSITY OF DROUGHT IMPACT
DO Abnormally Dry
Crop growth is stunted; planting is delayedFire danger is elevated; spring fire season starts earlyLawns brown early; gardens begin to wiltSurface water levels decline
D1 Moderate Drought
Irrigation use increases; hay and grain yields are lower than normalHoney production declinesWildfires and ground fires increaseTrees and landscaping are stressed; fish are stressedVoluntary water conservation is requested; reservoir and lake levels are below normal capacity
D2 Severe Drought
Specialty crops are impacted in both yield and fruit sizeProducers begin feeding cattle; hay prices are highWarnings are issued on outdoor burns; air quality is poorGolf courses conserve waterTrees are brittle and susceptible to insectsFish kills occur; wildlife move to farms for foodWater quality is poor; groundwater is declining; irrigation ponds are dry; outdoor water restrictions are implemented
D3 Extrene Drought
Crop loss is widespread; Christmas tree farms are stressed; dairy farmers are struggling financiallyWell drillers and bulk water haulers see increased businessWater recreation and hunting are modified; wildlife disease outbreak is observedExtremely reduced flow to ceased flow of water is observed; river temperatures are warm; wells are running dry; people are digging more and deeper wells
D4 Exceptional Drought New Hampshire has had little or no experience in D4 so no impacts have been recorded at that level in the Drought Impact
Source: The National Drought Mitigation Center, University of Nebraska-Lincoln

New Hampshire Employment SecurityEconomic & Labor Market Information Bureau92 | ENVIRONMENT
VITAL SIGNS 2020 | Economic & Social Indicators for New Hampshire, 2015-201915
10 Estimates based on water removed from total area11 Forest Inventory and Analysis Glossary. Accessed on February 2, 2021 at https://www.nrs.fs.fed.us/fia/data-tools/state-reports/glossary/ 12 Forest Inventory and Analysis. State Fact Sheet, https://www.fia.fs.fed.us/tools-data/ 13 Marguerite Holloway, “New England’s Forest Are Sick. They need more Tree Doctors,” NY Times, October 7, 2020. Accessed on January 7, 2021 at https://www.nytimes.com/2020/10/07/
climate/new-england-trees-forests.html 14 Edith Tucker, “With grants, Shelburne Riverlands project fully funded,” The Berlin Sun. November 27, 2020. Accessed on January 7, 2021 at https://www.conwaydailysun.com/news/local/
shelburne-riverlands-project-is-fully-funded-thanks-to-grants/article_b263e494-2f4f-11eb-9961-635e6dbae468.html
0.02
0.47
3.73
0.02
0.51
3.69
Rotten cull
Rough cull
Growing stock
Billions of live trees
2014 2019
BILLIONS OF LIVE TREES
Source: U.S. Forest Service
Definition of cull trees:11 Cull trees can include those with decay (rotten cull) or poor form, limbiness, or splits (rough cull). Rough cull is suitable for pulpwood and other fiber products.
Status of New Hampshire’s Forests Whether you care about purchasing natural Christmas trees, logging, hiking, or hunting, the condition of New Hampshire forests is probably of interest to you.
According to 2019 estimates from the United States Department of Agriculture, New Hampshire has 4.69 million acres of forest land. Forest covers 82 percent of total land area in New Hampshire,10 making New Hampshire the second most forested state in the nation, only behind Maine, where 89 percent of total land area forested.
Since 2014, the area of forest land has been reduced by approximately 80,000 acres, mainly a loss due to forest land being converted to nonforest land, though the number of live trees remained fairly unchanged. The billions of live trees in New Hampshire is equivalent to more than 3,100 live trees per resident.
Despite the fact that New Hampshire is home to the White Mountain National Forest (a small part of WMNF is located in western Maine), federal land ownership still only accounts for 17.6 percent of all forested land in New Hampshire. Another 9.8 percent of forested land is under state and local ownership. This means that close to three
quarters of New Hampshire’s forest land is in private ownership.12
As a result, the destiny of a large portion of New Hampshire’s landscape is controlled by the decisions made by private entities on whether to “protect, sell, subdivide, develop, log, or bequeath to the next generation.” 13
Forest and land conservation efforts are important in order to preserve New Hampshire rural scenic character and ensure the quality of New Hampshire’s resources such as water and soil as well as serving as host community for unique wildlife species. At the end of November 2020, it was announced that two separate State of New Hampshire entities/agencies — the Land and Community Heritage Investment Program (LCHIP) and NHDES’ Aquatic Resource Mitigation — provided grants in order to permanently conserve a heavily forested area along the Androscoggin River in northern New Hampshire. This area is currently owned by a timber investment management organization. 14 The combined conservation efforts between LCHIP and NHDES is an example of how the forested land adds value to the environment in multiple ways.
- Annette Nielsen

New Hampshire Employment SecurityEconomic & Labor Market Information Bureau ENVIRONMENT | 93
Economic & Social Indicators for New Hampshire, 2015-2019 | VITAL SIGNS 202015
TOXIC RELEASE INVENTORY 2015 2016 2017 2018 2019On-site Disposal or Other Releases (Pounds)New Hampshire 327,413 171,314 144,256 200,843 145,104Annual percent change -28.4% -47.7% -15.8% 39.2% -27.8%
New England 9,987,493 8,785,784 12,440,981 11,516,752 9,288,512Annual percent change -9.7% -12.0% 41.6% -7.4% -19.3%
U.S. (1,000 pounds) 2,967,684 3,128,757 3,536,129 3,369,250 2,962,475Annual percent change -16.1% 5.4% 13.0% -4.7% -12.1%
Off-site Disposal or Other Releases (Pounds)New Hampshire 218,649 142,931 180,842 224,058 247,861Annual percent change -29.2% -34.6% 26.5% 23.9% 10.6%
New England 6,962,710 7,486,317 6,228,889 7,304,041 6,826,272Annual percent change -35.3% 7.5% -16.8% 17.3% -6.5%
U.S. (1,000 pounds) 472,532 400,098 384,849 431,339 433,152Annual percent change 4.0% -15.3% -3.8% 12.1% 0.4%
Total On-site and Off-site Disposal or Other Releases (Pounds)New Hampshire 546,061 314,245 325,099 424,901 392,965Annual percent change -28.7% -42.5% 3.5% 30.7% -7.5%
New England 16,950,203 16,272,100 18,669,873 18,820,793 16,114,784Annual percent change -22.3% -4.0% 14.7% 0.8% -14.4%
U.S. (1,000 pounds) 3,440,216 3,528,855 3,920,978 3,800,588 3,395,627Annual percent change -13.8% 2.6% 11.1% -3.1% -10.7%
Source: U.S. Environmental Protection Agency, ELMI Analysis. Last Update 10/30/2020
FOREST INVENTORY DATA 2015 2016 2017 2018 2019Number of all live trees on forest land by Species group and Tree class code (in number)Growing stock 3,747,855,943 3,769,424,988 3,747,237,184 3,735,483,767 3,733,910,625Rough cull 506,155,055 502,748,347 504,200,124 500,825,911 469,425,181Rotten cull 23,462,913 23,063,794 23,082,695 22,536,693 21,223,651Total 4,277,473,911 4,295,237,129 4,274,520,003 4,258,846,371 4,224,559,456
Source: U.S. Forest Service, ELMI Analysis. Last Update 8/28/2020
MAPLE SYRUP PRODUCTION 2015 2016 2017 2018 2019New Hampshire (1,000 gallons) 154 176 160 163 148United States (1,000 gallons) 3,434 4,184 4,385 4,199 4,240Source: USDA - National Agricultural Statistics Service, ELMI Analysis. Last Update 8/28/2020

New Hampshire Employment SecurityEconomic & Labor Market Information Bureau94 | ENVIRONMENT
VITAL SIGNS 2020 | Economic & Social Indicators for New Hampshire, 2015-201915
FRUIT AND VEGETABLE CROPS 2015 2016 2017 2018 2019Apples1 Yield per Acre2 (Bushels)New Hampshire 369 255 469 314 321New England 361 264 367 NA 324
Strawberries Yield per Acre3 New Hampshire 6,000 5,950 6,800 5,900 5,700New England 4,600 5,150 5,900 4,700 NA
Pumpkins Yield per Acre4
New Hampshire 10,300 8,700 14,300 12,500 18,000New England 12,500 10,400 11,900 8,900 9,800
Tomatoes Yield per Acre4
New Hampshire 12,000 11,100 13,000 13,700 11,600New England 11,500 10,900 13,000 10,600 9,100
Sweet Corn Yield per Acre (Dozen5)New Hampshire 800 741 906 800 824New England 749 718 718 800 765
1 Apple production from commercial orchards with 100 or more trees.
2 Yield based on total production, which includes unharvested production and fruit production but not sold due to market conditions"
3 Total tabulated pounds produced per bearing acre harvested.
4 Total tabulated pounds produced per acre harvested.
5 Standard weight used for a dozen ears is 8.5 pounds
Source: USDA - National Agricultural Statistics Service, ELMI Analysis. Last Update 8/28/2020
Prepared by: New Hampshire Employment Security, Economic and Labor Market Information Bureauwww.nhes.nh.gov/elmi | (603) 228-4124

New Hampshire Employment SecurityEconomic & Labor Market Information Bureau | 95
Economic & Social Indicators for New Hampshire, 2015-2019 | VITAL SIGNS 2020
Average Weekly Wage . . . . . . . . . . . . . . . . . . . . . . . . . . . . . . . . . . . . . . . . (Section 2) Total wages paid by employers divided by average covered jobs, divided by the number of weeks in
the reference period.
Benefits Paid, Unemployment Insurance . . . . . . . . . . . . . . . . . . . . . . . . . . . (Section 3) Money payable to an unemployed individual as compensation for lost wages. Includes benefits paid
on wages earned in covered employment; plus interstate benefits; adjusted for benefit recoveries, and for transfers under the interstate combined wage plan.
Birth Rate . . . . . . . . . . . . . . . . . . . . . . . . . . . . . . . . . . . . . . . . . . . . . . . . (Section 1) Number of resident live births per 1,000 resident population.
British Thermal Units (BTUs) . . . . . . . . . . . . . . . . . . . . . . . . . . . . . . . . . . . (Section 8) The quantity of heat needed to raise the temperature of one pound of water one degree Fahrenheit
at a specified temperature.
Capital Expenditures. . . . . . . . . . . . . . . . . . . . . . . . . . . . . . . . . . . . . . . . . (Section 9) Capital spending for new and used structures and equipment (includes capitalized software) by U.S.
nonfarm businesses with and without paid employees.
Chained Dollars . . . . . . . . . . . . . . . . . . . . . . . . . . . . . . . . . . . . . . . . . . . . (Section 9) A methodology for adjusting for inflation, which includes both quantities produced and relative prices of goods and services.
Civilian Labor Force . . . . . . . . . . . . . . . . . . . . . . . . . . . . . . . . . . . . . . . . . (Section 3) That portion of the population age sixteen and older which is employed or unemployed and
actively seeking employment. Members of the armed forces and the institutionalized population are excluded.
Construction Contract Value Index . . . . . . . . . . . . . . . . . . . . . . . . . . . . . . (Section 11) Indexed dollar value of contracts for new construction, additions, and major alterations, but not for
maintenance.
Consumer Price Index for Urban Consumers (CPI-U) . . . . . . . . . . . . . . . . . . . (Section 2) An index used to measure changes in the cost of a market basket of selected goods and services. Often the reference for cost of living adjustments in wages and entitlements.
Covered Employment . . . . . . . . . . . . . . . . . . . . . . . . . . . . . . . . . . . . . . . . (Section 2) Employment in any industry insured under the provisions of the New Hampshire Unemployment Compensation Law or subject to the Unemployment Compensation for Federal Employee (UCFE) program.
Crime Index . . . . . . . . . . . . . . . . . . . . . . . . . . . . . . . . . . . . . . . . . . . . . . (Section 14) Selected offenses used to gauge fluctuations in the overall volume and rate of crime reported to law enforcement. The offenses included are the violent crimes of murder and nonnegligent manslaughter, forcible rape, robbery, and aggravated assault; and the property crimes of burglary, larceny/theft, and motor vehicle theft.
GLOSSARY & INDEX
GLOSSARY & INDEX

New Hampshire Employment SecurityEconomic & Labor Market Information Bureau96 |
VITAL SIGNS 2020 | Economic & Social Indicators for New Hampshire, 2015-2019
Current Dollars . . . . . . . . . . . . . . . . . . . . . . . . . . . . . . . . . . . . . . . . . . . . (Section 9) Figures reflecting actual prices or costs prevailing during the specified year(s).
Death Rate . . . . . . . . . . . . . . . . . . . . . . . . . . . . . . . . . . . . . . . . . . . . . . . (Section 1) Crude Number of resident deaths per 1,000 resident population.
Defense Contracts . . . . . . . . . . . . . . . . . . . . . . . . . . . . . . . . . . . . . . . . . . (Section 9) Contracts awarded to provide military supplies, services, and construction made during a specified fiscal year.
Degree-granting Institutions . . . . . . . . . . . . . . . . . . . . . . . . . . . . . . . . . . (Section 12) Postsecondary institutions that are eligible for Title IV federal financial aid programs and grant an associate’s or higher degree. For an institution to be eligible to participate in Title IV financial aid programs it must offer a program of at least 300 clock hours in length, have accreditation recognized by the U.S. Department of Education, have been in business for at least 2 years, and have signed a participation agreement with the Department.
Divorce Rate . . . . . . . . . . . . . . . . . . . . . . . . . . . . . . . . . . . . . . . . . . . . . . (Section 1) Number of divorces, annulments, and legal separations per 1,000 resident population.
Durable Goods . . . . . . . . . . . . . . . . . . . . . . . . . . . . . . . . . . . . . . . . . . . . (Section 4) Items with a normal life expectancy of three or more years. Expenditures for durable goods are generally postponable. Consequently, durable goods sales are the most volatile component of consumer expenditures. Common examples of durable goods items are automobiles, furniture, household appliances, mobile homes, etc.
Duration of Benefit Payments . . . . . . . . . . . . . . . . . . . . . . . . . . . . . . . . . . . (Section 3) Average Number of weeks compensated for unemployment during the year, divided by the number of first payments. May include more than one period of unemployment.
Electric Utility . . . . . . . . . . . . . . . . . . . . . . . . . . . . . . . . . . . . . . . . . . . . . (Section 8) A corporation, person, agency, authority, or other legal entity or instrumentality that owns and/or operates facilities for the generation, transmission, distribution, or sale of electrical energy, primarily for use by the public, and that files forms listed in the Code of Federal Regulations, Title 18, Part 141. Facilities that qualify as cogenerators or small power producers under the Public Utility Regulatory Policies Act are not considered utilities.
Energy Consumption . . . . . . . . . . . . . . . . . . . . . . . . . . . . . . . . . . . . . . . . (Section 8) The use of energy as a source of heat or power or as a raw material input to a manufacturing process.
Energy Generated, Net . . . . . . . . . . . . . . . . . . . . . . . . . . . . . . . . . . . . . . . (Section 8) The total amount of electric energy produced by a generating station less the electric energy consumed for station use.
Federal Home Loan Mortgage Corporation (Freddie Mac) . . . . . . . . . . . . . . . (Section 11) A shareholder-owned corporation that invests in home mortgages, ultimately providing lower housing costs and access to home financing.
Fuel Consumed to Generate Electricity . . . . . . . . . . . . . . . . . . . . . . . . . . . . (Section 8) Fuel required by all types of electricity generating plants. Coal, gas, and nuclear fuels are shown in equivalent barrels of oil.
GLOSSARY & INDEX
New Hampshire Employment SecurityEconomic & Labor Market Information Bureau | 97
Economic & Social Indicators for New Hampshire, 2015-2019 | VITAL SIGNS 2020
GLOSSARY & INDEX
Gross Domestic Product (GDP) . . . . . . . . . . . . . . . . . . . . . . . . . . . . . . . . . (Section 9) The market value of all final goods and services produced by resources located in the United States, regardless of ownership.
Gross Domestic Product by State (GDP) . . . . . . . . . . . . . . . . . . . . . . . . . . . (Section 9) The market value of all final goods and services produced by resources located in a state, regardless of ownership. GDP by State for the United States differs from GDP for the following reasons: GDP by State excludes – and GDP includes – the compensation of federal civilian and military personnel stationed abroad and government consumption of fixed capital for military structures located abroad and for military equipment, except office equipment.
Home Health Agency . . . . . . . . . . . . . . . . . . . . . . . . . . . . . . . . . . . . . . . (Section 13) Home Health Agency is an agency or organization which is primarily engaged in providing skilled nursing services and other therapeutic services. These services are given at home by a variety of skilled health care professionals.
Home Sales (existing homes) . . . . . . . . . . . . . . . . . . . . . . . . . . . . . . . . . . (Section 11) Estimates based on multiple listing data. Projections are made with the cooperation of the National Association of Realtors. Data primarily consists of existing units of single family homes, town houses, condominiums, and cooperatives. Multiple units are excluded.
Hospice . . . . . . . . . . . . . . . . . . . . . . . . . . . . . . . . . . . . . . . . . . . . . . . . (Section 13) Items and services provided to individuals who are terminally ill, and for their family. This care includes physical care and counseling.
Household . . . . . . . . . . . . . . . . . . . . . . . . . . . . . . . . . . . . . . . . . . . . . . . (Section 2) All the people who occupy a housing unit (single occupants, two or more unrelated occupants, and families).
Housing Permits . . . . . . . . . . . . . . . . . . . . . . . . . . . . . . . . . . . . . . . . . . (Section 11) The number of new housing units authorized by building permits.
Incarceration Rate . . . . . . . . . . . . . . . . . . . . . . . . . . . . . . . . . . . . . . . . . (Section 14) The number of persons confined in prison, with sentences over one year, per 100,000 resident population.
In-migration . . . . . . . . . . . . . . . . . . . . . . . . . . . . . . . . . . . . . . . . . . . . . . (Section 1) That part of the increase in the population not attributable to the natural increase rate. Generally, this is the populace moving to New Hampshire from an out-of-state residence or from outside the U.S.
Labor Force Participation Rate . . . . . . . . . . . . . . . . . . . . . . . . . . . . . . . . . . (Section 3) The percentage of the civilian noninstitutional population age sixteen or older that is working or looking for work.
Marriage Rate . . . . . . . . . . . . . . . . . . . . . . . . . . . . . . . . . . . . . . . . . . . . . (Section 1) Number of marriages per 1,000 resident population.
Meals and Rentals Tax Receipts . . . . . . . . . . . . . . . . . . . . . . . . . . . . . . . . (Section 10) Estimate of sales by hotels, motels, and eating and drinking establishments based on taxes received under the Meals and Rental Tax.

New Hampshire Employment SecurityEconomic & Labor Market Information Bureau98 |
VITAL SIGNS 2020 | Economic & Social Indicators for New Hampshire, 2015-2019
Median . . . . . . . . . . . . . . . . . . . . . . . . . . . . . . . . . . . . . . . . . . . . . . . . . (Section 2) The value exactly in the middle of a set of data that are ranked in order of ascending size. Half of all data values will be less than the median, while half will be more.
Medicaid . . . . . . . . . . . . . . . . . . . . . . . . . . . . . . . . . . . . . . . . . . . . . . . (Section 13) A joint federal-state program providing medical assistance to certain low income individuals and families.
Medicare . . . . . . . . . . . . . . . . . . . . . . . . . . . . . . . . . . . . . . . . . . . . . . . (Section 13) A federal program providing hospital insurance and supplementary medical insurance for persons who are eligible for retirement benefits and have attained the age of 65, disabled persons entitled to social security disability benefits, and workers or their dependents with permanent kidney failure.
Multiple Listing Service (MLS) . . . . . . . . . . . . . . . . . . . . . . . . . . . . . . . . . (Section 11) A real estate database that makes it possible to share listings of available properties between brokers, sellers, and buyers.
Natural Increase Rate . . . . . . . . . . . . . . . . . . . . . . . . . . . . . . . . . . . . . . . . (Section 1) The number of resident births minus deaths per 1,000 total resident population.
New Hampshire Housing Finance Authority (NHHFA) . . . . . . . . . . . . . . . . . . (Section 11) A non-profit corporation that operates programs designed to assist low and moderate income persons and families to obtain decent, safe and affordable housing.
Nonfarm Employment . . . . . . . . . . . . . . . . . . . . . . . . . . . . . . . . . . . . . . . . (Section 4) Place of work employment that does not include private household workers, self-employed, unpaid family workers, and domestics or agricultural workers.
Nondurable Goods . . . . . . . . . . . . . . . . . . . . . . . . . . . . . . . . . . . . . . . . . . (Section 4) Items that generally last for less than three years. Nondurable goods items are generally purchased when needed. Common examples of nondurable goods items are food, beverages, apparel, gasoline, etc.
Non-current Loans . . . . . . . . . . . . . . . . . . . . . . . . . . . . . . . . . . . . . . . . . . (Section 6) Loans and leases 90 days or more past due or in nonaccrual status.
Outdoor Recreation Value Added . . . . . . . . . . . . . . . . . . . . . . . . . . . . . . . (Section 10) Outdoor recreation is all recreational activities undertaken for pleasure that occur outdoors. Value added is the difference between an industry’s gross output (sales or receipts plus other operating income and inventory change) and its intermediate inputs (goods and services that are used in the production of other goods and services).
Outdoor Recreation, Core and Supporting . . . . . . . . . . . . . . . . . . . . . . . . . (Section 10) The economic impact of outdoor recreation activities includes the value of goods and services directly related to outdoor recreation (“core” goods and services), as well as the value of goods and services that support access to outdoor recreation (“supporting” goods and services). Core outdoor recreation goods and services include gear, equipment, fuel, concessions, maintenance, repair, and fees related to outdoor recreation activities. Supporting goods and services includes travel and tourism (trips more than 50 miles from home), as well as local trips (less than 50 miles from home), construction, and government expenditures.”
GLOSSARY & INDEX
New Hampshire Employment SecurityEconomic & Labor Market Information Bureau | 99
Economic & Social Indicators for New Hampshire, 2015-2019 | VITAL SIGNS 2020
GLOSSARY & INDEX
Parole . . . . . . . . . . . . . . . . . . . . . . . . . . . . . . . . . . . . . . . . . . . . . . . . . (Section 14) A condition of release of an inmate from prison serving an unexpired sentence, who has to report to a parole officer.
Per Capita Disposable Income . . . . . . . . . . . . . . . . . . . . . . . . . . . . . . . . . . (Section 2) Personal income less personal taxes and non-tax payments.
Per Capita Personal Income . . . . . . . . . . . . . . . . . . . . . . . . . . . . . . . . . . . . (Section 2) Total personal income divided by total population.
Personal Income . . . . . . . . . . . . . . . . . . . . . . . . . . . . . . . . . . . . . . . . . . . (Section 2) The current income received by all the residents of the state from all sources, including wages and salary disbursements, other labor income, proprietors’ income, rental income, interest, dividends, and transfer payments; less personal contributions for social insurance.
Probation . . . . . . . . . . . . . . . . . . . . . . . . . . . . . . . . . . . . . . . . . . . . . . . (Section 14) A suspended sentence for a convicted offender giving the offer of freedom during good behavior under supervision of a probation officer.
Real Gross Domestic Product . . . . . . . . . . . . . . . . . . . . . . . . . . . . . . . . . . . (Section 9) The market value of all final goods and services by resources located in the United States, regardless of ownership, adjusted for inflation.
Real Gross Domestic Product by State . . . . . . . . . . . . . . . . . . . . . . . . . . . . . (Section 9) The market value of all final goods and services produced by resources located in a state, regardless of ownership, adjusted for inflation.
Scholastic Assessment Test (SAT) . . . . . . . . . . . . . . . . . . . . . . . . . . . . . . (Section 12) (formerly Scholastic Aptitude Test) Mean test score for all students in the state who took the SAT exam during the designated academic year.
Short Stay Hospital . . . . . . . . . . . . . . . . . . . . . . . . . . . . . . . . . . . . . . . . (Section 13) A hospital that provides inpatient medical care and other related services for surgery, acute medical conditions or injuries (usually for a short term illness or condition).
Short Tons (S/T) . . . . . . . . . . . . . . . . . . . . . . . . . . . . . . . . . . . . . . . . . . . (Section 7) A unit of mass equal to 2,000 lb (exactly 907.18474 kg).
Skilled Nursing Facility . . . . . . . . . . . . . . . . . . . . . . . . . . . . . . . . . . . . . . (Section 13) Facility that provides care that can only be given by a registered nurse or doctor.
Toxic Release Inventory . . . . . . . . . . . . . . . . . . . . . . . . . . . . . . . . . . . . . (Section 15) Toxic Release Inventory tracks the management of certain toxic chemicals that may pose a threat to human health and the environment. A “release” of a chemical means that it is emitted to the air or water, or placed in some type of land disposal. U.S. facilities in different industry sectors must report annually how much of each chemical is released to the environment and/or managed through recycling, energy recovery and treatment.
Unemployed . . . . . . . . . . . . . . . . . . . . . . . . . . . . . . . . . . . . . . . . . . . . . . (Section 3) Persons who were not employed during the monthly survey week but were available for work and were overtly engaged in a job-seeking activity within the previous four week period, waiting to be recalled from a layoff, or waiting to report to a new job within thirty days.

New Hampshire Employment SecurityEconomic & Labor Market Information Bureau100 |
VITAL SIGNS 2020 | Economic & Social Indicators for New Hampshire, 2015-2019
Value Added by Manufacture . . . . . . . . . . . . . . . . . . . . . . . . . . . . . . . . . . . (Section 9) A measure of manufacturing activity used for comparing the relative economic importance of manufacturing among industries and geographic areas. The cost of materials, supplies, fuels, etc. are subtracted from the value of shipments plus receipts for services rendered, and adjusted by adding value added by merchandising plus net change in finished goods and work-in-process between the beginning and the end of the year.
Vehicle Registration . . . . . . . . . . . . . . . . . . . . . . . . . . . . . . . . . . . . . . . . . (Section 7) A count of the registration certificates on file at the Department of Safety at the end of each calendar year.
Weekly Benefit Amount, Average . . . . . . . . . . . . . . . . . . . . . . . . . . . . . . . . (Section 3) Benefits paid for total unemployment during the year divided by the number of weeks compensated.
Weeks Compensated for Unemployment . . . . . . . . . . . . . . . . . . . . . . . . . . . (Section 3) Number of weeks of unemployment for which benefits were paid including both total and partial unemployment. Interstate claims are counted in the paying state.
GLOSSARY & INDEX