Embed Size (px)
DESCRIPTION
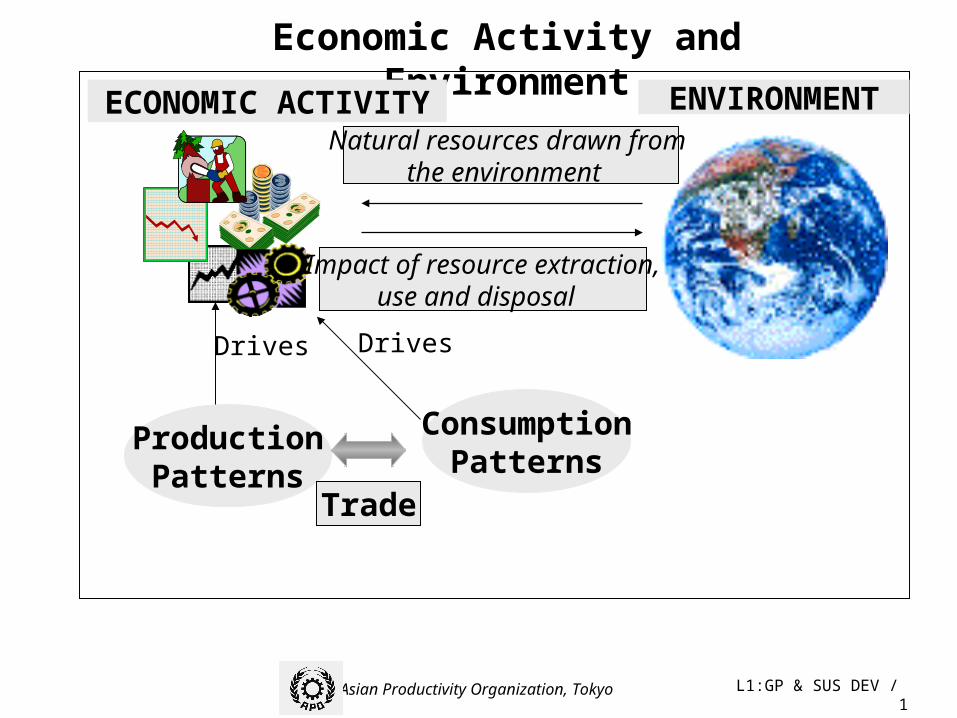
Economic Activity and Environment. ECONOMIC ACTIVITY. ENVIRONMENT. Natural resources drawn from the environment. Impact of resource extraction, use and disposal. Drives. Drives. Consumption Patterns. Production Patterns. Trade. Agriculture. Industry. Services. Production Patterns. - PowerPoint PPT Presentation
Citation preview
L1:GP & SUS DEV / 1Asian Productivity Organization, Tokyo
Economic Activity and Environment
ECONOMIC ACTIVITY
ProductionPatterns
ConsumptionPatterns
Natural resources drawn from the environment
Impact of resource extraction,use and disposal
Trade
ENVIRONMENT
Drives Drives
L1:GP & SUS DEV / 2Asian Productivity Organization, Tokyo
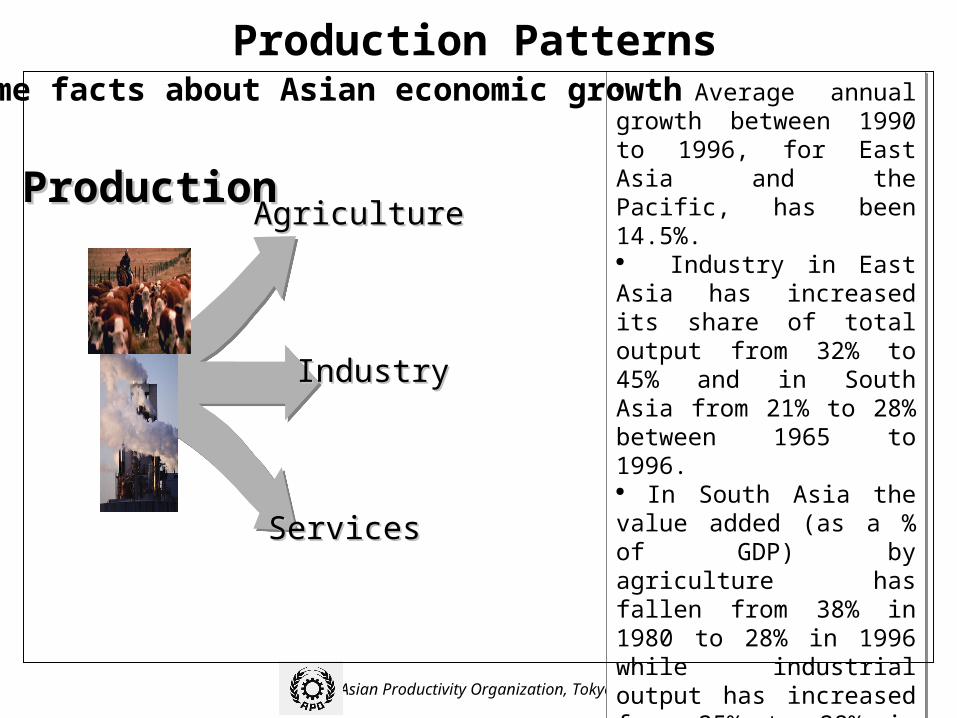
Average annual growth between 1990 to 1996, for East Asia and the Pacific, has been 14.5%. Industry in East Asia has increased its share of total output from 32% to 45% and in South Asia from 21% to 28% between 1965 to 1996. In South Asia the value added (as a % of GDP) by agriculture has fallen from 38% in 1980 to 28% in 1996 while industrial output has increased from 25% to 28% in the same period. Exports of services from developing countries grew at an average annual rate of 12% in the 1990s, twice as fast as those from industrial regions.
Average annual growth between 1990 to 1996, for East Asia and the Pacific, has been 14.5%. Industry in East Asia has increased its share of total output from 32% to 45% and in South Asia from 21% to 28% between 1965 to 1996. In South Asia the value added (as a % of GDP) by agriculture has fallen from 38% in 1980 to 28% in 1996 while industrial output has increased from 25% to 28% in the same period. Exports of services from developing countries grew at an average annual rate of 12% in the 1990s, twice as fast as those from industrial regions.
Some facts about Asian economic growth
ProductionProduction
IndustryIndustry
Agriculture Agriculture
ServicesServices
Production Patterns
L1:GP & SUS DEV / 3Asian Productivity Organization, Tokyo
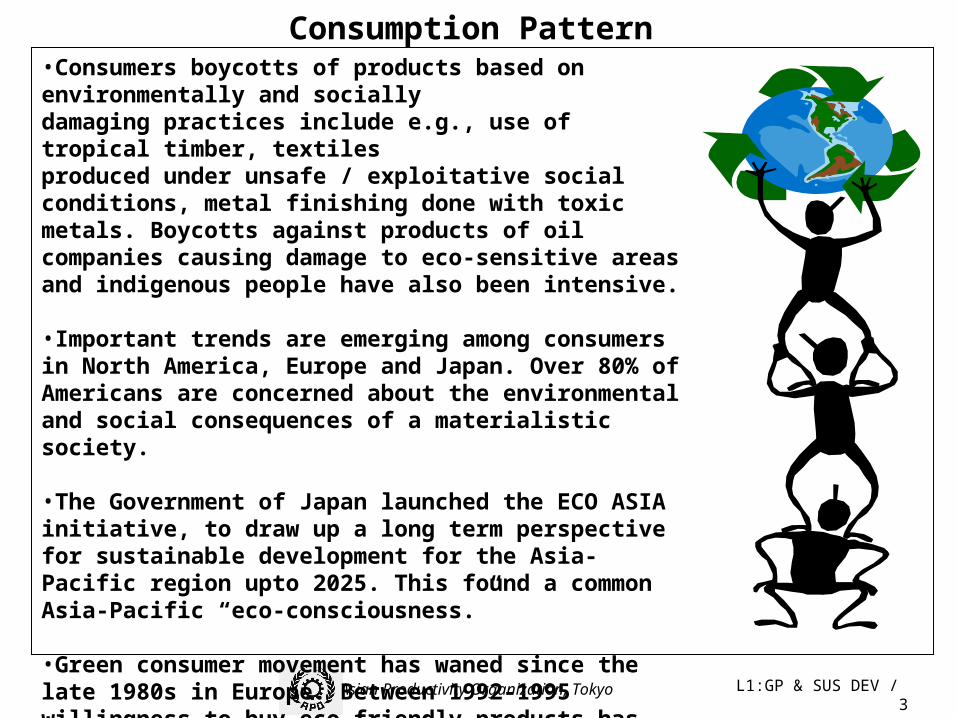
Consumption Pattern•Consumers boycotts of products based on environmentally and socially damaging practices include e.g., use of tropical timber, textiles produced under unsafe / exploitative social conditions, metal finishing done with toxic metals. Boycotts against products of oil companies causing damage to eco-sensitive areas and indigenous people have also been intensive.
•Important trends are emerging among consumers in North America, Europe and Japan. Over 80% of Americans are concerned about the environmental and social consequences of a materialistic society.
•The Government of Japan launched the ECO ASIA initiative, to draw up a long term perspective for sustainable development for the Asia-Pacific region upto 2025. This found a common Asia-Pacific “eco-consciousness.”
•Green consumer movement has waned since the late 1980s in Europe. Between 1992-1995 willingness to buy eco-friendly products has fallen from 69-58% in Britain and 75-50% in Germany. Main reason is confusion due to proliferation of labels and false claims. Active demand still exists however in some areas such as organic produce, fair trade coffee, tea and bananas, organic cotton.
L1:GP & SUS DEV / 4Asian Productivity Organization, Tokyo
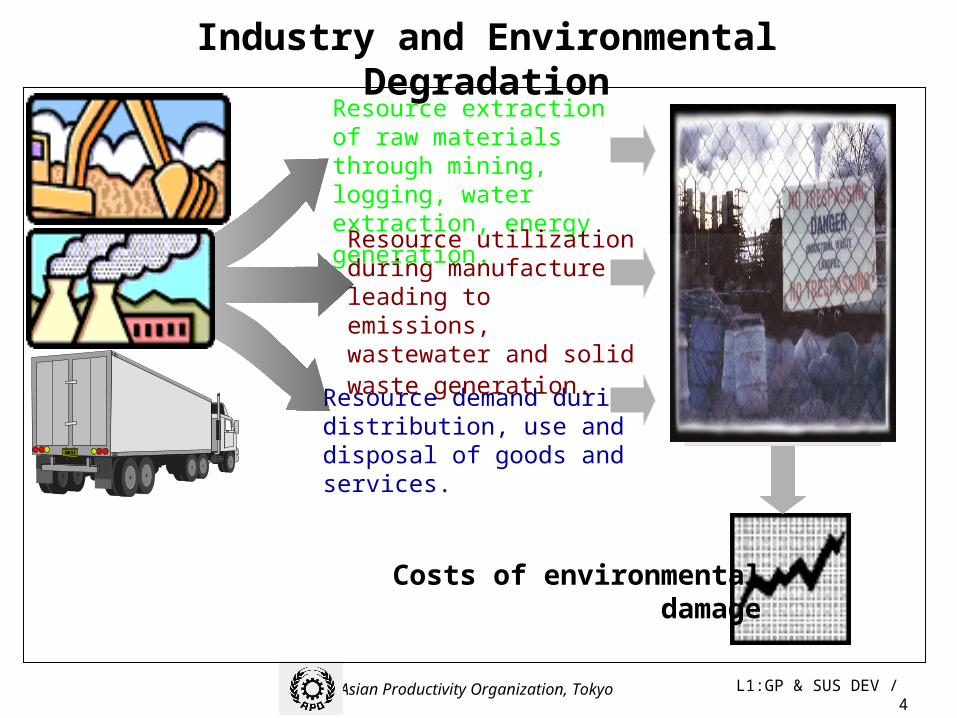
Industry and Environmental Degradation
Resource extraction of raw materials through mining, logging, water extraction, energy generation.
Resource demand during distribution, use and disposal of goods and services.
Resource utilization during manufacture leading to emissions, wastewater and solid waste generation.
Costs of environmental damage
L1:GP & SUS DEV / 5Asian Productivity Organization, Tokyo
Trade and Environment
•Trade is becoming increasingly globalized as well as liberalized.
•International trade liberalization has been crucial for the success of Asian economies. Trade expansion has led to rapid growth in export-oriented industries, urbanization, construction boom.
•Patterns of international trade have changed markedly. Focus of trade fromthe Asian region has been primarily on resource-intensive and labor intensive goods to the North.
•Such growth has had wide ranging benefits, improved living standards, provided technological capabilities and financial resources. However, this outward-looking export based growth has in the aggregate generated new and increased environmental pressures. •From an economic perspective, both trade liberalization and environmental protection are inherently important. There is a need is to combine both these aspects to promote sustainable economic development.
L1:GP & SUS DEV / 6Asian Productivity Organization, Tokyo
One of the most important events in international trade isthe completion of negotiations of the Uruguay Round in 1993.
Implications for developing countries are strong given that:(I) gains of US$ 230 billion per annum are likely to accrue to world economy. Of this less than 30% gains will accrue to the South i.e., the developing countries; (II) possible economic losses to developing countries importing food because of decreases in allowable European and North American agricultural subsidies. (III) Multifibre Agreement will be phased out in 2004 thus removing quotas on exports of textiles
and clothing which would be favorable for a number of developing countries.
Trade restrictions, protectionist barriers, non - tariff trade barriers such as ecolabels have environmental and economic implications for developing countries and sustainable trade .
In this context, the need to strengthen policy compatibility between trade liberalization and environmental protection has never been more crucial particularly for developing countries. This alone will ensure their survival in international trade. Role of WTO will be crucial in integrating trade and its environmental implications and in promoting and simulating trade in sustainable goods and services
Trade and Developing Countries
L1:GP & SUS DEV / 7Asian Productivity Organization, Tokyo
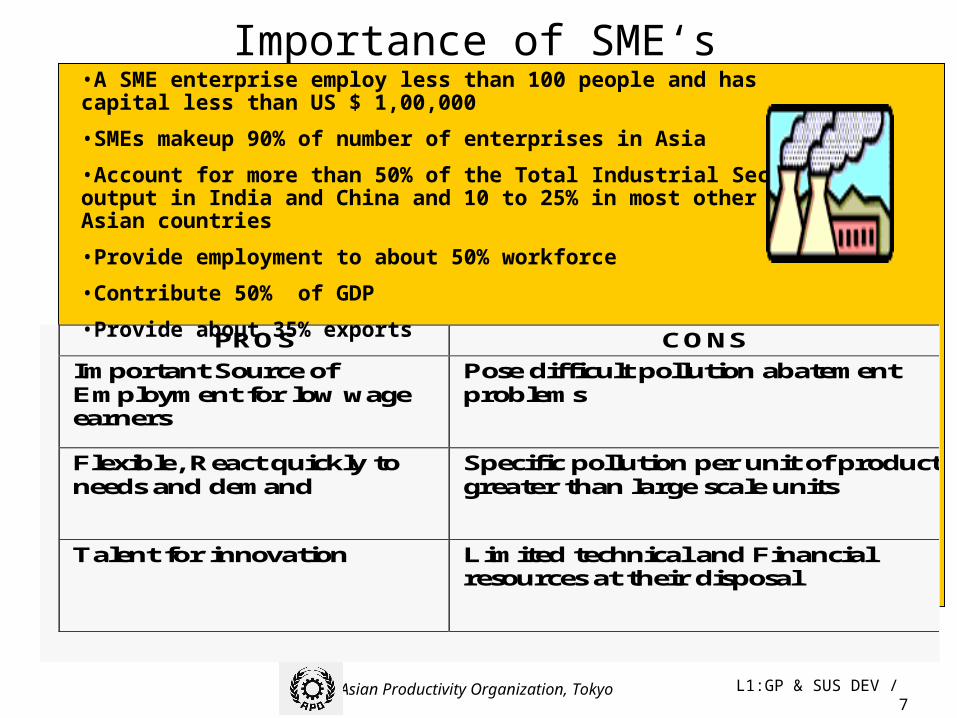
Importance of SME‘s
PROS CONS
Important Source ofEmployment for low wageearners
Pose difficult pollution abatementproblems
Flexible, React quickly toneeds and demand
Specific pollution per unit of productgreater than large scale units
Talent for innovation Limited technical and Financialresources at their disposal
•A SME enterprise employ less than 100 people and has capital less than US $ 1,00,000
•SMEs makeup 90% of number of enterprises in Asia
•Account for more than 50% of the Total Industrial Sector output in India and China and 10 to 25% in most other Asian countries
•Provide employment to about 50% workforce
•Contribute 50% of GDP
•Provide about 35% exports
L1:GP & SUS DEV / 8Asian Productivity Organization, Tokyo
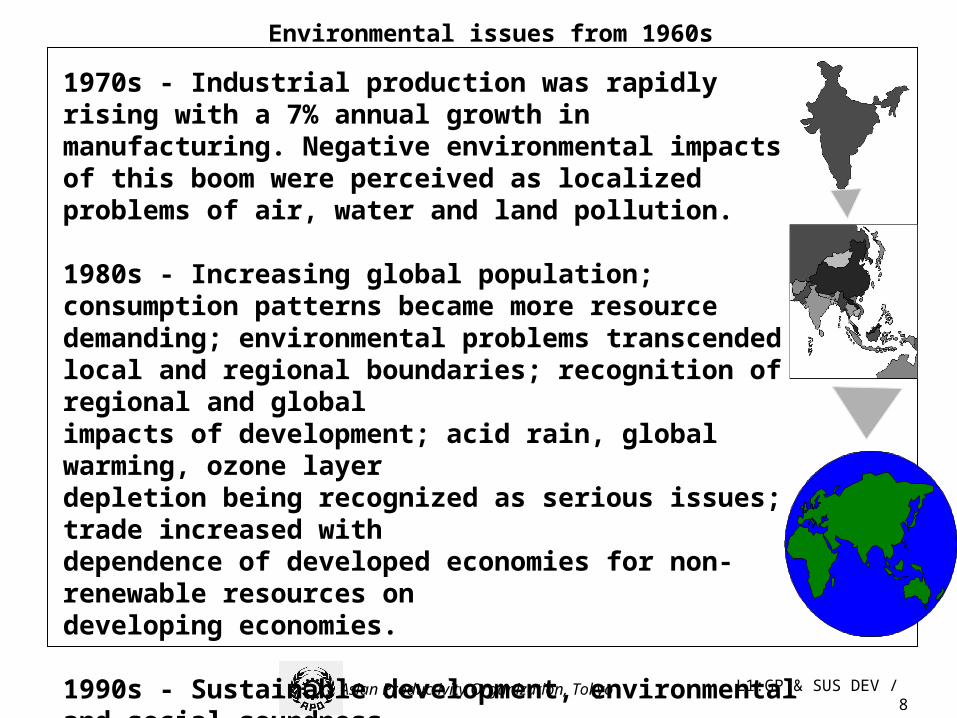
Environmental issues from 1960s
1970s - Industrial production was rapidly rising with a 7% annual growth in manufacturing. Negative environmental impacts of this boom were perceived as localized problems of air, water and land pollution.
1980s - Increasing global population; consumption patterns became more resource demanding; environmental problems transcended local and regional boundaries; recognition of regional and global impacts of development; acid rain, global warming, ozone layer depletion being recognized as serious issues; trade increased with dependence of developed economies for non-renewable resources on developing economies.
1990s - Sustainable development, environmental and social soundness began to be recognized as issues of governance. Role of environment and development in international trade have become issues of international polity and diplomacy. Emergence of a New Order with sustainable development as the need of the hour.

L1:GP & SUS DEV / 9Asian Productivity Organization, Tokyo
Landmark milestones from 1960s
1960s 1970s 1980s 1990s
Rac
hel C
arso
n’s
book
“Si
lent
Spr
ing”
Orig
in o
f the
con
cept
of “
Lim
its o
f Gro
wth
”
The
Popu
latio
n B
omb
Theo
ry b
y Eh
rlich
&
Ehrli
ch
The
Glo
bal 2
000
Rep
ort 1
980
WC
ED’s
Rep
ort “
Our
Com
mon
Fut
ure”
Eart
h Su
mm
it at
Rio
and
the
Age
nda
21
Inte
rnat
iona
l Fac
tor 1
0 C
lub
Uni
ted
Nat
ions
Con
fere
nces
on
Envi
ronm
ent,
Popu
latio
n, H
uman
Set
tlem
ents
L1:GP & SUS DEV / 10Asian Productivity Organization, Tokyo
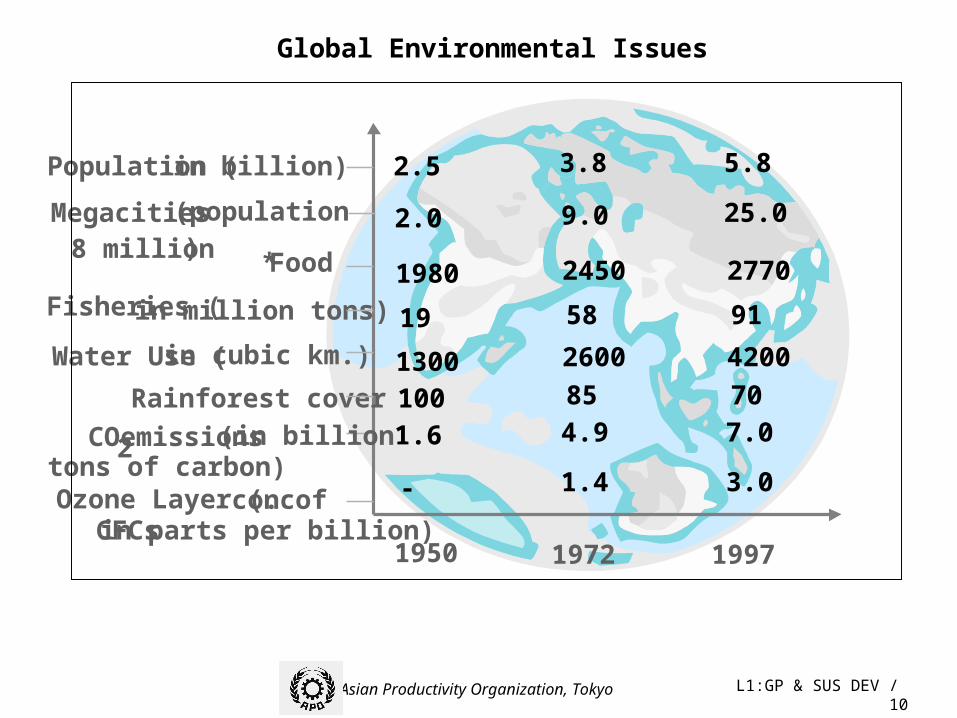
Global Environmental Issues
Population ( in billion)
Megacities (population 8 million )
*Food
Fisheries (in million tons)
Water Use (in cubic km.)
Rainforest cover
CO 2 emissions (in billion tons of carbon)Ozone Layer ( conc. ofCFCs in parts per billion)
1950 1972 1997
2.5 3.8 5.8
2.0 9.0 25.0
1980 2450 2770
19 58 91
1300 2600 4200
100 85 70
1.6 4.9 7.0
- 1.4 3.0
L1:GP & SUS DEV / 11Asian Productivity Organization, Tokyo
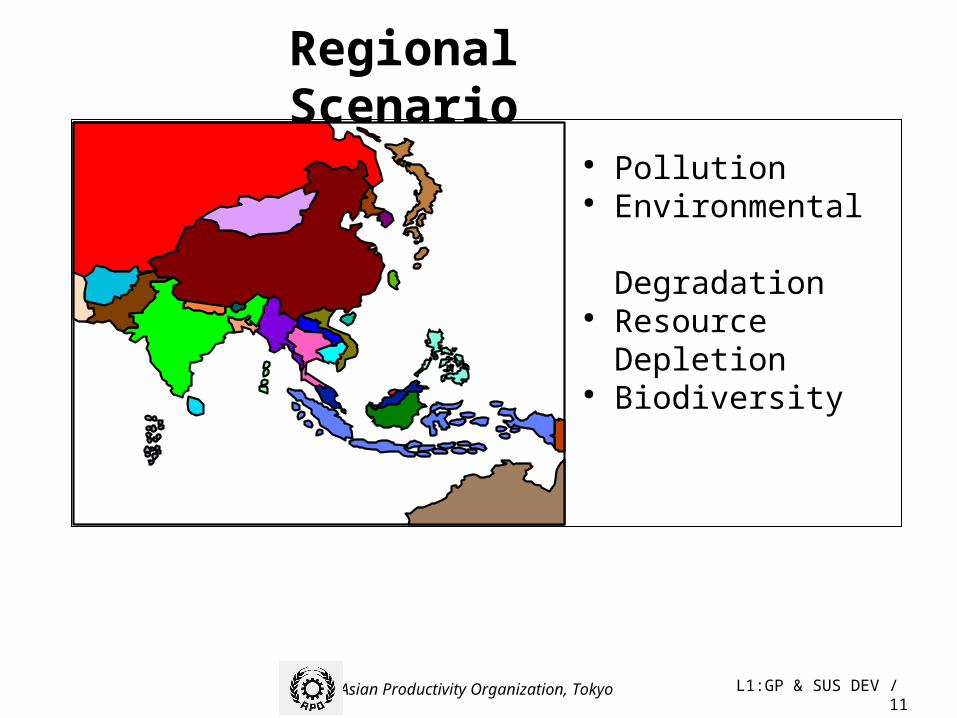
Regional Scenario
Pollution Environmental
Degradation Resource Depletion Biodiversity
L1:GP & SUS DEV / 12Asian Productivity Organization, Tokyo
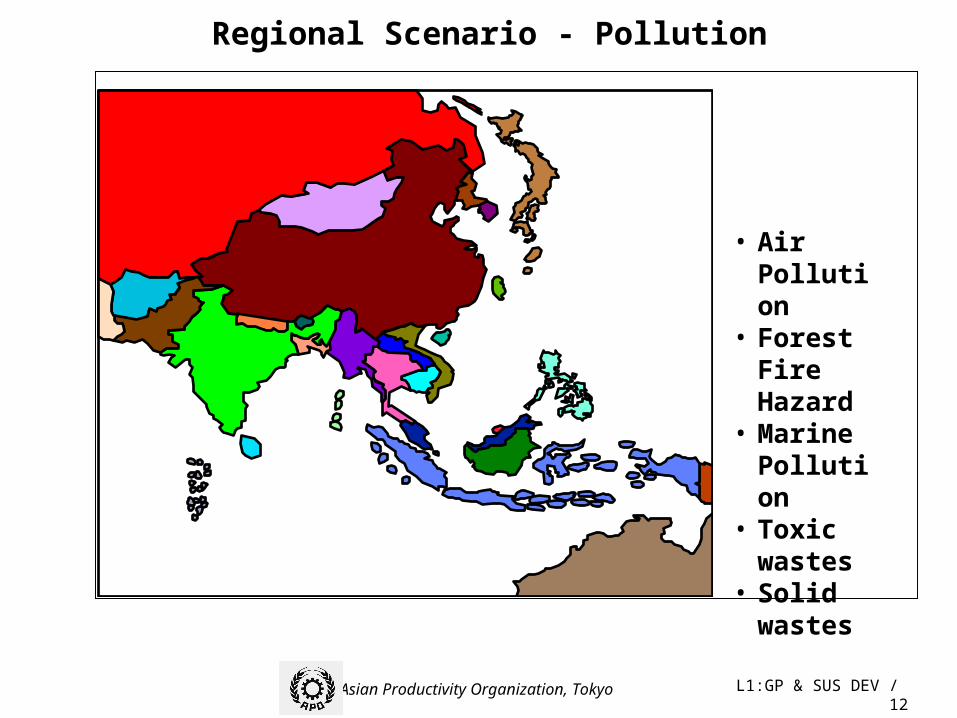
Regional Scenario - Pollution
• Air Pollution
• Forest Fire Hazard
• Marine Pollution
• Toxic wastes
• Solid wastes
L1:GP & SUS DEV / 13Asian Productivity Organization, Tokyo
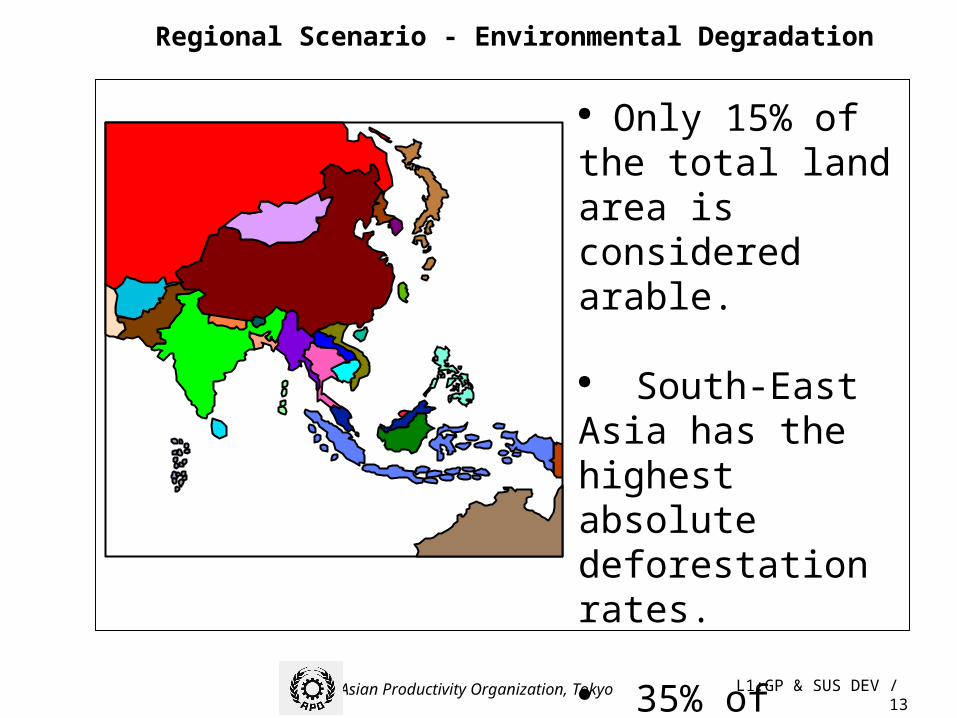
Regional Scenario - Environmental Degradation
Only 15% of the total land area is considered arable.
South-East Asia has the highest absolute deforestation rates.
35% of productive land in Asia is now desertified.

L1:GP & SUS DEV / 14Asian Productivity Organization, Tokyo
Regional scenario - Resource Depletion •Water scarcity: Fresh-water availability of below 1,000 cubic metres per capita per year indicates water scarcity. India is projected to fall into the water-stress category before 2025.
•Fossil fuel and energy demand:The region accounted for about 41% of world coal consumption in 1993.
declining availability of fresh water
deteriorating water quality
depletion of non-renewable fuel and mineral resources
declining availability of fresh water
deteriorating water quality
depletion of non-renewable fuel and mineral resources
L1:GP & SUS DEV / 15Asian Productivity Organization, Tokyo
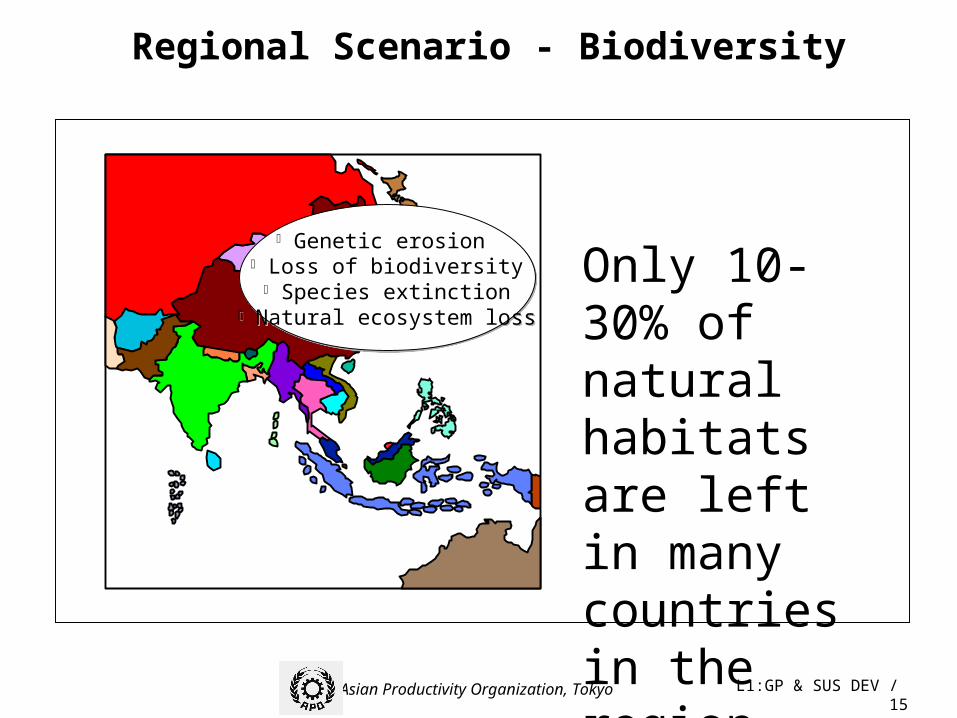
Only 10-30% of natural habitats are left in many countries in the region.
Regional Scenario - Biodiversity
Genetic erosion Loss of biodiversity Species extinction
Natural ecosystem loss
Genetic erosion Loss of biodiversity Species extinction
Natural ecosystem loss

L1:GP & SUS DEV / 16Asian Productivity Organization, Tokyo
Asian Product ivity Organization, Tokyo 6
CHINA--- 10% OF ANNUAL GDP
INDIA --- > 5% OF GDP
ASIAN REGION - 5% OF ANNUAL GDP
World Bank estimates in 1992 -East Asian countr ies would spend up to $ 20 bil lion ayear during the 1990s to clean up environmentaldamage brought about by rapid industrialization andpopulation growth.
Estimated worldwideexpenditure for purchasi ng andmaintai ning end-of-pipetechnologies is over US$ 3BILLION.
JAPAN --- 1% OF GDPin 1995.
COST OF ENVIRONMENTAL DAMAGE
L1:GP & SUS DEV / 17Asian Productivity Organization, Tokyo
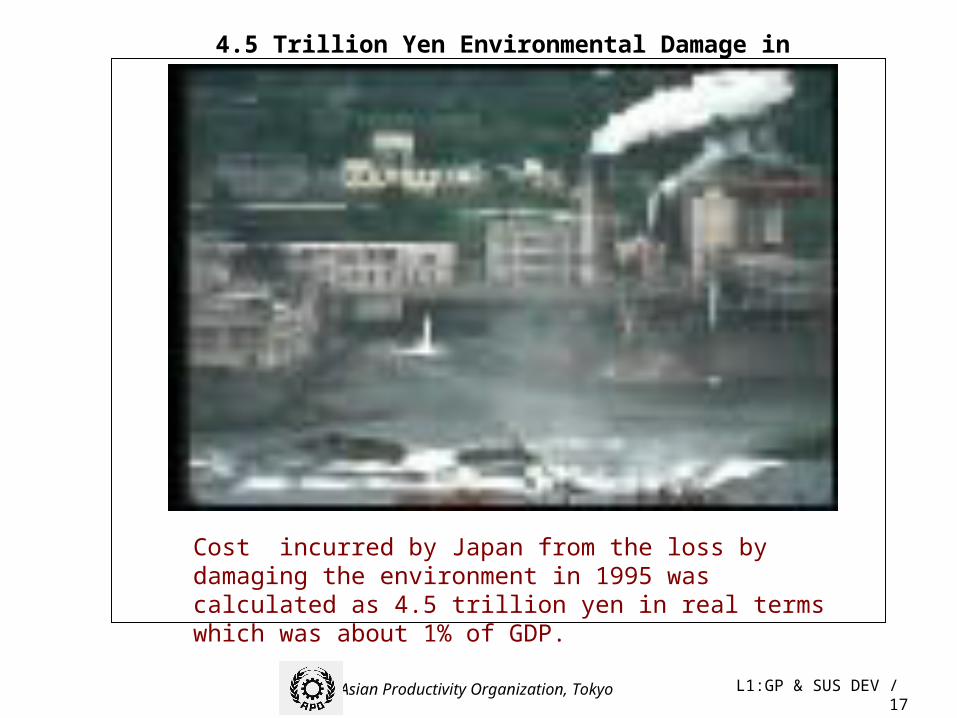
4.5 Trillion Yen Environmental Damage in 1995
Cost incurred by Japan from the loss by damaging the environment in 1995 was calculated as 4.5 trillion yen in real terms which was about 1% of GDP.

L1:GP & SUS DEV / 18Asian Productivity Organization, Tokyo
Public Concern
Societal demand for a cleaner environment and a better “quality of life” is increasing.
Public concern is being expressed as: protests/law suits consumer boycotts of products willingness to pay a premium for eco-friendly products
Stop the Pollution
Incidences Cause ResultLove Canal Episode, USA Toxic Waste PoisioningMinamata Mercury PoisioningBhopal gas Tragedy MIC Gas release
Bangladesh WellsArsenic Poisioning of the Ground water
Rivers like Ganges, Yamuna, Yangtze, Irrawady etc.
Industrial wastewater & domestic sewage discharge
PUBLIC PROTEST

L1:GP & SUS DEV / 19Asian Productivity Organization, Tokyo
International treaties and conventions to address global issues
IMPACT
Basel Convention
Montreal Protocol
Climate Change Convention
Convention on Biodiversity
Convention to Combat Desertification
Basel Convention
Montreal Protocol
Climate Change Convention
Convention on Biodiversity
Convention to Combat Desertification
Phase out of: hazardous materials lead in petrol CFCs in refrigeration GHG emitting processesBiodiversity conservationpromotion
Phase out of: hazardous materials lead in petrol CFCs in refrigeration GHG emitting processesBiodiversity conservationpromotion
International Environmental Treaties and Conventions
L1:GP & SUS DEV / 20Asian Productivity Organization, Tokyo
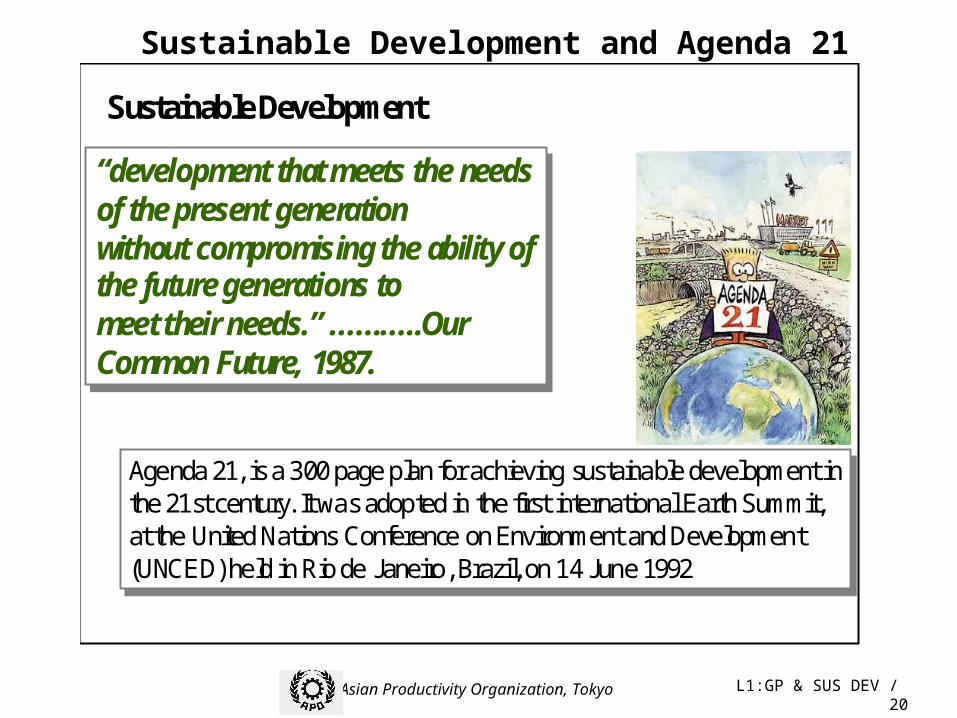
“development that meets the needsof the present generationwithout compromising the ability ofthe future generations tomeet their needs.” ………..OurCommon Future, 1987.
“development that meets the needsof the present generationwithout compromising the ability ofthe future generations tomeet their needs.” ………..OurCommon Future, 1987.
Sustainable Development
Agenda 21, is a 300 page plan for achieving sustainable development inthe 21st century. It was adopted in the first international Earth Summit,at the United Nations Conference on Environment and Development(UNCED) held in Rio de Janeiro, Brazil, on 14 June 1992
Agenda 21, is a 300 page plan for achieving sustainable development inthe 21st century. It was adopted in the first international Earth Summit,at the United Nations Conference on Environment and Development(UNCED) held in Rio de Janeiro, Brazil, on 14 June 1992
Sustainable Development and Agenda 21

L1:GP & SUS DEV / 21Asian Productivity Organization, Tokyo
Response to Agenda 21
Countries set up their own Local Agenda 21 plans.
Formation of the World Business Council of Sustainable Development (WBCSD), 1992
Formation of Malaysian Business Council of Sustainable Development, 1992
WBCSD’s Declaration for sustainable development stressed on eco-efficiency in production - More for Less
L1:GP & SUS DEV / 22Asian Productivity Organization, Tokyo
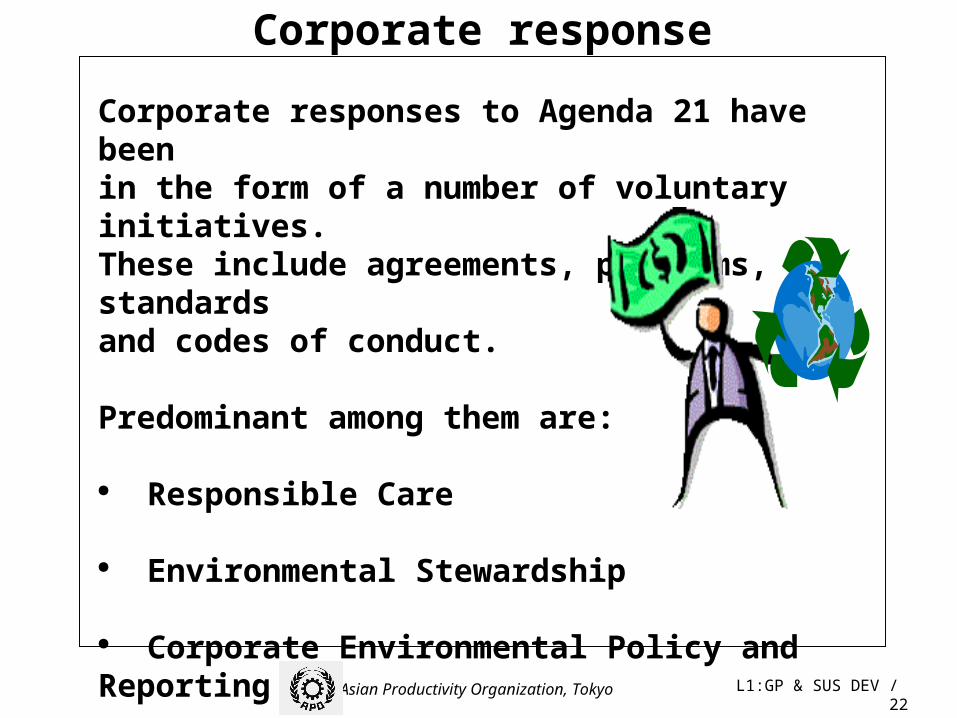
Corporate response
Corporate responses to Agenda 21 have been in the form of a number of voluntary initiatives. These include agreements, programs, standards and codes of conduct.
Predominant among them are:
Responsible Care
Environmental Stewardship
Corporate Environmental Policy and Reporting
Certification such as ISO 14000, SA 8000

L1:GP & SUS DEV / 23Asian Productivity Organization, Tokyo
Eco-efficiency, Factor 4 and 10 Eco-efficiency emphasizes economics, in addition to environmental improvement. It is concerned with resource productivity, that is, maximizing the value added per unit of resource input. The Wuppertal Institute in Germany coined the term Factor 4 to show that it is possible to quadruple resource productivity given the present state of technology.
Rising levels of consumption and a doubling of the world's population over the next 40-50 years would require a factor 4 increase in food production, a factor 6 increase in energy use and at least a factor 8 growth in income.
The Factor 10 Club, an international body of senior government, non-government, industry, and academic leaders believes that within one generation, nations can achieve a ten-fold increase in the efficiency with which they use resources.
Resource Efficiency

L1:GP & SUS DEV / 24Asian Productivity Organization, Tokyo
Ignore
Dilution and Dispersion
Treatment
Prevention
GP1990s
1980s
1970s
1960s
1950s
Environmental Management trends
L1:GP & SUS DEV / 25Asian Productivity Organization, Tokyo
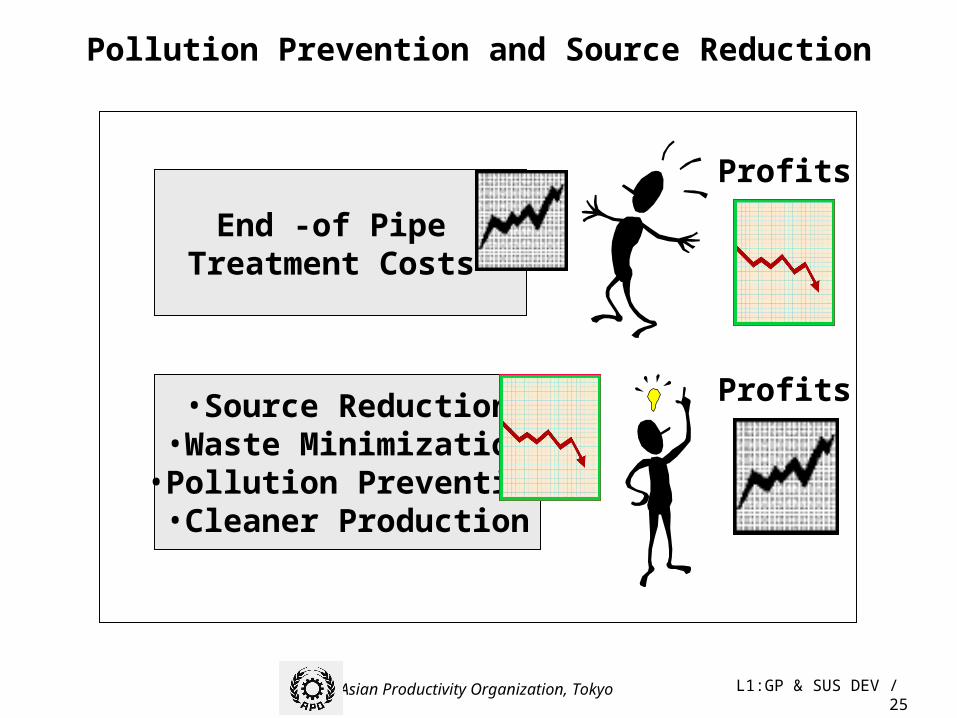
Pollution Prevention and Source Reduction
End -of Pipe Treatment Costs
•Source Reduction•Waste Minimization•Pollution Prevention•Cleaner Production
Profits
Profits
L1:GP & SUS DEV / 26Asian Productivity Organization, Tokyo
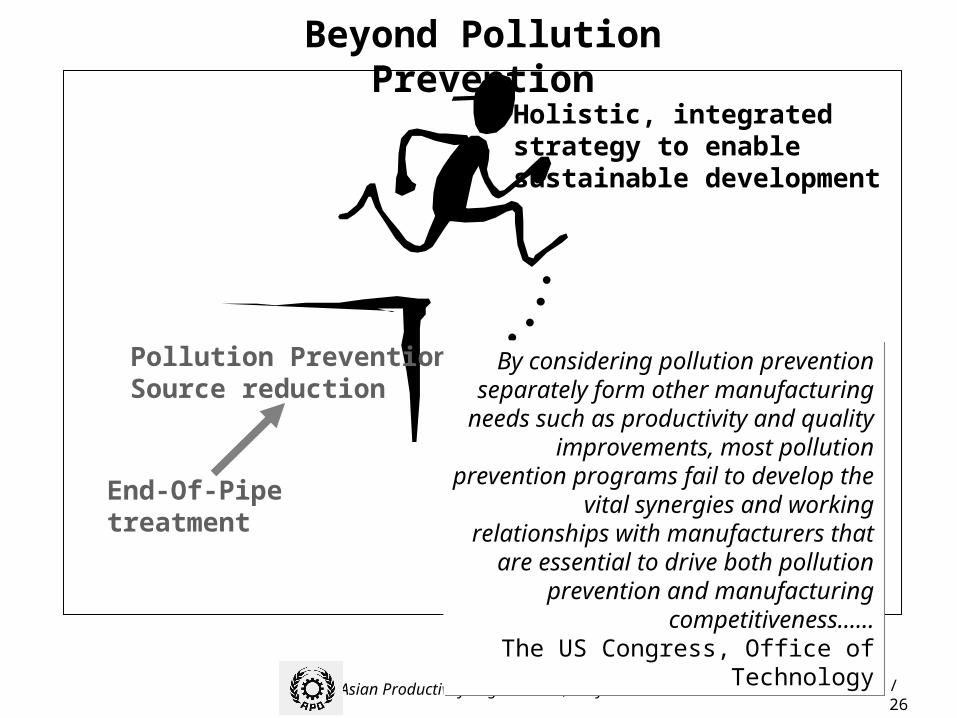
Beyond Pollution Prevention
Pollution PreventionSource reduction
End-Of-Pipe treatment
Holistic, integratedstrategy to enablesustainable development
By considering pollution prevention separately form other manufacturing needs such as
productivity and quality improvements, most pollution prevention programs fail to develop the
vital synergies and working relationships with manufacturers that are essential to drive both
pollution prevention and manufacturing competitiveness…...
The US Congress, Office of Technology
L1:GP & SUS DEV / 27Asian Productivity Organization, Tokyo
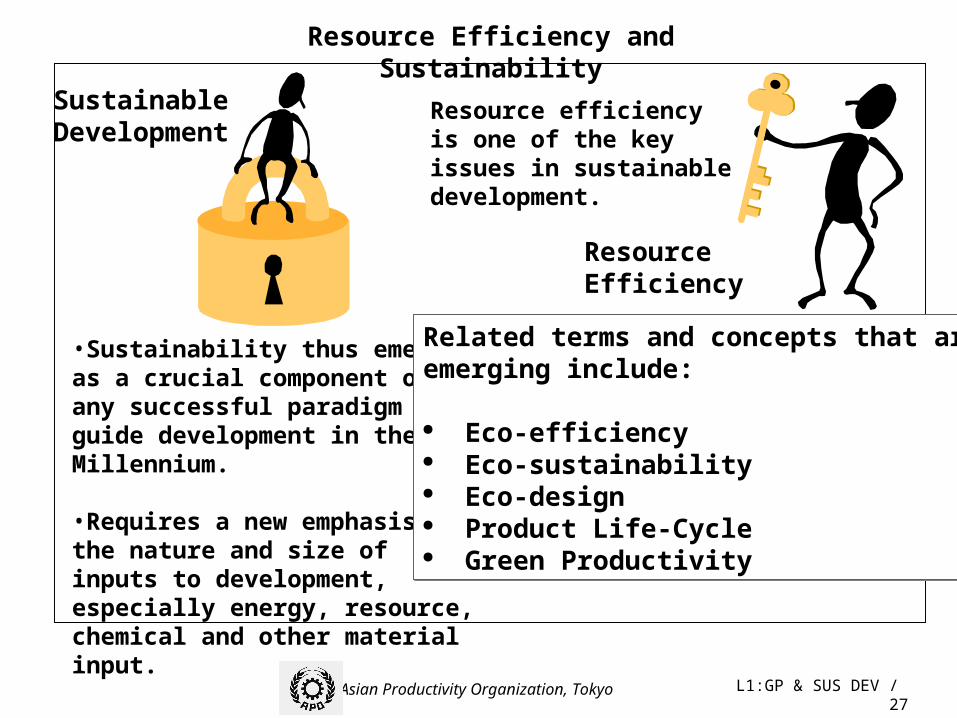
Resource Efficiency
Sustainable Development
Resource efficiency is one of the key issues in sustainable development.
•Sustainability thus emerges as a crucial component of any successful paradigm to guide development in the new Millennium.
•Requires a new emphasis on the nature and size of inputs to development, especially energy, resource, chemical and other material input.
Related terms and concepts that are emerging include:
Eco-efficiency Eco-sustainability Eco-design Product Life-Cycle Green Productivity
Related terms and concepts that are emerging include:
Eco-efficiency Eco-sustainability Eco-design Product Life-Cycle Green Productivity
Resource Efficiency and Sustainability
L1:GP & SUS DEV / 28Asian Productivity Organization, Tokyo
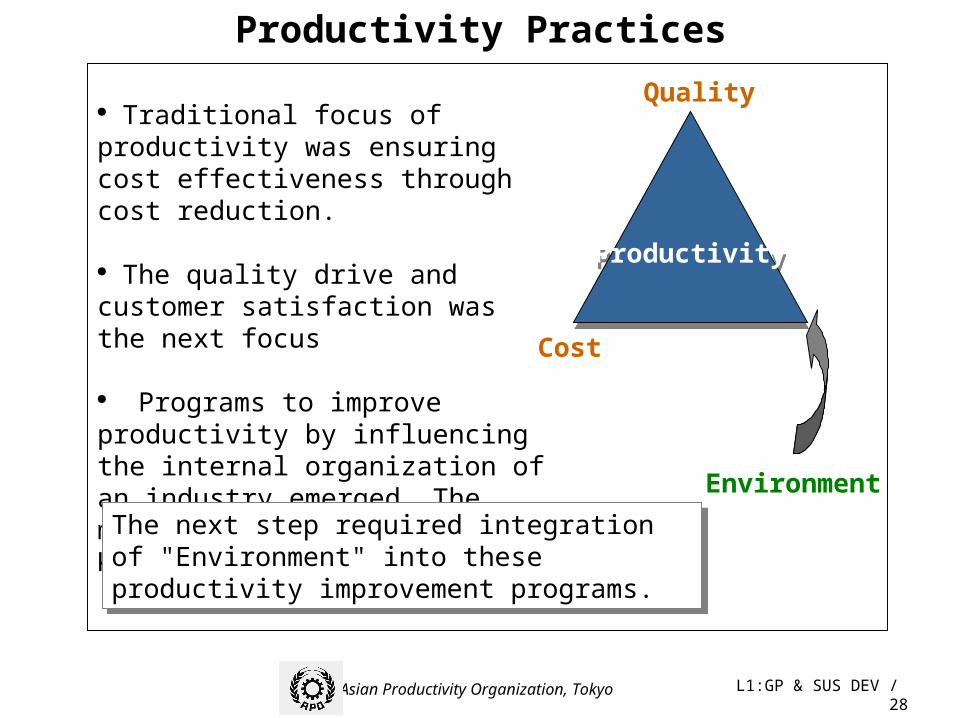
Traditional focus of productivity was ensuring cost effectiveness through cost reduction.
The quality drive and customer satisfaction was the next focus
Programs to improve productivity by influencing the internal organization of an industry emerged. The most popular have been Kaizen, TQM, TPM etc.
ProductivityProductivity
The next step required integration of "Environment" into these productivity improvement programs.
The next step required integration of "Environment" into these productivity improvement programs.
Quality
Cost
Environment
Productivity Practices
L1:GP & SUS DEV / 29Asian Productivity Organization, Tokyo
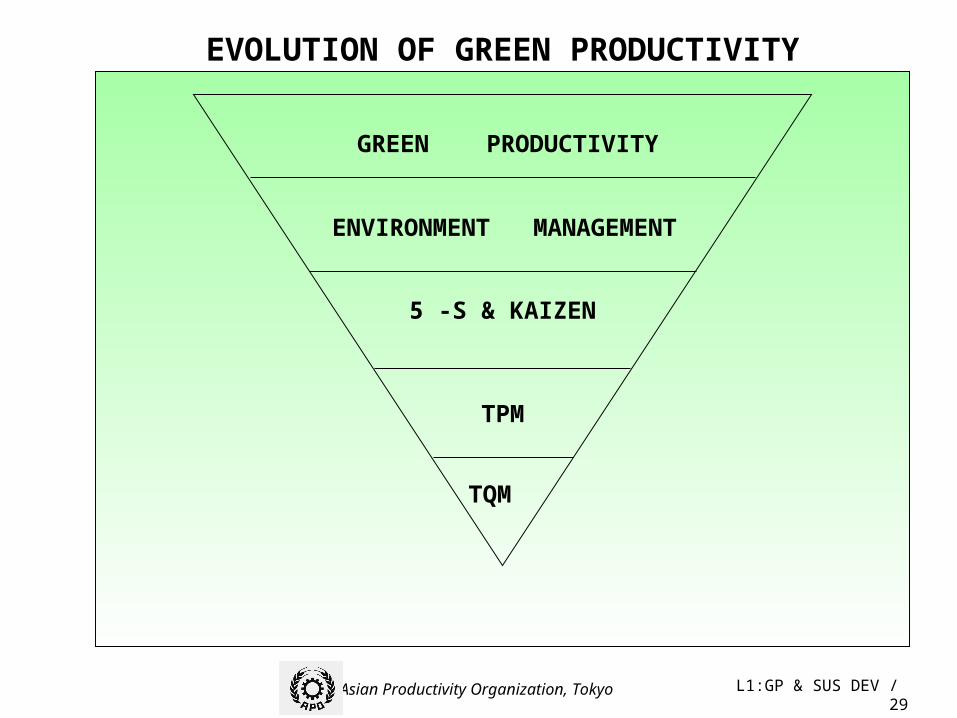
TQM
TPM
5 -S & KAIZEN
ENVIRONMENT MANAGEMENT
GREEN PRODUCTIVITY
EVOLUTION OF GREEN PRODUCTIVITY

L1:GP & SUS DEV / 30Asian Productivity Organization, Tokyo
Productivity improvement means improvement in QCDMS:
Q= Quality Higher Quality that meets or exceeds customer requirementsC= Cost Lower CostD= Delivery Timely Delivery as desired by the customerM= Morale Boosting morale of all concernedS= Safety Thinking and improving safety of each and every aspect of the product and process
L1:GP & SUS DEV / 31Asian Productivity Organization, Tokyo
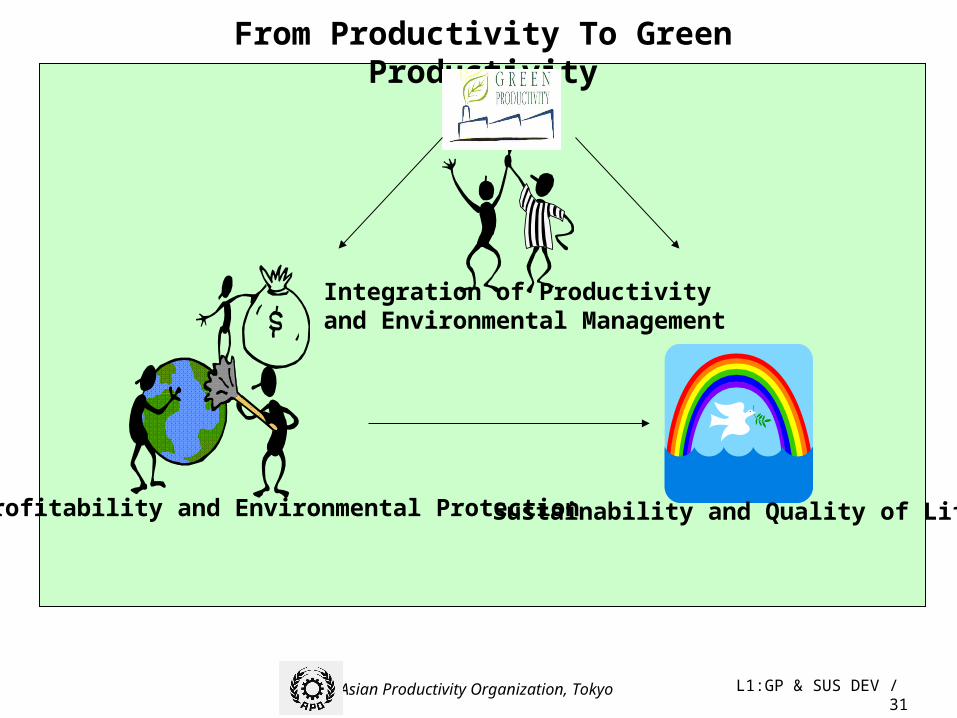
From Productivity To Green Productivity
Profitability and Environmental Protection
Integration of Productivity and Environmental Management
Sustainability and Quality of Life

L1:GP & SUS DEV / 32Asian Productivity Organization, Tokyo

L1:GP & SUS DEV / 33Asian Productivity Organization, Tokyo

L1:GP & SUS DEV / 34Asian Productivity Organization, Tokyo

L1:GP & SUS DEV / 35Asian Productivity Organization, Tokyo

L1:GP & SUS DEV / 36Asian Productivity Organization, Tokyo
L1:GP & SUS DEV / 37Asian Productivity Organization, Tokyo
L1:GP & SUS DEV / 38Asian Productivity Organization, Tokyo

L1:GP & SUS DEV / 39Asian Productivity Organization, Tokyo


![Level 5 Economics: Theory of the Firm [2] Economic Principles Economic Principles Economic Environment Economic Environment](https://img.pdfslide.us/doc/110x75/5519166655034638428b49a5/level-5-economics-theory-of-the-firm-2-economic-principles-economic-principles-economic-environment-economic-environment.jpg)