Embed Size (px)
Citation preview

Part 1: Introduction 1-1/40
Econometrics I Professor William Greene
Stern School of Business
Department of Economics

Part 1: Introduction 1-2/40
http://people.stern.nyu.edu/wgreene/Econometrics/Econometrics.htm

Part 1: Introduction 1-3/40
Overview: This is an intermediate level, Ph.D. course in Applied
Econometrics. Topics to be studied include specification, estimation, and inference in the context of models that include then extend beyond the standard linear multiple regression framework. After a review of the linear model, we will develop the theory necessary for analysis of generalized linear and nonlinear models.
Topics to be examined:
Regression modeling
Instrumental variables
Robust estimation and inference
Causal inference
Nonlinear modeling
Cross section, time series and panel data
Objective:
Preparation to read and carry out empirical social science research using modern econometric methods.
Abstract

Part 1: Introduction 1-4/40
Prerequisites
A previous course that used linear regression
Mathematical statistics
Matrix algebra

Part 1: Introduction 1-5/40
Readings
Main text: Greene, W.,
Econometric Analysis,
8th Edition,
Prentice Hall, 2017.
A few articles
Notes and materials on the course website:
http://people.stern.nyu.edu/wgreene/Econometrics/Econometrics.htm

Part 1: Introduction 1-6/40
Course Schedule
No class on: Thursday, September 21 *Tuesday, November 21 Thursday, November 23 *Tuesday, November 28
Added class on: Tuesday, December 12
Midterm: October 24
Final: Take home; posted December 7, due December 19

Part 1: Introduction 1-7/40
Practicals
Software
NLOGIT provided, supported http://people.stern.nyu.edu/wgreene/Econometrics/NLsetup.exe
SAS, Stata, EViews optional, your choice
R, Matlab, Gauss, others
Questions and review as requested
Problem Sets: (more details later)

Part 1: Introduction 1-8/40
Course Requirements
Problem sets: 5 (30%)
Midterm, in class (30%)
Final exam, take home (40%)

Part 1: Introduction 1-9/40
Econometrics I
Part 1 - Paradigm

Part 1: Introduction 1-10/40
Econometrics: Paradigm
Theoretical foundations Behavioral modeling: Optimization, labor supply,
demand equations, etc.
Microeconometrics and macroeconometrics
Mathematical Elements
Statistical foundations
‘Model’ building – the econometric model Mathematical elements
The underlying truth – is there one?

Part 1: Introduction 1-11/40
Objectives
Understanding covariation: What is the income elasticity of the demand for
health care in an economy?
Understanding a relationship: How will drivers respond to the availability of a
new toll road?
Causal Inference: The search for “causal” effects Did an antitrust intervention that broke up a
British boarding schools cartel have an impact on fees charged?
Prediction of an outcome of interest Does internet “buzz” help to predict movie
success?

Part 1: Introduction 1-12/40
Trends in Econometrics
Small structural models
Pervasiveness of an econometrics paradigm
Non- and semiparametric methods vs. parametric
Robust methods / Estimation and inference
Nonlinear modeling (the role of software)
Behavioral and structural modeling vs. “reduced form,”
“covariance analysis”
Identification and “causal” effects

Part 1: Introduction 1-13/40
Data Structures
Observation mechanisms
Passive, nonexperimental (the usual)
Randomly assigned experiment (wishful)
Active, experimental (occasional)
The ‘natural experiment’ (occasional, limited)
Data types
Cross section
Pure time series
Panel –
Longitudinal data – NLS
Country macro data – Penn W.T.
Financial data

Part 1: Introduction 1-14/40
Paradigm: Classical Inference
Population Measurement
Econometrics
Characteristics Behavior Patterns Choices
Imprecise inference about the entire population – sampling theory and asymptotics

Part 1: Introduction 1-15/40
Paradigm: Bayesian Inference
Population Measurement
Econometrics
Characteristics Behavior Patterns Choices
Sharp, ‘exact’ inference about only the sample – the ‘posterior’ density.

Part 1: Introduction 1-16/40
An Application:
Cornwell and Rupert Labor Market Data
Is Wage Related to Education?
Cornwell and Rupert Returns to Schooling Data, 595 Individuals, 7 Years Variables in the file are
EXP = work experience WKS = weeks worked OCC = occupation, 1 if blue collar, IND = 1 if manufacturing industry SOUTH = 1 if resides in south SMSA = 1 if resides in a city (SMSA) MS = 1 if married FEM = 1 if female UNION = 1 if wage set by union contract ED = years of education LWAGE = log of wage = dependent variable in regressions
These data were analyzed in Cornwell, C. and Rupert, P., "Efficient Estimation with Panel Data: An Empirical Comparison of Instrumental Variable Estimators," Journal of Applied Econometrics, 3, 1988, pp. 149-155.

Part 1: Introduction 1-17/40

Part 1: Introduction 1-18/40
Model Building in Econometrics
Role of the assumptions
Parameterizing the model
Nonparametric analysis
Semiparametric analysis
Parametric analysis
Sharpness of inferences

Part 1: Introduction 1-19/40
Nonparametric Regression
Kernel regression of log wage on education
Semiparametric Regression:
Least absolute deviations regression
Parametric Regression: Least squares –
maximum likelihood – regression
Application: Is there a relationship
between (log) Wage and Education?

Part 1: Introduction 1-20/40
A First Look at the Data
Descriptive Statistics
Basic Measures of Location and Dispersion
Graphical Devices
Box Plots
Histogram
Kernel Density Estimator

Part 1: Introduction 1-21/40

Part 1: Introduction 1-22/40
Box Plots
Shows upward trend in median log wage
Part 1: Introduction 1-23/40
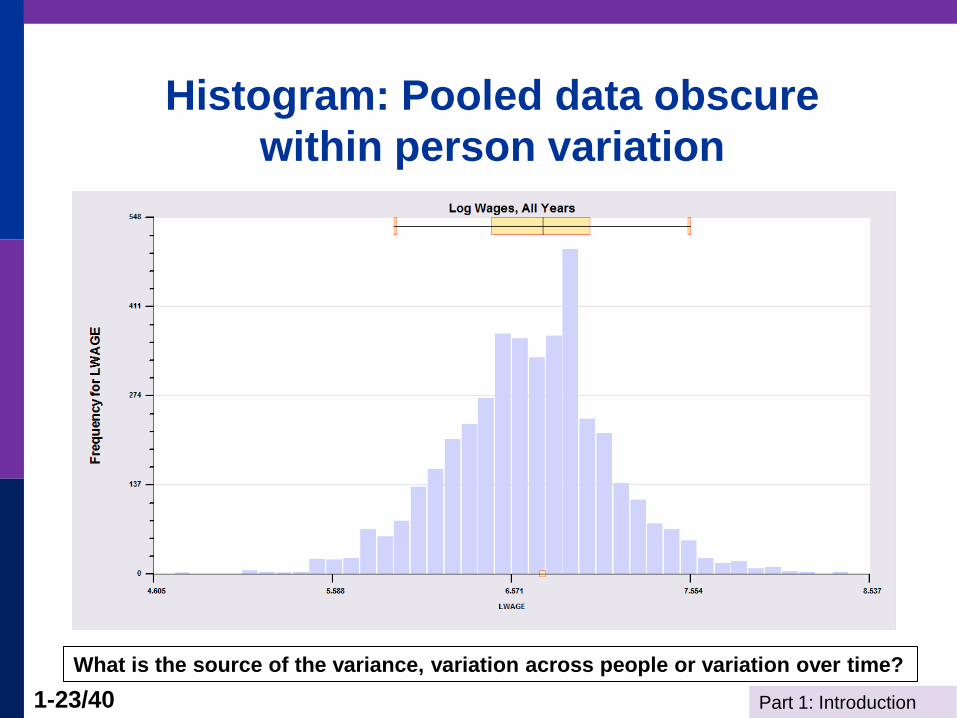
Histogram: Pooled data obscure
within person variation
What is the source of the variance, variation across people or variation over time?
Part 1: Introduction 1-24/40
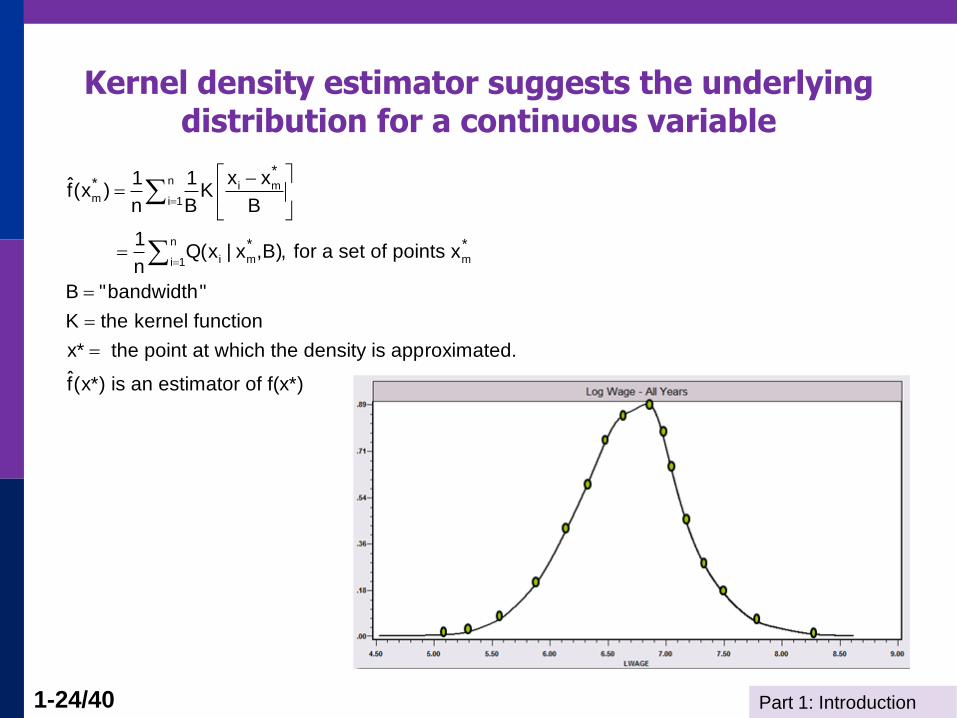
Kernel density estimator suggests the underlying distribution for a continuous variable
n i mm i 1
n
i m mi 1
**
* *
x x1 1f̂(x ) K
n B B
1 Q(x | x ,B), for a set of points x
n
B "bandwidth"
K the kernel function
x* the point at which the density is approximated.
f̂(x*) is an estimator of f(x*)

Part 1: Introduction 1-25/40
The kernel density
estimator is a
histogram (of sorts).
n i m
m mi 1
** *x x1 1
f̂(x ) K , for a set of points xn B B
B "bandwidth" chosen by the analyst
K the kernel function, such as the normal
or logistic pdf (or one of several others)
x* the point at which the density is approximated.
This is essentially a histogram with small bins.

Part 1: Introduction 1-26/40

Part 1: Introduction 1-27/40

Part 1: Introduction 1-28/40
From Jones and Schurer (2011) Stylized Box Plot

Part 1: Introduction 1-29/40
From Jones and Schurer (2011)

Part 1: Introduction 1-30/40
Objective: Impact of Education
on (log) Wage
Specification: What is the right model to
use to analyze this association?
Estimation
Inference
Analysis

Part 1: Introduction 1-31/40
Simple Linear Regression
LWAGE = 5.8388 + 0.0652*ED

Part 1: Introduction 1-32/40
Multiple Regression

Part 1: Introduction 1-33/40
Nonlinear Specification:
Quadratic Effect of Experience

Part 1: Introduction 1-34/40
Model Building in Econometrics
A Model Relating (Log)Wage to Gender and Education & Experience

Part 1: Introduction 1-35/40
Partial Effects
Coefficients may not tell the story
Education .05654
Experience .04045 - 2*.00068*Exp
FEM -.38922

Part 1: Introduction 1-36/40
Effect of Experience = .04045 - 2*.00068*Exp
Positive from 1 to 30, negative after.
Part 1: Introduction 1-37/40
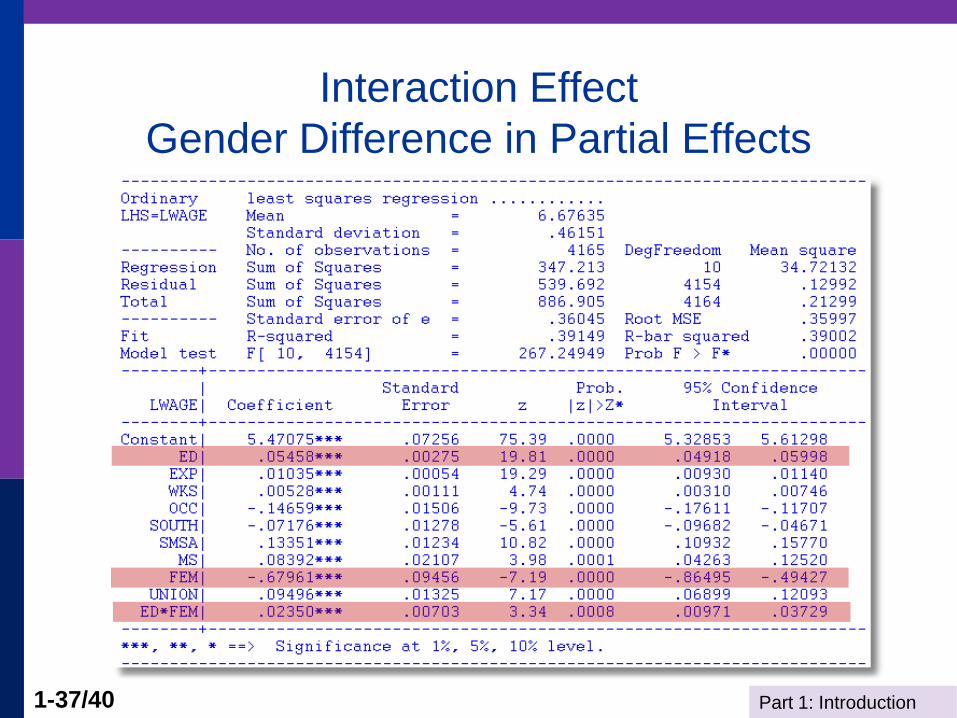
Interaction Effect
Gender Difference in Partial Effects

Part 1: Introduction 1-38/40
Partial Effect of a Year of Education
E[logWage]/ED = ED + ED*FEM *FEM
= 0.05458 + 0.02350*FEM
Note, the effect is positive.
The effect 43% is larger for women.

Part 1: Introduction 1-39/40
Gender Effect Varies by Years of Education
E[logWage]/FEM = FEM + ED*FEM *ED
= -0.67961 + 0.0235*ED
Part 1: Introduction 1-40/40
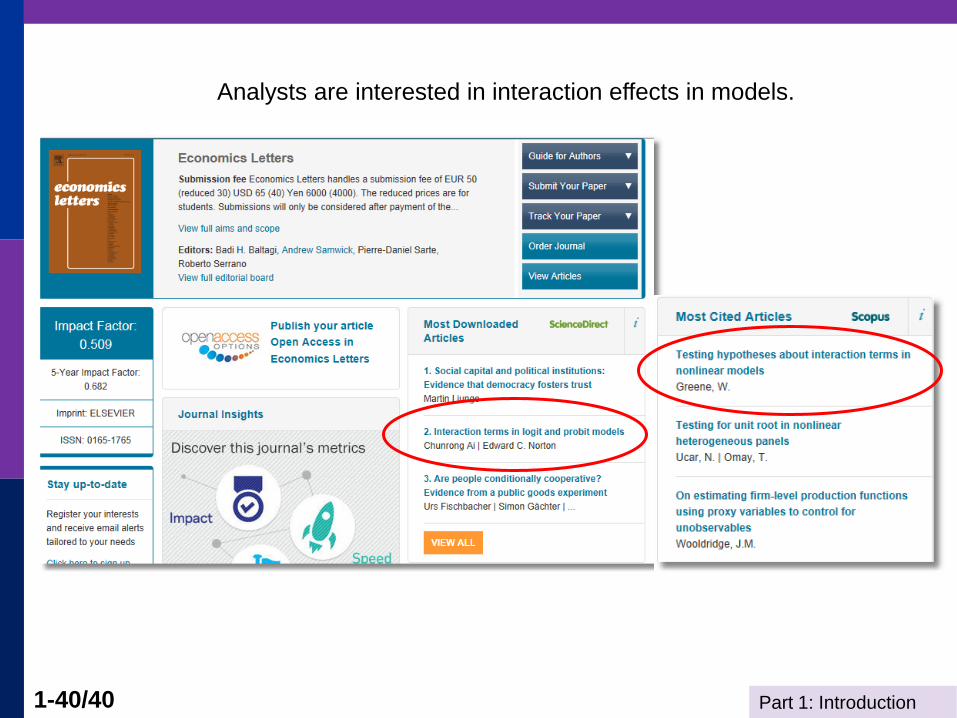
Analysts are interested in interaction effects in models.