Embed Size (px)
Citation preview
Page 1Version 1.0
Eviews Tutorial
Spring, 2004
Econometrics 322Prof. Paczkowski
Page 2Version 1.0
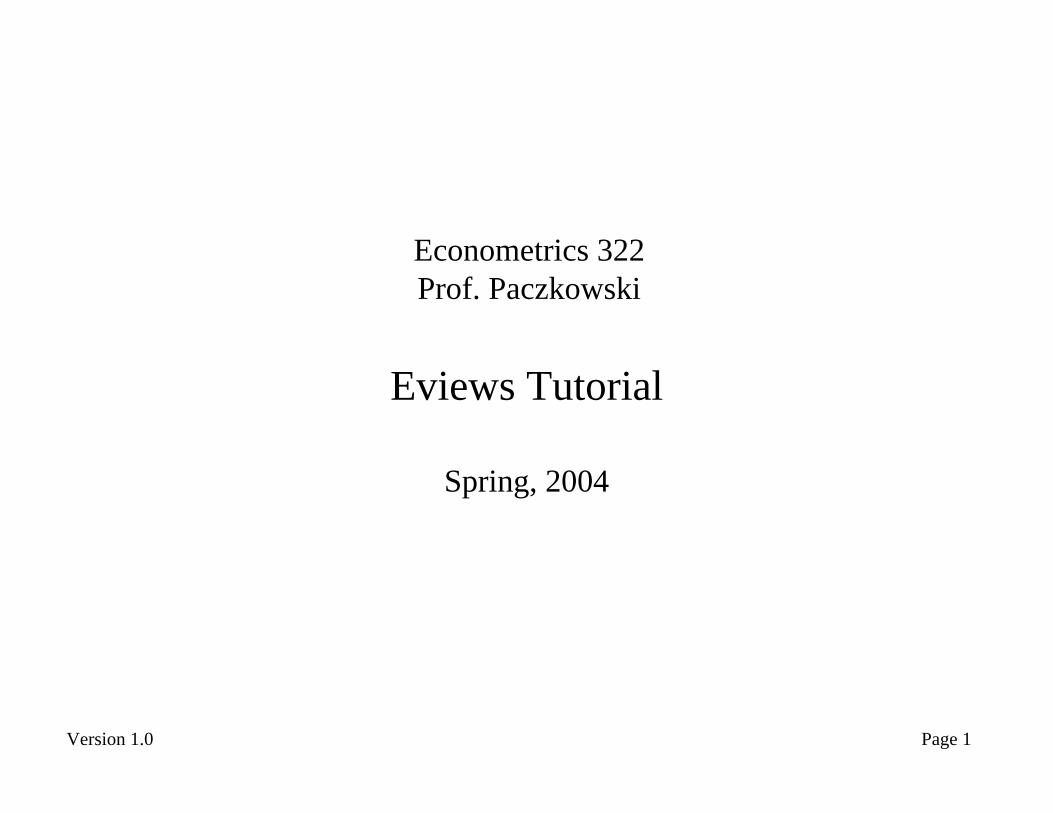
Eviews Blank Screen
You will type commands here
Output will appear here
Page 3Version 1.0
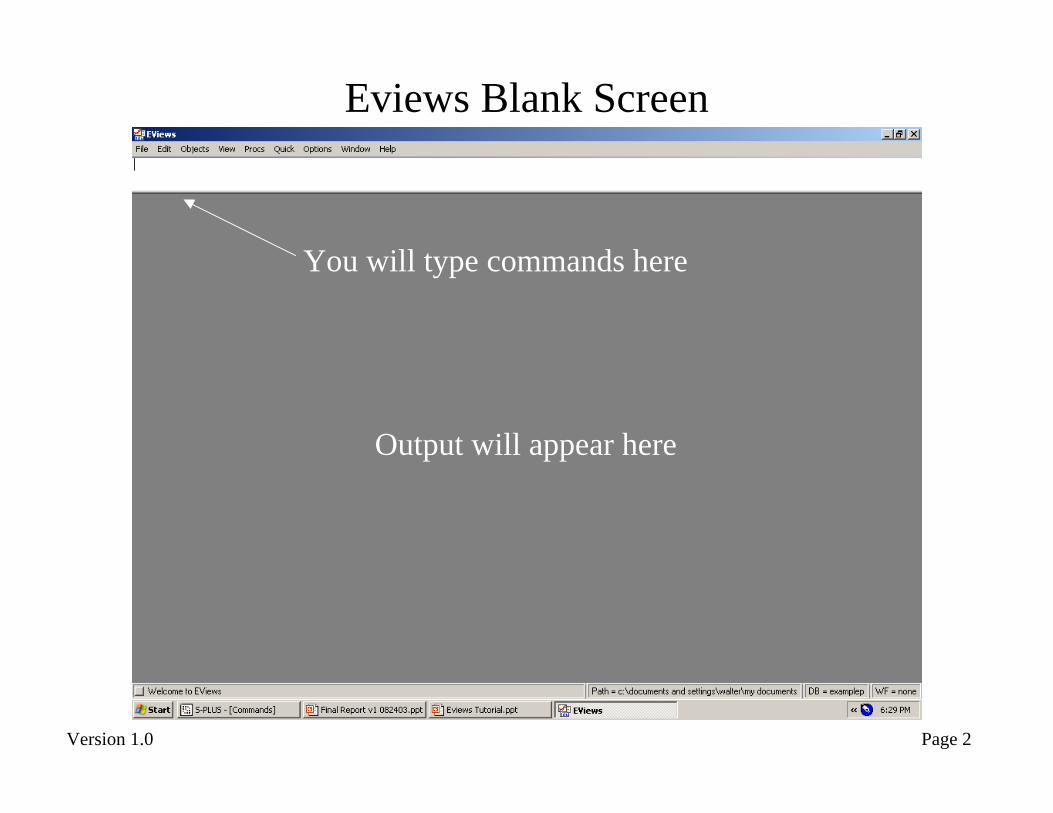
Create a Workspace First
ClickFile/New/WorkFile
Page 4Version 1.0
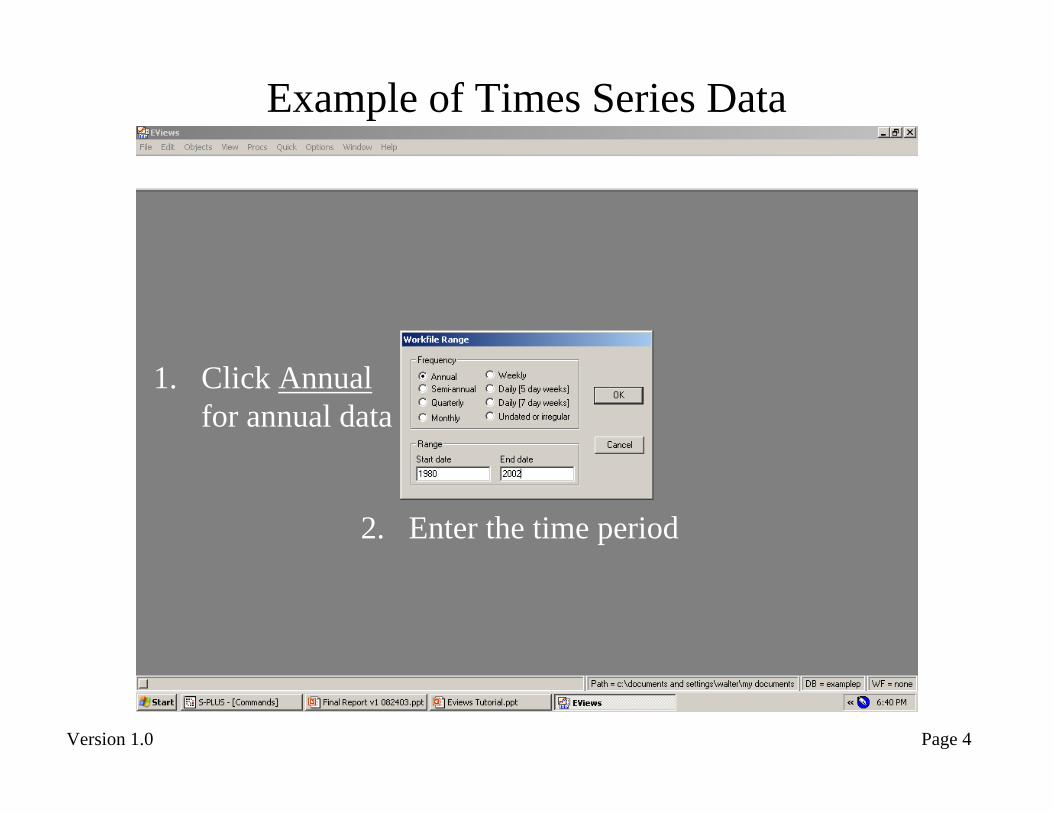
Example of Times Series Data
1. Click Annualfor annual data
2. Enter the time period
Page 5Version 1.0
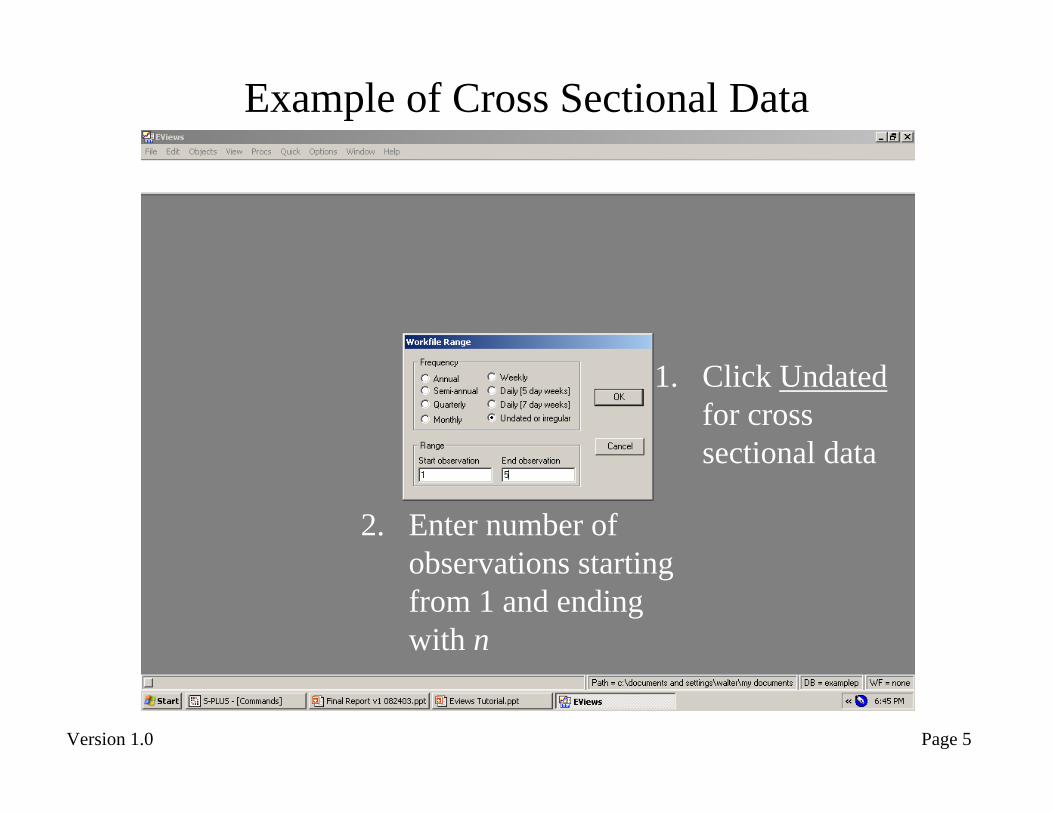
Example of Cross Sectional Data
1. Click Undatedfor cross sectional data
2. Enter number of observations starting from 1 and ending with n
Page 6Version 1.0
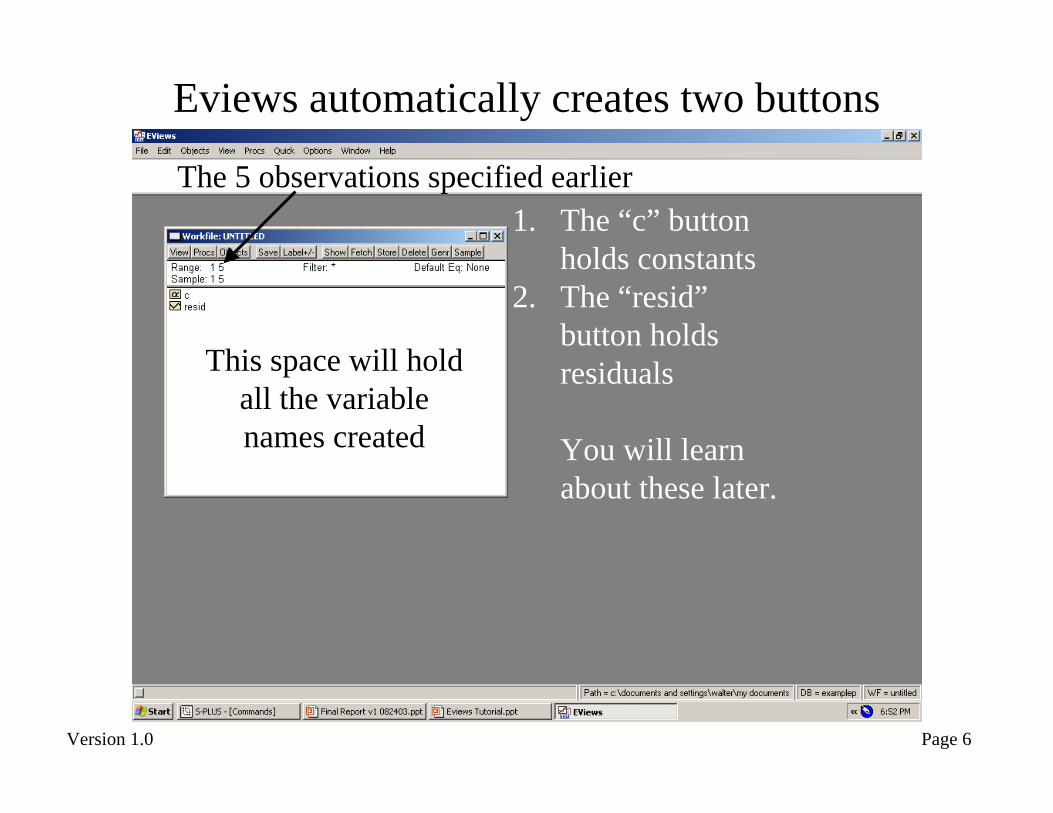
Eviews automatically creates two buttons
1. The “c” button holds constants
2. The “resid” button holds residuals
You will learn about these later.
The 5 observations specified earlier
This space will hold all the variable names created
Page 7Version 1.0
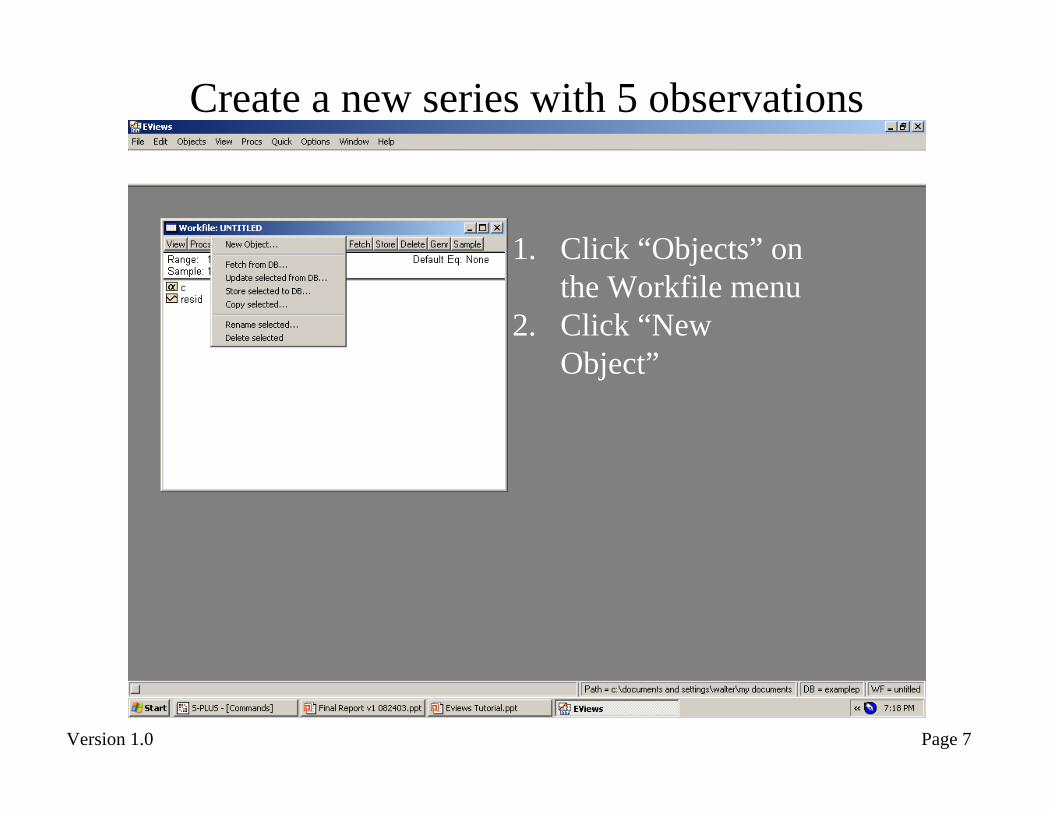
Create a new series with 5 observations
1. Click “Objects” on the Workfile menu
2. Click “New Object”
Page 8Version 1.0
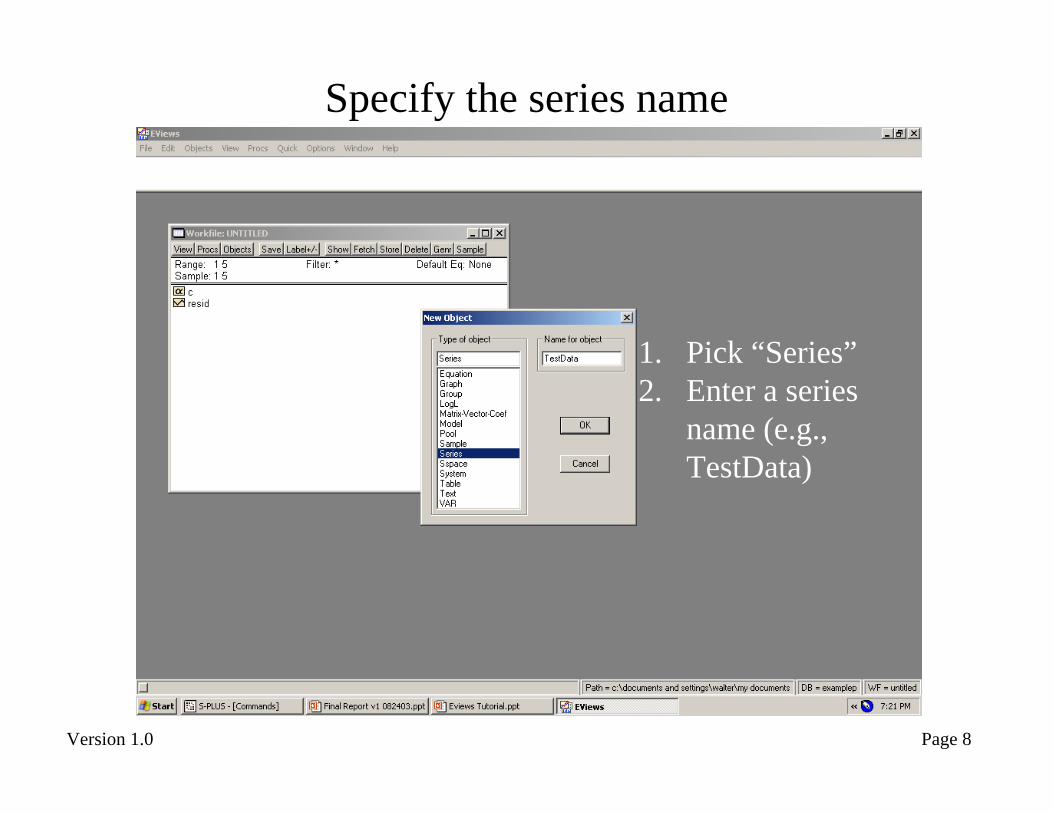
Specify the series name
1. Pick “Series”2. Enter a series
name (e.g., TestData)
Page 9Version 1.0
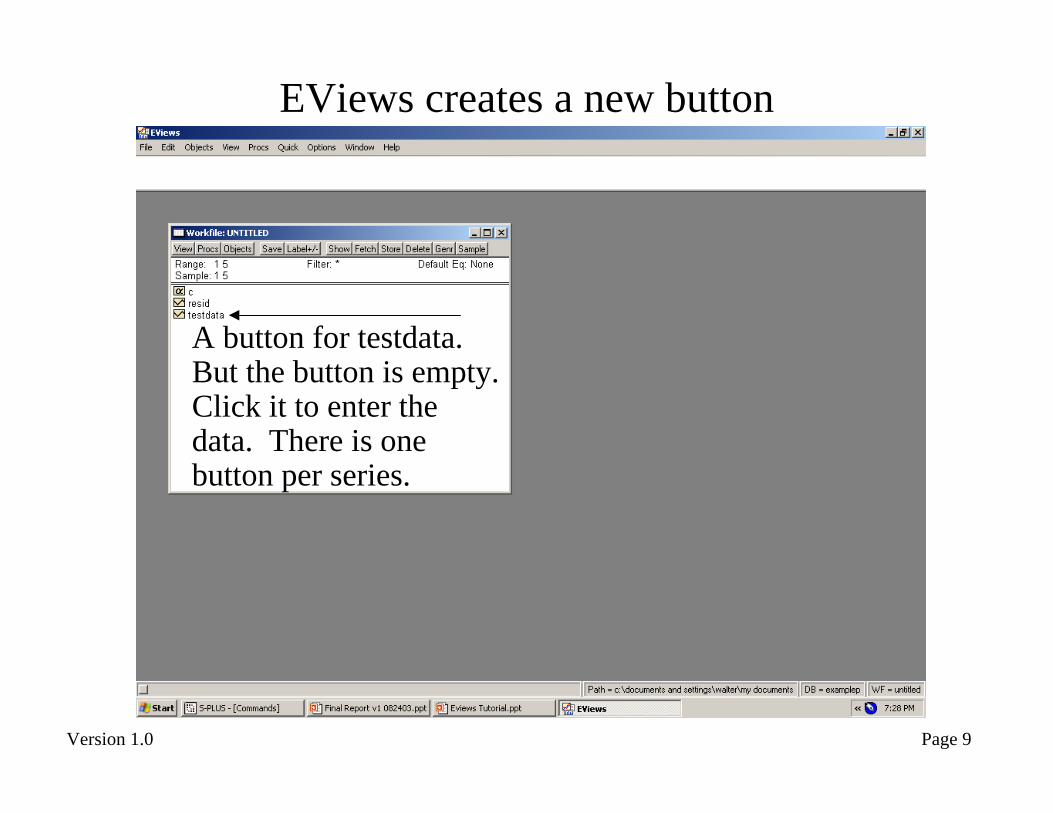
EViews creates a new button
A button for testdata. But the button is empty. Click it to enter the data. There is one button per series.
Page 10Version 1.0
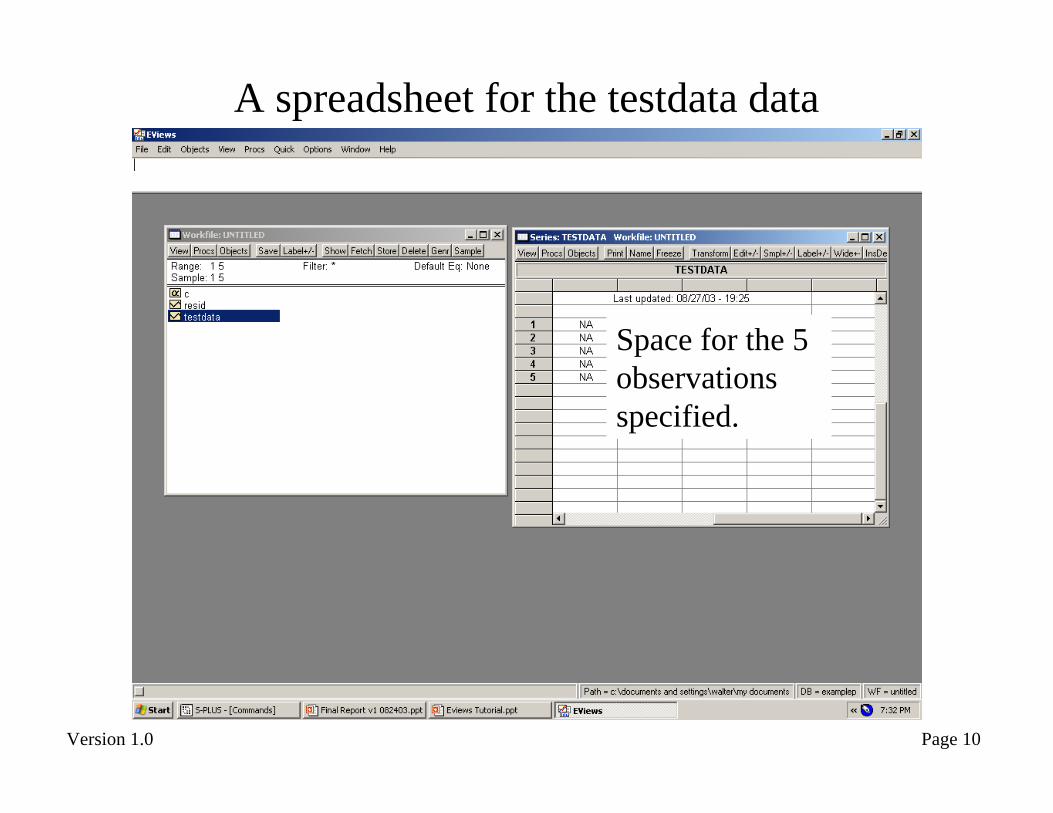
A spreadsheet for the testdata data
Space for the 5 observations specified.
Page 11Version 1.0
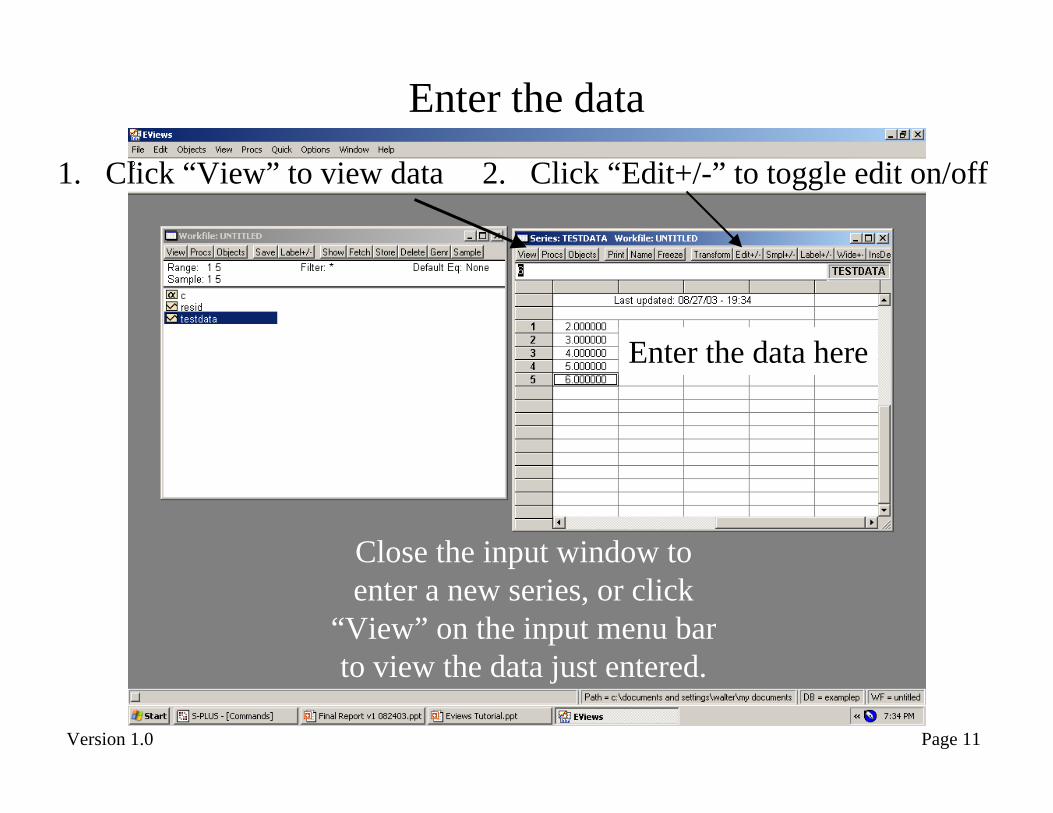
Enter the data
2. Click “Edit+/-” to toggle edit on/off
Enter the data here
Close the input window to enter a new series, or click
“View” on the input menu bar to view the data just entered.
1. Click “View” to view data
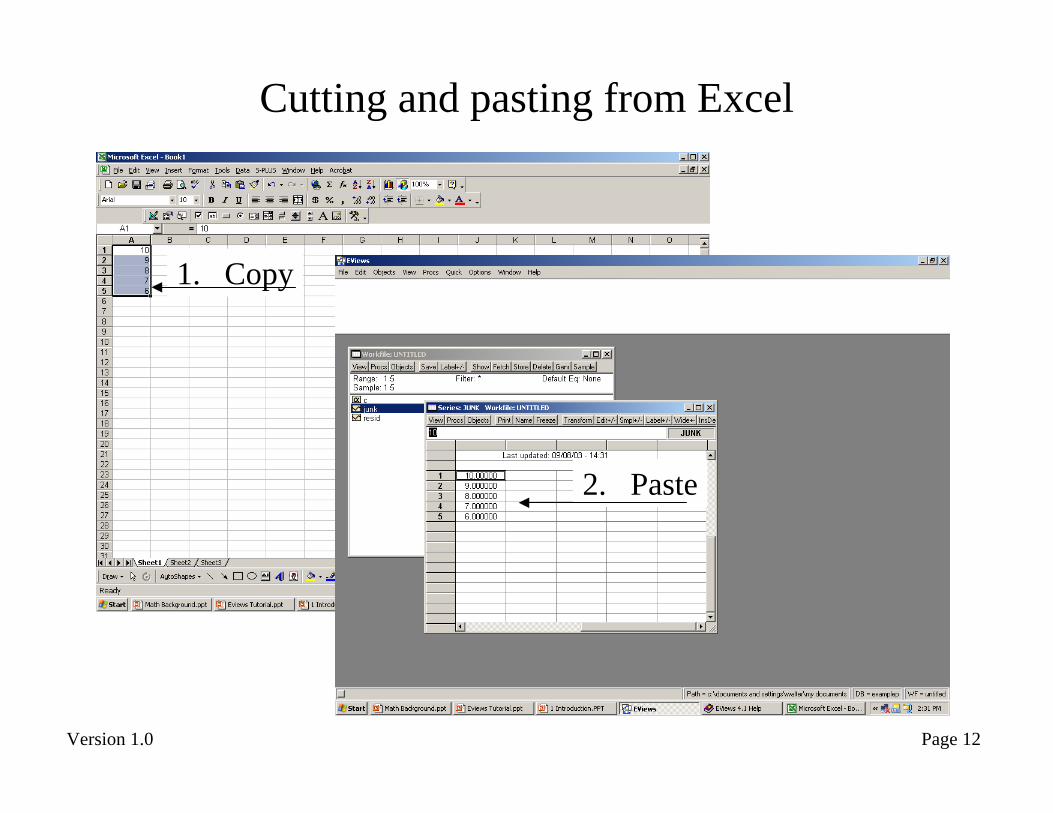
Page 12Version 1.0
Cutting and pasting from Excel
Close the input window to enter a new series, or click
“View” on the input menu bar to view the data just entered.
1. Copy
2. Paste
Page 13Version 1.0
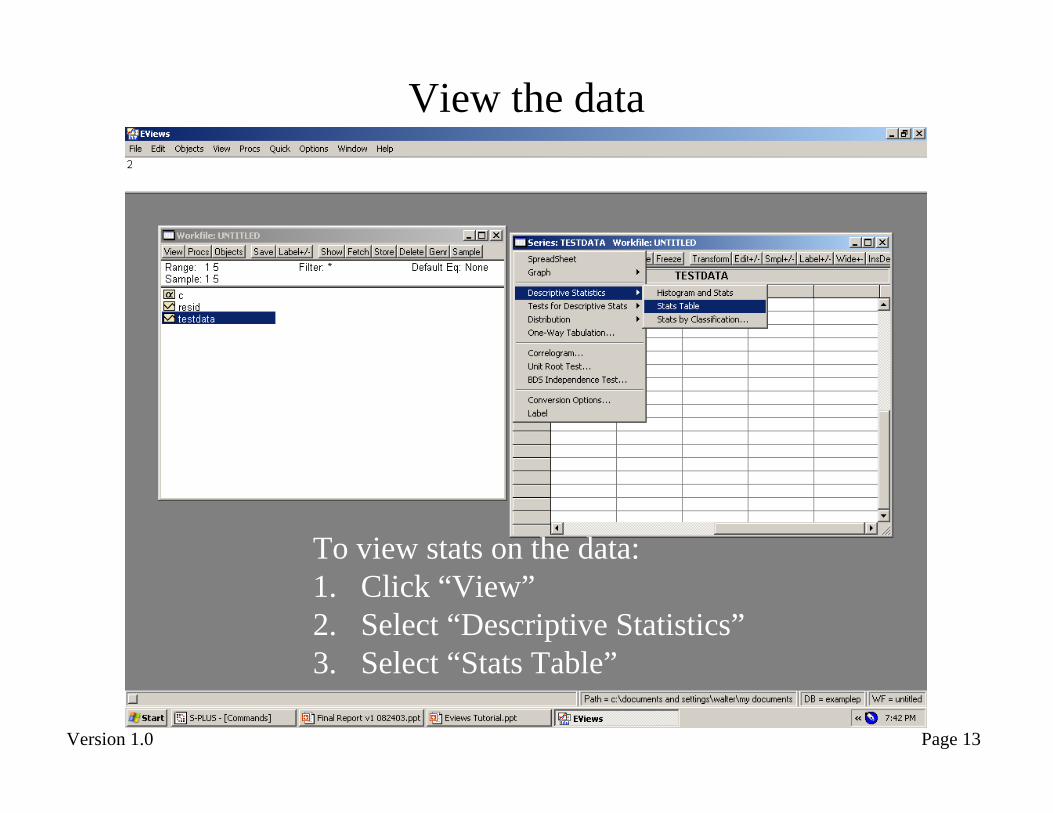
View the data
To view stats on the data:1. Click “View”2. Select “Descriptive Statistics”3. Select “Stats Table”
Page 14Version 1.0
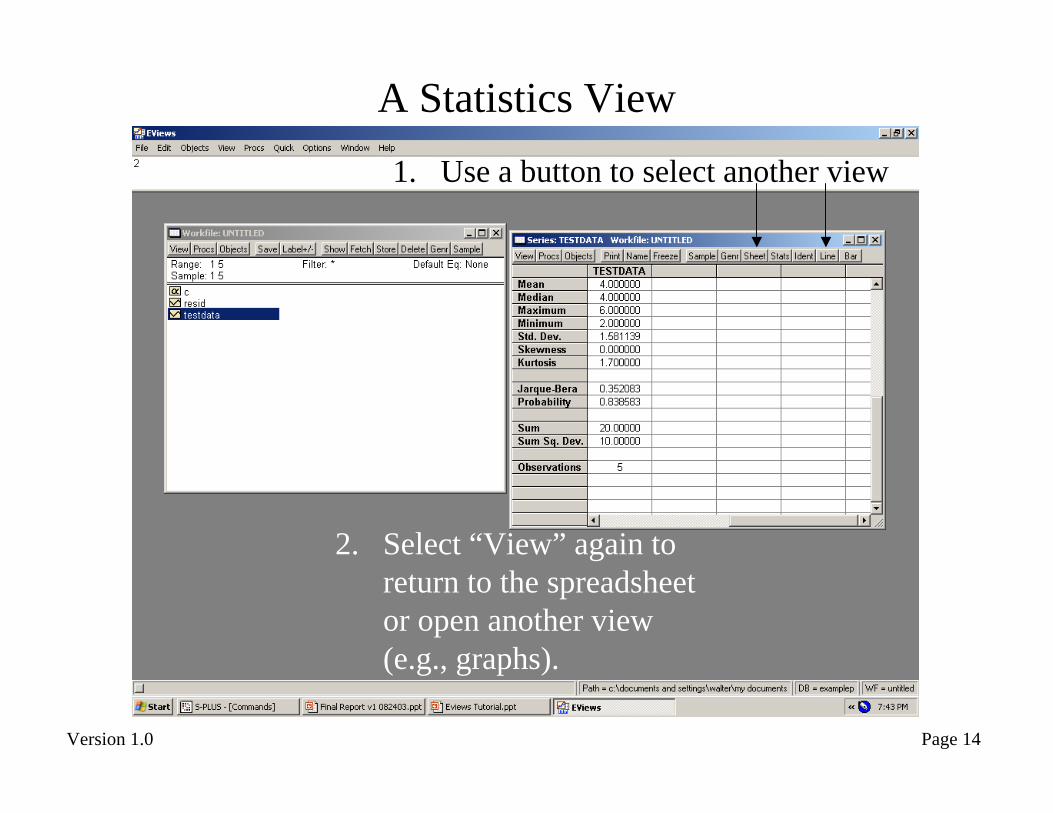
A Statistics View
2. Select “View” again to return to the spreadsheet or open another view (e.g., graphs).
1. Use a button to select another view
Page 15Version 1.0
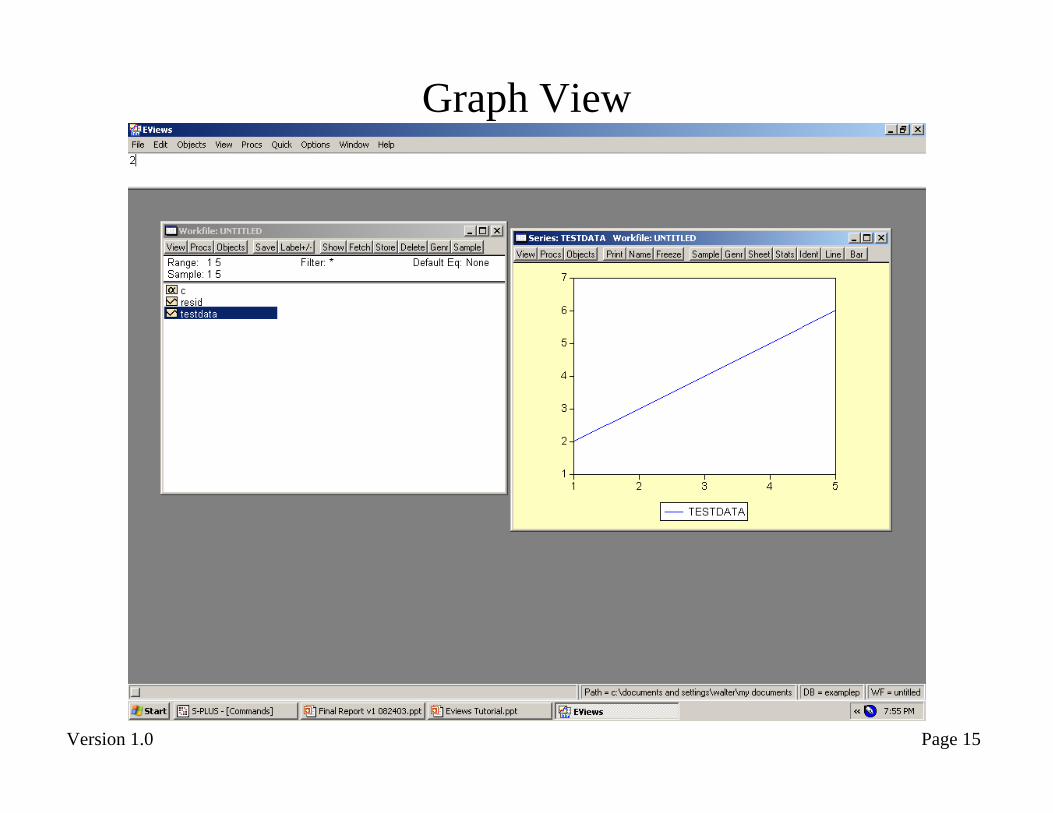
Graph View
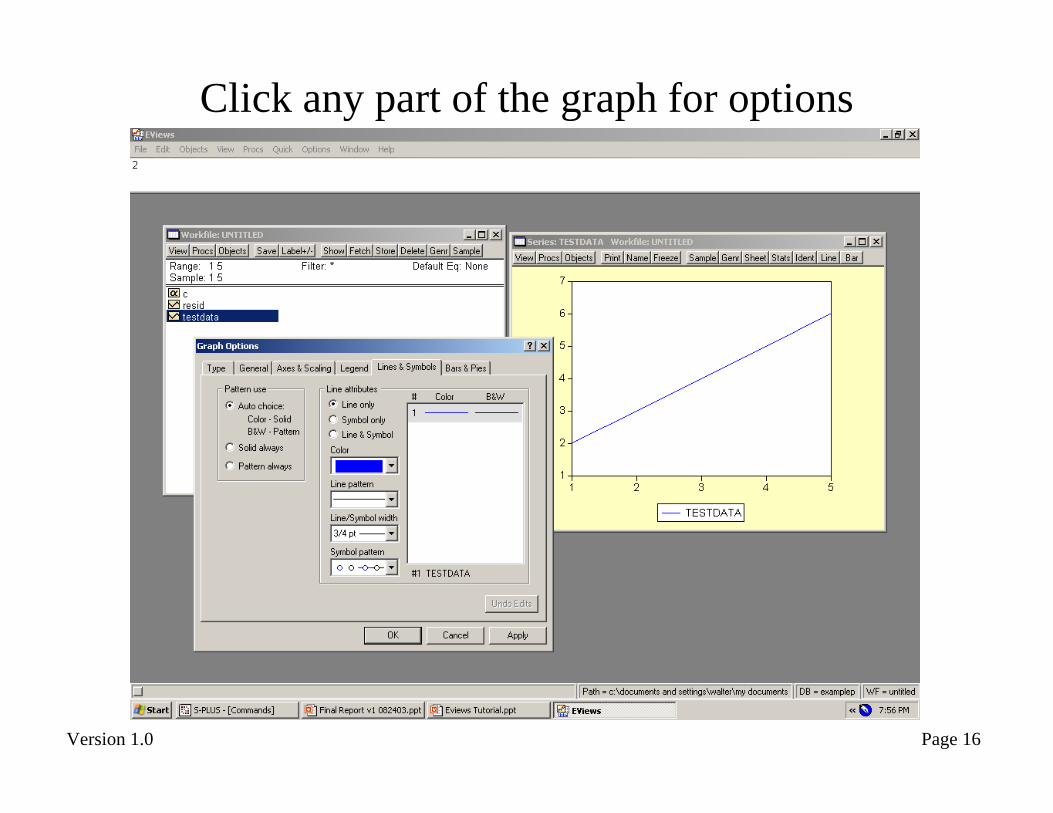
Page 16Version 1.0
Click any part of the graph for options
Page 17Version 1.0
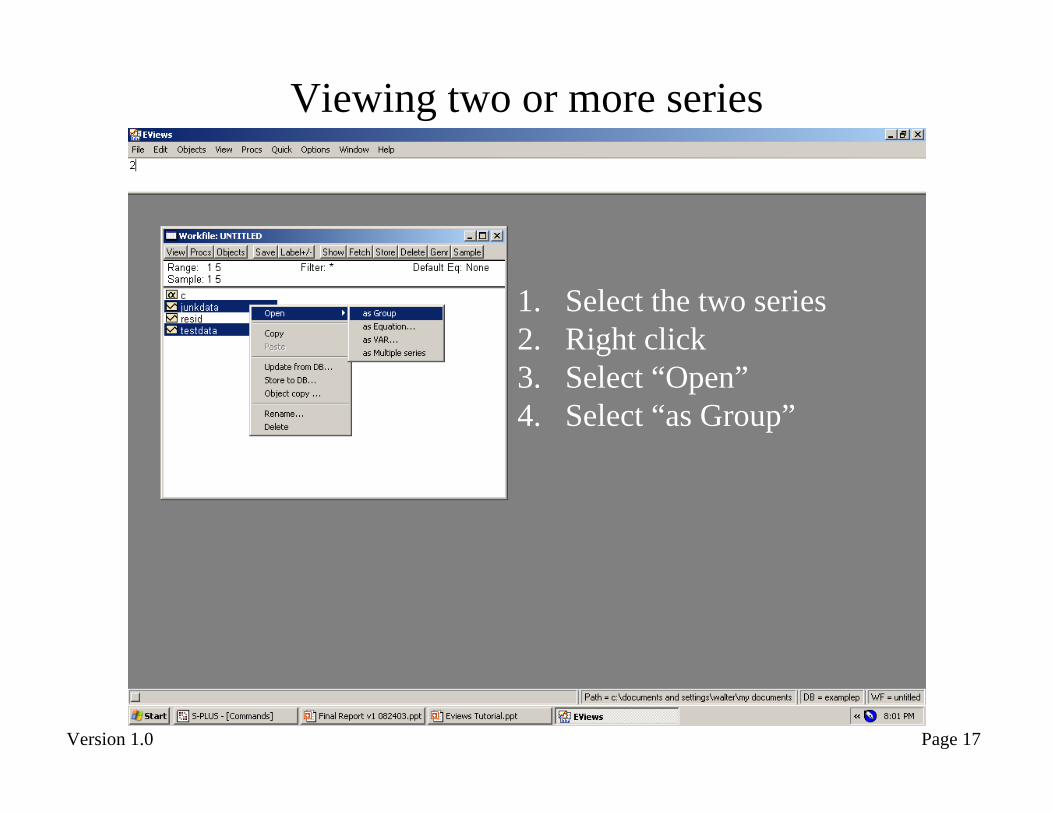
Viewing two or more series
1. Select the two series2. Right click3. Select “Open”4. Select “as Group”
Page 18Version 1.0
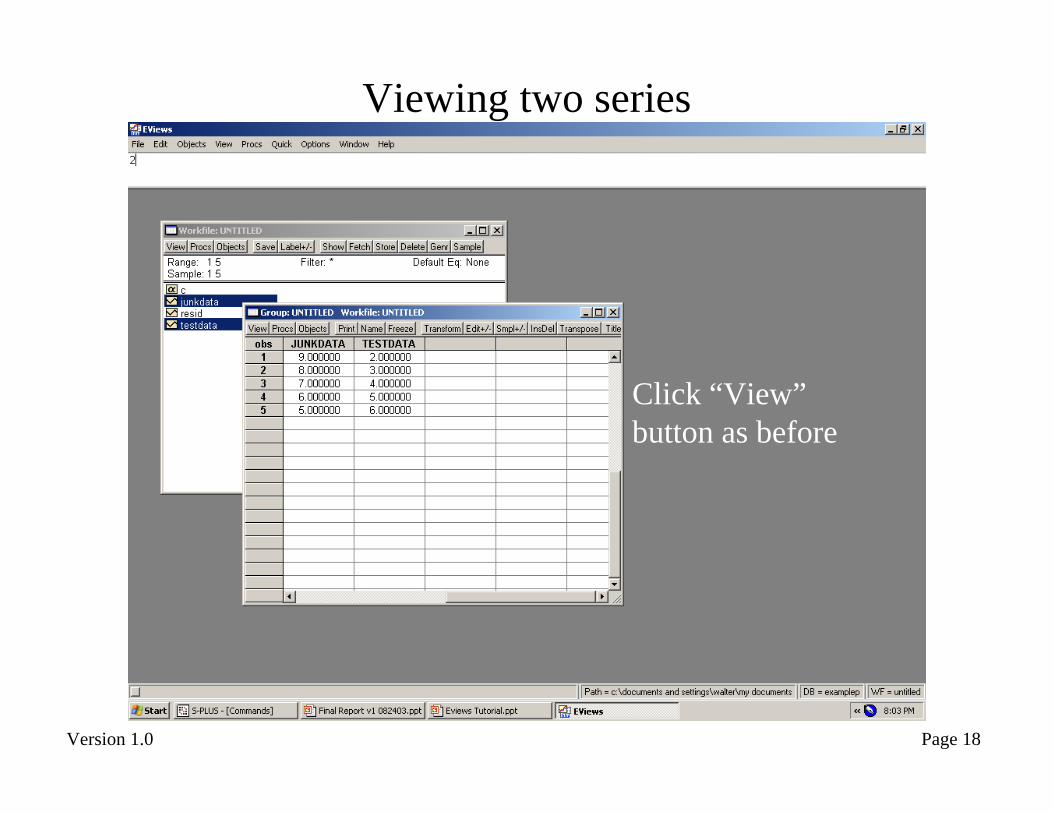
Viewing two series
Click “View” button as before
Page 19Version 1.0
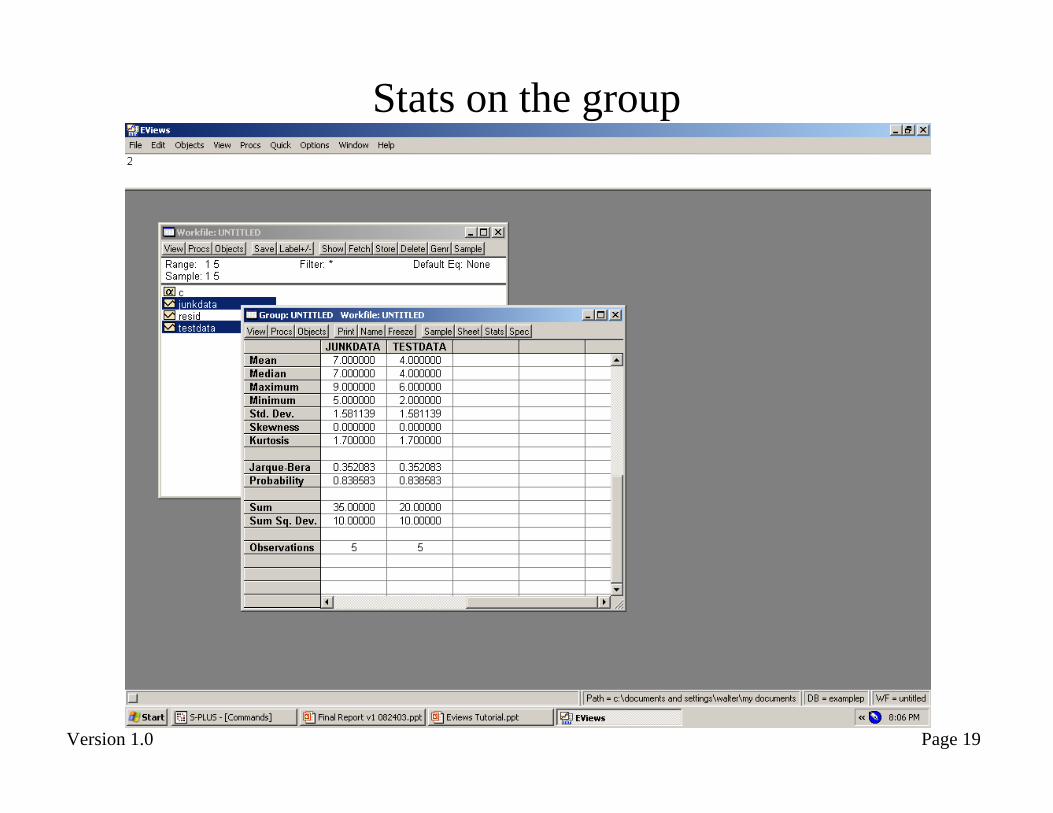
Stats on the group
Page 20Version 1.0
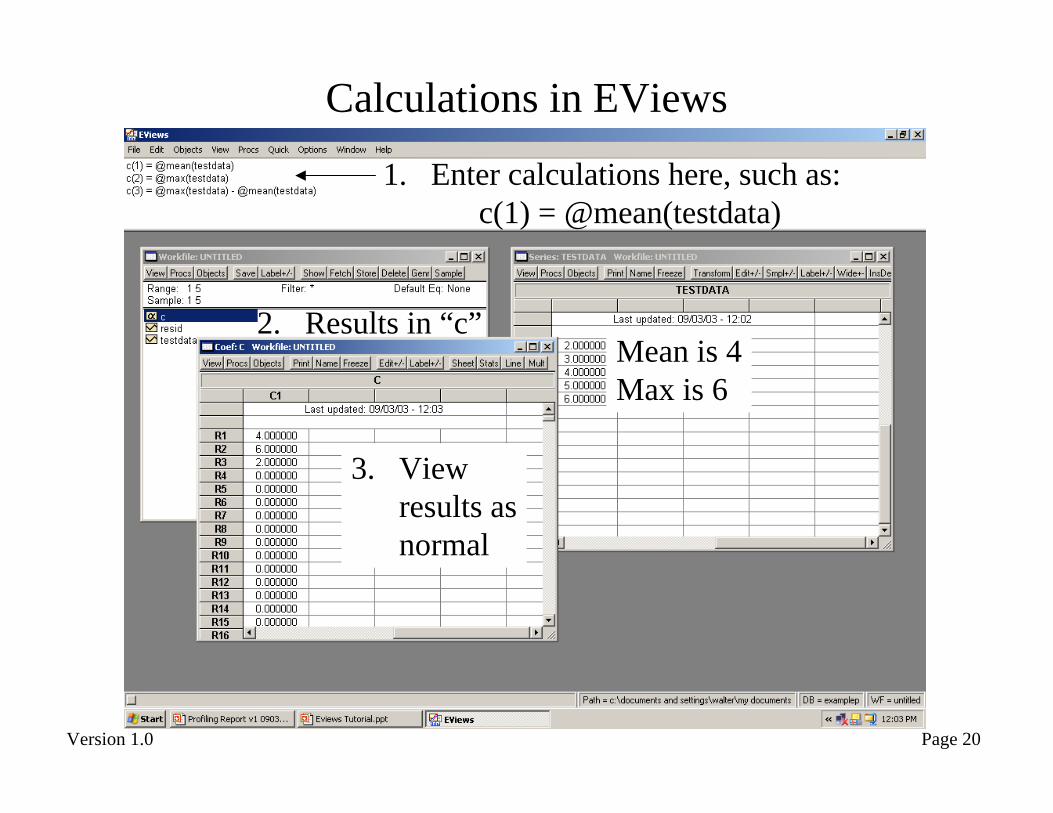
Calculations in EViews
1. Enter calculations here, such as:c(1) = @mean(testdata)
2. Results in “c”
3. View results as normal
Mean is 4Max is 6