Embed Size (px)
Citation preview
1
ECONOMETRIC BENCHMARKING AND ITS USES BY ORR:
A REVIEW
Jon Stern
CCRP, City University
1. Introduction and Scope of Paper
1
Benchmarking of efficiency against comparators is carried out by many companies to
monitor and improve their performance relative to competitors and/or similar companies.
This is a routine process for many companies, whether or not they are subject to
economic regulation - indeed, Network Rail carries out benchmarking of this type to
compare its performance on various aspects of its activities. Such benchmarking is a
standard (usually bottom-up) management tool and, in general, does not involve
econometric comparisons since it not usually multivariate. However, this standard
company benchmarking e.g. of business processes needs to be distinguished from
regulatory benchmarking which has a specific and very different purpose.
Regulatory benchmarking of efficiency in UK infrastructure industries was primarily
developed to deal with the fundamental problem for regulators of information asymmetry
- the regulated companies know much more about their costs and efficiency than does the
regulator. Hence, in a price/profit setting context, companies have strong incentives to
present information in a way that does not lead to a seriously challenging settlement.
Econometric benchmarking of efficiency and costs has developed in the UK and
elsewhere as a method which regulators use to try to obtain unbiased information with
which to address information asymmetries. However, how far it can do so in practice and
how far it can eliminate gaming is highly debatable, particularly when used over several
price reviews2.
Econometric benchmarking is clearly easier where there are multiple companies. Hence,
for ORR which is responsible for the regulation of a single nation-wide company,
econometric benchmarking requires international, preferably panel data. This
complicates issues. Nevertheless, at CP4 in 2008, ORR placed considerable weight on
the results of international econometric benchmarking of efficiency using panel data.
The results of the econometric benchmarking were extensively compared to – and, in
general, strongly supported by - the results from other (non-econometric) „bottom-up‟
benchmarking.
1 This review has benefited from conversations and/or written comments from the following people:
Eliane Algaard, Adam Cooper, John Cubbin, Godsway Cudjoe, Paul McMahon, Paul Plummer,
Michael Pollitt, Cathryn Ross, Andrew Smith, Chris Watts and Melvyn Weeks. I thank all of
them for their assistance. However, the views expressed in the paper and its recommendations are
solely my responsibility and do not necessarily reflect the views of any of the above nor of any of
the institutions with which they are connected. 2 See Shuttleworth (2005) for a sceptic‟s view. See Jamasb, Nillesen and Pollitt (2003) for a more
sympathetic view but which presents evidence of gaming within benchmarking.
2
Among outside observers, the use of econometric benchmarking by ORR in 2008 is
frequently referred to as a classic case of how it can and should be used. However,
particularly since 2008, major questions have been asked, most obviously by Network
Rail, about the use of international rather than single country data, e.g. concerning the
quality of the data and the stability of the estimated econometric models. This raises
questions as to how robust the earlier results were and, much more importantly, what
ORR should do about econometric benchmarking for CP5 in 2013 and beyond.
It is worth pointing out now that these issues are not unique to ORR. Considering single
company/large network regulation, within the UK Ofgem has been grappling with the
same issues as regards electricity transmission and gas transport networks (and, to a
lesser extent, BAA on airports and NATS). Further, the responses from the regulated
companies to the use of international benchmarking have been similarly hostile. In this
context, Ofgem has recently (July 2012) published their initial periodic review proposals
for electricity transmission and gas transport which provide useful evidence for this
paper.
The questions above also raise wider issues about the purpose and the organization of
econometric benchmarking for ORR. These issues are less often addressed than the more
technical issues above. However, I strongly argue that satisfactory answers to the more
technical questions require a clear view by ORR on the purpose of regulation – what it
wants econometric benchmarking for and why
1.1 Scope of Review Paper
The form of the paper is as follows. In Section 2, I discuss what purpose econometric
benchmarking can and should perform for ORR. In section 3, I discuss criteria for best
practice benchmarking. In Section 4, I review the 2008 ORR/ITS econometric
benchmarking exercise in the light of the earlier sections. In Section 5, I discuss Ofgem‟s
approaches to the econometric efficiency benchmarking of electricity and gas
transmission/transport networks. In Section 6, I return to issues facing ORR and discuss
international and national dataset choices and econometric method choices for CP5 and,
to a much more limited extent, for post-2013. Section 7 discusses future ORR
organizational choices for econometric benchmarking in CP5 and beyond. Section 8 of
concludes the paper with a summary of my main recommendations.
Note that the paper does not discuss non-econometric bottom-up methods of
benchmarking other than as comparators for top-down econometric methods.
This paper is based on a reading of various documents and interviews with people
working at ORR, Network Rail, ITS Leeds and Ofgem. It also draws heavily on the
recent reviews of efficiency measurement and econometric benchmark carried out by
Ofgem (the RIIO project) and by Ofwat (the FPL project and follow-up).
3
I am grateful to everyone who has assisted me with this review but the conclusions
reached and its recommendations are solely mine and do not necessarily reflect the views
of ORR or any other person or institution
2. What is the Purpose of Econometric Benchmarking for ORR?
As briefly suggested in the Introduction above, the main driver for the development of
econometric benchmarking of infrastructure industries has been as a method of
addressing the information asymmetry that regulators inevitably face.
I firstly discuss the background to economic benchmarking for regulation – why,
historically UK infrastructure regulators adopted econometric efficiency modeling; and,
secondly, discuss current and possible future reasons for ORR using it.
2.1 The Origins and Development of Econometric Benchmarking as a
Method of Tackling Information Asymmetries
The intellectual origins of UK infrastructure benchmarking derive primarily from
Shleifer‟s 1985 model of „yardstick‟ regulation3. The Shleifer model advocated the use
of objective statistical performance comparisons between comparable companies – in his
case, US the relative costs of Medicare funded hospitals. This model was taken up by
UK infrastructure regulators to address the inherent information asymmetry problems that
confronted them. In the UK, it was this perspective that led to econometric efficiency
benchmarking of electricity distribution companies and water companies4. A top-down
econometric benchmarking methodology was developed during the 1990s based on cross-
section modeling across the companies for a single time-period, with a new set of cross-
section estimates at each successive price review. Ofgem and Ofwat were the UK
pioneers for the first generation cross-section econometric benchmarking models.
This methodology was intended to provide the objective comparisons required to
implement Shleifer-like yardstick comparisons. However, even in the multi-company
context, it only managed to do so to a limited extent.
It may be argued that the practical issue was not “solving the information asymmetry
problem” but to provide an effective source of challenge to the companies‟ plans.
However, even on this criterion, it is doubtful how effective the first generation
benchmarking models were – at least after the first or second price review. That is
because firstly, companies quickly learnt how to “play the benchmarking game” (an easy
game to play with under 10-20 observations); and, secondly, the effectiveness of
benchmarking declined (and perhaps its importance was reduced) in electricity and other
3 See Shleifer, Rand Journal of Economics (1985)
4 Ofcom has commissioned econometric benchmarking studies e.g. of BT Openreach, wholesale
broadband access and other ICT services. However, for various reasons, they are only briefly
discussed in this paper.
4
network infrastructure industries as privatization and competition produced major but
declining efficiency gains.
The key problems with the first-generation benchmarking models were:
(i) The econometric models were not sufficiently reliable. They were
typically based on a very small number of observations (under 15 for
electricity distribution and each of integrated water and sewerage
companies and water only companies). In addition, they were only
reasonably well-determined for opex and, particularly in the earlier years,
tended to include different independent variables at each price round.
(ii) Regulator-built models were readily challenged by company-built (or
commissioned) models leading to serious indeterminacy. “Wars of the
models” developed in which regulators and companies, each with their
own consultants, traded econometric equations and estimates. Given the
very limited number of cross-section data points, there was little or no
chance of a clear-cut conclusion.
In consequence, the regulators‟ use of the first generation econometric models made a
useful contribution in structuring price reviews but failed to provide a clear and definitive
solution to the regulatory agencies‟ information asymmetry problems. At best, they
provided a relatively strong information basis for the regulator to reach an agreed
position on efficiency levels, costs and growth rates. At worst, they provided just another
piece of evidence to include in the discussions – but leaving the regulator with the
information asymmetry problems essentially unresolved.
The discussion above sets out the econometric benchmarking position for water and
electricity distribution in the UK until the mid-2000s. At this time, there was no formal
econometric benchmarking for any of the single network monopolies in energy or in
other infrastructure industries.
There have been major developments in efficiency analysis in recent years, leading to a
set of second-generation efficiency benchmarking econometric models. The ORR 2008
modelling was a classic example of second-generation econometric benchmarking. The
new models introduced5:
(a) The development and use of panel data sets. These provide far more
observations, even if there are only a limited number of companies. They
also allow for far more probing econometrics, including panel data
5 See Haney and Pollitt (2012) for a recent discussion of regulatory practice in electricity
transmission. This covers both the main research developments and what regulators actually do –
and why, including why regulators have been reluctant to adopt some of the more ambitious
methods. The paper„s focus on electricity transmission network benchmarking is particularly
relevant for ORR.
5
techniques that control for unobservable differences in characteristics
across companies.
(b) The development of explicit frontier-based benchmarking methods such as
DEA (data envelope analysis) and SFA (stochastic frontier analysis) as
applicable by regulatory agencies. These more sophisticated frontier
models importantly allowed much more robustness testing as well as
providing less naïve models than the first generation ones. But, this comes
at the cost of making the models much less comprehensible to non-
specialists and, in some cases, rather less robust.
(c) The development of totex data sets. This avoids the problems arising of
modeling only opex or capex and opex separately. In the UK, totex
modeling has been pioneered by Ofgem and has now been taken up by
Ofwat (and is also used by Ofcom). However, for various reasons, totex
benchmarking has so far not been popular with regulated energy or water
companies6.
The first of these developments has been particularly important in to the extension of
econometric benchmarking to single national monopolies, which inevitably requires
international panel data. ORR (working closely with ITS Leeds) was a pioneer in this,
not least in PR08, but Ofgem is now also using international data for its electricity
transmission/gas transportation regulation. However, there are always significant
definitional and measurement issues with international data sets so that the question
arises as to: whether or not they provide genuinely comparable data; or, alternatively,
whether the data problems are sufficiently severe as to throw major doubts on the
resulting econometric estimates.
ORR, with ITS Leeds, has been a leader in the development and application of all three
of the developments above. This has brought major benefits but also some problems. On
totex, rail track maintenance and renewals covers major elements of both opex and capex
but this accounts for only around two-thirds of Network Rail‟s expenditure since it
excludes some non-track related opex expenditure (e.g. some station and buildings
expenditure) and also excludes enhancement investment. In contrast, Ofgem and Ofwat
econometric benchmarking is now moving to totex modeling which includes all opex and
capex expenditure, including enhancements.
However, in spite of these important technical developments in econometric
benchmarking, it is noticeable that infrastructure regulators seem to be relying on
benchmarking a lot less as the prime solution to the information asymmetry problem than
10 years ago. Ofgem introduced „menu regulation‟ for electricity distribution companies
capex in 2004 and later extended it to gas distribution; Ofwat followed suit in 2009 with
the CIS (Capex Incentive Scheme), its version of menu regulation. In both cases, this
was in a multi-company context. However, Ofgem have made it clear that they intend to
6 Partly this seems to be a problem of coming to terms with something new. There can also be
stranded asset concerns with totex modeling e.g. if investment has strong cycles.
6
use their version of menu regulation (the IQI – Information Quality Incentive) for
electricity transmission/gas transportation in 2014. This will use menu regulation and
other information revelation methods linked in with totex benchmarking. As discussed
later in the paper, Ofwat are proposing a similar approach.
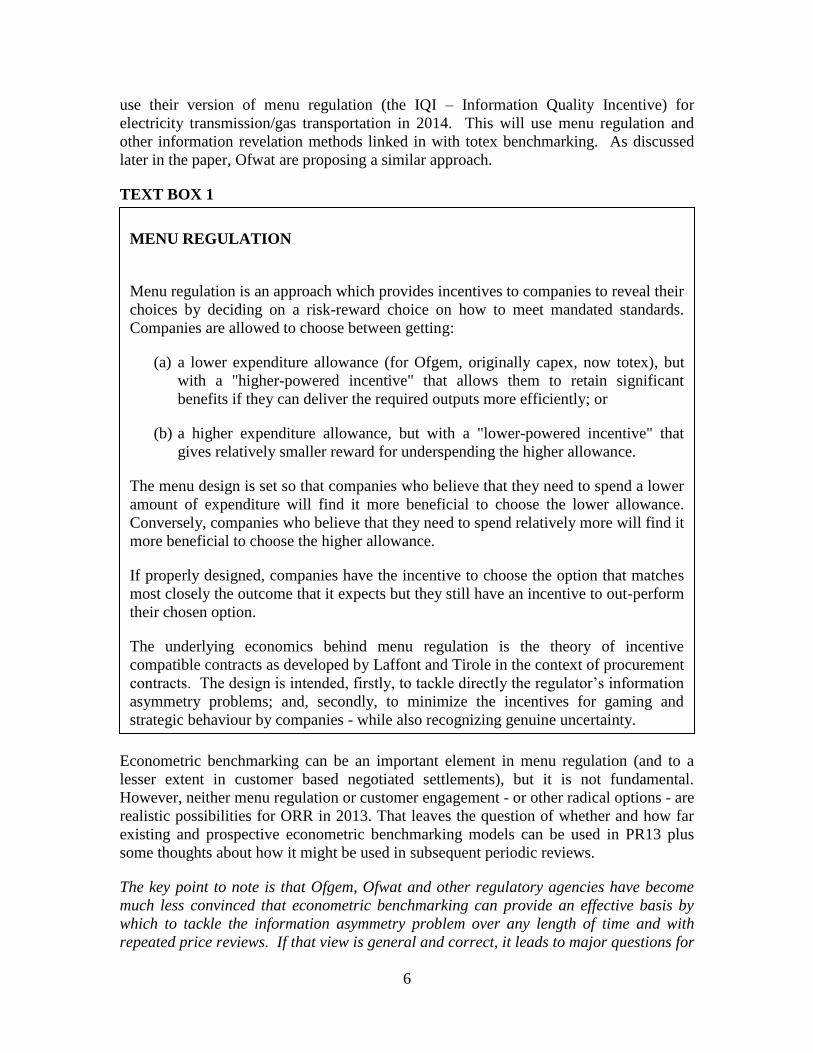
TEXT BOX 1
Econometric benchmarking can be an important element in menu regulation (and to a
lesser extent in customer based negotiated settlements), but it is not fundamental.
However, neither menu regulation or customer engagement - or other radical options - are
realistic possibilities for ORR in 2013. That leaves the question of whether and how far
existing and prospective econometric benchmarking models can be used in PR13 plus
some thoughts about how it might be used in subsequent periodic reviews.
The key point to note is that Ofgem, Ofwat and other regulatory agencies have become
much less convinced that econometric benchmarking can provide an effective basis by
which to tackle the information asymmetry problem over any length of time and with
repeated price reviews. If that view is general and correct, it leads to major questions for
MENU REGULATION
Menu regulation is an approach which provides incentives to companies to reveal their
choices by deciding on a risk-reward choice on how to meet mandated standards.
Companies are allowed to choose between getting:
(a) a lower expenditure allowance (for Ofgem, originally capex, now totex), but
with a "higher-powered incentive" that allows them to retain significant
benefits if they can deliver the required outputs more efficiently; or
(b) a higher expenditure allowance, but with a "lower-powered incentive" that
gives relatively smaller reward for underspending the higher allowance.
The menu design is set so that companies who believe that they need to spend a lower
amount of expenditure will find it more beneficial to choose the lower allowance.
Conversely, companies who believe that they need to spend relatively more will find it
more beneficial to choose the higher allowance.
If properly designed, companies have the incentive to choose the option that matches
most closely the outcome that it expects but they still have an incentive to out-perform
their chosen option.
The underlying economics behind menu regulation is the theory of incentive
compatible contracts as developed by Laffont and Tirole in the context of procurement
contracts. The design is intended, firstly, to tackle directly the regulator‟s information
asymmetry problems; and, secondly, to minimize the incentives for gaming and
strategic behaviour by companies - while also recognizing genuine uncertainty.
7
ORR as to the purpose of econometric benchmarking within the regulatory process.
Menu regulation and similar methods clearly benefit from having econometric
benchmarking methods involved, but the role played by econometric benchmarking per se
in assessing efficiency and setting price limits is rather lower implying a smaller rather
than a larger degree of reliance being placed on it when setting price limits7 8.
2.2 Possible Purposes of Econometric Benchmarking for ORR for
PR13/CP5 and Beyond
The general reason for econometric benchmarking may be to tackle the information
asymmetry between regulator and regulated company. However, to establish the current
and future purpose of regulation for ORR for CP5 and subsequent control periods, we
need one or more specific reasons.
(Note that I refer interchangeably in this paper to price review dates and the control
periods to which they refer - e.g. PR13 and CP5 – and similarly to PR08/CP4 and
PR19/CP6.)
This specific reason for econometric benchmarking is not a topic that has been much
discussed explicitly in the external literature. However, John Cubbin in his 2011 CERRE
presentation as discussant of ORR regulation provides a good starting point. Cubbin asks
“How are the results [of econometric benchmarking] to be used? How do they fit into the
regulatory process?” He suggests three alternative answers. These are listed below, with
Cubbin‟s version in italics followed by my interpretation of them.
(i) Numbers simply plugged into price control - Automatic application of
econometric estimates to set the answer for the final price determination.
(ii) Dialogue and challenge supported by other data – Top-down econometric
benchmarking estimates9 used as main reference point in negotiations with
regulated company, but with corroboration/support from other sources
(primarily from bottom-up engineering/management process
benchmarking.
(iii) Part of constructive dialogue with management - Top-down econometric
benchmarking estimates used as one input among many in negotiations
with regulated company, but not in any privileged way.
The requirements for the benchmarking estimates are different for each of these options.
In general, the more dependent is the regulator on the answers for setting the numbers in
7 See CEPA Report for Ofwat, July 2012 where a menu regulation approach is recommended in
which totex benchmarking is recommended for setting the menu baseline. 8 Ofgem and Ofwat have a longer history of price setting and regulation and so have had longer to
consider these issues than ORR, where PR08 was the first “normal” price review after the crisis
and cost explosion induced by Hatfield crash of 2000. 9 Econometric benchmarking is always top-down – even if disaggregated regionally or similar.
8
the final determination, the more confidence is needed in the econometric results –
particularly as regards robustness and margins of error.
My personal opinion is that the relative degrees of accuracy required for each of the
regulatory determination options listed above are likely to of the orders of magnitude
suggested below:
For option (i), the regulator needs an extremely high level of accuracy (e.g. a
range of less than +/-2.5%) as well as considerable robustness and corroboration.
For option (ii), the regulator needs robust and corroborated benchmarking but
there is no need for great accuracy - “around 35%” e.g. with a range of around +/-
5% or so is likely to quite sufficient to provide the basis for a challenge-based
negotiation.
For option (iii), we need reasonably stable and robust benchmark estimates – but
rather less than for option (ii). Stability of estimates is the most important.
In practice, the only example that I know of a regulator adopting an option (i) approach is
Netherlands electricity distribution, where it was roundly and swiftly rejected by the
courts on appeal. It is not practicable as it asks more of the econometrics than it can
reasonably deliver. That leaves the choice between options (ii) and (iii) – or somewhere
in between.
Note that ORR‟s approach for CP4 in 2008 is a good example of an option (ii) approach.
However, while regulators prefer an option (ii) approach, regulated infrastructure
companies consistently try and prevent this in favour of an option (iii) approach. Given
that the choice of approach for ORR in 2013 is between option (ii) and option (iii), the
key question is whether and how far any econometric benchmarking is likely to be robust
enough to support the tougher “challenge” approach of 2008 or only something rather
weaker.
Network Rail clearly prefers an option (iii) approach both in principle and for PR13.
That is because they – like regulated energy and water companies – much prefer the
“Let‟s throw everything into the pot” negotiation approach. In this, Network Rail is
following other regulated network companies where econometric benchmarking plays a
moderate or sizeable role.
Regulated network companies typically argue for an option (iii) approach because of
concerns about the quality of data and the robustness of the econometrics, but also
because this approach strengthens the company‟s position vis-a-vis the regulator. This
arises because reductions in the power of econometric benchmarking as a regulatory
device increase the regulated company‟s inherent information asymmetry advantages. In
9
addition, less clear and/or firm benchmarking estimates also increases the space and
scope for trade-offs between the regulated company and the regulator10
.
Recent and past stakeholder comments on draft regulatory proposals for energy and water
demonstrate how regulated companies consistently try to push the regulatory process
towards an option (iii) approach. Hence, it is not surprising that the energy companies
have argued against international benchmarking on similar grounds to Network Rail.
Indeed, there is a clear incentive for regulated companies to try and demonstrate
weaknesses and non-robustness in econometric benchmarking results – and for regulators
to try to demonstrate the opposite.
As a result, although the purpose of econometric benchmarking for the regulator may be
to eliminate as much as possible of the information asymmetry, the companies have a
powerful incentive to prevent that. Given the limited reliability of any econometric
benchmarking estimates, the companies typically win so that an option (iii) “Let‟s throw
everything into the pot” negotiation is the norm in periodic price reviews while an option
(ii) “Challenge” approach is much less frequently observed.
The arguments above illustrate a major reason why regulators have increasingly explored
information revelation methods such as menu choice (and customer based negotiated
settlements) relative to heavy reliance on econometric benchmarking. The alternatives
provide a way in which regulators can address the information asymmetry issue – but
without the negotiation problems from the regulated companies being in a privileged
information position. Econometric benchmarking may have a role in these alternatives;
but, if so, it is a subsidiary role e.g. in helping construct menu baselines or in providing a
check on business plans or menu submissions.
Interestingly, menu regulation does not seem to generate the opposition from companies
that arises from aggressive or challenging use of econometric benchmarking. That seems
primarily due to the fact that it is choices by the companies rather than decisions by the
regulator that determine the regulatory outcome - the choices may be heavily constrained
but they are the companies‟ choices. However, it may also be, at least in part, because
the degree of reliability of benchmarking estimates required to support these alternatives
is rather more similar to the option (iii) „all-in negotiation‟ approach than to the option
(ii) challenge approach.
In conclusion, when considering how best to develop its econometric benchmarking, ORR
needs first to consider the purpose for which it is needed. That includes which type of
regulation framework it is intended to support as well as how feasible is the framework
given both the likely quality of the estimates and the views and responses of Network Rail
and other players.
10
Regulator/company trade-offs need not be outlawed – but, particularly if based on discussions
around information ambiguities, they can inhibit clear regulatory governance and foster regulatory
collusion if not regulatory capture.
10
3. Criteria for Efficiency Benchmarking of Networks by Regulators
The best recent study of this issue is by Haney and Pollitt (2009). They constructed a set
of 8 indicators which they used to construct an efficiency benchmarking performance
index. They applied this method to a sample of 40 energy regulators responsible for such
regulation. The survey, mainly of OECD and middle income countries, covered both
electricity and gas and both distribution and transmission/transport11
.
The 8 indicators used by Haney and Pollitt12
were 1/0 indicators on the following13
:
They were added together to give a total score for each energy industry and country.
1) Current or prospective use of any formal benchmarking method (e.g. DEA,
COLS14
, SFA or other);
2) Use of more than one of the above benchmarking methods;
3) Totex modeling;
4) Use of panel data;
5) Use of uncertainty testing (e.g. tests for well-behaved functional forms);
6) Incorporation of environmental factors (e.g. weather, age of assets,
customer density)
7) Large data set – either at least 30 companies in data set or, if not use of
international data set
8) Mixture of analysis by regulator staff and external analysts
According to this ranking, none of the 40 countries surveyed in late 2008 scored a
maximum of 8. Austria scored 7 for both electricity and gas, Finland scored 6 in
electricity, Belgium scored 5.5 in electricity and 5 in gas – while Britain scored 4.5 in
each of electricity and gas (presumably for the 2006-7 reviews). Interestingly, both
Austria and Belgium had higher scores for electricity and gas transmission/transport than
for distribution and Netherlands had a 6 for electricity transmission but a Zero for
everything else. For Britain, distribution scored 6 for both electricity and gas with 3‟s for
electricity and gas transmission/transport15
.
11 Frontier Economics in its May 2010 report on benchmarking methods for Ofgem suggested
various general criteria for the choice of method (e.g. robustness, transparency, etc). These are
both general and require subjective judgments and so are unsuited to this context. 12
See Haney and Pollitt (2009), p.29. 13
For the first and last indicators, a partial score of 0.5 was a scoring option 14
COLS stands for Corrected Ordinary Least Squares. This is standard OLS regression but with the
regression line shifted towards the best performing company as a “quasi-frontier”. 15
See Haney and Pollitt (2009), pp. 31-32 and Appendix
11
My rough-and-ready look at the most recent UK infrastructure regulator econometric
benchmarking exercises suggests a score approaching 8 for the ongoing 2012-3 Ofgem
transmission/transport pricing review but only about 4 for the Ofwat 2009 price review.
However, the 2008 ORR econometric benchmarking would, on my reckoning, have
scored 7 or perhaps 7.5, dropping a half-point on incorporation of environmental factors
and perhaps a half-point for covering only around two-thirds of total expenditure, but
otherwise scoring solid 1‟s throughout.
Of course, the Haney-Pollitt index is only a measure of process and doesn‟t address the
quality of regulatory decisions. Although good regulatory decisions need well-founded
regulatory processes, there is no guarantee that good benchmarking processes necessarily
lead to good regulatory decisions – even if bad benchmarking processes almost always
contribute significantly to poor decisions16
.
4. PR08: ORR/ITS Benchmarking and Its Quality
Although many questions have arisen since 2008, it seems clear to me that, in the light of
the information available at the time, the econometric benchmarking undertaken for the
railway price review in 2008 was very successful both as a piece of benchmarking and in
its overall contribution to the CP4 review settlement.
Inevitably, the CP4 econometric benchmarking was based on data that was not current –
it was based on the 2006 LICB data set. Hindsight, in terms of more recent data and
subsequent modeling, may raise questions over whether the estimates were as well-
founded as was thought at the time; but, regulatory decisions are not taken in (or with)
hindsight. Hence, given the information available at the time, it seems to me that the
2008 econometric benchmarking played a significant role in the success of the review in
achieving a regulatory settlement that was acceptable to all parties17
.
The key points to make about why it was a success are:
(i) The econometric benchmarking using the LICB data set (for the period to
2006) provided what appeared to be sensible and robust estimates. The
ORR/ITS estimates were reviewed by LECG and Horton 4 in evidence
16
Unlike for developing countries, there is very little extant appraisal of the quality of regulatory
decisions and how this relates to regulatory characteristics and processes in OECD countries.
However, Section 4 of Green, Lorenzoni, Perez and Pollitt (2006) has a useful electricity-related
perspective. 17
ORR commissioned a review by Oxera of the PR08 international econometric benchmarking and
theme, which was published in November 2009. The role of the international benchmarking
studies in the overall PR08 process was discussed in the Nelson review, published in August 2009.
I have read both documents. The views that I express in this section are broadly consistent with
those in these documents but they are my views, based on a reading of the main pre-and post 2008
documents plus conversations with several of the participants.
12
submitted as rebuttal by Network Rail but those criticisms were reviewed
at the time and rejected;18
;
(ii) The results of the econometric analysis were strongly backed up by results
from a range of different types of „bottom-up‟ analyses (management,
engineering, etc);
(iii) The results provided the basis for discussions which resulted in an agreed
21% increase in Network Rail‟s operating maintenance and renewals
efficiency during CP4.
Comparing it with the Haney-Pollitt criteria, the 2008 modelling
Used more than one econometric benchmarking method and the results were
comparable across methods;
Involved a combination of Capex (renewals) and Opex (maintenance);
Employed both panel data and an international data set
Was based on relatively careful exploration and checking of LICB data set.
Tested for functional forms. (As always more could have been done on this but,
given diminishing returns, it is unclear how much – if any - difference it would
have made.)
Involved both internal modeling and the use of expert outsiders
Provided strong corroboration via a series of bottom-up engineering and
management consultancy studies19
.
In terms of decision making, Network Rail have not challenged the 21% target reached
with the aid of this analysis whatever reservations they may have had either in 2008 or,
on the basis of more recent data, about the CP4 econometric analysis. That confirms to
me that - whatever its weaknesses in hindsight (e.g. as regards data issues) - the 2008
ORR/ITS econometric benchmarking did what it was hoped (and intended) to do in terms
of the CP4 decisions and decision-making process20
.
18
See Pollitt Peer Review (2008). Some of the issues raised in the LECG and Horton 4 critiques
(e.g. on data) have since re-emerged in discussions between Network Rail and ORR – but
primarily around estimates based on post-2006 LICB data. 19
I have not reviewed these bottom-up studies and there may well be quality variations between
them, but it seems clear that, overall, these studies corroborated the econometric benchmarking
results. 20
I note that reviews of the work technically have been favourable, and it may well be that the
weaknesses were primarily with the data.
13
Of course, there were weaknesses – econometric benchmarking of efficiency varies from
the slightly inadequate to the seriously imperfect – and it is always the case that more
work could have been done. The main imperfections that I observe with the 2008
benchmarking are listed below. Note that I deliberately omit from this list data and other
issues that have only become more clearly apparent since 2008 as they do not affect the
quality of what was done in 2008 other than in hindsight. The issues that only emerged
clearly after 2008 are discussed in the next section which looks ahead to CP5.
The main weaknesses in the 2008 approach – the ones that are clear without hindsight -
include those listed below. I would like to make it clear that these issues seem to me to
be relatively minor rather than fundamental. To a considerable extent, the comments
reflect the fact that users of international panel data can only operate with the data-set
that they have available and cannot include other countries or variables that they would
like to have - or measure the data in other ways. In particular, the data and its definitions
may have some problems in absolute terms but, in practical and relative terms, there is
frequently no obvious superior alternative.
Taking these considerations into account, I list the main (non-hindsight) concerns with
the PR08 exercise below.
The LICB data set was good and intended for benchmarking between rail
companies but it was not designed or intended for regulatory econometric
benchmarking and particularly not for use in price setting by agencies like ORR
As with all such international panel data sets, this inevitably leads to a number of
problems such as the following:
o The comparator countries were those that happened to be in the
data set rather than a chosen set of the most appropriate for ORR
purposes. There is no question that they represented a reasonable
set of rail companies but, as in all such exercises, they were
probably not the ideal set.
o Omitted variable issues – these include both “known unknowns”
and “unknown unknowns”. It is again the case that the
benchmarking estimates rely heavily on the range and quality of
the data that the researcher happens to have available.21
o A non-ideal set of variables whose measurement may cause
problems (e.g. on definition of capital costs)
Benchmarking models vary from those based heavily on high-level micro-
economic theoretic cost function based models to those based on data exploration
with little or no structure imposed. The 2008 ORR/ITS econometric modeling for
PR08, like most such practically oriented exercises, took a middle way taking
information from the engineering and related literature that costs would be some
function of network size, usage by different types of traffic, technology, extent of
21
Omitted variable problems are always worrying as they can lead to biased estimates of all
coefficient estimates. In practice, panel data fixed effects models can often effectively correct for
omitted variable issues e.g. for national idiosyncrasies such as geography, climate, etc. See for
instance, Cubbin and Stern (2006).
14
single/multiple track, switch density, station density and other variables. This
resulted in an econometric specification which was in part limited by the variables
present in the data set and also by trade-offs between parsimony and having a
fuller specification.
The econometric approach adopted for PR08 is the one usually adopted for
regulatory benchmarking because it avoids the major risks (a) of imposing an
over-rigid structural specification and (b) the risks from pure data search without
any structure. However, the sensible intermediate choice does inevitably limit the
degree to which the variables included in the equation can be considered as those
that could be derived from a formal micro-economic cost function – or tested
against it. This raises questions like the following:
o Is maintenance and renewals expenditure a good proxy for a cost
function? Probably – but it is not automatically obvious that there
was a better alternative. (This issue mainly reflects the definition
of capital costs, but there is no obvious superior alternative to
capex as has been recognized by other infrastructure regulators22
.)
o If the models tested are intended to be cost functions, then network
(and rolling stock) quality issues arise which were not included in
the model23
.
(Note that, once one has controlled for age of assets, network
quality issues are much more important for rail than for energy and
water - and also more difficult to address satisfactorily.)
More could have been done on robustness checks and reporting failed
approaches24
- but more can always be done. The background working papers
published by ORR and ITS also provided more information on what was tested
and why and why things were rejected. However, given diminishing returns, it is
again far from clear that it would have made any significant difference to the
parameter estimates or the margins of error25
.
These concerns are not trivial but nor are they serious errors either of omission or
commission. It seems to me unlikely that their impact would have been sufficient to
change at all significantly the estimates made in 2008 using the 2006 LICB data set. Not
only were the results of that exercise generally supported by extensive sensitivity testing,
but the key 35% estimate of the NR efficiency gap was also corroborated by the bottom-
up studies. Judging without hindsight, in my view, the 2008 railway benchmarking still
22
The question as to whether capital inputs should be included (a) via capital expenditure (some
measure of investment); or (b) by some measure of capital-use is a difficult and much debated one.
After long consideration both Ofgem and Ofcom have used capex, not least because it is much
easier to measure. 23
I recognize that the PR08 benchmarking included a steady-state adjustment for Network Rail. 24
See 2010 Oxera evaluation and Cubbin (2011). 25
There are sharply diminishing returns to running more equations even for sensitivity purposes.
Indeed, this can rapidly become the equivalent of (hopefully) unconscious data-mining. (See
Section 6 for more on this in the rail benchmarking context.)
15
looks as good as or better than any other UK infrastructure econometric regulatory
benchmarking exercise carried out before 2010.26
If there was a problem with the 2008 econometric railway benchmarking, it seems to me
to relate to “regulatory governance”. It is rather less clear than it should have been
whether the published results were the responsibility (a) of ORR or (b) of ITS or (c) of
ORR and ITS jointly. I think it important, if a regulator publishes efficiency
benchmarking results, that they are clearly the property and responsibility of that
regulatory agency and not of any other party – and generally perceived as such.
I return to this issue in Section 7 where I discuss the regulatory governance issues for
CP5 and beyond.
5. Ofgem Econometric Benchmarking of Electricity Transmission and Gas
Transport
Ofgem have been leaders in developing benchmarking methods and their use among UK
infrastructure regulators. They were the first to use frontier methods, they were the first
to introduce totex (total expenditure benchmarking) and they were the first to develop
menu regulation. They have also developed a long (and productive) relationship with
Cambridge University and other academic economists as well as with various economic
consultancies.
Excluding telecoms, ORR was the first of the UK infrastructure regulators to use
international benchmarking, particularly for single area/company networks and in the use
of SFA-frontier modeling. However, Ofgem have, in recent years, developed
international benchmarking – and menu regulation – for electricity transmission and gas
transport networks. Hence, it is worth surveying Ofgem practice in this area before
making recommendations about the future of econometric efficiency benchmarking for
ORR.
In what follows, I deal firstly with the organization and purpose of econometric
benchmarking within Ofgem and then, secondly, discuss international econometric
benchmarking data and methodological issues.
The discussion below reflects my reading of Ofgem papers on cost assessment in the
ongoing price review for the electricity transmission and gas transport networks,
including some background papers to the July 2012 Initial Proposals27
. I have also had
26
Questions about the robustness of the econometric results in PR08 only became significant in
2009-10 when 2008 and subsequent data became available – but for a reduced set of countries. 27
The Initial Proposals can be downloaded from
http://www.ofgem.gov.uk/Networks/Trans/PriceControls/RIIO-
T1/ConRes/Documents1/RIIO%20T1%20Initial%20Proposals%20for%20NGGT%20and%20NGET%20O
verview%202707212.pdf and a March 2011 paper on cost assessment methods can be downloaded from
http://www.ofgem.gov.uk/Networks/Trans/PriceControls/RIIO-
T1/ConRes/Documents1/T1decisioncosts.pdf
16
the opportunity to discuss these issues with Ofgem senior and specialist staff members
working on the transmission reviews and Ofgem‟s cost assessment and econometric
benchmarking. What follows includes my interpretation of those conversations28
.
It should be noted that the officials involved in the Ofgem econometric benchmarking
with whom I have been in contact were keen to learn about ORR experience and also to
develop ongoing discussions with those involved in ORR benchmarking.
5.1 The Organization and Purpose of Ofgem Econometric Benchmarking
5.1.1 The Organization of Econometric Benchmarking in Ofgem
The most obvious feature to me is that Ofgem does most of its econometric
benchmarking in-house.
Cambridge University academics and other UK, US and other economists have been used
to provide specialist advice and assistance e.g. on international data, on specific
econometric issues that have arisen, and on more experimental methods – plus peer
reviewing. However, the core econometric estimation was done in-house by Ofgem staff.
This is in contrast with ORR, where ITS Leeds, at least until 2009, operated much more
as insiders than their Ofgem equivalents. Since 2009, ITS has continued to be ORR‟s
main econometric benchmarking advisers, operating under tendered contract (with the
exception of secondment input from Andrew Smith and Phil Wheat) 29
.
There is nothing inherently wrong with long-standing relationships of the ORR-ITS type.
Longer duration relationships build up familiarity and good knowledge of the issues on
both sides, but this can lead to issues being seen through one perspective rather than via
different ones, even with peer reviewing. In addition, the longer such relationships
continue, the greater the potential risks of the outsider becoming a quasi-insider (or at
least being perceived as an insider) and the harder it can become for potential new
entrants. The problem is essentially the same as that with the tenure of non-executive
directors, auditors and similar. For these reasons, Ofgem and some other regulators have
deliberately opted for more diversity in their choice of benchmarking support teams than
ORR has done to date.
The two organizational models have advantages and disadvantages. The ORR model
worked well in 2008, which was a pioneering exercise in the use of benchmarking for
both railway networks and for ORR. However, for more standardized and less
pioneering work, I think that a more in-house based approach, like that of Ofgem, has a
number of advantages, including the fact that the regulator‟s own benchmarking
specialists are an integral part of the price review decision-making team.
28
I am very grateful to Adam Cooper and Godsway Cudjoe of Ofgem for not only providing me
with helpful documentation but also spending time to discuss the issues with me. However, I take
sole responsibility for the views expressed on Ofgem and its econometric benchmarking. 29
It should be clearly noted that that ITS won its 2009 contract in open tender. In addition, the
choices of organizational model were the responsibility of ORR and not of ITS.
17
It seems to me that Ofgem‟s use of moderately arms-length specialist outsiders to provide
backing to their in-house team can provide a good model by which the benefits of
outsiders and the associated risks can best be handled.
5.1.2 Ofgem and the Purpose of Econometric Benchmarking
I argued in Section 2 of the paper that regulators needed to have a clear view as to the
purpose of econometric benchmarking. Given the evolution of Ofgem‟s benchmarking
methods from simple cross-section through domestic and international panel data models,
Ofgem has had to think clearly about the role of econometric efficiency benchmarking.
That was further encouraged by the expansion of econometric benchmarking from
electricity distribution to gas distribution and then to networks.
The RPI-X@20/RIIO exercise also and encouraged explicit consideration of the purpose
of econometric efficiency benchmarking and its role in a more company and output
driven regulatory approach. The early development of menu regulation, its extension to
gas distribution and now to transmission/transport networks all provided new ways of
addressing asymmetric information problems and a new, if lesser, role to econometric
benchmarking. More recently, the Ofgem “fast-tracking” regulatory approval
opportunity for companies with strong records and strong business plans has provided an
additional useful incentive which appears also to operate as an „information revelation‟
incentive similar in kind to menu regulation. This again means that econometric
benchmarking is now far from the only tool available to assist Ofgem decision-makers
regarding how they can tackle information asymmetry problems on efficiency judgments.
Menu regulation, fast/slow tracking and similar information revelation methods are not
possible for ORR at CP5, but may become so at CP6 and beyond. On the basis of Ofgem
experience, fast-tracking could probably only become a realistic opportunity for ORR if
Network Rail became considerably disaggregated in its operations and investment30
.
Even then it would have to be organized within the DfT planning and subsidy process. It
may be that the CP5 settlement could include explicit pointers in one or more of these
directions.
One major difference between Ofgem and ORR on the non-distribution networks is that,
for Ofgem, the main regulatory cost concerns are with enhancements rather than with
efficiencies relating to the existing network. Ofgem is having to regulate electricity
transmission and gas transportation networks that are expanding significantly in size in
response to climate change challenges and renewables expansion. This follows 20 years
of improving efficiencies on the networks which culminated in the RPI-X@20/RIIO
review.
30
In theory, ORR could fast track Network Rail if it were convinced that it had produced a good
plan on the basis of credible assumptions. However, that would have to be demonstrated clearly
to all other interested parties, including DfT, TOCs, customers, the NAO and the relevant
Parliamentary Select Committees. For these reasons as much as any technical reasons, I would
argue that fast tracking is only a realistic option with internal UK disaggregated comparisions.
18
A rather higher proportion of Network Rail‟s costs derive from operating the existing
network than with enhancements. As information asymmetry issues are almost certainly
worse for the former, that means it is more important – and harder – for ORR to get a
good grip on these issues than Ofgem. This is particularly true if there is strong evidence
that a significant efficiency gap remains between Network Rail‟s costs and those of other
countries‟ rail systems. However, that seems to me to be a strong argument for trying out
information revelation methods beyond CP5 in addition to existing benchmarking tools.
For electricity transmission, Ofgem‟s Initial Proposals propose £11 billion of capex for
GB electricity transmission (excluding system operation capex) and £3 billion for GP gas
transport. Of these two, almost £10 billion is „load-related‟ investment. (For electricity,
„load-related‟ investment is defined by Ofgem as “the investment required to connect
new generators and customers to the network, to upgrade the existing network and to
cater for growth in demand” – and similarly for gas.) These are not significantly higher
in absolute terms than Network Rail enhancement investment in CP4 but are a lot higher
relative to the size of the asset base.
5.2 Ofgem - International Benchmarking Data and Econometric Methods
As discussed below, Ofgem have had similar problems with international benchmarking
of electricity transmission and gas transport data as ORR – and have had similar
scepticism on its use expressed by companies. However, reflecting its different
organization of econometric benchmarking, Ofgem has adopted different estimation
approaches.
Given all of the difficulties, Ofgem seem to be placing much less weight on the
international totex benchmarking evidence in the current price determination (RIIO-T1)
than they had previously expected and are making more use of other evidence when
judging the network companies‟ efficiency. They are currently working with other
European regulators to improve the process and comparability of the data. Provided this
was successful, Ofgem would expect international benchmarking to play a more central
role in future transmission price reviews.
5.2.1 Ofgem and International Electricity and Gas
Transmission/Transport Data
Following the 2010 report on benchmarking methods commissioned from Frontier
Economics, Ofgem embarked on a programme to collect international panel data for
benchmarking on electricity transmission and gas transport networks. Frontier
recommended assembling these data from a variety of EU and North American sources.
The data collection exercise has been a lot less successful than was hoped. In particular,
Ofgem and its specialist advisers were unable to collect any usable information on
European countries. This was in spite of there being: an active EU energy policy focused
on competition; independent energy regulators in all countries; an EU-wide group of
energy regulators; and now a pan-EU energy regulator. The problems, as with rail,
19
seemed to be primarily a result of confidentiality clauses (including legal restrictions on
data disclosure) and data anonymisation issues.
It was possible to collect data on US electricity and gas via FERC data and a 3-year
(2006-9) totex panel based on common accounting and other rules was assembled.
However, many US state-level entities combined transmission and distribution network
data (and similarly for gas). Since there were no common definitions and boundaries
between high and low voltage/pressure networks, it proved impossible to separate clearly
between high voltage transmission lines and low voltage distribution. These features
greatly weakened the usefulness of the results for GB regulation.
For estimation purposes, the US data was combined with the GB transmission networks
data. This raised the obvious problem that the England and Wales electricity
transmission network and the GB gas transport network were much larger than the US
networks.
The econometric results obtained by Ofgem from their in-house estimation seem to be
quite well-determined, generally sensible and robust. They are not yet in the public
domain but it is to be hoped that Ofgem will publish them in due course. However, given
the data issues discussed above, not surprisingly, Ofgem received a lot of critical
comment from UK companies on using the estimated models to assess their efficiency for
the current transmission pricing review. In consequence, Ofgem signaled, as early as
March 2011, that the econometric benchmarking would be used as a subsidiary element
for efficiency assessment in the 2014 transmission price reviews and that the main focus
would be on disaggregated (bottom-up) cost assessment approaches. In particular,
Ofgem seem to be placing particular reliance on unit cost comparisons for the 2014
transmission price review. This is consistent with an approach which is more driven by
network expansion concerns than with raising efficiency on existing transmission assets.
One point worth noting in the context of the choice of PPP for railway network
benchmarking is that Ofgem, like ORR, has used general (GDP) PPPs in their modeling
and not sector-specific ones as Network Rail has been advocating.
5.2.2 Ofgem’s Choice of Econometric Methods for Efficiency Modelling
Ofgem historically has primarily relied on COLS as its main efficiency benchmarking
method, but supported by DEA and other methods. The 2010 Frontier Report
recommended that the international benchmarking of transmission/transport networks
should rely primarily on DEA. That recommendation was not accepted by Ofgem.
For the recent panel data efficiency modeling, I understand that Ofgem have continued to
rely primarily on COLS – but, for the current exercise, a panel version with fixed effects
and time-dummies. Ofgem seem to prefer COLS to explicit frontier models. Of the
frontier models, they seem to have particular reservations about the robustness of SFA
with its need for large numbers of observations to obtain well-determined and stable
results.
20
The views above may reflect particular issues arising out of energy networks31
.
Nevertheless, it is noticeable both Ofgem and Ofwat in-house regulatory teams rely on
COLS as their base-method econometric technique. They may do some in-house frontier
analysis and they certainly buy-in sophisticated frontier modeling expertise but that is
additional rather than core modeling.
5.3 Concluding Comment on Ofgem’s International Benchmarking
Ofgem does not seem to have given up on international econometric efficiency
benchmarking, but it is clearly perceived now as less central for transmission regulation
than at the end of the RIIO process in 2010 – at least for RIIO-T1. It remains to be seen
whether it will become more important in subsequent transmission price reviews. For
enhancements, unit cost benchmarking is being given particular weight in RIIO-T1.
My impression was that for Ofgem to take it further would require a substantial longer-
term project to collect the necessary data to assess efficiency (particularly for European
countries). However, with Ofgem‟s extension of menu regulation and „fast-tracking‟ to
transmission entities, there are alternatives to econometric benchmarking so that at least
some of the originally envisaged role may now have been superseded.
6. ORR Econometric Efficiency Benchmarking Options in PR13
Since 2008, it has become increasingly clear that modeling of the LICB data set will not
provide anything like as strong a basis for CP5 as was the case for CP4. In addition,
problems with instability of the SFA modeling results based on the LICB data set from
post-2006 data32
leave open how much of a gap still exists between Network Rail‟s
efficiency and that of its international counterparts. Related to that is the question, of the
size of any efficiency gap between Network Rail and international companies in 2013
over and above the 2008 agreed 21% catch-up.
There are also two other sets of issue that are relevant. The first set relate to issues within
the current LICB framework which are most relevant for the CP5 review e.g. on data
definitions and choices, steady-state investment issues, etc. These have been the subject
of ongoing debate between ORR and Network Rail. The second set is more relevant for
post-2013, but should be considered within the CP5 determination. This includes
whether or not to continue with international benchmarking or switch to purely UK
regional benchmarking.
I discuss each of these issues in turn. I also discuss lessons from Ofgem‟s experience.
Although much of the discussion is concerned with the technique and content of
benchmarking at CP5, I also make some points regarding ORR‟s organization of
31
See Haney and Pollitt (2012) for a detailed discussion of the relative merits of different estimation
methods for electricity transmission efficiency benchmarking. 32
Particularly 2009 and subsequent LICB data
21
benchmarking and its relations with both ITS and with Network Rail. I return to those
issues in more detail in Section 7.
In what follows, I assume that enhancement investment will continue to be excluded from
CP5 econometric benchmarking even if it is covered by other methods. This is in
contrast to Ofgem and Ofwat. However, Ofwat is considering whether to exclude „large
projects‟ (appropriately defined) from totex measurement and menu regulation.
TEXT BOX 2
Given that many rail enhancement projects are „large‟ by any standards (viz. West Coast
Electrification, HS1 and HS2), this may be an argument for permanently excluding them
from econometric benchmarking. In practical terms, though, this is a question for CP6
and beyond rather than CP5.
6.1 Alternatives and Possibilities for Econometric Efficiency Modelling in
PR13
For CP4, there seems to be considerable consensus that the 2008 ORR approach to
efficiency modeling is unsustainable – at least as a guiding force in the efficiency
assessment. Smith and Wheat (2012) conclude their recent Discussion Paper as follows:
“In its current form, using the updated data (to 2009) and models, the econometric
modelling benchmarking approach [based on the LICB data set] could only
reasonably used as a cross-check against other approaches, and the findings would
need caveats applied, and quite a wide range of results quoted.”33
33
Smith and Wheat (2012), p.14. My parenthesis addition.
Large Projects and Benchmarking
The largest projects almost always have substantial material uncertainties e.g. on
planning timetables, construction risks, optimism biases, etc and these are typically
much greater than for the average enhancement project (viz. the Thames Tideway
project). A recent CEPA report to Ofwat separates the key uncertainties into (i) cost
uncertainty, (ii) timing uncertainty and (ii) output uncertainty.(what the project will
actually deliver). It suggests various reasons why three all of these are likely to be
significantly greater for the largest and most ambitious projects.
See the discussion in CEPA Report to Ofwat “Incentives and Menus”, July 2012 and,
in particular, Annex 5.
22
Internal ORR papers that I have seen take a similar view, including the Advice to
Ministers document of March 2012.
Network Rail suggests that their UK route-based model should be able to provide useful
information at least to supplement if not to replace the LICB international modeling.
However, given that no model has yet been fully estimated or tested – and that it will be
based on only 3-years of past data – I doubt that it will be able to provide results capable
of bearing any substantial regulatory weight for PR13 and CP5.
There is also the possibility of developing a new international regional data set. Smith
and Wheat (2012) have reported preliminary results based on varying numbers of years
for 7 countries. This may also be useful as a cross-check. However, neither they nor
anyone else seems to be suggesting that this data-set could be a major source for
regulatory benchmarking estimates in 2013.
Although there is considerable agreement between ORR, Network Rail and ITS on the
position as stated above, there is considerable disagreement on:
(i) Various issues arising from the econometric modeling based on the LICB
data set; and
(ii) How much weight can or should be placed on any international
benchmarking.
Both of these issues arise primarily from Network Rail‟s exploration of the LICB data set
and its estimation based on LICB data up to 2009. In what follows, I will say a little
about each of the main issues under (i).
My main conclusions on the two points above for the CP5 regulatory determination are
set out below. I will discuss each in more detail below
1) As regards the debates over LICB-based estimates, it is clear to me that the
question of how large any efficiency gap between Network Rail and international
companies might be is extremely unlikely to be settled by further econometric
estimation based on the LICB data-set. The number of runs carried out on that
seems to me already to take one into the area of at least the sub-conscious
equivalent of data-mining.
2) As regards the use of international data, my main conclusion is that ORR must
retain some form of international benchmarking for CP5 and beyond. This is for
pragmatic, regulatory reasons as much as for obtaining reliable econometric
benchmarking modeling reasons. In addition, several of the arguments that
Network Rail have put up regarding the use of international data seem to me to be
very likely to apply to route-based disaggregated UK data, albeit to a lesser
extent.
23
6.2 Data and Modelling Issues concerning the LICB Data Set in PR13 and
Beyond
I discuss in turn, firstly, the main data issues that have arisen; and, secondly, the
modeling consequences.
6.2.1 LICB Data Issues
Obtaining good quality international data for regulatory benchmarking purposes is always
difficult. In the previous section, I discussed the problems that Ofgem has had over
electricity and gas transmission data. For rail, the problems seem particularly difficult as,
unlike energy or telecoms, there is no mandatory EU obligation for having regulators that
are independent of government or similar. Most international regulatory benchmarking
(e.g. by Ofgem and Ofcom) uses data on US states which follow common accounting and
recording conventions and is subject to common audit rules. However, the use of US
data creates its own problems in terms of comparability, as Ofgem has found.
The LICB data set only became available to ORR thanks to the goodwill of Network Rail
and the UIC (and its members). It was never collected to be used for econometric
benchmarking for regulatory purposes and by regulatory agencies. Its use in this way by
ORR has raised controversy. It is also clear that the LICB data are not assembled and
audited by a single entity and that the quality of the data reported seems to vary across
countries. This has led to major concerns about the comparability of the data for the
companies in the 2006 LICB data set about which Network Rail have, not surprisingly,
been vocal.
It is unclear who has the main responsibility for promoting UK interests with the LICB
data set. Even if Network Rail has the main responsibility, ORR needs to have its own
view and needs to be able to make representations.
Besides the data quality issues, there is the fundamental problem that several countries
have dropped out of the recording process, leaving a less obviously useful set of
comparator countries. It also means that the estimates for 2008 based on the 2006 data
set cannot be tested on equivalent data for later years.
The major problems on the quality of the data in the LICB data set raised by Network
Rail and discussed by ITS and ORR are:
(i) The differences between how countries classify enhancement investments
relative to renewals;
(ii) Investment cycles and steady-state investment levels;
(iii) Network quality – and national variations in delivered train service levels;
and
(iv) Exchange rates and PPPs.

24
There are other issues (e.g. the maintenance/renewals boundary) but the ones above seem
to be the most important.
In my view, the first three of these issues are potentially serious. However, I find
unconvincing the Network Rail argument in favour of using a construction PPP rather
than a general PPP.
The first issue, on the definition of enhancement investment, is clearly very important.
For CP5, any use of the LICB data needs to do as much as possible to achieve a common
definition across whatever countries are in the sample. In addition, if at all possible, this
needs to be done for past years and not just for current and future years. Certainly, just
correcting for 2009 is not a viable procedure and, as ITS has demonstrated, produces
implausible results. One possible approximation to creating the back-data might be to try
and derive additive or multiplicative corrections.
The second issue, on steady-state investment and investment cycles, may be important
but that has not been clearly demonstrated. In addition, it is unclear how much difference
this would make to any estimates. However, to explore this further, rather than more
estimation with the SFA model I would recommend alternative approaches (e.g. via
simulation) to provide evidence on the likely practical importance of this issue rather than
further LICB equation estimation34
.
The third issue on quality of track (and train) service strikes me as important and it is
unclear what can be done about it without some data on quality differences. It may be
that one could find some proxies to include as dummy variables in the modeling. As
these quality differences are likely to be relatively constant over time between countries,
this is an area where modelling with country-specific fixed effects may help shed light,
although there are also snags, as has been found by Smith and Wheat. This is an area
where ORR and its internal benchmarking team should discuss with their opposite
numbers in Ofgem and other regulators and make recommendations for ORR senior
management.
It should be noted that both the second and third issues would arise to a possibly
important extent within a UK disaggregated route-based model. They are not a unique
property of international econometric modelling.
Regarding the fourth issue, the choice of PPPs, I would argue that, unless there are
compelling reasons not to do so, regulators should always use general price indices rather
than sector-specific ones. That was one of the points for RPI-X price regulation rather
than cost-plus based regulation based on historic cost. This general perspective points to
the use of general GDP PPPs.
For railway track-related renewals and maintenance, it is not at all clear that there are any
compelling reasons to use a sector-specific PPP; nor is it clear that a general construction
industry correction factor is well-suited for these specific activities. There are also major
34
This issue has also arisen in the Ofgem international econometric modeling and alternative
solutions have been discussed in technical papers by and for Ofgem, including by Melvyn Weeks.
25
data quality issues with construction PPPs. Finally, taking a pragmatic approach, if it
were the case that the use of construction PPPs improved the fit of the estimated SFA
model, then there might perhaps be a case for switching to them. However, since - if
anything - it increases model instability, even this argument falls.
I note that Ofgem prefers to use broader indices not least to avoid the circularity that can
arise when the regulated company provides a large part of the demand for specific inputs
and hence can influence the index. This may be an issue for some railway civil
engineering inputs. However, Ofgem may qualify this to the extent that company
financing requirements are affected variations in specific inputs whose use (and price) are
outside the control of companies.35
Summarising, for PR13 and CP5, ORR has to make do with estimates based on the LICB
data set (presumably 2010 data) as currently constituted, making whatever corrections
can be carried out in the time available. The weaknesses are clear and mean that only
very limited weight can or should be put on estimates from this source (e.g. as a cross-
check against other approaches). However, although of much less reliability than in
2008, the value of the LICB data set may not be great - but it is not zero or negative. In
consequence, it should not be junked for CP5 unless rather bigger problems become
apparent.
Beyond CP5, the key question will be whether the LICB data set (or something derived
from this approach) can be salvaged and turned into a data set which again gives
confidence to its users.
6.2.2 LICB Modelling and Modelling Organization Issues for PR13
The estimation on the 2008 and 2009 LICB data has shown marked instability in the
results.
Most of the modeling on this data set - whether by ITS, ORR or Network Rail – has been
done using the ITS SFA model. The data issues raised by Network Rail has led to a very
large number of runs using this model both by Network Rail and by ITS and ORR in
response to the issues raised by NR. In my view has taken the process into deeply
diminishing returns territory and raises concerns about whether the probability
assumptions underlying the use of regression models are still being satisfied.
The benchmarking modeling based on the LICB data set seems to me have become a
progressively narrower conversation between a small number of people which strikes me
as being increasingly unhealthy. At the least, the ORR benchmarking team should
discuss data and methods – and other relevant issues - with their Ofgem equivalents and
others in preparation for CP5. In particular, ORR should also see whether there are other
lessons it can learn from Ofgem‟s recent experience with (commissioned and internal)
international panel data modeling.
35
Communication by Chris Watts to a LinkedIn debate September 2012.
26
In general, I think that ORR needs to build up its own internal benchmarking capability
regarding this (and other) data-sets. It is right that ITS should continue to develop the
LICB data set and its modeling. However, as regards this data set I think that ORR
should do more of its own analysis. For instance, I think that it should spend some time
estimating simple COLS models – particularly with fixed/random effects - on the LICB
data set (and possibly estimate other non-SFA models) as Ofgem has recently done on its
international panel data set. Whether or not such models are the chosen ones, I would
recommend taking them as a baseline starting point for the use of other and more
complex approaches.
Finally, I would argue strongly that, if ORR are going to use the LICB data set and model
for regulatory decision-making purposes in CP5, it needs to have its own versions in-
house – as well as ownership of not just the data set and data integrity work and all
resultant outputs. This is essential if, as is necessary for good regulatory practice, ORR is
to be able proactively to challenge and shape the development of the ITS models as they
develop.
I discuss various relatively detailed points on the choice of econometric method for ORR
benchmarking in Text Box 3 below. All of these points are intended to provide guidance
on what ORR should do in PR13 and beyond in the light of the experience during and
since PR08. Hence, they explicitly make hindsight judgements of the kind deliberately
avoided in Section 4 above.
TEXT BOX 3
Some Observations on Econometric Methods for Regulatory Benchmarking
My recommendations above on the need for ORR to use a variety of econometric
methods echoes a major theme of the 2009 Oxera report. One of their main
recommendations was that several modeling approaches, including COLS and DEA
should be used by ORR to cross-check the robustness of the efficiency estimation
results. (See Oxera (2009) Recommendations 4.1 and 4.2, p.17). Oxera specifically
recommended the use of parametric and semi-parametric methods (e.g. two and multi-
stage DEA) as well as SFA. Clearly, ORR should use all sensible approaches but I
would recommend starting with simple models and then introducing other more
complex approaches as appropriate rather than relying primarily on SFA models using
the other, simpler methods as cross-checks.
SFA models typically produce lower estimates of efficiency differences than DEA or
COLS as not all of the residual variation is classified as „inefficiency‟. However, lack
of knowledge on the accuracy of the estimate of the allocation of residuals between (a)
„genuine inefficiency‟ and (b) residual error can be difficult in practice. Hence, with
SFA, the reliability estimates of inefficiency depend heavily on the reliability of the
estimates of the overall residuals as well as its allocation between (a) and (b).
27
6.3 Use of the Network Rail UK Regional Data Set for Econometric
Benchmarking in PR13
Network Rail is (with outside assistance) constructing an econometric efficiency
benchmarking model for maintenance and renewals expenditure for 9 UK routes
(possibly also including Wales). This is a welcome development but is unlikely to
provide a strong basis for ORR‟s assessment of Network Rail‟s efficiency in CP5
although it could potentially be very useful indeed for PR18 and CP6. Note that to make
this option viable for price regulation purposes will require at least accounting if not
business separation for each route plus careful auditing.
The estimates of the residual and - in particular - their allocation between (a) and (b)
above, depend on a variety of assumptions about distributional properties which are both
complex and which can be difficult to test other than in narrow comparative terms.
Hence, in practice, regulators are wary of placing too much weight on SFA estimates.
For postal regulation, in 2006, Postcomm had a large sample (1200 observations on
delivery areas) but still used SFA to make an allowance for estimation error of the simple
inefficiency estimates derived from COLS and DEA but not as a main tool.
For rail, Oxera‟s 2009 report recommended SFA above COLS on the grounds that – data
permitting and distributional assumptions holding – SFA avoided the need for subjective
judgments on how much noise is present in the estimates. (See Oxera (2009), p.18.)
However, the practical implementation of COLS with fixed effects and time-dummies, as
used by Ofgem, should reduce the force of the potential econometric problems. They
also provide a set of simple base-line estimates against which other more sophisticated
ones can be compared. Besides the arguments above, I would point to „regulatory
revealed preference‟ where both Ofgem and Ofwat have been cautious about the use of
SFA models, particularly as the main estimation method. However, I note that Ofcom
have made more use of SFA models.
TFP (total factor productivity) modeling was discussed in the 2010 Frontier report for
Ofgem on benchmarking methods but was not recommended either for transmission or
for distribution. It has been used for energy regulation in the Netherlands. TFP
comparisons can be estimated by a variety of techniques including DEA, OLS, SFA or
index numbers, but they do depend heavily on reliable and comparable data on costs,
including capital costs.
Two other points on econometric methods for benchmarking of Network Rail efficiency.
Oxera (2009) recommended (a) further exploration of functional forms within SFA
models and (b) more work on estimating the uncertainty of the estimates of econometric
inefficiency. Both these points are well-taken. I am aware of more work since 2009 on
the former but not of anything substantive on the latter. For policy decisions, statistical
guidance on uncertainty estimates seems particularly important.
28
The main reasons why the disaggregated UK model is unlikely to provide a strong basis
for decisions in PR13 are:
(i) The model is far from fully estimated so that the joint scrutiny of estimates
and data has barely begun;
(ii) The model will be based on only 3 years of data so that it will have a
maximum of 27 (or 30) observations on which it is to be estimated. One
would have to be very optimistic to expect this to provide robust and
reliable estimates in time for CP5 decisions;
(iii) It has been suggested that the sample size might be increased by adding in
forecasts for the early years of CP5. That seems to me highly problematic.
Ofgem had considered doing the same for their transmission/transport
benchmarking models but have now rejected the idea36
;
(iv) The estimates available so far seem to be a pooled simple OLS model
without fixed (or random) effects. That is a very sensible starting point
but a lot more would need to be done to compare with the existing ORR
frontier based modeling results.
Provided that the international benchmarking provides some moderately useful evidence,
route-based UK only models cannot replace them - however useful they may be as a
supplement to international benchmarking. For both technical and general regulatory
policy reasons, my opinion is that ORR will have to continue with international
benchmarking for the following reasons.
(a) Countries all have degrees of inter-route efficiency variation. In setting
efficiency targets, rail regulators (like electricity and gas
transmission/transport regulators) have to look at evidence from cross-
national comparisons as well as within country
(b) Some of the problems pointed out by Network Rail will almost certainly
apply to regional modeling (e.g. network and service quality variations
and investment cycle issues);
(c) The need for modeling of frontier shifts requires international modeling
(possibly including TFP modeling);
36
The suggestion raises a number of problems both econometric and in terms of general incentives.
Melvyn Weeks of Cambridge University is advising Ofgem and has written on the econometric
problems. Although not using forecast data for transmission in RIIO-T1, Ofgem are still using 2-
years of forecast data for their electricity and gas distribution reviews. I remain very concerned
about the problems with this approach – potentially serious incentive problems as econometric
problems.
29
(d) The need for cross-country comparisons is greater where - as in rail - there
is ongoing government subsidy, levels of which vary by country37
; and
(e) International comparisons are crucial for ORR decisions on efficiency to
carry authority – appraisal justice must be seen to be done as well as to be
done at all.
For these reasons, it seems to me that the proposed new model will be able to provide
some but limited benchmarking evidence for CP5 decisions and potentially a lot more for
CP6 – but, in conjunction with and not instead of international benchmarking.
Looking ahead, if Network Rail were to reorganize itself into a much more disaggregated
company, the possibility would arise of moving towards benchmarking much more of a
multi-entity framework on the lines of water or electricity and gas distribution. However,
that would require a high degree of disaggregation and is more of a long-term than even a
medium-term option.
One final issue on this model is that, if ORR is going to use this model for regulatory
decision making, it needs to have its own version under its own control, including data
integrity tests and resultant outputs - at least over the period of regulatory decision
making. As with the LICB model, this is essential if, as is necessary for good regulatory
practice, ORR is to be able proactively to challenge and shape the development of the UK
regional model as it develops.
6.4 The International Regional Rail Data Set and Econometric
Benchmarking in PR13 and Beyond
The final data option for econometric benchmarking in CP5 is to use the Regional
International Dataset that has been worked on by ORR and ITS. However, whatever its
future potential, there are various issues which means that it is unlikely to provide more
than relatively minor corroborative evidential backing for CP5 decisions. Nevertheless, it
may provide some useful supporting information and, as discussed in the next section,
could potentially be a major benchmarking data source for CP6 and beyond.
The most obvious problems are:
(i) The dataset so far includes maintenance but not renewals, let alone
enhancements;
(ii) The dataset covers 7 countries but there is only one year of data for four of
the 7 countries; and
(iii) They are again a given and perhaps somewhat arbitrary choice of
countries based on what data happens to be available for which countries,
but this time including US companies as well as European countries
37
However, different treatment of subsidies in the accounts can be an important source of error and
must be handled with care.
30
In addition, the modeling so far has mainly relied on SFA frontier-based methods.
However relevant for a research agenda, it is clear to me that any use of this dataset for
regulatory decision making should be based on an estimation strategy that, having first
explored the data set and its quality in various ways, adopts an econometric strategy of
starting with relatively simple regression models before moving on to explore more
sophisticated modeling techniques such as SFA and other maximum likelihood methods.
This dataset is very promising for the future, both in general and as a potential
international data replacement should it not be possible to resurrect the LICB data in a
useable form. However, given growing Network Rail and ORR interest in disaggregated
modeling, developing this dataset over the next few years should, in my view, be treated
as a priority by ORR. It is the obvious complement to the Network Rail disaggregated
UK route data set. In addition, the greater the uncertainties over the future of the LICB
data set, the more important is the potential role of the international regionally
disaggregated data set. The development of this data set is something that I would
strongly advise ORR to pursue and maintain active involvement.
Finally, as with the other datasets discussed in this section, if ORR is going to use it or
regulatory decision-making purposes in 2013, I would argue that it needs to have its own
version under its own control at least over the period of regulatory decision making.
However, for PR13, any such role will almost certainly be confined to some limited
corroborative comparisons with results from other top-down (and bottom-up)
benchmarking.
7 ORR Organization of Econometric Benchmarking
This review has revealed some important data and econometric issues but, in my opinion,
by far the most important concerns relate, firstly to the purpose; and, secondly, to the
organization of ORR efficiency benchmarking. Indeed, thinking about the purpose of
benchmarking brings up directly the issue of its organization, not least in terms of how
benchmarking fits into ORR‟s price control decision-making.
7.1 The Roles of ORR Insiders and Outsiders
ORR is unusual in the degree to which its econometric benchmarking relies on work
carried out by outside experts. The relationship that has been built up with ITS Leeds has
undoubtedly brought great benefits to both parties. However, it seems to me that there
should have been a clearer dividing line in 2008 between where ITS advice ended and
ORR decision making began. This is unsatisfactory and is counter to standard guidance
for economic regulators on the necessary criteria for effective regulatory governance.38
.
The problem was relatively minor in 2008 because the econometric (and other bottom-
38
See guidance from UK Better Regulation Commission. See also Stern and Holder (1999), Brown,
Stern and Tenenbaum (2006) and its references on criteria for regulatory governance, plus Stern
(2007).
31
up) benchmarking estimates were used to provide a „challenge‟ to Network Rail – in the
terminology of Section 2 above, an Option (ii) purpose.
These „benchmarking governance‟ concerns have continued since 2008, although rather
less with ITS given that it now operates under tendered contract. This makes ITS into
more of an outsider and places greater responsibility on ORR to ensure transparency,
clarity and its ownership of judgments based on ITS modeling39
. However, in my
opinion, the main potential benchmarking governance problems for CP5 and beyond arise
from the inclusion of Network Rail as an additional joint party in the econometric
benchmarking process. This could well increase significantly as and when more reliance
were placed on Network Rail‟s regionally disaggregated UK model, thereby potentially
creating serious governance and conflict of interest problems.
There are good arguments for extensive co-operation between ORR and Network Rail on
benchmarking, as set out in the Nelson Review. However, there are (and should) be
limits, particularly as PR13 decision making gets closer. From a regulatory governance
perspective, I advocate caution, particularly as CP5 decision making gets closer, In any
event, I suggest that the links with both Network Rail and ITS need to be considered
carefully to achieve effective „benchmarking governance‟ in CP5 and beyond.
My recommendation is that ORR should use its own, in-house econometric benchmarking
unit to do routine benchmarking and to take the lead in co-ordinating data requirements.
In particular, the responsibility for detailed knowledge of the data and running all
econometric models within the lead-up period to regulatory decisions should be the
responsibility of the in-house unit. This responsibility should be in line with ORR’s
regulatory objectives as set out by the ORR board and senior management.
Under this model, the role of ITS Leeds and other current or future external advisers
would be specific advice, supporting research, peer review and similar – maybe with
some peak-period support. This would help bring greater clarity in the relationship
between ORR and ITS e.g. over the boundary between external advice and ORR
decision-making. Co-operation with Network Rail on data collection and model can and
should continue but ORR should have access to (or copies of) any econometric models to
run in-house during the decision-making period of any price review. This will become
more important should the role of Network Rail benchmarking data sets and models
become significantly more important for ORR price setting.
39
It should be emphasized that ITS econometric benchmarking work on railways has throughout
been subject to peer review and has regularly been presented at professional conferences and
published in refereed journals.
32
TEXT BOX 4
7.1.1 ORR Benchmarking Unit and Econometric Estimation Strategy
Under this proposed model, for the reasons given in Section 6 and Text Box 2, I would
argue that ORR benchmarking unit should develop simpler COLS and other estimation
models as well as more state-of-the-art SFA models40
. This would provide a much easier
starting point for understanding the results obtained from the econometric models and
communicating the results to non-specialists as well as incorporating a „simple-to-
complex‟ ORR econometric methodology.
It may be that, as with Ofgem and Ofwat, COLS models (in panel data versions) become
the main tool - but they may well remain only a subsidiary method. Like Ofcom, ORR
may wish to retain SFA as a major tool, but it should have also use and develop
alternative estimation models, as recommended in the Oxera (2009) report.
Nevertheless, in any event, it seems to me that even if SFA models retain their primacy,
having simpler COLS comparators can only be helpful, at least as a starting point.
40 I note that, to some extent, this has been done in the past – and that COLS models estimated on the
LICB data set have tended to produce estimates of larger Network Rail efficiency gaps, not least
for the reasons discussed in Text Box 3. However, almost all of the emphasis in the papers that I
have read for this review has been on the SFA modeling results.
Efficiency Benchmarking and Regulatory Governance
In this paper I have argued that effective regulatory governance requires the regulatory
agency to be clearly in charge of regulatory benchmarking and responsible for the
models and estimates used in any price review. For ORR, I have suggested that this
means an internal benchmarking unit to operate - and to lead - within a regulatory
strategy set out by the Board.
This view implies clear and defined limits in the degree to which econometric
benchmarking is: (a) outsourced other than by specific contract or (b) carried out as a
co-operative exercise with the regulated companies. This view may be controversial.
The second aspect, in particular, goes against recent trends in UK rail regulation and is
rather different from the views expressed by the Nelson Review. The approach
recommended is, however, close to how Ofgem and Ofwat appear to manage their
benchmarking.
Since ORR in its functions regarding Network Rail‟s the setting of access prices is an
economic regulator, my argument applies to all the main issues involved in economic
regulation (e.g. for cost of capital issues) - but not to engineering or other aspects.
However, it might well apply to engineering issues concerning health and safety issues
in rail regulation.
33
Developing COLS models seems to me eminently an in-house task (if necessary with
bought-in support).
The underlying approach proposed here is for ORR to have alternative ways of useful
benchmarking and not be dependent on one data-set or one method. However ORR
defines the purpose of regulation, there should be more than one option available to the
ORR benchmarking unit. That implies:
(i) being able to draw on a range of external expertise;
(ii) having more than one main data-set (but including at least one
international data-set); and
(iii) employing as a matter of routine more than one method of estimation.
The judgment above is a personal one and draws heavily on the examples of Ofgem and,
to a lesser extent, Ofwat regulatory experience. However, I note that Ofcom may provide
a counter-example.
Ofcom appears to rely more on outside advisers for their econometric efficiency
benchmarking of fixed line wholesale telecom services (including Open Reach) and have,
since at least 2005, focused on SFA panel modelling41
. Nevertheless, I think that the
Ofcom example is not as relevant as the Ofgem and Ofwat examples since, firstly, the
telecoms industry is much more competition-oriented at network and wholesale as well as
at retail level than energy, rail or water; and, secondly, price reviews seem to be much
less central to telecoms regulation.. In addition, in terms of outside advisers, Ofcom seem
to have employed short-term contracts with (competing) economic consultancy
companies rather than a longstanding relationship with a single academic unit. Hence,
the Ofcom example does not lead me to change the recommendation above.
7.2 Decision-making in PR13 for CP5
For PR13 and CP5, it is clear that econometric efficiency benchmarking will (have to)
take a lesser role than in 2008. That does not mean that it will be unimportant or that
whatever useable form of should be dropped – international econometric benchmarking
clearly has and will have some positive value.
However, following the arguments above, I would recommend that more of the CP5
benchmarking work be done in-house42
, following the recommendations on estimation
41
For a recent paper on econometric estimation of efficiency for an Ofcom wholesale price review,
see Deloitte‟s 2009 paper for BT “Further Analysis of the Efficiency of BT‟s Network
Operations”. This paper discusses and references a set of papers by NERA for Ofcom from 2005
onwards which focus heavily on SFA modeling, plus giving some discussion of internal Ofcom
TFP modeling. The NERA 2008 study can be downloaded from
http://stakeholders.ofcom.org.uk/binaries/consultations/llcc/annexes/efficiency.pdf 42
Including by consultants operating under the direction of ORR staff as Ofcom, Ofgem and other
regulators regularly do – and as Network Rail is doing for the estimation of its UK regionally
disaggregated model. The appropriate organisation and control over such contracting out raises
34
approaches above to the extent that time permits Clearly, making substantive progress on
data issues for all three potential data sets will also be crucial.
In terms of the organization of future econometric efficiency benchmarking, it may well
be that CP5 decisions need to anticipate likely future developments. To the extent that
they do, that will need to be incorporated in deciding on the purpose of regulation at CP6
and beyond. That includes the potential for menu regulation and other information
revelation methods of handling efficiency which rely less on benchmarking per se to
address information asymmetry.
Active exchanges and discussion with other infrastructure regulators (and regulate firms)
could be very useful in developing how econometric benchmarking can be best
developed for the UK rail network. This is in addition to continued work with Network
Rail, other rail companies and UK benchmarking and regulatory specialists.
A final comment: To reiterate the starting point of this review, establishing the purpose
of econometric benchmarking for ORR at CP5 and beyond 2013 will be crucial both in
defining what needs to be done but also by whom. The former includes how the results
will be used in arriving at target improvements. The latter covers organizational
arrangements and, more specifically, the relationships firstly, within ORR and, secondly,
with Network Rail, ITS Leeds and also with other outside specialists and consultants.
8 Conclusions and Main Recommendations
In general, I suggest that, having decided on the purpose of econometric benchmarking,
looking ahead to CP5 and beyond, ORR needs to increase its options. That implies using
a wider range of outside econometric benchmarking support: Many regulators
(including ORR) maintain a panel or panels of advisers for different issues. I
recommend that ORR should assemble and employ a panel of advisory groups for
econometric benchmarking rather than relying on solely on ITS (or any other
entity) as its dominant adviser.
more than one main data source (including at least one international data set);
and
a variety of estimation methods: with an estimation strategy determined in-house
and based on a „simple-to-complex‟ modeling strategy.
If adopted, these changes would place strong incentives on ORR actively to determine its
econometric benchmarking strategy, including the role and purpose of benchmarking in
price setting – including, for PR18, the role of econometric benchmarking relative to
menu regulation and other information revelation techniques. Such changes (particularly
implementation issues that need to be considered carefully but which are outside the scope of this
paper.
35
the first) would also provide much greater clarity into the relationship between ORR and
outside benchmarking support, and bring it into line with practice at Ofgem and other
economic regulators.
I suggest that this recommended future strategy be carried out via a stronger internal
econometric benchmarking unit and drawing on the experience of other UK infrastructure
regulators who have recently carried out reviews of benchmarking methods – primarily
Ofgem but also Ofwat
My main specific recommendations are as follows:
1) ORR needs to examine what is the desired purpose of econometric efficiency
benchmarking for CP5 and beyond.
For CP4 in 2008, international econometric benchmarking of efficiency
based on the LICB data-set was central to CP4 by giving a challenge to
Network Rail. Backed up by corroborative bottom-up benchmarking, it
played a major role in the process that led to the final settlement;
For PR13 and CP5, data and other issues mean that none of the
econometric benchmarking options will be able to support a „challenge‟
role of the type used in 2008. However, both the international and the
disaggregated UK econometric benchmarking should play some role and
can provide useful information for the CP5 decision-making process.
Beyond CP5 (but needing early consideration), ORR needs to decide the
extent to which it should continue to place significant weight on
econometric benchmarking per se as a solution to inherent information
asymmetry problems. I strongly recommend that ORR consider whether,
like Ofgem and Ofwat, it should turn more to „information revelation‟
methods such as menu regulation. Econometric benchmarking plays an
important but much less central role in these other methods.
Both Ofgem and Ofwat are trying to move towards totex (total
expenditure) modeling, including enhancements (except perhaps for large
and materially uncertain projects). ORR should consider whether
maintenance and renewals, excluding enhancements, is the best
expenditure basis of benchmarking or whether this should be changed.
This is at least as much a matter of data availability as of principle.
2) The Organization of ORR Benchmarking
I recommend that ORR, like Ofgem and Ofwat should make much more
use of its own, in-house econometric benchmarking unit which was
established after PR08. In particular, I recommend that the in-house unit
do all the routine benchmarking and take the lead in co-ordinating data
36
requirements. In both cases, it may need external support for specific
items but this can readily be bought-in under contract from a variety of
sources, drawing on academic teams, specialist consultancies and
individual experts.
I think it important that the responsibility for running all econometric
models within the lead-up period to regulatory decisions should be the
responsibility of the ORR in-house unit even if some work is contracted
out. This responsibility should be defined by the purpose for econometric
benchmarking and in line with ORR‟s regulatory objectives as set out by
the ORR Board and senior management
I argue that the ORR internal benchmarking unit should have access to and
be uniquely responsible for all data-sets and econometric models used by
ORR during the regulatory decision making period. This should include
not just the data set but also all data integrity work and all resultant
outputs. ORR and its benchmarking unit should be the sole responsible
agent for the efficiency benchmarking estimates for PR13 and beyond.
This is essential if, as is necessary for good regulatory practice, ORR is to
be able proactively to challenge and shape the development of the UK
econometric models as they develop.
Under this approach, the role of external advisers would be: specific
bought-in advice; supporting research; peer review; and similar. Outside
organizations can and should be competitively appointed for more
developmental and other benchmarking support but not for more routine
data collection and estimation.
Since 2009, ITS‟s work for ORR has been very largely under competitive
contract. The tendered contract approach should continue, but I suggest
that ORR might wish, as a matter of policy, to diversify its sources of
advice. It might also make more use of support from economic
consultancies as is done by Ofcom, Ofgem and Ofwat, a framework which
allows competition for shorter-term benchmarking assistance at peak
times.
Co-operation with Network Rail on data collection and modelling can and
should continue, including, where useful and relevant, the wider rail
industry Development of reliable international data sets should be a
priority within this. However, the relevant roles should be clarified (e.g.
regarding responsibilities for data collection), which will require careful
attention being given to managing responsibilities and handling potential
conflicts of interest between ORR and Network Rail.
37
It is crucial that the roles of ORR and Network Rail for benchmarking are
clear during the regulatory decision making period where, in my view,
ORR has to be the responsible party.
3) International Econometric Benchmarking Data Issues
I think it essential that ORR retain an international econometric
benchmarking capability. Ofgem have concluded that they need to retain
international econometric benchmarking for electricity and gas
transmission/transport in spite of similar company reservations as for rail.
Econometric benchmarking based on the Network Rail UK disaggregated
data-set can become a useful complement but neither can nor should
replace international econometric benchmarking.
Relatively little attention seems to have been given in recent years to
estimating shifts in the efficiency frontier relative to the Network Rail
efficiency gap. This is understandable given the relative magnitudes
involved (1-2% per year for frontier shifts as opposed to around 10-20%
for efficiency gaps). However, they are important and the estimation of
frontier changes again requires the use of international data.
For PR13, I think that ORR should try and use econometric benchmarking
from all 3 main available data-sets – the LICB data-set, the Network Rail
disaggregated data-set and the International Regional Data Set. For
reasons discussed at some length in the paper, none of these is likely to
provide econometric estimates that will bear much weight in determining
Network Rail‟s current and future efficiency from 2013-18 However, if
used with care, each should provide useful supporting information to
bottom-up engineering, management etc benchmarking.
Attempts should be made to rescue and improve the LICB data-set both
for CP5 and beyond. However, as regards international data, the
International Regional Data Set looks to me to be the most promising in
the medium-to-long term and would be a useful complement to the
Network Rail regional route modeling. ORR should consider as a matter
of priority whether and how the International Regional Data Set could best
be developed and how that might be supported.
The Network Rail disaggregated data-set could become very important for
econometric benchmarking at CP6 and beyond. How important it could
become will depend largely on how far Network Rail decentralizes its own
operations. The UK regional data set must, however, be compiled on a
clear and transparent basis and properly audited. For regulatory purposes,
ORR will need to have a copy of this data set which they can use in-house
for estimation and simulation purposes. Note, however, that given the
38
limited development and estimation, the role of this data set in CP5 is
virtually certain is to be relatively marginal.
4) Estimation Methods
I argue that ORR‟s internal benchmarking unit should - if necessary with
outside support – maintain COLS, DEA (including multi-stage DEA) and
other models. The Oxera 2009 Report strongly recommended that ORR
develop and use a variety of estimation methods, a view that I support for
PR13 and beyond. For econometric and other reasons, I recommend that
ORR adopt a „simple-to-complex‟ modeling approach.
I argue that ORR can and should draw on estimation experience of other
infrastructure regulators particularly Ofgem who, following a recent
review, still largely rely on COLS modeling, most recently in panel data
versions including fixed effect models, preferably taking account of time
varying versions of such models.
For PR13 and the future, I recommend the development of fixed/random
effect COLS models not least as a baseline comparator for other methods.
Even if other methods were chosen as more reliable, having it as a baseline
comparator would facilitate discussion among and between non-specialists
within ORR, Network Rail and the wider rail community.
The heavy focus on SFA modeling using the LICB data-set (and now the
International Regional data-set) e.g. to test data quality concerns has led to
diminishing returns. The discussions about econometric benchmarking and
its results seem to have become narrower both in scope as well as in the
numbers and range of people involved in them. This in itself is
problematic. In my opinion, having alternative (including simpler)
estimation methods should help reverse this and foster a wider discussion
involving non-specialists.
ORR should also consider the potential benefits from using alternative
methods (e.g. simulation methods) to test the robustness of their
econometric models. This would provide a much better alternative than
running ever more equation variants.
Jon Stern
January 2013
39
REFERENCES
Brown, A., Stern, J and Tenenbaum B., (2006), Evaluating Infrastructure Regulatory
Systems, World Bank.
CEPA (2012) „Incentives and Menus‟, A Report for Ofwat.
http://www.ofwat.gov.uk/pricereview/pr14/rpt_com120828wholesalecepa.pdf
Cubbin, J. (2011), „Comment on Smith, Wheat and Scarsi: Sub-company analysis of rail
infrastructure‟,CERRE,
http://www.cerre.eu/sites/default/files/110929_CEW_JCubbin_0.pdf
Cubbin, J. and Stern, J. (2006) ‘The impact of regulatory governance and privatization on electricity generation capacity in developing countries’, World Bank Economic Review, pp 115-141.
Deloitte, (2009), ‘Further Analysis of the Efficiency of BT’s Network Operations’ Report for BT.
Frontier Economics (2010), „RPI-X@20: The future role of benchmarking in regulatory
reviews‟, Report for Ofgem.
Green, R., Lorenzoni, A., Perez, Y. and Pollitt, M.G. (2006), „Benchmarking Electricity
Liberalisation in Europe‟, EPRG Working Paper 0609.
Haney, A.H. and Pollitt, M.G. (2009), „Efficiency Analysis of energy networks: An
international survey of regulators‟, Energy Policy, 37: 5814-30.
Haney, A.H. and Pollitt, M.G. (2012), „International Benchmarking of Electricity
Transmission by Regulators: Theory and Practice‟, EPRG Working Paper No 1226.
Jamasb, T., Nillesen, P. and Pollitt, M.G. (2004), Strategic Behaviour under Regulation
benchmarking‟, CMI Working Paper No. 19.
Oxera (2009), „Recommendations on how to model efficiency for future price reviews‟,
Report for ORR.
Pollitt, M.G. (2008), „Review of response documents‟ http://www.rail-
reg.gov.uk/upload/pdf/pr08-pollrvw-241008.pdf
Shleifer, A. (1985), „A theory of yardstick competition‟, Rand Journal of Economics,
Vol. 16, No. 3.
Shuttleworth, G. (2005), „Benchmarking of electricity networks:Practical problems with
its use for regulation‟, Utilities Policy, Vol. 13, pp. 310-17.

40
Smith, A. and Wheat, P. (2012), „Top Down Econometric Benchmarking Using the LICB
Dataset: Discussion of Issues and Suggested Next Steps‟ Mimeo.
Stern, J., (2007) „Evaluating Infrastructure Regulators: Developing UK and International
Practice.‟, CRI Occasional Lecture, No. 17.