Embed Size (px)
DESCRIPTION
Econocom Annual Report 2011
Citation preview

FINANCIAL STATeMeNTS

A leAding group
Founded 37 years ago,
Econocom is currently europe’s
leading independent business-
to-business iCT infrastructure
management provider.
With its complementary areas
of expertise (distribution,
leasing, IT services and
telecoms), and innovative range
of enterprise solutions,
Econocom assists businesses in
transforming their IT systems.
Operating in 17 countries,
Econocom Group employs
3,700 people and posted revenue
of €1,584 million and recurring
operating profit(1) of €66.6 million
in 2011.
Listed on the Euronext NYSE
since 1986, the Econocom share
joined the Brussels Bel Mid index
on 20 June 2011.
(1) Before amortisation of the ECS customer portfolio (€2 M/year).

3
2011 was notable for a number of successes and new projects.
Econocom doubled in size thanks to the successful operational integration of ECS, an acquisition
which would not have been possible without the trust of our financial partners, the banks and
investors. Thanks to a concerted effort from everyone concerned, including our employees,
we were able to pay off the bank loan much earlier than planned. As of 31 December 2011,
Econocom had a zero net financial debt position, thus leaving it independent and free to make
its own strategic choices.
The group continued to invest in promising growth markets, such as the medical sector and
multimedia solutions, and launched innovative products to assist companies in deploying and
managing tablets, ensure data centre availability and provide cloud-based backup solutions
for SMEs.
Lively sales activity, which exceeded expectations, resulted in another year of organic growth.
In 2011 our businesses posted record performance, exceeding the financial and operational
guidance announced at the beginning of the year. Consolidated revenue stood at €1.58 billion
and recurring operating profit(1) amounted to €66.6 million.
This performance was recognised by the stock market: the Econocom Group share was the
best-performing share in the Bel Mid index, rising 55% in 2011. Restated net earnings(2) per share
stood at €1.66, up 31% on the previous year.
In light of this successful year, I would like to thank our shareholders for their trust, the group’s
directors, who are responsible for these excellent results, and all the employees, whose
commitment helped make them possible.
Jean-Louis Bouchard
Chairman
MessAge froM The ChAirMAn of eConoCoM
(1) Before amortisation of the ECS customer portfolio (€2 million/year). (2) Restated with non-recurring items, net of tax impact.
4

Company profile 2
Chairman’s message 3
1. presentation of econocom group 7 Organisation of Econocom Group 8
Group structure 10
Ownership structure 12
Presentation of the group’s activities 13
2011 highlights 14
2011 key figures 16
Econocom Group SA/NV share 18
Shareholders’ agenda 19
Econocom Group SA/NV share performance 20
Information about the company 21
Competition and recruitment 22
Recent developments and outlook 24
2. Management report on the financial statements for the year ended 31 december 2011 27
3. financial statements 47
Consolidated statement of financial position 48
Consolidated income statement and statement of comprehensive income 50
Consolidated statement of changes in equity 52
Consolidated statement of cash flows 54
Notes to the consolidated statements 56
Condensed parent company financial statements as of 31 december 2011
(prepared in accordance with Belgian GAAP) 133
Balance sheet 134
Income statement 136
Cash flow statement 138
Consolidated highlights 141
ConTenTs
5

6
presenTATion of eConoCoM group
77

orgAnisATion of eConoCoM groupas of 31 December 2011
BoArd of direCTors
Jean-Louis BouchardChairman and Chief Executive Officer
Bruno LemaistreChief Executive Officer
Jean-Philippe RoeschChief Executive Officer
Robert BouchardChristian BretChantal De VriezeCharles de WaterVéronique di BenedettoGaspard Dürrleman Rafi KouyoumdjianJean Mounet
exeCuTive CoMMiTTee
Jean-Louis BouchardChairman and Chief Executive Officer
Bruno LemaistreChief Executive Officer
Jean-Philippe RoeschChief Executive Officer
Véronique di BenedettoDeputy Managing Director
finAnCe
Charles De StoopGroup Controller
88

CoMpAny seCreTAry depArTMenT
Galliane TouzeCompany Secretary
sTATuTory AudiTors
PricewaterhouseCoopersRéviseurs d’Entreprises SCCRL represented by Josy Steenwinckel or Emmanuèle Attout
Rafi Kouyoumdjan
Robert Bouchard
Jean Mounet Galliane Touze
Gaspard Dürrleman
Jean-Philippe Roesch Christian Bret
Véronique di Benedetto
Charles de Water
Charles De Stoop
Chantal De Vrieze
Bruno LemaistreJean-Louis Bouchard
99

group sTruCTureAs of 31 December 2011
10
econocom group sA/nv
Econocom Financial Services
International BV
Econocom Managed
Services SA/NV
Econocom Finance SNC
Econocom Lease SA/NV
Econocom Locazione Italia
SpA
Econocom Nederland BV
Atlance France SAS
Econocom Managed
Services BV
Econocom Location SAS
Econocom SAS
Econocom Managed
Services SAS
Econocom Products &
Solutions SAS
Alliance Support Services
SAS
Econocom Telecom Services
SAS
Asystel SAS
Econocom Maroc Sarl
Synopse SAS
GIE,Econocom Enterprise Solutions
Econocom Luxembourg SA
Atlance SA/NV
GIE Econocom
t
t
t
t
t t t t
tt t
tt
t
t
tt
tt
tt
t
t
t t
tt
100% 100% 93.57%
100%
41.67%
100%
40.5% 40.5%
100%
100%
100%
100%
100%
100%
100%
100%
88%
100%
84.66%
100%
25%25%
25%
25%
6.43% 58.33%
Econocom Public BV
t
t
19%
100%
100%

11
A2Z Holding NVEconocom
PSF SAEconocom
UK LtdEconocom
GmbH
Econocom Products &
Solutions Belux SA/NV
Econocom Expert
International Holding BV
Econocom SA (Espagne)
A2Z Solutions SA/NV
Data Networks France EURL
t t t t t t t
Econocom Services GmbH
tt t
Econocom France SA
Econocom Switzerland SA
Econocom Czech Republic
S.r.o
Econocom BV
Econocom Spain SAU
Econocom Deutschland
Holding
ECS International Corporation
Econocom Location Maroc SA Europe
Computer Systems
(Shanghai) Co. Ltd
tt
tt
tt
t
Econocom Romania SA
Econocom Slovakia
S.r.o
Econocom Polska
Sp. z.o.o.
Econocom Belgium SA/NV
Econocom Plc
Econocom International
Italia SPA
tt
tt
tt
t
Ficorent SAt
Econocom Technology Finance Ltd
t
Econocom Deutschland
GmbH
t
Econocom Managed
Services AGt
t
100%100%100%100%50.10%100%100%
100% 100%100%
100%
100%
100%
100%
100%
100%
100%
100%
100%
100%
100%
100%
100%
100%
100%
100%
100%
100%
100%
Econocom Location
Luxembourg SA
t
100%

12
oWnership sTruCTureas of 31 December 2011
Treasury stock
public shareholders
société générale
Bestinver gestion
valgestv. Wajs
Companiescontrolled
by j-l Bouchard
eConoCoM group sA/nv
6.04% 20.79%7.02%12.45%4.60%49.10%

13
ECONOCOM GROuP hAS 4 SEPARATE YET COMPLEMENTARY AREAS OF ExPERTISE:
LEASING: Innovative, tailored financing solutions to ensure more effective administrative and financial management of a business’ ICT and digital assets.
DISTRIBuTION: Services ranging from designing architecture solutions to roll-out, and from selling hardware and software (PCs, tablets, servers, printers, licences, digital devices, etc.) to systems integration.
IT SERVICES: Managing distributed and centralised IT resources: ITIL-compliant advice for IT service management, change management for IT infrastructures, infrastructure monitoring, outsourcing, deskside support and business continuity for all types of assets.
TELECOM SERVICES: Integration of mobile solutions to address companies’ changing needs, from devising solutions (engineering, imaging) to implementation (mobile device management, liaising with telecom providers, user support and maintenance of mobile devices).
With this expertise and its range of innovative enterprise solutions, Econocom assists businesses in transforming their IT systems.
overvieW of The group’s ACTiviTies

2011/2012 highlighTs
jAnuAry 201110 January
• Less than three months after the acquisition,
all the new group’s managers are appointed.
The new organisation is announced to the
200 main managers at an event, appropriately
called “Day One”.• Econocom Group
launches its new corporate design.
MArCh 20113 March
• A partnership with Apple is signed, thereby
making Econocom Belgium’s only ‘Apple
Authorized System Integrator’ and one of two Apple-accredited
providers in France.
30 March • A first instalment of the
structured debt is paid off (€40 million).
April 201129 April • Early repayment of the €40 million bridge loan; capital increase plan is cancelled.
MAy 201116 May• The final acquisition price of ECS is set and 890,000 Econocom shares received from Société Générale.
18 May• €84 million worth of convertible bonds successfully issued.
14
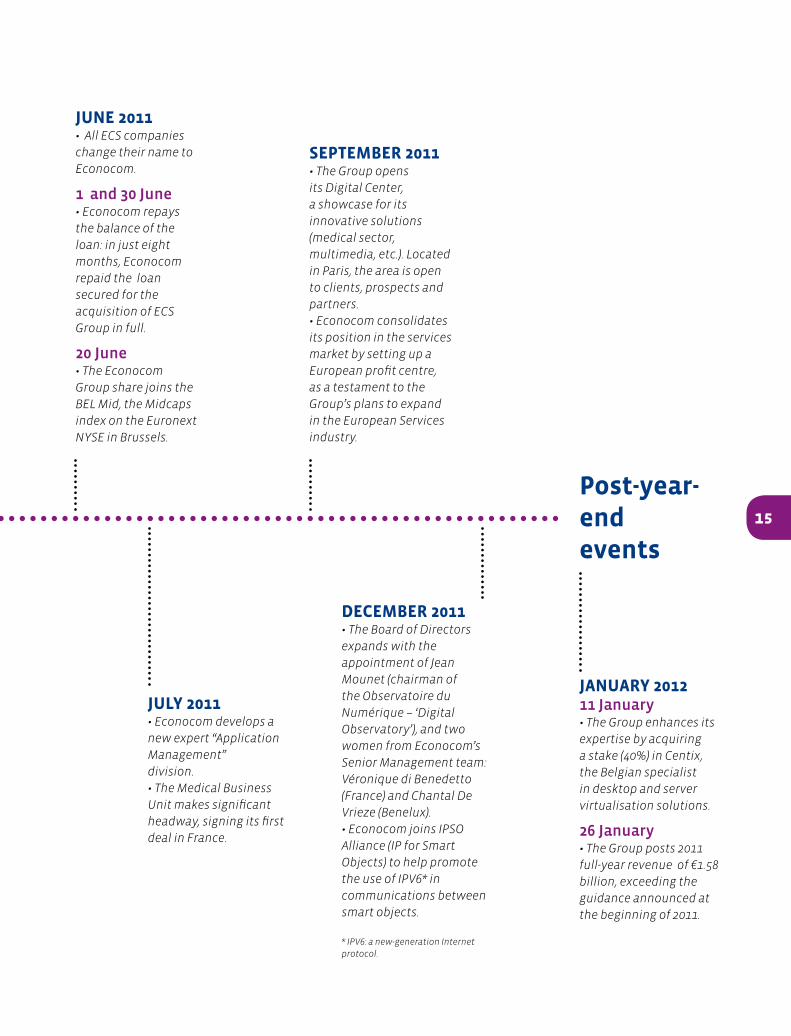
june 2011• All ECS companies change their name to Econocom.
1 and 30 June • Econocom repays the balance of the loan: in just eight months, Econocom repaid the loan secured for the acquisition of ECS Group in full.
20 June• The Econocom Group share joins the BEL Mid, the Midcaps index on the Euronext NYSE in Brussels.
july 2011• Econocom develops a new expert “Application Management” division. • The Medical Business Unit makes significant headway, signing its first deal in France.
sepTeMBer 2011 • The Group opens its Digital Center, a showcase for its innovative solutions (medical sector, multimedia, etc.). Located in Paris, the area is open to clients, prospects and partners. • Econocom consolidates its position in the services market by setting up a European profit centre, as a testament to the Group’s plans to expand in the European Services industry.
deCeMBer 2011• The Board of Directors expands with the appointment of Jean Mounet (chairman of the Observatoire du Numérique – ‘Digital Observatory’), and two women from Econocom’s Senior Management team: Véronique di Benedetto (France) and Chantal De Vrieze (Benelux).• Econocom joins IPSO Alliance (IP for Smart Objects) to help promote the use of IPV6* in communications between smart objects.
* IPV6: a new-generation Internet protocol.
post-year-end events
jAnuAry 201211 January• The Group enhances its expertise by acquiring a stake (40%) in Centix, the Belgian specialist in desktop and server virtualisation solutions.
26 January• The Group posts 2011 full-year revenue of €1.58 billion, exceeding the guidance announced at the beginning of 2011.
15

16
2011 Key figures
2009 2010 2011Consolidated revenue
759.3 1,021.4 1,584.3
Recurring operating profit
28.7 47.5* 66.6*
Net profit Group share
20.3 28.8 21.5
Consolidated condensed income statement (in € millions)
Revenue by geographical area
46%
24%
12%
18%
54% 2010
6%
16%
24%
2009
49%
2% 9%
40%
Consolidated revenue (in € millions)
2009
759.3
2010
1,021.4
2011
1,584.3
France Benelux Southern Europe Northern and Eastern Europe
*Before amortisation of the ECS customer portfolio.
2011

17
Recurring operating profit (in € millions)
Shareholders’ equity as of 31 December (in € millions)
Cash net of long-term debt as of 31 December (in € millions)
Breakdown of staff as of 31 December 2011
IT Financial Services
Econocom Enterprise Solutions
Products & Solutions
Holding
Managed Services
Agents
Telecom Services
70
60
50
40
30
20
10
0
2009
2009
20092010
2010
20102011
2011
2011
3,610
employees
€ 1,584.3 M
revenue
28.7
84.6
125.6
-27
30135.5
0
47.5*
66.6* 140
120
100
80
60
40
20
0
3025201510
50
-5-10-15-20-25-30
127 28 90143
758
108
2 356
*Before amortisation of the ECS customer portfolio.

18
ECONOCOM group shAre perforMAnCe
The Econocom Group share is
listed on the Bel Mid index.
ISIN code: BE0003563716
Average daily trading volume
in Brussels in 2011: 14,154
Market capitalisation as of
30 March 2011: €440 million
Jan. 11 Feb.1 0 March 11 April 11 May 11 June 11 July 11 Aug. 11 Sept. 11 Oct. 11 Nov. 11 Dec. 11
12/31/2010€10.00
12/31/2011€15.55
2006 2007 2008 2009 2010 2011
high (in €) 7.05 9.93 8.74 10.67 12.25 17.15
low (in €) 5.09 6.69 5.02 4.60 9.0 10.05
Closing price as of 31 december (in €) 6.66 7.51 6.44 10.35 10.00 15.55
Market capitalisation as of
31 december (in € millions)
193 194 160 257 262 440
Average daily trading
volume
18,955 22,959 11,850 16,030 12,246 14,154
number of shares as of 31 december
(in millions)
29.0 25.8 24.8 24.8 26.2 26.2
Monthly trading volume (in €)
Share performance
42,797
545,585
150,485
263,682
366,376
600,884
135,098 144,207 162,950
659,086
188,578198,701

19
2006 2007 2008 2009 2010 2011
high (in €) 7.05 9.93 8.74 10.67 12.25 17.15
low (in €) 5.09 6.69 5.02 4.60 9.0 10.05
Closing price as of 31 december (in €) 6.66 7.51 6.44 10.35 10.00 15.55
Market capitalisation as of
31 december (in € millions)
193 194 160 257 262 440
Average daily trading
volume
18,955 22,959 11,850 16,030 12,246 14,154
number of shares as of 31 december
(in millions)
29.0 25.8 24.8 24.8 26.2 26.2
Earnings per share* (in €)
Ownership structure as of 31 December 2011
Gross dividend per share (in €)
Dividend
At the Annual General Meeting
to be held on 15 May 2012,
the Board of Directors will
recommend a gross dividend
per share of €0.40 (€0.30 net).
This dividend will be paid on
7 June 2012.
Shareholders’ agenda
17 April 2012First-quarter trading statement
(Royal decree of 14 November 2007)
15 May 2012Annual General Meeting
07 june 2012Dividend payment date
24 july 2012Preliminary half-year revenue press release
30 August 2012Half-year results press release
31 August 2012Information meeting
17 october 2012Third-quarter trading statement
(Royal decree of 14 November 2007)
24 january 2013Preliminary full-year revenue press release
28 february 2013Audited full-year results press release
1 March 2013Information meeting
0.86
1.270.30
0.351.660.40
6.04%
49.10%
4.60%
12.45%
7.02%
20.79%
Treasury stock
Bestinver Gestion
Companies controlled by
Jean-Louis Bouchard
Société Générale
Valgest and V. Wajs
Public shareholders
Real-time financial information:
www.econocom.com
1.8
1.5
1.2
0.9
0.6
0.3
0
2009 2010 2011
0.40
0.35
0.30
0.25
0.20
0.15
0.10
0.05
0
2009 2010 2011
* Restated with non-recurring items, net of tax impact.

20
eConoCoM group sA/nv shAre perforMAnCeOn the Brussels stock exchange since 1 January 2009
price (€) volume
Month high (€) low (€) Closing (€) Average (€) number of shares
traded
value (in € thousands)
January 6.40 5.50 5.76 5.93 111,063 658.78
February 5.99 4.75 5.21 5.40 54,367 293.61
March 5.64 4.60 5.25 5.07 57,432 291.12
April 6.00 4.99 6.00 5.54 776,336 4,299.66
May 6.28 4.91 4.91 5.72 462,595 2,644.19
June 7.49 5.10 7.44 6.56 476,786 3,125.57
July 7.40 5.95 7.40 6.48 208,004 1,346.83
August 7.50 7.12 7.35 7.39 328,166 2,424.06
September 9.28 7.30 9.20 8.26 542,870 4,483.13
October 9.86 9.02 9.78 9.30 332,658 3,092.12
November 9.70 8.50 9.70 9.26 314,142 2,907.60
December 10.67 9.42 10.35 9.87 439,272 4,336.23
Total 2009 10.67 4.60 10.35 7.12 4,103,691 29,902.91
January 10.31 9.67 9.75 9.92 365,018 3,620.61
February 9.95 9.47 9.50 9.68 236,416 2,288.51
March 10.80 9.00 10.36 9.79 346,782 3,395.00
April 11.69 10.19 11.69 10.79 366,429 3,954.50
May 12.25 11.20 11.45 11.70 440,764 5,156 94
June 11.10 10.30 11.10 10.60 231,127 2,449.95
July 11.45 11.10 11.24 11.27 132,396 1,492.10
August 11.41 10.41 10.90 10.84 337,810 3,661.86
September 11.35 10.90 11.00 11.12 75,069 834.77
October 10.89 10.02 10.05 10.48 346,357 3,628.09
November 10.05 9.63 9.85 9.82 170,431 1,673.63
December 10.56 9.95 10.00 10.23 116,366 1,190.42
Total 2010 12.25 9.00 10.00 10.57 3,164,965 33,346.38
January 11.80 10.05 11.65 10.46 427,979 4,474.83
February 14.65 12.49 14.01 13.78 545,585 7,515.98
March 16.00 14.05 15.50 14.78 600,884 8,882.89
April 16.88 15.18 15.93 16.22 366,376 5,944.16
May 17.15 15.75 16.77 16.53 263,682 4,359.74
June 16.60 14.50 15 .21 15.27 150,485 2,298.11
July 16.11 14.60 15.30 15.14 135,098 2,044.87
August 15.00 12.95 14.60 13.54 198,701 2,689.81
September 14.60 12.76 13.10 13.31 144,207 1,919.72
October 13.90 12.70 12.81 13.21 162,950 2,153.19
November 12.90 11.41 11.80 12.19 659,086 8,036.06
December 15.55 12.00 15.55 13.68 188,578 2,578.94
Total 2011 17.15 10.05 15.55 14.35 3,843,611 52,898.30

21
inforMATion ABouT The CoMpAny
1. GENERAL INFORMATION • Company name: Econocom Group SA/NV
• Registered office: 5 Place du Champ de Mars, 1050 Brussels. The Econocom Group registered office formerly located at 34 boulevard de la Woluwe, Woluwe-Saint-Lambert - 1200 Brussels has been transferred following a decision of the Board of Directors on 7 March 2012.
• Legal form, constitution, published documents.
Econocom Group SA/NV is a société anonyme governed by the laws of Belgium. It was incorporated under a deed filed by Jacques Possoz, notary, on 2 April 1982, which was published in the appendices to the Moniteur Belge of 22 April 1982 (n° 820-11).
Econocom Group SA/NV is a company that publicly raises, or has publicly raised, capital under the terms of company laws.
The company is registered with the Brussels corporate register under number 0422.646.816.
• Term: indefinite.
• Financial year: 1 January to 31 December.
• Consultation of legal documents: - The parent company and consolidated financial statements and related reports may be consulted at the Banque Nationale de Belgique.- The bylaws and above-mentioned financial statements and related reports may be consulted at the registry of the commercial court.- All of the above-mentioned documents may be consulted at the Company’s registered office at 5 Place du Champ de Mars, 1050 Brussels, Belgium.
2. CORPORATE PuRPOSE (ARTICLE 3 OF ThE BYLAWS)The company’s purpose, in Belgium and abroad, is:
• The purchase, sale, lease and supply of computers and IT products generally, and all related financial operations.
• The negotiation of any and all business process engineering contracts with companies and the provision of any and all technical assistance in the field of information technologies.
• The design and implementation of electronic services and any and all related programming systems.
To this end, the company may acquire, manage, operate and sell patents, trademarks, and technical and industrial know-how.
The company may establish branch offices or subsidiaries in Belgium or abroad.
The company may deal with any and all Belgian or foreign companies with similar or complementary activities by means of asset transfers, partial or total mergers, subscription to initial capital or capital increases, financial investments, disposals, loans or any other means.

COMPETITION
Econocom Group stands out from its competitors thanks to its:
• Comprehensive and specialised offering in the management of corporate distributed infrastructures;
• Dual IT and telecommunications expertise;
• Combination of financing experience and technological know-how;
• Independence from IT equipment manufacturers, telecom providers, software vendors and financial companies.
Econocom Group has four independent and complementary businesses which include administrative and financial management of ICT assets (Leasing), procurement of IT products and solutions (Distribution), IT services (Services) and telecoms (Telecom). The group has no competitor capable of presenting such a range of offers in the areas of IT and telecoms. The group’s capacity to propose these four offerings and package them in enterprise solutions that draw on all four of its skill sets reinforces its unparalleled ability to respond to market expectations. Econocom group’s strategic plan, horizon 2012, capitalises on this competitive position.
A diversified offering
Econocom is currently the only independent provider in Europe that can design, supply, manage and finance corporate IT and telecommunications infrastructures.
The Group launched a telecommunications offering as early as 2000, well before its main competitors, and intends to draw on these strengths to leverage the expected sharp growth in the market for mobile services and voice/data convergence solutions. It has the required capabilities to meet strong future demand for mobile solutions and for managing telecommunications fleets.
Econocom has also launched cross-disciplinary offerings, involving several of its businesses, to address companies’ growing need for comprehensive solutions. These four new offerings allow companies to optimise and control the entire lifecycle of their corporate resources, including their:
• Distributed and centralised IT assets
• Telecom fleet
• Printer estate
• Procurement lead times and costs
• Licence agreement portfolio and migrations to Windows 7
• Tablet integration.
At the same time, through A2Z the Group boasts an innovative offering of IT and telecom services for SMEs, combining procurement with operational, administrative and financial services. This comprehensive management solution is billed on the basis of a monthly subscription cost per user.
Geographical presence
Econocom Group has been firmly established in Europe for over 35 years.
The acquisition of ECS Group allowed Econocom to strengthen significantly its presence in Western Europe and in particular in seven strategic markets: Belgium, France, Germany, Italy, Spain, the united Kingdom and the Netherlands, as well as establishing it in markets with high development potential in Eastern Europe, Morocco, China and the united States.
The group is currently directly established in seventeen countries in Europe, Morocco, China and the united States. This extended geographical scope, combined with international partnerships concluded, will enable the group to meet the requirements of its key account customers.
Main competitors
None of Econocom’s competitors has as broad a product and service offering. The main competitors in each of its businesses are as follows:
• Services: Capgemini, Atos, Steria, Logica, GFI, Neurones and Osiatis, which have an international presence but do not offer distribution or flexible leasing services. however, many services companies develop application software (accounting, inventory management, sales management, etc.), which is not part of Econocom’s current offering.
22
CoMpeTiTion And reCruiTMenT

• Distribution: Computacenter (France, Belgium, Germany and the united Kingdom), SCC (France and the united Kingdom), and RealDolmen (Belgium and Luxembourg).
• Leasing: the financial subsidiaries of manufacturers such as IBM, hP and Dell, and banks’ leasing subsidiaries (Arius and Etica) do not offer the same degree of independence or IT specialisation as Econocom Group. Neither ChG nor Grenke Leasing (Germany) carry out distribution or services activities.
• Telecoms: Econocom group has few competitors in the telecommunications field. The major IT services companies such as CSC, Atos and Capgemini already have specific outsourced telephone services offerings, mainly in the network sector of the market. Econocom on the other hand manages entire telephone fleets (mobile handsets, PDAs, tablets, etc.) along with the corresponding subscriptions. Lastly, the operators’ distribution conduits are primarily specialists in selling mobile phone hardware and voice and data subscriptions. While some – such as LCO (Orange) and Mobilitys and Coriolis (SFR) – are beginning to develop services, none benefits from the expertise acquired by Econocom in the business-to-business computer services sector over the past thirty-five years.
RECRuITMENT
As a group specialising in IT and telecommunications services, Econocom’s ability to attract and retain talented new employees is paramount to its success.
Econocom’s strategic plan, horizon 2012, highlights the group’s expansion scheme and ambitious growth objectives, hence the vital importance of recruitment and career development for the group.
The group has specialised recruitment units in each major country.
The group’s European presence, reputation, broad business base and listing on the Euronext market in Brussels all serve to attract young graduates and experienced staff alike.
The group seeks committed, innovative employees who are enthusiastic about sharing Econocom’s corporate values: Be Enterprising, Bounce back, Face reality, Share and Proud to be Responsible.
On 31 December 2011, the group had 3,610 employees and sales agents, compared with 3,664 at the end of 2010. The staff departures, resulting from the typical turnover rate in the IT industry on the one hand and from the merger between Econocom and ECS Groups on the other, were almost completely offset by the recruitment operations, particularly in the services sector.
Furthermore, with 600 sales and pre-sales staff, the group has strengthened its ability to continue and step up its growth, and consolidate its competitive edge.
Econocom’s growth is taking place in a constantly-changing environment. The group is therefore patently aware of the importance of enhancing its employees’ technical skills, now a major focus of its human resources policy. In conjunction with partners, the group has implemented various diploma courses and e-learning programs. These are particularly suited to employees working on-site at clients’ premises. In France, where over half of the group’s staff is located, training expenses came in at over 2% of total payroll.
The increase in the group’s size as a result of the merger with ECS Group resulted in a number of promotions and in managers expanding their teams. In order to assist managers in their career development, Econocom Group plans to set up a Management School in 2012 in conjunction with leading partners.
Career development is one of the group’s primary objectives. Employees are individually monitored, especially through their annual appraisals, which touch on achievements, objectives and training targets.
presentation of econocom group
23

24
1. PRINCIPAL INVESTMENTSIn addition to developing new products, software tools and recruiting new sales staff, engineers and technicians, Econocom Group SA/NV carries out external growth transactions in order to acquire specific skills or step up its expansion.
The group’s main investments over the last three years have been as follows:
2009
During 2009, Econocom Group SA/NV and its subsidiaries were not involved in any external growth transactions.
Econocom Group SA/NV raised its stake in the German company Econocom Gmbh from 80% to 90% by acquiring the equity interests of one of its managers in the German subsidiary.
2010
In 2010, Econocom seized upon a strategic external growth opportunity, thereby making decisive headway in the highly concentrated IT service market, where size is of strategic importance. On 28 October 2010, Econocom acquired 100% of ECS Group. This acquisition represents an investment of €192.8 million, which was financed as follows:
• An acquisition debt of €120 million from a banking pool and allocated to the payment of the price, acquisition costs and the funding of existing debts;
• Econocom Group shares given to the seller (SG Financial Services holding, a subsidiary of Société Générale) worth €30 million, or 1,354,376 of treasury stock and 1,372,897 new share issues;
• A €50 million bridge loan, to be repaid via an increase of the Econocom share capital.
The final investment, after adjustment of the price of ECS negotiated in 2011, stood at €180.1 million.
Moreover, the cash flow generated by the group’s satisfactory performance, combined with optimised management of ECS Group’s cash meant that the group
was able to repay both part of the loan secured for the acquisition and the €50 million bridge loan, without resorting to an increase in share capital, as originally planned. Lastly, the successful issue of €84 million worth of convertible bonds enabled Econocom Group to repay the balance of the acquisition loan during the first half of 2011.
In addition to this major acquisition, Econocom also acquired two sales agencies during the first half of 2010: IDS and Finedya. IDS sells Econocom Managed Services’ operational management services (outsourcing and support) in France, whilst Finedya sells Econocom Location’s financing and asset management services, also in France. These transactions represent a maximum equity finance of €3.2 million, €2.4 million of which was paid in 2010.
2011
In 2011, Econocom expanded its distribution business in Belgium, by focusing on the medical sector. On 31 March 2011, Econocom acquired 100% of the share capital of Systèmes & Supplies, a company specialising in selling products and solutions to the medical industry. This company was merged with EPS Belux, which opened its own dedicated Medical Business unit.
During the last quarter, Econocom acquired two sales agencies in France, DB2A Pays de Loire and DB2A Bretagne Normandie. These companies sell Econocom Location’s asset financing and asset management services in France and were dissolved without going into liquidation, resulting in the transfer of all their assets to Econocom Location SAS.
These transactions, financed with the group’s equity, amount to an investment of under €1 million.
2. ChANGES IN CAPITALAs of 31 December 2011, the company’s share capital stood at €17,076,677.70 and was composed of 26,172,897 ordinary shares with no stated par value, held in registered, bearer or dematerialised form. The capital is fully paid-up.
reCenT developMenT And ouTlooKEconocom Group’s development strategy combines both organic and external growth objectives.

recent development and outlook
25
In compliance with the Belgian law of 14 December 2005 on the elimination of bearer shares, on 7 December 2007, Econocom Group’s Board of Directors amended the company’s bylaws to inform holders of Econocom Group bearer shares that they had until 1 January 2014 to convert such shares into dematerialised shares through registration in a share account. Bearer shares registered in a share account as of 31 December 2007, automatically became dematerialised shares on 1 January 2008.
As of 31 December 2011, authorised unissued capital stood at €15,285,166.46. The Board of Directors decided, subject to the condition precedent that the convertibles bonds be converted on 1 June 2016, to increase within the authorised capital, the subscribed and paid-up share capital for a maximum amount of the equivalent of the conversion of all the convertible bonds into new shares, i.e. €2,610,000. The Board of Directors reserved the right, when it receives a conversion request from a bondholder, to issue the existing ordinary shares.
Changes in the company’s capital between 2002 and 2009 correspond to capital increases carried out for the
purpose of allocating shares on the exercise of employee stock options.
In 2010, Econocom Group issued 1,372,897 new shares for the capital increase paid to Société Générale Financial Services holding, a subsidiary of Société Générale, as partial payment for the acquisition of ECS Group. In 2011, Econocom Group SA/NV issued 4,000,000 bonds, worth €84 million, which can either be converted or exchanged for new or existing shares until 1 June 2016, with a 4% coupon rate, paid annually in arrears. The conversion rate is €21 per bond, each of which entitles the bearer to an Econocom Group share. The bonds were invested with qualified investors following an accelerated bookbuilding procedure. In the event that all the bonds are converted, 4 million new shares will be issued, resulting in a 15.28% dilution of the company’s share capital.
Econocom Group SA/NV did not cancel Econocom Group shares in 2011.
The number of Econocom Group SA/NV shares and voting rights (denominator) both stand at 26,172,897 as of 31 December 2011.
Changes in the company’s share capital and number of shares since 1 January 2002 are summarised in the table below:
date of operation Type of issue
Change in the
number of shares
Change in capital
(€)
issue premium
(€)
Total amount
of the operation
(€)number
of shares
share capital
(€)
01/01/2002 8,149,105 16,018,319.08
30/04/2002 Exercise of stock options 9,900 19,503.00 96,087.36 115,590.36 8,159,005 16,037,822.08
27/06/2002 Four-for-one stock split 36,636,020 16,037,822.08
18/12/2002 Cancellation of treasury shares (1,136,020) 31,500,000 16,037,822.08
22/12/2004 Cancellation of treasury shares (1,500,000) 30,000,000
20/07/2005 Exercise of stock options 265,000 143,100.00 966,650.00 1,109,750.00 30,265,000 16,180,922.08
22/12/2005 Cancellation of treasury shares (1,265,000) 29,000,000 16,180,922.08
15/05/2007 Cancellation of treasury shares (2,200,000) 26,800,000 16,180,922.08
20/12/2007 Cancellation of treasury shares (1,000,000) 25,800,000 16,180,922.08
22/12/2008 Cancellation of treasury shares (1,000,000) 24,800,000 16,180,922.08
28/10/2010Capital increase as payment for an acquisition
1,372,897 895,755.62 14,206,111.38 15,101,867.00 26,172,897 17,076,677.70
31/12/2011 26,172,897 17,076,677.70

26
The Extraordinary General Meeting of 19 May 2009 renewed for a three-year period the authorisation given to the Board of Directors to purchase Econocom Group SA/NV shares without the prior approval of shareholders, if the company faces a serious and imminent threat to its operations.
The Extraordinary General Meeting of 18 May 2010 renewed for a five-year period authorisation given to the Board of Directors for a capital increase, in accordance with article 603 of the Belgian Companies Code, either once or several times, for a maximum amount of €16,180,922.08. After the Board of Directors exercised this authorisation on 28 October 2010, the amount of authorised capital stood at €15,285,166.46.
The Extraordinary General Meeting of 18 May 2010 also authorised the Board of Directors to increase the share capital, in accordance with article 607 of the Belgian Companies Code, in the event of a takeover bid on the companies’ shares, and for a three-year period.
The Extraordinary General Meeting of 28 September 2011 renewed for a five-year period authorisation given to the Board of Directors to buyback treasury stock. The minimum purchase price was set at €6, the maximum price was €36, and the maximum number of shares to be purchased throughout the five-year period was
5,234,579. Furthermore, in accordance with article 620 of the Belgian Companies Code, the par value of shares held by the company and any subsidiaries it controls directly cannot exceed 20% of the capital subscribed.
As of 31 December 2011, Econocom Group SA/NV held 1,520,893 Econocom Group SA/NV shares, as part of the share buyback scheme and 60,039 Econocom Group shares acquired as part of the liquidity contract with Exane BNP Paribas, or 1,580,932 Econocom Group own shares, representing 6.04% of the total number of shares in issue.
3. OuTLOOKThe successful integration of ECS Group and record operational results posted by the group in 2011, combined with its strong financial position, mean that Econocom has the resources to continue its profitable mixed growth strategy.
In 2012, the group’s Management predicts another year of value creation and aims for a slight rise in revenue, recurring operating profit in excess of €70 million, and net earnings per share of around €2.

MAnAgeMenT reporT on The finAnCiAl sTATeMenTs for the year ended 31 December 2011
27

Note:
For 2010, ECS and its subsidiaries were consolidated in Econocom Group’s financial statements as of 1 October 2010.
The amortisation of the ECS customer portfolio is the result of the allocation of ECS goodwill for the amount of €40 million to the value represented by the portfolio of clients acquired. This intangible asset will be amortised over 20 years.
2011 was devoted primarily to the integration of ECS Group.
In 2011, Econocom Group repaid in full the loan secured in 2010 for the acquisition of ECS Group (€182 million), thanks to a significant reduction in working capital in
28
MAnAgeMenT reporT on The finAnCiAl sTATeMenTs for the year ended 31 December 2011 presented to the Annual General Meeting of 15 May 2012
1. SCOPE OF CONSOLIDATIONIn 2011, Econocom Group made no major acquisitions and focused primarily on integrating ECS and its subsidiaries, which it acquired in October 2010.
In 2011, Econocom expanded its distribution business in Belgium by acquiring Systèmes & Supplies on 31 March 2011, a company specialising in selling products and solutions to the medical industry. The Group also acquired two sales agencies during the last quarter, DB2A Pays de Loire and DB2A Bretagne Normandie. These companies sell Econocom Location’s asset financing and asset management services in France.
Furthermore, as every year, the Group reorganised its internal legal structures in order to simplify and harmonise its operational and legal operations.
In December 2011, Econocom Nederland BV set up a wholly-owned subsidiary called Econocom Public BV, in order to address the specific operational needs of the Dutch public sector market.
After the year end, the Group acquired a controlling stake in Centix, thus enhancing its virtualisation offering in Belgium.
2. RESuLTS 2.1. Consolidated results
(in € millions) 2011 2010
Revenue from continuing operations 1,584.3 1,021.4
Recurring operating profit (before amortisation of the ECS customer portfolio)
66.6 47.5
Recurring operating profit 64.6 47.0
Operating profit 46.0 40.3
Net financial income/(expense) (11.9) 0.8
Profit before tax 34.1 41.1
Income tax (12.8) (12.3)
Profit for the year excluding non-controlling interests (before amortisation of the ECS customer portfolio)
22.8 29.1
Profit for the year excluding non-controlling interests
21.5 28.8
In accordance with prevailing legislation and the Company’s bylaws, we submit to you for approval our report on the Company’s operations and the financial statements for the year ended 31 December 2011, and the compensation report.

Management report on the financial statements
29
the fourth quarter of 2010, and the issue in May 2011 of €84 million of bonds convertible into new or existing shares.
Econocom Group posted revenue of €1,584.3 million in 2011, versus €1,021.4 million in 2010 (up 55%). The Group’s revenue has risen by 1% on a pro forma basis and by 5% on a like-for-like basis (excluding non-strategic activities which Econocom is progressively relinquishing).
The Group’s recurring operating profit (before amortisation of the ECS customer portfolio) stood at €66.6 million, compared with €47.5 million at 31 December 2010.
Operating profit amounted to €46.0 million (€51.7 million, before amortisation of the ECS customer portfolio and impairment of the goodwill of Alliance Support Services), versus €40.3 million in the previous year (€40.8 million before amortisation of the ECS customer portfolio). Non-recurring expenses recorded in 2011 amounted to €18.6 million and consisted mainly of the costs of the acquisition and subsequent integration of ECS Group, and the partial impairment of the goodwill of Alliance Support Services, acquired by the Group in 2007.
Net financial expense of €11.9 million includes €6.1 million of non-recurring financial expenses incurred due to the amortisation of costs from the acquisition loan arising from its early repayment, and ancillary expenses from the issue of convertible bonds in May.
Profit for the year stood at €21.5 million.
Econocom continued to strengthen its financial position in 2011.
The Group’s net cash position stood at €0.5 million at the end of 2011, one year ahead of schedule. The Group’s cash position therefore exceeds its financial debt, which amounted to €145 million and consisted of €80 million of bond debts and €34 million of lease contacts refinanced with recourse and considered as debt under IFRS. The implementation of a centralised cash management system at Econocom Finance contributed to effective cash flow management, optimised costs and financial investments, and a swift repayment of the Group’s debt.
2.2. Breakdown of revenue by industry sector and geographical area
Revenue for the Group’s different businesses was as follows:
(in € millions) 2011 2010
Services 223 151
Distribution 238 197
Leasing 1,080 636
Telecom 43 37
Total 1,584 1,021
The Group reported growth in revenue in its four main geographical areas:
2.2.1. Services (revenue of €223 million)
Services recorded €223 million in revenue in 2011, compared with €151 million in 2010.
On a like-for-like basis, outsourcing and technical assistance rose, driven by investments in France. Maintenance, consultancy and projects were affected by the downturn in IT investments, particularly in the second half. The reorganisation in 2011, combined with business investments, bodes well for business in 2012.
(in € millions) 2011 2010
France 731 556
Benelux 373 259
Southern Europe 288 159
Northern and Eastern Europe 192 47
Total 1,584 1,021

2.2.2. Distribution (revenue of €238 million)
This business posted €238 million in revenue, rising sharply (+21%) on 2010. This result is based on the assumption of a comparable scope of activity, as ECS Group had no equivalent business.
This growth, which is well above the market rate, is due mainly to the signing of multi-year contracts in Belgium and France, and the return on investments made in profitable sectors such as dedicated medical and multimedia solutions, multimedia offerings and the Everpad solution for business-to-business deployment and distribution of digital tablets.
2.2.3. Leasing (revenue of €1,080 million)
In 2011, Leasing recorded a sharp rise in revenue (+70%), due largely to the acquisition of ECS, which was consolidated throughout the whole of 2011, whereas it was only consolidated for one quarter in 2010. On a pro forma basis, revenue dipped slightly (-2%) as a result of the Group’s strategic decision to reduce the number of contracts refinanced with recourse and contracts with minor companies for former ECS companies. On a comparable basis, (excluding non-strategic activities), revenue was up 3% thanks to lively sales activity.
Moreover, Leasing accounts for the majority of enterprise solutions offered to our clients. The success of these combined business offers, which are central to Econocom’s strategy, was consolidated in 2011 with revenue increasing two-fold.
2.2.4. Telecom (revenue of €43 million)
Telecom reported growth of 16% in 2011, with revenue reaching €43 million for the year, compared with €37 million in 2010. This growth was purely organic, as ECS Group had no equivalent business.
All the areas of this business contributed to this performance. Econocom is the first French outsourcer with over 150,000 lines. The handset distribution and operator line sales businesses are both performing well and are essential for selling services. Lastly, the high levels of expertise and partnerships with Apple and Microsoft
have allowed the business to take full advantage of the tablet boom within companies.
2.3. 2011 individual financial statements of Econocom Group SA/NV
Econocom Group SA/NV, as the Group’s holding company, manages a portfolio of securities, receives dividends from its subsidiaries and oversees the Group’s development.
It also provides services to the Group’s subsidiaries in the areas of management, IT, cash guarantees, provision of staff, consulting, communication and marketing. These services are billed according to normal market terms.
The revenue stated hereafter refers to Econocom Group SA/NV’s non-consolidated financial statements, prepared in accordance with Belgian legislation.
2.3.1. Income statement of Econocom Group SA/NV
Sales of services (non-consolidated) for the year stood at €16.5 million compared with €14.7 million in the previous year.
Operating loss came out at €0.5 million compared with a loss of €6.6 million in 2010. 2010 was affected by the cost of acquiring ECS Group for €6.4 million.
Net financial income came to €71.7 million compared with income of €9.3 million in 2010. This consists mainly of the dividends received from subsidiaries, worth €83.1 million, €2.5 million of interest expense on the convertible bonds, and a €7.7 million reduction in the value of the Alliance Support Services current account.
Net non-recurring income amounted to €1.9 million, compared with income of €3.1 million in 2010. This includes capital gains of €2.0 million resulting from the lowering of the sale price of ECS securities in 2011 and the write-down in full of the shares in Econocom Expert International holding BV.
Net profit amounted to €73.2 million, compared with €5.7 million in 2010.
30

2.3.2. Balance sheet of Econocom Group SA/NV
As of 31 December 2011, the equity of Econocom Group SA/NV stood at €191.8 million, compared with €125.5 million as of 31 December 2010. The Board of Directors’ recommendation to the Annual General Meeting to raise the dividend to €0.40 will have an impact of €10.5 million on the company’s reserves.
The debt incurred in 2010 by Econocom Group for the acquisition of ECS Group was repaid in full in 2011, thanks to the considerable cash flow generated by the Group’s strong performance and optimised management of the cash flow of the former ECS Group.
In May 2011, Econocom Group issued €84 million worth of convertible bonds, which mature in June 2016. These bonds have a conversion price of €21, and pay a 4% coupon annually in arrears. In the event that all the bonds are converted, four million new shares would be issued, resulting in a 15.28% dilution of the company’s share capital. Econocom Group lent the net proceeds from this issue of convertible bonds (€82 million) to two of its subsidiaries so that they could repay loans they had secured for the acquisition of ECS.
As a result of these transactions, all the loans secured for the acquisition of ECS (a €132 million bank loan, €40 million equity bridge and €10 million of shareholders’ current account) were paid up in full.
2.3.3. Business overview
2.3.3.1. Movements on shares affecting investments
As every year, the Group reorganised its internal legal structures in order to simplify and harmonise its operational and legal operations, with the following results:
• In May 2011, Econocom Group SA/NV transferred debts it held with Econocom Managed Services SA/NV and Econocom Lease SA/NV (€14 million each) to Econocom Finance SNC, the Group’s funding company. In exchange, Econocom Group acquired a 19% stake in Econocom Finance SNC, of which Econocom Managed Services SA/NV holds a 40.5% stake and 40.5% of which is owned by Econocom Lease SA/NV.
• The securities of Econocom SAS, the Group’s French holding company, were reclassified on 6 December 2011. As a result, Econocom SAS is now wholly owned by Econocom Group SA/NV. Econocom Group SA/NV bought the Econocom SAS shares owned by Econocom Managed Services SA/NV (33%) and Econocom Financial Services International BV (44.4%).
2.3.3.2. Treasury shares
Econocom Group SA/NV has a share buyback programme, which allows it to:
• issue shares to avoid potential dilution of shareholders’ interests due to the exercise of options;
• pay for external growth transactions, if any;
• cancel shares acquired.
The Extraordinary General Meeting of 28 September 2011 renewed for a five-year period the authorisation given to the Board of Directors to buy back treasury shares. The minimum purchase price was set at €6, the maximum price was €36, and the maximum number of shares to be purchased throughout the five-year period was 5,234,579. Furthermore, in accordance with article 620 of the Belgian Companies Code (Code des sociétés), the par value of shares held by the company and any subsidiaries it controls directly cannot exceed 20% of the capital subscribed.
The Extraordinary General Meeting of 19 May 2009 renewed for a three-year period the authorisation given to the Board of Directors to purchase Econocom Group SA/NV shares without the prior approval of shareholders, if the company faces a serious and imminent threat to its operations.
In 2011, the following treasury share movements took place:
• Econocom acquired 590,893 shares for an acquisition price of €7.3 million.
• When the final acquisition price for ECS Group was set, Société Générale sold 890,000 shares to Econocom Group for the price of €12.6 million.
• Econocom issued 80,000 shares as part of the exercise of stock options.
In addition, the company maintained its liquidity contract with Exane BNP Paribas with respect to the Econocom Group share.
Management report on the financial statements
31

As of 31 December 2011, Econocom Group SA/NV held 1,520,893 treasury shares, as part of the share buy back programme, and 60,039 Econocom Group shares, as part of its liquidity agreement with Exane, representing a total of 1,580,932 shares or 6.04% of the total number of shares in issue.
The voting rights associated with the shares held by the company have been suspended. The dividends on the shares held by the company when they were granted by the General Meeting have been cancelled.
Econocom Group SA/NV’s distributable reserves (non-consolidated data), stand at €75.4 million.
Econocom Group SA/NV’s non-distributable reserves have increased by €19.3 million (non-consolidated data) to €21.2 million.
2.3.3.3. Share capital
As of 31 December 2011, the share capital of Econocom Group SA/NV was made up of 26,172,897 shares with no stated par value.
In 2011, Econocom Group SA/NV issued €84 million worth of convertible bonds, €3.3 million of which were added to equity as paid-in capital, in compliance with Belgian law. The bonds were invested with qualified investors following an accelerated bookbuilding procedure. They
were issued at 100% of their par value, or €21 per bond, with a 4% coupon rate, paid annually in arrears. In the event that all the bonds are converted, four million new shares will be issued, resulting in a 15.28% dilution of the company’s share capital.
As of 31 December 2011, authorised unissued capital stood at €15,285,166.46. The Board of Directors decided, subject to the condition precedent that the convertible bonds be converted as of 1 June 2016, to increase within the authorised capital, the subscribed and paid-up share capital for a maximum amount of the equivalent of the conversion of all the convertible bonds into new shares, i.e. €2,610,000. The Board of Directors reserved the right, when it receives a conversion request from a bondholder, to issue the existing ordinary shares.
The changes in share capital between 2002 and 2010 consisted of a capital increase as part of the exercising of stock options by the Group’s employees, and the capital increase of €895,755.62 on 28 October 2010 reserved for SG Financial Services holding for the acquisition of ECS Group.
The share capital underwent no changes in 2011 and stood at €17,076,677.70 as of 31 December 2011.
The ownership structure is described in chapter 5 “Corporate governance statement”.
32

3. RISK FACTORSDue to the nature of its business, Econocom Group SA/NV is exposed to certain financial and legal risks. A complete review of the Group’s risk exposure and management strategy is provided by type of risk in the notes to the consolidated financial statements.
In view of its business model, Econocom Group SA/NV is not significantly exposed to exchange-rate, interest-rate or environmental risks.
The Group’s dependency on clients is limited. It is exposed to the risk of doubtful accounts, but this is limited by factoring solutions and the refinancing of lease contracts on a non-recourse basis.
The Group does not have a high liquidity risk as it has a net cash surplus.
Furthermore, Econocom Group SA/NV is exposed to the risk of termination of service contracts, as a large majority of the Group’s employees have permanent contracts. however, the contracts are mostly signed for longer than one year and include reciprocal notice periods.
The Group does not have any specific employee-related risks. The vast majority of its staff is employed in France and the Benelux countries.
The IT services market is extremely competitive, and has been for a long time. Econocom Group SA/NV is therefore accustomed to having to change and innovate in order to maintain and expand its client base.
Lastly, due to the progress of the integration of ECS Group and of Econocom’s restructuring of the debt from the loan for the acquisition during the first half of 2011, resulting in the waiving of the financial covenants associated with the acquisition loan, Econocom Group is no longer exposed to the specific risks associated with integrating ECS Group, which it acquired in October 2010.
4. OuTLOOK FOR 2012 AND DIVIDENDS IN 2011 The successful integration of ECS Group and record operational results posted by the Group in 2011, combined with its strong financial position, mean that Econocom has the resources to continue its profitable mixed growth strategy.
In 2012, the Group’s Management foresees another year of value creation and is aiming for a slight increase in revenue, recurring operating profit in excess of €70 million, and net earnings per share of approximately €2.
At the Annual General Meeting, the Econocom Board of Directors will invite shareholders to vote for the payment of a gross dividend of €0.40 per share, up 14% on 2010.
5. CORPORATE GOVERNANCE STATEMENT
5.1. Applicable corporate governance code
Econocom Group confirms that it adheres to the principles of the Belgian Corporate Governance Code which came into force in 2009, or the 2009 Code. This is available on www.corporategovernancecommittee.be. Econocom publishes its Corporate Governance charter on its website: www.econocom.com, (in French only), under Financial Information/Legal Information/Corporate Governance.
5.2. Exemptions from the 2009 Code
Econocom Group applies the recommendations of the 2009 Code, except for those which the Board has deemed ill-suited to Econocom Group’s size, or that it intends to implement over the long term. The principles which Econocom Group SA/NV does not yet adhere to, in whole or in part, are described below.
The Group currently only partially applies the recommendations of Principle 1 of the 2009 Code.
Management report on the financial statements
33

34
For reasons relating to Econocom Group SA/NV’s ownership structure, Jean-Louis Bouchard performs the duties of Chairman of the Board, Chief Executive Officer and Chairman of the Executive Committee(1). As such, the Group does not fully adhere to the principle of segregating the Board of Directors’ powers of control and executive powers. As of 31 December 2011, Jean-Louis Bouchard indirectly held 49.10% of Econocom Group SA/NV’s capital and as a result exercises control.
The reference framework for internal control and risk management will be prepared and submitted to the Board of Directors for approval during 2012. In light of the integration of ECS Group and the resulting changes to the organisation during 2011, the Group has decided to handle this project in 2012.
Econocom Group SA/NV complies with Principle 2 of the Belgian Corporate Governance Code, which recommends that at least half of the members of the Board of Directors should be non-executive. As of 31 December 2011, the Board of Directors had six non-executive directors out of eleven.
however, the Board has not appointed a Secretary to report to it on compliance with the applicable procedures and rules. This role is nevertheless informally fulfilled by Galliane Touze, the Group’s Company Secretary.
On 5 December 2011, the shareholders appointed three new Directors. As a result, the Board of Directors now includes two female directors, Véronique di Benedetto and Chantal De Vrieze. To date, Econocom Group does not have a Board of Directors of which at least a third of the members are of a different gender, as stipulated in article 518 bis of the Belgian Companies Code. In accordance with paragraph 3 of article 518 bis, Econocom Group has six years to comply with this requirement (i.e. until the end of 2017).
In order to comply with the recommendations in Principle 3 of the Belgian Corporate Governance Code, Econocom Group SA/NV drew up and implemented a
procedure relating to transactions and other contractual relations between the companies making up the Econocom Group and its directors and senior managers.
The Board of Directors has not drafted specific procedures on insider trading but keeps an updated list of insiders; these people have been formally notified of the law regarding market malpractices.
Econocom Group SA/NV does not currently apply the recommendations in Principle 4 of the Belgian Corporate Governance Code, which state that the Board should draw up nomination procedures and selection criteria for Board members and that a “Nomination Committee” should recommend suitable directorship candidates. This principle also recommends a periodic assessment of each director and of the Board of Directors, in accordance with procedures set by the Board.
To date, the Board of Directors has not set up a Nomination Committee or any formal procedures for nominating members of the Board of Directors and the Executive Committee. Management considers that this recommendation of the Code is not suitable for the Econocom Group in view of its size.
Although the Group has no specific formal procedures for assessing the Board of Directors, its members and its Committees, such assessments take place on a continuous basis.
In 2011, the Board of Directors set up a Compensation Committee, consisting of three non-executive directors, one of whom is an independent board member. The composition of the Compensation Committee, like that of the Audit Committee, will have to change so that at least 50% of its members are independent.
The Chairman of the Board of Directors does not systematically attend Annual General Meetings as recommended by Principle 8 of the Code, but he ensures that the Board of Directors is always represented by at least one Chief Executive Officer.
(1) The Executive Committee is the Management Board as defined by article 54 bis of the Belgian Companies Code.

Management report on the financial statements
35
5.3. Description of internal monitoring and risk management procedures in the context of the company’s processes and financial information
The financial information communicated by the Group refers to the Group’s consolidated financial statements and to aspects of managing financial statements published in compliance with IFRS as adopted by the European union and approved by the Board of Directors.
This financial information is, at every reporting date, presented to the Group’s Audit Committee, and explained to all the directors.
5.3.1. Financial organisation
The Group’s financial organisation is both local and global. The Group is made up of various businesses and countries, and the financial processes are implemented by finance teams, finance directors and financial controllers in each entity, all of whom report to the Group Chief Financial Officer. The Business Finance Directors ensure that the reporting rules and practices are applied consistently across the business line, irrespective of the country.
The Group’s cash is now managed centrally by Econocom Finance, overseen by a Group Treasurer who reports to the Group’s Finance Department.
Furthermore, in the interests of maintaining their independence from the operational teams, the finance teams report hierarchically to the Group’s Finance Department.
5.3.2. Reporting and consolidation coordination
The accounts are consolidated by a dedicated team on a quarterly basis. The consolidated companies send, via the consolidation tool, their detailed financial statements which are subsequently included in the consolidated financial statements.
Each entity (i.e. company or Business unit) draws up a budget before the beginning of the year. Profit forecasts are adjusted several times during the year and are monitored on a monthly basis based on the activity reports provided by Management. These reports are
drafted jointly by the entity’s financial manager and controller.
In addition, cash flow forecasts are made every two weeks by the financial controllers of the main subsidiaries and consolidated centrally by the Treasury department. The Group also has a cash pooling team within Econocom Finance in order to oversee better cash flow management and optimise the Group’s financial costs and investments.
The Group’s Finance Department draws up schedules and specific instructions for the various budgets, reports and the items needed for the purpose of consolidation.
5.3.3. Accounting standards
The Group’s accounting principles are set out in an accounting principles manual which is used as the basis for preparing financial information. This manual can be consulted via the IT system by all the account teams and describes the method for recording transactions and presenting financial information.
The team in charge of consolidation is also responsible for keeping abreast of changes to IFRS. As such, the team, in conjunction with the Group Finance Department and the business Finance Directors, decides which changes in Group accounting principles should be implemented, informs the relevant people and arranges training accordingly.
5.3.4. IT tools
As a result of the recent acquisition of ECS Group, the IT systems used by the Group for preparing financial information are currently being harmonised and aligned.
5.3.5. Risk factors, surveillance and monitoring
The monthly reports enable the various operational and financial managers and the Group’s Management to verify that the Group’s results are accurate and consistent with the targets set. These reports contain a comparison between the management data and the Group’s consolidated financial statements in order to ensure that the financial information is reliable.

36
The Group’s Internal Audit department is in charge of risk management, and is in charge inter alia of drawing up a risk map. It also reviews the subsidiaries’ financial statements in order to ensure that they comply with Group rules and verify that the reporting is accurate and that risks are already covered.
The Group has internal auditors who report to the Chief Financial Officer and an Internal Audit Director who reports to the Company Secretary.
5.3.5.1. Risks associated with IT accounting systems
The accounting systems used by the Group are currently organised by business line (Leasing, Services and Distribution). Due to the acquisition of ECS, which has a unified IT system, a plan to harmonise the various IT systems is underway.
The various business IT systems are interfaced with the accounting systems in order to ensure that the information is traceable, exhaustive and reliable.
The consolidation system is a standard tool. The accounting systems are either compatible market accounting systems or long standing internally-developed systems which allow for any necessary changes to the settings and system maintenance.
5.3.5.2. Risks associated with accounting standards
The consolidation department, in conjunction with the Group Finance Department and the Business Finance Departments, monitors changes in IFRS and adapts the Group’s accounting principles accordingly. It also organises training for finance staff whenever necessary.
5.3.5.3. Main transaction control procedures
In order to ensure the reliability of the financial information on transactions, Management Control verifies each month that the revenue and costs reported are in line with the flows expected at the time the transactions were approved.
The Finance Department draws up regular statistical analyses to ensure that the assumptions made when the lease contracts were recorded are conservative and appropriate.
The subsidiaries’ finance teams also carry out monthly verifications for each business line.
5.3.6. Preparation of financial information
The financial information is prepared under the supervision and responsibility of the Board of Directors which, since 2004, has had an Audit Committee, the role of which is set forth in chapter 5.5.3 below.
5.4. Share capital and share ownership
As of 31 December 2011, Econocom Group SA/NV’s share capital consisted of 26,172,897 shares, held as indicated below:
ownership structure 31 dec. 2011
Companies controlled by
Jean-Louis Bouchard49.10%
Bestinver Gestion 12.45%
Société Générale Financial Services holding 7.02%
Valgest V. Wajs 4.60%
Treasury stock 6.04%
Public shareholders 20.79%
Total 100.00%
There are no shareholders with special controlling rights.
Other than the treasury stock which has no voting rights, there are no other particular legal or statutory restrictions with respect to voting rights.
In 2011, Econocom Group SA/NV issued €84 million worth of convertible bonds, the main characteristics of which are described above in chapter 2.3.3.3 above.

Management report on the financial statements
37
5.5. Composition and function of the administrative bodies and committees
5.5.1. Composition of the Board of Directors
Jean-Louis Bouchard, (term of office expiring at the May 2016 Annual General Meeting) 38, avenue Gabriel 75008 Paris (France) Chairman of the Board of Directors and Chief Executive Officer of Econocom Group SA/NV, Chairman of Econocom International NV
Jean-Philippe Roesch, (term of office expiring at the May 2014 Annual General Meeting) 21, avenue de la Criolla 92150 Suresnes (France) Chief Executive Officer of Econocom Group SA/NV
Bruno Lemaistre, (term of office expiring at the May 2014 Annual General Meeting) Avenue des Éperons d’Or 15, 1050 Brussels (Belgium) Chief Executive Officer of Econocom Group SA/NV
Véronique di Benedetto, (term of office expiring at the May 2017 Annual General Meeting) 86, rue Miromesnil 75008 Paris (France) Executive director of Econocom Group SA/NV
Chantal De Vrieze, (term of office expiring at the May 2017 Annual General Meeting) Drève du Mereault, 241410 Waterloo (Belgium) Executive director of Econocom Group SA/NV
Robert Bouchard, (term of office expiring at the May 2015 Annual General Meeting) 1 bis, rue Clément Marot 75008 Paris (France) Non-executive director of Econocom Group SA/NV
Christian Bret, (term of office expiring at the May 2016 Annual General Meeting) 7, rue Pérignon 75015 Paris (France) Independent director of Econocom Group SA/NV
Charles de Water, (term of office expiring at the May 2017 Annual General Meeting) Korte Veersteeg, 4D 4157 GR Enspijk (Netherlands) Non-executive director of Econocom Group SA/NV and director of Econocom International NV
Gaspard Dürrleman, (term of office expiring at the May 2017 Annual General Meeting) 50, avenue Bosquet 75007 Paris (France) Non-executive director of Econocom Group SA/NV
Rafi Kouyoumdjian, (term of office expiring at the May 2013 Annual General Meeting) 25, rue de Lubeck 75016 Paris (France) Non-executive director of Econocom Group SA/NV
Jean Mounet, (term of office expiring at the May 2017 Annual General Meeting) 60, quai du Parc 94100 Saint-Maur-des-Fossés (France) Independent director of Econocom Group SA/NV
Five of the members of the Board of Directors held executive roles in 2011: Jean-Louis Bouchard, Jean-Philippe Roesch, Bruno Lemaistre, Véronique di Benedetto, and Chantal De Vrieze (appointed on 5 December 2011). Gaspard Dürrleman, Rafi Kouyoumdjian, Charles de Water and Robert Bouchard are non-executive directors. Christian Bret and Jean Mounet (appointed on 5 December 2011), are independent directors, as defined by article 526 ter of the Belgian Companies Code.
The Chairman of the Board of directors has controlling interests in a number of companies outside Econocom Group and serves as director or Chairman within them.
Jean-Philippe Roesch and Bruno Lemaistre do not serve on any other boards outside those of Econocom Group SA/NV and its subsidiaries.
Véronique di Benedetto serves on the boards of a number of associations, including the Syntec Numérique (French professional federation of members of the digital industry).
Chantal De Vrieze also serves on the boards of a number of associations, including the Belgian Fédération des Entreprises.

Charles de Water is a director of Econocom International NV, a member of the Supervisory Board of Rabobank West-Betuwe, Partner at Zuijdplas Beleggingen, a member of the Supervisory Board of Khondrion Mitochondrial Scientific Services BV, and Chairman of Kaacel BV.
Christian Bret is Managing Partner of Eulis.
Gaspard Dürrleman is Chairman of Montmorency Investissements, the Etablissements Cambour and the Ateliers Montdor.
Robert Bouchard serves as Chairman of APL France, and manager of SCI Maillot Pergolèse, SCI Taillis des Aigles, GMPC and Carmine SARL.
Rafi Kouyoumdjian is Chief Executive Officer of RKO Management and Investment BV and director of ITO33.
Jean Mounet is director of Pacte PME and the Fondation Télécom.
Aside from the length of the term of office (six years or more) and the renewable nature of the term of office, the bylaws do not stipulate any specific rules with respect to the appointment of directors or the renewing of their term of office, nor do they stipulate any age limit for Board membership.
5.5.2. Role of the Board of Directors
The Board of Directors meets as often as it deems necessary.
In 2011 the Board met on six occasions, including two meetings to approve the interim and annual financial statements. The overall attendance rate for the year was 82.10%.
The Board of Directors is responsible for approving the Company’s overall strategy proposed by the Chairman, authorising significant projects and ensuring that there are adequate resources to attain the Group’s objectives. It is entrusted with decision-making outside the scope of day-to-day management.
The Group’s operational management is entrusted to the Chief Executive Officers and the Executive Committee, (management board as defined in article 524 bis of the Belgian Companies Code and article 20 bis of the bylaws). The Board appoints the members of the Executive
Committee, as well as the Chief Executive Officer(s). It also oversees the quality of the management duties performed and ensures that they are consistent with the Group’s strategic objectives. To that end, it receives information every quarter including the budget and revisions thereto, a consolidated summary of the quarterly report and any other information it deems useful.
The Board is validly constituted only if at least half of its members are present or represented. A director may represent one or more other members of the Board. Decisions are adopted on the basis of a majority of votes. In the event of a split decision, the person chairing the meeting has the deciding vote. In exceptional circumstances, when urgency and the best interests of the Company so dictate, decisions may be adopted pursuant to the unanimous consent of the directors, expressed in writing. however, this procedure may not apply in relation to approving the annual financial statements and the issuance of authorised capital.
5.5.3. Committees set up by the Board of Directors
Pursuant to the bylaws, as amended by the Extraordinary General Meeting on 22 February 2000, the Board of Directors is authorised to set up specific committees and to determine their tasks and operating rules.
5.5.3.1. The Executive Committee (management board as defined in article 524 bis of the Belgian Companies Code)
The Board of Directors used this authorisation to set up a Group Executive Committee, whose creation was ratified by shareholders at the Extraordinary General Meeting on 18 May 2004.
The role of this Committee is to recommend strategic guidelines for the Group, implement the strategy chosen by the Chairman and approved by the Board of Directors, manage the Group’s operational departments and monitor their financial and operational performance.
The Executive Committee was reviewed at the Board Meetings on 16 March and 26 May 2011. It is chaired by Jean-Louis Bouchard, and its members include Bruno Lemaistre and Jean-Philippe Roesch, Group Managing Directors, and Véronique di Benedetto, Group Deputy Managing Director. Galliane Touze, Company Secretary,
38

also attends Executive Committee meetings, which take place at least ten times a year.
Jean-Louis Bouchard is in charge of strategy, communication and mergers/acquisitions. Bruno Lemaistre is in charge of the operational departments, whilst Jean-Philippe Roesch oversees the Group’s central corporate functions. Véronique di Benedetto is in charge of the Group’s operations in France.
Three of the Executive Committee members are Chief Executive Officers. Jean-Philippe Roesch was appointed Chief Executive Officer at the Annual General Meeting on 3 July 2006 and Bruno Lemaistre at the Annual General Meeting on 20 November 2008, effective as of 22 December 2008, when his appointment as director by the shareholders became effective.
5.5.3.2. The Compensation Committee
On 31 August 2011, the Board of Directors set up a Compensation Committee.
The role of the Compensation Committee is to advise and assist the Board of Directors with respect to its compensation policy and it is in charge of implementing plans for granting financial instruments (free shares, stock options, etc). It drafts the compensation report, in accordance with article 96 section 3 of the Belgian Companies Code, which is subsequently added to the corporate governance statement. One of its members will comment on the report during the Ordinary General Shareholders’ Meeting.
The Board of Directors has also granted the Compensation Committee, in accordance with article 20 of the bylaws, decision-making powers on behalf of the Board of Directors with respect to stock option plans or any other plans for granting financial instruments. In this respect, the Compensation Committee replaces the Stock Option Committee set up in February 2003.
The Committee has three members, Christian Bret, Gaspard Dürrleman and Rafi Kouyoumdjian, who were appointed for a three-year term which cannot exceed the length of their term as directors.
5.5.3.3. The Audit Committee
The Audit Committee was created by the Board of Directors on 18 May 2004.
The Committee comprises two non-executive directors, Gaspard Dürrleman and Rafi Kouyoumdjian, and one independent director, Christian Bret.
The Audit Committee meets as often as required; it met three times in 2011, with all Committee members in attendance, as well as Jean-Philippe Roesch, Chief Executive Officer, the Group Chief Financial Officer, and the head of Internal Audit. The members of the Audit Committee invite the Statutory Auditor as required by the agenda.
The Audit Committee is responsible for helping the Board of Directors perform its duty of controlling the Econocom Group’s operations. In particular, it examines the quality and relevance of internal and external audit engagements, monitors internal control and risk management procedures, ensures that the accounting methods used are appropriate, and that the Group’s financial data are complete and accurate.
Article 96 of the Belgian Companies Code stipulates that companies must prove the independence and audit and accounting expertise of at least one of the members of the Audit Committee. Econocom complies with this requirement.
5.5.4. Day-to-day management
The Executive Committee is in charge of day-to-day management of the Group; it is kept informed of the monthly results and oversees progress on the Group projects.
All major decisions regarding the subsidiaries are made by the relevant body, with the assent of a member of the Executive Committee in charge of the issue or activity in question. The subsidiaries generally do not have any major decision-making powers other than those concerning day-to-day management. The powers of the Group’s subsidiaries’ managers and the limits to these powers are set forth in an internal document.
5.5.5. Application of articles 523 and 524 of the Belgian Companies Code
The Compensation Committee met on 13 December 2011 and approved the granting of stock options to three Directors: Véronique di Benedetto, Bruno Lemaistre and Jean-Philippe Roesch.
Management report on the financial statements
39

40
5.7.1. Compensation policy for Directors and members of the Executive Committee
5.7.1.1. Procedure adopted in 2011 to define compensation for Directors and members of the Executive Committee and set their individual compensation
On 31 August 2011, the Board of Directors set up a Compensation Committee.
The role of the Compensation Committee is to advise and assist the Board of Directors with respect to its compensation policy and it is in charge of implementing plans for granting financial instruments (free shares, stock options, etc).
More specifically, the Compensation Committee is in charge of:
1°) upon recommendations of the Chairman:
a) Making suggestions and recommendations to the Board of directors with respect to the policy for compensating directors and members of the Executive Committee and, if required by law, any resulting recommendations which the Board of Directors must submit to the shareholders for approval.
b) Making suggestions and recommendations to the Board of directors with respect to the individual compensation of directors and members of the Executive Committee, including the variable part and long-term bonuses (long-term share ownership) granted as stock options or other financial instruments, termination benefits and, if required by law, any resulting recommendations which the Board of Directors must submit to the shareholders for approval.
c) Making suggestions and recommendations to the Board of directors with respect to setting and assessing performance targets linked to the directors’ and Executive Committee members’ individual compensation.
2°) Drafting the compensation report, in accordance with article 96 section 3 of the Belgian Companies Code, which is subsequently added to the corporate governance statement.
These three directors are not members of the Compensation Committee, but, this Committee is composed of directors and is under the authority of the Board of Directors. As such, its decisions are governed by article 523 of the Belgian Companies Code. Consequently, it should be noted that the three above-mentioned people are subject to a conflict of interests within the meaning of article 523 of the Belgian Companies Code (a conflict which these three directors have already brought to the Committee’s attention).
The exercise price, in accordance with the law, will be the average price thirty calendar days before the date of this meeting: €12.25, and these stock options may be exercised a maximum of two times as from 13 December 2015 and until 31 December 2016. These conditions comply with standard market practice.
This decision, and the number of stock options, are justified by the crucial role played by Bruno Lemaistre, Jean-Philippe Roesch and Véronique di Benedetto within Econocom Group, and by their considerable responsibilities.
5.6. Composition of advisory bodies
PricewaterhouseCoopers Reviseurs d’Entreprises SCCRL (term of office expiring at the May 2013 Annual General Meeting) Statutory Auditor of Econocom Group SA/NV, represented by Josy Steenwinckel or Emmanuèle Attout Woluwe Garden, Woluwedal, 18 1932 Sint-Stevens-Woluwe (Belgium).
5.7. 2011 Compensation report
The compensation report was drafted by the Compensation Committee and approved by the Board of Directors when it met on 7 March 2012. It will be put to the vote at the Ordinary Annual General Meeting on 15 May 2012.
This rapport was drafted in accordance with the provisions of articles 526 quater and 96 section 3 of the Belgian Companies Code. Its purpose is to describe in detail the policy for compensating directors (in charge of day-to-day management, executive and non-executive), as well as members of the Executive Committee of Econocom Group (management committee as defined in article 554 bis of the Belgian Companies Code).

Management report on the financial statements
41
Non-executive directors do not receive any payment other than the above-described attendance fees.
At the Extraordinary General Meeting on 28 September 2011, the Board of Directors was granted exemption from articles 520 ter, paragraph 2 of the Belgian Companies Code pertaining to the rules governing the distribution of the variable part of compensation. The variable portion of compensation paid to executive directors and Executive Committee members was set in 2011 based on annual performance, including compensation for which the variable portion is greater than one quarter of total compensation.
As the Compensation Committee was set up on 31 August 2011, compensation for members of the Executive Committee and Chantal De Vrieze in 2011 were set by the Chairman and the Chief Executive Officer in charge of the activity of the person concerned.
The Compensation Committee met on 5 March 2012 for the purpose of drafting the 2011 compensation report, in accordance with article 96 section 3 of the Belgian Companies Code, and reviewing the compensation policy for 2012 and 2013.
The compensation policy for 2012, as decided by the Board of Directors during its meeting on 7 March 2012 after consulting the Compensation Committee, is consistent with the policy for 2011. Variable compensation paid to executive directors and members of the Executive Committee is subject to the achievement of objectives, both quality- and quantity-based, over the year, within the scope of each director’s responsibility. 2013 will be the first year of the new strategic plan which is due to be announced at the end of 2012. The Group’s strategic guidelines and objectives will be determined during the second half. Consequently, the basis for compensation for members of the Executive Committee and executive directors in 2013 has not yet been discussed.
The Board of Directors did not deem it necessary, given the reliability of the Group’s financial information, to implement a system for retrieving variable compensation granted on the basis of incorrect financial information.
3°) Commenting on the report during the Ordinary General Shareholders’ Meeting.
4°) Submitting to the Board of Directors recommendations with respect to the procedure and conditions concerning the directors’ and Executive Committee members’ employment contracts.
5°) Generally fulfilling all the tasks assigned by the Board of Directors with respect to compensation.
The Board of Directors has also granted the Compensation Committee, in accordance with article 20 of the bylaws, decision-making powers on behalf of the Board of Directors with respect to stock option plans or any other plans for granting financial instruments such as warrants, existing or future plans, i.e. issuing stock options or any other financial instruments within the limits authorised by the Board of Directors, to whom the Compensation Board is accountable.
Lastly, the Board of Directors also decided to ask the Ordinary General Shareholders’ Meeting to grant it exemption, for a given time period, (2011 and 2012), from articles 520 ter, paragraph 2 of the Belgian Companies Code pertaining to the rules governing the distribution of the variable part of compensation to directors, members of the Executive Committee, Chief Executive Officers and “other directors” (as defined by the Belgian Companies Code).
At the Extraordinary General Meeting on 28 September 2011, the Board of Directors was granted exemption from the abovementioned rules for 2011 and 2012.
5.7.1.2. 2011 compensation policy
Since 1999, the bylaws have provided for the compensation of offices held. The Annual General Meeting of 18 May 2004 set the attendance fees of directors at €2,500 per director per Board meeting, subject to actual attendance at the meetings.
Executive directors receive no compensation for their directorship. They are compensated for the contractual relationship with one or several Group companies.
Non-executive directors who are members of the Audit Committee receive €1,000 per meeting, subject to actual attendance. Members of the Compensation Committee receive €2,000 per meeting, subject to actual attendance.

42
5.7.2.3. Total compensation paid to executive directors and members of the Executive Committee in 2011(2)
This chapter shows the overall amount of compensation and benefits paid directly or indirectly to executive directors by Econocom Group SA/NV or any of the Group’s other companies in 2011.
5.7.2. Compensation paid in 2011
5.7.2.1. Non-executive directors
This chapter sets forth the individual compensation and benefits paid directly or indirectly to non-executive directors by Econocom Group SA/NV or any of the Group’s other companies in 2011.
Christian Bret €17,500
Robert Bouchard €15,000
Gaspard Dürrleman €19,500
Charles de Water €15,000
Rafi Kouyoumdjian €22,000
Jean Mounet (1) -
Total €89,000
(1) Began term of office on 5 December 2011
Fixed portion €1,489,909
Variable portion €1,879,845
Pension -
Other, including benefits in kind €127,836
Total €3,497,590
(1) All the Group’s companies are consolidated. (2) Including social security charges.(3) Including members of the Executive Committee and Chantal De Vrieze.
The information in this chapter refers to the executive members of the Board of Directors and members of the Executive Committee, i.e. Jean-Louis Bouchard, Bruno Lemaistre, Jean-Philippe Roesch, Véronique di Benedetto and Chantal de Vrieze.
Two of the four executive directors have a company car but do not receive any other kind of compensation.
The variable compensation of the executive directors(3) are linked to (i) the pre-tax earnings of the entities under their control, (ii) the pre-tax consolidated income or loss of Econocom Group, (iii) savings goals, and lastly (iv) qualitative and measurable objectives. With the exception of the qualitative objectives, the objectives consist of the results mentioned in either the Group’s management report or the audited consolidated financial statements. These objectives are assessed for the calendar year.
Like all the other Econocom Group employees, the members of the Executive Committee are assessed throughout the year by their manager and during an annual appraisal held at the beginning of the following year.
5.7.2.2. Compensation paid to the Chairman of the Board of Directors and the Executive Committee
Jean-Louis Bouchard performs the duties of Chairman of the Board, Chief Executive Officer, and Chairman of the Group’s Executive Committee. he receives no compensation whatsoever, and does not benefit from any special pension or insurance, either directly or indirectly, from either Econocom Group SA/NV or any companies in the scope of consolidation(1) for these duties. Econocom International NV – whose Chairman is Jean-Louis Bouchard – bills fees to Econocom Group SA/NV and its subsidiaries for managing and coordinating the Group. These fees amounted to €2,099,000 in 2011, compared with €1,199,000 in 2010. The amount of services performed by Jean-Louis Bouchard has increased as a result of the growth in the size of Econocom following the acquisition of ECS Group.
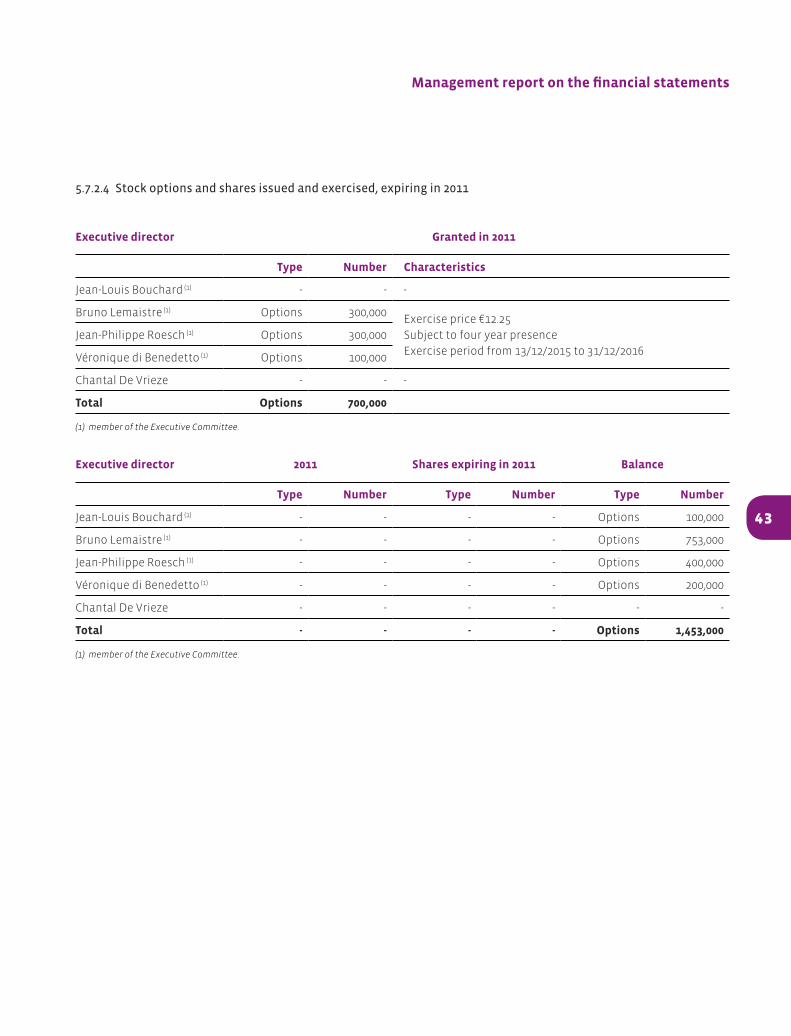
Management report on the financial statements
43
5.7.2.4 Stock options and shares issued and exercised, expiring in 2011
executive director granted in 2011
Type number Characteristics
Jean-Louis Bouchard (1) - - -
Bruno Lemaistre (1) Options 300,000Exercise price €12.25
Subject to four year presence
Exercise period from 13/12/2015 to 31/12/2016
Jean-Philippe Roesch (1) Options 300,000
Véronique di Benedetto (1) Options 100,000
Chantal De Vrieze - - -
Total options 700,000
(1) member of the Executive Committee.
executive director 2011 shares expiring in 2011 Balance
Type number Type number Type number
Jean-Louis Bouchard (1) - - - - Options 100,000
Bruno Lemaistre (1) - - - - Options 753,000
Jean-Philippe Roesch (1) - - - - Options 400,000
Véronique di Benedetto (1) - - - - Options 200,000
Chantal De Vrieze - - - - - -
Total - - - - options 1,453,000
(1) member of the Executive Committee.

44
a notice from Econocom International NV, which is controlled by Jean-Louis Bouchard, indicating that as of 1 September 2007, Econocom International NV held 12,857,760 Econocom Group shares, representing 47.97% of the capital.
As of 31 December 2011, Jean-Louis Bouchard directly and indirectly held 12,849,864 Econocom Group SA/NV shares, representing 49.10% of the capital. Jean-Louis Bouchard is the only shareholder who controls more than 30% of the Group and does not need to launch a takeover bid as he acquired his 30% interest prior to 1 September 2007, and duly carried out all the legally-required disclosures and publications about his interests.
On 20 May 2011 Econocom Group received notification from Société Générale S.A. stating that the 10% threshold of voting rights had not been reached and that, on 16 May 2011, it held 1,845,958 Econocom Group shares, i.e. 7.05% of the shares carrying voting rights and share capital. As far as Econocom is aware, Société Générale owned 1,837,273 shares as of 31 December 2011, i.e. 7.02% of the capital.
The company was also informed that Bestinver Gestion S.A. SGIIC held more than 5% of the capital. As of 31 December 2011, Bestinver Gestion held 3,259,181 Econocom Group shares, i.e. 12.45% of the capital.
Furthermore, on 17 November 2011, Econocom Group exceeded 5% of the shares and voting rights following the acquisitions of Econocom Group shares under its share buyback programme.
Relations with the majority shareholder, Econocom International NV, correspond to loans granted or received and the provision of standard services on arm’s-length terms.
5.7.2.5. Termination benefits and other contractual obligations
The employment contracts of the executive directors contain no specific clause with respect to pensions or termination benefits, except for two of them.
Jean-Philippe Roesch has a termination benefit of one month’s salary for each year of service. This contractual obligation is fully accrued in the accounts.
Véronique di Benedetto has a termination benefit of (i) twice the last twelve months’ fixed salary plus (ii) twice the annual average of the last 24 months of variable compensation in the event of dismissal (excluding gross negligence or misconduct) or termination by amicable mutual agreement occurring before 1 November 2012.
5.8. Appropriation of net profit and dividend policy
The Group’s sound financial position means that the Board of Directors was able to further increase the amount of the dividend.
The gross dividend per share proposed to the General Meeting of 15 May 2012 was €0.40 (€10,469,158 for 26,172,897 shares), up by 14% over the dividends paid in 2011 for 2010. This compensation represents a pay¬out of 41.6%.
5.9. Relations with major shareholders
The transparency-related disclosures made to the Company designate Econocom International NV as the majority shareholder.
In accordance with Article 74 section 6 of the Belgian law of 1 April 2007 on takeover bids, on 4 December 2007, Econocom Group SA/NV received

Management report on the financial statements
45
5.10. Employee share ownership
Since November 1997, Econocom Group SA/NV and various subsidiaries and sub-subsidiaries have set up several stock option plans for their employees, managers and executives. An updated summary of the Group’s related commitments as of 31 December 2011 is provided below.
number of outstanding
optionsexpiration date exercise price (in €)
2008 10,000 April 2013 7.70
2010353,000 August 2015 10.97
550,000 December 2014 9.91
201130,000 December 2015 12.93
790,000 December 2016 12.25
Total 1,733,000
These plans cover Econocom Group SA/NV shares listed on the futures market of the Brussels stock exchange. upon the exercise of options, Econocom Group SA/NV may either transfer existing shares or issue new shares by way of a capital increase.
The options are granted with a view to involving employees, managers and executives more closely in the Group’s operations and business development.
Part of the options is contingent on their beneficiaries achieving individual performance goals.
Options are granted under contracts signed between Econocom Group SA/NV and the beneficiary.
At its meeting on 25 January 2000, the Board of Directors approved the text of the option contracts. In application of Article 523 of the Belgian Companies Code, three directors who were – or could become – option beneficiaries abstained from voting.
The text of the standard stock option contract was amended to take into account the changes in legislation. This amendment was approved by the Stock Option Committee, (now called the Compensation Committee), on 8 December 2010.
The exercise price is set in accordance with Article 43 of the Belgian law dated 26 March 1999, and corresponds to the average price quoted for the Econocom Group SA/NV share over the thirty days preceding the grant date.
The options may not be transferred and Econocom Group SA/NV does not hedge its exposure to changes in the share price.
In 2011, 80,000 stock options were exercised, 100,000 were forfeited and 820,000 new options were granted.
In relation to the stock options exercised, the Board of Directors transferred 80,000 existing shares held in treasury and did not issue any new shares.
As of 31 December 2011, 1,733,000 options (representing 6.62% of the number of outstanding shares) had not yet been exercised. The options are exercisable for the same number of shares and represent a potential capital increase (including premiums issued on new shares) of €19.5 million.

5.11. Statutory Auditor’s fees
In 2011, the PricewaterhouseCoopers network provided audit services (reviewing the Group’s consolidated and parent company financial statements) and non audit-related services to Econocom Group SA/NV and its subsidiaries. Below is a table indicating the type of services provided and the related fees:
46
Consolidated statutory Auditor’s fees for auditing the 2010 financial statements €367,955
fees linked to the functions of the statutory Auditor and the related functions performed in the group
by individuals linked to the statutory Auditor€620,866
fees for non audit-related engagements carried out by the statutory Auditor for econocom group
Non-audit certification engagements €111,221
Tax advisory work -
Other -
fees for non audit-related engagements or specific assignments performed within the Company
by individuals linked to the statutory Auditor
Non-audit certification engagements €89,250
Tax advisory work €251,214
Other €129,870
5.12. Treasury shares
Refer to paragraph 2.3.3.2.
6. POST-YEAR-END EVENTS On 11 January 2012, Econocom Group announced that it had acquired a 40% stake in Centix, with a three-year option to purchase the company’s remaining stake.
Centix, Belgium’s acknowledged specialist in desktop and server virtualisation solutions has reported consistent growth since its inception in 2007, with revenue of €2 million.
Econocom and Centix are both well-established in the market and will benefit from their complementary strengths in terms of both technological expertise and customer portfolio, enabling them to offer their customers a leading solution for migrating all their IT infrastructures to the cloud computing mode and covering all areas of virtualisation.

Consolidated statement of financial position 48
Consolidated income statement and statement of comprehensive income 50
Consolidated statement of changes in equity 52
Consolidated statement of cash flows 54
Notes to the consolidated financial statements 56
ConsolidATed finAnCiAl sTATeMenTs for the year ended 31 December 2011
ConTenTs
47

48
ConsolidATed sTATeMenT of finAnCiAl posiTionas of 31 December 2011
(in € thousands) Notes 31 dec. 2011 31 dec. 2010
non-current assets
Intangible assets, net 6 48,639 51,661
Goodwill 7 134,222 137,872
Property, plant and equipment, net 8 13,364 13,469
Financial assets 9 45,058 33,113
Long-term receivables 10 2,201 2,265
Deferred tax assets 30 13,104 27,230
Total non-current assets 256,588 265,610
Current assets
Inventories 11 14,858 16,253
Trade and other receivables 12 596,752 670,472
Current tax assets 9,524 8,970
Other current assets 12 21,151 56,613
Cash and cash equivalents 13 144,772 217,873
Total current assets 787,057 970,181
non-current assets held for sale
Total assets 1,043,645 1,235,791
ASSETS
* Data for 2010 include the finalised allocation of the purchase price of ECS Group to its assets, liabilities and contingent liabilities.

ConsolidATed sTATeMenT of finAnCiAl posiTionas of 31 December 2011
49
Consolidated financial statements
(in € thousands) Notes 31 dec. 2011 31 dec. 2010
Share capital 17,077 17,077
Additional paid-in capital and reserves 97,033 79,736
Profit for the year 21,512 28,778
shareholders’ equity 15 135,622 125,591
Non-controlling interests 15 (119) 66
Total equity 135,503 125,657
non-current liabilities
Financial liabilities 18 11,520 123,814
Bonds 18 76,520
Non-current provisions 16 448 450
Provisions for pensions and other commitments 17 11,714 11,689
Other non-current liabilities 2,675 2,276
Deferred tax liabilities 30 9,299 19,790
Total non-current liabilities 112,176 158,019
Current liabilities
Financial liabilities 18 63,904 126,764
Bonds 18 3,360
Current provisions 16 29,125 27,287
Current tax liabilities 3,097 12,438
Trade and other payables 19 596,300 712,820
Other current liabilities 19 100,180 72,806
Total current liabilities 795,966 952,115
liabilities related to assets held for sale
Total equity and liabilities 1,043,645 1,235,791
EQuITY AND LIABILITIES
* Data for 2010 include the finalised allocation of the purchase price of ECS Group to its assets, liabilities and contingent liabilities.

50
ConsolidATed inCoMe sTATeMenTfor the year ended 31 December 2011
(in € thousands) Notes 2011 2010
revenue from continuing operations 21 1,584,289 1,021,360
operating expenses (1,519,721) (974,343)
Cost of sales (1,182,381) (746,235)
Personnel costs 22 (216,825) (140,217)
External expenses 23 (97,406) (73,715)
Depreciation, amortisation and provisions for impairment 24 (11,646) (6,717)
Taxes (other than income taxes) (11,218) (7,515)
Impairment losses on current assets, net 25 2,898 (254)
Other operating income and expenses 26 338 622
Financial expense, operating activities 27 (3,481) (312)
recurring operating profit 64,568 47,017
Other non-recurring operating income and expenses 28 (18,588) (6,750)
operating profit 45,980 40,267
Net financial income/(expense) 29 (11,875) 851
profit before tax 34,105 41,118
Income tax 30 (12,847) (12,350)
profit from continuing operations 21,258 28,768
Share of profit of associates 40 4
profit including non-controlling interests 21,298 28,772
non-controlling interests 214 6
profit for the year excluding non-controlling interests 21,512 28,778
Basic earnings per share - continuing operations 31 0.858 1.231
Basic earnings per share - discontinued operations
Basic earnings per share 0.858 1.231
Diluted earnings per share - continuing operations 0.837 1.227
Diluted earnings per share - discontinued operations
diluted earnings per share 0.837 1.227
Data for 2010 include both the entities in Econocom’s scope of consolidation and the contribution of ECS Group and its subsidiaries as from 1 October 2010.

51
(in € thousands) 2011 2010
profit for the year including non-controlling interests 21,298 28,772
Adjustments to the fair value of financial instruments and other financial assets
89 135
Exchange differences on translation of foreign operations 205 252
Actuarial gains/losses on employee benefits 80 147
Income tax relating to elements directly recognised in equity (24) (50)
income and expenses recognised directly in equity 350 484
Total comprehensive income for the year 21,648 29,256
Attributable to owners of the parent 21,862 29,262
Attributable to non-controlling interests (214) (6)
ConsolidATed sTATeMenT of CoMprehensive inCoMefor the year ended 31 December 2011

52
ConsolidATed sTATeMenT of ChAnges in equiTy as of 31 December 2011
(in € thousands) number of shares share capitalAdditional
paid-in capitalTreasury
stock reserves
net income/ (expense) recognised
directly in equity
equity attributable to
owners of the parent
non-controlling
interestsTotal
equity
Balance as of 31 december 2010 26,172,897 17,077 69,244 (16,011) 56,718 (1,437) 125,591 66 125,657
Capital increase - -
Share-based payments 287 287 287
Acquisition of treasury shares (12,995) (12,995) (12,995)
Sale of treasury shares 6,364 6,364 6,364
Dividends paid (8,812) (8,812) (8,812)
Convertible bonds - items of equity 3,286 3,286 3,286
Other transactions with owners 39 39 29 68
sub-total – transactions with owners 0 3,286 (6,631) (8,486) 0 (11,831) 29 (11,802)
Profit including non-controlling interests 21,512 21,512 (214) 21,298
Other comprehensive income items 350 350 350
sub-total – total comprehensive income 0 0 0 21,512 350 21,862 (214) 21,648
Balance as of 31 december 2011 26,172,897 17,077 72,530 (22,642) 69,744 (1,087) 135,622 (119) 135,503
Balance as of 31 december 2009 24,800,000 16,181 55,038 (16,829) 28,720 1,421 84,531 72 84,603
Capital increase 1,372,897 896 14,206 0 0 0 15,102 0 15,102
Share-based payments 0 0 0 0 282 0 282 0 282
Acquisition of treasury shares 0 0 0 (7,996) 0 0 (7,996) 0 (7,996)
Sale of treasury shares 0 0 0 22,832 5,946 0 28,778 0 28,778
Dividends paid 0 0 0 0 (6,944) 0 (6,994) 0 (6,944)
Other transactions with owners 0 0 0 (14,018) (64) 0 (14,082) 2 (14,080)
sub-total – transactions with owners 1,372,897 896 14,206 818 (780) 0 15,140 2 15,142
Profit including non-controlling interests 0 0 0 28,778 0 28,778 (7) 28,771
Other comprehensive income items 0 0 0 0 (2,858) (2,858) (1) (2,859)
sub-total – total comprehensive income 0 0 0 28,778 (2,858) 25,920 (8) 25,912
Balance as of 31 december 2010 26,172,897 17,077 69,244 (16,011) 56,718 (1,437) 125,591 66 125,657
Consolidated financial statements
53

54
ConsolidATed sTATeMenT of CAsh floWsfor the year ended 31 December 2011
(in € thousands) 2011 2010
Profit including non-controlling interests 21,298 28,771
Elimination of the share of profit of associates (40) (4)
Depreciation of property, plant and equipment/amortisation of intangible assets 9,998 4,914
Impairment of goodwill 3,650
Impairment of financial assets 8 (38)
Impairment of trade receivables, inventories and other current assets (5,396) 1,167
(Gains)/losses on the disposal of property, plant and equipment and intangible assets 314 (205)
(Gains)/losses on the disposal of companies and businesses
Non-recurring impact of the recognition of residual interests on TRO and other contracts (7,704)
Non-recurring impact of the recognition of interests in mutual funds and other (4,500)
Change in provisions 430 (1,019)
Income and expenses related to equity-based payment 959 345
Cash flows from operating activities after cost of net debt and income tax 31,221 21,727
Income tax expense 12,848 12,679
Cost of net debt 15,388 3,184
Cash flows from operating activities before cost of net debt and income tax (a) 59,457 37,590
Change in working capital (b) 28,547 203,180
Income tax paid (c) (19,105) (8,249)
net cash provided by operating activities (a+b+c=d) 68,899 232,521
Acquisition of property, plant and equipment and intangible assets, excluding the Leasing business
(7,859) (3,555)
Disposal of property, plant and equipment and intangible assets, excluding the Leasing business
789 1,488
Acquisition/disposal of property, plant and equipment allocated to the Leasing business 107 598
Acquisition of financial assets (14,019) (10,269)
Disposal of financial assets 2,106 1,764
Acquisition of companies and businesses, net of cash acquired (488) (156,388)
Data for 2010 include both the entities in Econocom’s scope of consolidation and the contribution of ECS Group and its subsidiaries as from 1 October 2010.

Consolidated financial statements
55
(in € thousands) 2011 2010
net cash used in investing activities (e) (19,364) (166,362)
Convertible bonds - items of equity 3,286
Convertible bonds - issue of convertible bonds 79,880
Increase in non-current financial liabilities 6,936 120,550
Repayment of non-current financial liabilities (118,791) (16,089)
Increase in current financial liabilities 25,569 98,591
Repayment of current financial liabilities (88,535) (109,932)
Interest paid (15,388) (3,184)
Acquisition and sale of treasury stock (6,748) 5,884
Dividends paid during the year (8,772) (6,905)
net cash provided by/(used in) financing activities (f) (122,563) 88,915
Impact of changes in exchange rates (73) 277
Change in cash and cash equivalents (d+e+f) (73,101) 155,351
Cash and cash equivalents as of 1 january 217,873 62,522
Change in cash and cash equivalents (73,101) 155,351
Cash and cash equivalents as of 31 december 144,772 217,873
Data for 2010 include both the entities in Econocom’s scope of consolidation and the contribution of ECS Group and its subsidiaries as from 1 October 2010.

56
noTes To The ConsolidATed finAnCiAl sTATeMenTsfor the year ended 31 December 2011
1. Information about Econocom Group
2. Summary of significant accounting policies
3. Changes in the scope of consolidation
4. List of consolidated companies
5. Segment reporting
6. Intangible assets
7. Goodwill
8. Property, plant & equipment
9. Financial assets
10. Long-term receivables
11. Inventories
12. Trade and other receivables and other current assets
13. Cash and cash equivalents
14. Fair value of financial assets
15. Equity
16. Provisions
17. Provisions for pensions and other commitments
18. Financial liabilities
19. Trade and other payables and other current liabilities
20. Fair value of financial liabilities
21. Revenue from continuing operations
22. Personnel costs
23. External expenses
24. Additions to and reversals of depreciation, amortisation and provisions
25. Impairment losses on current assets, net
26. Other operating income and expenses
27. Financial expense, operating activities
28. Other non-recurring operating income and expenses
29. Net financial expense
30. Income taxes
31. Earnings per share
32. Notes to the consolidated statement of cash flows
33. Risk management
34. Off-balance sheet commitments
35. Contingent liabilities
36. Related-party transactions
37. Subsequent events
38. Assessments made by management and sources of uncertainty

1. INFORMATION ABOuT ECONOCOM GROuPEconocom Group SA/NV, the Group’s parent company, is a société anonyme governed by the laws of Belgium with a Board of Directors, whose registered office is located at Place du Champ de Mars, 5, 1050 Brussels (previously boulevard de la Woluwe, 34 1200 Woluwe Saint-Lambert).
The company is registered with the Brussels corporate register under number BE0422 646,816 and is listed on the Brussels Euronext stock exchange.
The consolidated financial statements for the year ended on 31 December 2011 reflect the accounting situation of Econocom Group and its subsidiaries.
On 7 March 2012, the Board of Directors finalised the consolidated financial statements for the year ended on 31 December 2011 and authorised the publication thereof. These financial statements shall only be deemed final after they have been approved by the shareholders at the Annual General Meeting on 15 May 2012.
The financial statements were submitted to the shareholders on 13 April 2012.
2011 was primarily devoted to the integration of ECS Group, which Econocom acquired in October 2010.
Moreover, during this year, Econocom Group paid up in full the financial debts incurred by the loan it had secured in 2010 for the acquisition of ECS Group (€182 million). It was able to do so by a considerable reduction in the fourth quarter of 2010 of its working capital and by issuing €84 million worth of convertible bonds in May 2011, as new or existing shares (OCEANE).
2. SuMMARY OF SIGNIFICANT ACCOuNTING POLICIES
2.1. General principles and statement of compliance
The financial statements for Econocom Group for 2011 were prepared in compliance with the International Financial Reporting Standards (IFRS) and interpretations, as adopted by the European union (regulation 1606/2002 of 19 July 2002) at the end of the financial year. These financial statements compare the data from 2011 with that of 2010, which was prepared in compliance with the same standard.
As of 31 December 2011, the financial reporting standards and interpretations adopted by the European union were similar to the mandatory financial reporting standards and interpretations published by the IASB (International Accounting Standards Board).
International standards include IFRS, IAS (International Accounting Standards) and the interpretations of the IFRIC (International Financial Reporting Interpretations Committee).
The financial statements presented do not take into account drafts of standards and interpretations which, at the end of the financial year, were still at the exposure draft stage at the IASB and the IFRIC.
All the standards applied by the European union are available on the European Commission website at the following address: http://ec.europa.eu/internal_market/accounting/ias/index_en.htm.
notes to the consolidated financial statements
57

58
2.2. Adoption of IFRS
2.2.1. Standards, revised standards and interpretations applicable as from 1 January 2011
The Group has adopted all the new and revised standards and interpretations which were applicable as of 1 January 2011 and approved by the European union.
standard/interpretation Application date impact on the group
eu (1) group
iAs 24 revisedRelated Party Disclosures
1 January 2011 1 January 2011No impact on the financial statements
improvements to ifrs Classification of Rights Issues.
1 January 2011 1 January 2011No impact on the financial statements
ifrs 1 revisedFirst-time Adoption of IFRS – Exemptions from IFRS 7
1 July 2010 1 January 2011No impact on the financial statements if there are no business combinations
ifriC 19 Extinguishing Financial Liabilities with Equity Instruments.
1 July 2010 1 January 2011No impact on the financial statements
ifriC 14 Minimum Funding Requirements in IAS 19
1 January 2011 1 January 2011No impact on the financial statements
(1) Unless otherwise stated, these are applicable as from the date indicated here.
These standards either do not apply to the Group or do not have a significant impact on the Group’s consolidated financial statements as from 31 December 2011.

notes to the consolidated financial statements
59
2.2.2. Standards, amendments and interpretations published by the IASB but not yet approved by the European Union
standards/interpretation
iAsB application date (1) expected impact on the group
ifrs 7 Amendments
Disclosures – Transfers of Financial Assets
Disclosures – Offsetting Financial Assets and Financial Liabilities
1 July 2011
1 January 2013 under assessment
ifrs 1 AmendmentSevere hyperinflation and Removal of Fixed Dates for First-time Adopters
1 July 2011No impact on the financial statements
iAs 12 Amendment Deferred Tax: Recovery of underlying Assets 1 January 2012No impact on the financial statements
iAs 27 revised Separate Financial Statements 1 January 2013No impact on the financial statements
iAs 32 AmendmentOffsetting Financial Assets and Financial Liabilities
1 January 2014 under assessment
iAs 28 revisedInvestments in Associates and Joint Ventures
1 January 2013under assessment but no major impact expected
ifrs 9 Financial Instruments 1 January 2015 under assessment
ifrs 10 Consolidated Financial Statements 1 January 2013under assessment but no major impact expected
ifrs 11 Joint Arrangements 1 January 2013under assessment but no major impact expected
ifrs 12 Disclosure of Interests in Other Entities 1 January 2013 under assessment
ifrs 13 Fair Value Measurement 1 January 2013 under assessment
iAs 1 AmendmentPresentation of Items of Other Comprehensive Income
1 July 2012No impact on the financial statements
iAs 19 revised Employee Benefits 1 January 2013No impact on the financial statements
ifriC 20Stripping Costs in the Production Phase of a Surface Mine
1 January 2013No impact on the financial statements
(1) Unless otherwise stated, these are applicable as from the date indicated here..

2.3.3. Estimates used and judgement
The preparation of Econocom Group’s consolidated financial statements requires the use of a certain number of estimates and assumptions by Management which may affect the carrying amount of certain items in assets and liabilities, expenses and income, and the information disclosed in the notes.
The Group’s Management regularly reviews its estimates and assumptions in order to ensure that they accurately reflect both its past experience and current economic position.
Depending on how these assumptions change, the items in future financial statements may differ from the current estimates. The impact of the change in accounting estimates is recorded during the change period and all future periods affected by the changes.
The main estimates made by Management for the preparation of the financial statements concern the valuing and useful life of operating, tangible, intangible assets, goodwill, provisions for risks and other provisions related to business, and the methods used for calculating commitments relating to personnel benefits, share-based payments, deferred taxes and financial instruments. The Group has used the adjustment rate method, based on market data, to estimate assets and liabilities.
The main methods used by the Group are set out in the relevant paragraphs in the notes to the financial statements and in particular in the following notes:
• Note 2.11 – Impairment of assets
• Note 2.12 – Financial assets and liabilities
• Note 2.14 – Share-based payments
• Note 2.15 – Income tax
• Note2.16 – Provisions and contingent liabilities
• Note 2.17 – Post-employment benefits and other commitments
• Note 3 – Changes in the scope of consolidation.
The main accounting methods for which assessments require estimates concern the elements in Note 38 – Assessments made by Management and sources of uncertainty.
60
2.2.3. Reminder of options chosen for first-time adoption of IFRS
For the purpose of drawing up its IFRS opening balance sheet on 1 January 2004 (the date on which the Group first adopted IFRS), Econocom has elected to do the following, in accordance with IFRS 1, as they continue to affect the financial statements:
• Not restate business combinations prior to 1 January 2004.
• Reclassify as consolidated reserves goodwill as of 1 January 2004.
• Not revaluate tangible and intangible assets on the date of transition to fair value.
• Apply IFRS 2, “Share-based payments” to equity instruments attributed after 7 November 2002, as the rights were not acquired on 1 January 2005.
2.3. Basis for preparation and presentation of the consolidated financial statements
2.3.1. Basis for reporting
The consolidated financial statements were prepared in accordance with the historical cost accounting method, with the following exceptions:
• Certain financial assets and liabilities at fair value.
• Non-current assets held for sale, recorded at whichever is the lowest amount – either the carrying amount or the fair value less the disposal costs once the sale is deemed highly probable. These assets cease to be amortised when they are recognised as assets (or group of assets) held for sale.
2.3.2. Changes to the presentation
Changes in presentation and reclassifications are made when they provide information that is both reliable and more relevant for the readers of the financial statements, and when the changes in question are likely to last, without compromising comparability. When a change has a significant impact, the comparative information must also be reclassified.
There have been no material changes in the presentation of the consolidated financial statements.

Moreover, apart from the use of estimates, the Group’s Management also relies on its own judgement in order to determine the appropriate accounting treatment for certain operations, whilst awaiting clarification from certain IFRS standards or when the standards used do not deal with the issues concerned. This is the case for the sale options granted to minority shareholders.
Sale options granted to minority shareholders
The Group has granted minority shareholders in some of its subsidiaries a buyout option of their shares. The price of these transactions may be either fixed or determined according to a predefined calculation. Furthermore, they may be conducted at any time in some cases, or on a specific date in others.
IAS 27 revised, applied to the consolidated financial statements as from 1 January 2010, specifies the accounting treatment of additional acquisition of shares from companies which are already controlled.
Sale options granted as of 1 January 2010
IAS 27 revised stipulates that any transaction with minority shareholders with equity securities – without any change in control – must be recognised in equity. Consequently, the Group considers that any sale options granted after the date of the first application of the revised standard must affect the consolidated equity.
The Group records financial liabilities for the sale options granted to minority shareholders of the entities in question. The related non-controlled interests are reclassified in financial liabilities. The difference between the debt from buyout option and the carrying amount of the reclassified non-controlled interests is recorded as a deducted from equity.
Liabilities are initially recorded for the present value of the strike price and then, for subsequent reporting, based on the fair value of potentially purchased shares if the strike price is based on fair value. Any later changes in fair value of the obligation are accounted for by adjusting equity.
2.4. Consolidation methods
The consolidated financial statements include the financial statements of companies acquired as from the
acquisition date and of sold companies up until the disposal date.
2.4.1. Subsidiaries
Subsidiaries are companies over which Econocom exercises exclusive control. Exclusive control is presumed to exist when the parent company holds, directly or indirectly, the power to govern the financial and operational policies of a company in such a way as to obtain benefits from its activities. Subsidiaries are included in the basis of consolidation as of the date on which control is effectively transferred to the Group; sold subsidiaries are removed from the basis of consolidation on the date of loss of control.
Exclusively-controlled entities are fully consolidated by the Group: the assets, liabilities, income and expenses of the subsidiary are fully consolidated, line by line in the consolidated statements and the share of equity and net profit attributable to minority shareholders is presented under the separate item of minority interests in the consolidated statement of financial position and income statement.
2.4.2. Associates
Associates are investments in which the Group exercises significant influence, meaning that it has the ability to participate in the financial and operational policies of the company without controlling it. Significant influence is presumed when the parent company, directly or indirectly, has a fraction equal to at least 20% of the entity’s voting rights.
Such investments in associates are consolidated under the equity method: investment in an associate is initially stated at cost of acquisition, and then its carrying amount is increased or decreased to recognise the Group’s share in the fair value of the held company’s assets and liabilities.
2.4.3. Business combinations and goodwill
Business combinations are recognised under the acquisition method, in accordance with IFRS 3. This standard was revised, applicable as from 1 January 2010, without retroactive effect, the main consequences of
notes to the consolidated financial statements
61

62
which were greater control in the accounting treatment of the business combination and greater use of fair value.
As of 1 January 2010, business combinations are treated as follows:
The cost of the business combination approximates the fair value of the assets provided, the liabilities incurred or assumed and the equity instruments issued by the Group on the acquisition date, in exchange for control of the acquiree.
The identifiable assets and liabilities and contingent liabilities of the acquiree which comply with IFRS are recognised at fair value at the acquisition date, except for non-current assets held for sale, which are recognised at fair value less the cost of sale, in accordance with IFRS 5.
The difference between the cost of the business combination and the acquirer’s share in the carrying amount of the identifiable assets and liabilities and contingent liabilities at the acquisition date is recognised in goodwill. For each business combination, minority interests may be measured at fair value, resulting in the recognition of additional goodwill (“full” goodwill option).
As any subsequent changes in the percentage of interest, without affecting the control of the acquiree, are regarded as transactions between shareholders, the difference between the purchase (or sale) value and the carrying amount of the share acquired (or sold) is recognised in equity.
For business combinations which take place in several stages, the shares owned prior to the control of the aquiree being taken will be revaluated to fair value against profit. The same applies to shares retained after loss of control.
Moreover, the amount of costs directly attributable to the business combination is recognised in income.
When goodwill is determined on a temporary basis at the end of the year during which the acquisition took place, the Group must account for the adjustments of these temporary amounts within a year of the acquisition date. If the differences between the temporary and final amounts have a material impact on the presentation of the financial statements, the comparative information
presented for the period before fair value was finalised is restated as if the amounts had been finalised at the acquisition date.
When the difference between the cost of the business combination and the share of the fair value of identifiable assets and liabilities and contingent liabilities is negative, it is immediately recognised as income.
Subsequently, goodwill is measured at its cost less any depreciation from impairment, determined in accordance with the method described in Note 2.11. In the event of impairment, depreciation is recorded under “Other non-current operating income and expenses” in the income statement included in the Group’s operating profit.
2.5. Translation of foreign currencies
2.5.1. Functional currency and reporting currency
The items in the financial statements for each entity are estimated using the currency of the primary economic environment (or “functional currency”) in which the entity operates. The Group’s consolidated financial statements are reported in euros, which is the Group’s reporting currency.
2.5.2. Recognition of foreign currency transactions
Foreign currency transactions of subsidiaries are initially recorded in their functional currency using the exchange rates prevailing at the dates of the transactions.
Monetary elements in foreign currencies are translated at the reporting date at the year-end rate. Any foreign exchange gains or losses resulting or arising from the payment of these monetary elements are recorded in the income statement for the period.
Non-monetary elements in foreign currencies recognised at historical cost are translated at the historical transaction rate and non-monetary elements in foreign currencies recognised at fair value are translated at the rate at the time fair value was determined. When a profit or loss for a non-monetary element is recognised directly in equity, the “change” component of this profit or loss is

notes to the consolidated financial statements
63
also recognised in equity. Otherwise, this component is recognised as income for the period.
The accounting of currency hedges as derivatives is described in the “Derivative instruments” paragraph of Note 2.12 – Financial assets and liabilities.
2.5.3. Translation of the financial statements of foreign entities
The results and financial positions of the Group’s entities with functional currencies other than the reporting currency are translated into euro as follows:
• Statement of financial position items other than equity are translated at the year-end exchange rate.
• Income statement and statement of cash flow items are translated at the average exchange rate for the year.
• Exchange differences are recognised in currency translation adjustments in the statement of comprehensive income, among the other elements of the comprehensive income, and in particular the currency translation adjustments arising from borrowings in foreign currencies covering an investment in a foreign currency or a permanent advance to the subsidiaries.
2011 2010 2009
year-end rate Average rate year-end rate Average rate year-end rate Average rate
GBP 1.197 1.149 1.162 1.165 1.126 1.115
MAD 0.090 0.089 0.089 0.090 0.088 0.089
ChF* 0.823 0.811 0.762 0.80
uSD* 0.773 0.717 0.748 0.743
CZK* 0.039 0.040 0.040 0.040
PLN* 0.224 0.242 0.252 0.250
RON* 0.231 0.236 0.235 0.234
CNY* 0.123 0.111 0.113 0.112
* As of 31 December 2010, following the acquisition of ECS Group in the fourth quarter 2010, the income statement of the subsidiaries who report their financial statements in these currencies were calculated at the average three-month rate.

64
2.6. Intangible assets
Separately-acquired intangible assets are measured, either at their acquisition cost, or at their fair value on the acquisition date in the context of a business combination.
Subsequent to their acquisition date, they are measured at their entry cost less the accumulated amortisation and accumulated impairment losses.
Intangible assets with definite useful lives are amortised over the economic useful life.
Intangible assets with indefinite useful lives are not amortised.
Intangible assets acquired by the Group are measured at their acquisition cost less any accumulated amortisation and accumulated impairment losses. They mainly comprise operating licences and IT software.
They are amortised according to the straight line method over their useful lives.
The customer portfolio acquired from ECS Group was valued according to the MEEM method (Multi-period Excess Earning method) at €40 million amortised over 20 years.
useful lives (in years)
Buildings 20 - 50
Fixtures 10
IT equipment 3 - 7
Vehicles 4 - 7
Furniture 10
2.7. Property, plant and equipment
2.7.1. Property, plant and equipment held directly
Property, plant and equipment are carried at acquisition cost less any accumulated amortisation and accumulated impairment losses.
Additions to depreciations are booked according to the straight line method or diminishing balance method over the scheduled service life of the assets taking into account any residual value.
Land is not amortised.
The spare equipment supplied to clients as part of additional services under certain lease contracts is recognised under property, plant and equipment and amortised over the duration of the contract.
When an item of property, plant and equipment comprises components with different useful lives, such components are recognised and amortised as separate items under property, plant and equipment.
The profits or losses from the sale of an item of property, plant and equipment are determined by the difference between the income from the sale and the net carrying amount of the sold asset and are included in “Other operating income and expenses”.

notes to the consolidated financial statements
65
2.7.2. Property, plant and equipment held under finance leases
Finance leases that transfer substantially all the risks and rewards of ownership are recognised in the statement of financial position at inception of the lease at the lower of (i) the fair value of the leased item, or (ii) the sum of the future minimum lease payments discounted to present value. Lease payments are apportioned between the finance charge and the reduction of the outstanding liability. The finance charge is recognised in the net financial income and expense part of the income statement under “Expenses on long-term liabilities”.
Assets acquired under finance leases are depreciated over the same period as items of directly-held property, plant and equipment of an identical category.
2.8. Other financial assets
Investments in non-consolidated companies are recorded at fair value. Any unrealised gains or losses are recognised directly in equity. When the investment is sold, the accumulated gain or loss previously recognised in equity is included in profit or loss for the period.
2.9. Leases entered into by the Leasing business
Virtually all leases operated by the Leasing business are finance leases although operating leases may also be contracted.
2.9.1. Financial leases
The Group’s finance leases are mainly refinanced contracts, whereby equipment and related contracts are sold to refinancing institutions at an all-inclusive price representing the present value of future minimum lease payments receivable and the financial residual value of the equipment. Financial residual value represents the amount for which the Group undertakes to repurchase the equipment upon expiry of the lease. Lease payments due by lessees are paid directly to the refinancing institutions on a non-recourse basis, which means that the Group transfers the risk of payment default. From a
legal standpoint, Econocom Group relinquishes ownership of the equipment on the date of sale and recovers ownership at the end of the lease term by repurchasing the equipment.
In some cases, the Group asks refinancing institutions to grant it invoicing and payment agency on their behalf. This does not alter the transfer of the risk of payment default from the clients to the refinancing institutions.
Revenue, cost of sales and residual interest are recognised progressively as assets are delivered, pro rata to the amount of each delivery.
IAS 17 states that initial recognition of a lease must take place at the commencement of the lease, i.e., the date from which the lessee is entitled to exercise its right to use the leased asset. Article 5.1 of the Group’s General Sales Conditions defines this date as the date on which the leased asset is delivered, which is officially confirmed when the Statement of Acceptance is signed.
Refinanced contracts
Refinanced contracts are accounted for as follows:
In the statement of financial position
• For each lease contract, any difference between the residual interest in the leased assets (as defined in paragraph 2.10.3 below) and their financial residual value (the Group’s repurchase commitment under the finance lease, defined in the introductory paragraph) is booked in assets if it is positive, or in liabilities if it is negative.
In the income statement
• Related revenue corresponds to the present value of future minimum lease payments (corresponding to the payments that the lessee is required to make throughout the realisation period and the lease term).
• The cost of sales represents the purchase cost of the asset.
• The Group’s residual interest in the leased assets is deducted from the cost of sales.
specific cases of bridges on roll out facility (rof) and Technology refresh option (Tro) contracts
These contracts systematically start with an investment period – termed a “realisation period” – which precedes the start of the initial lease period.

In order to finance investments made during the realisation period, a non-recourse sale may be made (so that there is no longer any client credit risk) to a refinancing institution. Econocom accounts for this financing operation as a sale, resulting in the replacement of “revenue accruals” in the statement of financial position by a receivable owed by the refinancing institution.
These operations, which for administrative reasons are dealt with in two phases – a bridge during the realisation period followed by subsequent refinancing at the beginning of the initial lease period – should be considered in substance as a single transaction, provided that the bridge and the subsequent refinancing are carried out with the same refinancing institution and if the refinancing conditions are defined at the time of the bridge.
Specific cases of lease extensions
Revenue is recognised on lease extensions in line with the initial qualification of the lease, i.e.:
• If the initial contract qualifies as an operating lease, revenue from the extension of the lease will be deferred over the period of the lease extension.
• If the initial contract qualifies as a finance lease, revenue from the extension of the lease will be recognised in full on the last day of the initial lease.
Non-refinanced contracts
These are exceptional cases as lease contracts, and as a rule, are usually refinanced.
They are accounted for as follows:
In the statement of financial position
The value of the lease receivables is recorded in the statement of financial position rather than the value of the equipment.
In the income statement
Income and expenses are recognised in the following line items as assets are delivered:
• Revenue: present value of future minimum lease payments.
• Cost of sales: carrying amount of the leased asset.
It is recognised on a periodic basis:
• Financial income: the monthly financial income corresponding to the difference between the lease payments invoiced monthly and the monthly portion of the present value of said payments.
2.9.2. Operating leases
Econocom Group retains all the risks relating to operating leases as the significant risks and rewards incidental to ownership of the assets concerned are not transferred.
In the statement of financial position
The leased equipment is recorded as an asset in the statement of financial position and depreciated on a straight-line basis over the duration of the contract to write it down to its residual value, which represents the company’s residual interest in the asset at the end of the lease term.
In the income statement
Income statement entries are made on a periodic basis with the invoiced lease payment recorded as revenue and the depreciation described above recorded as an expense.
2.9.3. Residual value
As stated above, leased equipment is repurchased from refinancing institutions at the end of the lease term. The financial residual value of these assets represents a liability – which is generally long-term – and is discounted using the same method as for the related lease contract.
Econocom Group’s residual interest in the transferred assets corresponds to an estimated market value.
This residual interest is calculated as follows:
• For all contract types except Technology Refresh Option (TRO) contracts, the estimated market value is calculated using an accelerated diminishing balance method of depreciation, based on the amortisation of the original purchase cost of each item of equipment. This residual interest represents a long-term asset which is discounted using the same method as for the related lease contract.
66

• Due to the specific nature of Technology Refresh Option contracts, the accelerated diminishing balance method of depreciation is not applicable. The estimated market value for these contracts is calculated by using a fixed percentage of the original purchase cost of the equipment.
The positive or negative differences between the future value of equipment and the financial residual value are recognised on a contract-by-contract basis as financial assets or liabilities, respectively. In order to reflect the economic reality and ensure consistent accounting treatment, the financial residual value is excluded from net debt (See Note 2.12.5).
2.10. Inventories
For the Distribution and Leasing businesses, inventories are measured either at the lower of their cost price or at net realisable value. Cost is measured using the weighted average cost method. Net realisable value is the estimated selling price in the ordinary course of business less the estimated costs necessary to make the sale.
For the Services business, inventories are accounted for at the cost price and impaired in line with the economic life of the equipment for which they are intended.
2.11. Impairment of assets
Fixed assets (such as goodwill and intangible assets with an undefined useful life) in CGus or group of CGus undergo impairment tests every year at 31 December.
A Cash Generating unit (CGu) is described as the smallest group of assets with cash flow that is independent of that generated by other assets or groups of assets.
An impairment test is performed mainly when events or circumstances indicate that an impairment loss is likely to affect goodwill, intangible assets or property, plant and equipment of CGus or group of CGus. Such events or circumstances may be the result of significant unfavourable events of a long-term nature affecting either the economic environment or the assumptions and objectives decided at the acquisition date.
The impairment test involves determining whether the recoverable amount of an asset, a CGu or group of CGus is lower than its carrying amount.
The recoverable amount of an asset, a CGu or group of CGus is the higher of its fair value less costs to sell and its value in use.
The value in use is determined in relation to the projected future cash flow, and taking into account the time value and the risks inherent in the business and the specific context of the CGu or group of CGus.
Future cash flow projections are made based on the budgets and medium-term plans.
These plans are made for a maximum five-year period. To calculate the value in use, a terminal value equal to the discounting to perpetuity of an annual normative flow is added to the value of future flows throughout the duration of the plan.
Fair value is the amount that could be obtained from the sale of the assets tested under normal competitive conditions between well-informed, consenting parties, less the disposal cost. These amounts are calculated based on market information.
If the carrying amount of the assets, CGu or group of CGus exceeds its recoverable amount, an impairment loss is recognised.
Impairment losses are allocated in priority against goodwill. In this case, it would be recorded under “Other non-recurring operating income and expenses” in the income statement.
Impairment losses recognised as property, plant and equipment and other intangible assets may be reversed in subsequent periods for the impairment loss initially accounted for, when the recoverable amount is higher than the carrying amount. Impairment losses recognised in goodwill may not be reversed.
notes to the consolidated financial statements
67

68
Loans and receivables are assessed on an individual basis for objective evidence of impairment and an impairment loss is recognised if their carrying value is greater than their estimated recoverable amount. Impairment losses are recognised in the income statement and may be reversed in subsequent periods if there is an increase in the estimated recoverable amount of the assets in question.
3. Held-to-maturity financial assets
held-to-maturity financial assets are non-derivative financial assets with fixed or determinable payments and fixed maturity that an entity has the positive intention and ability to hold to maturity. They are measured and recognised at amortised cost using the effective interest method.
held-to-maturity financial assets are assessed on an individual basis for objective evidence of impairment and an impairment loss is recognised in the income statement if their carrying value is greater than their estimated recoverable amount.
4. Available-for-sale financial assets
Available-for-sale financial assets are initially recognised at fair value which corresponds to their acquisition cost plus any transaction costs. After initial recognition, they are remeasured at market value on the reporting date, which Econocom Group deems to be their fair value. Any changes in market value are recorded in equity.
Available-for-sale financial assets are tested for impairment on an individual basis and if there is objective evidence of impairment, an impairment loss is recorded in the income statement (impairment losses recognised on equity instruments are irreversible).
2.12.2. Financial liabilities
Financial liabilities are split into two categories: financial liabilities at fair value through profit or loss and financial liabilities at amortised cost.
Financial liabilities at fair value through profit or loss comprise:
• financial liabilities held for trading which include liabilities incurred mainly for the purpose of being sold or repurchased in the near term;
2.12. Financial assets and liabilities
2.12.1.Financial assets
In accordance with IAS 39, financial assets are broken down into the following four categories:
• financial assets at fair value through profit or loss;
• loans and receivables;
• held-to-maturity financial assets;
• available-for-sale financial assets.
The classification determines the accounting treatment of these instruments. The classification is decided by the Group at the initial accounting date, depending on the objective in view of which the assets were acquired. Acquisition and sales of financial assets are accounted for at the transaction date on which the Group undertook the purchase or sale.
1. Financial assets at fair value through profit or loss
These financial assets are measured at fair value; any changes in fair value are booked to the income statement.
This category includes:
• financial assets held for trading, i.e., assets that the Group intends to sell in the near term for the purpose of generating gains that are managed as part of a portfolio of financial instruments and for which there exists a past practice of selling in the near term;
• assets designated by the Group upon initial recognition as financial assets at fair value through profit or loss.
2. Loans and receivables
These financial assets are initially recognised at fair value plus any directly attributable transaction costs; they are subsequently recognised at amortised cost at each reporting date using the effective interest method.
This category includes trade receivables and other debtors, loans and security guarantees, receivables from controlled entities, cash and cash equivalents and advances given to associates or non-consolidated entities.

notes to the consolidated financial statements
69
• the hedging relationship;
• the effectiveness of the hedging relationship by testing the effectiveness of the hedge at inception and on an ongoing basis throughout the financial reporting periods for which the hedge has been designated.
hedging instruments that qualify for hedge accounting are accounted for as follows:
• Fair value hedges: changes in the fair value of the hedging instrument and the hedged item are recorded on a symmetrical basis as a loss or gain in the income statement for the period. The hedging instrument and hedged item are marked to market in the statement of financial position.
• Cash flow hedges: the net after-tax gain or loss on the effective portion and the ineffective portion of the hedging instrument are recognised in equity and profit or loss respectively. The amounts taken to equity are written back to profit or loss in the period in which the transaction impacts the income statement.
2.12.4. Cash and cash equivalents
These include cash on hand and demand deposits, other highly-liquid investments with maturities of three months or less from the date of acquisition and bank overdrafts. Bank overdrafts are posted under current liabilities in the statement of financial position, within financial liabilities.
IAS 7 defines cash equivalents as short-term, highly liquid investments that are readily convertible to a known amount of cash, and that are subject to an insignificant risk of changes in value.
Cash equivalents are booked at fair value; changes in fair value are recognised through profit or loss under “Financial income and expense”.
2.12.5. Definition of net debt
The concept of net debt as used by the Group represents gross debt excluding debts related to financial residual values, less net cash.
• liabilities designated by the Group upon initial recognition as financial liabilities at fair value through profit or loss.
The Group’s financial liabilities mainly consist of borrowings convertible into new or existing shares issued in May 2011; current accounts in debit, current bank overdraft facilities, and debt recorded against finance leases and factored debt. They are recorded at amortised cost.
Factoring
Certain subsidiaries of Econocom Group use factoring to cover their cash requirements. Factoring involves the transfer of title of trade receivables and all associated rights to the factor, including the right to receive the related cash inflows.
According to IAS 39 – Financial Instruments: Recognition and Measurement (where substantially all the risks and rewards of ownership relating to trade receivables are transferred) the receivables are derecognised. Where this is not the case they are maintained in the statement of financial position after the transfer and a financial liability is recorded to reflect the cash received.
2.12.3. Derivative financial instruments
The Group uses swaps (derivative instruments) to hedge its interest rate exposure. It uses the financial markets for hedging the exposure related to its business activities and not for speculation purposes.
For hedge accounting purposes hedges qualify as:
• Fair value hedges if they hedge exposure to changes in the fair value of a recognised asset or liability or a firm commitment such as a fixed-rate loan or an asset or liability denominated in a foreign currency;
• Cash flow hedges if they hedge the exposure to variability in cash flows attributable to:- an asset or liability such as a variable-rate loan;- a highly probable future transaction; or- a firm commitment in relation to a foreign currency hedge.
As of the date of inception of the hedge, the Group formally documents the financial instrument to be used for hedge accounting purposes as well as:

70
2.16. Provisions and contingent liabilities
A provision is recognised when the Group has a present (legal or constructive) obligation as a result of a past event, and it is probable that an outflow of resources embodying economic benefits will be required to settle the obligation, and a reliable estimate can be made of the amount of the obligation.
A restructuring provision is recorded when an entity has a detailed formal plan for the restructuring and has announced its main features to those affected by it or has started to implement the plan.
The amount recognised represents the best estimate of the expenditure expected to be required to settle the present obligation at the reporting date. The discount rate reflects current market assessments of the time value of money and the risks specific to the liability.
A contingent liability is (i) a possible obligation that arises from past events whose existence will be confirmed only by the occurrence or non-occurrence of one or more uncertain future events that are not under the Group’s control, or (ii) a present obligation that is not recognised because the amount of the obligation cannot be measured with sufficient reliability. No provision is recorded for contingent liabilities.
2.16.1. Long-term provisions
Long-term provisions mainly include the following:
• Restructuring provisions:
- reorganisation measures taken at the time of a business combination;
- the discontinuation of a business line or measures implemented to turn around the financial situation of an entity;
- steps taken to improve productivity.
Restructuring provisions reflect the company’s obligations at the reporting date due to commitments made to third parties.
2.13. Treasury shares
Treasury shares and the related transaction costs are recorded as a deduction from equity. When they are sold, the consideration received in exchange for the shares net of the transaction costs is recorded in equity.
2.14. Share-based payment
Free share and stock option plans are offered by the Group and paid as shares. In accordance with IFRS 2 – Share-based Payment, the fair value of these plans, representing the fair value of services rendered by the beneficiaries, is measured on the options’ grant date, using the Black-Scholes-Merton model.
The final total expense for stock option plans is measured on the options’ grant date and distributed through profit and loss over the vesting period.
2.15. Income tax
Income tax expenses for the year include current taxes due and deferred taxes.
Deferred taxes are accounted for using the liability method for all temporary differences existing between the carrying amount between the tax bases of assets and liabilities and their carrying amounts in the consolidated financial statements, except for non tax-deductible goodwill. Deferred taxes are determined according to the way in which the Group expects to recover or settle the carrying amount of the assets and liabilities using the tax rates and laws that have been enacted or substantially enacted by the reporting.
Deferred tax assets and liabilities are not adjusted and are classified in the statement of financial position as non-current assets and liabilities.
Deferred tax assets are only recognised to the extent that it is probable that future taxable profit will be available against which deductible temporary differences or tax loss and tax credit carry forwards can be utilised.

notes to the consolidated financial statements
71
For defined-benefit plans, pension liabilities are determined according to the projected unit credit method on the expected retirement date, with an end-of-career salary, taking specifically into account:
• statutory rights depending on the seniority acquired by the different staff categories;
• turnover rate calculated according to the average of recognised exits;
• salaries and fringe benefits including a ratio of the applicable employer social charges;
• an annual salary increase rate;
• the life expectancy of employees on the basis of statistical tables;
• a discount rate for pension liability, revised every year.
The actuarial gains or losses relating to the post-employment defined benefit plans stem from changes in actuarial assumptions retained from one year to another in the measurement of commitments. Since 1 January 2007, these gains or losses are immediately recorded in the period in which they are recognised against equity, net of differed tax according to the option of the amendment to IAS 19.
2.18. Non-current assets held for sale and discontinued operations
IFRS 5 – Non-current Assets held for Sale and Discontinued Operations, requires a specific accounting treatment and presentation of assets or group of assets held for sale and operations discontinued, sold, or held for sale.
A non-current asset (or disposal group) is classified as “held for sale” if its carrying amount will be recovered principally through a sale transaction rather than through continuing use, and if the sale is highly probable. These assets or group of assets are presented separately from other assets or groups of assets when the amount concerned is material. They are measured at the lower of their carrying amount and fair value less costs to sell.
• Provisions for contingences and litigations:
These provisions cover long-term claims or contingencies which may be settled after the operating cycle.
They are measured by reference to the amount of the probable outflow of resources that will be required to settle lawsuits or claims in progress where an obligating event exists on the reporting date: provisions for litigation and claims comprise the estimated amount required to settle litigations, disputes and claims filed by third parties, including the expenses linked to social or tax-related disputes. With respect to tax and social issues, a provision is booked for tax reassessments notified by the tax authorities if the company concerned has contested or intends to contest the reassessment and does not consider that it is highly probable that the outcome of the appeal procedure will be favourable.
2.16.2. Short-term provisions
Short-term provisions primarily correspond to provisions for claims linked to the normal operating cycle and which are expected to be settled within the next 12 months. They are determined according to the same methods as long-term provisions (see above).
2.17. Post-employment benefits and other commitments
The Group’s companies offer, in accordance with the labour laws of each country, various types of employee benefits.
Employees of the Group’s French subsidiaries contribute to the French general and complementary pension plans: these plans are defined-contribution plans for which the Group’s commitments are limited to the payment of periodic contributions, based on a percentage specified under employee costs. Contributions to these defined-benefit pension plans are recognised in employee costs in earnings for the period.

72
The Group recognises revenue from the sale of services when it is probable that future economic benefits will flow to the entity concerned and these benefits can be measured reliably.
Revenue generated from the rendering of services over several accounting periods is recognised by reference to the stage of completion of the transaction at the reporting date. The percentage of completion is obtained by comparing the amount of costs incurred at the reporting date with the estimated total costs of the transaction. If it seems that total identified costs will exceed the price that the customer is prepared to pay, the expected loss on the transaction is recognised immediately as an expense.
IAS 18 is the standard applied for revenue recognition.
2.20. Operating profit
Operating profit includes all income and expenses directly arising from the Group’s business, whether these income and expenses are recurring or the result of one-off decisions or transactions.
Recurring operating profit is an intermediary aggregate which facilitates the understanding of the company’s operating performance.
Other non-current income and expenses, excluded from recurring operating profit, include:
• unusual items representing income and expenses, deemed unusual in terms of their frequency, nature or amount;
• impairment loss of goodwill;
• the results of the disposal of intangible assets or property, plant and equipment, assets or operating investments;
• the cost of restructuring and the costs associated with adjusting staff levels;
• the granting of free shares.
These assets cease to be amortised when they are recognised as assets (or group of assets) held for sale. These are presented separately on the Group statement of financial position, without restatement of prior periods.
An operation discontinued, sold, or held for sale is defined as a component of an entity with cash flows that can be clearly distinguished from the rest of the entity and which represents a major, separate line of business or area.
Income and expense relating to discontinued operations are presented separately in the income statement under “Discontinued Operations” and are restated in the cash flow statement.
2.19. Income from continuing operations
Income from continuing operations is reported where:
• it is probable that the economic benefits resulting from the transaction will be beneficial to the Group;
• the amount of revenues can be reliably measured;
• it is probable that the amount of the sale will be recovered on the transaction date.
• sales of goods
Sales of goods correspond to our Distribution and Telecom activities.
Sales of goods are reported at issue of the delivery note, the date of transfer of the risks and rewards of title from the entity to the buyer.
IAS 18 is the standard applied for revenue recognition.
• finance lease sales
Finance lease sales correspond to the Leasing activity.
IAS 17 is applied for revenue recognition, based on the type of contract as specified in Note 2.20.
• sales of services
Sales of services correspond to our Services and Telecom activities.

notes to the consolidated financial statements
73
Cash flows from financing include:
• changes in equity;
• changes in debts and borrowings;
• dividends.
2.23. Basic earnings per share
Basic earnings per share is determined by dividing profit by the weighted average number of ordinary shares outstanding during the year – a calculation that factors in the number of treasury shares held on a pro rata basis.
Diluted earnings per share is calculated by adjusting the weighted average number of ordinary shares outstanding to assume conversion of all dilutive potential financial instruments issued by the Group or for one of its subsidiaries. Dilution is calculated separately for each instrument, based on market prices at the year-end and excluding anti-dilutive instruments.
Non-dilutive stock options are not included in the calculation.
2.24. Operating segments
Since 1 January 2009, the Group applies IFRS 8 concerning segment reporting which replaces IAS 14. The segment report presented has been prepared on the basis of internal management data disclosed to the Group Management Committee, the Group’s primary operating decision-maker.
2.21. Net profit from discontinued operations
A discontinued operation activity is a component which the Group has disposed of or which it has classified as held for sale and which:
• represents a separate major line of business or geographical area;
• is part of a single, coordinated plan to dispose of a major line of business or geographical area;
• or is a subsidiary acquired purely with a view to resale.
Net profit from discontinued operations includes:
• the profit net of income tax from the discontinued activity up until the disposal date or the year-end if the activity had not been disposed of by the year-end;
• the proceeds from the disposal, net of income tax, of the activity if it had been disposed of by year-end.
2.22. Statement of cash flows
The statement of cash flows is presented in line with the method used for the Group’s internal cash management and separates the following three elements: cash flows from operational activities, cash flows from investment and cash flow from financing.
Cash flows from operational activities include the following:
• operating cash flow with non-recurring items after change in income tax and capital gain from disposal of assets;
• incoming and outgoing payments from recurring activities;
• changes in working capital requirements.
Cash flows from investment include:
• investments in existing assets for the purpose of maintaining or renewing assets existing at the beginning of each year and which are required for the normal running of business;
• development investments, including fixed assets.

74
The four business segments listed above present long-term financial profitability and share similar features that allow their aggregation.
They are managed according to the nature of the products and services sold in the given economic and geographic environments. This segmentation into business areas serves as a basis for the presentation of the company’s internal management data and is used by the Group’s operating decision makers to monitor business activity.
The Group’s Management Committee measures the performance of these aggregate strategic operating business segments based on operating profit. The results correspond to the items that are directly or indirectly attributable to a business segment.
Sales and transfers between segments are carried out at arm’s-length conditions and are eliminated according to the usual consolidation principles.
The Group’s aggregate strategic operating business segments are defined as follows:
• leasing
Innovative, tailored financing solutions to ensure more effective administrative and financial management of a business’ ICT and digital assets.
• distribution
Services ranging from designing architecture solutions to roll-out, and from selling hardware and software (PCs, tablets, servers, printers, licences, digital devices, etc.) to systems integration.
• iT services
Managing distributed and centralised IT resources: ITIL-compliant advice for IT service management, change management for IT infrastructures, infrastructure monitoring, outsourcing, deskside support and business continuity for all types of assets.
• Telecom services
Integration of mobile solutions to address companies’ changing needs, from devising solutions (engineering, imaging) to implementation (mobile device management, liaising with telecom providers, user support and maintenance of mobile devices).
• Miscellaneous businesses
This segment comprises all business activities that do not correspond to the segments defined above.
2.25. Other information
In 2011, the Group did not make any significant changes to its accounting policies other than revisions to IFRSs applicable as of 1 January 2011 as indicated in Note 2.2.1, and which had no impact on the consolidated financial statements.
The information for the comparative periods was prepared in accordance with IFRS.
Aggregate strategic operating business segments (4)
Countries(17)
Leasing
Belgium, China, Czech Republic, France, Germany, Ireland, Italy, Luxembourg, Netherlands, Poland, Romania, Slovakia, Spain, Switzerland, united Kingdom, united States
Distribution Belgium, France, Luxembourg
ServicesBelgium, France, Germany, Italy, Luxembourg, Morocco, Nether-lands, Spain, Switzerland
Telecom France
The Group’s operating activities are organised into four aggregate strategic operating business lines: Leasing, Distribution, Services and Telecom. These can be analysed as follows:

notes to the consolidated financial statements
75
• merger of DB2A Pays de Loire and DB2A Bretagne Normandie with Econocom Location SAS
• merger of Systems & Supplies with Econocom Products and Solutions SA/NV
• merger of Wanlease Italia SPA with Econocom International Italia SPA
• internal transactions:
- Econocom Group SA/NV acquired 100% of the shares of Econocom SAS held by EMS SA/NV and EFSI BV.
3.2. Additions to the scope of consolidation in 2010
3.2.1. Acquisition of ECS Group
1. Description of the transaction
On 1 July 2010, the Group entered into exclusive negotiations with Société Générale to acquire ECS Group, a company specialising in IT management services, with the aim of becoming the leading provider of business-to-business mobility services.
On 10 September 2010, the acquisition contract was signed by the parties.
On 28 October 2010, following approval by the European competition authorities, the Group announced the finalisation of the entire share capital of ECS SA, the parent company whose subsidiaries are listed in Note 4 – List of consolidated companies.
The consolidated data for 2010 includes the contribution of ECS Group and its subsidiaries as of 1 October 2010. 1 October is deemed the acquisition date.
This major acquisition enables the Group to establish itself as the European leader in IT and telecom infrastructure management.
2. Determining and allocating the cost of the combination
The business combination was accounted for as of 1 October 2010, the date on which the acquisition of ECS Group became effective.
3. ChANGES IN ThE SCOPE OF CONSOLIDATIONThe consolidated financial statements of Econocom Group as of 31 December 2011 include the accounts of the companies listed in Note 4 – List of consolidated companies.
The cash flow impacts of major changes in the scope of consolidation are presented in Note 32.
3.1. Changes in the scope of consolidation in 2011
3.1.1. Acquisitions
In March 2011, the Group acquired Systems & Supplies, thereby consolidating its Distribution business in the medical sector in the Benelux, for €200 thousand. The entire cost of combination was allocated to the customer portfolio.
In November 2011, the Group acquired DB2A Pays de Loire and DB2A Bretagne Normandie, thereby consolidating its Leasing business, for €180 thousand. The entire cost of combination was allocated to the customer portfolio.
In December 2011, Econocom Group acquired 10% of Econocom Gmbh, bringing its interest up to 100%.
3.1.2. Company formations
Econocom Public BV was created on 28 December 2011, as part of the Group’s leasing operations in the Netherlands, in order to address the specific operational needs of the Dutch public sector market. It is wholly owned by Econocom Nederland BV.
3.1.3. Internal restructuring operations with no impact on the scope of consolidation
As part of the Group’s efforts to streamline the legal structures of its direct and indirect investments, the following operations were carried out:

76
The price was initially set at €210 million. The amount paid to Société Générale by Econocom Group was actually €178.8 million, following a payment by ECS of a 2009 dividend for the amount of €17.2 million and a payment by the seller of a price adjustment of €14.0 million paid as 890,000 Econocom Group shares.
This transaction was financed in the following way:
• an acquisition loan of €120 million;
• Econocom Group shares paid to Société Générale for the value of €30 million, or 1,354,376 of treasury shares and 1,372,897 newly issued shares (for a price of €11 per share) when title for all ECS shares was transferred;
• a €40 million bridge loan;
• available cash for the remaining amount.
Number of shares comprising ECS SA’s share capital
14,734,754
Number of shares acquired by Econocom Group
14,734,754
Or 100%
Acquisition price (in € thousands) 192,760
Earn-out (14,018)
Total cost of the business combinations
178,742
The cost of the business combination as of the acquisition date was calculated as follows:
In accordance with IFRS 3 revised, the Group had 12 months as from the acquisition date in which to finalise the purchase price allocation to ECS Group’s assets, liabilities and contingency liabilities.
The initial purchase price allocation of 1 October 2010 is now definitive.

notes to the consolidated financial statements
77
Notes fair value in
accordance with
ifrs: provisional
calculation
fair value in
accordance
with ifrs: final
calculation
Intangible assets, net 6 6,638 6,638
Customer portfolio 6 40,000 40,000
Goodwill 0 0
Property, plant and equipment, net 8 6,866 6,866
Financial assets 9 1,559 1,559
Deferred tax assets 30 19,514 25,546
Current assets
Inventories 11 4,867 4,867
Trade and other receivables 12 393,843 387,755
Current tax assets 6,897 6,897
Cash 13 11,148 11,148
Other current assets 12 142,012 149,614
Financial liabilities 18 561 561
Non-current provisions 16
Provisions for pensions and other commitments 17 6,151 6,151
Other non-current liabilities
Deferred tax liabilities 30 14,931 20,840
Current liabilities
Financial liabilities 18 116,646 116,341
Current provisions 16 21,591 22,912
Current tax liabilities 5,654 6,084
Trade and other payables 19 286,951 282,883
Other current liabilities 19 106,915 115,393
Total net assets acquired 73,944 69,725
Cost of business combination 192,760 178,742
provisional goodwill 118,816 109,017
When allocating the cost of this business combination, the Group recognised intangible assets as part of customer relations (see Note 6).
The estimation of provisions was reviewed in accordance with IFRS 3 revised. Provisions for pensions and other commitments were re-estimated according to the SoRIE
method described in Note 17 and certain contingent liabilities resulting from litigation in progress at the acquisition date gave rise to the recognition of provisions (see Note 16).
Deferred tax assets and liabilities were adjusted as a result of purchase price allocation.

78
The table below shows the various valuation methods used for the provisional allocation of the acquisition cost:
franchises, patents and licenses Cost approach method (amortised replacement cost)
intangible assetsCustomer relations
Multi-period excess earnings method
property, plant and equipmentProperty
Market approach method
financial assetsunguaranteed residual value of leased assets
Determined on a contract-by-contract basis, depending on the commercial residual value taken by ECS on each contract. When the financial residual value of a contract was lower than the commercial residual value, this was used as the unguaranteed residual value of leased assets.
investments Discontinued cash flows method
Goodwill essentially corresponds to market shares, development capacity, and the synergies expected, particularly in terms of complementary businesses and extended, strengthened European presence, operating and commercial costs and income which cannot be accounted for separately on Econocom Group’s statement of financial position.
The values used reflect Management’s best estimations.
(in € thousands)
eCs goodwill published as of 31 dec. 2010 118,816
Adjustment of the acquisition price (14,018)
IAS17 evaluation of contracts acquired 4,800
Evaluation of contract risks (878)
Impact of income tax on adjustments (1,086)
Other income tax adjustments 1,383
eCs goodwill published as of 31 dec. 2011 109,017
The provisional version will be changed to the final version in the following way:

• Internal transactions:
- Econocom SAS acquired:
• 100% of the shares of Econocom Products and Solutions SAS from EMS SA/NV
• 100% of the shares of Econocom Location SAS from EFSI BV
• 100% of the shares of ECS from Econocom Group SA/NV
These internal operations resulted in a capital increase at Econocom SAS of 2,362,463 shares.
The number of shares making up Econocom SAS’s share capital now stands at 2,456,623 shares, breaking down as follows:
• Econocom Group SA/NV: 556,740 shares, i.e., 22.66%
• Econocom Managed Services SA/NV: 809,515 shares, i.e., 32.96%
• EFSI BV: 1,090,368 shares, i.e., 44.38%
A capital increase was carried out by Econocom Managed Services SA/NV and subscribed by Econocom Group SA/NV by incorporating the current account. Econocom Group SA/NV now holds the entire share capital of Econocom Managed Services SA/NV.
notes to the consolidated financial statements
79
3. Pro forma information
If the acquisition of ECS Group had occurred on 1 January 2010, the Group’s revenue would have been €1,573 million, recurring operating profit would have been €47.3 million, and net attributable profit would have been €28.8 million..
3.2.2. Company formations in 2010
Econocom Finance SNC was created on 28 October 2010, as part of the acquisition of ECS Group. It is owned in equal parts by Econocom Lease SA/NV and Econocom Managed Services SA/NV. It was formed for the purpose of centralising the Group’s cash management to ensure that cash flow is well under control, thereby optimising the Group’s costs and financial investments.
3.2.3. Internal restructuring operations in 2010 with no impact on the scope of consolidation
As part of the Group’s efforts to streamline the legal structures of its direct and indirect investments, the following operations were carried out in 2010:
• merger of Promodata SAS, Econocom Enterprise Solutions EuRL, Econocom Gestion EuRL with Econocom Location SAS
• merger of SCI Alexandre with Econocom Products and Solutions SAS

4. LIST OF CONSOLIDATED COMPANIES
80
nameregistered office vAT no. % interest immediate holding company
2011 2010
Econocom SAS Nanterre FR 653 269 667 77 100% 22.66% Econocom Group SA/NV
32.95% Econocom Manages Services SA/NV
44.39% EFS International BV
Econocom Location SAS Nanterre FR 513 324 398 68 EFS International BV
100% 100% Econocom SAS
Atlance France SAS Nanterre FR 774 408 146 14 100% 100% Econocom Location SAS
GIE Econocom Enterprise Solutions France Nanterre FR 875 126167 98 25% 25% Econocom Locaiton SAS
25% 25% Econocom Managed services SAS
25% 25% Econocom Products and Solutions
25% 25% Econocom Telecom Services SAS
G.I.E. Econocom Nanterre FR 104 082 368 83 41.67% 41.67% Econocom Group SA/NV
58.33% 58.33% Econocom SAS
Econocom Products and Solutions Belux SA/NV Brussels BE 042 685 15 67 100% 100% Econocom Group SA/NV
Econocom Managed Services SA/NV Brussels BE 043 209 34 28 100% 100% Econocom Group SA/NV
Atlance SA/NV Brussels BE 047 648 96 35 99.93% 99.93% Econocom Lease SA/NV
0.07% 0.07% Econocom Managed Services SA/NV
Econocom PSF SA Luxembourg Lu 181 844 17 0.08% 0.08%Econocom Products and Solutions
Belux SA/NV
99.92% 99.92% Econocom Group SA/NV
Econocom Luxembourg SA Luxembourg Lu 134 543 64 100% 100% Econocom Lease SA/NV
Econocom Lease SA/NV Brussels BE 043 132 17 82 100% 100% Econocom Group SA/NV
Econocom Nederland BV Nieuwegein NL 007 552 506 B01 100% 100% EFS International BV
Econocom Public BV Nieuwegein NL 851 221 658 B01 100% Econocom Nederland BV
Econocom Gmbh Frankfurt DE 225 258 231 100% 90% Econocom Group SA/NV
Econocom Services Gmbh Frankfurt DE266737264 100% 100% Econocom Gmbh
Econocom Expert International holding BV Nieuwegein NL 007 552 506 B02 50.10% 50.10% Econocom Group SA/NV
Econocom Managed Services BV Nieuwegein NL 007 552 506 B01 100% 100% Econocom Nederland BV
Econocom uK Ltd Chertsey GB 386 394 113 100% 100% Econocom Group SA/NV
Econocom SA (Spain) Madrid ES A78 017 282 100% 99.99% Econocom Group SA/NV
0.01% Econocom SAS
Econocom Locazione Italia SPA Milano IT 076 558 901 55 93.57% 93.57% Econocom Group SA/NV
6.43% 6.43% Econocom SAS
Econocom Products and Solutions SAS Les ulis FR 953 315 664 30 100% 100% Econocom Managed Services SA/NV
Econocom Managed Services SAS Nanterre FR 083 422 331 03 100% 100% Econocom Products and Solutions SAS
Synopse SAS Nanterre FR 064 009 426 11 100% 100% Econocom Managed Services SAS
Econocom Maroc SARL Rabat 100% 100% Econocom Managed Services SAS
Econocom Telecom Services SAS Clichy FR 503 532 352 45 88% 88% Econocom Products and Solutions SAS
Alliance Support Services SAS Les ulis FR 464 513 670 72 100% 100% Econocom Products and Solutions SAS
Asystel SASAsnières sur Seine
FR185 017 211 53 100% 100% Econocom Products and Solutions SAS

notes to the consolidated financial statements
81
nameregistered office vAT no. % interest immediate holding company
2011 2010
A2Z holding NV Brussels BE 044 560 86 94 100% 100% Econocom Group SA/NV
A2Z Solutions NV Brussels BE 044 848 72 20 100% 100% A2Z holding NV
Econocom Finance SNC Brussels BE0830.430.559 18.98% Econocom Group SA/NV
40.51% 50% Econocom Managed Services SA/NV
40.51% 50% Econocom Lease SA/NV
Data Networks France SARL Clichy FR 314 141 463 24 100% 100% A2Z holding NV
EFS International BV Nieuwegein NL 817 289 094 b01 100% 100% Econocom Group SA/NV
Econocom France SA (ECS SA) Nanterre FR67 301 364 824 100% 100% Econocom SAS
Econocom International Italia SpA
(ECS International Italia SpA)Milano IT07933030152 100% 100% Econocom France SA
Econocom Deutschland holding Gmbh
(ECS Deutschland holding Gmbh)Ettlingen DE 114143755 100% 100% Econocom France SA
Econocom Deutschland Gmbh
(ECS Deutschland Gmbh)Ettlingen DE 226562411 100% 100% Econocom Deutschland holding Gmbh
Econocom Belgium S.A./N.V.
(ECS Belgium SA/NV)Brussels BE 0429 616 166 100% 100% Econocom France SA
ECS International Corporation uSAWilmington
New Castle 100% 100% Econocom France SA
Econocom Spain SAu
(ECS International Espana SAu)Barcelona ESA78836996 100% 100% Econocom France SA
Econocom Plc (ECS united Kingdom Plc) Richmond GB 429 820 536 100% 100% Econocom France SA
Econocom BV
(ECS International Netherlands BV)Amersfoort NL807576359B01 100% 100% Econocom France SA
Econocom Polska Sp.z.o.o.
(ECS International Polska S.p.z.o.o)Warszawa PL 5252186685 100% 100% Econocom France SA
Econocom Technology Finance Ltd
(high Technology Finance Ltd)Dublin IE 951 3453 D 100% 100% Econocom Plc
Econocom Location Luxembourg SA
(ECS Luxembourg SA)Luxembourg Lu 18756845 99.69% 99.69% Econocom Belgium SA/NV
0.31% 0.31% Econocom France SA
Econocom Switzerland SA
(ECS International Switzerland SA)Nyon 625,894 100% 100% Econocom France SA
Econocom Czech Republic s.r.o
(ECS international Czech Republic s.r.o)Praha CZ27382893 100% 100% Econocom France SA
Econocom Managed Services AG
(ECS Technoservice solutions AG)Frankfurt DE 113 58 95 23 100% 100% Econocom Deutschland holding Gmbh
Econocom Location Maroc
(ex ECS International Maroc SA)Casablanca 100% 100% Econocom France SA
Econocom International Romania Srl Bucharest RO22396330 100% 100% Econocom France SA
ECS Shanghai Co. Ltd Shanghai 100% 100% Econocom France SA
Econocom Slovakia, s.r.o (ECS International
Slovakia s.r.o)Bratislava SK2022858046 100% 100% Econocom France SA
Ficorent SA Nyon 456,260 100% 100% Econocom Switzerland SA
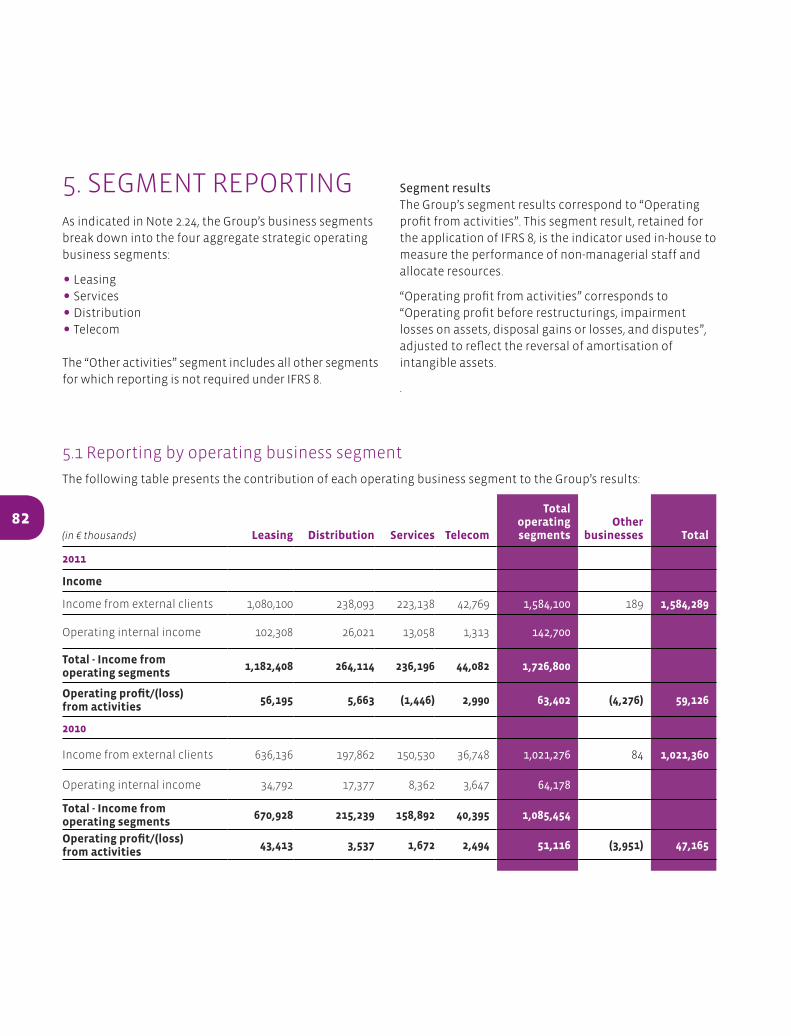
5. SEGMENT REPORTINGAs indicated in Note 2.24, the Group’s business segments break down into the four aggregate strategic operating business segments:
• Leasing
• Services
• Distribution
• Telecom
The “Other activities” segment includes all other segments for which reporting is not required under IFRS 8.
82(in € thousands) leasing distribution services Telecom
Total operating segments
other businesses Total
2011
income
Income from external clients 1,080,100 238,093 223,138 42,769 1,584,100 189 1,584,289
Operating internal income 102,308 26,021 13,058 1,313 142,700
Total - income from operating segments
1,182,408 264,114 236,196 44,082 1,726,800
operating profit/(loss) from activities
56,195 5,663 (1,446) 2,990 63,402 (4,276) 59,126
2010
Income from external clients 636,136 197,862 150,530 36,748 1,021,276 84 1,021,360
Operating internal income 34,792 17,377 8,362 3,647 64,178
Total - income from operating segments
670,928 215,239 158,892 40,395 1,085,454
operating profit/(loss) from activities
43,413 3,537 1,672 2,494 51,116 (3,951) 47,165
Segment resultsThe Group’s segment results correspond to “Operating profit from activities”. This segment result, retained for the application of IFRS 8, is the indicator used in-house to measure the performance of non-managerial staff and allocate resources.
“Operating profit from activities” corresponds to “Operating profit before restructurings, impairment losses on assets, disposal gains or losses, and disputes”, adjusted to reflect the reversal of amortisation of intangible assets.
.
5.1 Reporting by operating business segment
The following table presents the contribution of each operating business segment to the Group’s results:

notes to the consolidated financial statements
83
(in € thousands) 2011 2010
Income from operating segments 1,726,800 1,085,454
Income from "Other activities" segment 189 84
Elimination of internal revenue (142,700) (64,178)
Total income from continuing operations 1,584,289 1,021,360
Operating Profit/(Loss) from activities 63,402 51,116
Profit/(Loss) from "Other activities" segment (4,276) (3,951)
operating segments activity profit/(loss) 59,126 47,165
Amortisation of intangible assets (1,829) (148)
Additions and reversals of provisions for risks 7,271
operating profit before restructurings, impairment losses on assets, diposal gains or losses and disputes
64,568 47,017
Costs of acquisition of ECS Group (6,447)
Non-current risks (638)
Costs of reorganisations (14,938)
Impairment of goodwill (3,650)
Profit/(Loss) on disposal of investment property 335
operating profit 45,980 40,267
Other financial income and expense (11,875) 851
profit before tax 34,105 41,118
5.2. Reconciliation with the consolidated financial statements
revenue by geographical region
(in € thousands) 2011 2010
France 731,203 556,005
Benelux 373,122 259,430
Southern Europe (Spain, Italy) 288,154 158,941
Northern and Eastern Europe (Germany, Eastern European countries, united Kingdom) 191,810 46,984
1,584,289 1,021,360
5.3. Geographical segments
Geographical segment data presented in the table below were prepared on the basis of the geographical coverage of clients for revenue.

84
6. INTANGIBLE ASSETS 2011
(in € thousands)
Customer portfolio and
business assets
franchises, patents, licences,
etc.eCs iT
system other Total
Acquisition cost
Gross value as of 31 December 2010 42,370 19,409 12,900 706 75,385
Acquisitions 320 2,764 254 3,338
Disposals (140) (140)
Transfers and other movements (22) (22)
gross value as at 31 december 2011 42,690 22,011 13,154 706 78,561
Amortisation and impairment
Accumulated amortisation and impairment as of 31 December 2010
(854) (13,392) (8,772) (706) (23,724)
Amortisation expense (2,501) (1,767) (1,930) (6,198)
Disposals 0
Transfers and other movements 0
Accumulated amortisation and impairment as of 31 december 2011
(3,355) (15,160) (10,702) (706) (29,922)
Carrying amount as of 31 december 2010
41,516 6,017 4,128 51,661
Carrying amount as of 31 december 2011
39,335 6,852 2,452 48,639

notes to the consolidated financial statements
85
INTANGIBLE ASSETS 2010
(in € thousands)
Customer portfolio and
business assets
franchises, patents, licences,
etc.eCs iT
system other Total
Acquisition cost
Gross value as of 31 December 2009 0 11,127 0 706 11,834
Acquisitions 2,370 2,020 8 4,398
Disposals (408) (408)
Changes in scope of consolidation 40,000 6,670 12,892 59,562
gross value as of 31 december 2010 42,370 19,409 12,900 706 75,385
Amortisation and impairment 0 0
Accumulated amortisation and impairment as of 31 December 2009
(7,713) (706) (8,419)
Amortisation expense (354) (1,220) (423) (1,997)
Disposals 115 115
Changes in scope of consolidation (500) (4,574) (8,349) (13,423)
Accumulated amortisation and impairment as of 31 december 2010
(854) (13,392) (8,772) (706) (23,724)
Carrying amount as of 31 december 2009
0 3,414 0 0 3,414
Carrying amount as of 31 december 2010
41,516 6,017 4,128 0 51,661

86
7. GOODWILL For the purposes of impairment testing, consolidated goodwill is allocated to cash generating units (CGus) as follows:
2011 (in € thousands) leasing distribution services Telecom Total
Goodwill as of 1 January 2011 108,686 1,211 17,670 10,306 137,873
Acquisitions 0
Impairment (3,650) (3,650)
goodwill as of 31 december 2011 108,686 1,211 14,020 10,306 134,223
of which gross 108,686 1,211 18,281 10,306 138,484
of which accumulated impairment (4,261) (4,261)
In 2011, the Group finalised allocation of the cost of regrouping ECS Group, which entered the scope of consolidation on 1 October 2010. This resulted in a fall in goodwill of €9,799 thousand.
2010 (in € thousands) leasing distribution services Telecom Total
Goodwill as of 1 January 2010 4,980 1,211 12,359 10,306 28,856
Acquisitions 103,706 5,311 109,017
Impairment 0
goodwill as of 31 december 2010 108,686 1,211 17,670 10,306 137,873
of which gross 108,686 1,211 18,281 10,306 138,484
of which accumulated impairment (611) (611)

7.1. Definition of cash-generating units and allocation of ECS goodwill
Definition of cash-generating units
The CGus used until the end of 2010 were based on the nature of the Group’s business in each country (e.g. Services in France). The growth of the Group, and in particular resulting from the acquisition of ECS Group, and the international expansion of our client companies, have led the Group to redefine the scope of its CGus. As of 2011, the Group’s goodwill will be tested as part of the four CGus representing the Group’s four areas of business: Leasing, Distribution, Services, and Telecoms.
In the course of this business combination, the Group recorded impairment of €3.65 million on the goodwill of Alliance Support Services, based on a separate assessment.
Allocation of the goodwill from the acquisition of ECS by CGU
ECS’ goodwill, as described in Note 3, was allocated to the Group’s CGus as shown below:
7.2 Impairment tests and impairment of goodwill
Goodwill was tested for impairment in accordance with the methods outlined in Note 2.11 “Impairment of assets”.
The recoverable amount of the CGus was determined by calculating the value in use using the discounted cash flow method. The calculation was performed using four-year cash flow projections based on business plans and forecasts approved by Management. The discount rate used was set at 8.9%. Cash flow projections beyond the projected timeframe were extrapolated using a perpetual growth rate of 1%. These growth rates are consistent with the business plans used, the development potential of the markets on which the CGus entities operate and with the competitive positions on those markets.
In the context of a sensitivity analysis, a differential assumption using a discount rate which is two percentage points higher than the base rate of 8.9% would not change the conclusions of the analysis. The same would be true if cash flows over the last four years of the business plan were reduced by 10%. Lastly, no impairment would be required if the perpetual growth rate were reduced to 0%.
The Alliance Support Services activity was nevertheless tested separately this year, due to its performance which fell short of the Business Plan before the CGus were combined. This separate test revealed impairment of €3,650,000. Alliance Support Services is part of the Services CGu.
(in € thousands)
Cgu goodWill
Leasing 103,706
Services 5,311
Total 109,017
notes to the consolidated financial statements
87

88
8. PROPERTY, PLANT & EQuIPMENT 2011Changes in the gross value of property, plant and equipment as well as the related depreciation expense are presented below for 2011:
(in € thousands)land and buildings
plant and iT equipment
furnitureand
vehicles
other items of property,
plant & equipment
property, plant and equipment
held under finance leases (1) Total
Acquisition cost
gross value as of 31 december 2010 10,583 24,884 7,204 61 2,196 44,928
Acquisitions 133 4,534 191 4,858
Disposals (3,452) (541) (721) (4,714)
Changes in scope of consolidation
Translation adjustments 58 (13) 45
Transfers and other movements (108) 628 (659) (139)
gross value as of 31 december 2011 10,608 26,652 6,182 61 1,475 44,978
depreciation and impairment
Accumulated depreciation and impairment as of 31 December 2010
(5,093) (19,039) (5,842) (1,485) (31,459)
Additions (498) (2,307) (393) (656) (3,854)
Reversals 54 54
Disposals 2,647 365 612 3,624
Changes in scope of consolidation
Translation adjustments (49) 9 (40)
Transfers and other movements 59 (507) 509 61
Accumulated depreciation and impairment as of 31 december 2011
(5,532) (19,255) (5,352) (1,475) (31,614)
Carrying amount as of 31 december 2010
5,490 5,845 1,362 61 711 13,469
Carrying amount as of 31 december 2011
5,076 7,397 830 61 0 13,364
(1) Assets held under finance leases solely comprise IT equipment leased to clients which is classified under furniture and vehicles owned by the Group for its own purposes, i.e., not refinanced via a refinancing institution.

notes to the consolidated financial statements
89
8. PROPERTY, PLANT & EQuIPMENT 2010
(in € thousands)land and buildings
plant and iT equipment
furnitureand
vehicles
other items of property,
plant & equipment
property, plant and equipment
held under finance leases (1) Total
Acquisition cost
gross value as of 31 december 2009 8,267 13,194 2,305 174 3,053 26,993
Acquisitions 106 1,232 189 3,061 4,588
Disposals (1,470) (4,734) (102) (5,694) (12,000)
Changes in scope of consolidation 4,315 14,529 4,755 4 23,603
Translation adjustments 54 3 57
Transfers and other movements (635) 609 54 (117) 1,776 1,687
gross value as of 31 december 2010 10,583 24,884 7,204 61 2,196 44,928
depreciation and impairment
Accumulated depreciation and impairment as of 31 December 2009
(4,104) (9,925) (1,661) (74) (2,085) (17,849)
Additions (170) (1,295) (368) (1,884) (3,717)
Reversals 49 49
Disposals 857 3,158 100 3,143 7,258
Changes in scope of consolidation (2,003) (10,644) (3,887) (16,534)
Translation adjustments (51) (2) (53)
Transfers and other movements 327 (282) (24) 74 (708) (613)
Accumulated depreciation and impairment as of 31 december 2010
(5,093) (19,039) (5,842) (1,485) (31,459)
Carrying amount as of 31 december 2009
4,163 3,269 644 100 968 9,144
Carrying amount as of 31 december 2010
5,490 5,845 1,362 61 711 13,469
(1) Assets held under finance leases solely comprise IT equipment leased to clients which is classified under furniture and vehicles owned by the Group for its own purposes, i.e., not refinanced via a refinancing institution.

9. FINANCIAL ASSETSThe following table presents a breakdown of financial assets:
90
(in € thousands)
investmentsin
non-consolidated companies
investmentsaccounted for
under the equity method
unguaranteed residual value
of leasedassets
other financial
assets Total
Balance as of 31 december 2009 2 58 14,316 7,602 21,978
Increases 4 8,244 13,145 21,393
Repayments (1) (13,082) (13,083)
Changes in scope of consolidation 1,230 1,562 2,792
Translation adjustments 1 1
Fair value adjustments 0
Other movements 32 32
Balance as of 31 december 2010 2 62 23,790 9,259 33,113
Increases 40 10,875 3,136 14,051
Repayments (1,016) (1,091) (2,106)
Changes in scope of consolidation 0
Translation adjustments (1) 1 (0)
Fair value adjustments 0
Other movements 0
Balance as of 31 december 2011 2 102 33,649 11,305 45,058
Maturities of financial assets
Other financial assets correspond to guarantees and deposits.
2011 < 1 yeardue in 1
to 5 years > 5 years Total
Investments in non-consolidated companies 2 2
Investment accounted for under the equity method 102 102
unguaranteed residual value of leased assets 33,646 3 33,649
Guarantees given to factors 9,389 9,389
Other guarantees and deposits 1,422 494 1,916
Total 9,389 35,170 499 45,058

notes to the consolidated financial statements
91
2010 < 1 yeardue in 1
to 5 years > 5 years Total
Investments in non-consolidated companies 2 2
Investments accounted for under the equity method 62 62
unguaranteed residual value of leased assets 23,752 38 23,790
Guarantees given to factors 6,645 6,645
Other guarantees and deposits 2,606 8 2,614
Total 6,645 26,420 48 33,113
Analysis of “unguaranteed residual value of leased assets”
The positive difference, calculated on a contract by contract basis, between the long- and short-term future
(in € thousands) 2011 2010
Long-term 33,649 23,790
Short-term 3,911 2,398
unguaranteed residual value of leased assets, net 37,560 26,188
Gross and net unguaranteed residual value of leased assets by maturity is as follows:
31 dec. 2011 < 1 yeardue in 1
to 5 years > 5 years Total
unguaranteed residual value of leased assets, gross
20,774 63,965 4 84,744
Financial residual value (16,863) (30,320) (1) (47,184)
unguaranteed residual value of leased assets, net
3,911 33,646 3 37,560
31 dec. 2010 < 1 yeardue in 1
to 5 years > 5 years Total
unguaranteed residual value of leased assets, gross
21,852 64,056 37 85,945
Financial residual value (19,454) (40,303) (0) (59,757)
unguaranteed residual value of leased assets, net
2,398 23,753 37 26,188
value of the equipment and the financial residual value is recognised in financial assets due in more than one year, and in “Other receivables” for assets due in less than one year.

92
10. LONG-TERM RECEIVABLESlong-term receivables (in € thousands) 31 dec. 2011 31 dec. 2010
Long-term tax receivables 35 0
Other long-term receivables 2,166 2,265
Total 2,201 2,265
By maturity 31 dec. 2011 31 dec. 2010
1 to 5 years 944 1,588
> 5 years 1,257 677
Total 2,201 2,265
Other long-term receivables mainly relate to:
• loans to institutions providing regulated housing loans for an amount of €1,361K;
• loans to personnel for an amount of €423K;
• €417K representing the present value of a receivable owed by a French company that was previously placed in receivership and for which a four-year recovery plan has been set up.

notes to the consolidated financial statements
93
11. INVENTORIES(in € thousands) 31 dec. 2011 31 dec. 2010
gross provision net gross provision net
Equipment in the process of being refinanced 6,458 (1,696) 4,761 5,951 (1,678) 4,273
Other inventories 15,314 (5,217) 10,097 17,904 (5,923) 11,980
IT and telecom equipment 4,879 (243) 4,636 6,437 (157) 6,280
Spare parts 10,435 (4,974) 5,461 11,466 (5,766) 5,700
Total 21,771 (6,913) 14,858 23,854 (7,602) 16,253
Gross value
(in € thousands)
As of 31 Dec. 2010
Changes in inventories
As of 31 dec. 2011
Equipment in the process of being refinanced 5,951 507 6,458
Other inventories 17,904 (2,590) 15,314
IT and telecom equipment 6,437 (1,559) 4,879
Spare parts 11,466 (1,031) 10,435
Total 23,854 (2,083) 21,771
Impairment of inventories
(in € thousands)
As of 31 Dec. 2010 Additions Reversals
Other changes
(reclassifi-cation)
As of 31 dec. 2011
Equipment in the process of being refinanced (1,678) (590) 113 459 (1,696)
Other inventories (5,923) (164) 871 0 (5,217)
IT and telecom equipment (157) (97) 11 0 (243)
Spare parts (5,766) (67) 859 0 (4,974)
Total (7,602) (754) 984 459 (6,913)

94
12. TRADE AND OThER RECEIVABLES AND OThER CuRRENT ASSETS VAT receivables should be analysed in light of VAT payables. Other receivables represent advances to employees as well as miscellaneous receivables owed by third parties (including tax receivables, amounts due from suppliers, etc.) and by related parties.
(in € thousands) 31 dec. 2011 31 dec. 2010
Trade receivables 546,522 593,629
Other receivables 50,230 76,843
Trade receivables and other receivables 596,752 670,472
Trade receivables
(in € thousands) 31 dec. 2011 31 dec. 2010
Trade receivables - gross 577,464 627,909
Refinancing institutions 158,839 308,282
Other 418,625 319,627
impairment losses on doubtful debts (30,942) (34,279)
net value 546,522 593,629
Refinancing institutions correspond to financial institutions which are subsidiaries of banks.
Impairment losses on doubtful debts
(in € thousands)
As of 31 Dec. 2010 Additions Reversals
Changes in the scope of
consolidationOther
movementsAs of
31 dec. 2011
Impairment losses on doubtful debts (34,279) (6,011) 10,543 0 (1,195) (30,942)
A provision for impairment is booked when there is a major doubt as to whether the Group will be able to collect the debt in question.

notes to the consolidated financial statements
95
Other receivables
(in € thousands) 31 dec. 2011 31 dec. 2010
Recoverable VAT 15,656 51,170
Due from suppliers 21,533 3,578
Current portion of the residual value of leased assets 3,911 2,398
Advances to agents 1,166 725
Factoring receivables 4,017 4,681
Other receivables 3,947 14,291
Trade and other receivables 50,230 76,843
Other current assets
(in € thousands) 31 dec. 2011 31 dec. 2010
Prepaid expenses 19,957 54,731
Miscellaneous current assets 1,193 1,882
other current assets 21,151 56,613

96
13. CASh AND CASh EQuIVALENTS
Cash equivalents consist of investments with maturities of less than three months that are readily convertible into cash and which are subject to an insignificant risk of changes in value.
None of the Group’s cash or cash equivalents are subject to any restrictions.
(in € thousands) 31 dec. 2011 31 dec. 2010
Cash 120,460 87,162
Cash in hand 17 12
Demand accounts 120,443 87,150
CAsh equivAlenTs 24,312 130,711
Term accounts 3,357 39,519
Marketable securities 20,955 91,192
Cash and cash equivalents 144,772 217,873
31 December 2011 €74.8 million
31 December 2010 €56.5 million
As of 31 December 2011:
1 - The accounting treatment of bridges on lease contracts mentioned in Note 2.9.1 contributed €85.6 million to net cash and cash equivalents as of 31 December 2011, compared with €27.4 million for the year ended 31 December 2010. The significant rise in bridges is mainly due to two major contracts signed in the Netherlands.
2 - The amount of factored receivables derecognised in accordance with the accounting method described in Note 2.12.2 is as follows:.

notes to the consolidated financial statements
97
14. FAIR VALuE OF FINANCIAL ASSETSFinancial instruments are measured using market prices resulting from trades on a national stock market or over-the-counter markets. If listed market prices are not available, fair value is measured using other valuation methods including, inter alia, discounted future cash flows.
In any event, estimated market values are based on certain market interpretations required for measurement purposes.
As such, these estimates do not necessarily reflect the amounts that the Group would actually receive or pay out if the financial instruments were to be traded on the market. The use of different estimates, methods and assumptions may have a material impact on estimated fair values.
In view of their short-term nature, the carrying amount of trade and other receivables, and cash and cash equivalents is an estimate of their fair value.
The Group’s financial assets as of 31 December 2011 can be analysed as follows:
Notes (in € thousands) statement of financial position headings
loans and receivables Carrying amount
9 Financial assets 44,954 44,954
Guarantees and deposits 11,305 11,305
Unguaranteed residual value of leased assets (non-current portion)
33,649 33,649
10 Long-term receivables 2,201 2,201
12 Trade receivables 546,522 546,522
12 Other receivables 50,060 50,060
Other receivables 46,149 46,149
Unguaranteed residual value of leased assets (current portion) 3,911 3,911
13 Cash and cash equivalents 144,772 144,772
Total financial assets 788,909 788,909
Based on available information, the fair value of the Group’s financial assets approximates their carrying amount.

98
15. EQuITY15.1. Share capital
(1) Equity items were calculated in comparison with the convertible bond debt item calculated at the debt rate without a conversion option, in compliance with IAS 32 section 29-30 which defines equity items as residual.
15.2. Currency translation reserves
Currency translation reserves are the cumulative effect of the consolidation of subsidiaries with functional currencies other than the euro.
The amount of foreign exchange differences in equity is broken down as follows:
The change in the number of shares in 2010 is a result of the capital increase which occurred when ECS Group was acquired as partial payment.
The number of bearer or dematerialised shares stands at 12,414,189. The number of registered shares is 13,758,708.
As of 31 December 2011, the authorised share capital stood at €15,285,000. This authorisation is valid until 17 May 2015.
This amount has therefore been deducted from equity as of 31 December 2011.
number of shares value (in € thousands)
Total Treasury stock outstandingshare
capitalpaid-in capital
Treasury stock
As of 31 december 2009 24,800,000 2,209,318 22,590,682 16,181 55,038 (16,829)
Issue 1,372,897 1,372,897 896 14,206
Purchases of treasury stock 764,586 (764,586) (7,996)
Sales of treasury stock (1,661,376) 1,661,376 6,505
Options exercised (246,700) 246,700 2,309
As of 31 december 2010 26,172,897 1,065,828 25,997,069 17,077 69,244 (16,011)
Issue 0
Purchases of treasury stock 595,104 (595,104) (7,563)
Sales of treasury stock
Convertible bonds - Equity items(1) 3,286
Options exercised (80,000) 80,000 932
As of 31 december 2011 26,172,897 1,580,932 25,481,965 17,077 72,530 (22,642)
foreign exchange differences by currency (in € thousands) 31 dec. 2011 31 dec. 2010
Swiss Franc (ChF) (568) (502)
China Yuan Renminbi (CNY) (70) (35)
Czech Republic Koruna (CZK) (1) (19)
Pound Sterling (GBP) (3,219) (3,653)
united States Dollar (uSD) (7) (13)
Moroccan Dirham (MAD) 6 (15)
Polish Zloty (PLN) (374) (225)
New Romanian Leu (RON) (78) (70)
Total (4,311) (4,532)

notes to the consolidated financial statements
99
15.3. Changes in equity not recognised in profit or loss
15.3.1. Stock option plans
Since 1998, stock options have been granted to some of the Group’s members of staff, managers and corporate officers for an agreed unit price. The characteristics of these plans are detailed below:
stock option plansnumber of options
outstandingexpiry
dateexercise price
(in €)
2008 10,000 April 2013 7.7
2010 353,000 January 2014 10.97
550,000 January 2014 9.91
2011 30,000 December 2015 12.93
790,000 December 2016 12.25
Total 1,733,000
general disclosures specific disclosures in accordance with ifrs 2
plans
number of options
outstanding fair value(1) volatilityduration of the options
dividend (in €) rfir(2)
2008 10,000 1.82 40% 5 years 0.24 4.0%
2010 353,000 2.18 23% 4 years 0.30 4.0%
550,000 1.80 23% 4 years 0.30 4.0%
2011 30,000 2.69 34% 3 years 0.40 2.0%
790,000 2.81 34% 4 years 0.40 2.0%
(1) Fair value of the option (in euros).(2) RFIR: risk-free interest rate.
2011 2010
Options outstanding as of 1 January 1,093,000 390,700
Options granted during the year 820,000 1003000
Options exercised during the year (80,000) (246,700)
Options expired during the year and forfeited (100,000) (54,000)
options outstanding as of 31 december 1,733,000 1,093,000
The weighted average price of the option is the same as the exercise price.
The expected volatility is measured by the stockbroker in charge of the share on a daily basis and in line with the duration of the options and the previous changes to the share.
A detailed description of these stock option plans can be found in section 5.10 of the Management Report.
Changes in the number of share purchase options in the year are as follows:

100
payable in 2012 paid in 2011 paid in 2010
Total dividend (in € thousands) 10,969 9,161 7,440
dividend per share (in €) 0.40 0.35 0.30
15.4. Non-controlling interests
Changes in non-controlling interests are presented as follows:
(in € thousands) 2011
As of 31 December 2010 67
2011 profit attributable to non-controlling interests (214)
Changes in the scope of consolidation
Other movements 28As of 31 December 2011 (119)
In accordance with IFRS 2 – Share-based payments, plans granted after 7 November 2002 are measured in a specific way in the Group’s statement of financial position.
As of 31 December 2011, stock option plans affect the Group’s equity in the amount of of €287,000.
The impact on the 2011 results from stock options is an expense of €587,000.
15.3.2. Provisions for pensions and other commitments
The impact of provisions for pensions and other commitments on consolidated equity is described in Note 17.
15.3.3. Treasury stock
The group has a treasury stock buyback plan.
This treasury stock is held by Econocom Group SA/NV. The total number of shares held cannot exceed 20% of the total number of shares issued as part of the share capital.
The net acquisition cost of the shares bought and the income from the sale of the shares have been attributed to decreases and increases in equity respectively.
15.3.4. Dividends
The table below shows the dividend amount per share paid by the Group in previous years and the amount the Board of Directors recommended in 2010, subject to approval during the Ordinary General Meeting on 15 May 2012.
As the dividend price is subject to approval at the Annual General Meeting, it was not recognised as a liability in the financial statements as of 31 December 2011.

16. PROVISIONS
(in € thousands) provisions restructuring
employee- related
contingencies
Tax and legal
risks
deferred commis-
sions other
risks Total
Balance as of 31 december 2009 6 980 1,239 1,314 1,029 2,037 6,604
Additions 1,593 27 21 77 80 3,246 5,043
Reversals (704) (330) (503) (410) (2,546) (4,491)
Changes in scope of consolidation 381 8,342 2,200 9,641 20,564
Translation adjustments 1 17 17
Other movements 0
Balance as of 31 december 2010 1,599 684 9,272 888 2,900 12,395 27,737
Additions 226 534 2,857 724 778 1,743 6,863
Reversals (1,611) (191) (1,981) (193) (509) (2,052) (6,536)
Changes in scope of consolidation 3 0 3
Translation adjustments 2 1 (0) (14) (12)
Other movements 59 1,000 457 1,518
Balance as of 31 december 2011 214 1,027 10,209 2,420 3,173 12,529 29,573
Current 214 582 10,209 2,420 3,171 12,529 29,126
Non-current 445 2 447
(in € thousands) 31 dec. 2011 31 dec. 2010
Non-current provisions 448 450
Current provisions 29,125 27,287
Total provisions 29,573 27,737
impact (net of incurred expenses)
(in € thousands) Additions reversal
Recurring operating profit (loss) 6,275 (4,625)
Non-current operating items 588 (1,612)
Income tax 0 (299)
Total 6,863 (6,536)
notes to the consolidated financial statements
101

102
A provision is recognised when an obligation (legal or constructive) resulting from a past event with regard to a third-party will cause, in an unquestionable or probable way, an outflow of resources whose amount can be estimated reliably. Provisions are reviewed at each reporting date and adjusted where appropriate to reflect the best estimate of the obligation at that date.
non-current provisions
Provisions for non-current personnel-related contingencies relate to a legal dispute concerning Promodata SNC. At the time of the acquisition of this company in October 2002, four managers were beneficiaries under a share purchase plan relating to Promodata SNC’s American parent company, Comdisco Inc., using a loan from a uS bank. Comdisco Inc. was subsequently declared bankrupt and the shares lost all value, following which one of the managers filed a claim against his employer, Promodata SNC. A settlement was reached in 2008. The other managers concerned by the
affair may also file claims. The provision therefore corresponds to an estimate of this risk.
Non-current provisions are not discounted.
Current provisions
Provisions for employee-related contingencies primarily concern claims brought before the French labour courts.
Provisions for deferred commissions are calculated contract-by-contract based on the unguaranteed residual value of leased assets, less any residual commercial value of the contracts concerned.
Provisions for risks related to the Leasing activity represent a provision on outstanding rentals receivable on self-financed contracts.
Other contingencies mainly comprise the Group’s best estimate of its exposure in relation to a number of commercial legal disputes – in some cases legal proceedings have been issued against the Group.

17. PROVISIONS FOR PENSIONS AND OThER COMMITMENTS
17.1. Description of pension plans
The Group’s employees are entitled to short-term benefits (paid leave, sick leave, profit-sharing) and defined benefit/contribution post-employment benefits (severance pay).
The short-term benefits are expensed by the various Group entities that grant them.
Post-employment benefits are granted under defined contribution plans or defined benefit plans.
defined contribution plans
Defined contribution plans are characterised by periodic contributions to external agencies responsible for the plans’ administrative and financial management. The employer is therefore free of any subsequent obligation as the agency is in charge of paying employees the amounts to which they are entitled (basic Social Security pension plan, supplementary pension plans, defined contribution plans).
defined benefit plans
Defined benefit plans are characterised by the employer’s obligation to its employees. Provisions are therefore accrued to meet this obligation.
The defined benefit obligation is calculated using the projected unit credit method which uses actuarial assumptions of salary increases, retirement age, mortality, employee turnover and the discount rate.
Changes to the actuarial assumptions, or the difference between these assumptions and reality, result in actuarial gains or losses which are recognised in equity
for the period in which they occurred in accordance with the Group’s accounting principles.
For the Group, defined benefit post-employment plans primarily concern:
• Severance pay in France:
- Lump-sum benefits calculated according to the employee’s years of service and his/her average compensation received over the last 12 months prior to his/her departure. Article 22 of the Agreement states nevertheless that the compensation should not include premiums, bonuses or additional payments for overtime, travelling and secondment;
- The calculation is based on parameters defined by the human Resources Department in France in November each year;
- The calculated amount is set aside under provisions in the statement of financial position.
• Termination benefits in Italy:
- an allowance calculated according to the employee’s years of service and his/her annual gross salary, revised every year and paid either in advance or at the time of retirement or termination, whether voluntary or forced;
- the calculated amount is set aside under provisions in the statement of financial position. As any allowances after 1 January 2007 have been transferred to a third-party organisation, provisions only apply to allowances granted up to 31 Decembre 2006, which were still paid for by the employer on 31 Decembre 2011.
notes to the consolidated financial statements
103

104
17.2. Actuarial assumptions
Actuarial assumptions depend on a certain number of long-term parameters. These inputs are revised each year.
france italy
(in € thousands) 31 dec. 2011 31 dec. 2010 31 dec. 2011 31 dec. 2010
Retirement age 62-65 years 62-65 years 64 years 60-62 years
Salary increase rate (France) or allowance (Italy)
1.4% - 4% 1.4% - 4% 3% 3%
Rate of payroll expenses 45% 45% 29% 29%
Discount rate 4.8% 4.5% 4.8% 4.5%
Mortality table INSEE 2007-2009 INSEE 2006-2008 80% SIF 92 80% SIF 92
17.3. Summary of the financial position of defined benefit post-employment plans and other commitments
(1) “Other movements” in respect of other commitments correspond to the reclassification of termination benefits in Italy (Trattamento di fine rapporto) previously recognised in personnel costs.
(in € thousands) 31 dec. 2010
Changes in the scope of
consolida-tion
increases for the
year
reversals for the year
(utilised provisions)
reversals for the year
(surplus provisions)
Changes in actuarial
gains/(losses)
other movements 31 dec. 2011
Provision for pensions 8,785 0 207 (212) 0 (32) 0 8,748
Other commitments (1) 2,904 0 519 (410) 0 (47) 0 2,966
Total 11,689 0 726 (622) 0 (79) 0 11,714
summary of movements in 2011
summary of movements in 2010
(in € thousands) 31 dec. 2009
Changes in the scope of
consolida-tion
increases for the
year
reversals for the year
(utilised provisions)
reversals for the year
(surplus provisions)
Changes in actuarial
gains/(losses)
other movements 31 dec. 2010
Provision for pensions 3,702 4,639 551 0 0 (79) (28) 8,785
Other commitments (1) 1,230 1,512 382 (152) 0 (68) 0 2,904
Total 4,932 6,151 933 (152) 0 (147) (28) 11,689

18. FINANCIAL LIABILITIES (in € thousands) 31 dec. 2011 31 dec. 2010
Finance lease liabilities 11,520 6,986
Finance lease liabilities - real estate 2,577 2,838
Financial residual value 8,943 4,102
Other finance lease liabilities 0 46
Financial liabilities 0 116,570
Bond loans 76,520 0
Other borrowings 0 259
non-current financial debt 88,040 123,815
Bank borrowings 13,922 77,368
Bond loans (short-term portion) 3,360
Finance lease liabilities 35,976 23,735
Finance lease liabilities – real estate 260 215
Liabilities from contracts refinanced with recourse(1) 33,644 21,168
Financial residual value(2) 2,025 1,694
Other finance lease liabilities 46 658
Bank overdrafts 1,743 2,300
Other borrowings 12,263 23,361
Factoring payables(3) 12,189 11,531
Other borrowings and financial liabilities 74 11,830
Current financial debt 67,264 126,764
Total cost of debt 155,304 250,579
notes to the consolidated financial statements
105
On 18 May 2011, Econocom issued €84 million worth of convertible bonds.
These convertible bonds are listed on the Luxembourg stock exchange and their main characteristics are:
• maturity: 5 years
• annual coupon rate: 4%
• conversion price: €21, i.e. a premium of 25.15% compared with the price on 18 May 2011.
Should there be a request to convert any number of these bonds – which could happen at any time – the same number of newly-issued shares or treasury shares will be brought to the bond holder.
The purpose of this transaction was primarily to repay the bank loan secured for the acquisition of ECS Group in October 2010.
Of the initial amount of €132 million, a balance of €92 million was still due prior to the issue of convertible
(1) The debt from contracts refinanced with recourse is backed by our clients’ rent for contracts which are funded but for which the Group maintains part of the credit risk. The Group therefore incorporated a similar amount of unassigned debts, in accordance with IAS 32.(2) Econocom compares the future estimated value of equipment (residual interest) and the financial residual value of each contract. The net financial residual value revealed by the comparison on a contract-by-contract basis, is recognised as a finanicial liability. The difference is recognised in financial assets in the absence of any net financial residual value. The netting of this repurchase commitment with the future value of equipment resulted in a €47.2 million decrease in financial liabilities as of 31 December 2011 compared with €59.8 million as of 31 December 2010.(3) Factoring payables consist mainly of a €9.6 million reverse factoring contract and the residual risks arising from our factoring contracts.

106
(in € thousands) Total 2011due in 1 to
5 years > 5 years
Finance lease liabilities 11,520 10,136 1,383
Finance lease liabilities – real estate 2,577 1,194 1,383
Financial residual value 8,943 8,943 0
Other finance lease liabilities 0 0 0
Bond loans 76,520 76,520 0
Other borrowings 0 0 0
Total 88,040 86,656 1,383
non-current financial debt, analysed by maturity
(in € thousands) Total 2010due in 1 to
5 years > 5 years
Finance lease liabilities 6,986 5,272 1,714
Finance lease liabilities – real estate 2,838 1,131 1,706
Financial residual value 4,102 4,094 8
Other finance lease liabilities 46 46 0
Bond loans 116,570 116,570 0
Other borrowings 259 259 0
Total 123,815 122,101 1,714
non-current financial debt, analysed by maturity
(in € thousands) 31 dec. 2011 31 dec. 2010
Long-term 8,943 4,102
Short-term 2,025 1,694
Total financial residual value, net 10,968 5,796
Analysis of “financial residual value”
bonds. On 31 December 2011, this loan had been completely paid up. In the consolidated financial statements, the convertible bonds are for the most part recognised in financial liabilities (€79.9 million), except for the derivative included in the bond, the value of
which (€3.3 million) is recognised in equity (see Note 15). In accordance with IFRS, the issuance fees were recognised in equal parts in loan capital and equity, after which the interest rate of the “loan capital” component of the bond stood at 5.34%.
The negative difference, calculated on a contract-by-contract basis, between the long- and short-term future value of the equipment and the financial residual value
is recognised in non-current financial debt due in more than one year, and current financial debt due in less than one year.
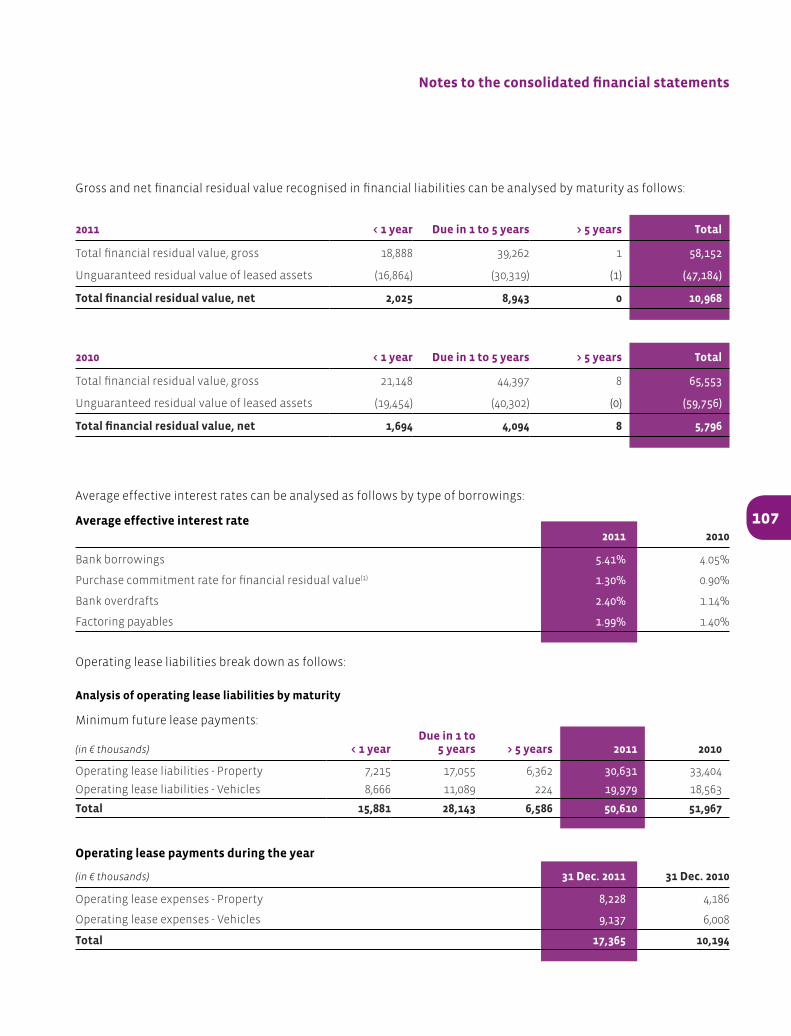
2011 < 1 year due in 1 to 5 years > 5 years Total
Total financial residual value, gross 18,888 39,262 1 58,152
unguaranteed residual value of leased assets (16,864) (30,319) (1) (47,184)
Total financial residual value, net 2,025 8,943 0 10,968
2011 2010
Bank borrowings 5.41% 4.05%
Purchase commitment rate for financial residual value(1) 1.30% 0.90%
Bank overdrafts 2.40% 1.14%
Factoring payables 1.99% 1.40%
Average effective interest rates can be analysed as follows by type of borrowings:
Average effective interest rate
(in € thousands) < 1 yeardue in 1 to
5 years > 5 years 2011 2010
Operating lease liabilities - Property 7,215 17,055 6,362 30,631 33,404
Operating lease liabilities - Vehicles 8,666 11,089 224 19,979 18,563
Total 15,881 28,143 6,586 50,610 51,967
Analysis of operating lease liabilities by maturity
Minimum future lease payments:
(in € thousands) 31 dec. 2011 31 dec. 2010
Operating lease expenses - Property 8,228 4,186
Operating lease expenses - Vehicles 9,137 6,008
Total 17,365 10,194
operating lease payments during the year
Gross and net financial residual value recognised in financial liabilities can be analysed by maturity as follows:
notes to the consolidated financial statements
107
Operating lease liabilities break down as follows:
2010 < 1 year due in 1 to 5 years > 5 years Total
Total financial residual value, gross 21,148 44,397 8 65,553
unguaranteed residual value of leased assets (19,454) (40,302) (0) (59,756)
Total financial residual value, net 1,694 4,094 8 5,796

108
19. TRADE AND OThER PAYABLES AND OThER CuRRENT LIABILITIES
(in € thousands) 31 dec. 2011 31 dec. 2010
Trade payables 495,946 601,125
Other payables 100,354 111,695
Trade and other payables 596,300 712,820
Other payables can be analysed as follows:
(in € thousands) 31 dec. 2011 31 dec. 2010
Accrued taxes and personnel costs 91,302 108,144
Dividends payable 245 204
Customer prepayments 8,807 3,346
other payables 100,354 111,695
Other current liabilities can be analysed as follows:
(in € thousands) 31 dec. 2011 31 dec. 2010
Other liabilities 5,852 12,131
Deferred income 86,464 52,850
Miscellaneous current liabilities 7,864 7,825
other current liabilities 100,180 72,806

20. FAIR VALuE OF FINANCIAL LIABILITIES
In view of their short-term nature, the carrying amount of trade and other payables approximates fair value.
The market value of financial instruments is measured based on valuations provided by bank counterparties or financial models widely used on financial markets, and on market information available at the reporting date.
Notes statement of financial position headingsfinancial liabilities
at amortised costCarrying amount
18 Current and non-current liabilities bearing interest 107,738 107,738
Bank borrowings 79,880 79,880
Finance lease liabilities 13,852 13,852
Bank overdrafts 1,743 1,743
Other borrowings 12,263 12,263
Non-current liabilities not bearing interest 2,675 2,675
19 Trade payables 495,946 495,946
19 Other payables 114,070 114,070
Total financial liabilities 720,430 720,430
Based on available information, the carrying amount of the Group’s financial liabilities approximates fair value.
21. REVENuE FROM CONTINuING OPERATIONS
Revenue from continuing operations can be analysed as follows:
(in € thousands) 2011 2010
Leasing 1,080,100 636,136
Distribution 238,093 197,862
Services 223,138 150,530
Telecom 42,769 36,748
Other revenue from operations 189 84
Total revenue from continuing operations 1,584,289 1,021,360
notes to the consolidated financial statements
109

110
22. PERSONNEL COSTS
The following table presents a breakdown of personnel costs:
(in € thousands) 2011 2010
Wages and salaries (150,882) (98,605)
Payroll costs (59,010) (36,041)
Provision expense for pension and other post-employment benefit obligations (104) (781)
Employee profit-sharing (2,088) (953)
Other (4,740) (3,837)
Total (216,825) (140,217)
Expenses relating to defined benefit pension plans only concern the Group’s French and Italian subsidiaries.
Further details about these plans are provided in Note 17.
The impact of share-based payment plans can be analysed as follows:
(in € thousands) 2011 2010
Stock options (587) (252)
Total (587) (252)
23. ExTERNAL ExPENSES
(in € thousands) 2011 2010
External services (rent, maintenance, insurance, etc.) (21,609) (14,252)
Agents’ commissions (21,413) (20,688)
Fees paid to intermediaries and other professionals (20,482) (17,321)
Other services and sundry goods (sub-contracting, public relations, transport, etc.) (33,902) (21,454)
Total (97,406) (73,715)
The following table presents a breakdown of external expenses:

24. ADDITIONS TO AND REVERSALS OF DEPRECIATION, AMORTISATION AND PROVISIONS
Additions to and reversals of depreciation, amortisation and provisions can be analysed as follows:
(in € thousands) 2011 2010
Intangible assets – Franchises, patents, licenses, business assets, etc. (6,198) (2,497)
Property, plant and equipment – Finance leases (602) (1,235)
Other items of property, plant and equipment (3,198) (2,433)
Provisions for operating contingencies and expenses (1,648) (553)
net additions to depreciation, amortisation and provisions (11,646) (6,717)
Additions to and reversals of provisions for restructuring are included in operating profit.
25. IMPAIRMENT LOSSES ON CuRRENT ASSETS, NET
The following table breaks down impairment losses on current assets by category.
(in € thousands) 2011 2010
Impairment of inventories (754) (3,135)
Reversals of impairment of inventories 984 4,162
Impairment losses on doubtful debts (8,573) (6,803)
Reversals of impairment losses on doubtful receivables 11,528 5,523
Total 3,184 (254)
notes to the consolidated financial statements
111

112
26. OThER OPERATING INCOME AND ExPENSES
Other operating income and expenses can be broken down as follows:
(in € thousands) 2011 2010
Miscellaneous benefits 1,408 1,468
Capital losses on sales of property, plant and equipment and intangible
assets – recurring operating activities(314) (606)
Capital losses on sales of trade receivables (51) (178)
Other (705) (61)
other operating income and expenses 338 622
27. FINANCIAL ExPENSE, OPERATING ACTIVITIESThe following table breaks down net financial expense from operating activities by type of income/expense:
(in € thousands) 2011 2010
Financial income related to the leasing business 1,649 1,536
Income from current assets 153 115
Miscellaneous financial income from operating activities 504 437
Exchange gains 1,765 1,977
Total financial income from operating activities 4,071 4,065
Financial expenses related to the leasing business (598) (744)
Financial expenses related to bank overdrafts (3,036) (807)
Financial expenses related to factoring (1,317) (497)
Financial expenses related to miscellaneous operating activities (707) (446)
Exchange losses (1,894) (1,883)
Total financial expenses from operating activities (7,552) (4,377)
financial expense, operating activities (3,481) (312)
net exchange gains/(losses) recorded in the income statement
(in € thousands) 2011 2010
ChF 105 21
CZK 1 10
EuR (€) 12 70
GBP (£) (150) (33)
MAD (51) (23)
PLN (45) 48
Total (129) 94

28. OThER NON-RECuRRING OPERATING INCOME AND ExPENSES(in € thousands) 2011 2010
Restructuring costs (14,938)
Acquisition-related costs in respect of ECS Group (6,447)
Impaiment of goodwill ( 3,650)
Other expenses (1,764)
Total other operating expenses (18,588) (8,211)
Other operating income 1 126
Capital gain on disposal of property 335
Total other operating income 1 461
Total (18,588) (6,750)
Other non-recurring operating expenses consist mainly of the costs incurred by the acquisition and subsequent integration of ECS Group, and the partial impaiment of goodwill in respect of Alliance Support Services, which the Group acquired in 2004.
29. NET FINANCIAL ExPENSE(in € thousands) 2011 2010
Capital gains on disposals of financial assets 3609
Other financial income 322 19
financial income 322 3628
Convertible bonds - Expenses on liabilities (2,663)
Expenses on non-recurring liabilities (6,142)
Expenses on non-current liabilities (2,845) (2,697)
Other financial expense (547) (80)
financial expense (12,197) (2,777)
net financial expense (11,875) 851
financial expenses
Financial expenses, i.e. €12.2 million include €6.1 million in non-current financial expenses attributable to the accelerated amortisation of costs from the loans for the acquisition further to their repayment in full and to the issue of convertible bonds in May.
financial income
In 2010, capital gains on disposals of financial assets are mainly attributable to the disposal of the MBO Capital venture capital fund. In addition to the recognition of this capital gain in the income statement, the fair value of the fund previously recognised directly in equity of €3.3 million at end-2009, was cancelled.
notes to the consolidated financial statements
113

114
30. INCOME TAxES30.1. Recognition of current and deferred taxes
30.1.1. Income statement
(in € thousands) 2011 2010
Current tax (9,565) (12,957)
Deferred tax (3,282) 607
income tax expense - continuing operations (12,847) (12,350)
Income tax related to discontinued operations
Total income tax expense (12,847) (12,350)
30.1.2. Reconciliation of actual tax charge and theoretical tax charge
(in € thousands) 2011 2010
Profit before tax including profit from discontinued operations 34,105 41,118
Income tax expense (12,847) (12,350)
group theoretical tax rate as a percentage of profit before tax 37.67% 30.04%
The following table provides a reconciliation between profit before tax and income tax expense:
(in € thousands) 2011 2010
Profit for the year 21,471 28,774
Non-controlling interests (214) (7)
Income tax expense 12,847 12,350
Impairment of goodwill 3,650
profit before tax, impairment of goodwill on an equity basis 37,755 41,118
Theoretical tax expense calculated at the Belgian standard tax rate (2011: 33.99%; 2010: 33.99%)
(12,833) (13,976)
Tax proof:
Permanent differences (5,232) 306
unrecognised tax losses incurred in the year (552) (796)
Previously unrecognised tax losses used in the year 174 269
Adjustment to previously unrecognised deferred tax 1,553 14
Items taxed at a reduced rate 0 (42)
Additional tax expense 581 156
Changes in income tax rate 1,209 779
Tax credits and other taxes 2,252 940
effective income tax expense (12,847) (12,350)

Permanent differences mainly relate to the following items:
(in € thousands) 2011 2010
Goodwill and excess depreciation and amortisation (158) (26)
Tax-exempt profit (84)
Other non-taxable or non-deductible income and expenses (1,937) 416
Taxing of internal distributions (3,137)
Total (5,232) 306
30.2. Deferred tax assets and liabilities
30.2.1. Movements in deferred tax liabilities
(in € thousands) 2011 2010
As of 1 january 19,790 5,731
Increase/(decrease) 1,734 8,446
Impacts of exchange rate fluctuations, changes in the scope of consolidation
and reclassifications(12,224) 5,612
As of 31 december 9,300 19,790
30.2.2. Movements in deferred tax assets
(in € thousands) 2011 2010
As of 1 january 27,230 7,898
Increase/(decrease) (1,548) 9,053
Tax assets not recorded in profit or loss (25) (50)
Impacts of exchange rate fluctuations, changes in the scope of consolidation
and reclassifications(12,552) 10,328
As of 31 december 13,104 27,230
notes to the consolidated financial statements
115

116
Assets liabilities net
(in € thousands) 31 dec. 2011 31 dec. 2010 31 dec. 2011 31 dec. 2010 31 dec. 2011 31 dec. 2010
Business - Leasing 18,180 21,438 (22,894) (20,854) (4,714) 584
Other assets 292 333 (12,183) (12,833) (11,891) (12,500)
Pensions 3,591 2,651 3,591 2,651
Provisions 11,128 12,220 11,128 12,220
Other liabilities (1,894) (1,612) (1,894) (1,612)
Tax loss carry forwards 7,586 6,097 7,586 6,097
Netting of assets - liabilities (27,673) (15,509) 27,673 15,509 0 0
deferred tax assets (liabilities), net 13,104 27,230 (9,298) (19,790) 3,806 7,440
Deferred tax assets recognised in the statement of financial position
13,104 27,230 13,104 27,230
Deferred tax liabilities recognised in the statement of financial position
(9,298) (19,790) (9,298) (19,790)
net balance 13,104 27,230 (9,298) (19,790) 3,806 7,440
Recoverable within 12 months, before netting
17,155 26,858 (7,713) (12,331) 9,442 14,527
Recoverable beyond 12 months, before netting
23,623 15,881 (29,258) (22,020) (5,635) (6,139)
30.2.3. Main sources of deferred tax assets and liabilities
30.2.4. Deferred tax assets on tax loss carry forwards
As of 31 December 2011, the Group’s tax loss carry forwards can be analysed as follows by due date:
(in € thousands) 2011 2010
Y+1 18,530 18,770
Y+2 374 1,288
Y+3 262 3,623
Y+4 445 457
Beyond 3,281 1,424
Evergreen tax loss carry forwards 36,314 54,873
Total 59,206 80,435

The Group’s unrecognised deferred tax assets at 31 December 2011 and 2010 were related to the following items:
2011 gross value
Total deferred
tax assets
recognised deferred
tax assets
unrecognised deferred
tax assets
Tax loss carry forwards 59,206 17,163 7,342 9,821
Other credits 977 244 244 0
Total 60,183 17,407 7,586 9,821
unrecognised deferred tax assets amount to €4.8 million (versus €14.4 million in 2010) and correspond to tax loss carry forwards whose recovery is not probable and which are not therefore recognised in the statement of financial position .
Deferred tax assets on tax losses carried forward (€1.5 million) in 2011 were recognised mainly for Econocom Group SA/NV (€1.2) million, in light of the additional revenue it will benefit from in future years, as a result of the consolidation of ECS Group and invoicing of services.
notes to the consolidated financial statements
117
2010 gross value
Total deferred
tax assets
recognised deferred
tax assets
unrecognised deferred
tax assets
Tax loss carry forwards 80,435 20,159 5,766 14,393
Other credits 1,184 331 331 0
Total 81,619 20,490 6,097 14,393

118
31. EARNINGS PER ShARE Basic earnings per share
(in € thousands) 2011 2010
Operating profit before tax 45,980 40,267
Net consolidated earnings attributed to owners of the parent 21,512 28,771
Average number of shares outstanding 25,070,417 23,375,237
operating profit per share before tax (in €) 1.834 1.723
Basic earnings per share (in €) 0.858 1.231
diluted earnings per share
(in € thousands) 2011 2010
Diluted operating profit before tax 45,980 40,267
Diluted profit attributed to owners of the parent 23,269 28,771
Average number of shares outstanding 25,070,417 23,375,237
Impact of stock options 389,780 66,222
Impact of convertible bonds 2,333,333
Diluted average number of shares outstanding 27,793,530 23,441,459
diluted operating profit per share before tax (in €) 1.654 1.718
diluted earnings per share (in €) 0.837 1.227
Earnings per share is calculated based on the weighted average number of shares in circulation during the year.
This number corresponds to the movements of ordinary shares in 2010 adjusted with movements of treasury stock.
Movements on treasury stock are detailed in Note 15.1.
The average diluted number of shares in circulation is a weighted average of ordinary shares in 2011, adjusted by movements on treasury stock and dilutive potential shares.
The dilutive effect is a result of the issue of stock options and the conversion of convertible bonds.
None of the operations on ordinary or potential shares after the reporting date had a material effect on the results published.

32. NOTES TO ThE CONSOLIDATED STATEMENT OF CASh FLOWS32.1. Definition of cash flows
(in € thousands) 2011
Cash and cash equivalents at beginning of year 217,873
Change in gross cash and cash equivalents (73,101)
Cash and cash equivalents at end of year 144,772
The cash flows analysed in the following table include changes in all activities, including continuing activities as well as activities sold or held for sale.
Consolidated cash flows include cash and cash equivalents.
Year-on-year changes in cash and cash equivalents analysed in the statement of cash flows can be broken down as follows:
32.2. Impact of changes in the scope of consolidation
No major acquisition was made in 2011; the acquisitions made during the year are analysed in detail in Note 3.
The related cash flows can be analysed as follows:
(in € thousands)
Cost of acquisitions 380
Cash and cash equivalents acquired (7)
Net costs 373
notes to the consolidated financial statements
119

120
33. RISK MANAGEMENT33.1.Capital adequacy framework
net debt/equity ratio (2011: 8.4%; 2010: 26.4%)
The Group uses a number of different ratios including the net debt/equity ratio which provides investors with a snapshot of the Group’s level of debt in relation to its consolidated shareholders’ equity. It is calculated by taking aggregate debt as presented in Note 18, less cash and consolidated shareholders’ equity at the reporting date.
The Group seeks a level of gearing that maximises value for shareholders while maintaining the financial flexibility that is required to implement its strategic projects.
33.2. Risk management policy
The Group’s activities are subject to certain financial risks: market risk (including currency risk, interest rate risk and price risk), liquidity risk and credit risk.
The Group’s overall risk management programme focuses on reducing exposure to credit risk and interest rate risk by transferring finance lease receivables to refinancing institutions and by using factoring solutions on a non-recourse basis for a number of subsidiaries.
Financial market risks (interest rate and currency risk) and liquidity risks are handled by Group Management.
33.2.1. Market risk
At the end of the year, Group Management fixes all the exchange rates to be applied in the following year’s budgeting process.
The Group uses hedging instruments such as swaps and caps to hedge its interest rate exposure. Derivative financial instruments are used purely for hedging and never for speculation purposes.
33.2.1.1. Foreign exchange risk
The acquisition of ECS Group in 2010 extended the new Group’s geographical scope to new areas (non-eurozone European countries, Asia and the Americas). Business in these latter two continents is relatively non-material at present. Most of the new Group’s business is still carried out in the eurozone.
The operations of the Group’s uK, Czech, Swiss, Romanian, Polish and Moroccan subsidiaries and certain contracts denominated in foreign currencies are exposed to foreign exchange risk on the pound sterling, uS dollar, Moroccan dirham, Czech koruna, Swiss franc, Romanian leu and Polish zloty. This exposure is limited by the denomination of the subsidiaries’ purchases and sales in the same currency. Econocom Group does not deem this risk to be material, but has, nevertheless signed a number of foreign exchange hedging agreements to hedge internal flows.
33.2.1.2. Interest rate risk
The operating income and cash flows of Econocom Group are substantially independent of changes in interest rates. Sales of leases to refinancing institutions are systematically based on fixed rates. The income arising on these contracts is therefore set at the outset and only varies if the contract is amended.
As of 31 December 2011, the Group’s variable-rate debt comprised a loan whose due date is in 2012, hedged by a swap and short-term borrowings (credit lines and bridges). Lastly, the Group’s factoring is at a short-term variable rate.
33.2.1.3. Price risk
The Group is exposed to the risk of fluctuations in the future values of leased equipment within the scope of its Leasing business. It deals with this risk by calculating the future value of equipment using the diminishing balance method, which is described in Note 2.9.3.
The method is regularly compared with actual transactions, and annual statistics are compiled to validate the suitable and conservative nature of the selected method.

33.2.1.4. Liquidity risk
The Finance Department is responsible for ensuring that the Group has a constant flow of sufficient funding:
• by analysing and updating consolidated cash flow requirements on a monthly basis and every two weeks for our ten main companies.
• by negotiating and maintaining sufficient outstanding lines of financing.
• by optimising the centralised management of the Group’s cash in order to offset the excesses and internal cash requirements.
Thus, having repaid in full the loan secured for the acquisition of ECS, the Group secured bilateral lines of credit from various banks in the amount of €163.1 million, €40 million of which was confirmed within one year and €20 million within two years, in order to guarantee that the necessary cash was available to fund the Group’s assets, short-term cash requirements and expansion, at minimal cost.
Furthermore, Econocom does not have any major loans falling due in 2012 and 2013; the bond loan issued in 2011 does not fall due until 2016.
Based on our current financial forecasts, we believe we have sufficient resources to continue our business, both in the short- and long-term.
notes to the consolidated financial statements
121

122
Maturity analysis for financial liabilities (excluding derivative instruments)
The following maturity analysis for financial liabilities (principal and interest) shows remaining contractual maturities on an undiscounted basis:
2011 (in € thousands) Total commitments < 1 yeardue in 1 to
5 years > 5 years
Finance lease liabilities - real estate 3,521 403 1,613 1,504
Financial residual value 63,951 20,041 43,910
Other finance lease liabilities 46 46
Bank borrowings 49,527 49,527
Bond loan 100,800 3,360, 97,440
Trade and other payables 596,300 596,300
Factoring 12,431 12,431
Other financial liabilities 1,887 1,887
Total 828,463 683,996 142,963 1,504
2010 (in € thousands) Total commitments < 1 yeardue in 1 to
5 years > 5 years
Finance lease liabilities - real estate 3,924 403 1,613 1,908
Financial residual value 74,566 24,973 49,587 6
Other finance lease liabilities 712 665 47
Bank borrowings 239,642 109,942 129,700
Trade and other payables 717,418 717,418
Factoring 11,693 11,693
Other financial liabilities 12,189 12,102 87
Total 1,060,144 877,196 181,035 1,914
33.2.2. Credit and counterparty risk
The Group has no significant exposure to credit risk. It has policies in place to ensure that sales of goods and services are made to clients with an appropriate credit history. The Group’s exposure is also limited as it does not have any concentration of credit risk and uses factoring solutions for the Distribution and Services businesses, as well as non-recourse refinancing with bank subsidiaries in the Leasing business. For its Leasing business, the Group does nevertheless have the option of
retaining the credit risk for certain strategic transactions, provided that they do not have a material impact on the business’ risk profile.
The Group only invests with investment grade counterparties, thus limiting its credit risk exposure.
Maximum credit risk exposure
As the Group has no specific credit risk per se, its maximum exposure in this respect is equal to the amount of its financial assets (see Note 14).

Aged balance of receivables past due but not impaired
Carrying amount
receivables not past
due
receivables past due
2011 (in € thousands) Total < 60 daysBetween 60 and 90 days > 90 days
Refinancing institutions(1) 158,839 127,104 31,735 26,164 1,692 3,879
Other receivables 418,625 303,973 114,652 53,847 7,391 53,414
Impairment losses on doubtful debts (30,942) (114) (30,827) (1,184) (524) (29,119)
Trade receivables and other debtors, net 546,522 430,963 115,560 78,827 8,559 28,174
(1) Refinancing institutions correspond to financial institutions which are bank subsidiaries. The significant amount of receivables past due as of 31 December is attributable to buoyant business levels in IT Financial Services in December. The bulk of these past due amounts are usually paid in the first two weeks of January.
33.2.3 . Equity risk
The Group does not hold any unlisted or listed shares apart from treasury shares.
As the treasury shares held by Econocom Group as of 31 December 2011 are deducted from shareholders’ equity in the consolidated financial statements, it is not necessary to compare their carrying amount to their actual market value.
33.3. Operating risk management policy
33.3.1. Risks relating to Managed Services contracts
The main risk in relation to Services contracts is the notice period for contract terminations. This period is traditionally long enough to enable the Group to make the appropriate staffing changes, particularly for major contracts. however, in certain circumstances the notice period may be limited to one month, in which case Econocom Group has to anticipate the possibility of the contract being terminated in order to take the necessary measures, particularly in relation to redeploying employees. A portion of Econocom’s revenues are generated by sub-contractors, with the aim of increasing flexibility.
33.3.2 . Dependency risk
The Group continually strives to broaden its client portfolio as part of its development strategy to gain market share. No single client represents over 5% of consolidated revenue and no supplier accounts for more than 25% of its total purchases. The Group’s operations are not dependent on any specific patents or on any licences for brands which it does not own.
33.3.3. Competition
The IT services market has always been highly competitive. There are a limited number of competitors at an international level for all of the Group’s businesses. however, in each country where it has operations and in each of its businesses, the Group faces strong competition from international, national or local players.
33.3.4 . Legal risks
The Group operates as a service provider in various Western European countries and is therefore subject to numerous different laws as well as customs, tax and labour regulations. In order to limit its exposure to legal risks, the Group has set up subsidiaries in each country run by managers who are fully aware of the applicable local laws and regulations.
Through its headquarters in Brussels, Econocom keeps abreast of new European legislation and regulations.
notes to the consolidated financial statements
123

124
The Group is not aware of any exceptional events or litigation likely to have a substantial impact on its financial position, assets, business or the results of its operations. Any pending litigation is covered by provisions for appropriate amounts calculated by Group Management.
Disclosures concerning litigation or arbitration likely to have a substantial impact on Econocom Group’s financial position, assets, business or the results of its operations at 31 December 2011 are presented in Note 35.
Liabilities are recognised in line with current accounting practices (see Note 2.16).
Provisions for claims and litigation are described in Note 16.
33.3.5. Employee-related risks
As far as Econocom Group Management is aware, the Group is not exposed to any employee-related risks other than those arising in the normal course of business for companies of a comparable size based in Europe. The majority of the workforce is employed in the Group’s French, Belgian and Italian subsidiaries.
33.3.6. Environmental risks
Econocom Group does not destroy the machines purchased from refinancing institutions at the term of the related contracts. The machines are sold to brokers (or to recognised waste management dealers) who are responsible for managing the applicable end-of-life procedures and have provided the Group with guarantees that they comply with the related regulations.
33.3.7. Insurance against risk
The Group is covered against liability claims and property damage via insurance policies taken out with first-rate insurers. It has elected not to take out business interruption insurance.
The Group reviews and evaluates its risks on an ongoing basis in conjunction with its insurers and experts so as to ensure optimal coverage in both the insurance and reinsurance markets.
33.3.8. Pledges, guarantees and collateral provided for borrowings
Real security interests provided as collateral for borrowings or financial liabilities by the Group chiefly consist of receivables offered as collateral for its short-term funding. The amount of pledged and mortgaged assets is disclosed in Note 34.
33.4. Sensitivity analysis
The sensitivity analyses carried out to measure the impact of various foreign currency/euro exchange rate fluctuations show that, assuming a constant level of performance of foreign subsidiaries, a 10% drop in all these currencies would have an impact on the Group’s net results of less than €0.6 million.
In addition, the Group is managing finance lease agreements denominated in dollars in its Leasing business. The terms and conditions of this contract are such that the foreign exchange risk is automatically hedged and fluctuations in the dollar exchange rate have only a non-material impact on results.
As regards interest rates, the sensitivity analysis shows that a 1% (100-basis point) change in short-term interest rates would impact profit before tax and non-recurring items to the tune of +/- €0.2 million.

34. OFF-BALANCE ShEET COMMITMENTS34.1. Commitments to purchase shares
econocom gmbh: put option granted on the 10% interest held by local managers
The General Manager of the German subsidiary Econocom Gmbh held 10% of the company’s capital at the beginning of the year. Econocom Group SA/NV held the remaining 90% of the capital of Econocom Gmbh.
Econocom has cross options and a call option and the manager has a put option on the total amount of the capital held by this manager.
These options, which may be exercised at any time between 1 January 2011 and 31 December 2012, were exercised in 2011 and at year-end Econocom Group SA/NV held 100% of the capital of Econocom Gmbh.
econocom Telecom services sAs
Some of the managers of French subsidiary Econocom Telecom Services SAS hold 12% of the Company’s share capital. Econocom Products and Solutions SAS holds the balance of Econocom Telecom Services SAS’ share capital.
Econocom Products and Solutions SAS has agreed with all of its managers individually to grant cross options and call options to the company and has also granted them a put option on that same interest.
These options may be exercised in 2012 and 2013 for the three managers holding 8% of the share capital and in 2013 and 2014 for the others.
The price of the put and call options will be based on seven times the difference between the EBIT-year average and the reference EBIT, i.e., €690,000.
In compliance with IFRS 3 revised, the Group recognised a liability in the amount of €1.5 million in the 2011 consolidated financial statements.
34.2. Commitment to pay earn-out
dB2A
During the last quarter Econocom Location SAS acquired two sales agencies in France: DB2A Pays de Loire and DB2A Bretagne Normandie. These companies sell Econocom Location’s financing and asset management services in France.
These companies were purchased for an initial price of €180,000 which, if necessary, will be completed with defined sales operations. The additional price shall not exceed €50,000 and shall be recognised as expenses in the 2012 financial statements.
34.3. Other equity commitments
A2Z solutions
The Belgian company A2Z Solutions developed an operational IT infrastructures and telecom management activity for small-and medium-sized companies.
Its parent, A2Z holding, itself a subsidiary of Econocom Group, granted the manager of the A2Z activity stock options on the capital of A2Z Solutions. The options acquired at the price of €17,500 entitle the manager to acquire 7.5% of the capital of A2Z Solutions at a price of €150,000. These options could have been exercised between 1 January and 31 December 2011; they have not been exercised.
notes to the consolidated financial statements
125

126
34.4. Commitments for the acquisition of ECS Group
Acquisition agreement: earn-out
The earn-out was exercised for an amount of €14,018,000 (reduction of the price), paid in Econocom Group shares, measured at fair value at the transaction date. This amount was recognised in the opening balance sheet, as specified in Note 3.
indemnification clause:
The parties are discussing the indemnification clause. As they have failed to reach an agreement with respect to the application of this clause, no commitment received has been recognised.
34.5. Guarantees
(in € thousands)
guarantees given 69,189
Carrying amount of assets pledged by certain subsidiaries as guarantees for factors 1,108
Securities pledged (including ECS SA securities) 4,106
Guarantees given (amounts authorised) by Econocom Group SA/NV
to third parties (banks and/or suppliers) on behalf of subsidiaries 63,975
34.6. Finance lease commitments
(in € thousands)
Guarantees in respect of future lease payments
(lease on the Belgian head office)2,838
34.7. Commitments to acquire property, plant and equipment
(in € thousands)
Lease contracts for delivery in 2012 and subsequent years 1 ,341
Certain types of lease contracts, for which the equipment ordered will be delivered in 2012 and subsequent years, include a commitment by Econocom to purchase said equipment in the future. This commitment stood at €1,341,000 on 31 December 2011. The outstanding amount
of the lease contract not used during the realisation or exchange period is no longer taken into account as it is part of the current activity and does not include a firm and irrevocable commitment from Econocom.

Off-balance sheet commitments by maturity and type of commitment are presented in the following table:
(in € thousands) < 1 year1 year < x < 5 year s > 5 years Total 2011 Total 2010
Commitments given:
Mortgages
Assets pledged as guarantees for factors 1,108 1,108 4,152
Securities pledged 4,106 4,106 196,866
Assets pledged as guarantees for third parties 13,971 46,504 3,500 63,975 48,870
Assets pledged following the acquisition of ECS 205,000
Finance leases 260 1,306 1,551 2,838 3,085
Property, plant and equipment 1,237 514 1,341 2,231
Commitments received:
Guarantees and pledges 5,055 7,583 12,638 1,308
35. CONTINGENT LIABILITIES At the end of December 2007, legal proceedings were instituted against one of the Group’s subsidiaries involving a material sum. The court ruled in favour of Econocom. This ruling was appealed and the hearing is scheduled for the first half of 2012. Econocom believes that it has accrued sufficient provisions to cover the related risk.
34.8. Commitments received: deposits and guarantees
(in € thousands)
Guarantees payable on first call and pledges 12,638
notes to the consolidated financial statements
127

128
36. RELATED-PARTY TRANSACTIONS 36.1. Management remuneration
(in €) 2011 2010
Remuneration allocated to non-executive directors (attendance fees) 89,000 76,500
Remuneration allocated to executive directors 3,497,590 3,994,638
Remuneration allocated to members of the Management Committee (excluding directors) 0 867,014
Stock options held by Management and directors
Number of stock options outstanding as of 31 December 1,453,000 768,000
The remuneration policy for directors and members of the Executive Committee is described in the Management Report submitted to the Annual General Meeting, in Note 5.7.1.
income expenses receivables payables
(in € thousands) 2011 2010 2011 2010 31 dec. 2011 31 dec. 2010 31 dec. 2011 31 dec. 2010
Econocom International NV 174 95 (2,312) (1,253) 38 5 25 10,232
Econocom Expert
International holding BV(387)
SCI Pergolèse 12 12 (1,317) (1,019) 471 172 318
Audevard 22 18 2
APL (26) (14) 6
GMPC (134) 12
Total 208 125 (4,042) (2,420) 38 478 203 10,562
36.2. Related-party transactions
Transactions between the parent company and its subsidiaries, which are related parties, are eliminated on consolidation and are not presented in this note. The transactions with related parties summarised below
Econocom International NV is an unlisted holding company which holds a 49.10% stake in Econocom Group SA/NV as of 31 December 2011.
In 2010, for the acquisition of ECS Group, EINV loaned €10 million to Econocom Group. Interest on this loan was paid on the basis of the 3-month Euribor +100 basis points, i.e., €131,000 for 2011.
mainly concern the principal transactions carried out with companies in which the Chairman of Econocom Group’s Board of Directors holds a directorship.
This loan was repaid in full in July 2011. In August 2011, Econocom Expert International holding BV, 50.10% of which is owned by Econocom Group SA/NV and 49.90% by Econocom International NV, paid back Econocom International NV the balance of the debt with €2.4 million worth of share capital. €387,000 of interest was recognised in expenses for 2011.
37. POST-YEAR-END EVENTS
The main areas in which judgment was exercised by Management were as follows:
• Impairment of goodwill (Note 7): each year, Econocom Group reviews the value of the goodwill in its consolidated financial statements, in accordance with the principles described in Note 2.11. These impairment tests are particularly sensitive to medium-term financial projections and to the discount rates used to estimate the value in use of CGus.
• Assessment of provisions for pensions (Note 17): an actuary calculates the provision for pensions using the projected unit credit method described in Note 2.17. This calculation is particularly sensitive to the discount rate, salary increase rate and employee turnover rate.
• Valuation of the stock options granted since November 2002: the actuarial formulae used are affected by assumptions concerning employee turnover, developments and volatility of the share price of Econocom Group SA/NV, as well as the probability of managers achieving their objectives (see Note 15.3.1.).
• Assessments of the probability of recovering the tax loss carry forwards of the Group’s subsidiaries.
• Provisions (Note 16): provisions are recognised to meet the probable outflow of resources in favour of a third-party with no corresponding consideration for the Group. They include provisions for all kinds of litigation which are estimated on the basis of the most probable settlement assumptions. To determine these assumptions, Group Management relies, if necessary, on assessments made by external consultants.
• Fair value of financial instruments (Notes 14 and 20): this is measured using market prices. The value of derivative financial instruments is determined and sent to the Group by its banking counterparties. If listed market prices are not available, fair value is estimated using other valuation methods including, inter alia, discounted future cash flows.
• The accounting methods used for the acquisition of ECS Group are described in Note 3.
38. ASSESSMENTS MADE BY MANAGEMENT AND SOuRCES OF uNCERTAINTY
On 11 January 2012, Econocom Group announced that it had acquired a 40% stake in Centix, with a three-year call option on the company’s remaining shares.
Centix, Belgium’s acknowledged specialist in desktop and server virtualisation solutions has reported consistent growth since its inception in 2007, with revenue of €2 million.
This company will be consolidated in the Econocom Group’s 2012 consolidated financial statements. Goodwill is currently being measured and the impact on the other items of the Group’s consolidated financial statements is deemed non-material.
129

130
reporT of The sTATuTory AudiTor on The ConsolidATed finAnCiAl sTATeMenTs for the year ended 31 December 2011
sTATuTory AudiTor’s reporT To The generAl shAreholders’ MeeTing on The ConsolidATed ACCounTs of The CoMpAny eConoCoM group sA/nv As of And for The yeAr ended 31 deCeMBer 2011
As required by law and the company’s articles of association, we report to you in the context of our appointment as the company’s statutory auditor. This report includes our opinion on the consolidated accounts and the required additional disclosure..
unqualified opinion on the consolidated accounts
We have audited the consolidated accounts of Econocom Group SA/NV and its subsidiaries (the “Group”) as of and for the year ended 31 December 2011, prepared in accordance with International Financial Reporting Standards, as adopted by the European union, and with the legal and regulatory requirements applicable in Belgium. These consolidated accounts comprise the statement of consolidated financial position as of 31 December 2011 and the consolidated statements of income, comprehensive income, changes in shareholders’ equity, and cash flows for the year then ended, as well as the summary of significant accounting policies and other explanatory notes. The total of the statement of consolidated financial position amounts to EuR (000) 1,043,645 and the consolidated statement of income shows a profit for the year, group share, of EuR (000) 21,512.
The company’s board of directors is responsible for the preparation of the consolidated accounts. This responsibility includes: designing, implementing and maintaining internal control relevant to the preparation and fair presentation of consolidated accounts that are free from material misstatement, whether due to fraud or error; selecting and applying appropriate accounting policies; and making accounting estimates that are reasonable in the circumstances.
Our responsibility is to express an opinion on these consolidated accounts based on our audit. We conducted our audit in accordance with the legal requirements applicable in Belgium and with Belgian auditing standards, as issued by the “Institut des Reviseurs d’Entreprises/Instituut der Bedrijfsrevisoren”. Those auditing standards require that we plan and perform the audit to obtain reasonable assurance about whether the consolidated accounts are free of material misstatement.
In accordance with the auditing standards referred to above, we have carried out procedures to obtain audit evidence about the amounts and disclosures in the consolidated accounts. The selection of these procedures is a matter for our judgment, as is the assessment of the risk that the consolidated accounts contain material misstatements, whether due to fraud or error. In making those risk assessments, we have considered the Group’s internal control relating to the preparation and fair presentation of the consolidated accounts, in order to design audit procedures that were appropriate in the circumstances, but not for the purpose of expressing an opinion on the effectiveness of the Group’s internal control. We have also evaluated the appropriateness of the accounting policies used and the reasonableness of accounting estimates made by management, as well as the presentation of the
consolidated accounts taken as a whole. Finally, we have obtained from the board of directors and Group officials the explanations and information necessary for our audit. We believe that the audit evidence we have obtained provides a reasonable basis for our opinion.
In our opinion, the consolidated accounts as of 31 December 2011 give a true and fair view of the Group’s net worth and financial position and of its results and cash flows for the year then ended in accordance with International Financial Reporting Standards, as adopted by the European union, and with the legal and regulatory requirements applicable in Belgium.
Additional comment
The company’s board of directors is responsible for the preparation and content of the management report on the consolidated accounts. Our responsibility is to include in our report the following additional comment, which does not have any effect on our opinion on the consolidated accounts:
The management report on the consolidated accounts deals with the information required by the law and is consistent with the consolidated accounts. however, we are not in a position to express an opinion on the description of the principal risks and uncertainties facing the companies included in the consolidation, the state of their affairs, their forecast development or the significant influence of certain events on their future development. Nevertheless, we can confirm that the information provided is not in obvious contradiction with the information we have acquired in the context of our appointment.
Sint-Stevens-Woluwe, 6 April 2012
The statutory auditor
PwC Reviseurs d’Entreprises sccrl, société civile à forme commerciale
represented by
Emmanuèle Attout
Réviseur d’Entreprises
PwC Bedrijfsrevisoren cvba, burgerlijke vennootschap met handelsvorm - PwC Reviseurs d’Entreprises scrl, société civile à forme commerciale - Financial Assurance ServicesMaatschappelijke zetel/Siège social: Woluwe Garden, Woluwedal 18, B-1932 Sint-Stevens-WoluweT: +32 (0)2 710 4211, F: +32 (0)2 710 4299, www.pwc.comBTW/TVA BE 0429.501.944 / RPR Brussel - RPM Bruxelles / ING BE43 3101 3811 9501 - BIC BBRUBEBB / RBS BE89 7205 4043 3185 - BIC ABNABEBR

131
We hereby declare that, to the best of our knowledge, the consolidated financial statements for the period ended 31 December 2011, prepared in accordance with the International Financial Reporting Standards (IFRS) as adopted in the European union, and with the legal provisions applicable in Belgium, give a true and fair view of the assets, financial positions and profit or loss of the Company and the undertakings in the consolidation taken as a whole, and that the management report includes a fair review of the development and performance of the business, profit or loss and financial position of the Company and the undertakings in the consolidation taken as a whole, together with a description of the principal risks and uncertainties that they face.
7 March 2012
on behalf of the Board of directors
jean-louis Bouchard, Chairman of econocom group

132

Balance sheet 134
Income statement 136
Cash flow statement 138
(*) Parent company financial statements are prepared in accordance with Belgian GAAP.
Condensed pArenT CoMpAny finAnCiAl sTATeMenTs*
as of 31 December 2011
ConTenTs
eConoCoM group sA/nv pArenT CoMpAny finAnCiAl sTATeMenTs In accordance with article 105 of the Belgian Companies’ Act, Econocom Group SA/NV hereby states that the following financial statements are an abridged version of the full annual financial statements that can be obtained from the company and which will be filed with the Banque Nationale de Belgique. This abridged version does not contain all of the notes to the parent company financial statements or the Statutory Auditor’s report, which contained an unqualified audit option in relation to the annual financial statements of Econocom Group SA/NV. The Statutory Auditor’s report also includes additional information with respect to the conflict of interest described in heading 5.5.3 of the management report.
133

134
pArenT CoMpAny BAlAnCe sheeT as of 31 December 2011
ASSETS (in € thousands) 31 dec. 2011 31 dec 2010
fixed assets 528,300 344,198
i. start-up costs 1,350 5,120
ii. intangible assets 127 53
iii. property, plant and equipment 216 106
A. Land and buildings 0 0
B. Plant and equipment, fixtures and fittings 90 83
E. Other property, plant and equipment 23 23
F. Fixed assets in progress 103 0
iv. financial assets 526,607 338,919
A. Related parties 526,606 338,918
1. Investments 368,527 176,158
2. Receivables 158,079 162,760
C. Other financial assets 1 1
1. Shares 0 0
2. Receivables and cash guarantees 1 1
Current assets 36,900 41,097
vi. inventories and work in-progress 6 18
A. Inventories 6 18
vii. receivables due within 1 year 14,559 13,526
A. Trade receivables 10,098 5,094
B. Other receivables 4,461 8,432
ix. Cash investments 22,104 13,935
A. Treasury stock 21,204 1,951
B. Other investments 900 11,984
x. Cash and cash equivalents 103 13,513
xi. Accruals and other assets/liabilities 128 105
Total assets 565,200 385,295
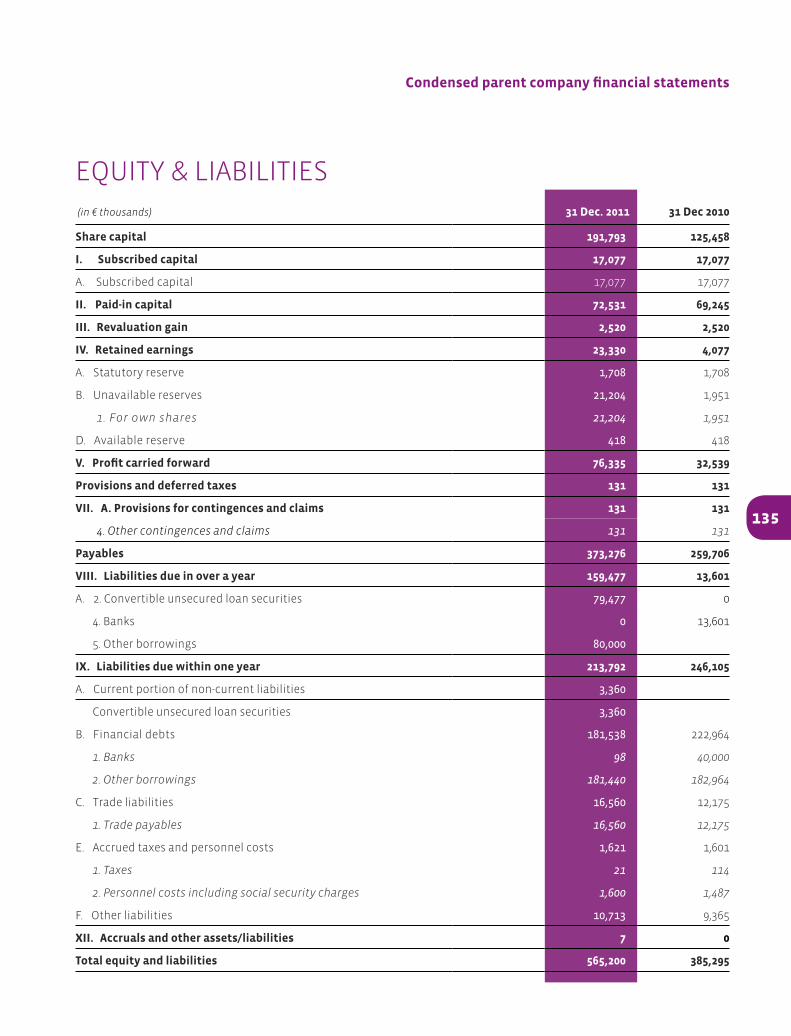
Condensed parent company financial statements
135
EQuITY & LIABILITIES (in € thousands) 31 dec. 2011 31 dec 2010
share capital 191,793 125,458
i. subscribed capital 17,077 17,077
A. Subscribed capital 17,077 17,077
ii. paid-in capital 72,531 69,245
iii. revaluation gain 2,520 2,520
iv. retained earnings 23,330 4,077
A. Statutory reserve 1,708 1,708
B. unavailable reserves 21,204 1,951
1. For own shares 21,204 1,951
D. Available reserve 418 418
v. profit carried forward 76,335 32,539
provisions and deferred taxes 131 131
vii. A. provisions for contingences and claims 131 131
4. Other contingences and claims 131 131
payables 373,276 259,706
viii. liabilities due in over a year 159,477 13,601
A. 2. Convertible unsecured loan securities 79,477 0
4. Banks 0 13,601
5. Other borrowings 80,000
ix. liabilities due within one year 213,792 246,105
A. Current portion of non-current liabilities 3,360
Convertible unsecured loan securities 3,360
B. Financial debts 181,538 222,964
1. Banks 98 40,000
2. Other borrowings 181,440 182,964
C. Trade liabilities 16,560 12,175
1. Trade payables 16,560 12,175
E. Accrued taxes and personnel costs 1,621 1,601
1. Taxes 21 114
2. Personnel costs including social security charges 1,600 1,487
F. Other liabilities 10,713 9,365
xii. Accruals and other assets/liabilities 7 0
Total equity and liabilities 565,200 385,295

136
inCoMe sTATeMenT for the year ended 31 December 2011
(in € thousands) 2011 2010
ii. Cost of sales and services 16,943 10,776
A. Materials and goods 0 0
B. Services and miscellaneous goods 12,780 16,555
C. Personnel costs (including security charges) and pensions 4,092 4,623
D. Amortisation/depreciation and impairment of start-up costs, intangible assets and property, plant & equipment 62 62
E. Impairment of inventories, work in-progress and trade receivables (additions +, reversals -) 0 0
F. Provisions for contingencies & charges (additions +, reversals -)
G. Other operating expenses 9 53
v. financial expenses 27,784 3,164
A. Expenses on liabilities 12,616 1,845
B. Impairment of current liabilities other than inventories, work in-progress and trade receivables 7,680 113
C. Other operating expenses 7,488 1,206
viii. exceptional expenses 500 2,000
B. Impairment of long-term investments 500
C. Provisions for contingences and charges (additions +, reversals -)
D. Losses on disposal of fixed assets 2,000
E. Other exceptional expenses
x.A. income tax 21 114
xi. profit for the year 73,170 5,706
Total 118,418 32,277
Expenses

Condensed parent company financial statements
137
(in € thousands) 2011 2010
i. sales of services 16,479 14,713
A. Revenue 14,865 12,159
D. Other operating income 1,614 2,554
iv. financial income 99,516 12,443
A. Income from long-term investments 94,293 5,205
B Income from current assets 220 101
C. Other financial income 5,003 7,137
vii. exceptional income 2,423 5,121
B. Reversals of impairment of long-term investments 454 1,200
D. Gains on disposal of fixed assets 1,969 3,921
x. Tax adjustments and reversals 0 0
Total 118,418 32,277
(in € thousands) 2011 2010
A. Total profit available for distribution 105,709 26,416
1. Profit for the year 73,170 5,706
2. Retained earnings 32,539 20,710
B. levying on equity - 15,374
1. Equity and paid-in capital
2. Reserves - 15,374
C. Appropriation to equity (18,905) (90)
2. To the statutory reserve ( 90)
3. To other reserves (18,905)
d. Appropriation to retained earnings (76,335) (32,539)
1. Amount carried forward (76,335) (32,539)
f. profit available for distribution (10,469) (9,161)
1. Dividends (10,469) (9,161)
Income
Appropriation of profit

138
pArenT CoMpAny CAsh floW sTATeMenT for the year ended 31 December 2011
(in € thousands) 2011 2010
Profit (loss) for the year 73,170 5,706
Income tax expense 21 114
Depreciation, amortisation and impairment 8,048 (1,138)
Gains/losses on disposals of long-term investments (1,969) (1,565)
Dividends received from investments (83,116) (4,410)
Interests received on financial receivables due in more than 1 year (1,012) 1,050
Gains/losses on sales of treasury shares 118 (5,902)
operating cash flow (a) (4,740) (6,145)
Change in receivables due within 1 year (8,680) (5,381)
Change in other current assets (11) 136
Change in trade payables 4,351 9,935
Change in accrued taxes and personnel costs due within 1 year 20 888
Change in other current liabilities 7
Change in working capital (b) (4,313) 5,578
Income tax expense (c ) (21) (114)
net cash provided by/(used in) operating activities (a+b+c) = d (9,074) (681)

Condensed parent company financial statements
139
(in € thousands) 2011 2010
Cash flows from investing activities
Set-up costs 5,120 5,120
Acquisition of property, plant and equipment and intangible assets for internal use (245) (78)
Disposal of property, plant and equipment and intangible assets for internal use 711
Acquisition of investments (115) (162,760)
Acquisition of financial receivables due in more than 1 year (131)
Repayment of financial receivables due in more than 1 year 454
Disposal of other long-term investments 866
Dividends received from investments 13,900 4,410
Interests received on financial receivables due in more than 1 year 11,177 795
net cash provided by investing activities (e) 30,291 (161,247)
Cash flows from financing activities
Convertible bonds - paid-in capital (1,610)
Convertible bonds - items of equity 3,286
Convertible bonds - issue of convertible bonds 79,477
Change in financial liabilities due within 1 year (87,604) 174,906
Change in financial liabilities due in more than 1 year (13,601) 1,601
Acquisition of treasury stock (12,968) (8,439)
Sale of treasury stock 6,246 14,323
Interests paid (10,165) (1,845)
Dividends paid during the year (8,772) (6,905)
net cash used in financing activities (f) (45,711) 173,641
Change in cash and cash equivalents (d+e+f) (24,494) 11,713

140

ConsolidATed highlighTs as of 31 December 2011
141

142
ConsolidATed highlighTs
(in € thousands) 2006 2007 2008 2009 2010 2011
number of shares (as of 31 december 2011)
Ordinary shares 29,000,000 25,800,000 24,800,000 24,800,000 26,172,897 26,172,897
AFV (preferred shares) 0 0 0 0 0 0
Total 29,000,000 25,800,000 24,800,000 24,800,000 26,172,897 26,172,897
Free float 40.15% 41.91% 40.38% 20.09% 20.93% 20.79%
per share data (in €)
Net dividend (on ordinary shares) 0.15 0.18 0.18 0.23 0.26 0.30
Gross dividend (on ordinary shares) 0.20 0.24 0.24 0.30 0.35 0.40
Payout rate (a) 58% 34% 32% 37% 31% 42%
Recurring operating profit 0.57 0.95 1.03 1.16 1.80 2.47
Operating profit 0.5 0.92 1.01 1.16 1.54 1.76
Profit before tax 0.5 0.91 1 1.13 1.57 1.30
Profit/(loss) for the year 0.35 0.70 0.76 0.82 1.10 0.82
Consolidated cash flow 0.70 1.24 1.30 1.45 1.44 2.27
Equity attributable to shareholders
of the parent company3.04 3.23 3.41 3.41 5.33 5.18
Price/earnings (b) 19 11 8 13 9 19
Price/cash flow (b) 10 6 5 7 7 6.85
Net yield (c) 2.25% 2.40% 2.80% 2.22% 2.60% 1.93%
Gross yield (c) 3.00% 3.20% 3.72% 2.90% 3.50% 2.57%
stock market data (in €)
Average share price 6.35 7.2 7.24 7.12 10.52 14
As of 31 December 6.66 7.51 6.44 10.35 10 15.35
high 7.05 9.93 8.74 10.67 12.25 17.15
Low 5.09 6.69 5.02 4.6 9 10.05
Annual return (at end-December) (d) 3% 15% (11.85%) 66.29% (1.32%) 58.10%
Annual market return (e) 26.17% (1.95%) (47.56%) 24.63% 7.08% (9.76%)
Annual trading volume (in units) 4,833,457 5,862,670 3,021,641 4,103,691 3,164,365 3,814,657
Average daily trading volume 19,098 22,991 11,850 16,547 12,313 14,959
Annual trading volume, in absolute value (in € millions)
30.99 46.61 21.7 30.14 33.65 52.9
Market capitalisation as of 31 December (in € millions)
193 193 160 257 262 407
Listing market (f) TC TC TC TC TC TC
number of employees as of 31 december 2,200 2,307 2,318 2,266 3,664 3,610
(a) Payout rate = gross dividend/consolidated profit from ordinary activities after tax. (b) Share price as of 31 December/cash flow.(c) Net or gross dividend/share price as of 31 December.(d) Annual return = change in share price as of 31 December relative to 31 December of the prior year + net dividend/share price as of 31 December of the prior year.(e) Return index (Belgian All Shares) of Euronext Brussels.(f) Listing market = Brussels. SM = Second Marché from 9 June 1988; CSF = Marché au Comptant Simple Fixing from 13 December 1996. CDF = Marché au Comptant Double Fixing from 11 March1998; and TSC = Marché à Terme semi-continu from 11 March 1999. The Econocom Group share is listed on the Marché à terme continu (TC) since 16 March 2000.


The Econocom Group 2011 annual report is available in French and English on the Group’s website www.econocom.com.
A printed brochure is also available in both languages by contacting the Communications Department.
Econocom Communications Department106 rue des Trois Fontanot
92751 Nanterre CEDExFrance
Email : [email protected]
Design: Paola Naugès - [email protected]: The Crew Paris
Photo credits: Eric Ducretot, Getty images, Corbis, iStockphoto

BelgiumPlace du Champ de Mars, 5
1050 Brussels
Horizon Park
Leuvensesteenweg 510/80
1930 Zaventem
Tel.: 32 2 790 81 11
Czech RepublicRadlicka 14
150 00 Prague 5
Tel.: 420 225 100 300
France 106 rue des Trois Fontanot
92751 Nanterre
Tel.: 33 1 41 67 30 00
34 avenue Matignon
75008 Paris
Tel.: 33 1 53 89 18 11
1 rue de Terre Neuve
Zac de Courtaboeuf
91940 Les Ulis
Tel.: 33 1 69 18 35 00
42-46 rue Médéric
92582 Clichy Cedex
Tel.: 33 1 47 56 37 00
146 boulevard Voltaire
92600 Asnières-sur-Seine
Tel.: 33 1 56 04 09 49
Les Richardets
1 bis rue des Aérostiers
93165 Noisy le Grand
Tel.: 33 1 41 67 30 00
France (continued)35 Boulevard de Courcerin
77185 Lognes
Tel.: 33 1 41 67 30 00
GermanyHerriotstr. 8
D-60528 Frankfurt am Main
Tel.: 49 69 71408-00
Ireland3rd Floor, IFSC House
IFSC
Dublin 1
Tel.: 353 1 6750300
ItalyVia Marcello Nizzoli 8
20147 Milan
Tel.: 39 02 33 62 61
Luxembourg4 rue d’Arlon
L-8399 Windhof
Tel.: 352 39 55 50
MoroccoImmeuble Casablanca
Business Center - Lot 2
Lotissement Mandarouna
Sidi Maârouf
20270 Casablanca
Tel.: 212 522 78 90 30
PolandMarszalkowska 111
00-102 Warsaw
Tel.: 48 22 528 53 33
RomaniaSevastopol Street nr. 13-17
Appart nr. 404
Sector 1
Bucharest
Tel.: + 40 21 310 93 43
SlovakiaHodžovo nám. 1A
811 06 Bratislava
Tel.: 420 225 100 300
SpainC/ Cardenal Marcelo Spínola, 4
28016 Madrid
Tel.: 34 91 411 91 20
C/ Constitució, 3
08960 Barcelona - Sant Just Desvern
Tel.: 34 93 470 30 00
SwitzerlandRoute de Champ-Colin 12
CH-1260 Nyon
Tel.: 41 22 363 79 30
The NetherlandsRond het Fort 38
NL-3439 MK Nieuwegein
P.O. Box 264
NL-3430 AG Nieuwegein
KvK 30110081 / KvK 32071903
Tel.: 31 30 63 58 333
United KingdomEton House
18/24 Paradise Road
Richmond-upon-Thames
Surrey TW9 1SE
Tel.: 44 20 8940 1299
Econocom Addresses
N°Vert 0800 716 715 (France) +33 800 716 715 (International)Contact:

www.econocom.com