Embed Size (px)
DESCRIPTION
poi
Citation preview
Chapter Twenty-Seven
Oligopoly
Oligopoly
A monopoly is an industry consisting
a single firm.
A duopoly is an industry consisting of
two firms.
An oligopoly is an industry consisting
of a few firms. Particularly, each firm’s
own price or output decisions affect its
competitors’ profits.
Oligopoly
How do we analyze markets in which
the supplying industry is
oligopolistic?
Consider the duopolistic case of two
firms supplying the same product.
Quantity Competition
Assume that firms compete by
choosing output levels.
If firm 1 produces y1 units and firm 2
produces y2 units then total quantity
supplied is y1 + y2. The market price
will be p(y1+ y2).
The firms’ total cost functions are
c1(y1) and c2(y2).
Quantity Competition
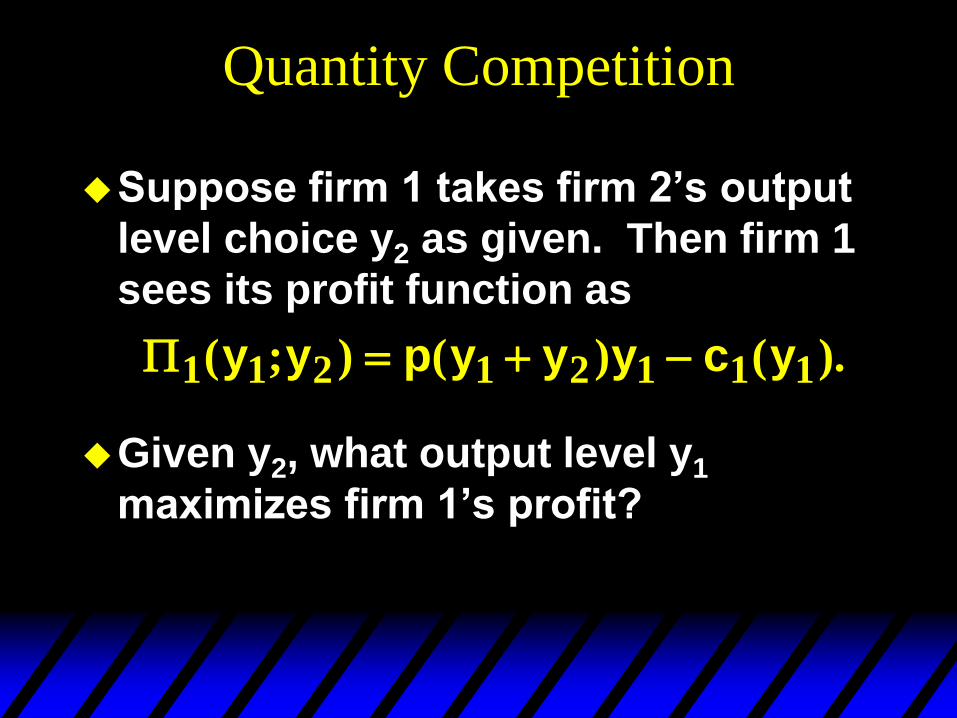
Suppose firm 1 takes firm 2’s output
level choice y2 as given. Then firm 1
sees its profit function as
Given y2, what output level y1
maximizes firm 1’s profit?
1 1 2 1 2 1 1 1( ; ) ( ) ( ).y y p y y y c y
Quantity Competition; An Example
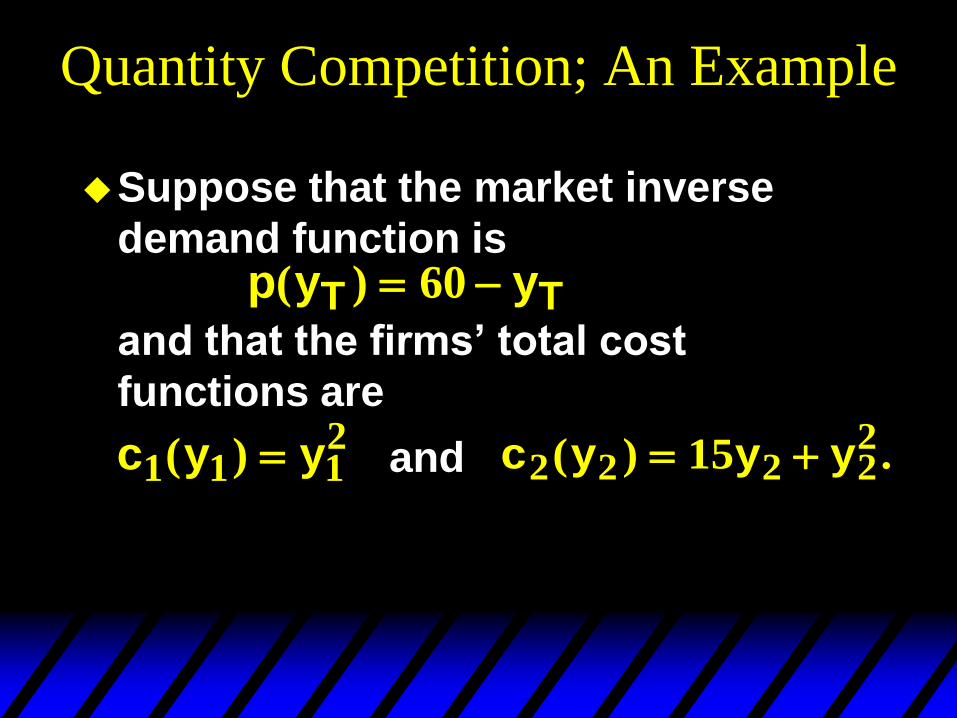
Suppose that the market inverse
demand function is
and that the firms’ total cost
functions are
p y yT T( ) 60
c y y1 1 12
( ) c y y y2 2 2 22
15( ) . and
Quantity Competition; An Example
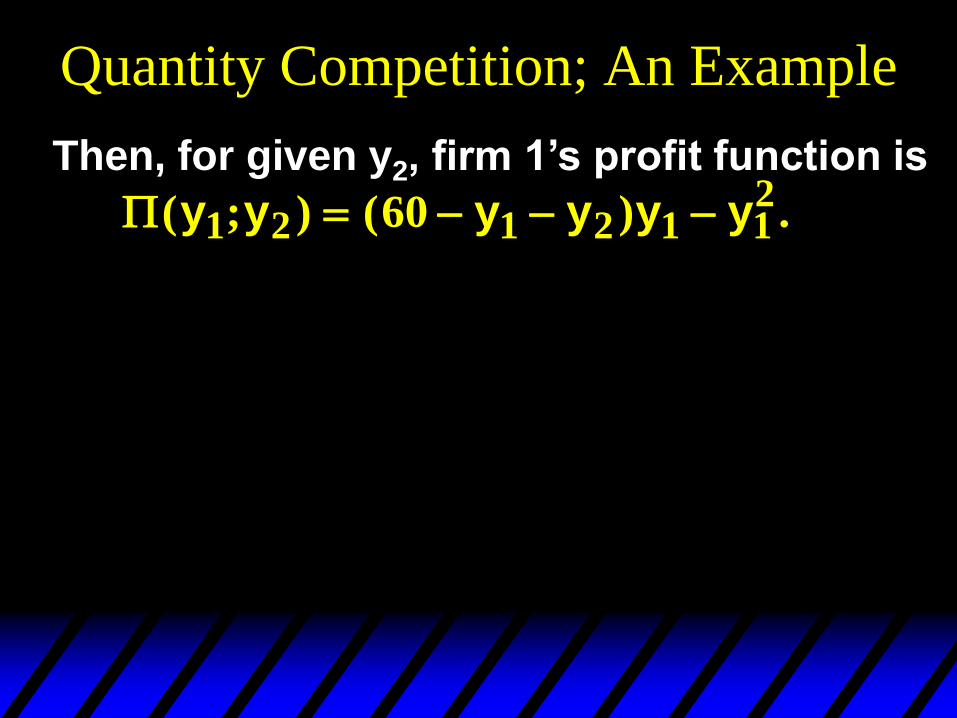
( ; ) ( ) .y y y y y y1 2 1 2 1 12
60
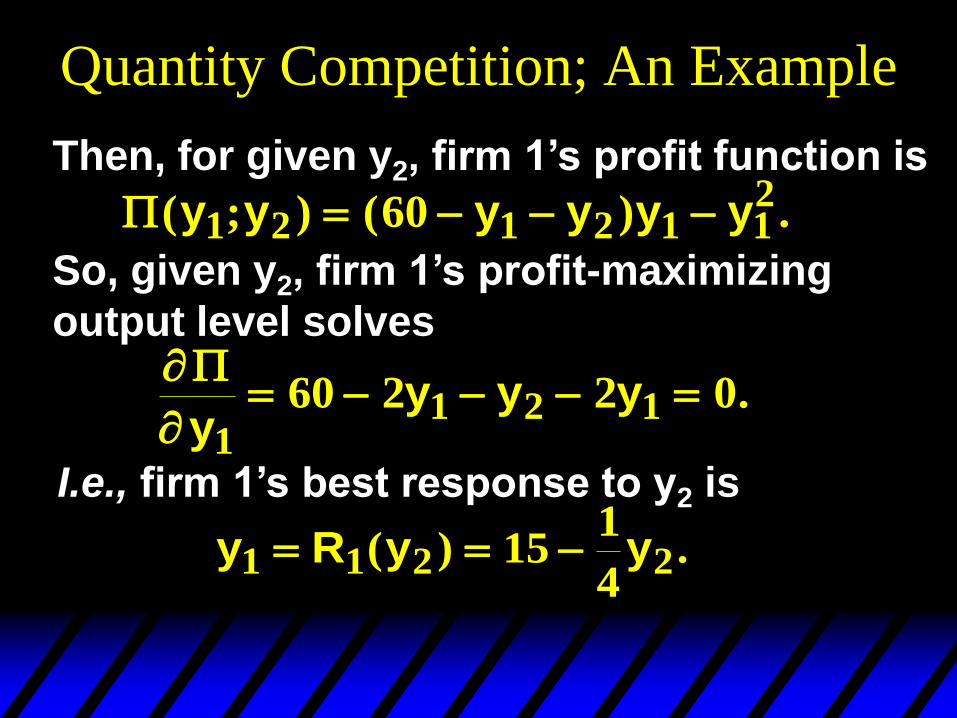
Then, for given y2, firm 1’s profit function is
Quantity Competition; An Example
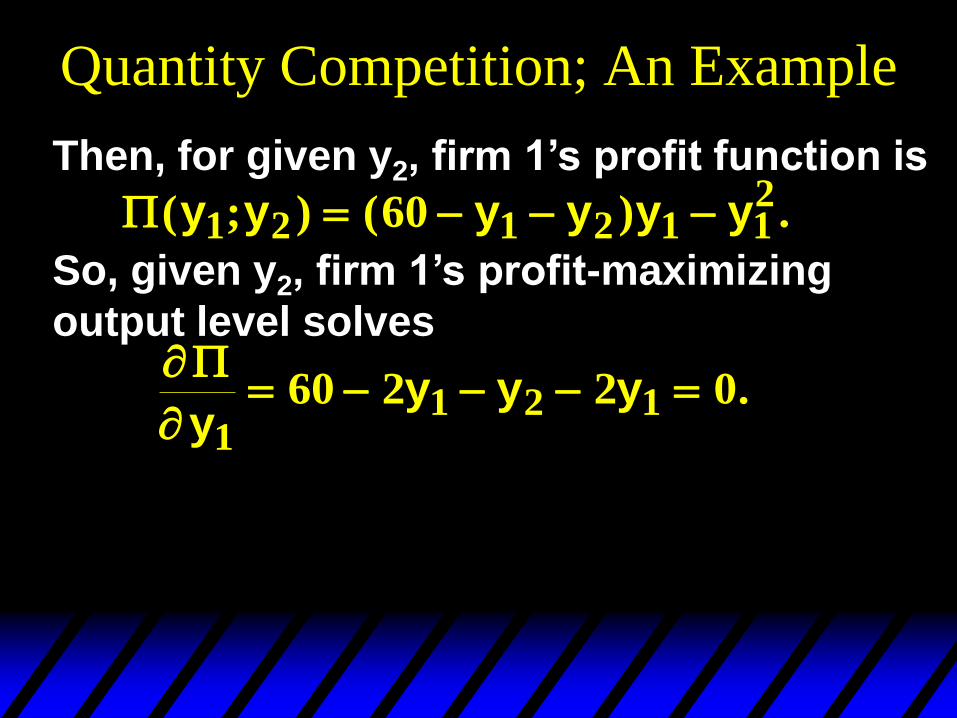
( ; ) ( ) .y y y y y y1 2 1 2 1 12
60
Then, for given y2, firm 1’s profit function is
So, given y2, firm 1’s profit-maximizing
output level solves
yy y y
11 2 160 2 2 0 .
Quantity Competition; An Example
( ; ) ( ) .y y y y y y1 2 1 2 1 12
60
Then, for given y2, firm 1’s profit function is
So, given y2, firm 1’s profit-maximizing
output level solves
yy y y
11 2 160 2 2 0 .
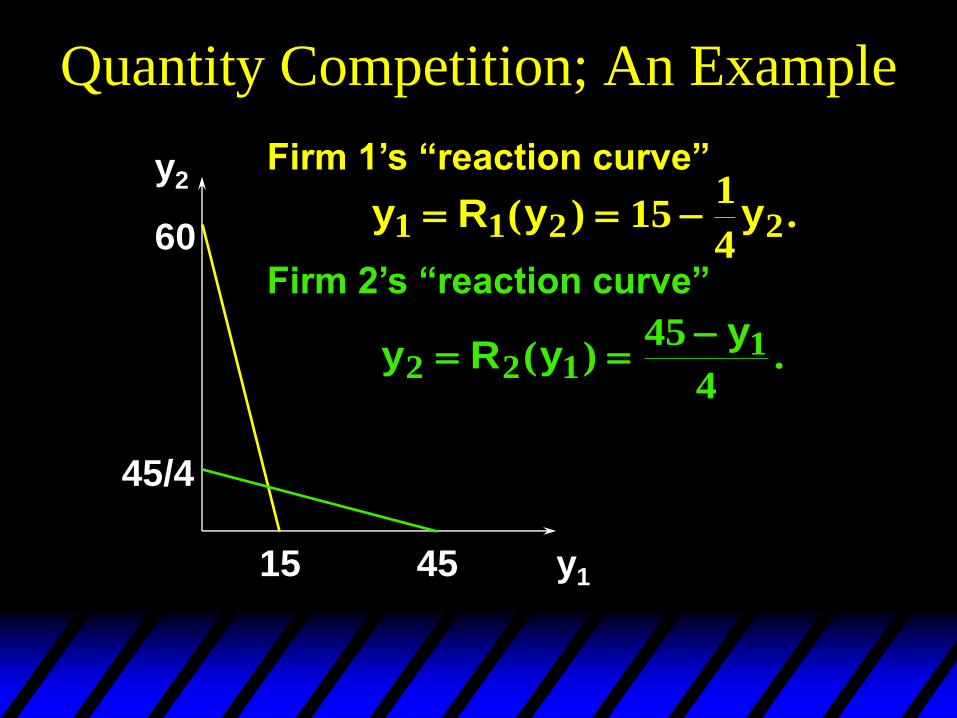
I.e., firm 1’s best response to y2 is
y R y y1 1 2 2151
4 ( ) .
Quantity Competition; An Example
y2
y1
60
15
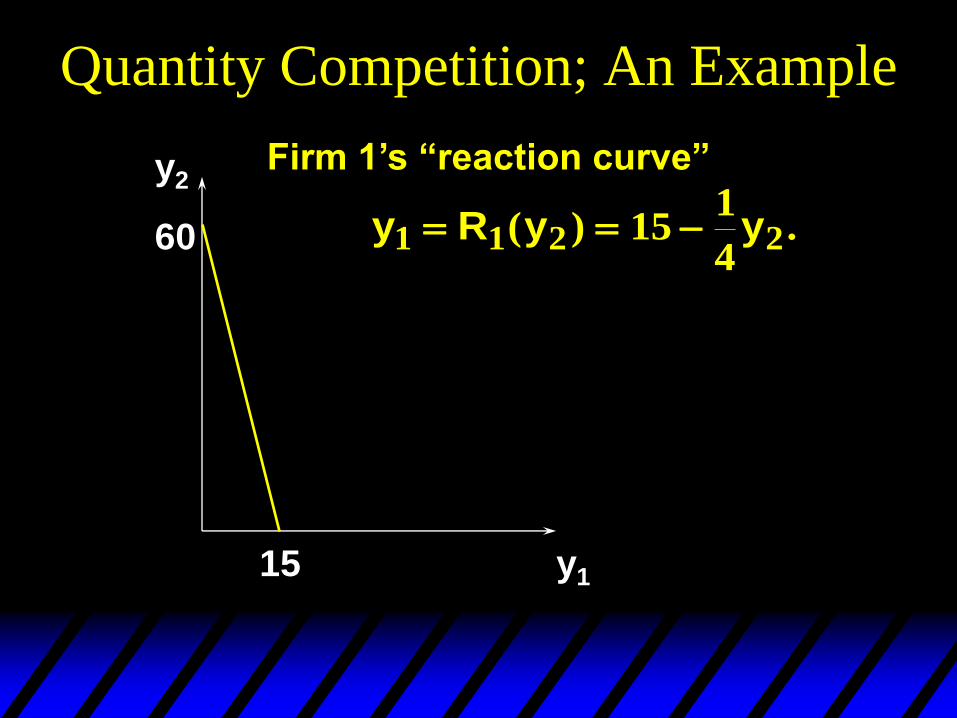
Firm 1’s “reaction curve”
y R y y1 1 2 2151
4 ( ) .
Quantity Competition; An Example
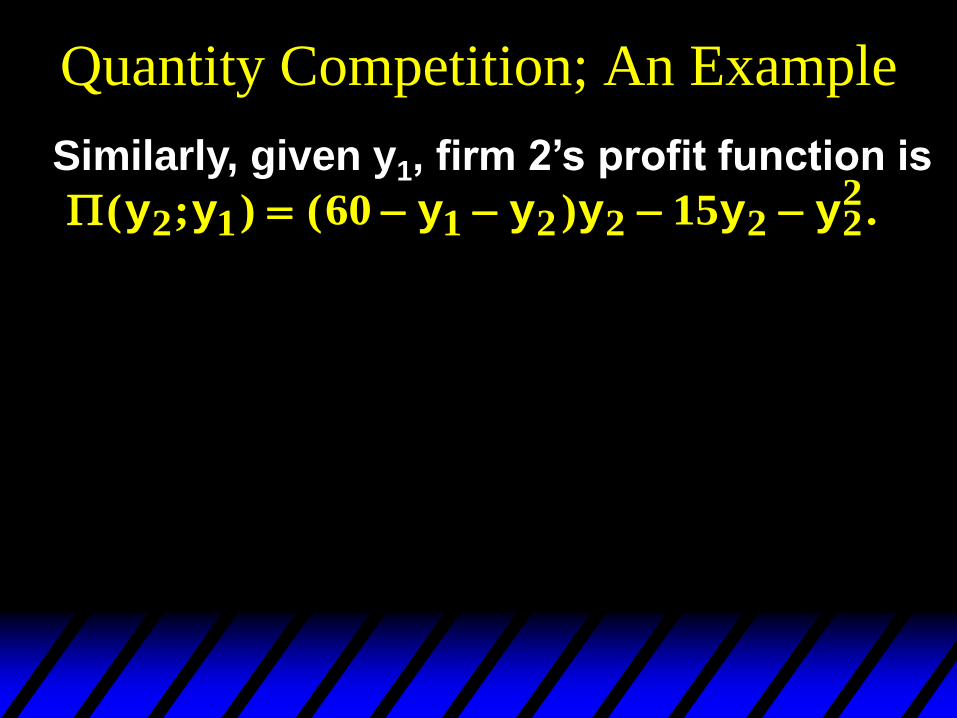
( ; ) ( ) .y y y y y y y2 1 1 2 2 2 22
60 15
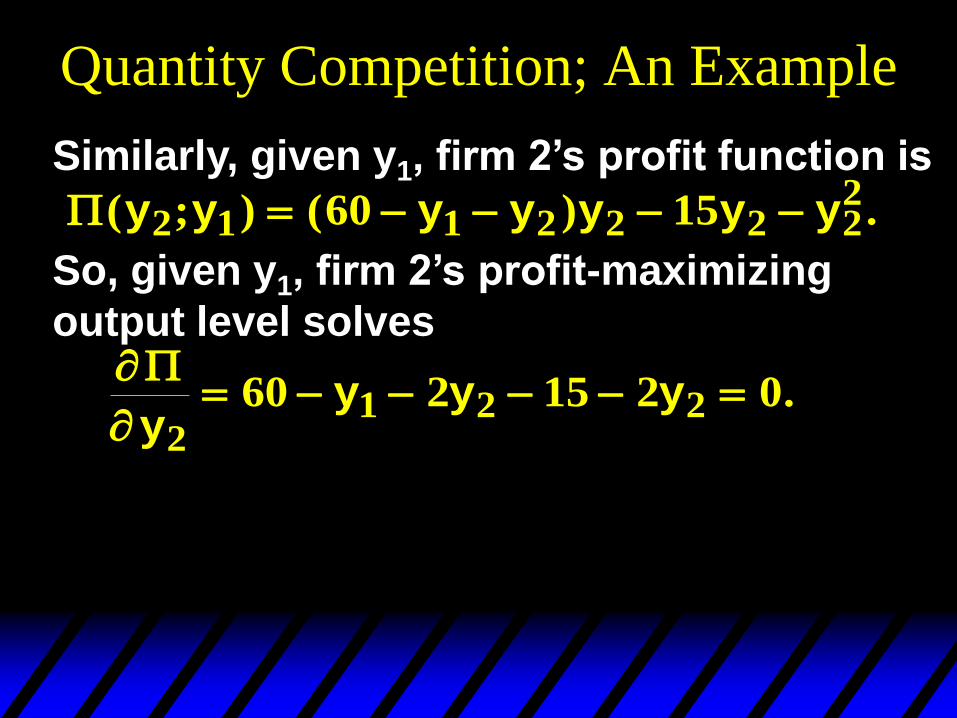
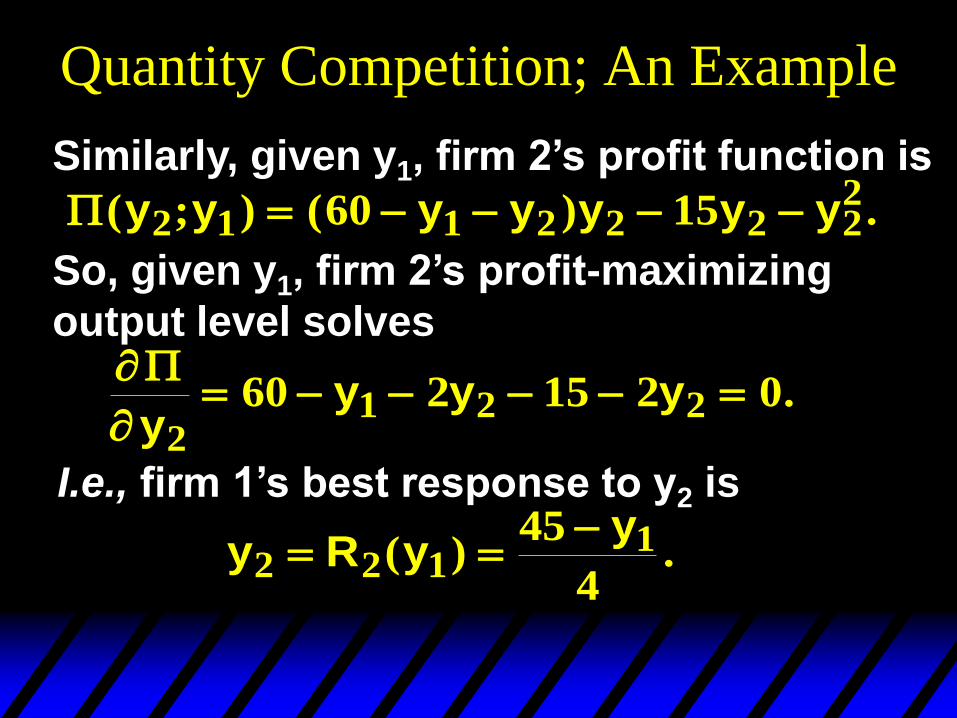
Similarly, given y1, firm 2’s profit function is
Quantity Competition; An Example
( ; ) ( ) .y y y y y y y2 1 1 2 2 2 22
60 15
Similarly, given y1, firm 2’s profit function is
So, given y1, firm 2’s profit-maximizing
output level solves
yy y y
21 2 260 2 15 2 0 .
Quantity Competition; An Example
( ; ) ( ) .y y y y y y y2 1 1 2 2 2 22
60 15
Similarly, given y1, firm 2’s profit function is
So, given y1, firm 2’s profit-maximizing
output level solves
yy y y
21 2 260 2 15 2 0 .
I.e., firm 1’s best response to y2 is
y R yy
2 2 1145
4
( ) .
Quantity Competition; An Example
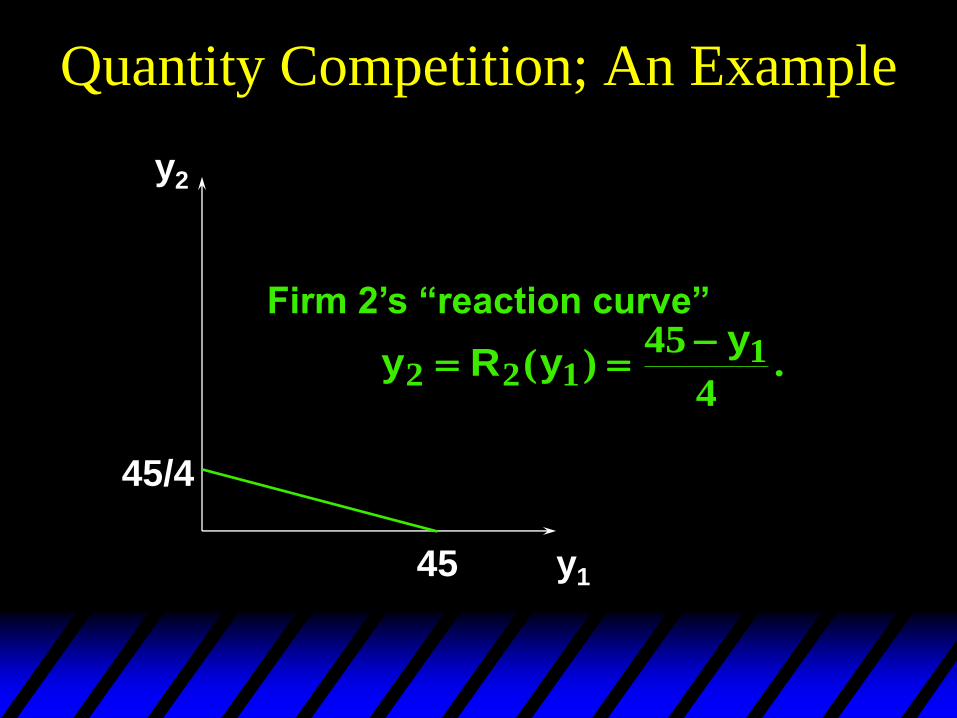
y2
y1
Firm 2’s “reaction curve”
y R yy
2 2 1145
4
( ) .
45/4
45
Quantity Competition; An Example
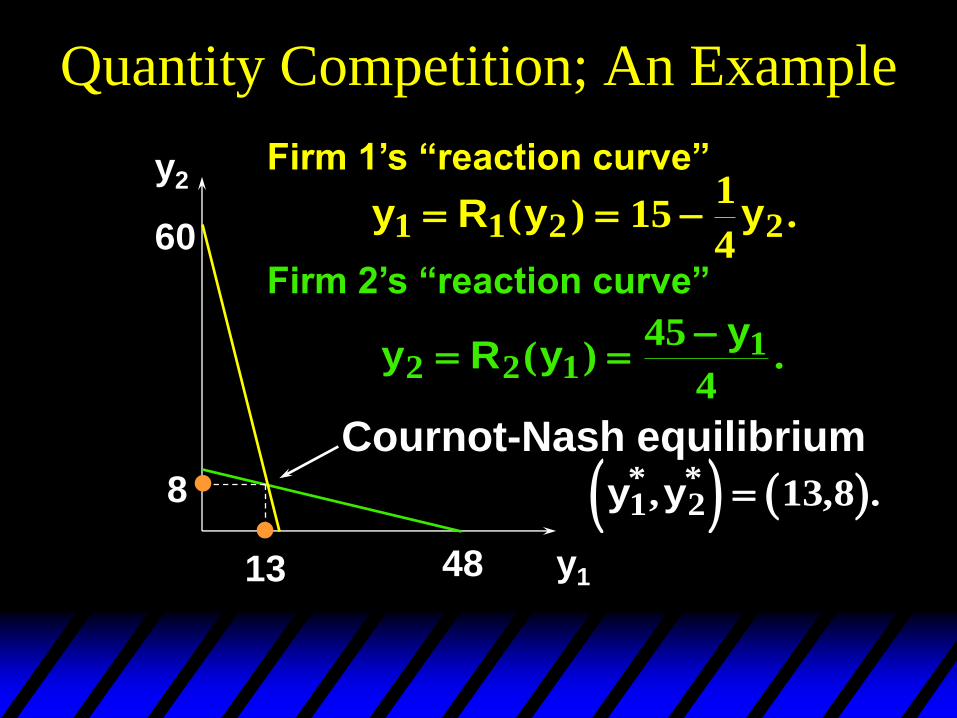
An equilibrium is when each firm’s
output level is a best response to the
other firm’s output level, for then
neither wants to deviate from its
output level.
A pair of output levels (y1*,y2*) is a
Cournot-Nash equilibrium if
y R y2 2 1* *
( ).y R y1 1 2* *
( ) and
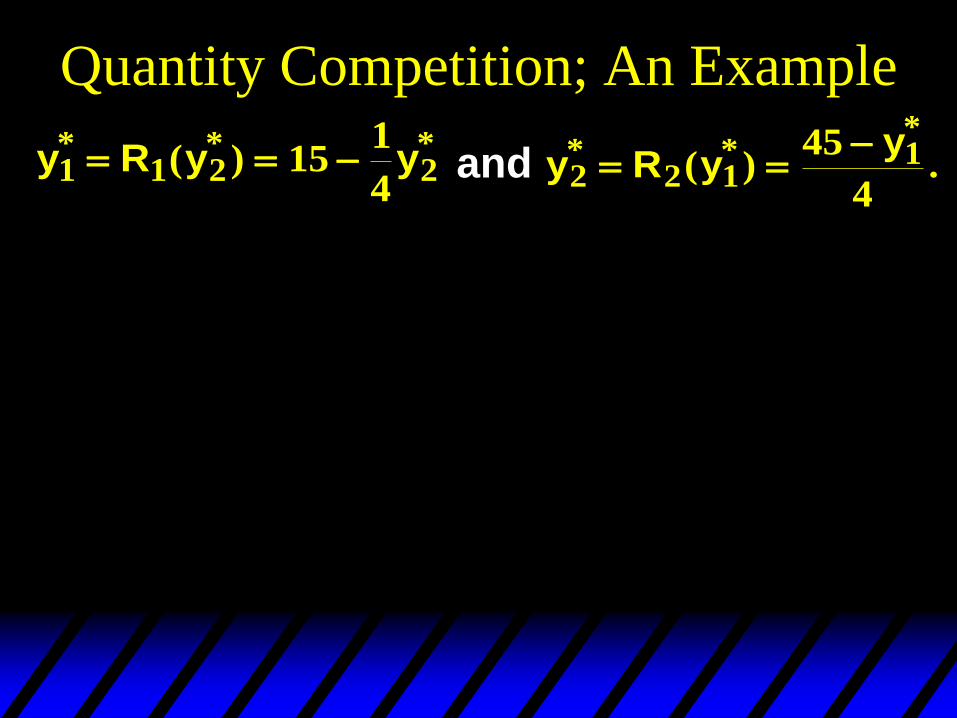
Quantity Competition; An Example
y R y y1 1 2 2151
4
* * *( ) y R y
y2 2 1
145
4
* **
( ) .
and
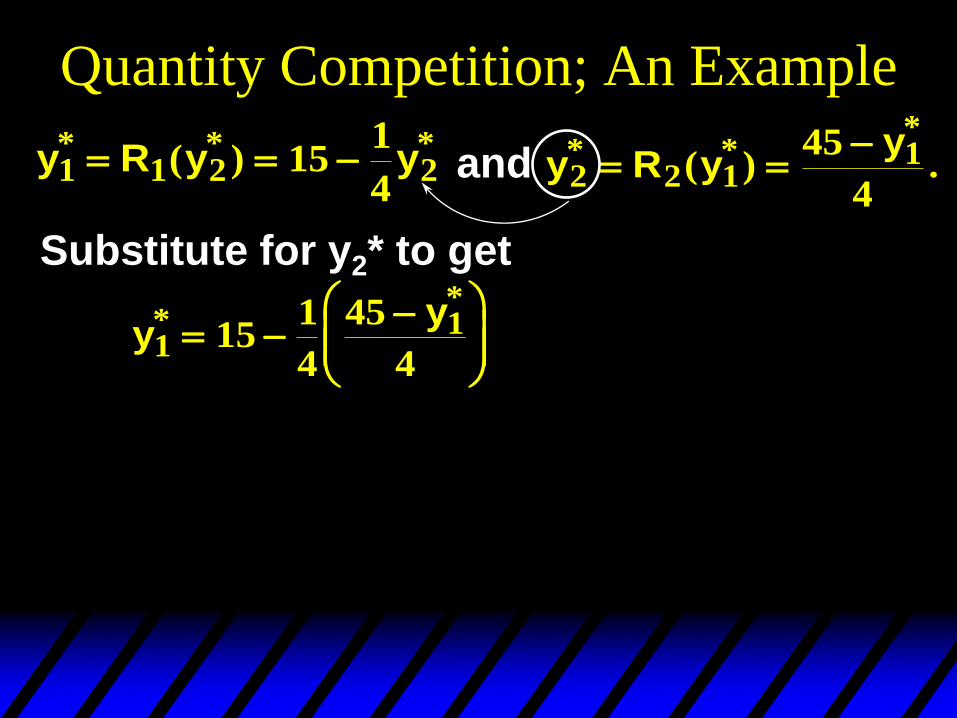
Quantity Competition; An Example
y R y y1 1 2 2151
4
* * *( ) y R y
y2 2 1
145
4
* **
( ) .
and
Substitute for y2* to get
yy
1115
1
4
45
4
**
Quantity Competition; An Example
y R y y1 1 2 2151
4
* * *( ) y R y
y2 2 1
145
4
* **
( ) .
and
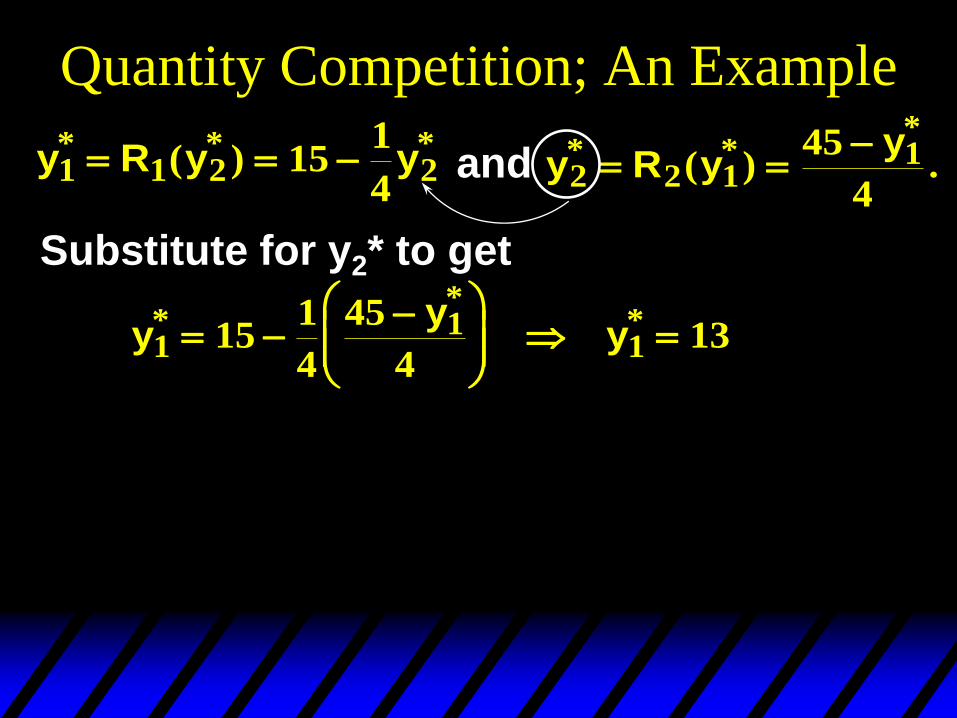
Substitute for y2* to get
yy
y11
1151
4
45
413
**
*
Quantity Competition; An Example
y R y y1 1 2 2151
4
* * *( ) y R y
y2 2 1
145
4
* **
( ) .
and
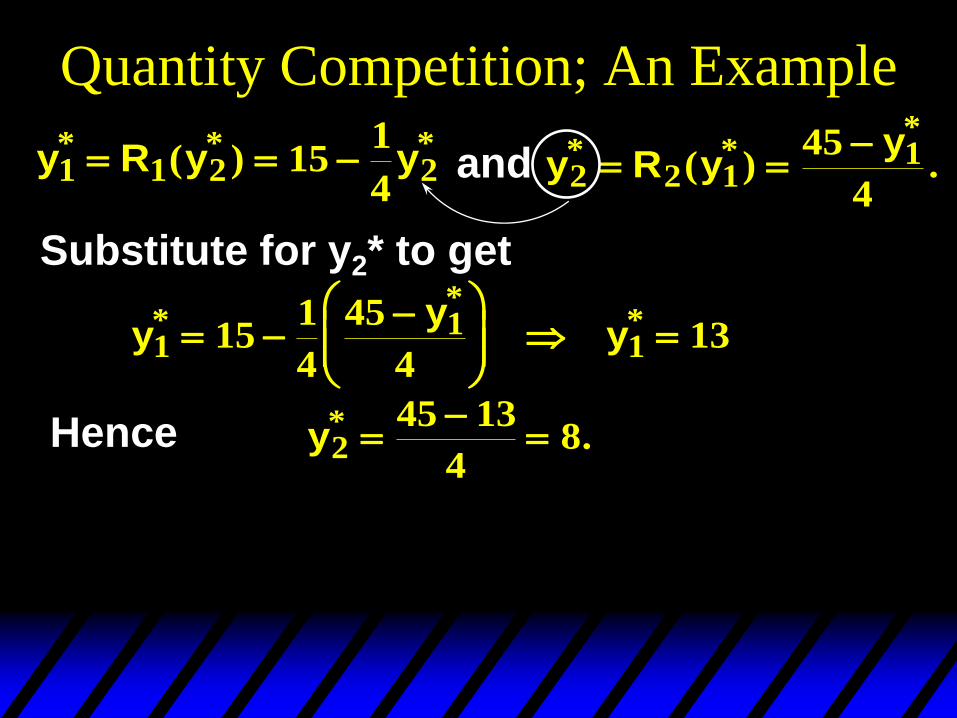
Substitute for y2* to get
yy
y11
1151
4
45
413
**
*
Hence y245 13
48
*.
Quantity Competition; An Example
y R y y1 1 2 2151
4
* * *( ) y R y
y2 2 1
145
4
* **
( ) .
and
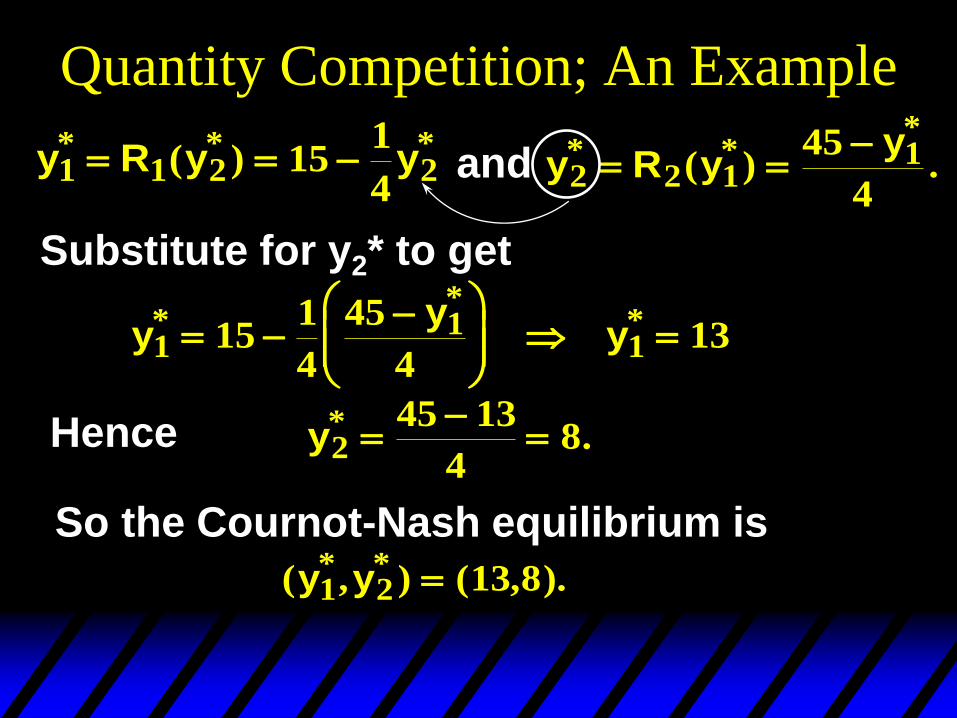
Substitute for y2* to get
yy
y11
1151
4
45
413
**
*
Hence y245 13
48
*.
So the Cournot-Nash equilibrium is
( , ) ( , ).* *y y1 2 13 8
Quantity Competition; An Example
y2
y1
Firm 2’s “reaction curve”
60
15
Firm 1’s “reaction curve”
y R y y1 1 2 2151
4 ( ) .
y R yy
2 2 1145
4
( ) .
45/4
45
Quantity Competition; An Example
y2
y1
Firm 2’s “reaction curve”
48
60
Firm 1’s “reaction curve”
y R y y1 1 2 2151
4 ( ) .
8
13
Cournot-Nash equilibrium
y y1 2 13 8* *, , .
y R yy
2 2 1145
4
( ) .
Quantity Competition
1 1 2 1 2 1 1 1( ; ) ( ) ( )y y p y y y c y
1
11 2 1
1 2
11 1 0
yp y y y
p y y
yc y
( )
( )( ) .
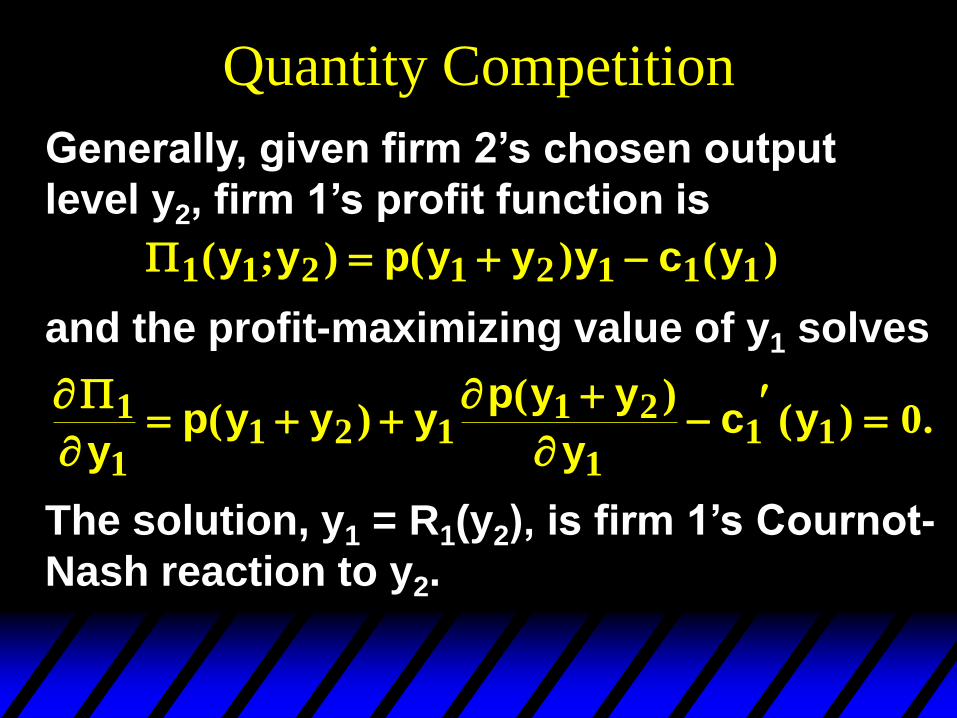
Generally, given firm 2’s chosen output
level y2, firm 1’s profit function is
and the profit-maximizing value of y1 solves
The solution, y1 = R1(y2), is firm 1’s Cournot-
Nash reaction to y2.
Quantity Competition
2 2 1 1 2 2 2 2( ; ) ( ) ( )y y p y y y c y
2
21 2 2
1 2
22 2 0
yp y y y
p y y
yc y
( )
( )( ) .
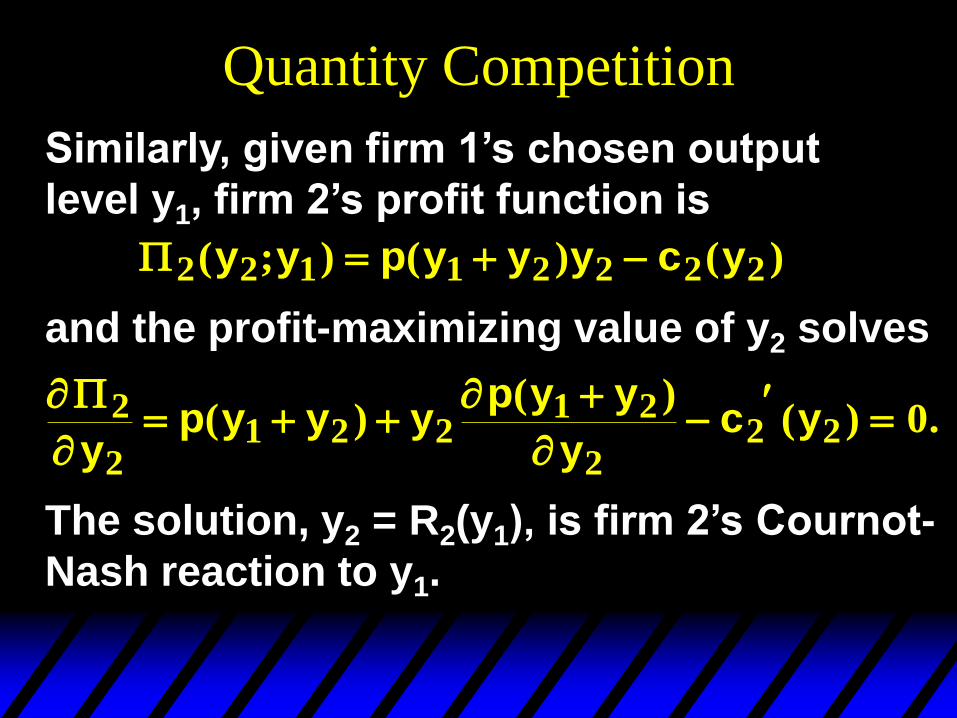
Similarly, given firm 1’s chosen output
level y1, firm 2’s profit function is
and the profit-maximizing value of y2 solves
The solution, y2 = R2(y1), is firm 2’s Cournot-
Nash reaction to y1.
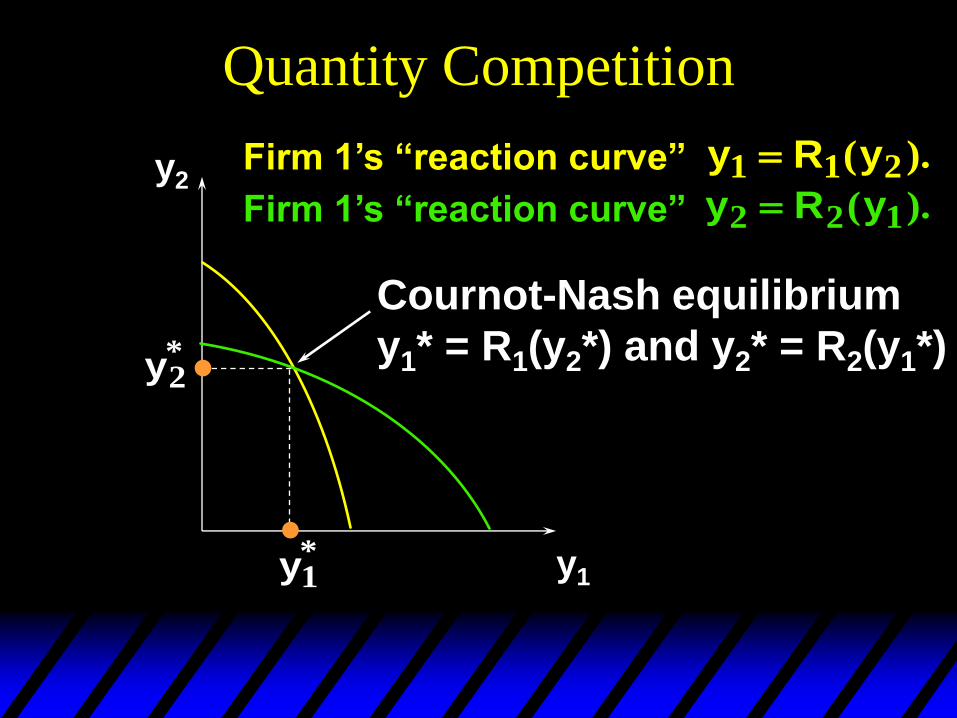
Quantity Competition
y2
y1
Firm 1’s “reaction curve”
Firm 1’s “reaction curve” y R y1 1 2 ( ).
Cournot-Nash equilibrium
y1* = R1(y2*) and y2* = R2(y1*) y2*
y R y2 2 1 ( ).
y1*
Iso-Profit Curves
For firm 1, an iso-profit curve
contains all the output pairs (y1,y2)
giving firm 1 the same profit level 1.
What do iso-profit curves look like?
y2
y1
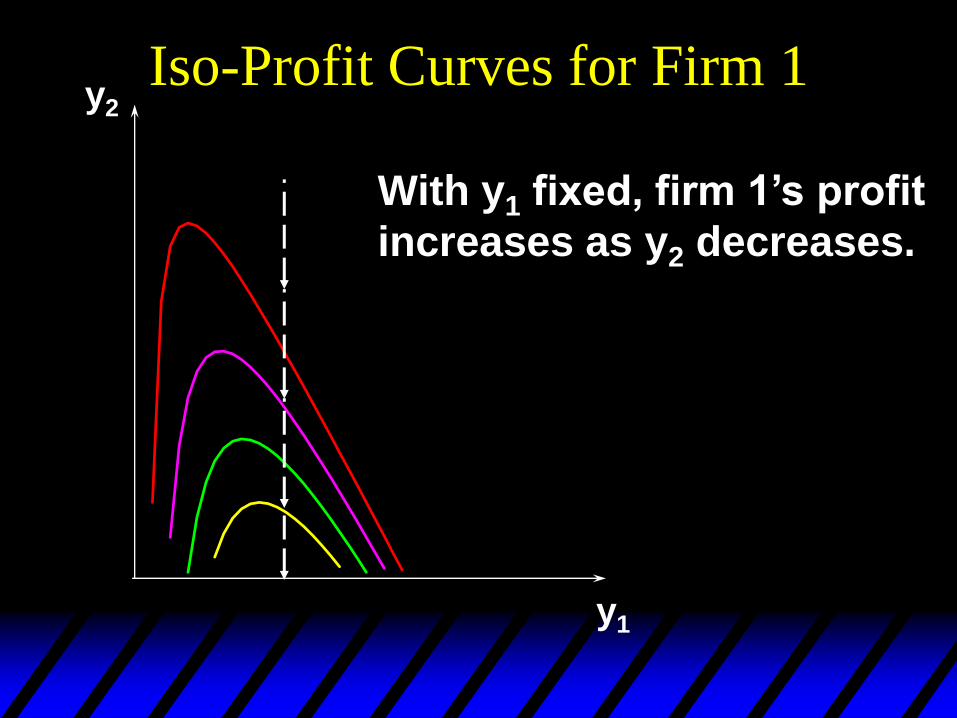
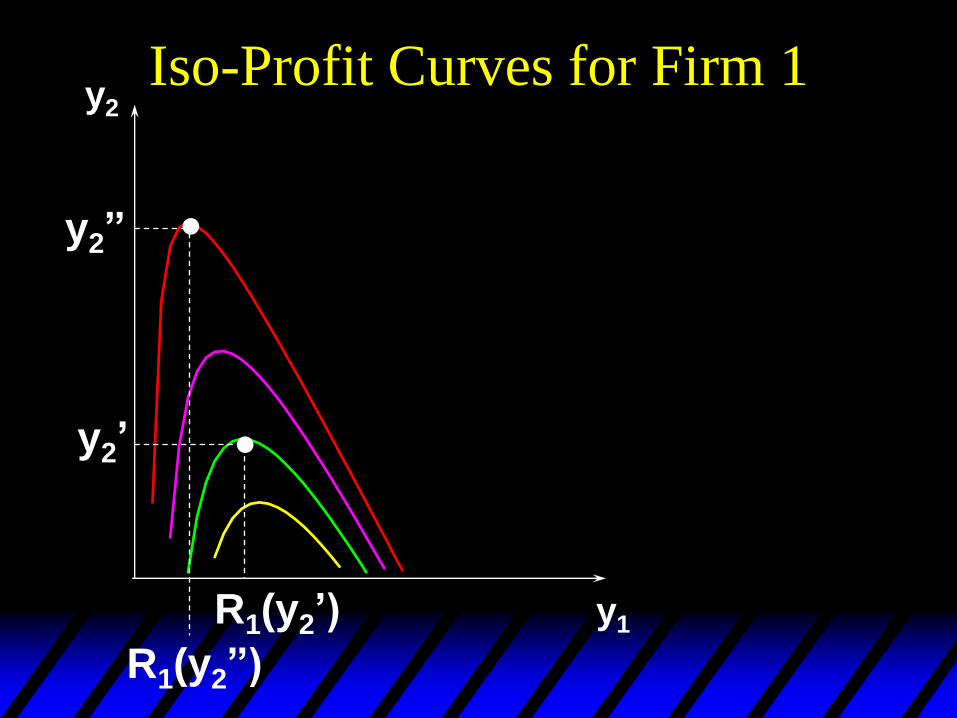
Iso-Profit Curves for Firm 1
With y1 fixed, firm 1’s profit
increases as y2 decreases.
y2
y1
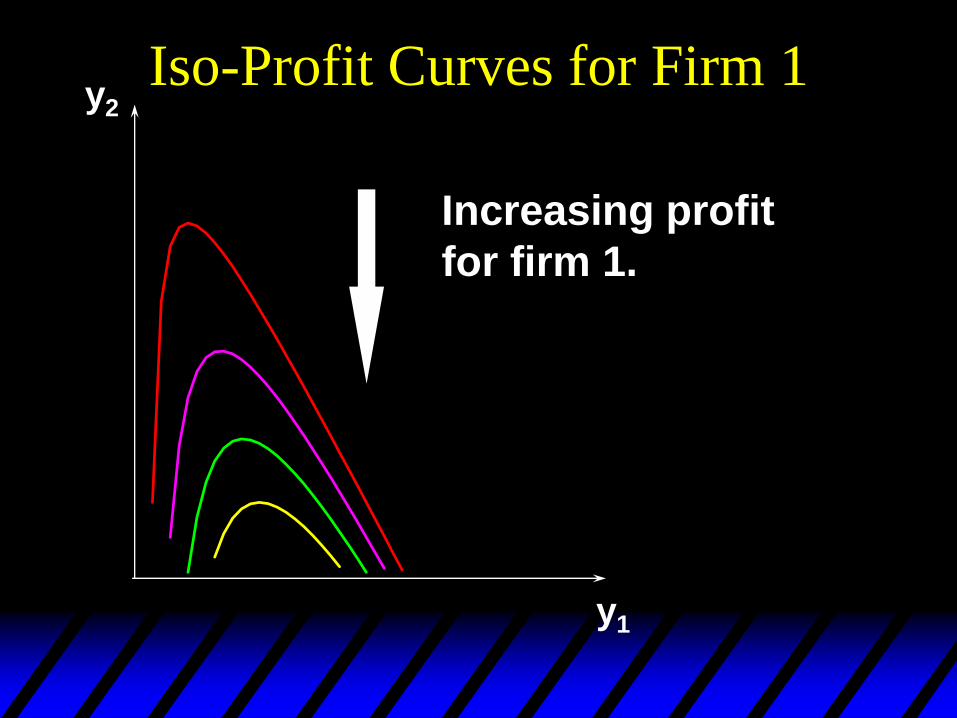
Increasing profit
for firm 1.
Iso-Profit Curves for Firm 1
y2
y1
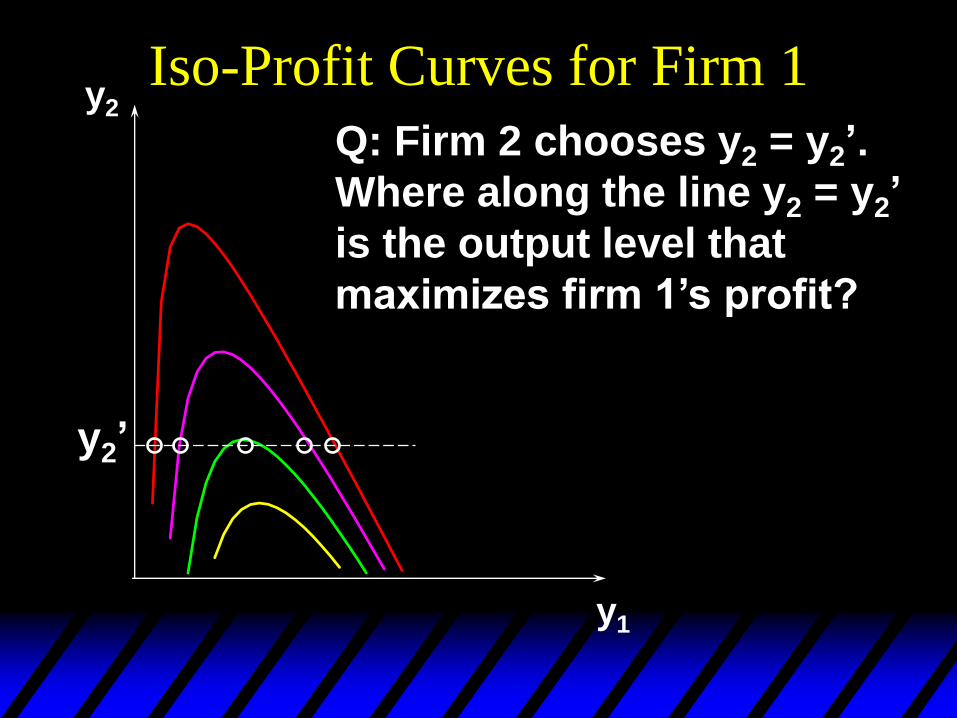
Iso-Profit Curves for Firm 1
Q: Firm 2 chooses y2 = y2’.
Where along the line y2 = y2’
is the output level that
maximizes firm 1’s profit?
y2’
y2
y1
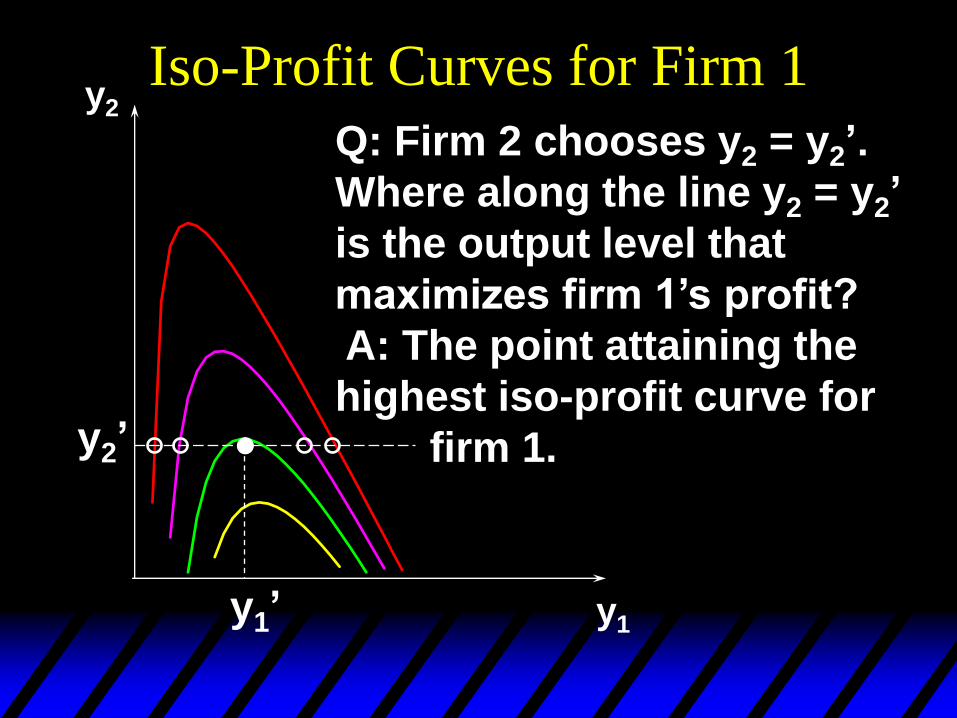
Iso-Profit Curves for Firm 1
Q: Firm 2 chooses y2 = y2’.
Where along the line y2 = y2’
is the output level that
maximizes firm 1’s profit?
A: The point attaining the
highest iso-profit curve for
firm 1. y2’
y1’
y2
y1
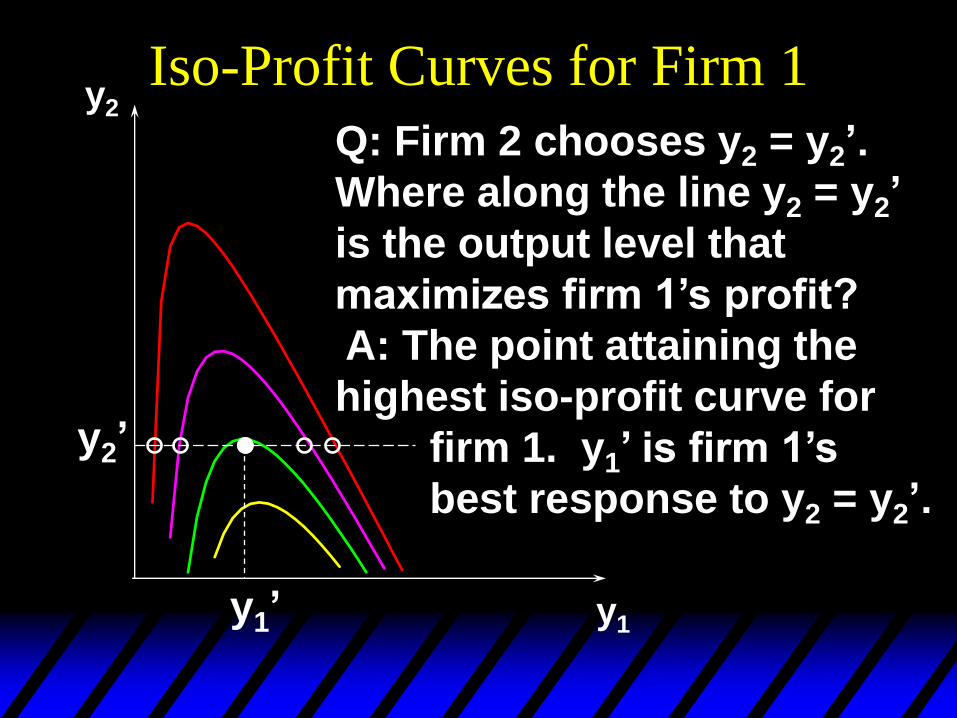
Iso-Profit Curves for Firm 1
Q: Firm 2 chooses y2 = y2’.
Where along the line y2 = y2’
is the output level that
maximizes firm 1’s profit?
A: The point attaining the
highest iso-profit curve for
firm 1. y1’ is firm 1’s
best response to y2 = y2’.
y2’
y1’
y2
y1
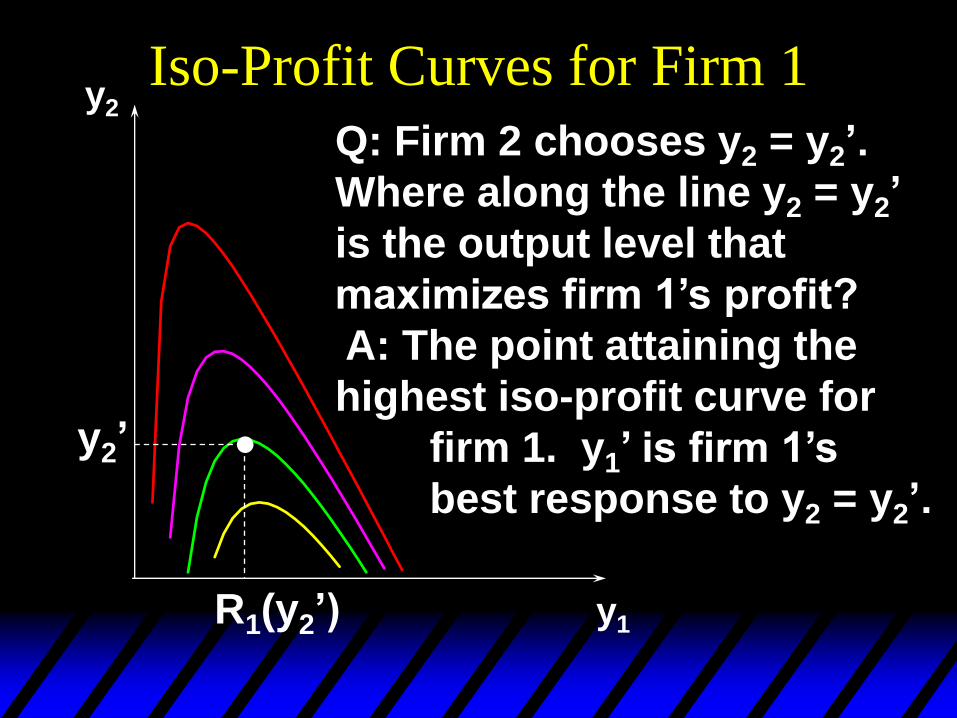
Iso-Profit Curves for Firm 1
Q: Firm 2 chooses y2 = y2’.
Where along the line y2 = y2’
is the output level that
maximizes firm 1’s profit?
A: The point attaining the
highest iso-profit curve for
firm 1. y1’ is firm 1’s
best response to y2 = y2’.
y2’
R1(y2’)
y2
y1
y2’
R1(y2’)
y2”
R1(y2”)
Iso-Profit Curves for Firm 1
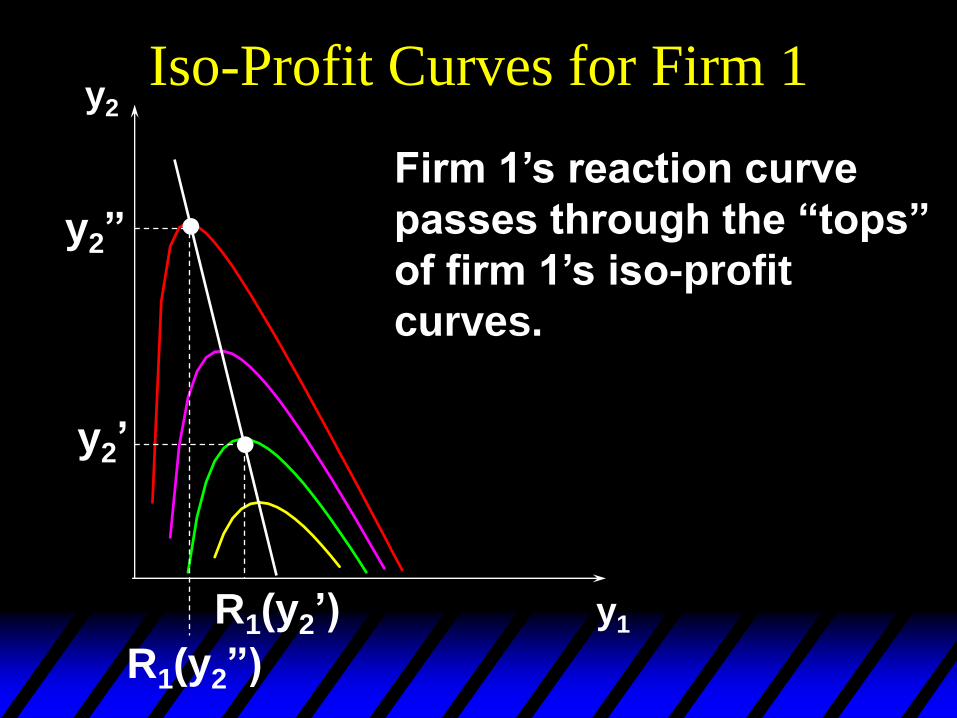
y2
y1
y2’
y2”
R1(y2”)
R1(y2’)
Firm 1’s reaction curve
passes through the “tops”
of firm 1’s iso-profit
curves.
Iso-Profit Curves for Firm 1
y2
y1
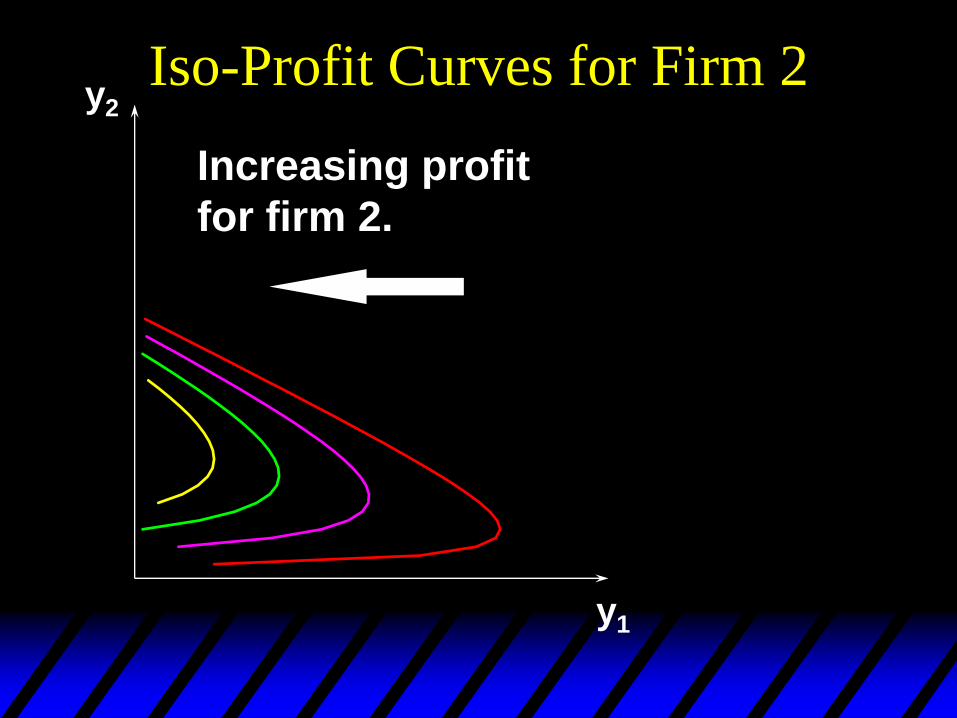
Iso-Profit Curves for Firm 2
Increasing profit
for firm 2.
y2
y1
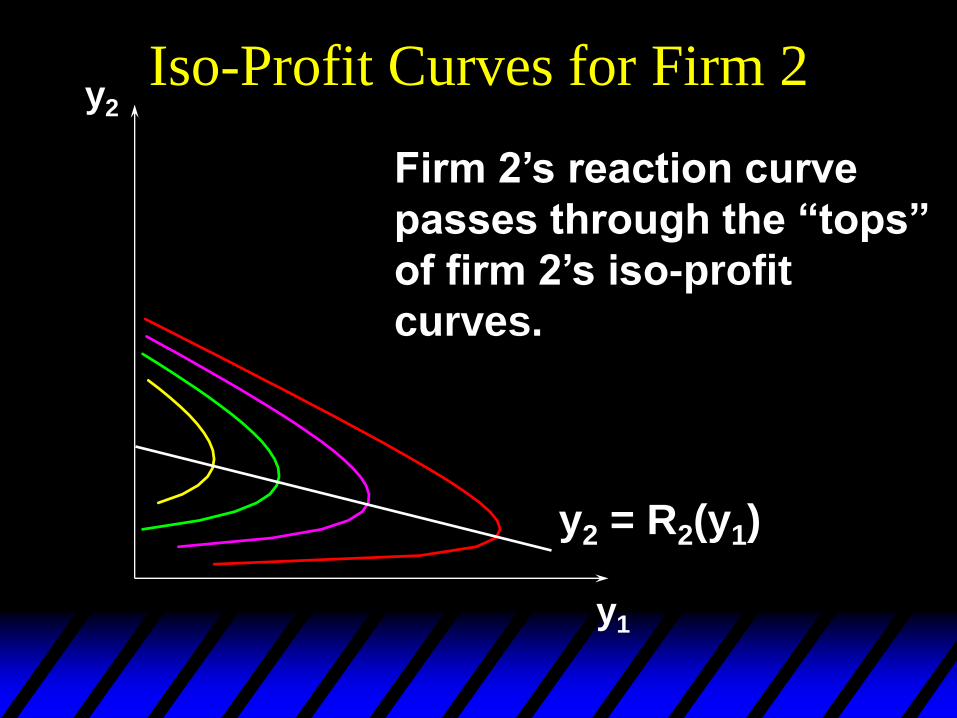
Iso-Profit Curves for Firm 2
Firm 2’s reaction curve
passes through the “tops”
of firm 2’s iso-profit
curves.
y2 = R2(y1)
Collusion
Q: Are the Cournot-Nash equilibrium
profits the largest that the firms can
earn in total?
Collusion y2
y1 y1*
y2*
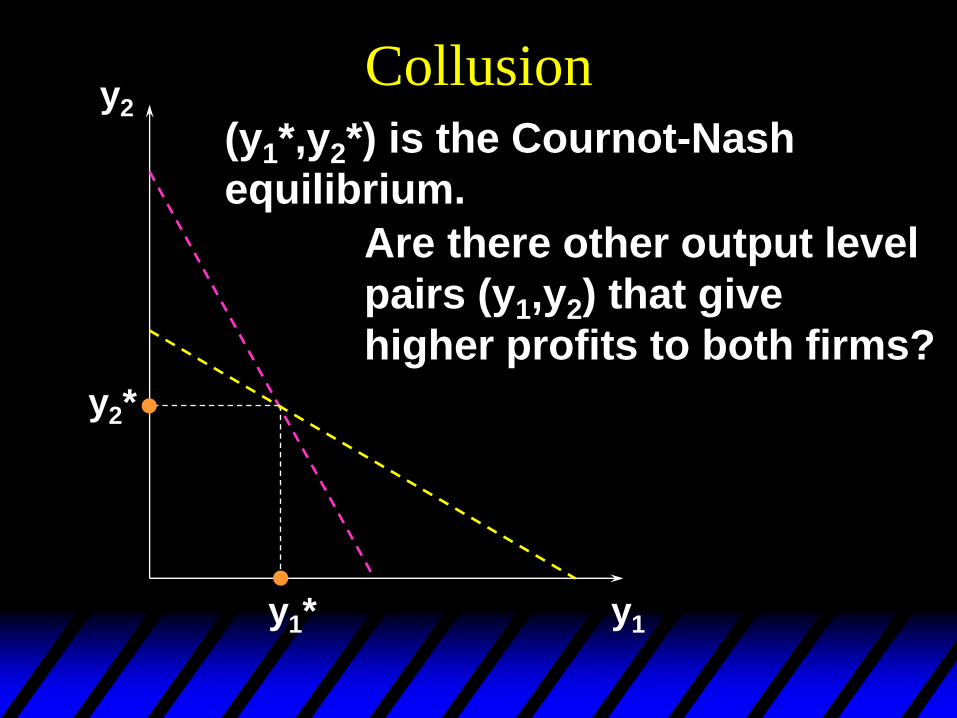
Are there other output level
pairs (y1,y2) that give
higher profits to both firms?
(y1*,y2*) is the Cournot-Nash
equilibrium.
Collusion y2
y1 y1*
y2*
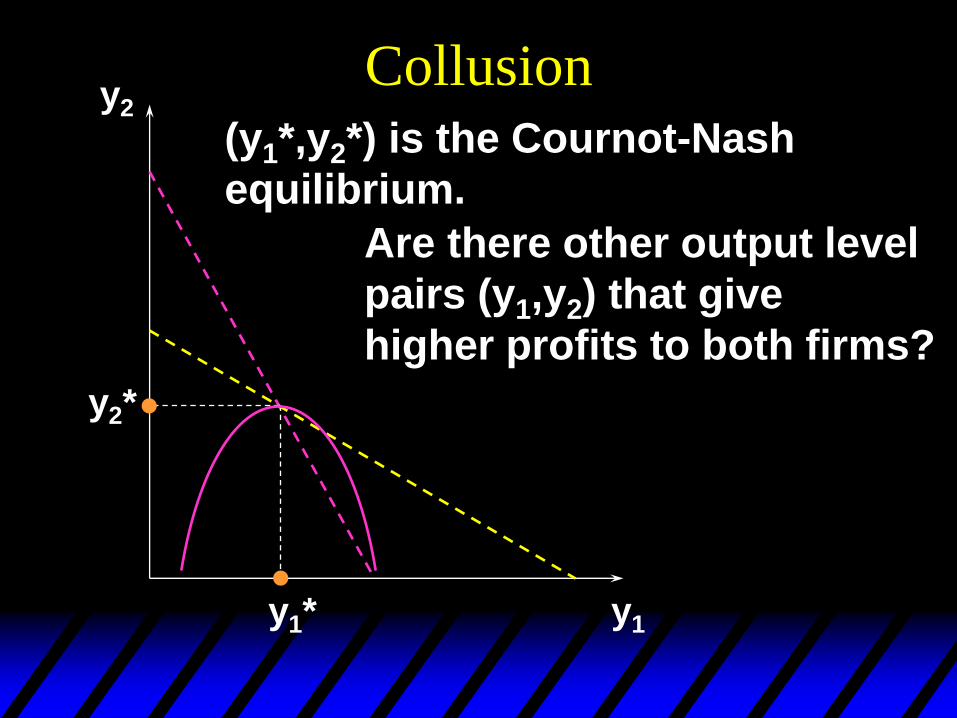
Are there other output level
pairs (y1,y2) that give
higher profits to both firms?
(y1*,y2*) is the Cournot-Nash
equilibrium.
Collusion y2
y1 y1*
y2*
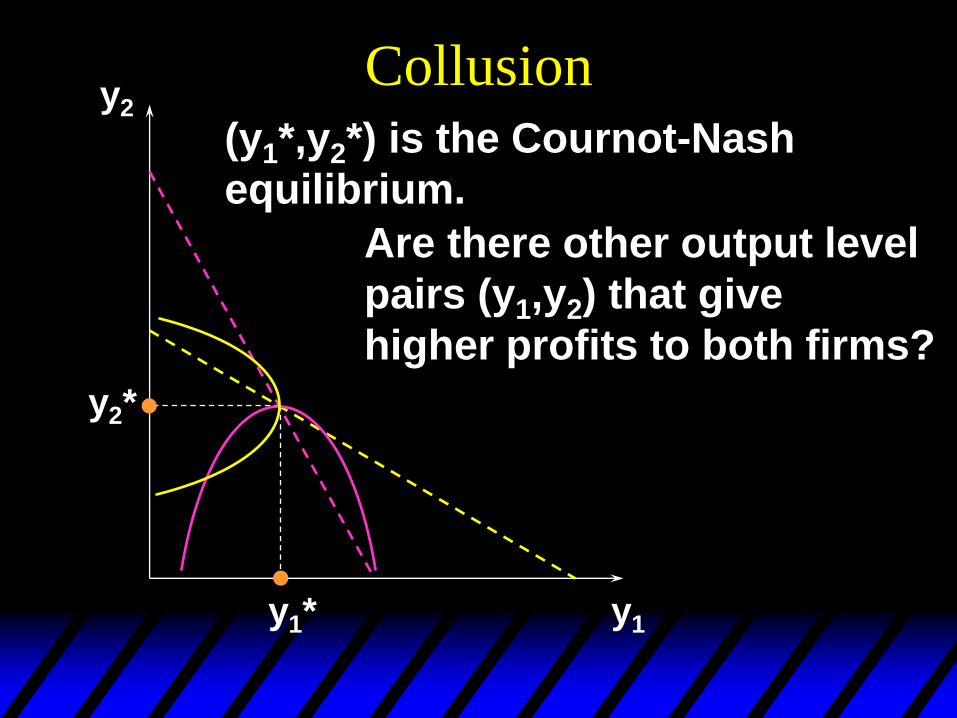
Are there other output level
pairs (y1,y2) that give
higher profits to both firms?
(y1*,y2*) is the Cournot-Nash
equilibrium.
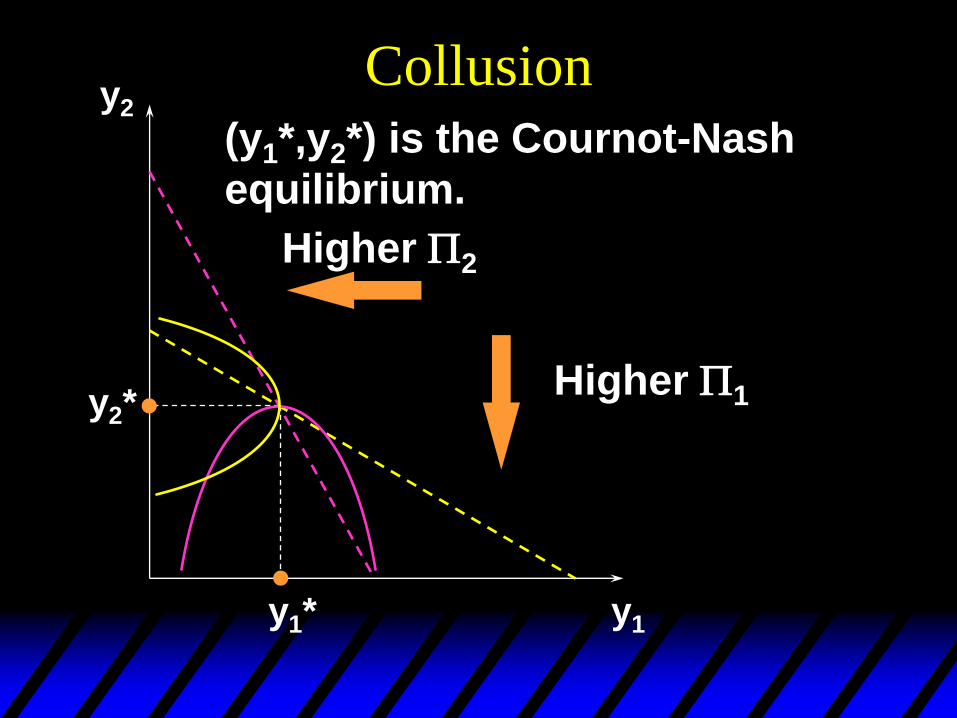
Collusion y2
y1 y1*
y2*
(y1*,y2*) is the Cournot-Nash
equilibrium.
Higher 2
Higher 1
Collusion y2
y1 y1*
y2*
Higher 2
Higher 1 y2’
y1’
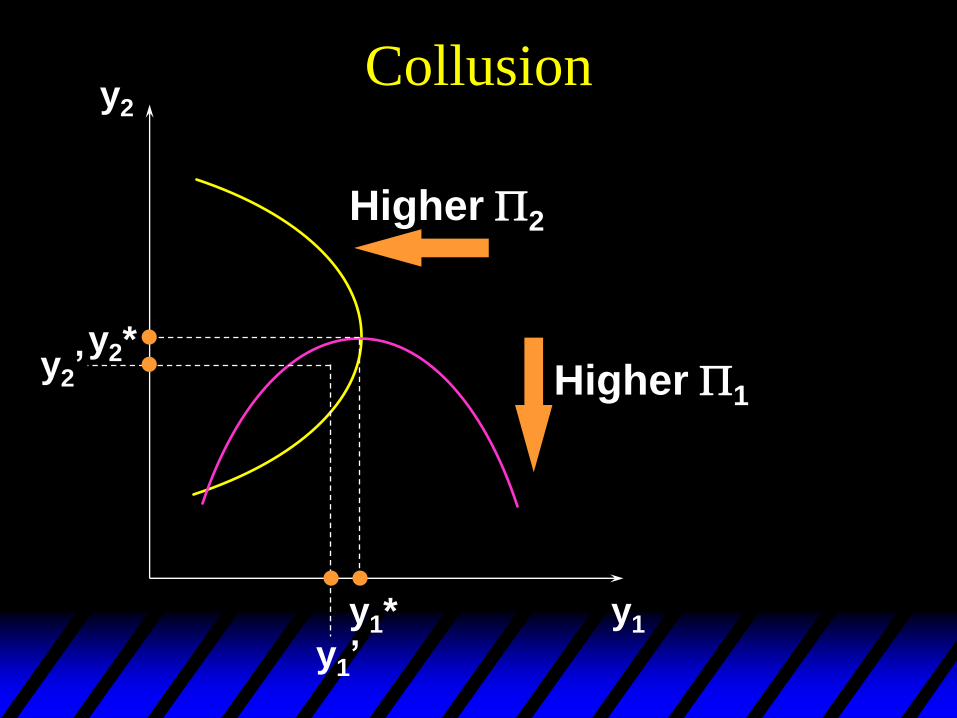
Collusion y2
y1 y1*
y2* y2’
y1’
Higher 2
Higher 1

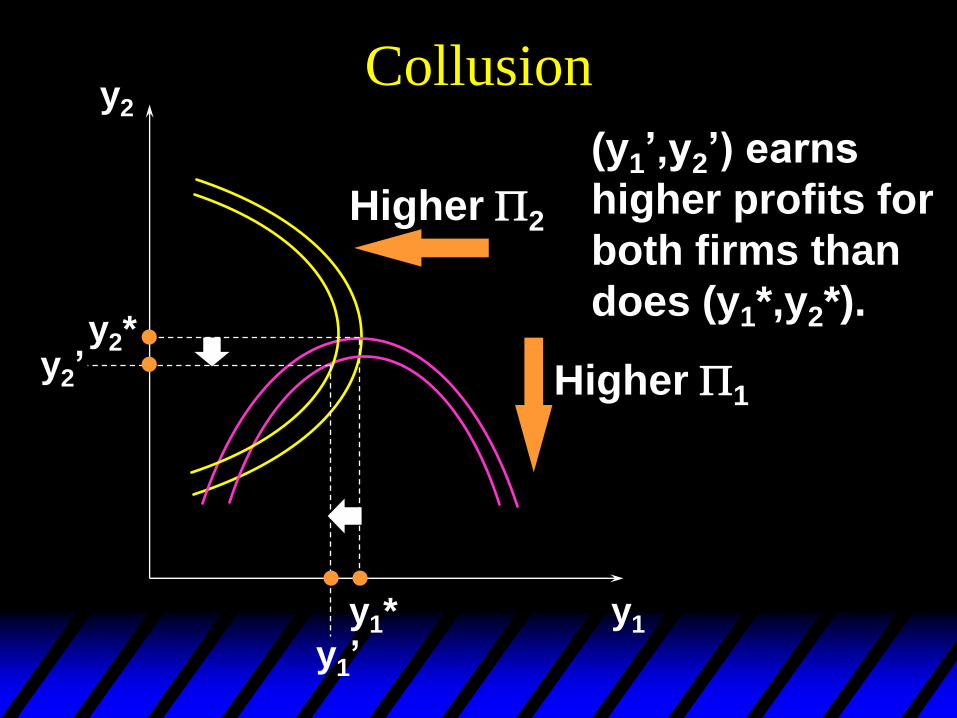
Collusion y2
y1 y1*
y2* y2’
y1’
Higher 2
Higher 1
(y1’,y2’) earns
higher profits for
both firms than
does (y1*,y2*).
Collusion
So there are profit incentives for both
firms to “cooperate” by lowering
their output levels.
This is collusion.
Firms that collude are said to have
formed a cartel.
If firms form a cartel, how should
they do it?
Collusion
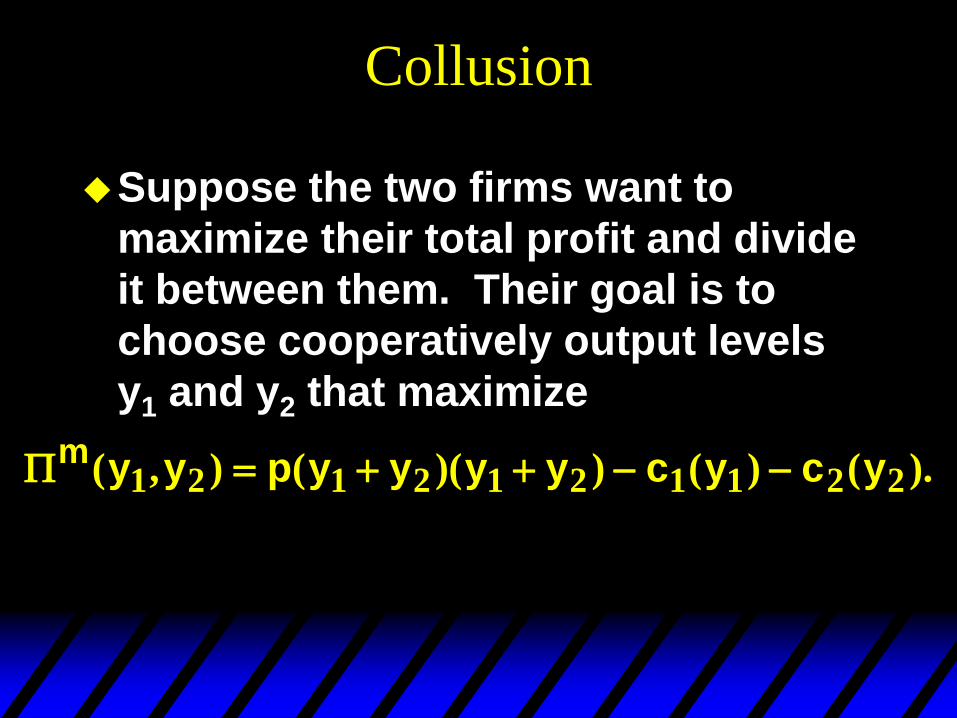
Suppose the two firms want to
maximize their total profit and divide
it between them. Their goal is to
choose cooperatively output levels
y1 and y2 that maximize
m y y p y y y y c y c y( , ) ( )( ) ( ) ( ).1 2 1 2 1 2 1 1 2 2
Collusion
The firms cannot do worse by
colluding since they can cooperatively
choose their Cournot-Nash
equilibrium output levels and so earn
their Cournot-Nash equilibrium
profits. So collusion must provide
profits at least as large as their
Cournot-Nash equilibrium profits.
Collusion y2
y1 y1*
y2* y2’
y1’
Higher 2
Higher 1
(y1’,y2’) earns
higher profits for
both firms than
does (y1*,y2*).
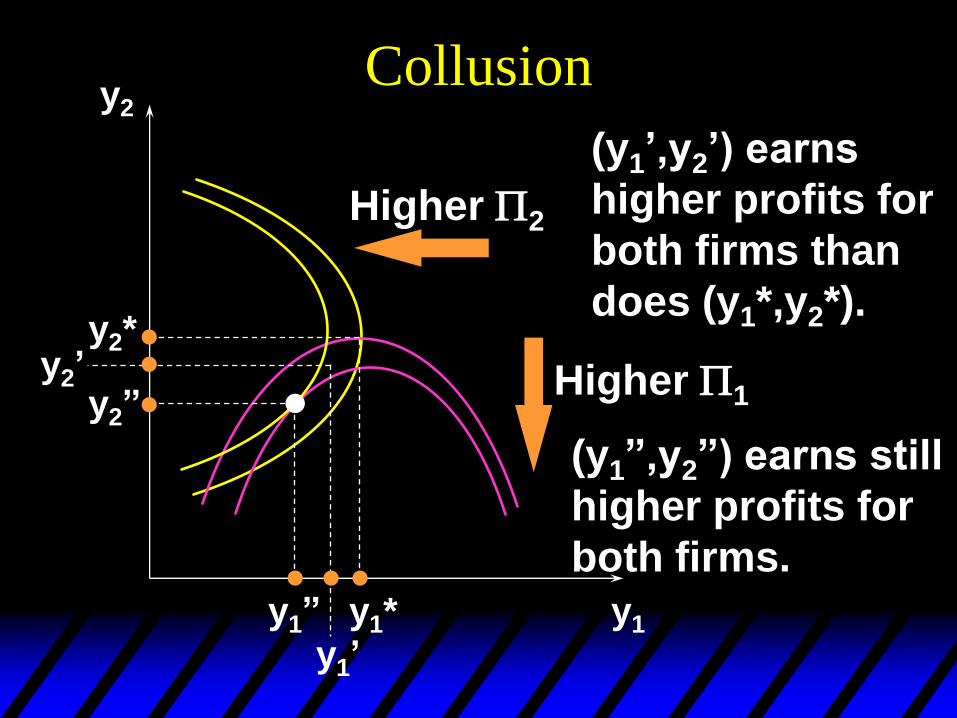
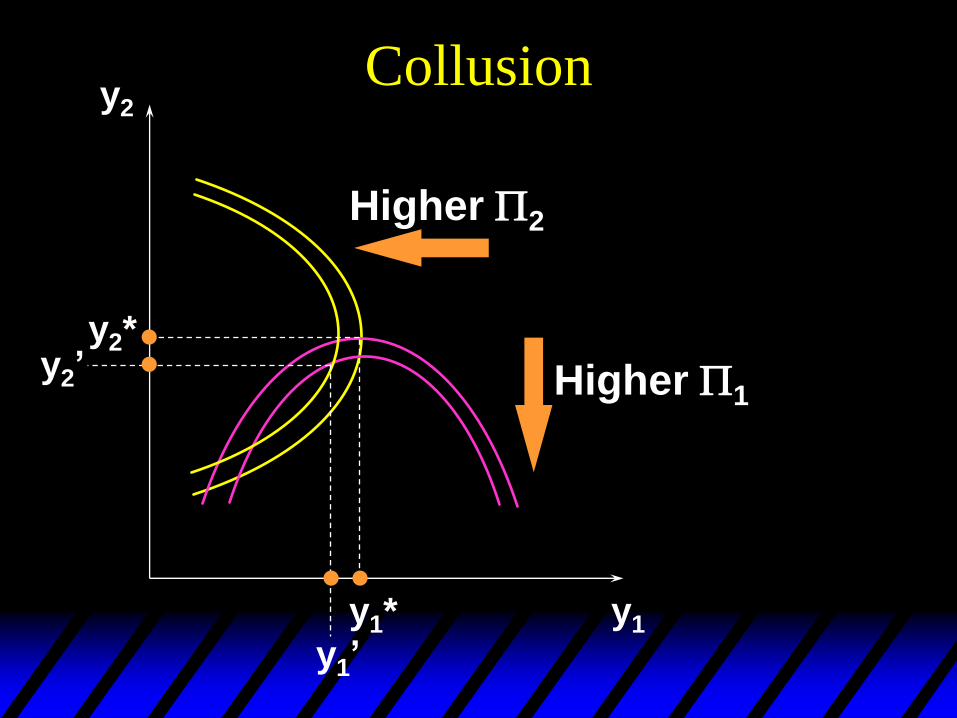
Collusion y2
y1 y1*
y2* y2’
y1’
Higher 2
Higher 1
(y1’,y2’) earns
higher profits for
both firms than
does (y1*,y2*).
(y1”,y2”) earns still
higher profits for
both firms.
y2”
y1”
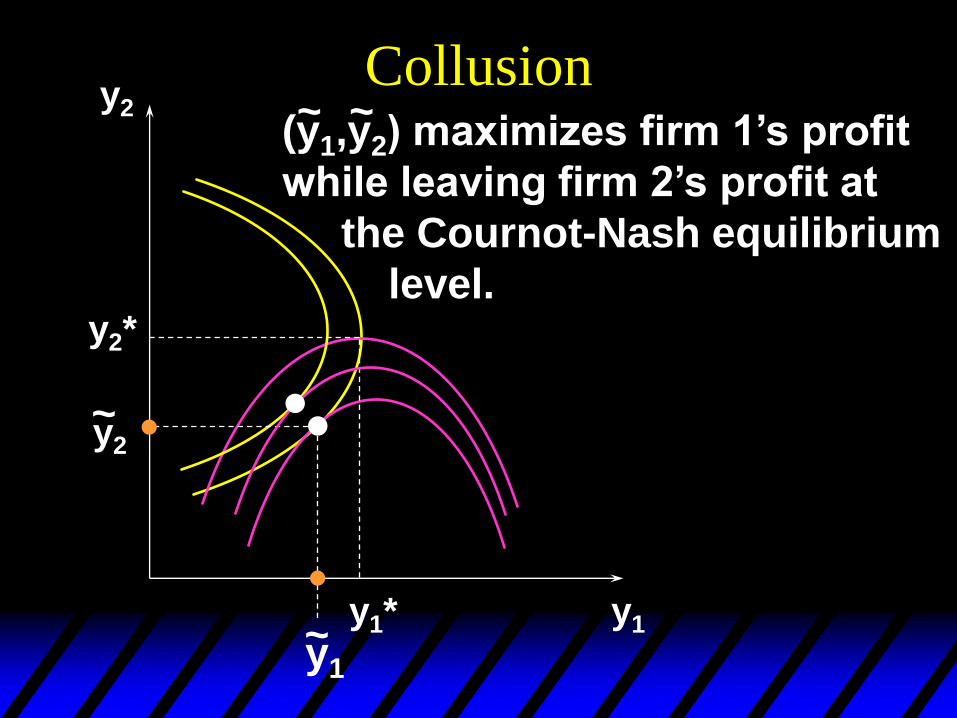
Collusion y2
y1 y1*
y2*
y2 ~
y1 ~
(y1,y2) maximizes firm 1’s profit
while leaving firm 2’s profit at
the Cournot-Nash equilibrium
level.
~ ~
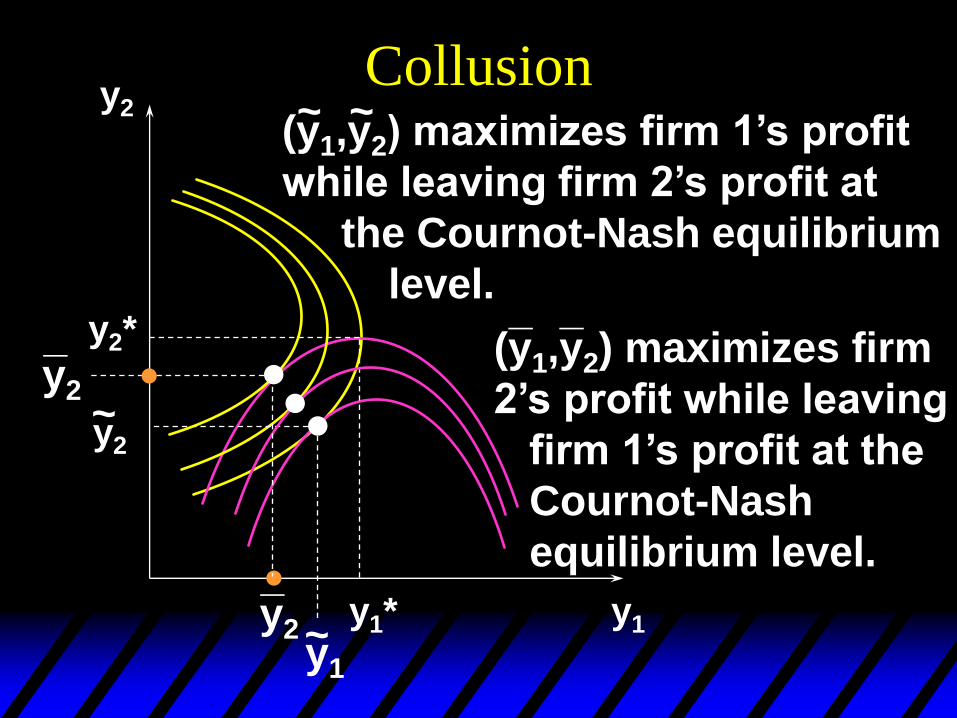
Collusion y2
y1 y1*
y2*
y2 ~
y1 ~
(y1,y2) maximizes firm 1’s profit
while leaving firm 2’s profit at
the Cournot-Nash equilibrium
level.
~ ~
y2
_
y2
_
(y1,y2) maximizes firm
2’s profit while leaving
firm 1’s profit at the
Cournot-Nash
equilibrium level.
_ _
Collusion y2
y1 y1*
y2*
y2 ~
y1 ~
y2
_
y2
_
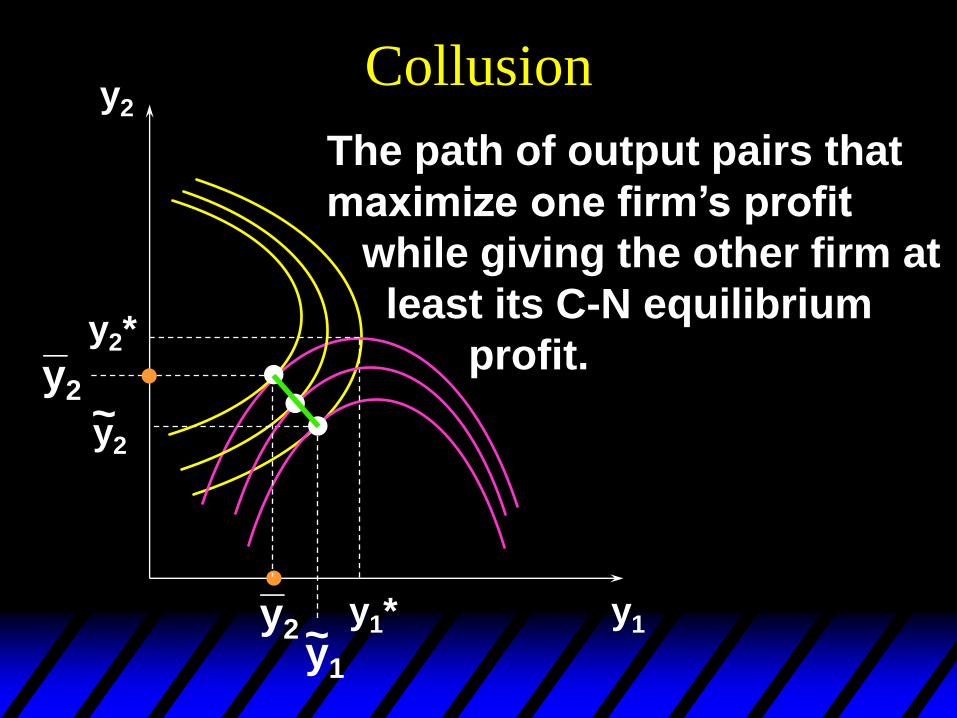
The path of output pairs that
maximize one firm’s profit
while giving the other firm at
least its C-N equilibrium
profit.
Collusion y2
y1 y1*
y2*
y2 ~
y1 ~
y2
_
y2
_
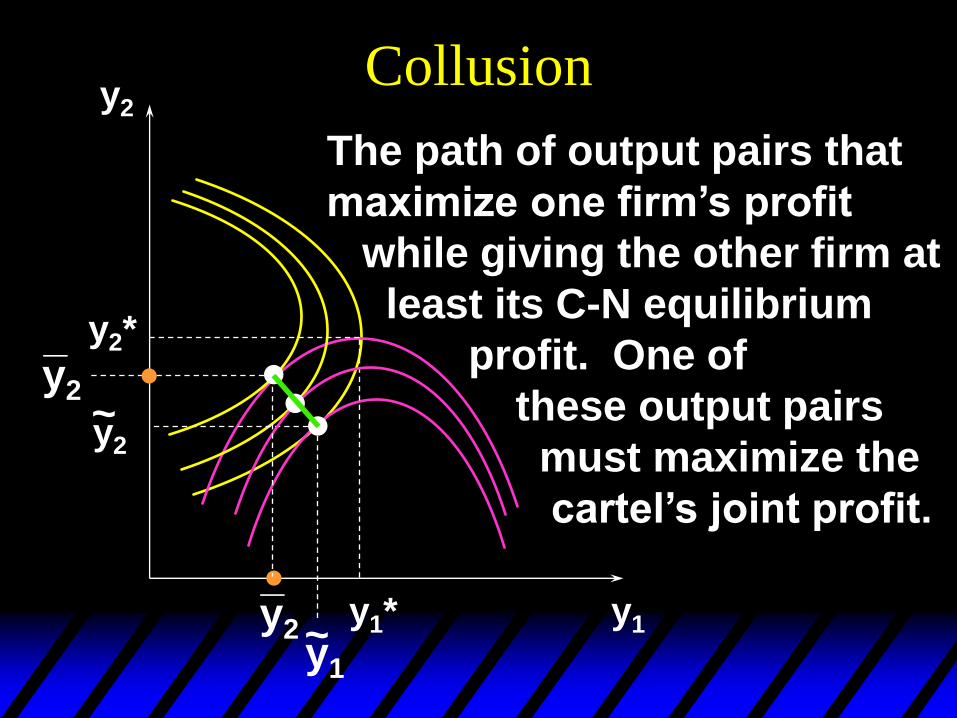
The path of output pairs that
maximize one firm’s profit
while giving the other firm at
least its C-N equilibrium
profit. One of
these output pairs
must maximize the
cartel’s joint profit.
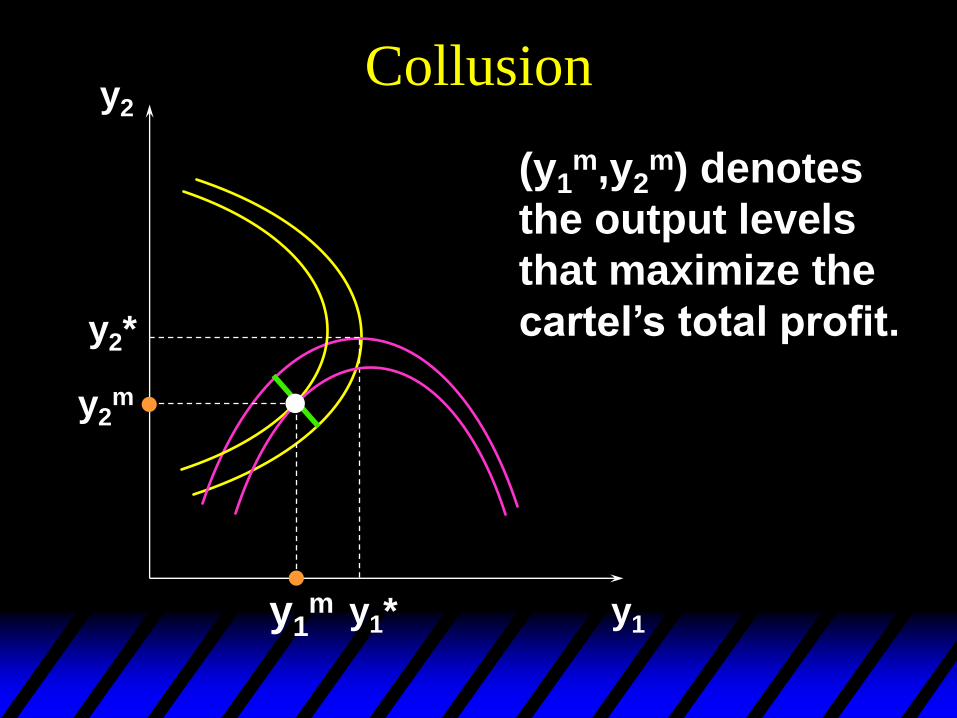
Collusion y2
y1 y1*
y2*
y2m
y1m
(y1m,y2
m) denotes
the output levels
that maximize the
cartel’s total profit.
Collusion
Is such a cartel stable?
Does one firm have an incentive to
cheat on the other?
I.e., if firm 1 continues to produce y1m
units, is it profit-maximizing for firm
2 to continue to produce y2m units?
Collusion
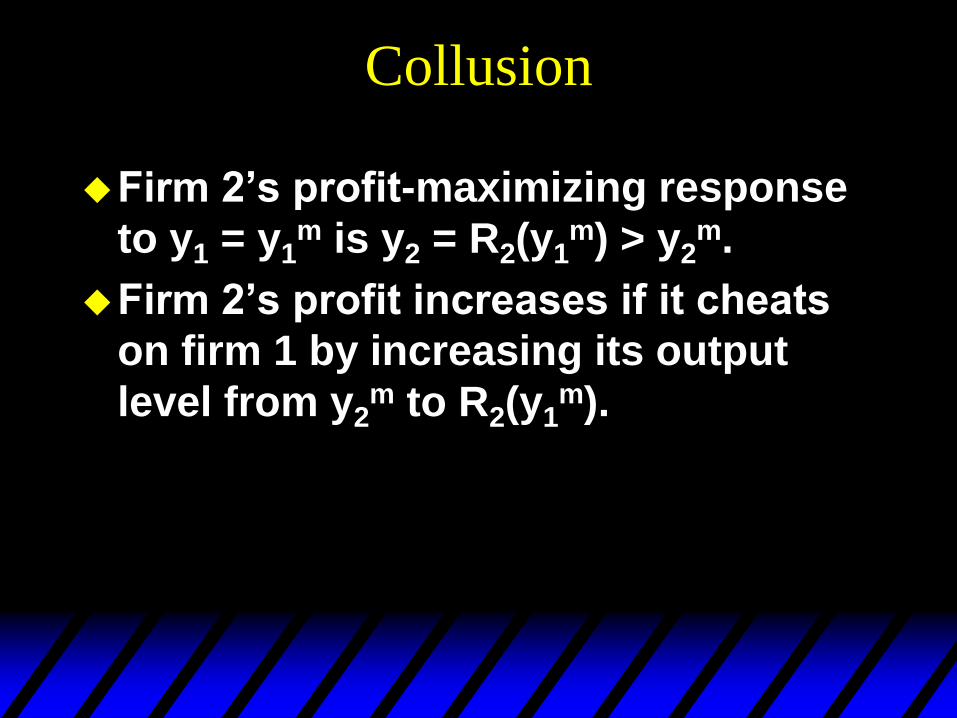
Firm 2’s profit-maximizing response
to y1 = y1m is y2 = R2(y1
m).
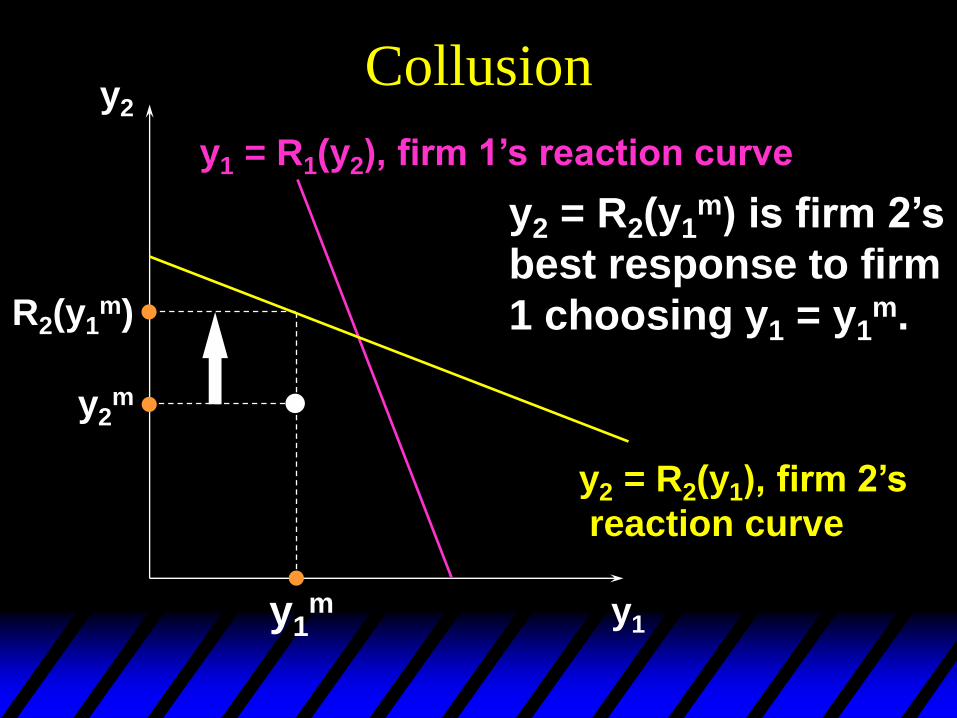
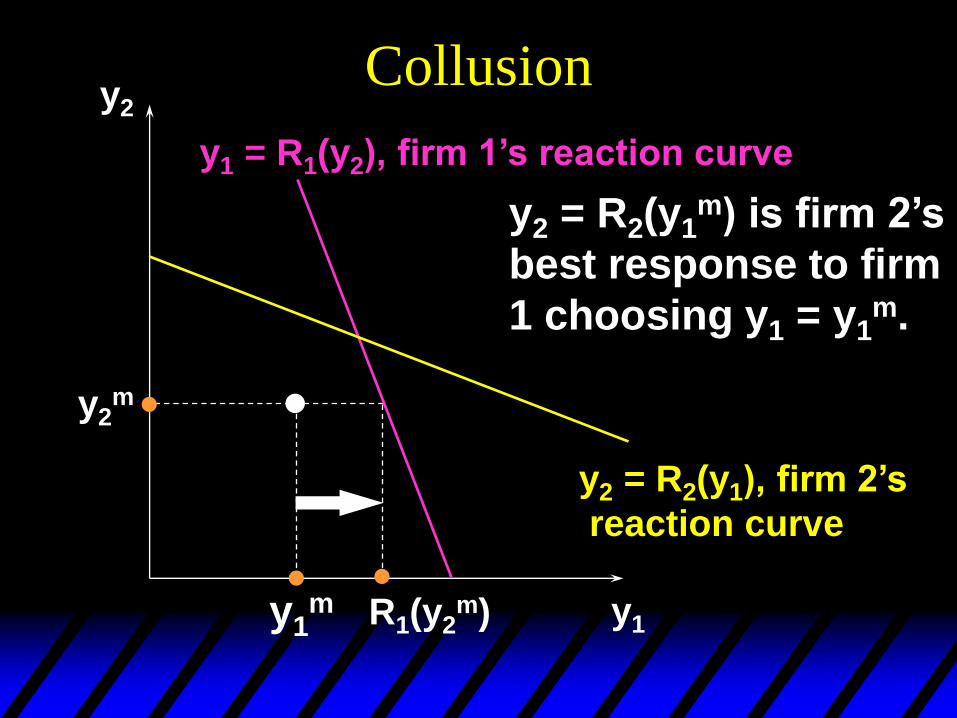
Collusion y2
y1
y2m
y1m
y2 = R2(y1m) is firm 2’s
best response to firm
1 choosing y1 = y1m. R2(y1
m)
y1 = R1(y2), firm 1’s reaction curve
y2 = R2(y1), firm 2’s
reaction curve
Collusion
Firm 2’s profit-maximizing response
to y1 = y1m is y2 = R2(y1
m) > y2m.
Firm 2’s profit increases if it cheats
on firm 1 by increasing its output
level from y2m to R2(y1
m).
Collusion
Similarly, firm 1’s profit increases if it
cheats on firm 2 by increasing its
output level from y1m to R1(y2
m).
Collusion y2
y1
y2m
y1m
y2 = R2(y1m) is firm 2’s
best response to firm
1 choosing y1 = y1m.
R1(y2m)
y1 = R1(y2), firm 1’s reaction curve
y2 = R2(y1), firm 2’s
reaction curve
Collusion
So a profit-seeking cartel in which
firms cooperatively set their output
levels is fundamentally unstable.
E.g., OPEC’s broken agreements.
Collusion
So a profit-seeking cartel in which
firms cooperatively set their output
levels is fundamentally unstable.
E.g., OPEC’s broken agreements.
But is the cartel unstable if the game
is repeated many times, instead of
being played only once? Then there
is an opportunity to punish a cheater.


