Embed Size (px)
DESCRIPTION
Chapter-8. ECON107 Principles of Microeconomics Week 10 NOVEMB ER 2013. 8. Utility and Demand. Lesson Objectives. Given a particular budget, how does a consumer decide what goods and services to buy ? Why does the typical consumer buy more of a product when its price falls ?. - PowerPoint PPT Presentation
Citation preview

ECON107Principles of
MicroeconomicsWeek 10
NOVEMBER 2013
1
Chapter-8

8 Utility and Demand

Lesson ObjectivesGiven a particular budget, how does a
consumer decide what goods and services to buy?
Why does the typical consumer buy more of a product when its price falls?
3

Issues of Discussion
Predictions of Marginal Utility Theory
Deriving the Demand Schedule and Curve.
Consumer Surplus.
4

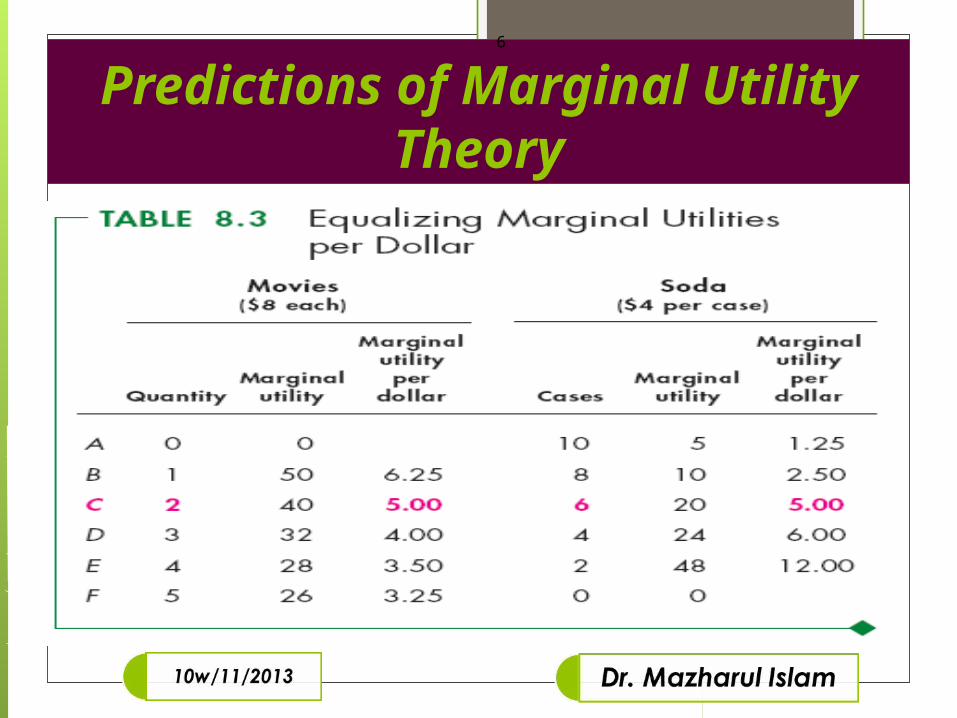
Predictions of Marginal Utility Theory
A Fall in the Price of a MovieWhen the price of a good falls the quantity demanded of that good increases—the demand curve slopes downward. For example, if the price of a movie falls, we know that MUM/PM rises, so before the consumer changes the quantities bought, MUM/PM > MUS/PS. To restore consumer equilibrium (maximum total utility) the consumer increases the movies seen to drive down the MUM and restore MUM/PM = MUS/PS.
5
Predictions of Marginal Utility Theory
6
7

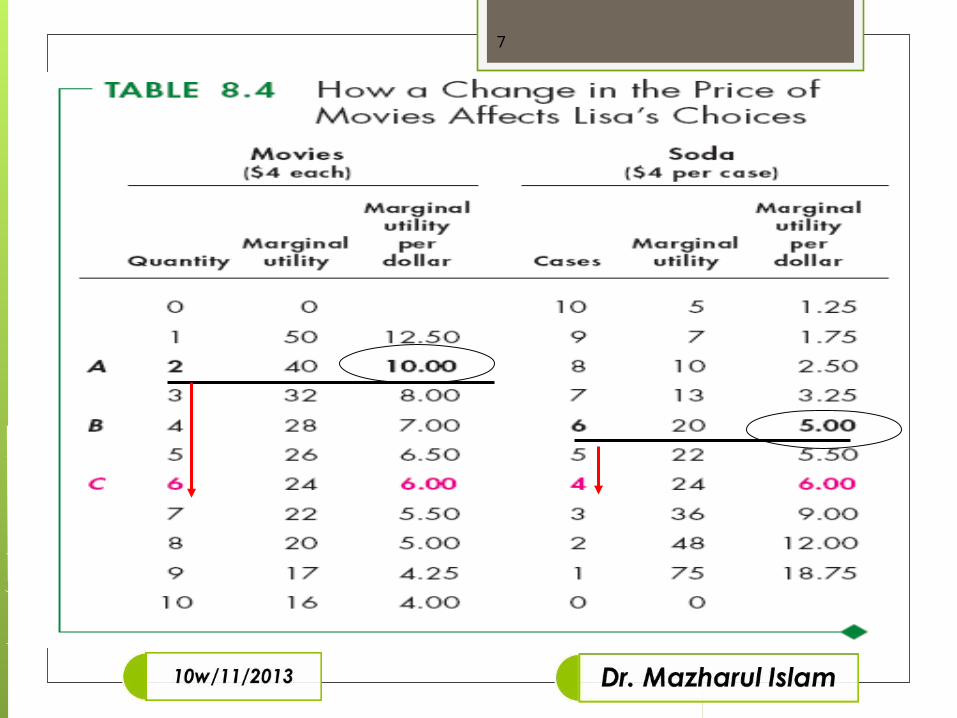
Predictions of Marginal Utility Theory
A Fall in the Price of a MovieA change in the price of one good changes the demand for another good. You’ve seen that if the price of a movie falls, MUM/PM rises, so before the consumer changes the quantities consumed, MUM/PM > MUS/PS.
To restore consumer equilibrium (maximum total utility) the consumer decreases the quantity of soda consumed to drive up the MUS and restore MUM/PM = MUS/PS.
8
Derive Demand Schedule for Movie
9
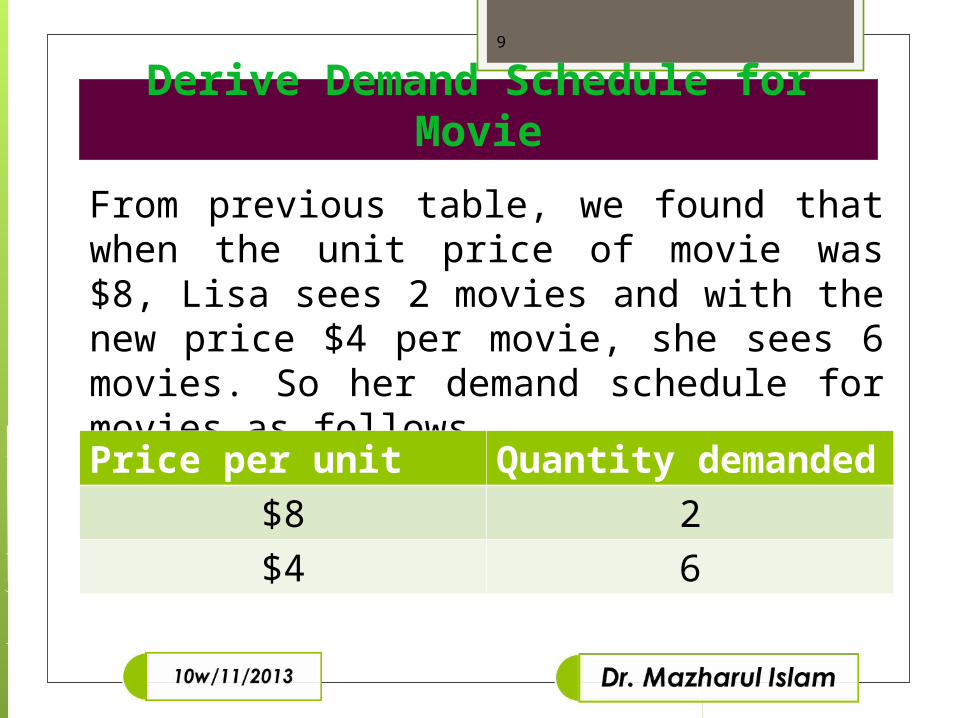
From previous table, we found that when the unit price of movie was $8, Lisa sees 2 movies and with the new price $4 per movie, she sees 6 movies. So her demand schedule for movies as follows.
Price per unit Quantity demanded
$8 2
$4 6
Derive Demand Curve for Movie
10
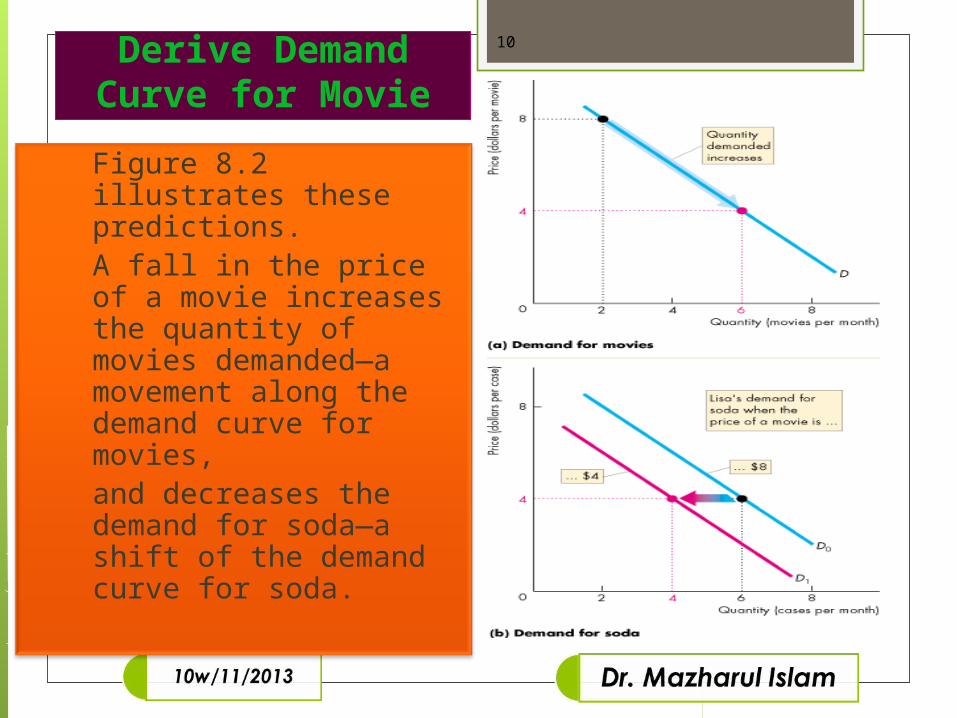
Figure 8.2 illustrates these predictions.A fall in the price of a movie increases the quantity of movies demanded—a movement along the demand curve for movies,and decreases the demand for soda—a shift of the demand curve for soda.

Predictions of Marginal Utility Theory
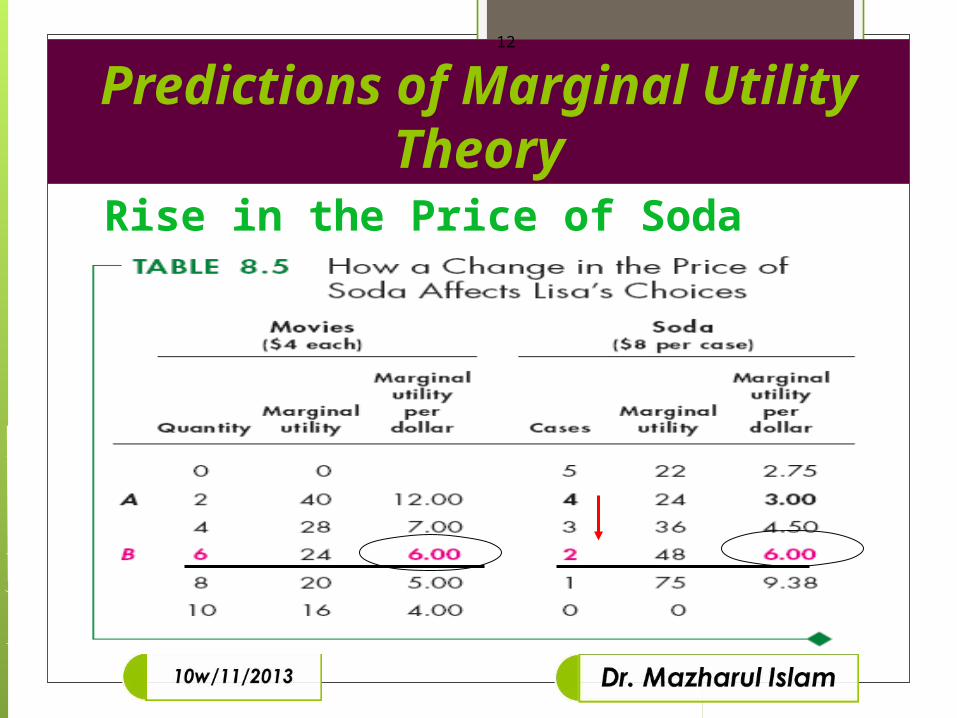
Rise in the Price of SodaNow suppose the price of soda rises.We know that MUS/PS falls, so before the consumer changes the quantities bought, MUS/PS < MUM/PM. To restore consumer equilibrium (maximum total utility) the consumer decreases the quantity of soda consumed to drive up the MUS and increases the quantity of movies seen to drive down MUM.
These changes restore MUM/PM = MUS/PS.
11
Predictions of Marginal Utility Theory
Rise in the Price of Soda
12
Derive Demand Schedule for Soda
13
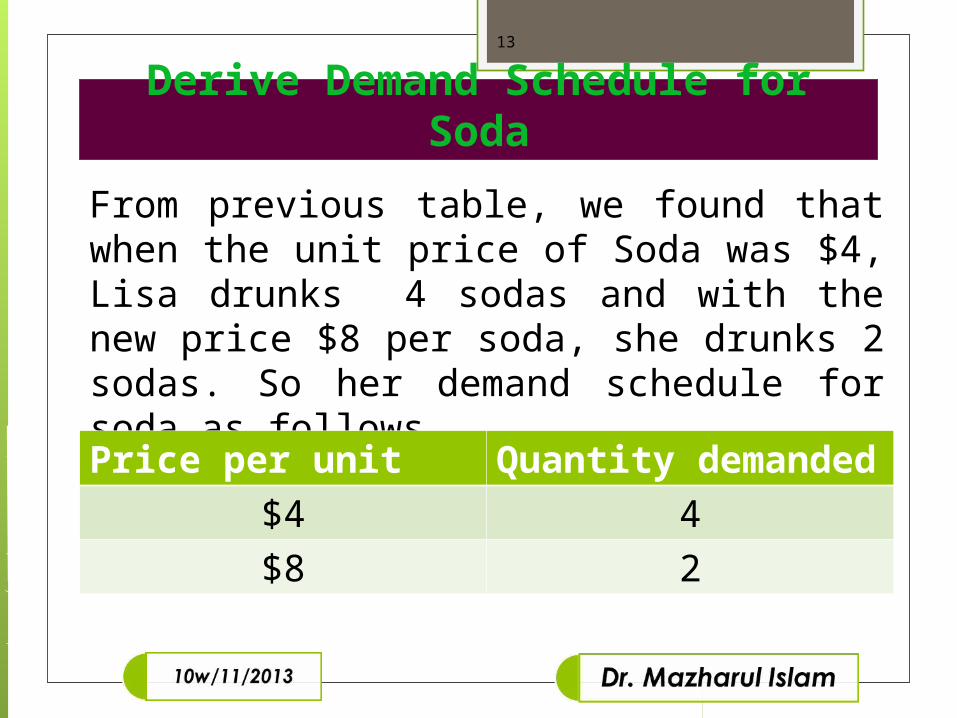
From previous table, we found that when the unit price of Soda was $4, Lisa drunks 4 sodas and with the new price $8 per soda, she drunks 2 sodas. So her demand schedule for soda as follows.
Price per unit Quantity demanded
$4 4
$8 2
Derive Demand Curve for Soda
14
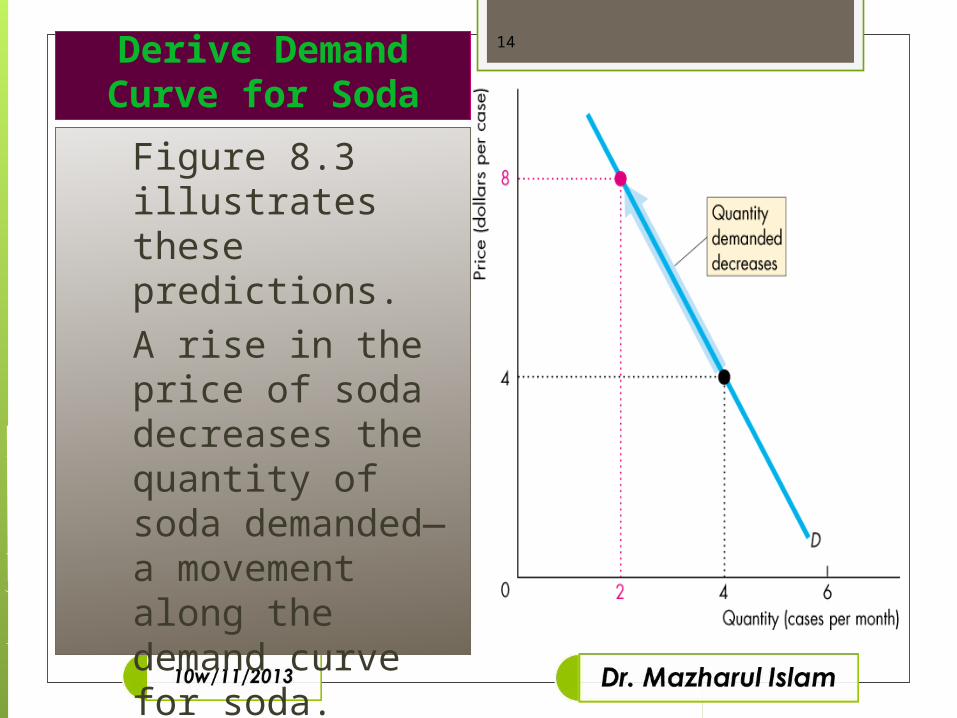
Figure 8.3 illustrates these predictions.A rise in the price of soda decreases the quantity of soda demanded—a movement along the demand curve for soda.

Predictions of Marginal Utility Theory
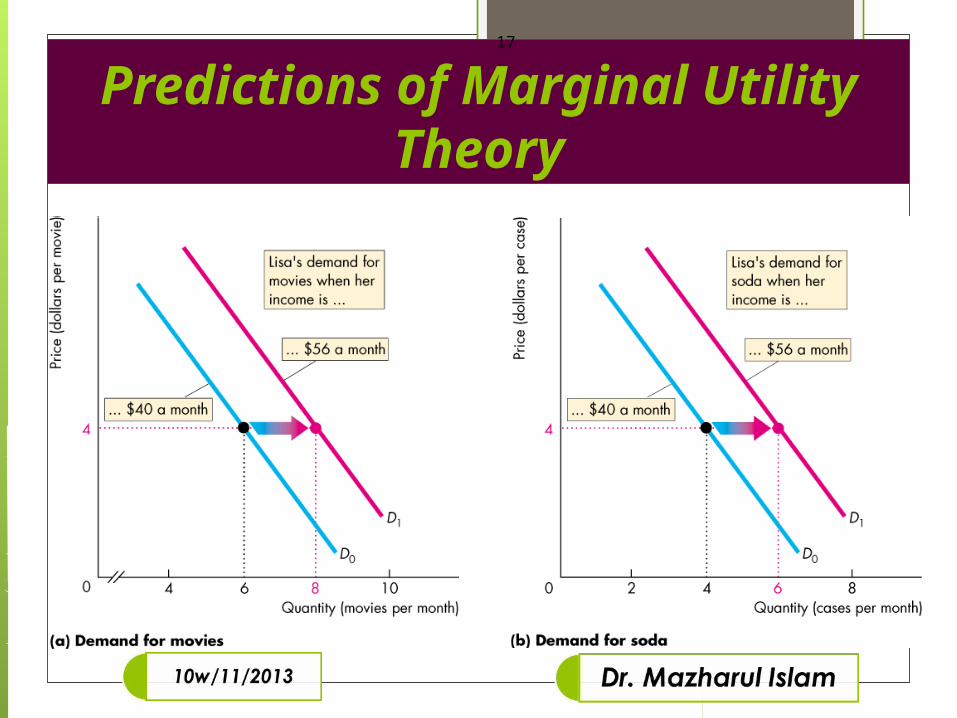
A Rise in IncomeWhen income increases, the demand for a normal good increases.
Given the prices of movies and soda, when Lisa’s income increases from $40 a month to $56 a month, she buys more movies and more soda.
Movies and soda are normal goods.Table 8.6 shows these predictions.
15

Predictions of Marginal Utility Theory
A Rise in Income
16
Table 8.6 shows Lisa’s affordable combinations when she has $56 to spend.With $40 to spend, Lisa sees 6 movies and drinks 4 cases of soda a month.With $56 to spend, Lisa spends the extra $16.She sees 8 movies and drinks 6 cases of soda a month.
Predictions of Marginal Utility Theory
17
Consumer SurplusThe difference between the maximum amount that a consumer is willing to pay for a given quantity of a good and what the consumer actually pays.
Example: You went into a store and find a sweater that you like. The price tag on it is $50. You don't notice another sign saying that there's a sale on these items and that the discount is 40%. You decide you value the sweater $50 and so you went to the sales clerk to buy it. When she tells you that there's a 40% discount. So you pay $30. You get at least $20 in consumer surplus.
18
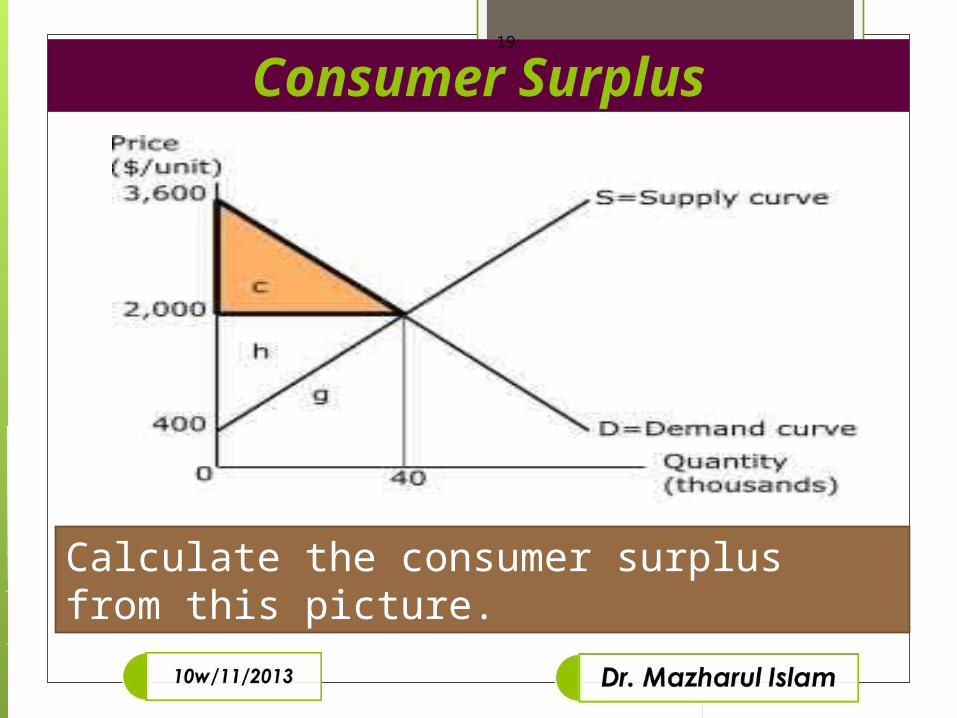
Consumer Surplus19
Calculate the consumer surplus from this picture.

Now it’s over for today. Do Now it’s over for today. Do you have any question? you have any question?
20