Embed Size (px)
Citation preview

1
Running head: Tree growth across altitude and species 1
2
Intra- and inter-specific tree growth across a long altitudinal gradient in the Peruvian 3
Andes 4
5
Joshua M. Rapp1,2,*, Miles R. Silman1, James S. Clark3, Cecile A. J. Girardin4, Darcy Galiano5, 6
Richard Tito5 7
8
9
1: Department of Biology, Wake Forest University, Winston-Salem, NC 27106 USA 10
2: Present address: Harvard Forest, Harvard University, Petersham, MA 01366 USA 11
3:Department of Biology and Nicholas School of the Environment, Duke University, Durham, 12
NC 27708 USA 13
4: Environmental Change Institute, School of Geography and the Environment, Oxford 14
University, South Parks Road, Oxford, OX1 3QY, England, UK 15
5: Universidad Nacional de San Antonio Abad del Cusco, Perú 16
*To whom correspondence should be addressed. Email: [email protected] 17

2
Abstract 18
Tree growth response across environmental gradients is fundamental to understanding species 19
distributional ecology, forest ecosystem ecology, and to predict future ecosystem services. Cross-20
sectional patterns of ecosystem properties with respect to climatic gradients are often used to 21
predict ecosystem responses to global change. Across sites in the tropics, primary productivity 22
increases with temperature, suggesting that forest ecosystems will become more productive as 23
temperature rises. However, this trend is confounded with a shift in species composition, and so 24
may not reflect the response of in situ forests to warming. In this study, we simultaneously 25
studied tree diameter growth across the altitudinal ranges of species within a single genus across 26
a geographically compact temperature gradient, to separate the direct effect of temperature on 27
tree growth from that of species compositional turn-over. Using a Bayesian state space modeling 28
framework we combined data from repeated diameter censuses and dendrometer measurements 29
from across a ~1700 meter altitudinal gradient collected over six years on over 2400 trees in 30
Weinmannia, a dominant and widespread genus of cloud forest trees in the Andes. Within 31
species, growth showed no consistent trend with altitude, but higher elevation species had lower 32
growth rates than lower elevation species, suggesting that species turn-over is largely responsible 33
for the positive correlation between productivity and temperature in tropical forests. Our results 34
may indicate a significant difference in how low- and high-latitude forests will respond to 35
climate change, since temperate and boreal tree species are consistently observed to have a 36
positive relationship between growth and temperature. If our results hold for other tropical 37
species, a positive response in ecosystem productivity to increasing temperatures in the Andes 38
will depend on the altitudinal migration of tree species. The rapid pace of climate change, and 39
slow observed rates of migration, suggest a slow, or even initially negative response of 40
3
ecosystem productivity to warming. Finally, this study shows how the observed scale of 41
biological organization can affect conclusions drawn from studies of ecological phenomena 42
across environmental gradients, and calls into question the common practice in tropical ecology 43
of lumping species at higher taxonomic levels. 44
Keywords: tropical montane cloud forest, Weinmannia, climate change, temperature gradient, 45
tree diameter growth, Andes, altitudinal gradient, species migration 46
Introduction 47
Tropical forests contain ~25% of the carbon in the terrestrial biosphere, and account for ~33% of 48
global terrestrial net primary productivity (Bonan 2008). Understanding the response of tree 49
diameter growth to temperature is important for predicting forest carbon dynamics under climate 50
change, but studies examining recent trends in tree growth in the tropics have yielded conflicting 51
results (e.g. Phillips et al. 1998, Clark et al. 2003, Baker et al. 2004, Feeley et al. 2007, Chave et 52
al. 2008, Lewis et al. 2009, Clark et al. 2010a). While there are multiple interacting factors that 53
determine tree growth and forest productivity, temperature has a strong influence on tree growth 54
(Clark et al. 2010a), and has been increasing at a rate of 0.26ºC/decade in the tropics since the 55
1960's (Malhi and Wright 2004). As warming is expected to accelerate (Christensen 2007, 56
Urrutia and Vuille 2009), understanding the response of tree growth to temperature will aid in 57
predicting whether tropical forests will be sources or sinks of carbon in the future. In this study 58
of productivity along a tropical altitudinal gradient we examine patterns of tree growth rate at 59
species and genus levels across a mean annual temperature gradient of ~9 ºC in the Peruvian 60
Andes. By examining growth both within and among species in the genus Weinmannia across 61
the altitudinal gradient, we separate the general physiological response of growth to temperature 62
within species from the effect of species compositional change across the gradient. 63
4
Globally, forest ecosystem productivity increases from the poles to the equator (Field et al. 1998, 64
Friend 2010), paralleling an increase in temperature. Across sites and along altitudinal gradients 65
in the tropics, ecosystem productivity also increases with temperature (Kitayama and Mueller-66
Dombois 1994, Delaney et al. 1997, Kitayama and Aiba 2002, Leuschner et al. 2007, Girardin et 67
al. 2010). While we are aware of no published studies of growth rates for individual tree species 68
across temperature gradients in the tropics, studies at higher latitudes show a similar increase in 69
growth rate within species with temperature across latitudinal and altitudinal gradients (Coomes 70
and Allen 2007, Purves 2009). In contrast, studies from the tropics reporting declines in growth 71
during warm years (Clark et al. 2003, Feeley et al. 2007, Clark et al. 2010a), suggest that for 72
tropical trees the temperature-dependence of growth for individuals can be very different than 73
the ecosystem trend taken as a cross section along an environmental gradient (Fig. 1). Clearly it 74
is important to have a better understanding of the temperature dependence of growth across 75
levels of biological organization, to effectively scale from individuals to ecosystems. 76
Temperature is likely to affect productivity both directly and indirectly. Direct metabolic effects 77
have been invoked as a driver for increasing productivity for both individuals and ecosystems, 78
based on kinetic effects of temperature on photosynthetic and respiratory rates (Brown et al. 79
2004, Allen et al. 2005). Laboratory measurements of photosynthetic carbon assimilation 80
generally show a broad range of increasing assimilation followed by an optimum and then a 81
steep decline as temperature increases (Leuning 2002, Medlyn et al. 2002). Trees may rarely 82
experience conditions near the edges of their metabolic limits (Berry and Bjorkman 1980, 83
Farquhar et al. 1980, Hikosaka et al. 2006), leading to most individuals experiencing increased 84
growth with temperature, particularly in temperate systems. Observations show that the 85
maximum growth rate of many temperate and boreal tree species is near their warm range 86
5
boundaries (Coomes and Allen 2007, Purves 2009), and they often grow successfully when 87
planted in warmer areas outside their native ranges (Bonan and Sirois 1992, Vetaas 2002). In 88
contrast, a negative growth-temperature relationship seen at some sites in the lowland tropics has 89
been cited as evidence that night time respiratory carbon losses have left those trees are near their 90
upper metabolic limits (Clark et al. 2003, Clark et al. 2010a). 91
Indirect effects of environmental temperature regime on ecosystem productivity could occur 92
through growing season length or biotic interactions, which influence growth rates of individuals 93
and are correlated with mean annual temperature. Changes in species composition across 94
temperature gradients could also cause changes in ecosystem productivity if species are 95
distributed across the gradient in relation to their fundamental growth rates. This is likely to 96
occur if there are genetically based trade-offs between growth and persistence such that high 97
growth in warmer conditions is limited by persistence in colder conditions. 98
Maximum measured assimilation rates are not higher in the tropics than in the temperate zone, so 99
higher annual productivity in the tropics is likely the result of a longer growing season (Huston 100
and Wolverton 2009, Malhi 2012). Likewise, increased growing season length has been 101
proposed as a contributing mechanism for increasing growth in northern high latitude forests 102
during the 20th century (Myneni et al. 1997, McMahon et al. 2010). However, within the tropics 103
growing season is most commonly determined by moisture (Borchert 1999, Worbes 1999, 104
Schongart et al. 2002, Singh and Kushwaha 2005) or radiation seasonality (Rapp 2010) instead 105
of temperature. Since the effect of temperature on growing season length in the tropics is 106
minimal, we will not consider it further here. 107
6
Biotic interactions have long been thought to be more intense in the tropics (Dobzhansky 1950, 108
MacArthur 1972), and a recent review supports this view (Schemske et al. 2009). Temperature 109
could be responsible for this gradient by increasing encounter rates of organisms at higher 110
temperatures (Moya-Larano 2010), but other mechanisms not involving temperature per se have 111
also been proposed, such as the greater diversity and more stable climate of the tropics 112
(Schemske et al. 2009). Across altitudinal gradients there is evidence that negative interactions 113
(i.e. herbivory, seed predation, competition) are more intense at lower altitudes (Coomes and 114
Allen 2007, Hillyer and Silman 2010), while facilitation increases with altitude (Callaway et al. 115
2002). Studies of fossil leaf assemblages provide evidence for herbivory increasing with 116
temperature independent of altitude or latitude (Wilf and Labandeira 1999, Wilf et al. 2001). 117
These biotic interactions have the potential to affect the growth rates of individuals, but may also 118
interact with species physiology to create the widely observed trade-off between growth and 119
persistence in trees (reviewed in Stephenson et al. 2011). One such trade-off is that between 120
growth rate and freezing tolerance, mediated by the biotic interaction of competition. North 121
American trees exhibit a growth – cold tolerance trade-off where faster growing trees have lower 122
tolerance to freezing temperatures, so that species (and ecotypes within species) with higher 123
growth rates, and hence a competitive advantage, have more southerly distributions, and species 124
with higher cold-tolerance (and lower growth) have more northerly distributions (Loehle 1998). 125
This is true even though there may be several niche axes along which individual species vary 126
such that both fast and slow growing tree species exist within a given community. For example, 127
species within a clade of live oaks (Quercus series Virentes) sort out along a latitudinal gradient 128
as predicted by their freezing tolerances and seedling growth rates (Koehler et al. 2012), while 129
these same species exist in communities with both faster and slower growing species. While 130
7
freezing tolerance per se is unlikely to be important in the tropics except near tree line, trade-offs 131
between growth in favorable environments and persistence in stressful environments are 132
commonly observed (Stephenson et al. 2011). 133
In summary, the three broad possibilities for the observed positive relationship between 134
ecosystem productivity and temperature (Raich et al. 2006) are a general physiological response 135
of tree growth to temperature, with increasing growth in all species, biotic interactions affecting 136
growth in ways either consistent or not with the physiological effect of temperature, and changes 137
in species composition along temperature gradients, with faster growing species found at warmer 138
sites. The distinction between the pathways is important because of implications for forest 139
response to climate change. If growth within individual species shows a positive relationship to 140
temperature, forests are likely to respond quickly, with an increase in net primary productivity 141
(NPP). If compositional change is driving the positive relationship between temperature and 142
NPP, forest productivity may respond more slowly, as warmer-niche tree species will need to 143
migrate to an area and displace existing individuals before forests show a positive growth 144
response. 145
Here we test whether the pattern of increasing stem growth with temperature in the wet tropics is 146
due to consistent positive responses of individual species to temperature, or whether the trend is 147
largely due to a change in species composition. We used a ~1700 meter altitudinal gradient at a 148
single locale in the Peruvian Andes to study tree growth response to temperature within and 149
between species in the cloud forest tree genus Weinmannia. Our study system allowed us to test 150
the effect of temperature independent of those of precipitation and growing season length as 151
precipitation is high across the entire gradient (rainfall > PET in all months), and growth 152
phenology is similar among altitudes (Rapp 2010). Comparing growth of species within a single 153
8
genus that differ in altitudinal range made it more likely that differences in growth rates between 154
the species were due to different temperature responses rather than other, phylogeneticly 155
confounded traits (Harvey and Pagel 1991). We are aware of no other study in which the 156
relationship between temperature and tree growth has been examined both within and across 157
species in a single study in tropical forest. In doing so, this study improves our understanding of 158
the potential effects of warming on tropical forest productivity. 159
Methods 160
Study site 161
Data on tree growth were collected along a ~1700 meter altitudinal gradient in the Kosñipata 162
Valley (-13º 6’ 18’’ latitude, -71º 35’ 21” longitude), in and adjacent to Manu National Park, on 163
the eastern slope of the Andes in southern Peru. Data came from ten 1 ha permanent tree plots 164
located every ~250 m in elevation from 1750 m to 3400 m (Table A1), established by the Andes 165
Biodiversity and Ecosystem Research Group (ABERG) in 2003. Eight of the plots are on a 166
single, 8 km long ridge that descends from 3700 m to 1700 m, forming the northern margin of 167
the Kosñipata Valley. The other two plots are <10 km from the main ridge, with the plot at 1750 168
m on a second ridge also along the northern margin of the valley, and the plot at 3025 m on an 169
east facing slope in the southern part of the valley. The substrate of most plots is Ordivician shale 170
and slate, while all or parts of two plots are on Permian granite (Table A1). A cool and wet 171
climate at the study site supports tropical montane cloud forest (TMCF), and temperature 172
decreases with altitude at a measured lapse rate of 5.2ºC km-1 (Rapp 2010). Both aboveground 173
and belowground net primary productivity decrease approximately 4-fold between lowland (200 174
m) and high altitude (3000 m) sites (Girardin et al. 2010), and the wood decomposition rate also 175
decreases with altitude (Meier et al. 2010). A shift in carbon allocation in trees from above- to 176
9
below-ground contributes to decreasing above-ground biomass and increasing below-ground 177
carbon stocks with altitude (Zimmermann et al. 2009, Girardin et al. 2010). Weinmannia is the 178
dominant genus in these plots, accounting for 16% of woody stems ≥ 10 cm DBH (0.3 – 43.5% 179
of stems per plot). Other common genera include Clusia (13%) and Miconia (8%). 180
Study species 181
The genus Weinmannia contains ~150 species of cloud forest trees and shrubs, is widespread 182
throughout the tropics, and has a center of diversity in the tropical Andes (Bradford 1998). In 183
general, the environmental niche is conserved across neotropical members of the genus, which 184
form a monophyletic group (Bradford 1998, 2002). In our study area 17 species of Weinmannia 185
were found between 950 m to 3800 m in elevation, and they are dominant in the tree community 186
above 2000 meters. The nine most abundant species were included in this analysis (Table 1). 187
Data collection 188
Tree diameter growth data were derived from repeated diameter measurements on all trees 189
greater than 1 cm diameter at breast height (DBH) in one hectare permanent tree plots, and 190
yearly diameter increments derived from dendrometer measurements on a subset of the same 191
trees. Individuals greater than 10 cm DBH were first censused in 2003 (2005 for the plot at 1750 192
m), individuals 1-10 cm DBH were first censused in 2006, and all individuals were censused 193
yearly from 2007 to 2009, with a total of 2478 stems included in this analysis (Table 1). At each 194
census, DBH was measured (point of measurement marked by paint and/or located a fixed 195
distance below a tag nailed to the tree), height (in meters) was estimated, and canopy status was 196
scored. Canopy status was scored on a three level scale (1 = understory; 2 = mid-canopy with 197
some direct light on crown; 3 = canopy or emergent tree with greater than 90% direct sunlight on 198
10
top of crown), modified from Clark and Clark (1992). When multiple estimates (range: 1 - 7 per 199
stem) for canopy status was available, the median value was used in the analysis. 200
Band dendrometers were installed in October 2003 and January 2007, for a total of 441 201
individual stems (Table 1). The bands installed in 2003 were on stems randomly selected across 202
all species (100 dendrometers per plot; see Girardin et al. (2010) and Rapp (2010)). In 2007 203
additional bands were installed on up to 50 randomly selected Weinmannia stems per plot. Stems 204
with deformities that would prevent accurate increment readings (split stems, cavities, etc.) were 205
avoided. After each installation, bands were allowed to settle on the stem, and the first (baseline) 206
measurement was made 5-8 months after installation. Dendrometers were measured in June 207
2004, July 2006 and three times a year between June 2007 and August 2009. Diameter growth 208
for each measurement interval was calculated as di = Ci/π, where di is the diameter growth for the 209
interval and Ci is the measured circumferential growth from dendrometer bands. Growth of all 210
measurement intervals within a study year was summed to calculate annual diameter increment. 211
For growth intervals that overlapped study years, growth within the study year was pro-rated by 212
the number of days of that interval contained within that year. A study year was defined as 213
beginning on July 16th, and ending on July 15th of the next calendar year, and labeled as the first 214
calendar year. We define it this way for three reasons: to correspond to the diameter censuses, 215
which were typically done June-August of each year; to make the greatest use of the 216
dendrometer data; and because the dry season (June-August) is a period of relatively low tree 217
growth (Rapp 2010), so that defining a year in this way is comparable to north temperate zone 218
studies where the growing season is within one calendar year. 219
Analysis 220

11
Our sampling scheme provided us with two types of data typically used in analysis of tree 221
growth: diameter data from repeated censuses using measuring tapes and diameter increments 222
based on high-precision dendrometers, each which have strengths and weaknesses. The diameter 223
censuses provided good coverage of individuals since we measured every stem greater than 1 cm 224
DBH, but trees were not measured every year. Also, because cloud forest trees grow slowly and 225
often have irregular trunks, measurement errors were relatively large compared with diameter 226
growth rates. Dendrometers provided much more accurate measurements and were measured 227
frequently to provide sub-yearly measurements on growth. However, dendrometer data were 228
available on fewer stems since accurate measurements are only obtained on trees with fairly 229
round, damage-free stems greater than 10 cm DBH, and dendrometers are expensive in terms of 230
materials and installation effort. 231
To make use of both datasets while accounting for the unrealistic negative growth estimates from 232
census data (see Appendix B for a discussion of comparing data from these two sources), we 233
used a Bayesian state space modeling approach that uses both DBH and dendrometer increments, 234
and constrains growth rates to be positive using informative priors. The Bayesian model 235
combines data from several sources while accommodating their dependence structure, that 236
between different types of observations, between and among individuals, and over years. The 237
Bayesian state space model used here was presented in Clark et al. (2007) and extended in Clark 238
et al. (2010b). Here we give a description of only the most relevant features, including the 239
addition of covariates for altitude, canopy status, and diameter. These covariates were identified 240
as important predictors in an exploratory analysis using a generalized linear model (GLM) 241
framework with the dendrometer data alone (Appendix C). 242
12
Different information was available for each tree, because censuses began in different years for 243
different plots and sets of trees (i.e. stems > 10 cm DBH vs. stems 1-10 cm DBH), and 244
dendrometers were installed at different times on different trees. Thus, we needed to combine 245
different data sources and make a probability statement about growth in years for which data 246
were missing. The model was structured to emphasize the blending of data, and for “borrowing 247
strength” across the full dataset (Clark et al. 2007). We therefore estimated growth for each 248
individual tree and year (tree-year), and fitted confidence envelopes reflecting information about 249
how the different sources of variation affected each tree-year (Fig. D2). The model partitioned 250
the measurement error of each data source (diameter census and dendrometer data), and included 251
a term for process error, i.e., variation in growth not taken up by covariates (canopy status, 252
diameter, and altitude), and fixed year and random individual effects. While plots differ for 253
reasons other than altitude, we could not reliably estimate the variability associated with plot-to-254
plot differences independent of altitude since there was only one plot at each altitude in most 255
cases. An earlier version of the model included a random plot effect but no altitude effect, to 256
account for the possibility of climatic optima in growth. Monotonic altitudinal trends in growth 257
were seen for all species, so the final version included altitude as a covariate but no plot effect. 258
We analyzed growth separately for the nine most common species, which differed in altitudinal 259
range but taken together were widely distributed across the gradient. An altitude effect was 260
estimated only for the four species which had at least 20 stems at multiple elevations (Table 1). 261
We then analyzed the effect of species median altitude on growth rate across species by 262
combining data from all species and parameterizing the model with a random effect of species 263
and assigning the mean species altitude, instead of stem altitude, to all stems of a given species. 264
Each model was analyzed using Gibbs sampling (Gelfand and Smith 1990) implemented in R 265
13
(Version 2.11; R Development Core Team 2010). Detailed diagnostics for this Markov Chain 266
Monte Carlo model are described in Clark et al. (2010b). The model was run for 50,000 steps 267
(burn in period 10,000 steps), and visual inspection showed rapid convergence of the MCMC 268
chains (Fig. D1). R scripts are included as a supplement (Supplement 1). 269
Evaluating growth trends with altitude 270
To evaluate trends in tree growth with altitude both within and across species, we compared 271
growth among trees of a standardized size in a consistent light environment. The use of scenarios 272
enabled us to make realistic comparisons within and between species, whereas comparing mean 273
growth rates could be misleading if, as is the case here, size distribution and light environment 274
varies between plots and species (J.M. Rapp, unpublished data). We compared three scenarios: 275
1) sapling (DBH = 10 cm) in the understory (Canopy Status = 1); 2) sapling in a gap (Canopy 276
Status = 3); and 3) adult (DBH = 80th percentile for that species) canopy tree (Canopy Status = 277
3). We used the 80th percentile of DBH for each because species vary in maximum size such that 278
choosing an arbitrary DBH would not be representative of a mature tree for all species. We chose 279
10 cm DBH for saplings so that dendrometer data would inform these estimates since growth 280
estimates for trees with dendrometers were better than those without. 281
Results 282
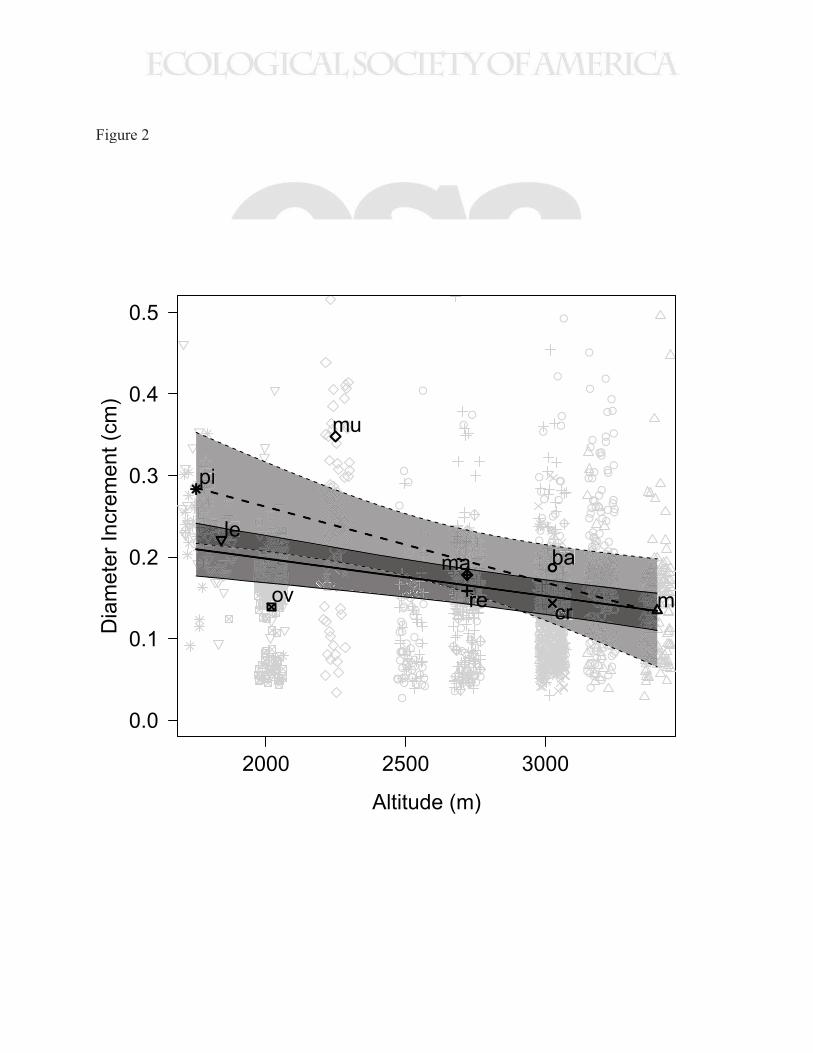
Species growing at high altitude (low mean annual temperature) grew more slowly than species 283
growing at lower altitude (high mean annual temperature) (Figs. 2 and C2), but within species 284
the growth response to altitude was species-specific. 285
Diameter growth within species 286
14
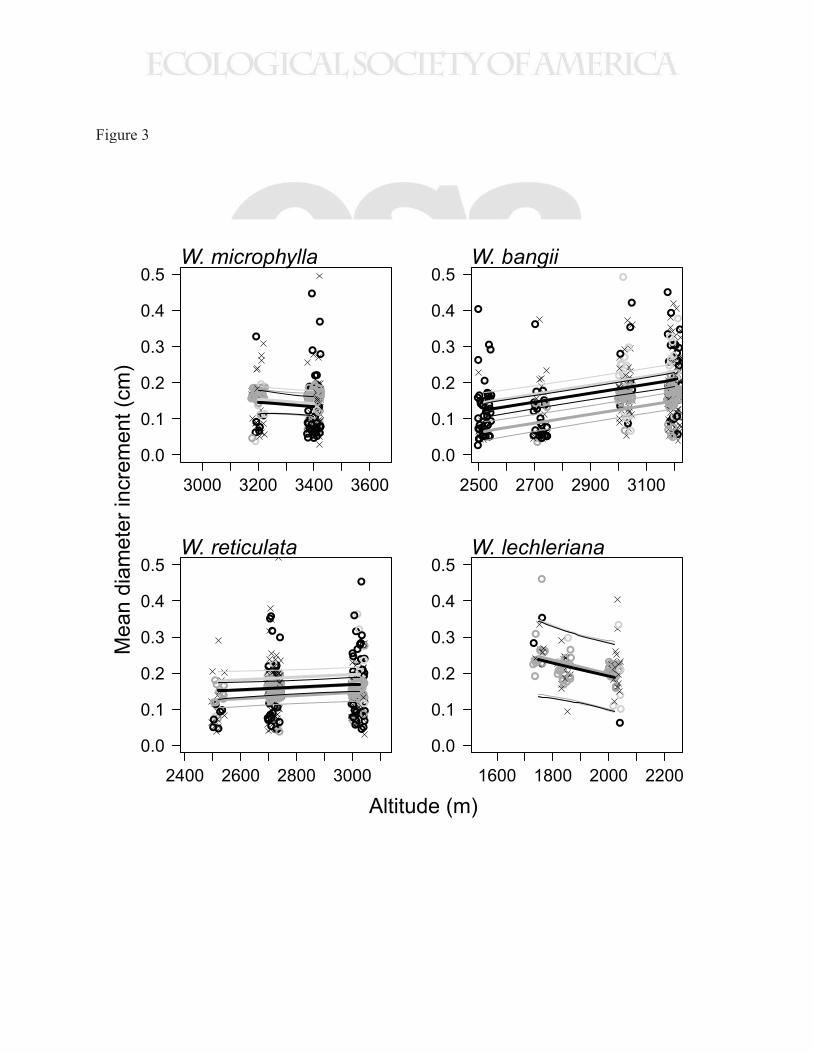
For no species was there a statistically significant positive correlation between growth and mean 287
annual temperature. Of the four species with at least 20 individuals at multiple elevations (W. 288
microphylla, W. bangii, W. reticulata, and W. lechleriana), two showed a trend of decreasing 289
growth with altitude, and two showed an increasing trend (Fig. 3). For only one of these species 290
(W. bangii), was the trend statistically significant (95% credible interval for altitude effect = 291
0.97-1.51 mm km-1; Table D3), and this trend was for higher growth at higher altitude (lower 292
temperature), the opposite of what would be predicted if a direct physiological effect of 293
temperature on growth was a dominant driver of the ecosystem pattern. 294
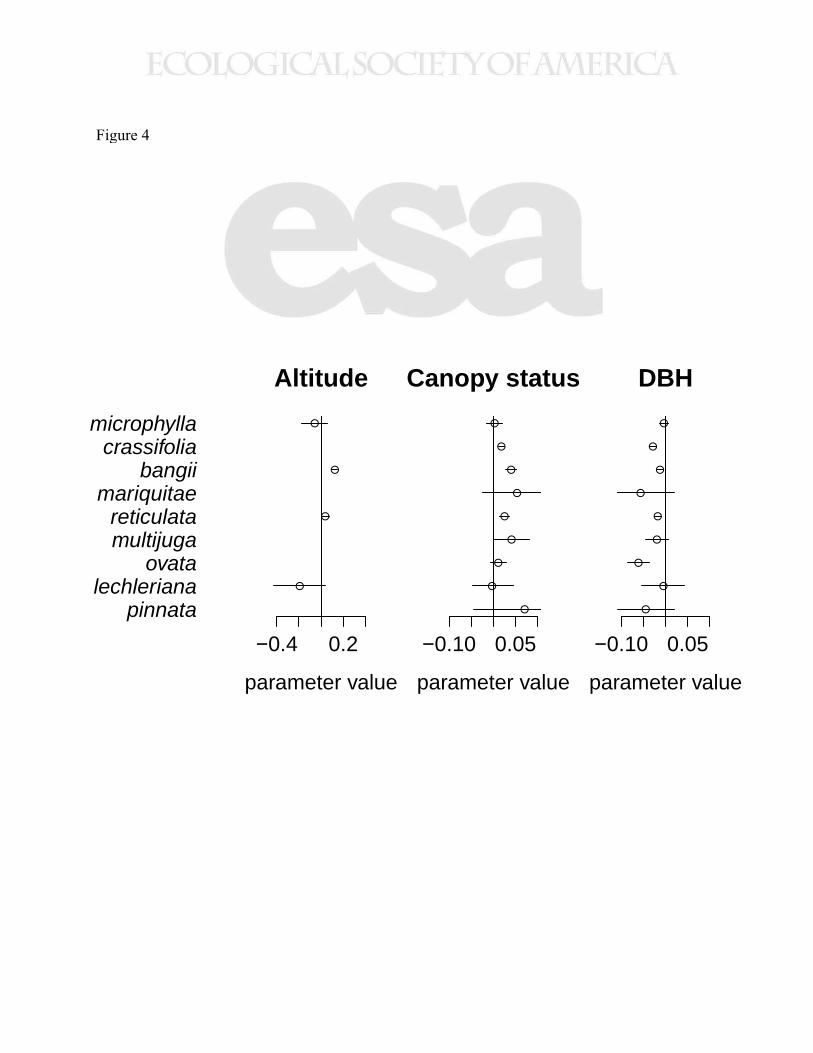
While the effect of altitude within species varied in magnitude and direction across species, 295
canopy status had a consistently positive effect, and DBH had a consistently negative effect on 296
growth within species, although the magnitude of each effect varied by species (Fig. 4, Tables 297
D1-D9). Comparing the growth trends of saplings in gaps, saplings in the understory, and canopy 298
trees showed that growth in W. bangii and W. reticulata responded strongly to light environment 299
and diameter, while in W. lechleriana and W. microphylla growth was relatively insensitive to 300
these variables (Fig. 3). 301
Altitudinal trends across species 302
Lower altitude species grew faster, with the effect robust to the method of analysis and the 303
species included. Including all Weinmannia species, the effect of species median altitude was -304
0.195 mm km-1 (95% CI = -0.363 to -0.0275 mm km-1). One of the species, W. ovata often 305
exhibits a shrub-like growth form distinct from the other species included in this analysis, and its 306
low growth rate may be related to this uncommon life form rather than its altitudinal niche. 307
Excluding W. ovata from the analysis resulted in a stronger effect of species median altitude of -308
0.459 mm km-1 (95% CI = -0.67 to – 0.251 mm km-1; Fig. 2, Table D10). This study, like most 309
15
tree growth studies, sampled trees in plots – on a per area basis. Since tree diversity declines with 310
altitude, more individuals per species were sampled with increasing altitude, so higher altitude 311
species had a greater influence on the across species analysis. We therefore also calculated the 312
regression through the predicted growth of adult canopy trees growing at the median altitude of 313
each species (excluding W. ovata), which predicted a stronger trend of -0.929 mm km-1 (r2 = 314
0.47, p = 0.0358; Fig. 2). While this regression provides a useful bound on the effect of altitude 315
across species, inference is limited because it assumes growth rate is predicted perfectly for each 316
species, and does not account for important variability either in growth within species or in the 317
sample size used to make each estimate. 318
Model output and parameter estimates 319
The Bayesian state space model also estimated variability associated with fixed year effects, 320
measurement error, random individual effects, and process error (variability not associated with 321
other parameters). For all species, diameter measurement error and individual effects were larger 322
than “process” error and increment measurement error (Fig. D3, Tables D1-D9). While there was 323
a trend toward higher growth in the last three years of the study there was very little year-to-year 324
variation in growth rates (Fig. D4, Tables D1-D9). 325
Discussion 326
This study illustrates how biotic responses to an environmental gradient can change across scales 327
of biological organization. The growth response to altitude of individual species differed from 328
that seen at the genus level, supporting the hypothesis that species compositional change is 329
largely responsible for the positive relationship between ecosystem productivity (NPP) and 330
temperature observed in the tropics and at the study site (Raich et al. 2006, Girardin et al. 2010). 331
Diameter growth response to the temperature gradient was species-specific, with one species 332
16
showing a negative response of growth to temperature, while the growth responses of three other 333
species were not statistically different from zero (Fig 1b, Fig. 3). At the genus-level growth was 334
positively correlated with temperature (Fig 2). Our results imply that temperature acts indirectly 335
to cause the observed altitudinal gradient in ecosystem productivity, by determining the 336
altitudinal niche and mean growth rates of individual species, while species compositional 337
change drives increasing ecosystem productivity with temperature (Fig 1b and 1c, path b). 338
Altitudinal growth trends within species 339
A direct metabolic effect of temperature on growth is inconsistent with the constant or declining 340
growth with altitude observed for the four Weinmannia species examined. It appears likely that 341
another factor in the biotic or abiotic environment has a stronger effect than the metabolic effect 342
of temperature on growth. One alternative explanation is that genetic variation across the 343
altitudinal gradient causes the observed pattern, since genetic variation associated with climatic 344
variation across species ranges is commonly observed (Eckert et al. 2010, Sork et al. 2010). 345
However, this seems unlikely since the entire altitudinal ranges of these Weinmannia species are 346
contained within a few kilometers, and good dispersal potential of the small (~0.0001 g) wind-347
dispersed seeds should lead to genetically well mixed populations, although we have no data to 348
confirm this. 349
An abiotic cause for the constant or increasing growth within species with altitude seems 350
unlikely in this system as well. While in many mountain systems drought is common at lower 351
altitudes and constrains growth (e.g. Jump et al. 2006), in our study system rainfall is higher at 352
lower altitude and rainfall is greater than potential evapotranspiration on a monthly scale at all 353
17
elevations (Rapp 2010). Likewise, growing season length, soils, and topography are all relatively 354
consistent across the study site. 355
Biotic interactions are more likely to have produced the within species altitudinal patterns of 356
growth observed here. Competition for light is asymmetric and dependent on the height of the 357
tree canopy (Weiner 1990). Since canopy height declines with altitude in our system (Girardin et 358
al. 2010), we expect that lower light competition could lead to greater growth at higher altitude. 359
Other biotic interactions such as seed predation (Hillyer and Silman 2010) and herbivory (R. 360
Tito, unpublished data) also decline with altitude at the study site, and increased herbivory in 361
particular can lower growth through direct loss of photosynthate to herbivores and costs 362
associated with increased investment in plant defenses. There is no data on pathogen prevalence 363
or the effect of mycorrhizae or endophyte mutualists on growth in this system, although the 364
taxonomic composition but not the diversity of microbes living on Weinmannia leaf-surfaces 365
changes with altitude (Fierer et al. 2011). 366
Species composition and ecosystem productivity 367
If the divergent patterns seen here for growth within and between Weinmannia species across a 368
temperature gradient hold for other tropical tree taxa, the pattern of increasing NPP with 369
temperature in the wet tropics (Raich et al. 2006) may largely be due to species compositional 370
change. Understanding the effects of species composition may be particularly important when 371
projecting future patterns of ecosystem productivity based on projected climate changes. Model 372
predictions suggest a lag between climate change and species migrations (Iverson et al. 2004, 373
Morin et al. 2008), and observed tree species migration rates lag behind historical rates of 374
climate change and are slower than needed to keep pace with predicted climate change (Feeley et 375
al. 2011). Given this lag, our results suggest initial ecosystem-level productivity responses to 376
18
climate change are likely to be small, with flat or possibly decreasing productivity as temperature 377
increases if most Andean tree species respond similarly to Weinmannia. Only once species 378
migrations have equilibrated with climate will ecosystem productivity increase. This response 379
could be moderated by adaptation of growth to new climate conditions, but because trees are 380
long-lived it is unlikely that tree populations will be able to adapt fast enough to keep track with 381
rising temperatures (Kuparinen et al. 2010). Temperatures are predicted to continue to rise given 382
current projections of anthropogenic greenhouse gas emissions (Meehl 2007), so ecosystems are 383
likely to be in disequilibrium with climate for decades or longer. In addition, species migrate at 384
different rates and novel combinations of tree species (“no-analog” communities sensu Williams 385
and Jackson 2007) are likely to be common. Given the dependence of ecosystem productivity on 386
species composition, predicting the ecosystem properties of no-analog communities will be 387
difficult. 388
Differences between tropical and temperate forests 389
The results shown here differ from results for temperate areas where productivity increases with 390
temperature within species across latitudinal and altitudinal gradients (Loehle 1998, Coomes and 391
Allen 2007, Purves 2009). This inconsistency may be the result of a shift in the primary drivers 392
of tree growth rate with latitude. For instance, since biotic interactions generally increase in 393
importance towards the tropics (Schemske et al. 2009), these may mask the positive metabolic 394
effect of temperature on growth in the tropics, but not in temperate areas. However, biotic 395
interactions have the potential to have both positive and negative effects on growth, and not all 396
relevant interactions show a latitudinal trend (e.g. herbivory; Moles et al. 2011a, Moles et al. 397
2011b), so it is unclear whether this would be a general mechanism. On the other hand, a 398
temperature-dependent growing season is a common feature of higher latitudes and can have a 399
19
strong influence on tree growth (Myneni et al. 1997, McMahon et al. 2010), and we suspect that 400
the observed positive relationship between tree growth and temperature at higher latitudes may 401
be due to growing season length rather than temperature per se. This is supported by 402
observations of decreased growth and higher mortality as temperatures warm in temperate 403
systems where growing season is limited by summer drought rather than temperature (e.g. Jump 404
et al. 2006). 405
Growth rate variability among individuals 406
Altitudinal growth trends were only revealed after properly attributing errors and disaggregating 407
the overall data into meaningful scenarios for comparison because of the high growth rate 408
variability among individuals in this study (Figs. 2 and 3). High and low growth rates were 409
observed at all altitudes, with predicted variability within species often exceeding the predicted 410
change in growth rate across species for canopy adults. However, by effectively attributing 411
variation between measurement error, 'process' error, and fixed and random effects, and by using 412
scenarios to compare trees of similar life-stage and microenvironment across the gradient (e.g. 413
using conditional rather than marginal distributions; Clark et al. 2011), ecological meaning was 414
extracted from a highly variable system. For example, ignoring canopy status (positive effect on 415
growth) and diameter (negative effect on growth), would have obscured important patterns since 416
the size distribution of individuals and stand structure vary across sites (J.M. Rapp, unpublished 417
data). 418
Species versus genus in ecological analysis 419
That responses measured at the genus level are not the same as responses measured on species 420
within the genus calls into question the widespread practice in the tropical forest ecology 421
literature of lumping species together at the genus-level to measure distributional, community, 422
20
and ecosystem patterns and processes (e.g. Feeley et al. 2011). Indeed, the results from 423
Weinmannia suggest the practice could lead to qualitatively different conclusions about the 424
processes in question, whether the lumping is to increase sample sizes to calculate growth or 425
vital rates, or to deal with taxonomic uncertainty in highly diverse or poorly sampled systems. 426
We expect this to be a concern any time congeneric species sort out along an environmental 427
gradient, whether it be temperature as in this study, or soil nutrients, moisture, or rain fall 428
seasonality which are common determinants of species distributions in the lowland tropics 429
(Toledo et al. 2012). Lumping species at higher taxanomic levels may be appropriate depending 430
on the purpose and scale of the comparison. For instance, combining species in the largely 431
montane genus Weinmannia in a comparison of montane and lowland taxa could be permissible 432
if the variation in the trait measured was less within the genus than that between Weinmannia 433
and the lowland taxa. 434
Conclusions 435
In this study we showed that species differed in growth rate across their altitudinal ranges, and 436
that these differences were idiosyncratic among species, such that genus-level patterns did not 437
mimic species-level patterns. Instead, novel patterns of ecosystem productivity emerged at 438
higher levels of biological organization. These results highlight the importance of considering 439
community species composition when interpreting studies of ecosystem productivity across 440
temperature gradients in the tropics, especially when considering the response of ecosystems to 441
climate change. While this study reveals intriguing patterns, future studies are needed to 442
determine how well these results generalize to other species, and to identify the specific 443
temperature-driven trade-off(s) in the tropics hypothesized to set species growth rates. In 444
addition, differences between drivers of tree growth patterns across tropical and temperate 445
21
climate gradients should be explored to understand whether we should expect a fundamentally 446
different response to climate change between the tropics and higher latitudes. 447
Acknowledgements 448
This paper is a product of the Andes Biodiversity and Ecosystem Research Group (ABERG; 449
http:/andesconservation.org). Data included here are the result of an exceptional effort by 450
botanists and field assistants in Peru, most from the Universidad Nacional de San Antonio Abad 451
de Cusco, Peru. Special thanks go to Prof. Norma Salinas Revilla. Support came from the 452
Gordon and Betty Moore Foundation’s Andes to Amazon initiative, NSF DEB-0237684, and 453
NSF EAR-0711414. INRENA, SERNANP, and personnel of Manu National Park, Peru, 454
provided gracious assistance with logistics and permission to work in the protected area, while 455
the Amazon Conservation Association and the Cock-of-the-Rock Lodge provided logistical 456
support. We thank E.K. Faison and two anonymous reviewers for their valuable comments. 457
Literature cited 458
Allen, A. P., J. F. Gillooly, and J. H. Brown. 2005. Linking the global carbon cycle to individual 459
metabolism. Functional Ecology 19:202-213. 460
Baker, T. R., O. L. Phillips, Y. Malhi, S. Almeida, L. Arroyo, A. Di Fiore, T. Erwin, N. Higuchi, 461
T. J. Killeen, S. G. Laurance, W. F. Laurance, S. L. Lewis, A. Monteagudo, D. A. Neill, 462
P. N. Vargas, N. C. A. Pitman, J. N. M. Silva, and R. V. Martinez. 2004. Increasing 463
biomass in Amazonian forest plots. Philosophical Transactions of the Royal Society of 464
London Series B-Biological Sciences 359:353-365. 465
Berry, J. and O. Bjorkman. 1980. Photosynthetic response and adaptation to temperature in 466
higher-plants. Annual Review of Plant Physiology and Plant Molecular Biology 31:491-467
543. 468
22
Bonan, G. B. 2008. Forests and climate change: Forcings, feedbacks, and the climate benefits of 469
forests. Science 320:1444-1449. 470
Bonan, G. B. and L. Sirois. 1992. Air-Temperature, Tree Growth, and the Northern and Southern 471
Range Limits to Picea-Mariana. Journal of Vegetation Science 3:495-506. 472
Borchert, R. 1999. Climatic periodicity, phenology, and cambium activity in tropical dry forest 473
trees. Iawa Journal 20:239-247. 474
Bradford, J. C. 1998. A cladistic analysis of species groups in Weinmannia (Cunoniaceae) based 475
on morphology and inflorescence architecture. Annals of the Missouri Botanical Garden 476
85:565-593. 477
Bradford, J. C. 2002. Molecular phylogenetics and morphological evolution in Cunonieae 478
(Cunoniaceae). Annals of the Missouri Botanical Garden 89:491-503. 479
Brown, J. H., J. F. Gillooly, A. P. Allen, V. M. Savage, and G. B. West. 2004. Toward a 480
metabolic theory of ecology. Ecology 85:1771-1789. 481
Callaway, R. M., R. W. Brooker, P. Choler, Z. Kikvidze, C. J. Lortie, R. Michalet, L. Paolini, F. 482
I. Pugnaire, B. Newingham, E. T. Aschehoug, C. Armas, D. Kikodze, and B. J. Cook. 483
2002. Positive interactions among alpine plants increase with stress. Nature 417:844-848. 484
Chave, J., R. Condit, H. C. Muller-Landau, S. C. Thomas, P. S. Ashton, S. Bunyavejchewin, L. 485
L. Co, H. S. Dattaraja, S. J. Davies, S. Esufali, C. E. N. Ewango, K. J. Feeley, R. B. 486
Foster, N. Gunatilleke, S. Gunatilleke, P. Hall, T. B. Hart, C. Hernandez, S. P. Hubbell, 487
A. Itoh, S. Kiratiprayoon, J. V. LaFrankie, S. L. de Lao, J. R. Makana, M. N. S. Noor, A. 488
R. Kassim, C. Samper, R. Sukumar, H. S. Suresh, S. Tan, J. Thompson, M. D. C. 489
Tongco, R. Valencia, M. Vallejo, G. Villa, T. Yamakura, J. K. Zimmerman, and E. C. 490
23
Losos. 2008. Assessing evidence for a pervasive alteration in tropical tree communities. 491
Plos Biology 6:455-462. 492
Christensen, J. H., B. Hewitson, A. Busuioc, A. Chen, X. Gao, I. Held, R. Jones, R.K. Kolli, W.-493
T. Kwon, R. Laprise, V. Magaña Rueda, L. Mearns, C.G. Menéndez, J. Räisänen, A. 494
Rinke, A. Sarr and P. Whetton. 2007. Regional Climate Projections.in S. Solomon, D. 495
Qin, M. Manning, Z. Chen, M. Marquis, K.B. Averyt, M. Tignor and H.L. Miller, editor. 496
Climate Change 2007: The Physical Science Basis. Contribution of Working Group I to 497
the Fourth Assessment Report of the Intergovernmental Panel on Climate Change. 498
Cambridge University Press, Cambridge, United Kingdom and New York, NY, USA. 499
Clark, D. A. and D. B. Clark. 1992. Life-History Diversity of Canopy and Emergent Trees in a 500
Neotropical Rain-Forest. Ecological Monographs 62:315-344. 501
Clark, D. A., S. C. Piper, C. D. Keeling, and D. B. Clark. 2003. Tropical rain forest tree growth 502
and atmospheric carbon dynamics linked to interannual temperature variation during 503
1984-2000. Proceedings of the National Academy of Sciences of the United States of 504
America 100:5852-5857. 505
Clark, D. B., D. A. Clark, and S. F. Oberbauer. 2010a. Annual wood production in a tropical rain 506
forest in NE Costa Rica linked to climatic variation but not to increasing CO2. Global 507
Change Biology 16:747-759. 508
Clark, J. S., D. Bell, C. J. Chu, B. Courbaud, M. Dietze, M. Hersh, J. HilleRisLambers, I. Ibanez, 509
S. LaDeau, S. McMahon, J. Metcalf, J. Mohan, E. Moran, L. Pangle, S. Pearson, C. Salk, 510
Z. H. Shen, D. Valle, and P. Wyckoff. 2010b. High-dimensional coexistence based on 511
individual variation: a synthesis of evidence. Ecological Monographs 80:569-608. 512
24
Clark, J. S., D. M. Bell, M. H. Hersh, and L. Nichols. 2011. Climate change vulnerability of 513
forest biodiversity: climate and competition tracking of demographic rates. Global 514
Change Biology 17:1834-1849. 515
Clark, J. S., M. Wolosin, M. Dietze, I. Ibanez, S. LaDeau, M. Welsh, and B. Kloeppel. 2007. 516
Tree growth inference and prediction from diameter censuses and ring widths. Ecological 517
Applications 17:1942-1953. 518
Coomes, D. A. and R. B. Allen. 2007. Effects of size, competition and altitude on tree growth. 519
Journal of Ecology 95:1084-1097. 520
Delaney, M., S. Brown, A. E. Lugo, A. TorresLezama, and N. B. Quintero. 1997. The 521
distribution of organic carbon in major components of forests located in five life zones of 522
Venezuela. Journal of Tropical Ecology 13:697-708. 523
Dobzhansky, T. 1950. Evolution in the tropics. American Scientist 38:209-221. 524
Eckert, A. J., A. D. Bower, S. C. Gonzalez-Martinez, J. L. Wegrzyn, G. Coop, and D. B. Neale. 525
2010. Back to nature: ecological genomics of loblolly pine (Pinus taeda, Pinaceae). 526
Molecular Ecology 19:3789-3805. 527
Farquhar, G. D., S. V. Caemmerer, and J. A. Berry. 1980. A Biochemical-Model of 528
Photosynthetic Co2 Assimilation in Leaves of C-3 Species. Planta 149:78-90. 529
Feeley, K. J., M. R. Silman, M. B. Bush, W. Farfan, K. G. Cabrera, Y. Malhi, P. Meir, N. S. 530
Revilla, M. N. R. Quisiyupanqui, and S. Saatchi. 2011. Upslope migration of Andean 531
trees. Journal of Biogeography 38:783-791. 532
Feeley, K. J., S. J. Wright, M. N. N. Supardi, A. R. Kassim, and S. J. Davies. 2007. Decelerating 533
growth in tropical forest trees. Ecology Letters 10:461-469. 534
25
Field, C. B., M. J. Behrenfeld, J. T. Randerson, and P. Falkowski. 1998. Primary production of 535
the biosphere: Integrating terrestrial and oceanic components. Science 281:237-240. 536
Fierer, N., C. M. McCain, P. Meir, M. Zimmermann, J. M. Rapp, M. R. Silman, and R. Knight. 537
2011. Microbes do not follow the elevational diversity patterns of plants and animals. 538
Ecology 92:797-804. 539
Friend, A. D. 2010. Terrestrial plant production and climate change. Journal of Experimental 540
Botany 61:1293-1309. 541
Gelfand, A. E. and A. F. M. Smith. 1990. Sampling-Based Approaches to Calculating Marginal 542
Densities. Journal of the American Statistical Association 85:398-409. 543
Girardin, C. A., Y. Mahli, L. E. O. C. Aragao, M. Mamani, W. Huaraca Huasco, L. Durand, K. J. 544
Feeley, J. Rapp, J. E. Silva-Espejo, M. Silman, N. Salinas, and R. J. Whittaker. 2010. Net 545
primary productivity allocation and cycling of carbon along a tropical forest elevational 546
transect in the Peruvian Andes. Global Change Biology. 547
Harvey, P. H. and M. D. Pagel. 1991. The comparative method in evolutionary biology. Oxford 548
University Press, Oxford. 549
Hikosaka, K., K. Ishikawa, A. Borjigidai, O. Muller, and Y. Onoda. 2006. Temperature 550
acclimation of photosynthesis: mechanisms involved in the changes in temperature 551
dependence of photosynthetic rate. Journal of Experimental Botany 57:291-302. 552
Hillyer, R. and M. R. Silman. 2010. Changes in species interactions across a 2.5 km elevation 553
gradient: effects on plant migration in response to climate change. Global Change 554
Biology 16:3205-3214. 555
Huston, M. A. and S. Wolverton. 2009. The global distribution of net primary production: 556
resolving the paradox. Ecological Monographs 79:343-377. 557
26
Iverson, L. R., M. W. Schwartz, and A. M. Prasad. 2004. How fast and far might tree species 558
migrate in the eastern United States due to climate change? Global Ecology and 559
Biogeography 13:209-219. 560
Jump, A. S., J. M. Hunt, and J. Penuelas. 2006. Rapid climate change-related growth decline at 561
the southern range edge of Fagus sylvatica. Global Change Biology 12:2163-2174. 562
Kitayama, K. and S. I. Aiba. 2002. Ecosystem structure and productivity of tropical rain forests 563
along altitudinal gradients with contrasting soil phosphorus pools on Mount Kinabalu, 564
Borneo. Journal of Ecology 90:37-51. 565
Kitayama, K. and D. Mueller-Dombois. 1994. An altitudinal transect analysis of the windward 566
vegetation on Haleakala, a Hawaiian island mountain: 1. Climate and soils. 567
Phytocoenologia 24:111-133. 568
Koehler, K., A. Center, and J. Cavender-Bares. 2012. Evidence for a freezing tolerance-growth 569
rate trade-off in the live oaks (Quercus series Virentes) across the tropical-temperate 570
divide. New Phytologist 193:730-744. 571
Kuparinen, A., O. Savolainen, and F. M. Schurr. 2010. Increased mortality can promote 572
evolutionary adaptation of forest trees to climate change. Forest Ecology and 573
Management 259:1003-1008. 574
Leuning, R. 2002. Temperature dependence of two parameters in a photosynthesis model. Plant 575
Cell and Environment 25:1205-1210. 576
Leuschner, C., G. Moser, C. Bertsch, M. Roderstein, and D. Hertel. 2007. Large altitudinal 577
increase in tree root/shoot ratio in tropical mountain forests of Ecuador. Basic and 578
Applied Ecology 8:219-230. 579
27
Lewis, S. L., G. Lopez-Gonzalez, B. Sonke, K. Affum-Baffoe, T. R. Baker, L. O. Ojo, O. L. 580
Phillips, J. M. Reitsma, L. White, J. A. Comiskey, M. N. Djuikouo, C. E. N. Ewango, T. 581
R. Feldpausch, A. C. Hamilton, M. Gloor, T. Hart, A. Hladik, J. Lloyd, J. C. Lovett, J. R. 582
Makana, Y. Malhi, F. M. Mbago, H. J. Ndangalasi, J. Peacock, K. S. H. Peh, D. Sheil, T. 583
Sunderland, M. D. Swaine, J. Taplin, D. Taylor, S. C. Thomas, R. Votere, and H. Woll. 584
2009. Increasing carbon storage in intact African tropical forests. Nature 457:1003-585
U1003. 586
Loehle, C. 1998. Height growth rate tradeoffs determine northern and southern range limits for 587
trees. Journal of Biogeography 25:735-742. 588
MacArthur, R. H. 1972. Geographical ecology: patterns in the distribution of species. Harper & 589
Row, New York. 590
Malhi, Y. 2012. The productivity, metabolism and carbon cycle of tropical forest vegetation. 591
Journal of Ecology 100:65-75. 592
Malhi, Y. and J. Wright. 2004. Spatial patterns and recent trends in the climate of tropical 593
rainforest regions. Philosophical Transactions of the Royal Society of London Series B-594
Biological Sciences 359:311-329. 595
McMahon, S. M., G. G. Parker, and D. R. Miller. 2010. Evidence for a recent increase in forest 596
growth. Proceedings of the National Academy of Sciences of the United States of 597
America 107:3611-3615. 598
Medlyn, B. E., E. Dreyer, D. Ellsworth, M. Forstreuter, P. C. Harley, M. U. F. Kirschbaum, X. 599
Le Roux, P. Montpied, J. Strassemeyer, A. Walcroft, K. Wang, and D. Loustau. 2002. 600
Temperature response of parameters of a biochemically based model of photosynthesis. 601
II. A review of experimental data. Plant Cell and Environment 25:1167-1179. 602
28
Meehl, G. A., T.F. Stocker, W.D. Collins, P. Friedlingstein, A.T. Gaye, J.M. Gregory, A. Kitoh, 603
R. Knutti, J.M. Murphy, A. Noda, S.C.B. Raper, I.G. Watterson, A.J. Weaver and Z.-C. 604
Zhao. 2007. Global Climate Projections.in S. Solomon, D. Qin, M. Manning, Z. Chen, M. 605
Marquis, K.B. Averyt, M. Tignor and H.L. Miller, editor. Climate Change 2007: The 606
Physical Science Basis. Contribution of Working Group I to the Fourth Assessment 607
Report of the Intergovernmental Panel on Climate Change. Cambridge University Press, 608
Cambridge, United Kingdom and New York, NY, USA. 609
Meier, C. L., J. Rapp, R. M. Bowers, M. Silman, and N. Fierer. 2010. Fungal growth on a 610
common wood substrate across a tropical elevation gradient: Temperature sensitivity, 611
community composition, and potential for above-ground decomposition. Soil Biology & 612
Biochemistry 42:1083-1090. 613
Moles, A. T., S. P. Bonser, A. G. B. Poore, I. R. Wallis, and W. J. Foley. 2011a. Assessing the 614
evidence for latitudinal gradients in plant defence and herbivory. Functional Ecology 615
25:380-388. 616
Moles, A. T., I. R. Wallis, W. J. Foley, D. I. Warton, J. C. Stegen, A. J. Bisigato, L. Cella-617
Pizarro, C. J. Clark, P. S. Cohen, W. K. Cornwell, W. Edwards, R. Ejrnaes, T. Gonzales-618
Ojeda, B. J. Graae, G. Hay, F. C. Lumbwe, B. Magana-Rodriguez, B. D. Moore, P. L. 619
Peri, J. R. Poulsen, R. Veldtman, H. von Zeipel, N. R. Andrew, S. L. Boulter, E. T. Borer, 620
F. Fernandez Campon, M. Coll, A. G. Farji-Brener, J. De Gabriel, E. Jurado, L. A. Kyhn, 621
B. Low, C. P. H. Mulder, K. Reardon-Smith, J. Rodriguez-Velazquez, E. W. Seabloom, 622
P. A. Vesk, A. van Cauter, M. S. Waldram, Z. Zheng, P. G. Blendinger, B. J. Enquist, J. 623
M. Facelli, T. Knight, J. D. Majer, M. Martinez-Ramos, P. McQuillan, and L. D. Prior. 624
29
2011b. Putting plant resistance traits on the map: a test of the idea that plants are better 625
defended at lower latitudes. New Phytologist 191:777-788. 626
Morin, X., D. Viner, and I. Chuine. 2008. Tree species range shifts at a continental scale: new 627
predictive insights from a process-based model. Journal of Ecology 96:784-794. 628
Moya-Larano, J. 2010. Can temperature and water availability contribute to the maintenance of 629
latitudinal diversity by increasing the rate of biotic interactions? Open Ecology Journal 630
3:1-13. 631
Myneni, R. B., C. D. Keeling, C. J. Tucker, G. Asrar, and R. R. Nemani. 1997. Increased plant 632
growth in the northern high latitudes from 1981 to 1991. Nature 386:698-702. 633
Phillips, O. L., Y. Malhi, N. Higuchi, W. F. Laurance, P. V. Nunez, R. M. Vasquez, S. G. 634
Laurance, L. V. Ferreira, M. Stern, S. Brown, and J. Grace. 1998. Changes in the carbon 635
balance of tropical forests: Evidence from long-term plots. Science 282:439-442. 636
Purves, D. W. 2009. The demography of range boundaries versus range cores in eastern US tree 637
species. Proceedings of the Royal Society B-Biological Sciences 276:1477-1484. 638
R Development Core Team. 2010. R: A Language and Environment for Statistical Computing. R 639
Foundation for Statistical Computing, Vienna, Austria. 640
Raich, J. W., A. E. Russell, K. Kitayama, W. J. Parton, and P. M. Vitousek. 2006. Temperature 641
influences carbon accumulation in moist tropical forests. Ecology 87:76-87. 642
Rapp, J. M. 2010. Climate control of plant performance across an Andean altitudinal gradient. 643
Ph.D. dissertation. Wake Forest University, Winston Salem, North Carolina. 644
Schemske, D. W., G. G. Mittelbach, H. V. Cornell, J. M. Sobel, and K. Roy. 2009. Is There a 645
Latitudinal Gradient in the Importance of Biotic Interactions? Annual Review of Ecology 646
Evolution and Systematics 40:245-269. 647
30
Schongart, J., M. T. F. Piedade, S. Ludwigshausen, V. Horna, and M. Worbes. 2002. Phenology 648
and stem-growth periodicity of tree species in Amazonian floodplain forests. Journal of 649
Tropical Ecology 18:581-597. 650
Singh, K. P. and C. P. Kushwaha. 2005. Emerging paradigms of tree phenology in dry tropics. 651
Current Science 89:964-975. 652
Sork, V. L., F. W. Davis, R. Westfall, A. Flint, M. Ikegami, H. F. Wang, and D. Grivet. 2010. 653
Gene movement and genetic association with regional climate gradients in California 654
valley oak (Quercus lobata Nee) in the face of climate change. Molecular Ecology 655
19:3806-3823. 656
Stephenson, N. L., P. J. van Mantgem, A. G. Bunn, H. Bruner, M. E. Harmon, K. B. O'Connell, 657
D. L. Urban, and J. F. Franklin. 2011. Causes and implications of the correlation between 658
forest productivity and tree mortality rates. Ecological Monographs 81:527-555. 659
Toledo, M., M. Peña-Claros, F. Bongers, A. Alarcón, J. Balcázar, J. Chuviña, C. Leaño, J. C. 660
Licona, and L. Poorter. 2012. Distribution patterns of tropical woody species in response 661
to climatic and edaphic gradients. Journal of Ecology 100:253-263. 662
Urrutia, R. and M. Vuille. 2009. Climate change projections for the tropical Andes using a 663
regional climate model: Temperature and precipitation simulations for the end of the 21st 664
century. Journal of Geophysical Research-Atmospheres 114. 665
Vetaas, O. R. 2002. Realized and potential climate niches: a comparison of four Rhododendron 666
tree species. Journal of Biogeography 29:545-554. 667
Weiner, J. 1990. Asymmetric competition in plant populations. Trends in Ecology & Evolution 668
5:360-364. 669
31
Wilf, P. and C. C. Labandeira. 1999. Response of plant-insect associations to Paleocene-Eocene 670
warming. Science 284:2153-2156. 671
Wilf, P., C. C. Labandeira, K. R. Johnson, P. D. Coley, and A. D. Cutter. 2001. Insect herbivory, 672
plant defense, and early Cenozoic climate change. Proceedings of the National Academy 673
of Sciences of the United States of America 98:6221-6226. 674
Williams, J. W. and S. T. Jackson. 2007. Novel climates, no-analog communities, and ecological 675
surprises. Frontiers in Ecology and the Environment 5:475-482. 676
Worbes, M. 1999. Annual growth rings, rainfall-dependent growth and long-term growth 677
patterns of tropical trees from the Caparo Forest Reserve in Venezuela. Journal of 678
Ecology 87:391-403. 679
Zimmermann, M., P. Meir, M. I. Bird, Y. Malhi, and A. J. Q. Ccahuana. 2009. Climate 680
dependence of heterotrophic soil respiration from a soil-translocation experiment along a 681
3000 m tropical forest altitudinal gradient. European Journal of Soil Science 60:895-906. 682
Ecological Archives 683
Appendix A: Study plot locations and characteristics. 684
Appendix B: Issues in comparing growth rates derived from census and dendrometer data. 685
Appendix C: Generalized linear model analysis of tree growth rate using dendrometer data only. 686
Appendix D: Parameter estimates from the Bayesian analysis of tree growth. 687
Supplement: R code and example dataset for fitting the Bayesian model of tree growth.688
32
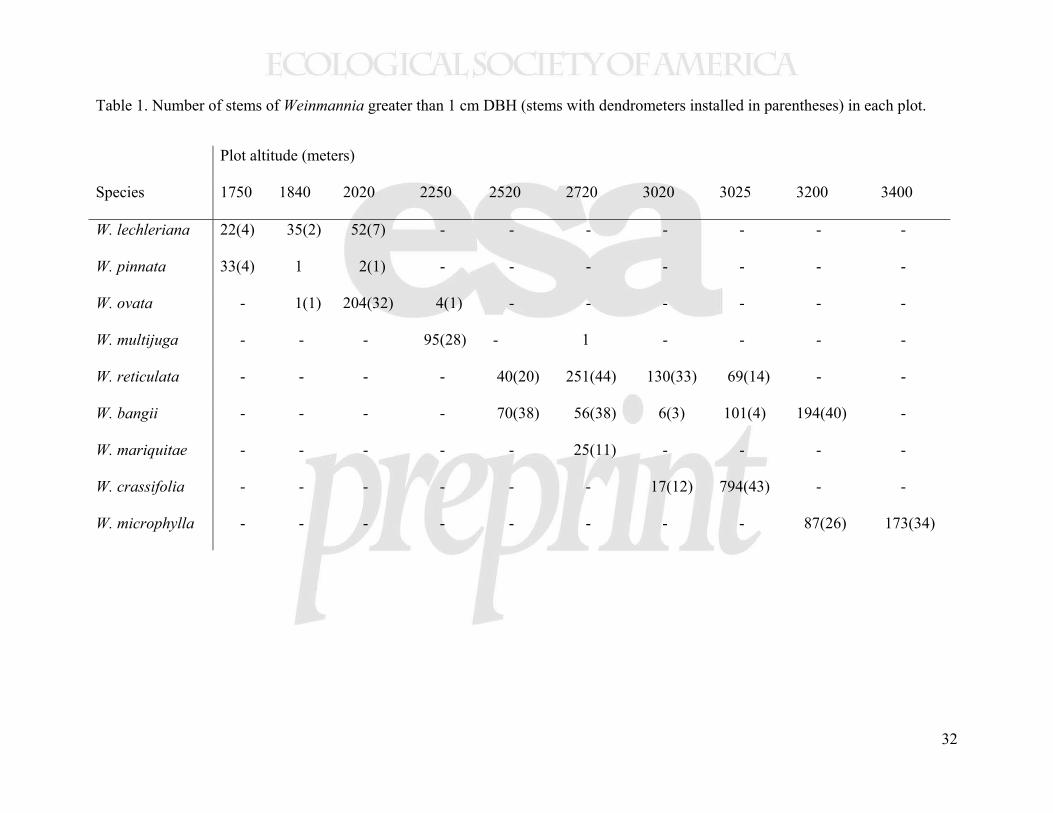
Table 1. Number of stems of Weinmannia greater than 1 cm DBH (stems with dendrometers installed in parentheses) in each plot.
Plot altitude (meters)
Species 1750 1840 2020 2250 2520 2720 3020 3025 3200 3400
W. lechleriana 22(4) 35(2) 52(7) - - - - - - -
W. pinnata 33(4) 1 2(1) - - - - - - -
W. ovata - 1(1) 204(32) 4(1) - - - - - -
W. multijuga - - - 95(28) - 1 - - - -
W. reticulata - - - - 40(20) 251(44) 130(33) 69(14) - -
W. bangii - - - - 70(38) 56(38) 6(3) 101(4) 194(40) -
W. mariquitae - - - - - 25(11) - - - -
W. crassifolia - - - - - - 17(12) 794(43) - -
W. microphylla - - - - - - - - 87(26) 173(34)

33
Figure legends
Figure 1. Two hypotheses relating tree growth to temperature: a) growth increases within species
with temperature, and b) growth rate is fixed within species, but a trade-off between temperature
and growth results in warmer niche species having faster growth. c) The path through which
climate affects ecosystem productivity under scenarios (a) and (b).
Figure 2. Modeled diameter increment versus altitude for adult canopy trees of all species. Gray
points indicate the growth of individual stems, while black points show the predicted growth rate
of a canopy tree at the species’ median altitude. Different symbols demark species and the black
points are labeled with the first two letters of the species epithet. Lines (thick line is mean,
shaded areas show 95% credible interval) depict the trend in diameter increment of a canopy tree
versus species median altitude. Solid lines show the predicted diameter increment from the
Bayesian model of all species combined, while the dashed lines show the regression through the
predicted growth rate of a canopy tree at the species’ median altitude. In calculating both lines
data for W. ovata was omitted (for justification see main text).
Figure 3. Mean diameter increment versus stem altitude for four common species. Points are
modeled mean diameter increment for each tree, while lines (thick line is mean, thin lines are the
95% credible interval) depict predicted growth for three different scenarios: saplings in the
understory (dark gray; dbh = 10 cm, canopy status = 1); saplings in gaps (light gray; dbh = 10
cm, canopy status =3); and canopy trees (black; dbh = 80th percentile of dbh distribution for each
species, canopy status = 3). Points have the same color scheme as lines, with stems < 15 cm dbh
considered saplings and stems in the 70th percentile or above considered canopy trees. Stems
indicated by an ‘x’ do not fit into any of the three scenarios.

34
Figure 4. Parameter values for three covariates included in the Bayesian model. Points represent
the mean posterior parameter value, while lines depict the 95 % credible interval of the
parameter. Parameter estimates greater (less) than zero indicate that parameter had a positive
(negative) effect on growth. Note that the credible intervals for W. mariquitae and W. pinnata are
truncated.
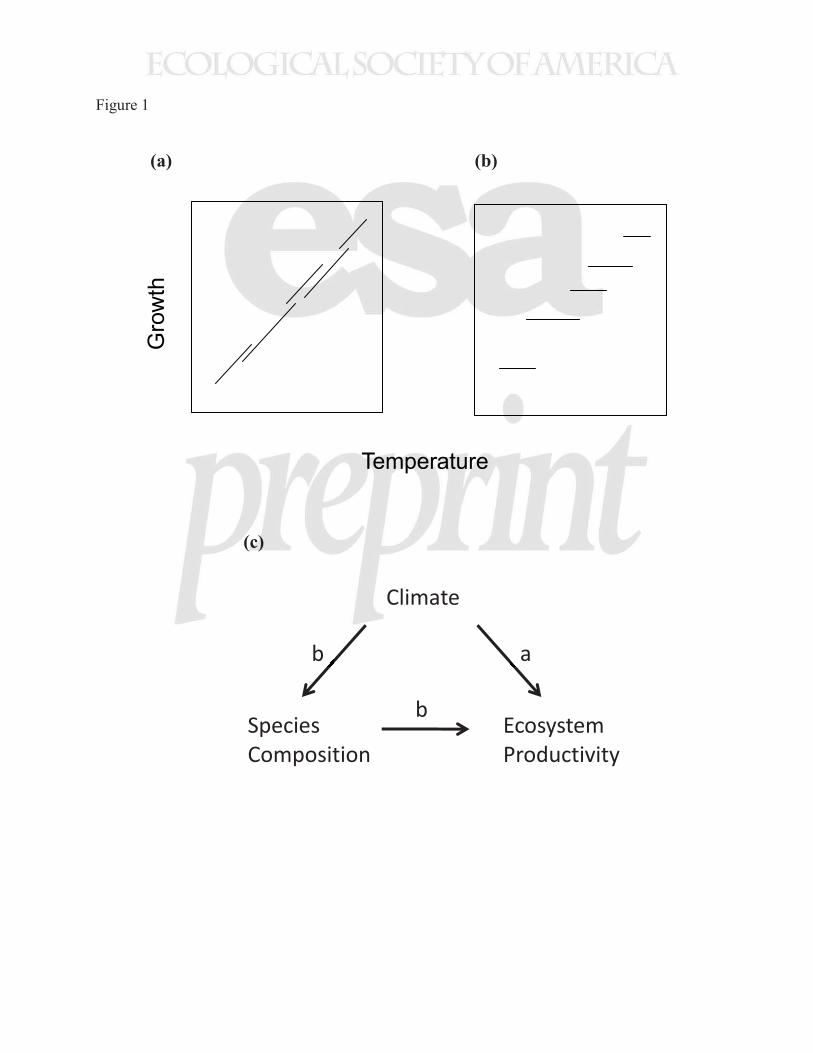
Figure 1
(a) (b)
(c)
Climate
SpeciesComposition
EcosystemProductivity
b
b
a
Temperature
Growth
2000 2500 3000
0.0
0.1
0.2
0.3
0.4
0.5
Altitude (m)
Dia
met
er In
crem
ent (
cm)
●
●
●●●●
●
●
●
●● ●●
●
●
●●●
●
●
●
●
●●
●
●
●
●●●
●
●
●
●
●
●
●●
●
●
●
●●●
●●
●●
●
●
●
●
●
●
●●●● ●●●
●
●
●
●
●
●
●●
●
●
●
●●●
●
●
●
●
●●●
●
●
● ●
●
●
●
●
●
●●
●
●
●
●
●●
●
●
●
●
●
●
●
●
●
●●●
●
●
●
●
●
●
●
●
●
●
●
●
●●
●
●
●
●●
●
●
●
●●
●
●
●
●
●
●
●
●
●
●
●
●
●
●
●
●
●
●
●
●
●
●
●
●●
● ●●
●●●
●
●
●
●
●
●
●
●
●
●●
mcr
ba
re
ma
mu
ov
le
pi
rerrrrreererrrerrererreerrrerreeeereeerreerrerreerreerrr rrrrrrrccccccrccccccccccrrccrcccccccccccccccccccccrcrccrcccc
babababbbabbbabbbbaaabbbbbabbbbbbbbbabbbabaababbmaaamamaaaaaaamamaalelllee
pipippppipppppppppp
rrrrrrrrrrrrrrrrrrrrccrcrrcrccrcrccrccrcrrrccrccrccccccccrccccccccccccccrcccccrccrcrccccrccccccccccceeeeeeee
aaamammmmaaalelllellelel
Figure 2
●
●●
●●●●●●●
●
●
●
●
●●●●●●●
●●●●●●●●●●●●●●●●●●●●
●●●●●●
●●●●
●
●
●●
●●
●
●●
●
●
●
●
●
●
●
●●
●
●
●●
●●●
●
●
●●●●●
● ●
●●
●
●●
●
●●
●
●
●
●
●●
●
●
●
●
●●
●
●
●
●●●●
●
●●●●●●●●●●
●●●●
●
●
●●●●●●●●●●● ●●●●●
3000 3200 3400 3600
0.0
0.1
0.2
0.3
0.4
0.5W. microphylla
●
●●●●
●
●
●●
●●
●●
●●
●
●
●
●
● ●●
●
●
●
●●
●
●
●
●
●●
●●
●●
●
●
●
●
●●
●
●
●
●
●
●
●
●●●
●
●
●
●
●●●
●
●●●
●
●
●●
●●● ●●
●
●
●
●
●
●
●
●
● ●
●●
●
●
●
●
●
●
●
●
●
●
●●●●
●
●
●
●
●●
●
●
●●
●
●
●
●
●
●
●●
●●
●
●
●
●
●●●●
●
● ●●●●●●●
●
●●●
●
●●●●●●
●●●●●●●
●
●●●●
●●●
●●
●
●● ●
●
●
●●●●
●
●
●
●
●
●
●
●
●
●
●●
●●●●
●
●●
●●●
●
●
●
●
●
●●●●●●●●●
●●
●
●●●●●●●●●●●●●●●●●●
●●●
2500 2700 2900 3100
0.0
0.1
0.2
0.3
0.4
0.5W. bangii
●
●
●●
●●●
●
●
●●●
●
●
●●
●●
●
●
●●
●●
●● ●
●
●
●
●
●
●
●
●
●
●●●
●
●
●
●
●
●
●
●
●
●●
●
●
●
●
●
●
●
●
●
●
●●●●●●●●●●●
●●
● ●●●●●●●●
●
●
●●●●●●●●●●●●●●●●●●●●●●●●●●●●●
●●●
●●●
●● ●●●●
●● ●●
●
●
●●
●●
●●●●
●●●●●
●
●●●●●●● ●●
● ●●
●●
●●●●●●●●●
●
●
●●●●●●●●
●●
●
● ●
●
●
●●
●●●
●●●
●
●
●
●
●
●
●
●
●●
●
●●
●
●
●
●
●●
●
●
●
●●●●●
●
●
●●
●●●
●●●●
●●●●●
●●● ●
●●
●●●●●●●●●●●●●●
●
●●● ●●●●
●●
●
●
●
●
●
●●
● ●
●
●
●
●
●
●●●
●
●
●●
● ●
●
●
●
●●●●●●●●●●●●●●●●●●●●●
2400 2600 2800 3000
0.0
0.1
0.2
0.3
0.4
0.5W. reticulata
●
●
●
●
●●●●●
●●
●
●
●●●
●
●●
●
●
●
●
●
●
●
●●● ●●●
●●●
●●
●
●
●
●
●
●
●●●●●
●
● ●
●●●●
●
●●●●●●●●● ●●
1600 1800 2000 2200
0.0
0.1
0.2
0.3
0.4
0.5W. lechleriana
Altitude (m)
Mea
n di
amet
er in
crem
ent (
cm)
Figure 3
pinnatalechleriana
ovatamultijugareticulata
mariquitaebangii
crassifoliamicrophylla
●
●
●
●
−0.4 0.2
Altitude
parameter value
●
●
●
●
●
●
●
●
●
−0.10 0.05
Canopy status
parameter value
●
●
●
●
●
●
●
●
●
−0.10 0.05
DBH
parameter value
Figure 4