Embed Size (px)
Citation preview
ECOLOGY – What is it?
The scientific study of interactions between organisms and their environments, focusing on energy transfer It is a science of relationships.
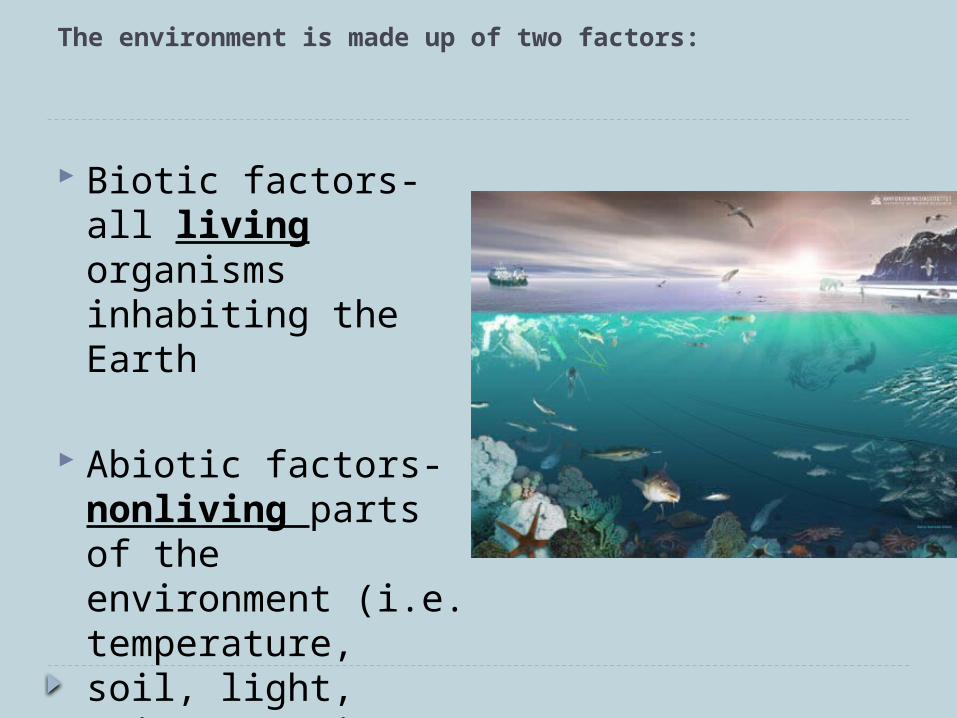
The environment is made up of two factors:
Biotic factors- all living organisms inhabiting the Earth
Abiotic factors- nonliving parts of the environment (i.e. temperature, soil, light, moisture, air currents)
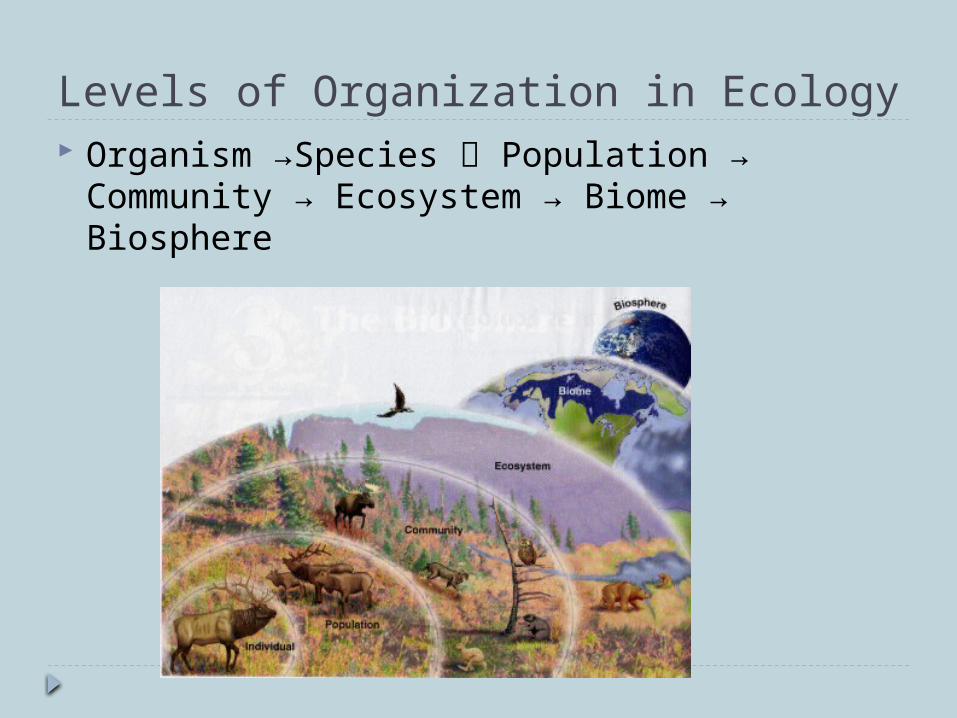
Levels of Organization in Ecology Organism →Species Population →
Community → Ecosystem → Biome → Biosphere
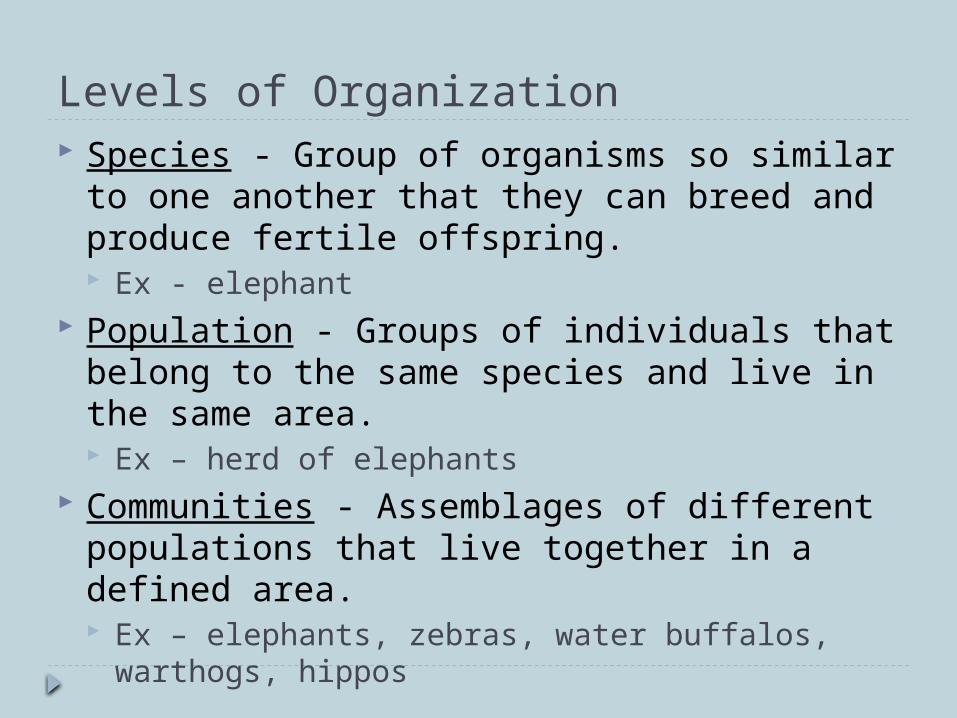
Levels of Organization Species - Group of organisms so similar to one
another that they can breed and produce fertile offspring. Ex - elephant
Population - Groups of individuals that belong to the same species and live in the same area. Ex – herd of elephants
Communities - Assemblages of different populations that live together in a defined area. Ex – elephants, zebras, water buffalos, warthogs,
hippos
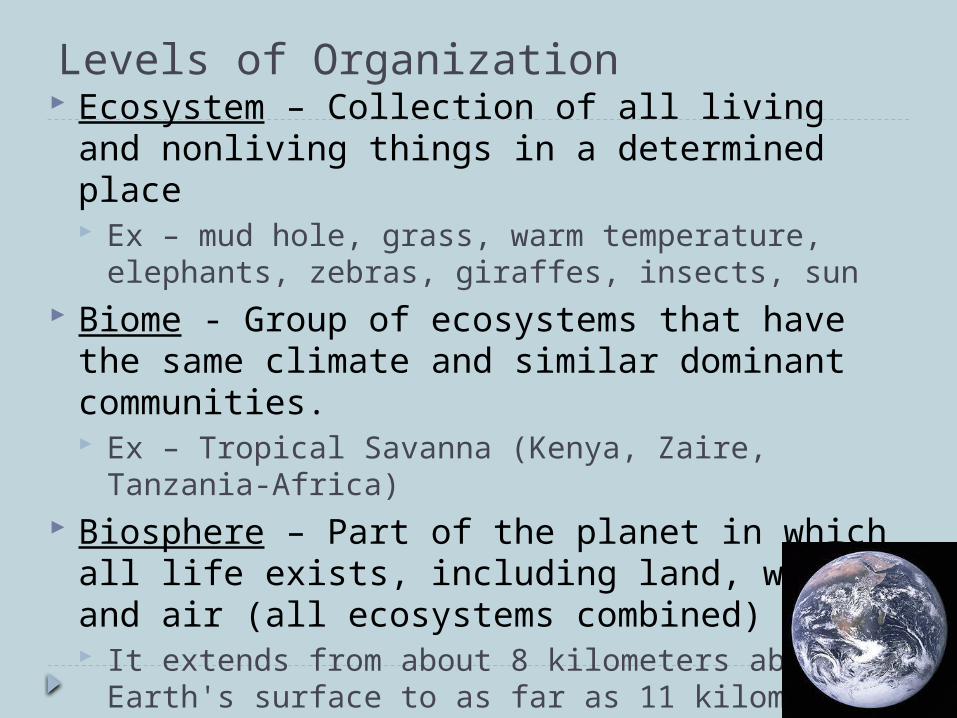
Levels of Organization Ecosystem – Collection of all living and
nonliving things in a determined place Ex – mud hole, grass, warm temperature,
elephants, zebras, giraffes, insects, sun Biome - Group of ecosystems that have the
same climate and similar dominant communities. Ex – Tropical Savanna (Kenya, Zaire, Tanzania-
Africa) Biosphere – Part of the planet in which all life
exists, including land, water, and air (all ecosystems combined) It extends from about 8 kilometers above Earth's
surface to as far as 11 kilometers below the surface of the ocean.
Habitat vs. Niche…Niche - the role a species plays in a community (job)
Habitat- the place in which an organism lives out its life (address)
A niche is determined by the tolerance limitations of an organism, or a limiting factor.
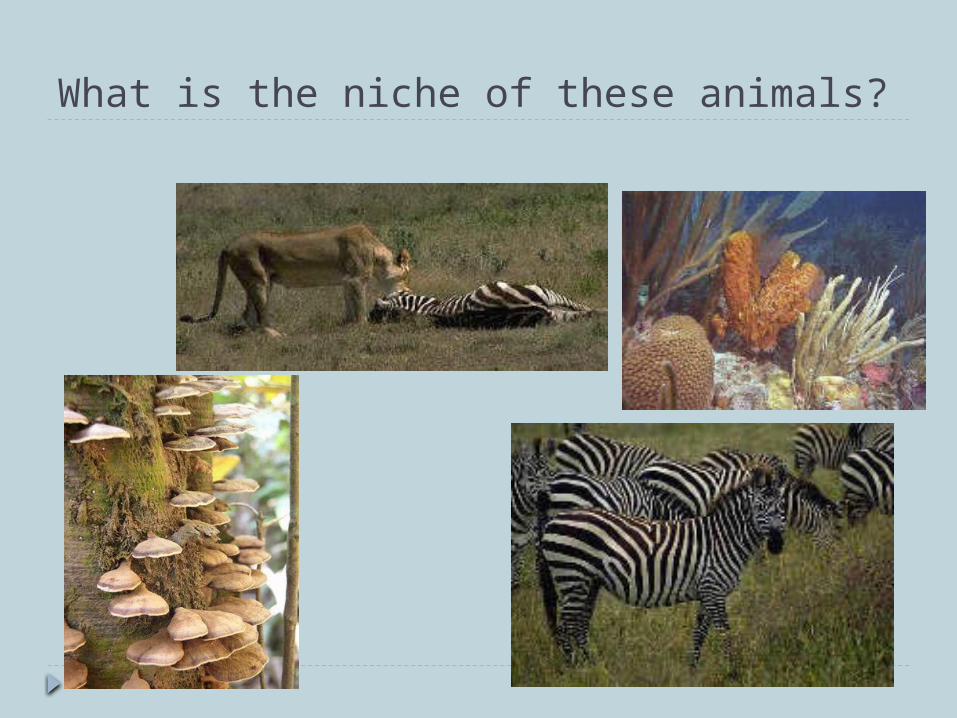
What is the niche of these animals?
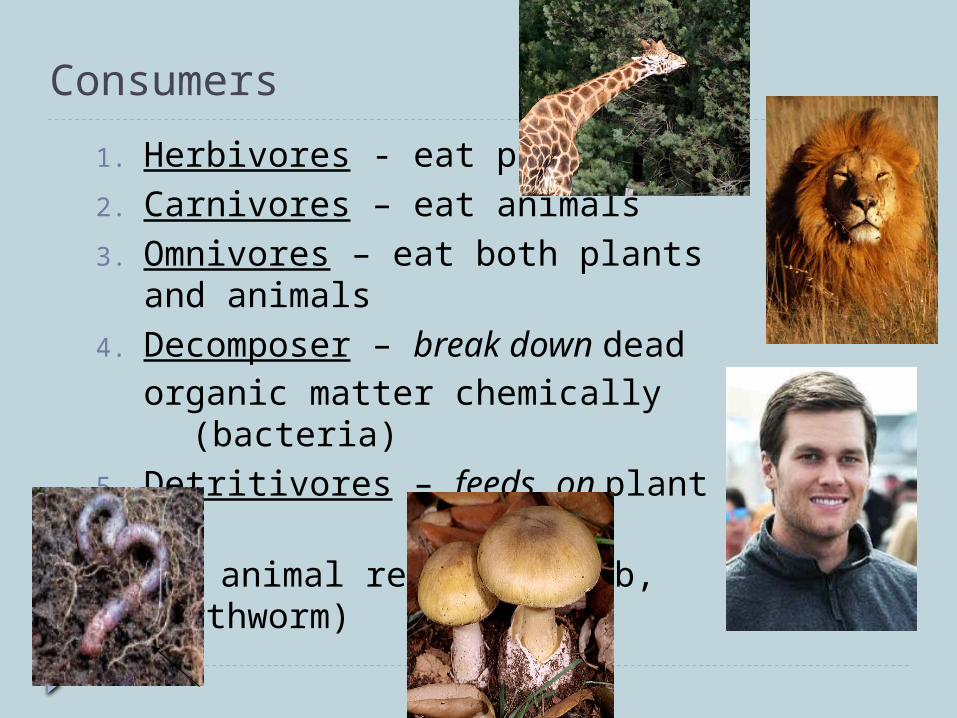
Consumers
1. Herbivores - eat plants2. Carnivores – eat animals3. Omnivores – eat both plants and
animals4. Decomposer – break down dead
organic matter chemically (bacteria)
5. Detritivores – feeds on plant and animal remains (crab, earthworm)
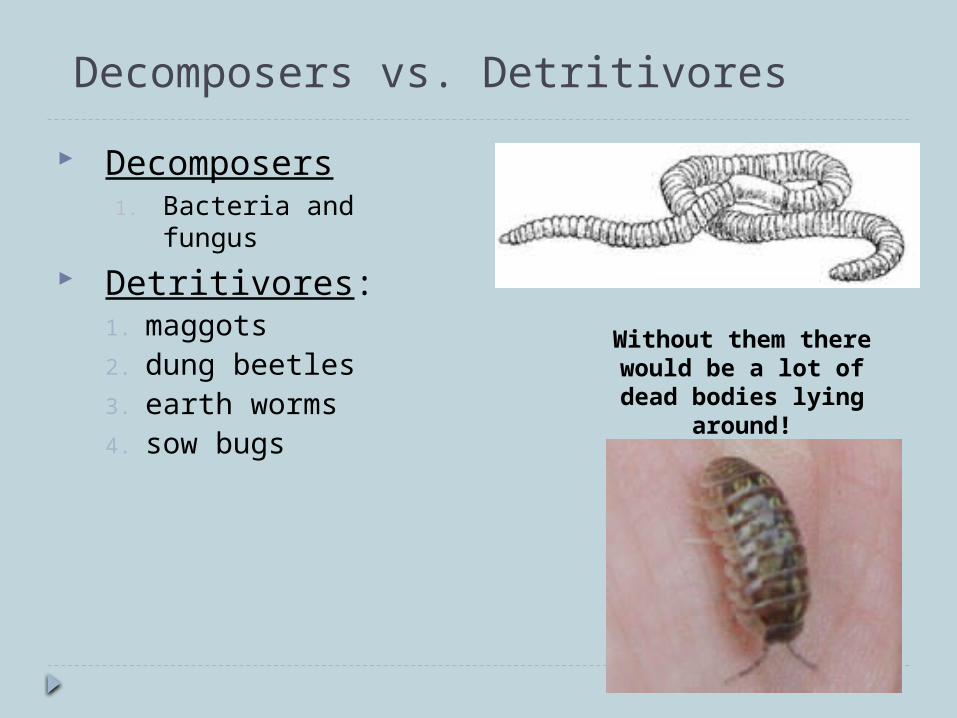
Decomposers vs. Detritivores
Decomposers1. Bacteria and fungus
Detritivores:1. maggots2. dung beetles3. earth worms4. sow bugs
Without them there would be a lot of dead bodies lying around!
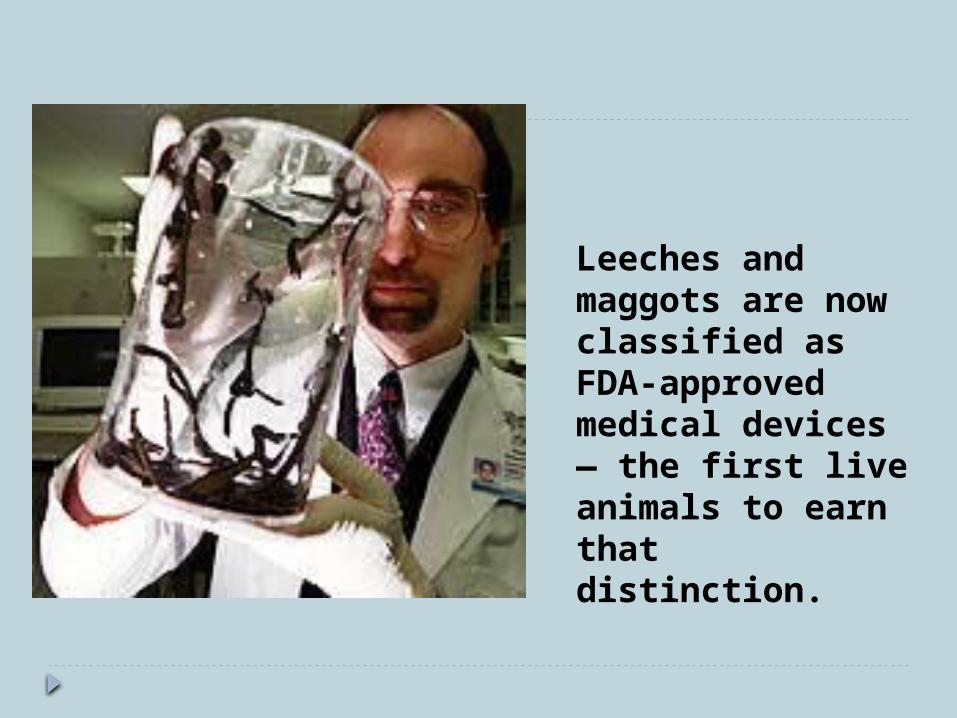
Leeches and maggots are now classified as FDA-approved medical devices — the first live animals to earn that distinction.
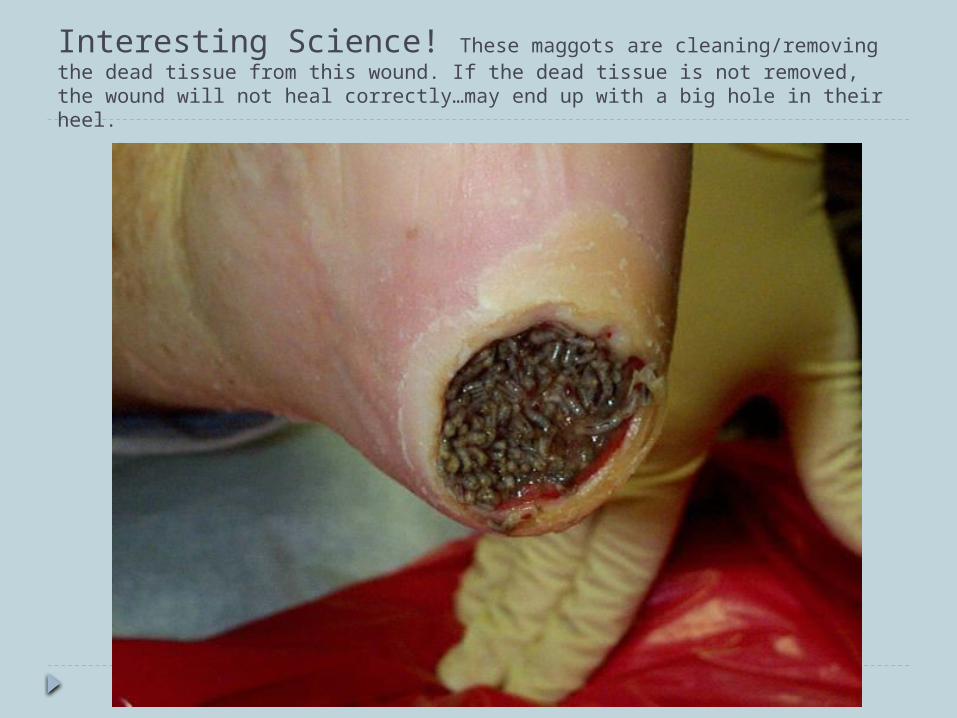
Interesting Science! These maggots are cleaning/removing the dead tissue from this wound. If the dead tissue is not removed, the wound will not heal correctly…may end up with a big hole in their heel.
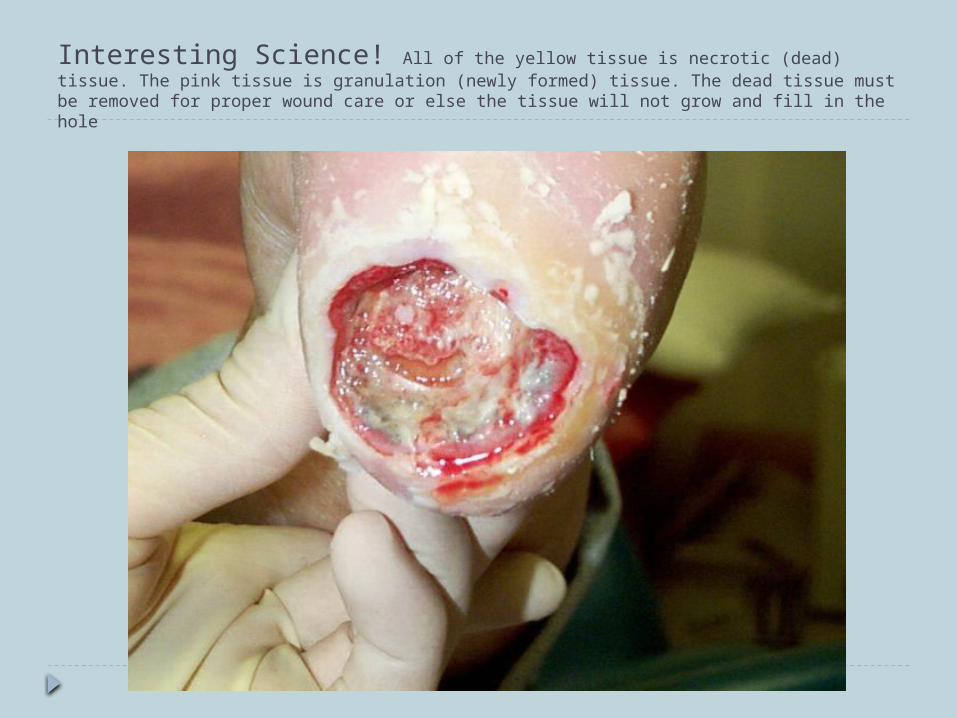
Interesting Science! All of the yellow tissue is necrotic (dead) tissue. The pink tissue is granulation (newly formed) tissue. The dead tissue must be removed for proper wound care or else the tissue will not grow and fill in the hole
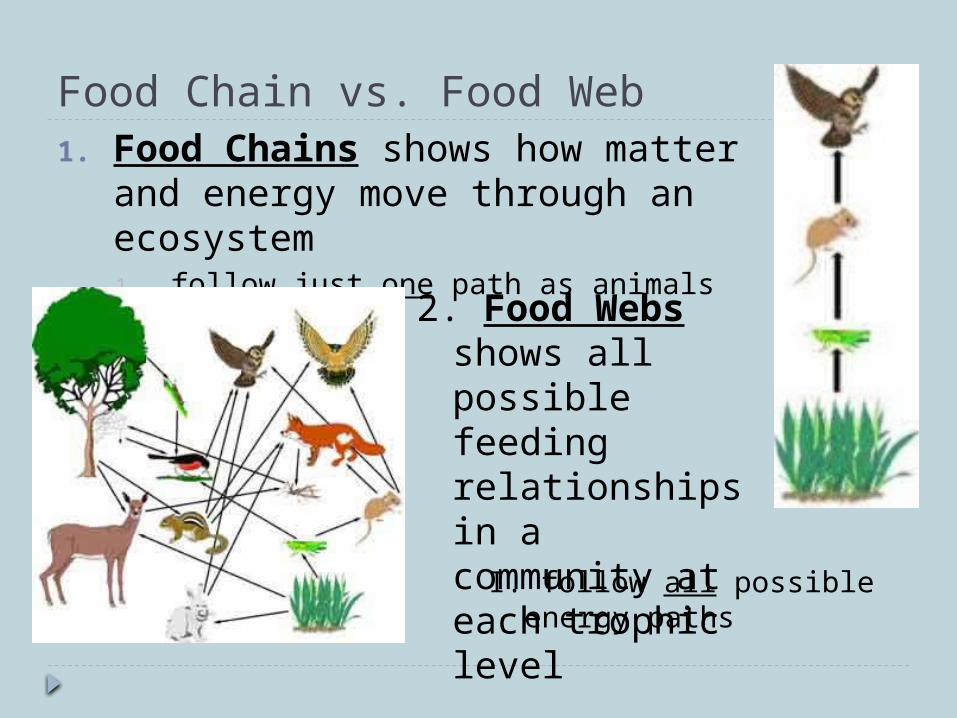
Food Chain vs. Food Web1. Food Chains shows how matter
and energy move through an ecosystem1. follow just one path as animals find food.
2. Food Webs shows all possible feeding relationships in a community at each trophic level
I. follow all possible energy paths
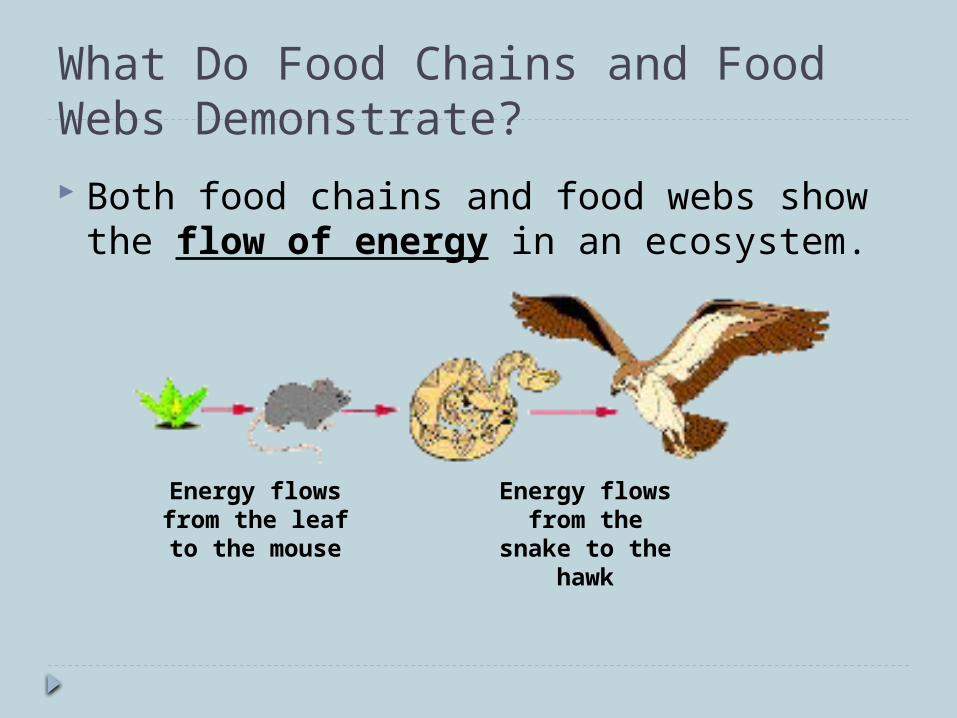
What Do Food Chains and Food Webs Demonstrate? Both food chains and food webs show the
flow of energy in an ecosystem.
Energy flows from the leaf to the
mouse
Energy flows from the snake
to the hawk
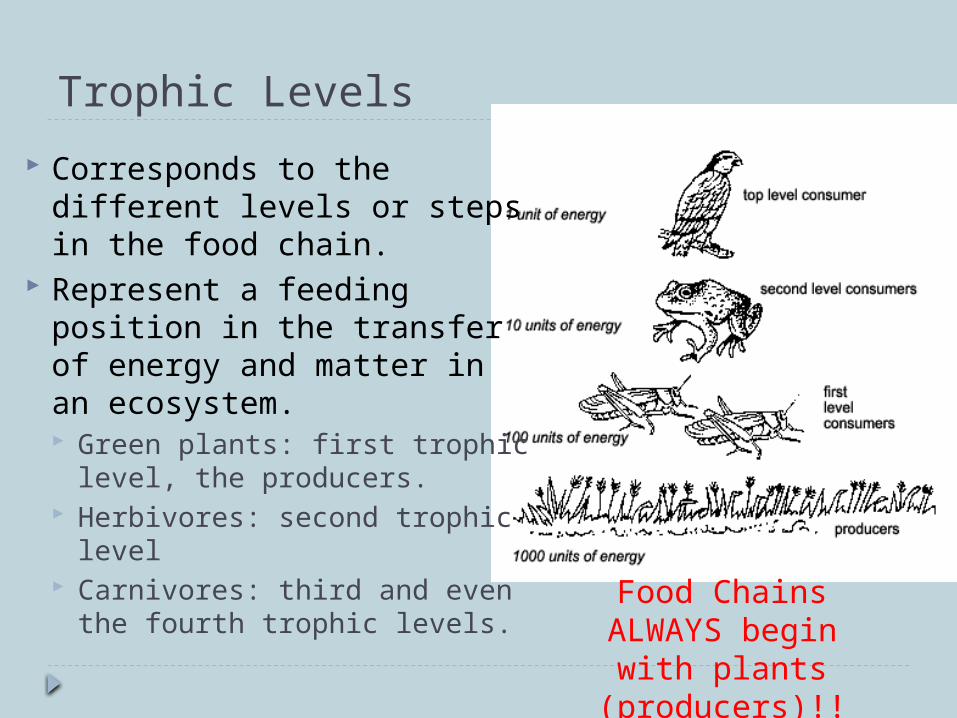
Trophic Levels
Corresponds to the different levels or steps in the food chain.
Represent a feeding position in the transfer of energy and matter in an ecosystem. Green plants: first trophic
level, the producers. Herbivores: second trophic
level Carnivores: third and even
the fourth trophic levels.
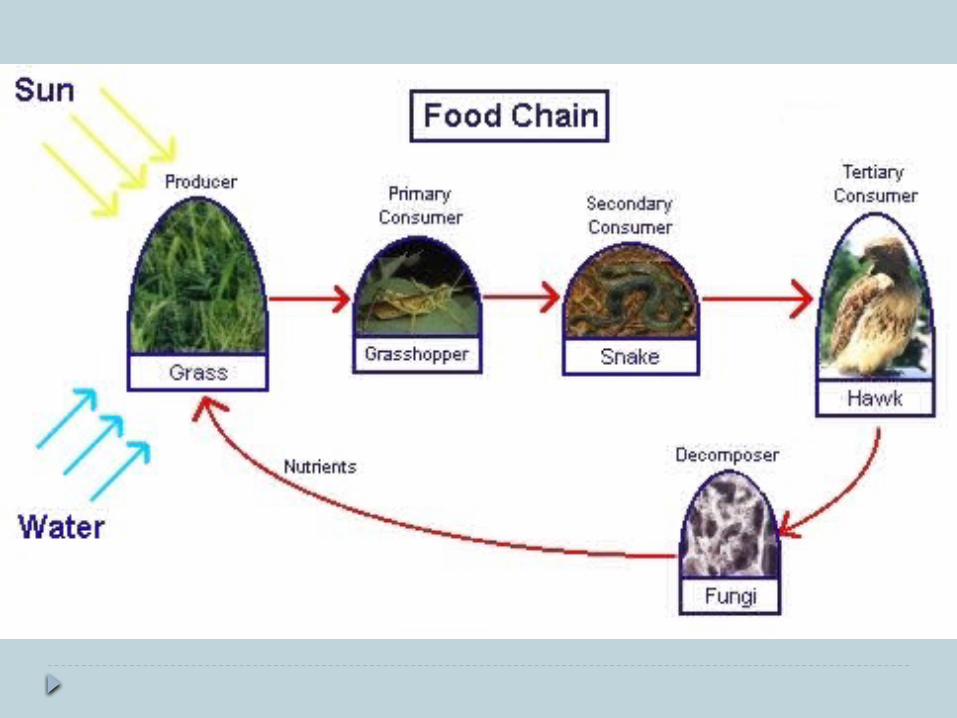
Food Chains ALWAYS begin with plants (producers)!!
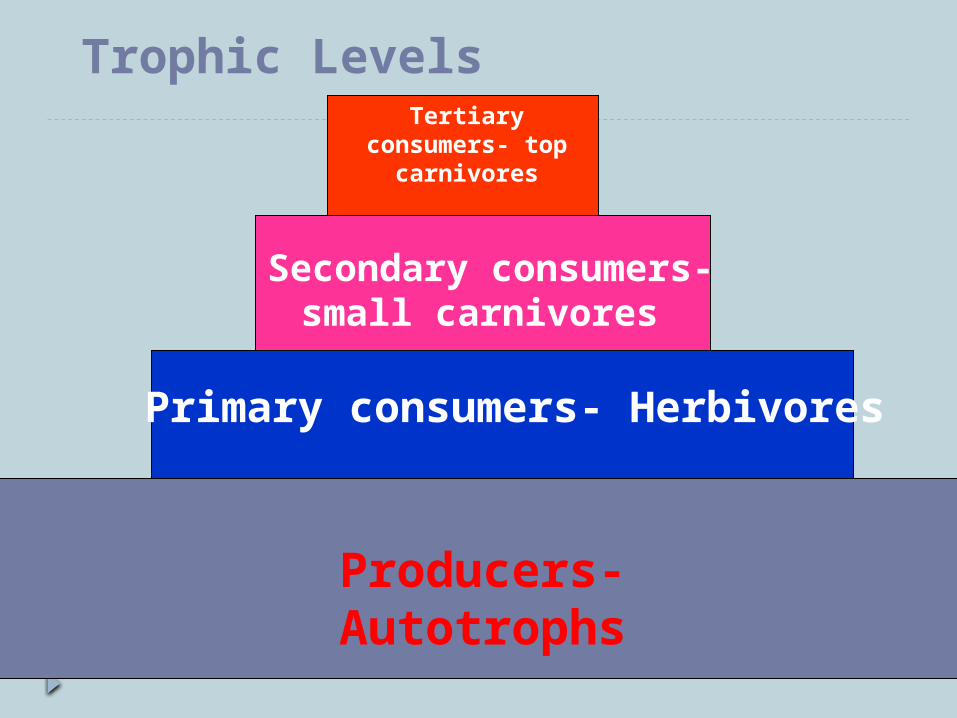
Trophic Levels
Producers- Autotrophs
Primary consumers- Herbivores
Secondary consumers-small
carnivores
Tertiary consumers- top
carnivores
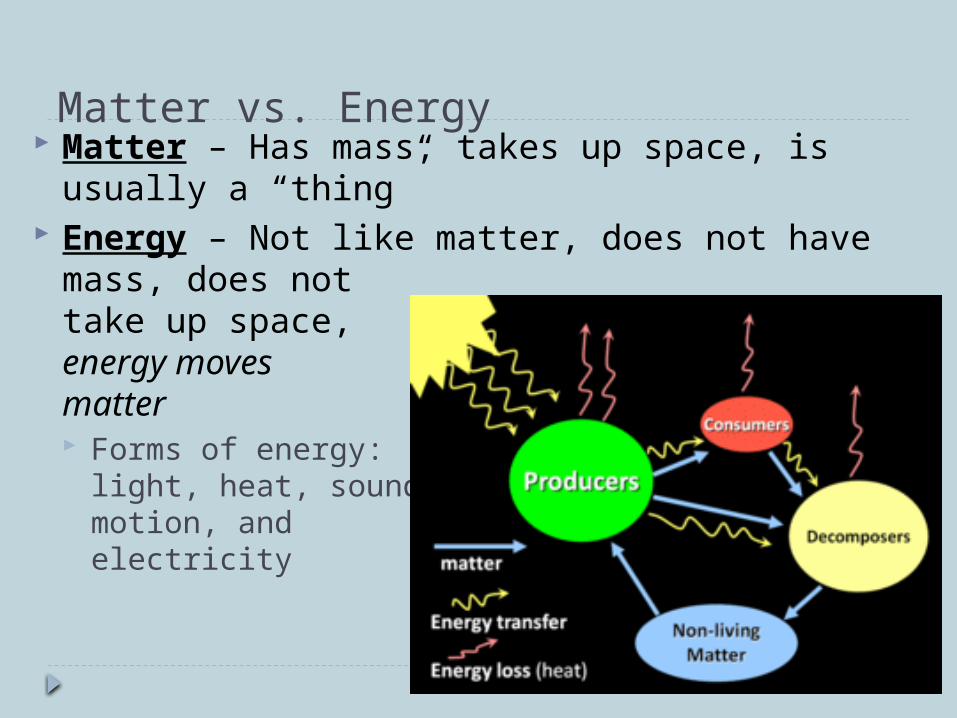
Matter vs. Energy Matter – Has mass, takes up space, is usually a
“thing” Energy – Not like matter, does not have mass,
does not take up space, energy moves matter Forms of energy:
light, heat, sound, motion, and electricity
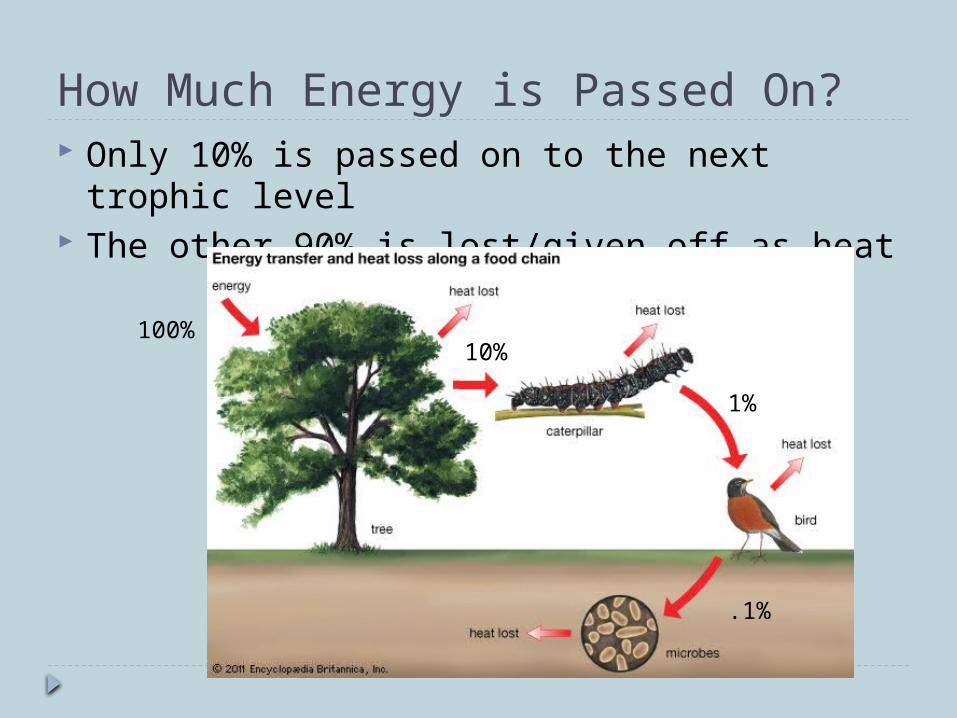
How Much Energy is Passed On? Only 10% is passed on to the next trophic
level The other 90% is lost/given off as heat
100%10%
1%
.1%

Food Chains: Matter and Energy
As you move up a food chain, the matter and energy decreases.
Energy is transferred upwards but is diminished with each transfer.
Pyramids are larger at the bottom…more matter and energy are at the bottom of the pyramid!
.1% Energy
1% Energy
10% Energy
100% Energy
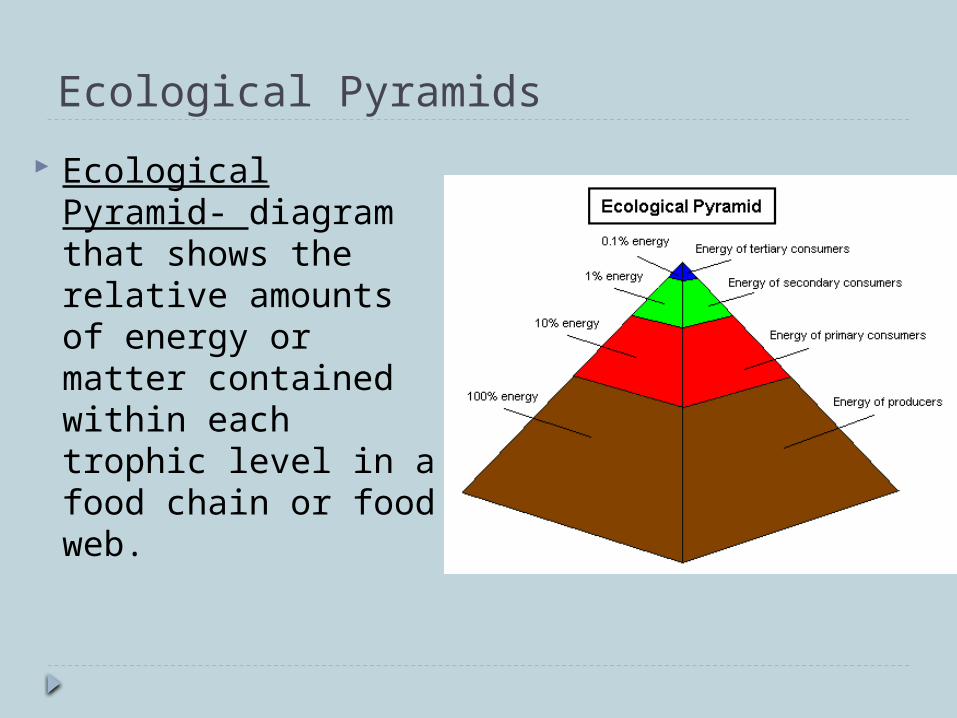
Ecological Pyramids
Ecological Pyramid- diagram that shows the relative amounts of energy or matter contained within each trophic level in a food chain or food web.
Two Types of Ecological Pyramids1. Pyramid of Biomass – Represents the
biomass at each trophic level2. Pyramid of Numbers – Represents the
number of organisms at each trophic level
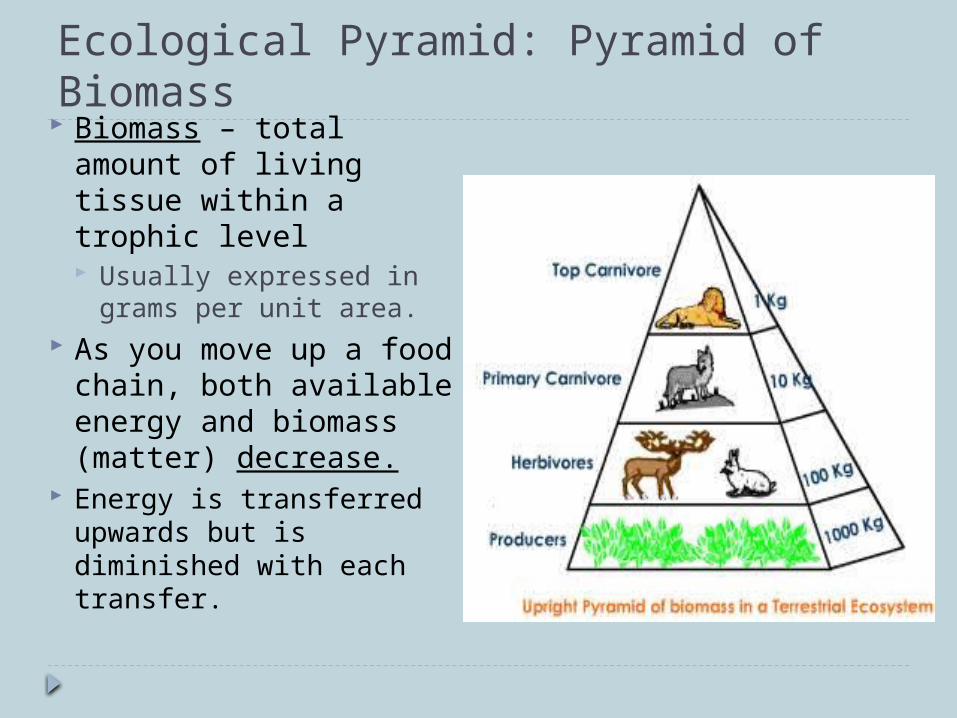
Ecological Pyramid: Pyramid of Biomass Biomass – total
amount of living tissue within a trophic level Usually expressed in
grams per unit area. As you move up a food
chain, both available energy and biomass (matter) decrease.
Energy is transferred upwards but is diminished with each transfer.
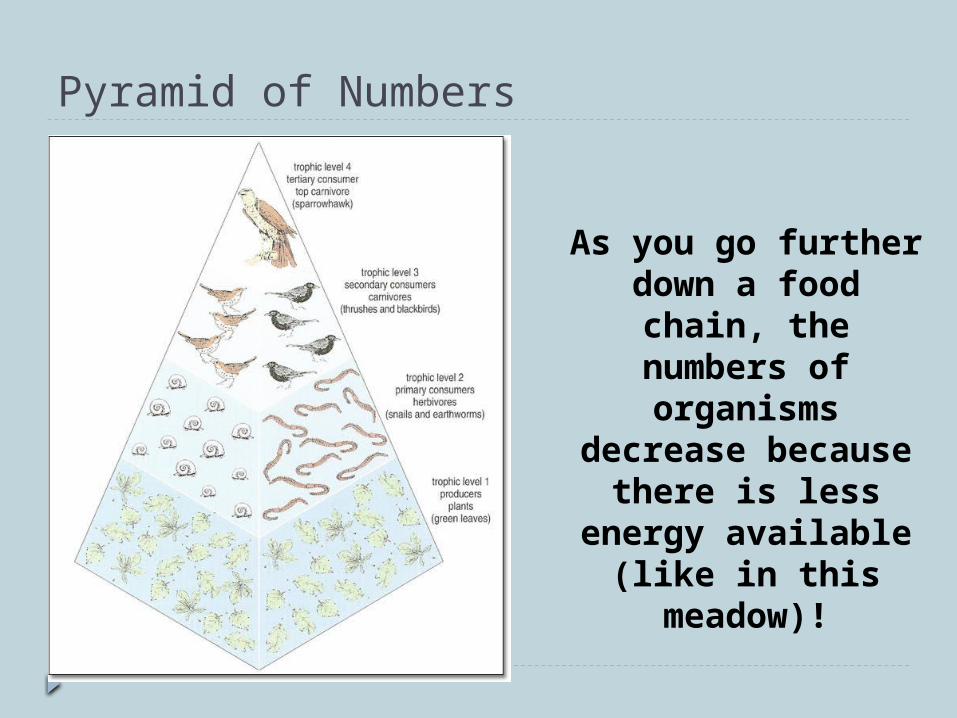
Pyramid of Numbers
As you go further down a food chain,
the numbers of organisms decrease because there is less energy available (like
in this meadow)!
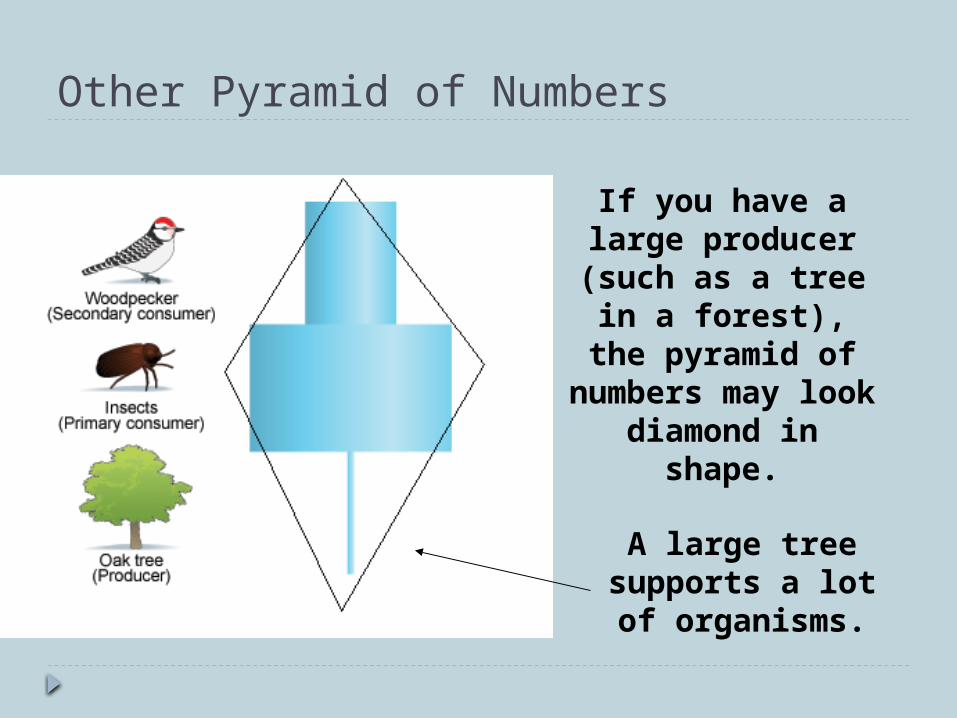
Other Pyramid of Numbers
If you have a large producer (such as a tree in a forest), the pyramid of numbers may look diamond in
shape.
A large tree supports a lot of
organisms.
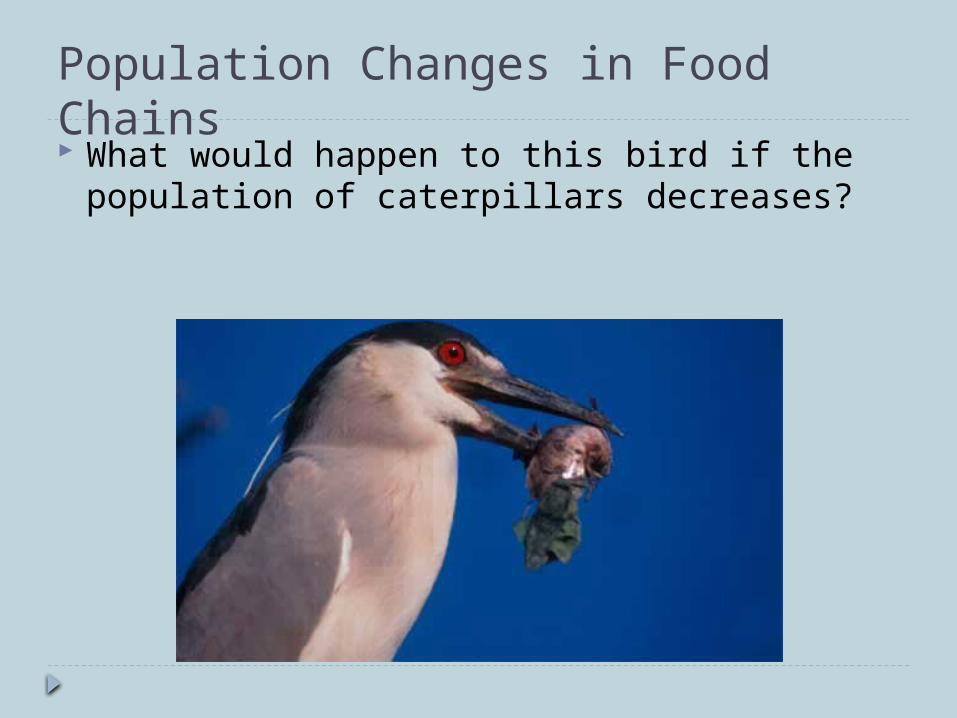
Population Changes in Food Chains What would happen to this bird if the
population of caterpillars decreases?
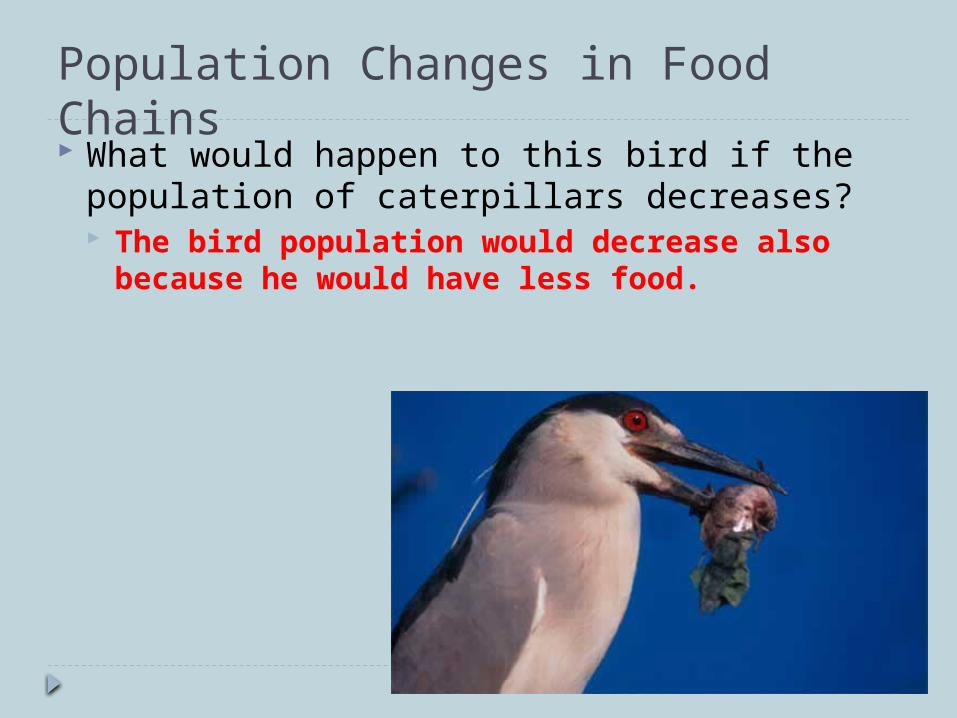
Population Changes in Food Chains What would happen to this bird if the
population of caterpillars decreases? The bird population would decrease also
because he would have less food.
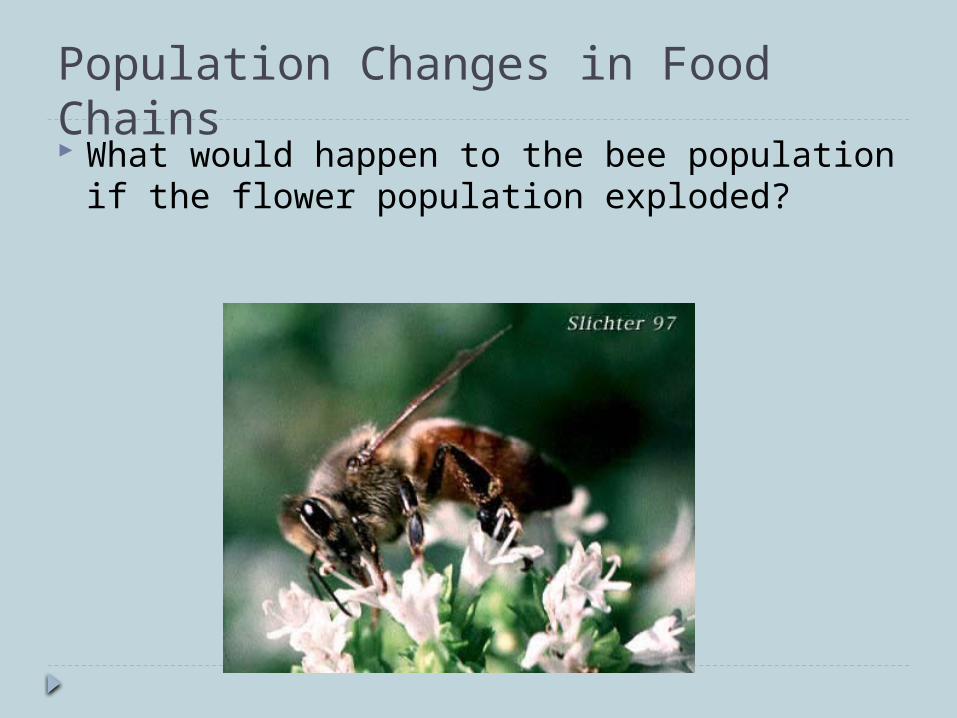
Population Changes in Food Chains What would happen to the bee population if
the flower population exploded?
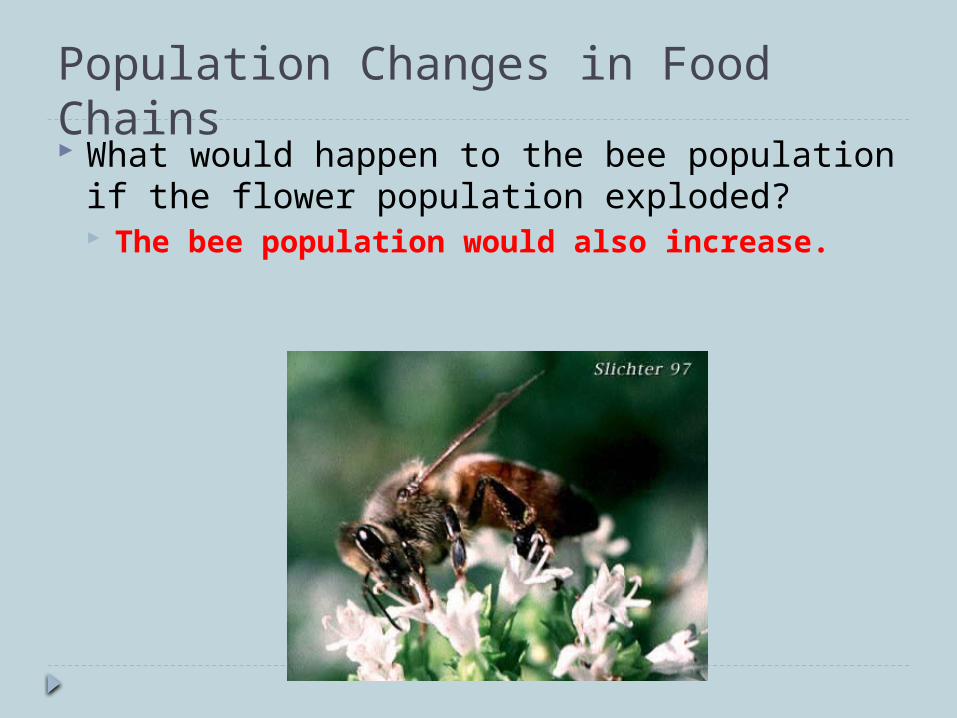
Population Changes in Food Chains What would happen to the bee population if
the flower population exploded? The bee population would also increase.
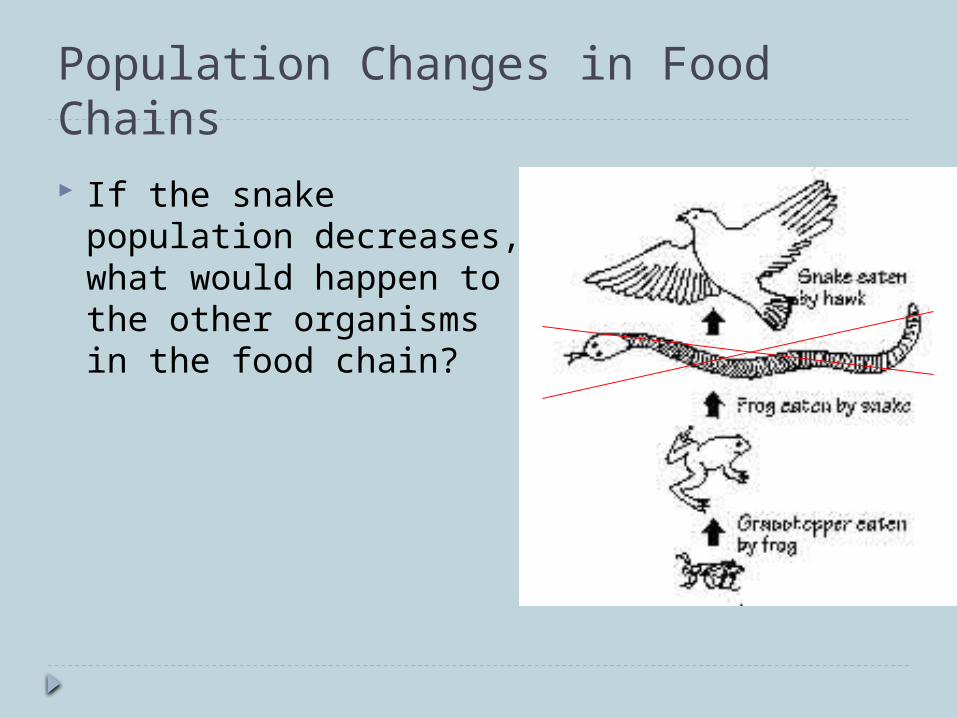
Population Changes in Food Chains If the snake population
decreases, what would happen to the other organisms in the food chain?

Population Changes in Food Chains• If the snake population
decreases:– The hawk population
decreases also (less food)– The frog population
increases (less predators eating them)
– More frogs eating the grasshoppers, so less grasshoppers
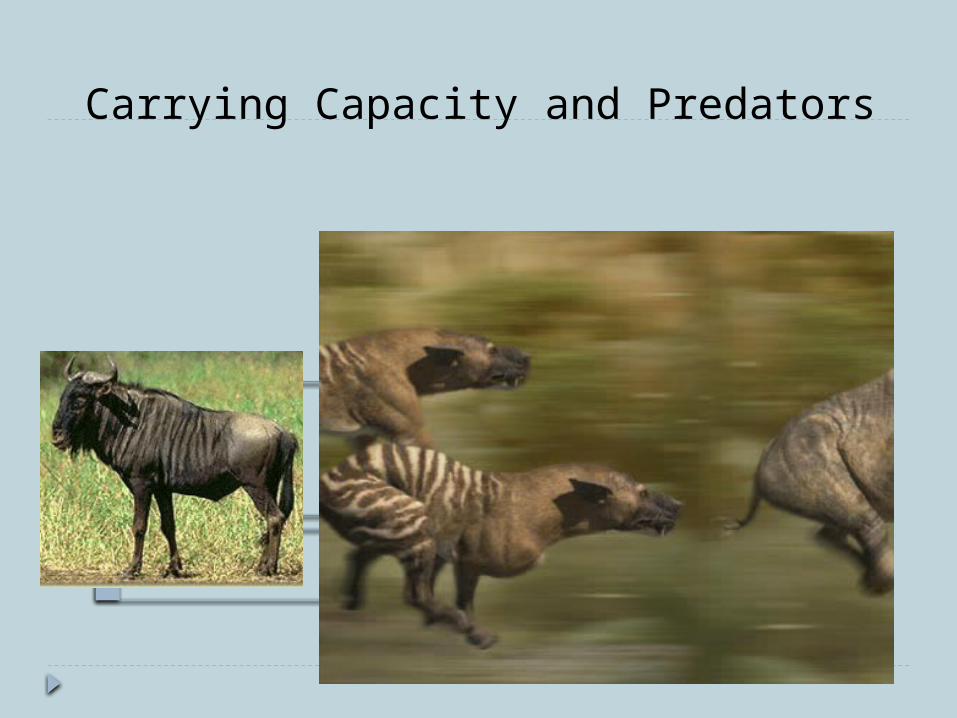
Carrying Capacity and Predators
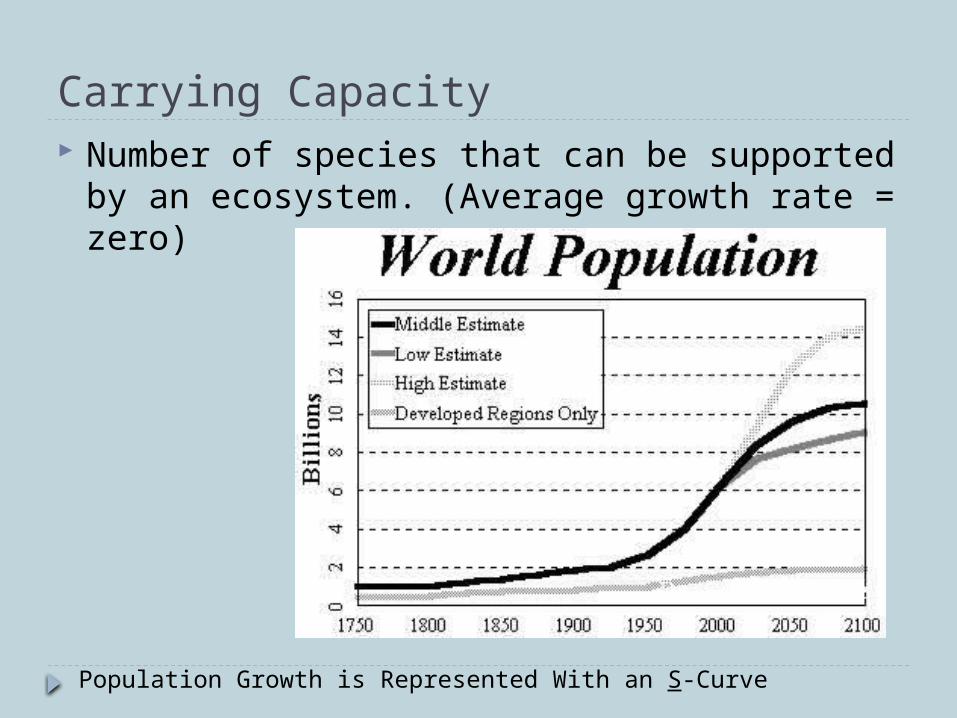
Carrying Capacity Number of species that can be supported by
an ecosystem. (Average growth rate = zero)
Population Growth is Represented With an S-Curve
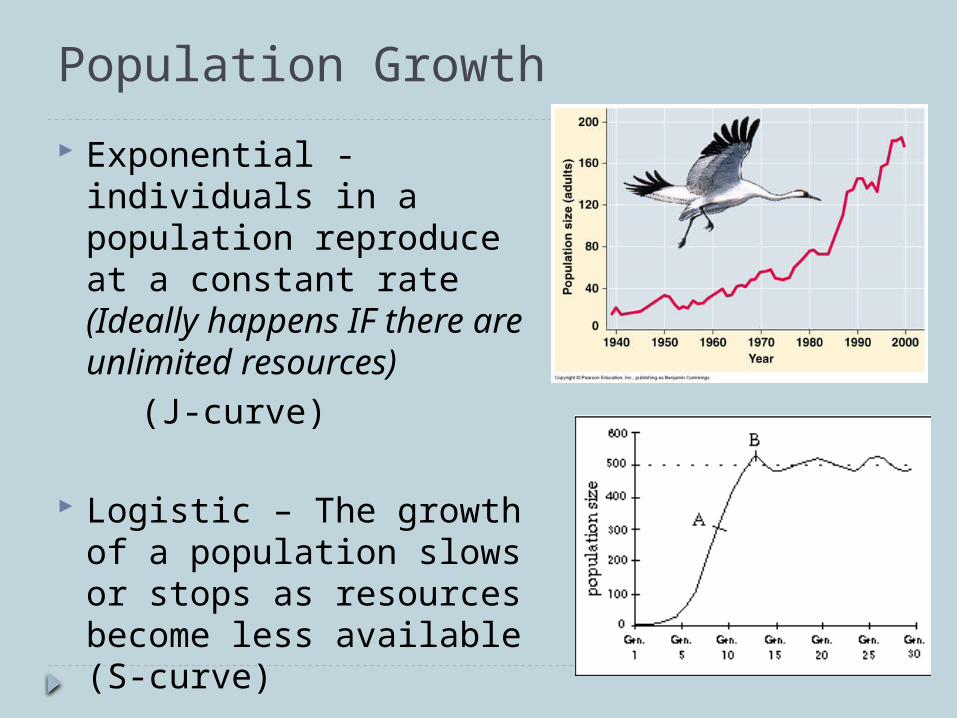
Population Growth
Exponential - individuals in a population reproduce at a constant rate (Ideally happens IF there are unlimited resources)
(J-curve)
Logistic – The growth of a population slows or stops as resources become less available (S-curve)
3 Factors that affect population size:
1. # of births Populations will grow if birthrate > death rate Populations will shrink if birthrate < death rate Populations will stay the same birthrate = death
rate 2. # of deaths 3. # of individuals that enter or leave a
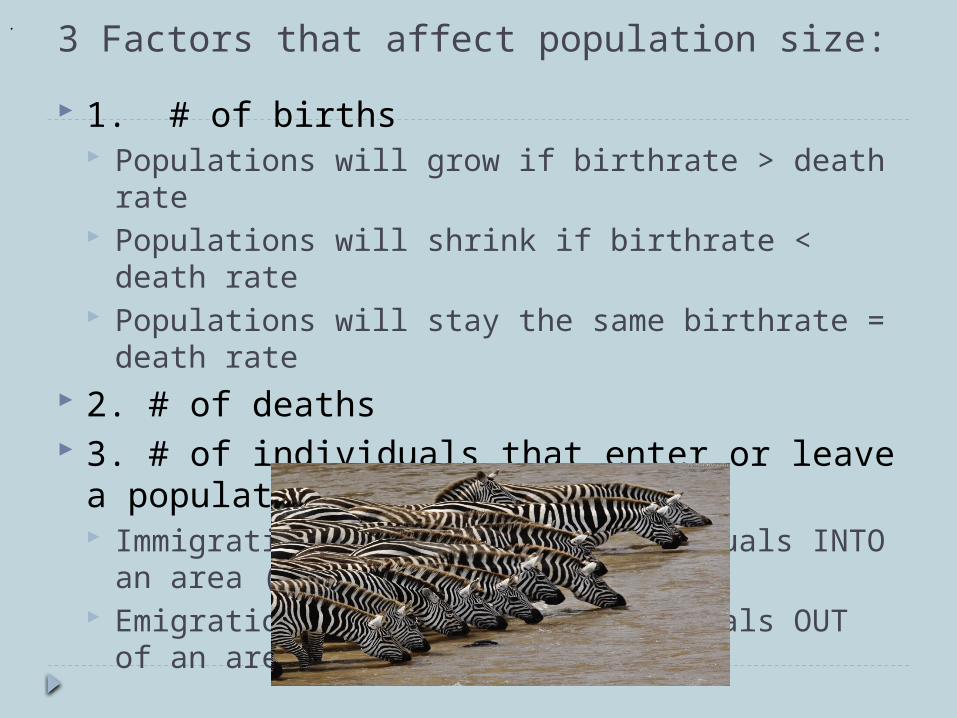
population Immigration = movement of individuals INTO an
area (growth) Emigration = movement of individuals OUT of an
area (shrink)
.
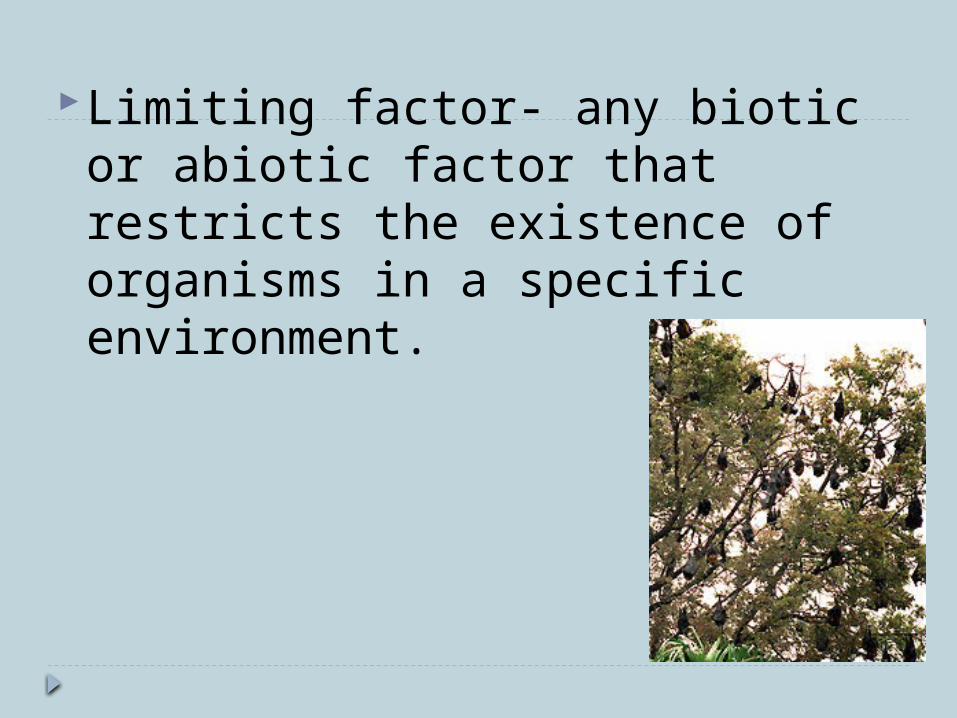
Limiting factor- any biotic or abiotic factor that restricts the existence of organisms in a specific environment.
Limiting Factors: Limit Population Growth
Limiting factors:
a. Density independent: factors that affect all members of the population equally if population is dense or not.
Natural disasters: floods, earthquakes, wildfires, tornadoes, mudslides, pollution, habitat destruction
b. Density dependent: factors that affect crowded populations
EX: competition, predation, crowding and stress, parasitism, and disease
Competition
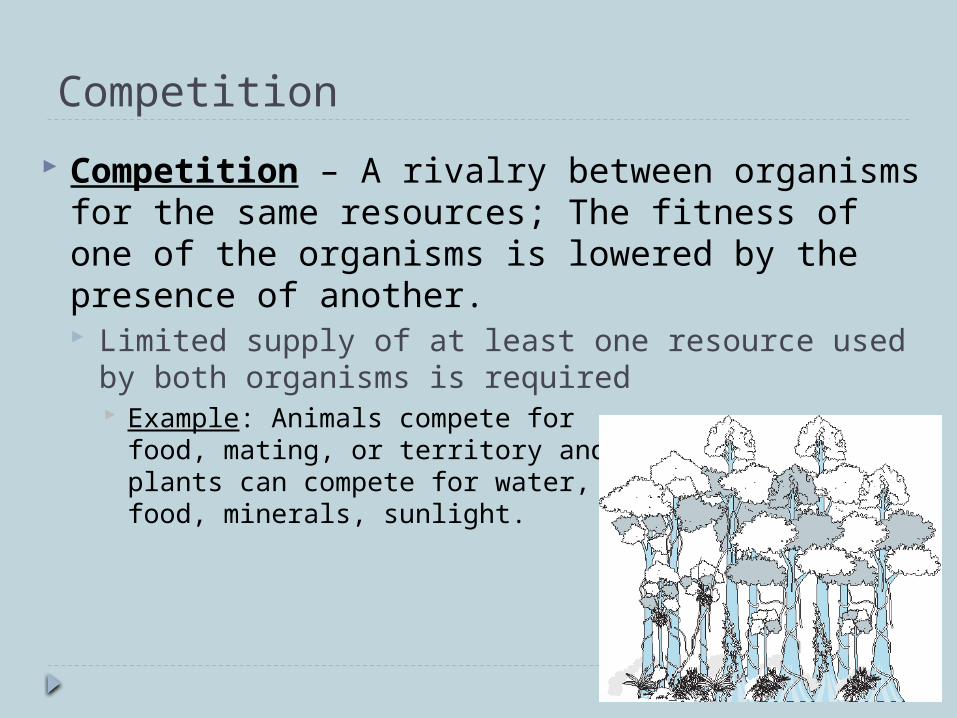
Competition – A rivalry between organisms for the same resources; The fitness of one of the organisms is lowered by the presence of another. Limited supply of at least one resource used by both
organisms is required Example: Animals compete for
food, mating, or territory and plants can compete for water, food, minerals, sunlight.
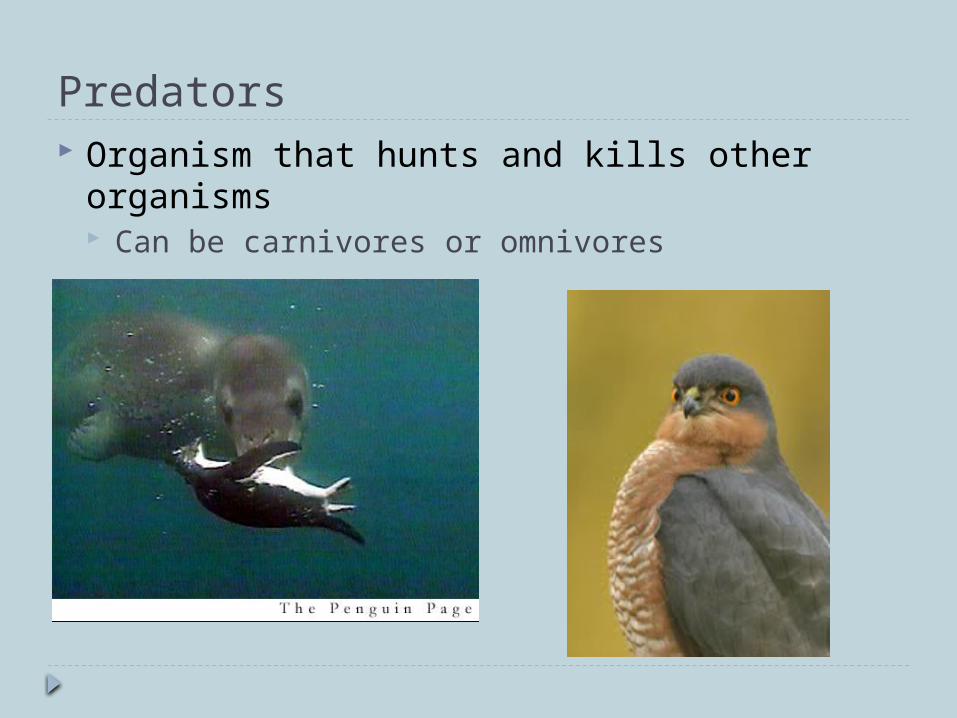
Predators Organism that hunts and kills other organisms
Can be carnivores or omnivores
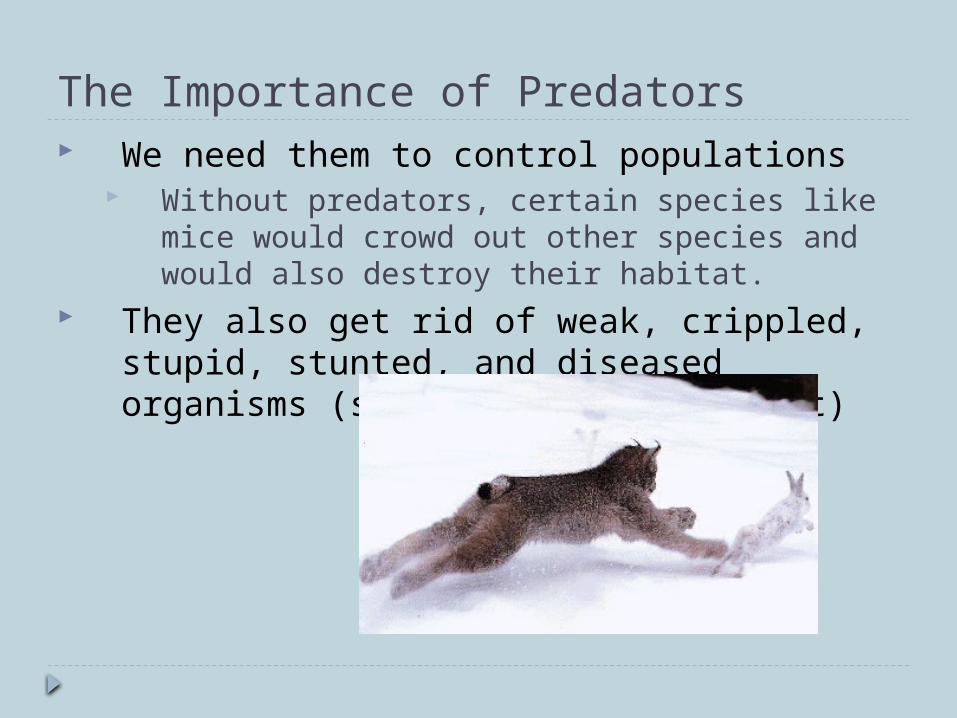
The Importance of Predators We need them to control populations
Without predators, certain species like mice would crowd out other species and would also destroy their habitat.
They also get rid of weak, crippled, stupid, stunted, and diseased organisms (survival of the fittest)
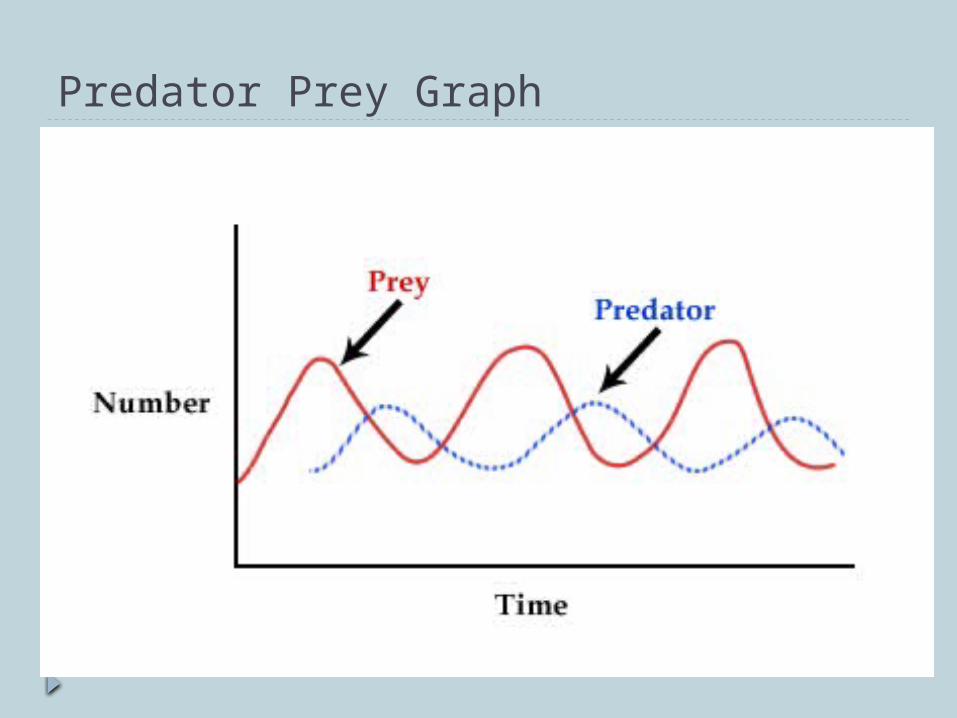
Predator Prey Graph
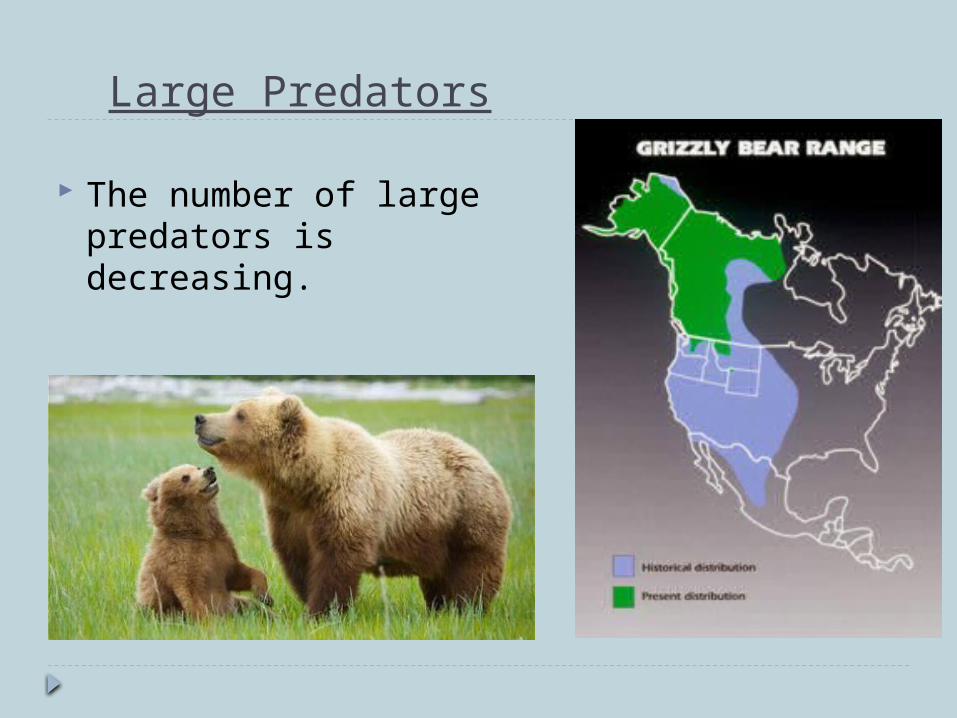
Large Predators
The number of large predators is decreasing.

Wild Rabbits in Australia Early 1900's, wild rabbits were taken from
England to Australia to be used for hunting. Since then, rabbits have multiplied exponentially
and have severely affected the ecosystem where they live.
Damages include:1. Loss of vegetation from rabbit
grazing – threatens the survival of native animals that rely on plants for food and shelter
2. Wild rabbits compete with livestock for available pasture and kill young trees & shrubs.
3. The holes they dig contribute to soil erosion by removing vegetation and disturbing soil.
Symbiotic Relationships:
Interactions between two or more organisms; Two different species start a relationship (interact) in order to ensure survival
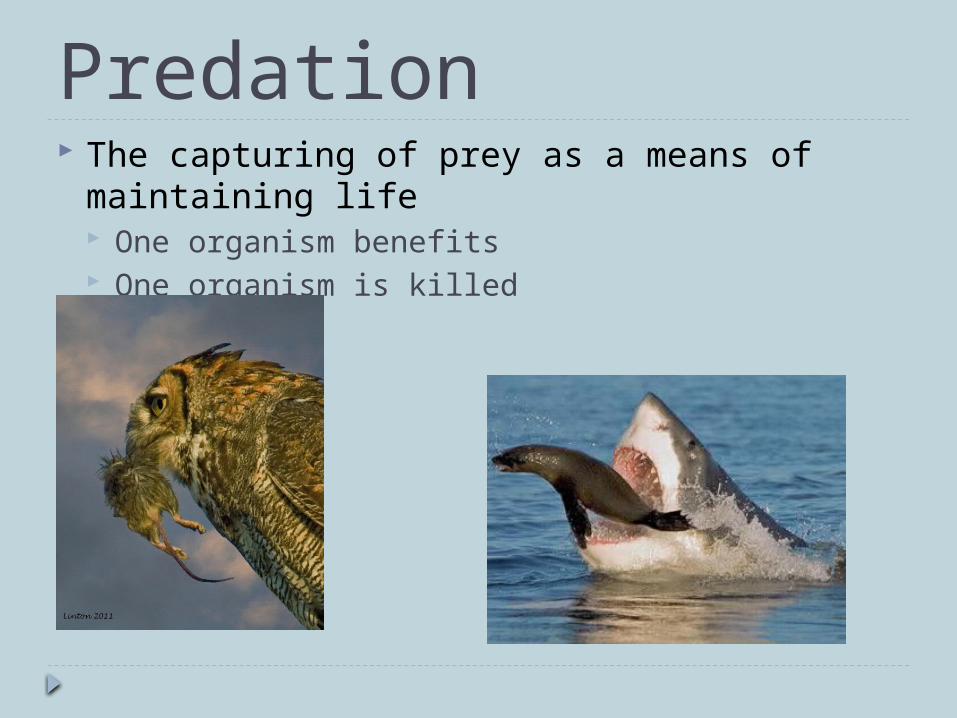
Predation The capturing of prey as a means of
maintaining life One organism benefits One organism is killed
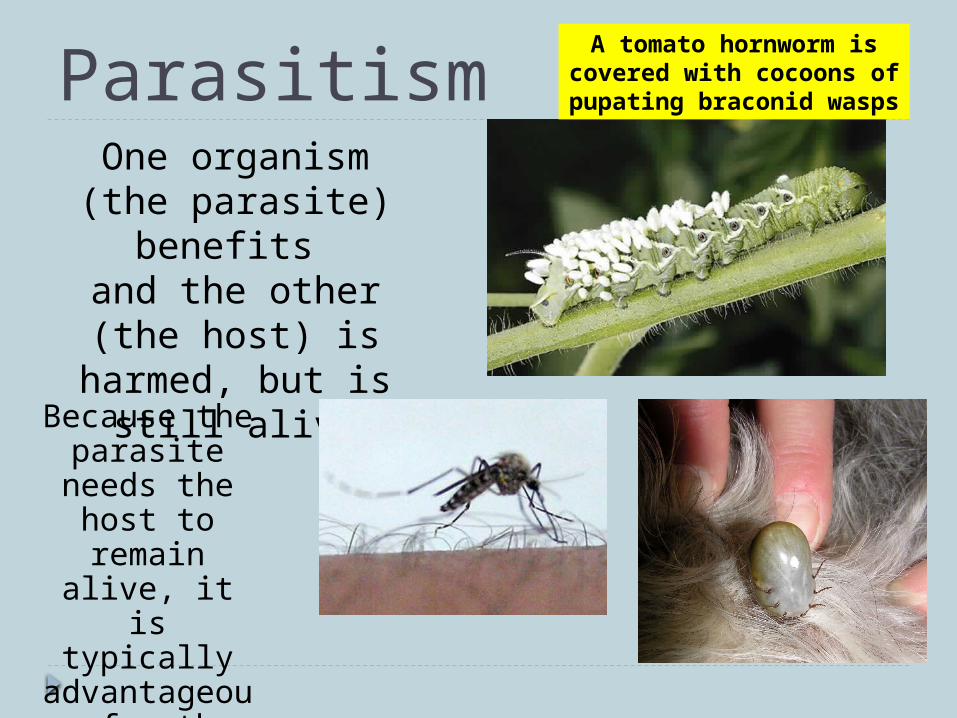
ParasitismOne organism (the parasite) benefits and the other (the
host) is harmed, but is still alive
A tomato hornworm is covered with cocoons of
pupating braconid wasps
Because the parasite needs
the host to remain alive, it
is typically advantageous for the parasite NOT to kill its
host
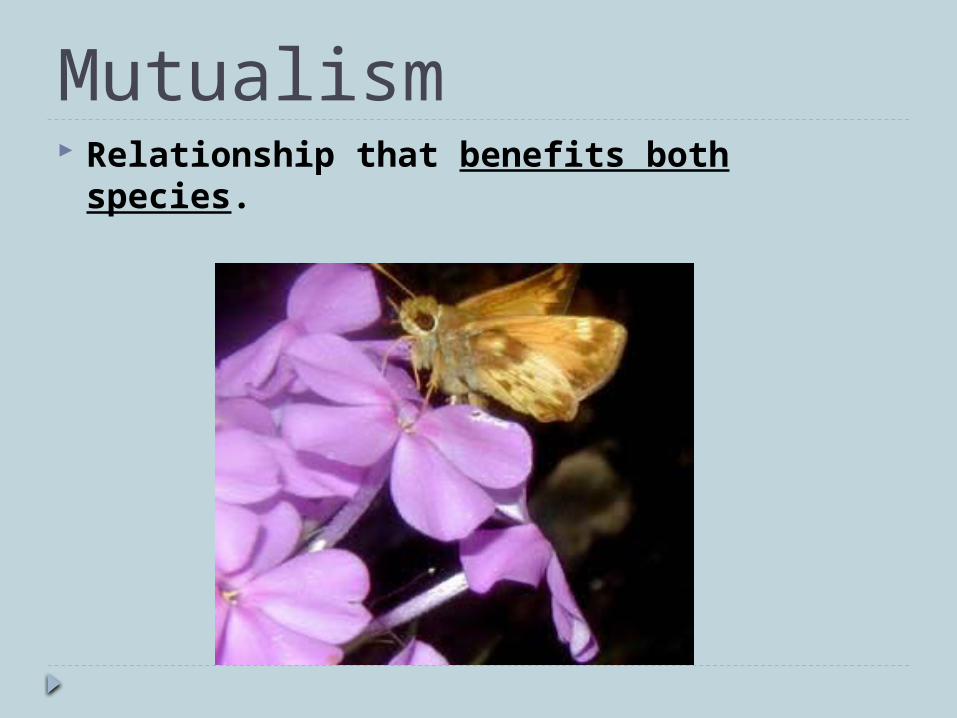
Mutualism Relationship that benefits both species.
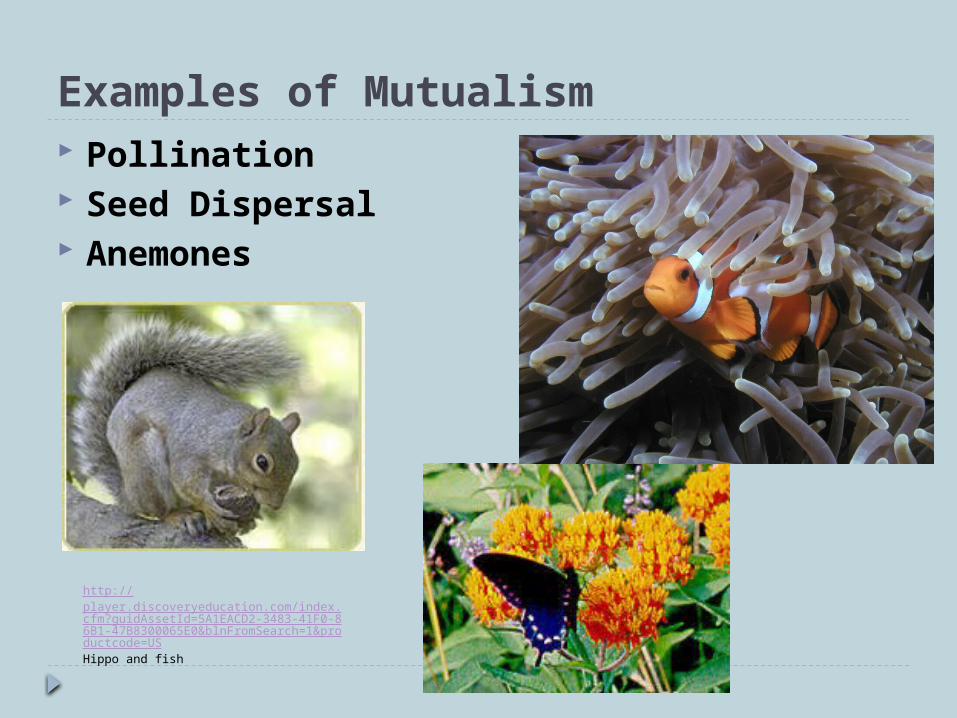
Examples of Mutualism Pollination Seed Dispersal Anemones
http://player.discoveryeducation.com/index.cfm?guidAssetId=5A1EACD2-3483-41F0-86B1-47B8300065E0&blnFromSearch=1&productcode=USHippo and fish
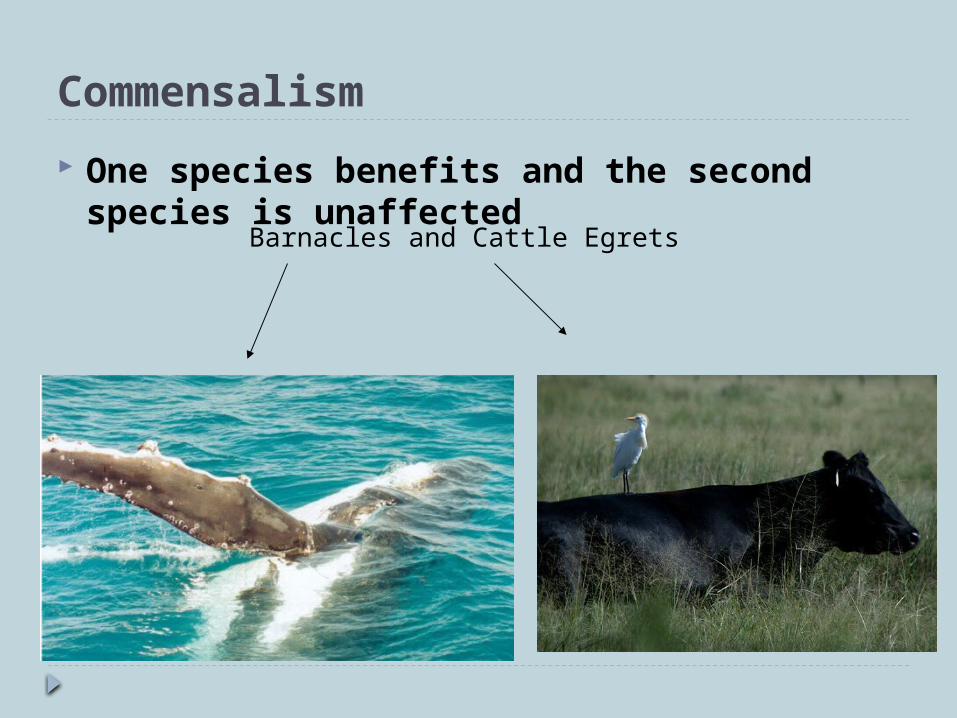
Commensalism
One species benefits and the second species is unaffected
Barnacles and Algae
Barnacles and Cattle Egrets
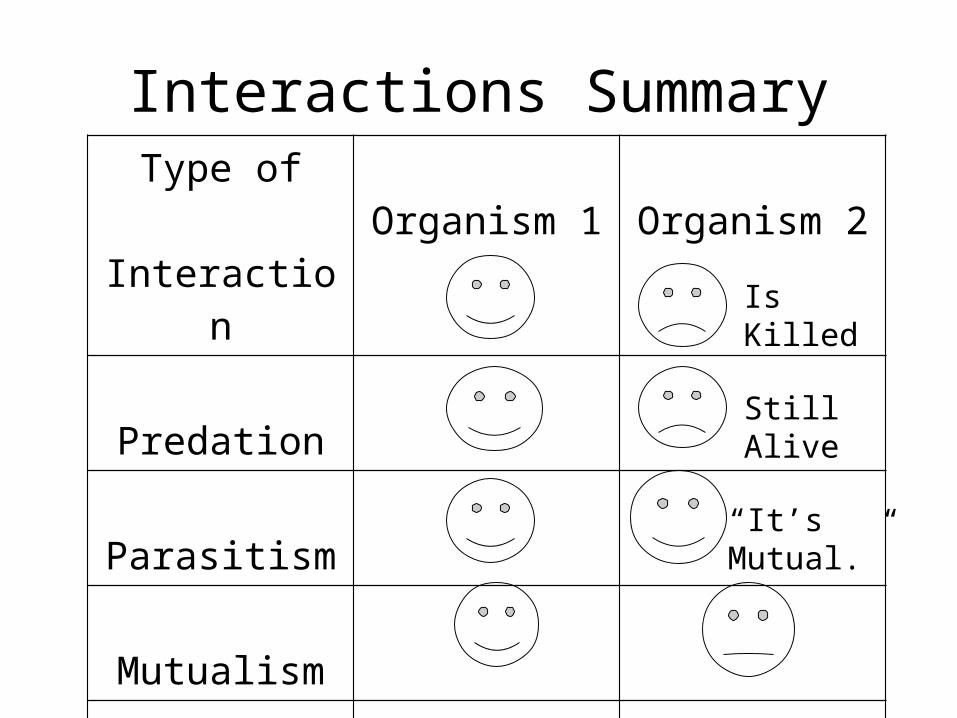
Interactions SummaryType of
Interaction Organism 1 Organism 2
Predation
Parasitism
Mutualism
Commensalism
Is Killed
Still Alive
“It’s Mutual.”