Embed Size (px)
Citation preview
1
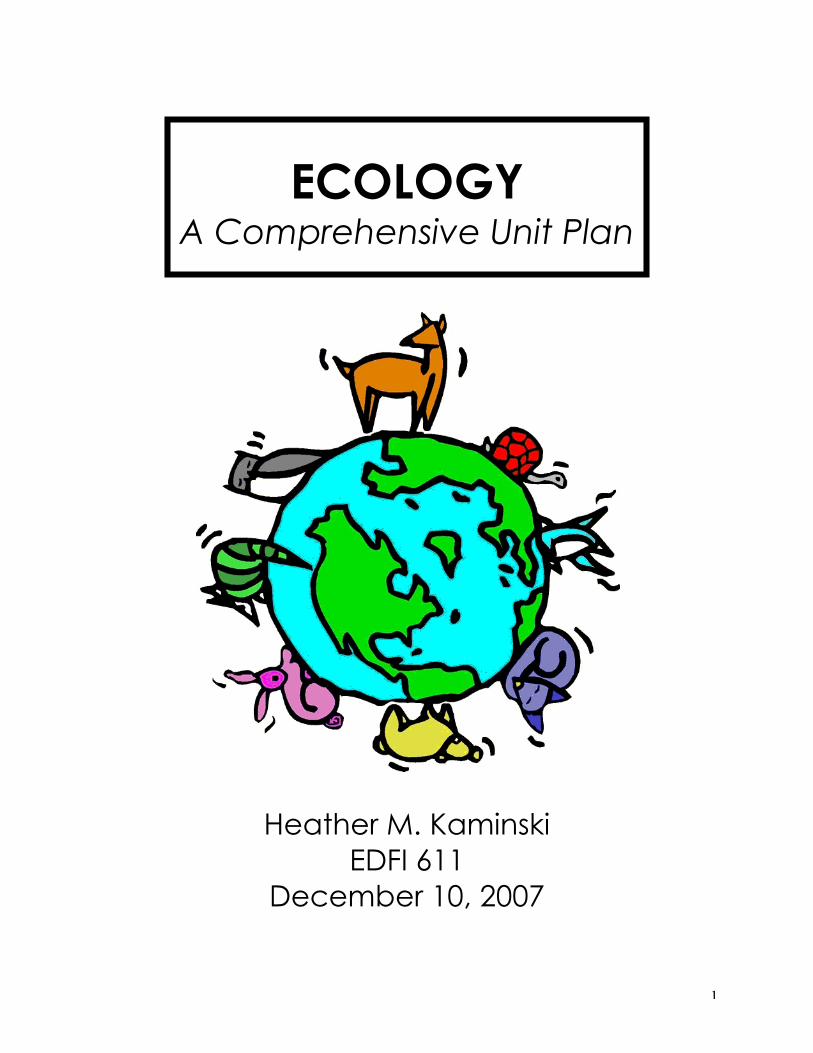
ECOLOGY
A Comprehensive Unit Plan
Heather M. Kaminski
EDFI 611 December 10, 2007
2
Table of Contents
1. Rationale / Research 3-6
2. Explanation of Unit Design 7-8
3. Who’s Who in an Ecosystem 9-18
4. Food Webs and Chains 19-37
5. Biological Interactions 38-56
6. Water Cycle 57-70
7. Carbon Cycle 71-79
8. Nitrogen Cycle 80-84
9. Atmospheric Issues 85-95
10. Biomagnification 96-103
11. References 104-106
3
Rationale / Research
For my course project I am designing a set of materials focused around an
Ecology Unit for a high school Biology course. The rationale behind my decision
is two fold, first students have a difficult time understanding the cycling of
materials, energy, and food within an ecosystem. Students have
misconceptions about how organisms obtain food; they believe it is taken
directly from the environment, as we do. In order to better understand the flow
of energy students must be able to understand that organisms obtain food in a
variety of ways and this concept is directly related to how energy flows through
and ecosystem.
Second, as district we are focusing on varying instruction which is closely related
to differentiated instruction. We are working to develop all of our lessons around
the idea that all students learn differently, thus we are developing lessons and
projects that allow students to have a variety of presentations and activities that
focus on a wide range of learning abilities. All of the lessons developed will be
focused around the student learning objectives and standards set forth by the
Ohio Department of Education. (Ohio Department of Education Center for
Curriculum and Assessment, 2003).
Differentiated instruction can be defined as, “ as a process to approach
teaching and learning for students of differing abilities in the same class, the
intent of differentiating instruction is to maximize each student’s growth and
4
individual success by meeting each student where he or she is, and assisting in
the learning process”. (Hall, 2002). The idea behind differentiated instruction
not only allows for students to decide what is the best activity or project for
themselves but it allows the student to fell some sense of entitlement and control
over how they learn.
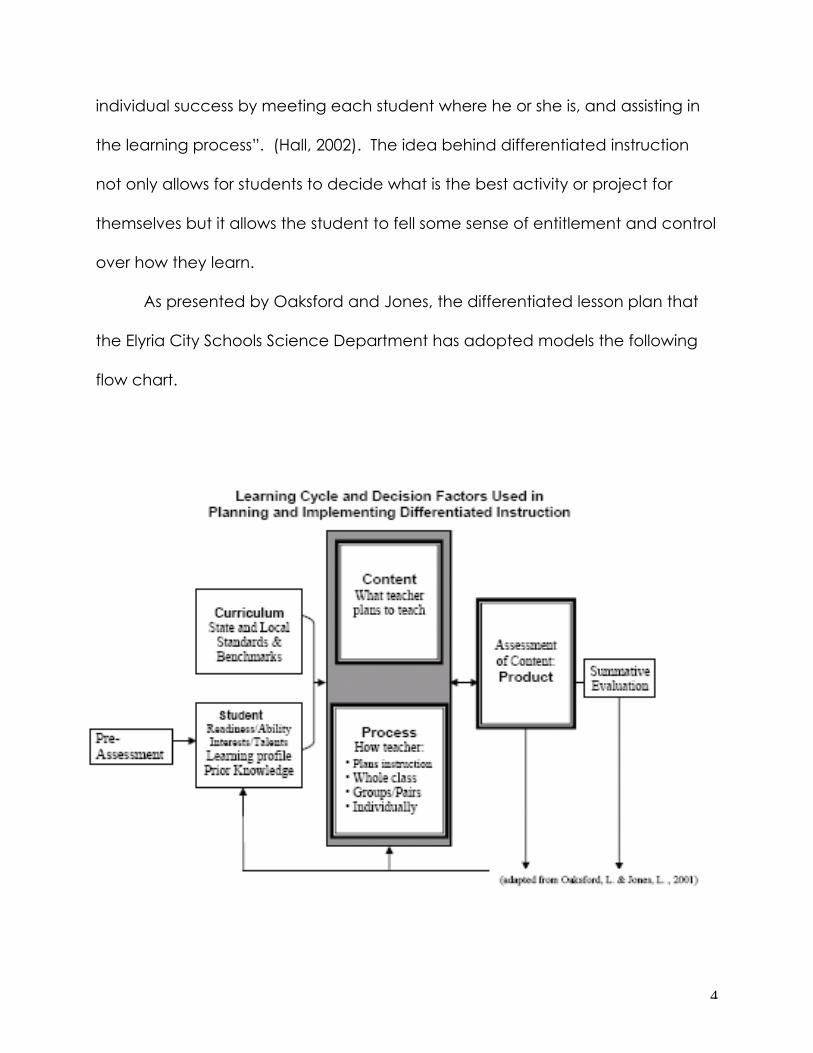
As presented by Oaksford and Jones, the differentiated lesson plan that
the Elyria City Schools Science Department has adopted models the following
flow chart.
5
We are looking to develop all students on a variety of levels while giving them
the opportunity to choose how they learn. The lesson plans throughout this unit
will model the previous flow chart and will address a variety of learning as well as
multiple types of assessments. The final assessment within the unit will be the
district assessment, developed by the Elyria City Schools Science Department;
this assessment will be found at the end of the Unit Plan. Many of the lesson
plans throughout this unit will have a variety of presentation materials and
activities to focus on all learning styles. For those students who are “ahead” of
the class or w ho seem to get the material very quickly, there are enrichment
activities and many reading activities to supplement each lesson. A lesson plan
which uses a variety of teaching techniques, in my opinion, has been found to
develop all students and focuses on the varying interests, abilities, and
achievement levels of all students it can be found as a valuable tool for the
development of the student’s population.
6
Bibliography
Hall, Tracy. (June 2002) Differentiated instruction, effective classroom practices report, Wakefield, MA: National Center for Assessing the General Curriculum. http://www.cast.org/system/galleries/download/ncac/DifInstruc.pdf
Oaksford, L. & Jones, L. (2001) Differentiated instruction abstract. Tallahassee, FL:
Leon County Schools. Ohio Department of Education Center for Curriculum and Assessment. (2003).
Academic content standard K-12 science. Columbus, Ohio: Ohio Department of Education
7
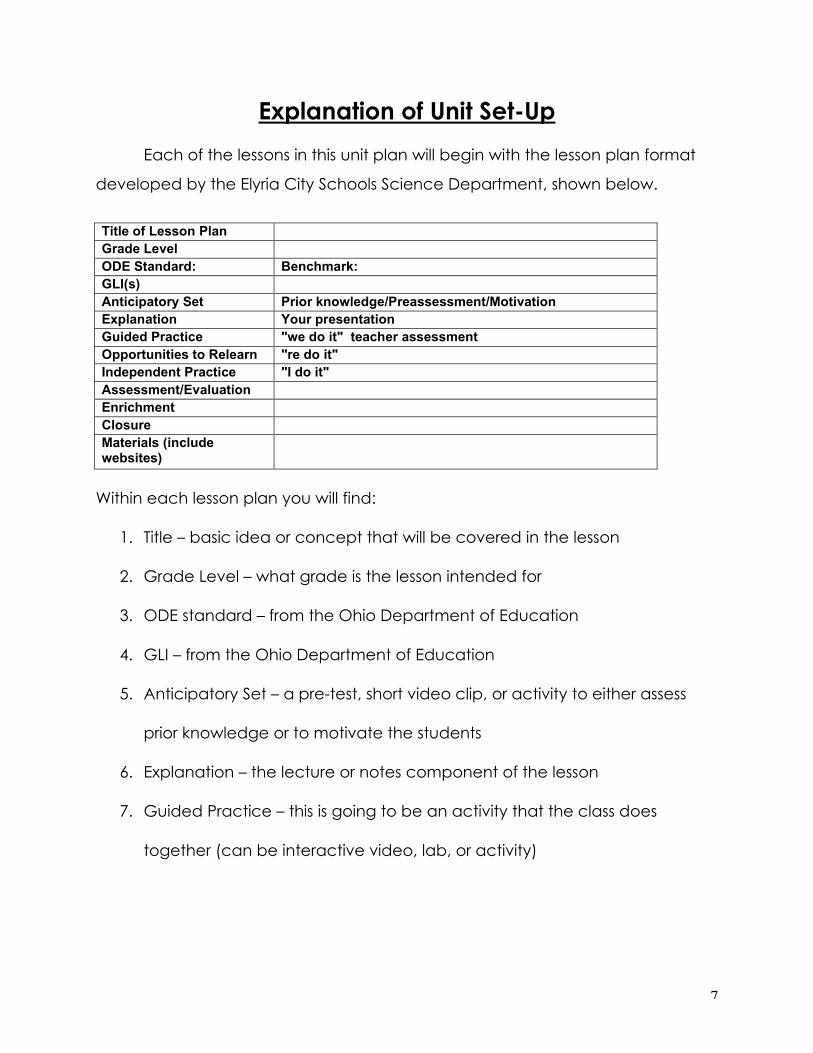
Explanation of Unit Set-Up
Each of the lessons in this unit plan will begin with the lesson plan format
developed by the Elyria City Schools Science Department, shown below.
Title of Lesson Plan Grade Level ODE Standard: Benchmark: GLI(s) Anticipatory Set Prior knowledge/Preassessment/Motivation Explanation Your presentation Guided Practice "we do it" teacher assessment Opportunities to Relearn "re do it" Independent Practice "I do it" Assessment/Evaluation Enrichment Closure Materials (include websites)
Within each lesson plan you will find:
1. Title – basic idea or concept that will be covered in the lesson
2. Grade Level – what grade is the lesson intended for
3. ODE standard – from the Ohio Department of Education
4. GLI – from the Ohio Department of Education
5. Anticipatory Set – a pre-test, short video clip, or activity to either assess
prior knowledge or to motivate the students
6. Explanation – the lecture or notes component of the lesson
7. Guided Practice – this is going to be an activity that the class does
together (can be interactive video, lab, or activity)
8
8. Opportunities to Relearn – this is going to be a supplement to the concept
being covered (student will complete basic assessment, or correct
previous work – then we go over the material)
9. Independent Practice – generally a lab followed by assessment questions,
graphs, or journaling
10. Assessment / Evaluation – because evaluations are done throughout the
unit, this going to be tied into what was previously done, in most cases.
This will always conclude with the district assessment at the end of the unit.
11. Enrichment – generally an article related to the concept and its
relationship to the students. This will be supplemented with a writing
assignment or learning activity.
12. Closure – review what was done in the lesson and how it will relate to
where we are going
13. Materials – for this unit, the materials will be imbedded in the paper, this
will also include a reference page at the end of the unit with all websites
used for pictures and graphs.
In addition to the previous lesson plan, I will also imbed all the materials for the
lesson into the paper.

9
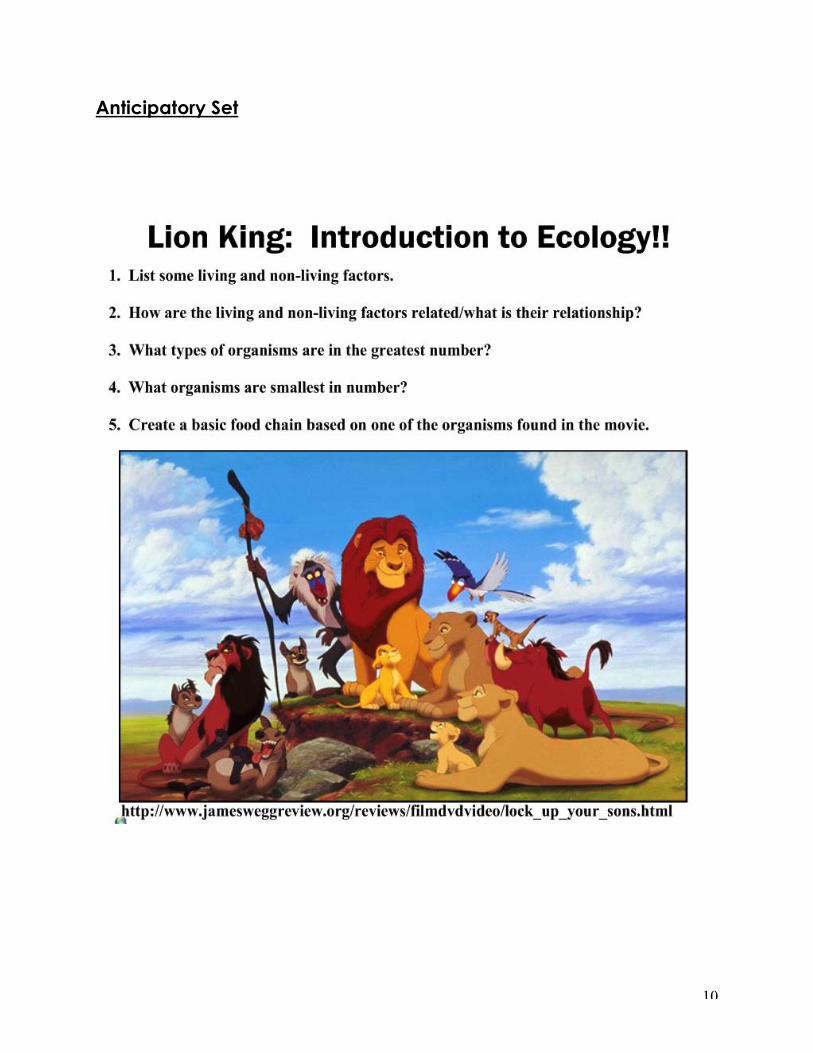
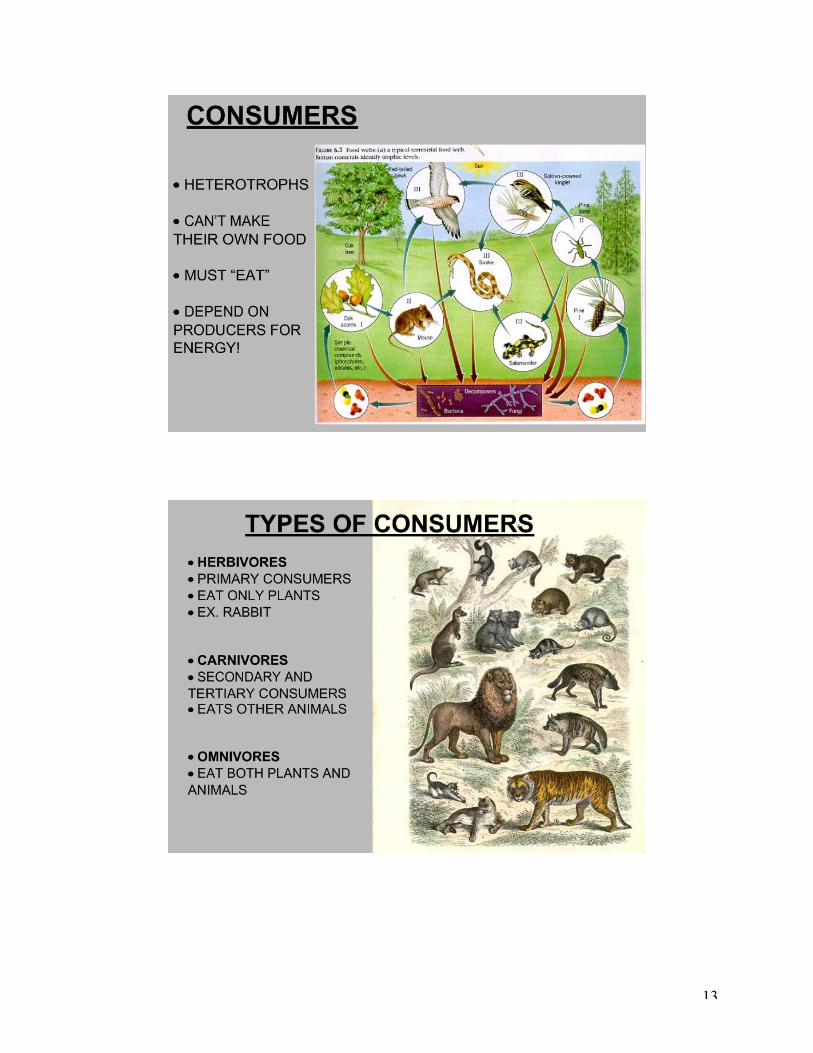
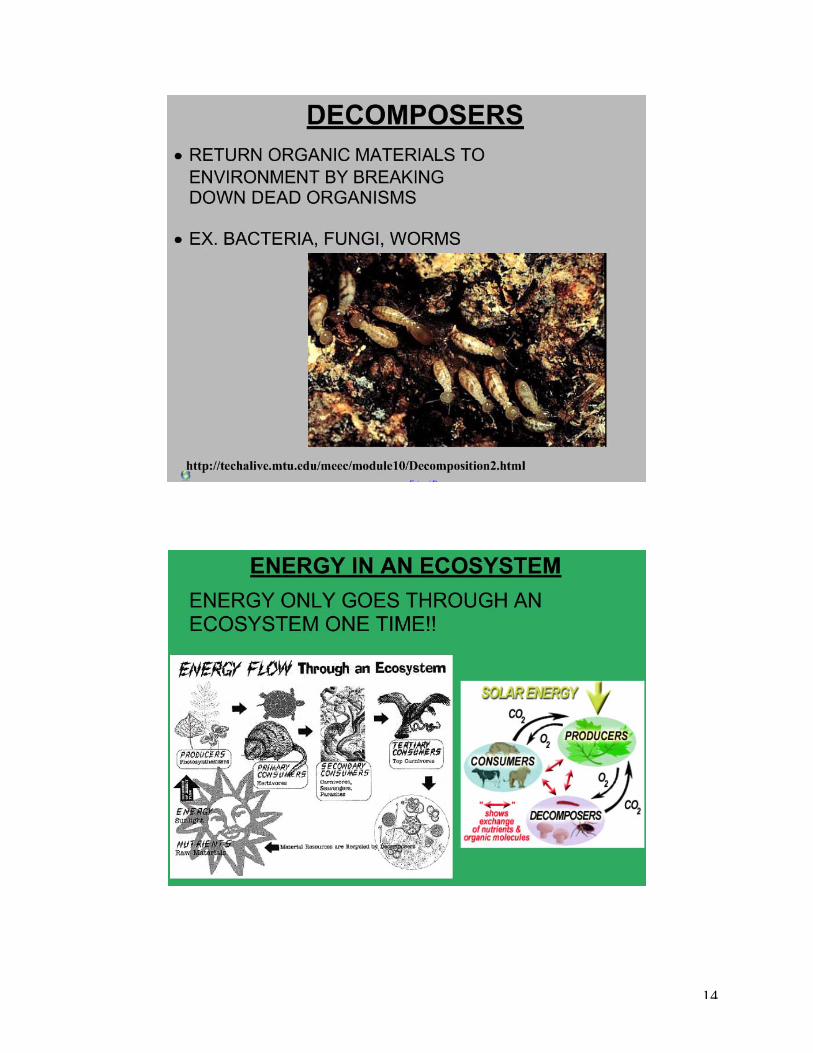
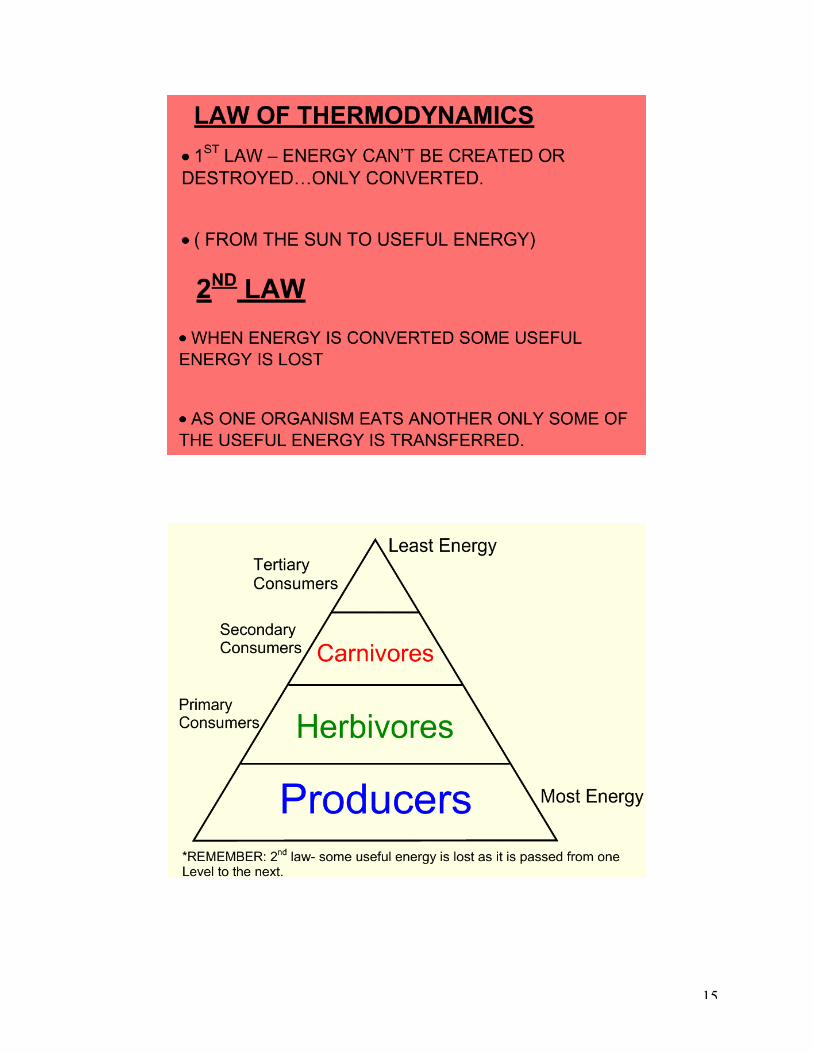
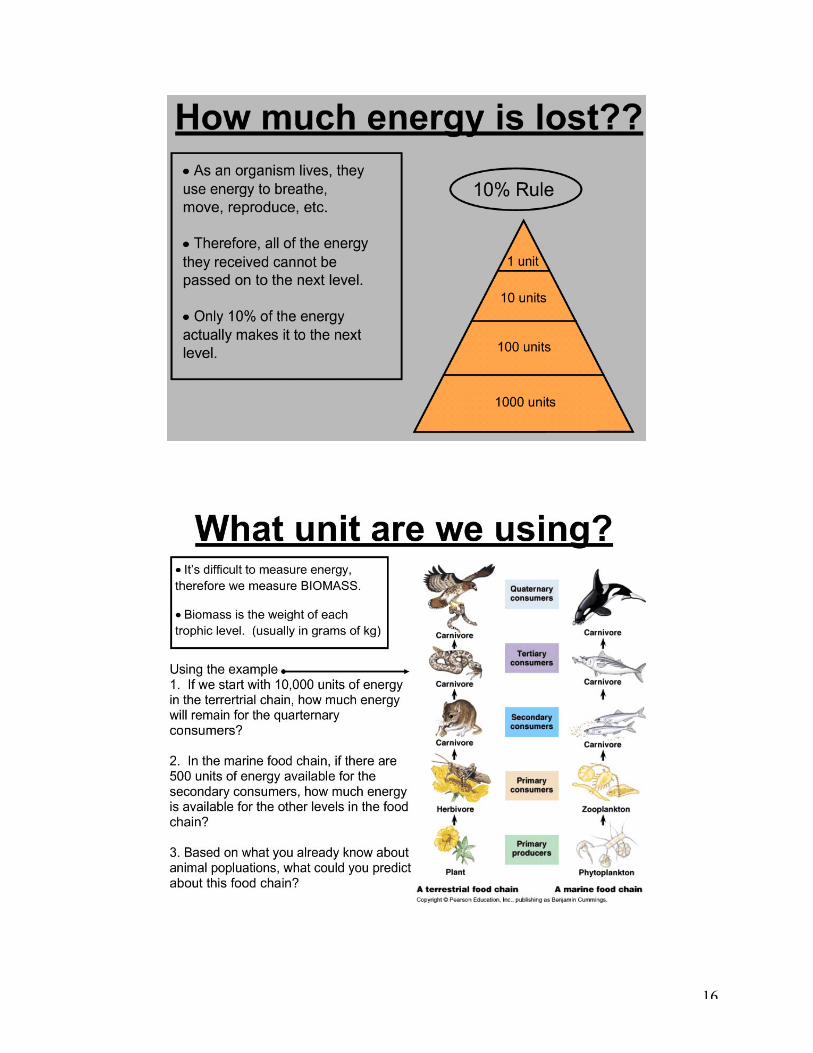
Lesson One: Who’s Who in an Ecosystem
Title of Lesson Plan Who's Who in an Ecosystem? Grade Level 10 ODE Standard: Explain the structure and function of ecosystems and
relate how ecosystems change over time. GLI(s) Describe how matter cycles and energy flows through
different levels of organization in living systems and between living systems and the physical environment. Explain how some energy is stored and much is dissipated into the environment as thermal energy (e.g., food webs and energy pyramids). (1992/LS - 9). Relate how distribution and abundance of organisms and populations in an ecosystem are limited by the ability of the ecosystem to recycle materials and the availability of matter, space and energy. (1999/LS - 16)
Anticipatory Set Show the beginning scene from The Lion King. Prior to showing clip, give students the 5 questions to think about while watching (found in the share folder (Lion King Intro). Discuss with the students the possible answers to the questions posed.
Explanation Notes: "Who's who in an Ecosystem" Guided Practice Practice built into presentation, variety of internet
practice and questions. Opportunities to Relearn Revisit the Lion King: answer questions related to movie Independent Practice "The Price of Butter Depends on the Number of Old
Maids" Assessment/Evaluation Final product from the Independent practice and district
assessment. Enrichment United Streaming Video: Food Chains and Webs Closure Write down the 3 most important things you learned from
the lesson. These ideas will then be shared with the rest of the class.
Materials (include websites)
At the end of the Unit plan: reference page.
10
Anticipatory Set
11
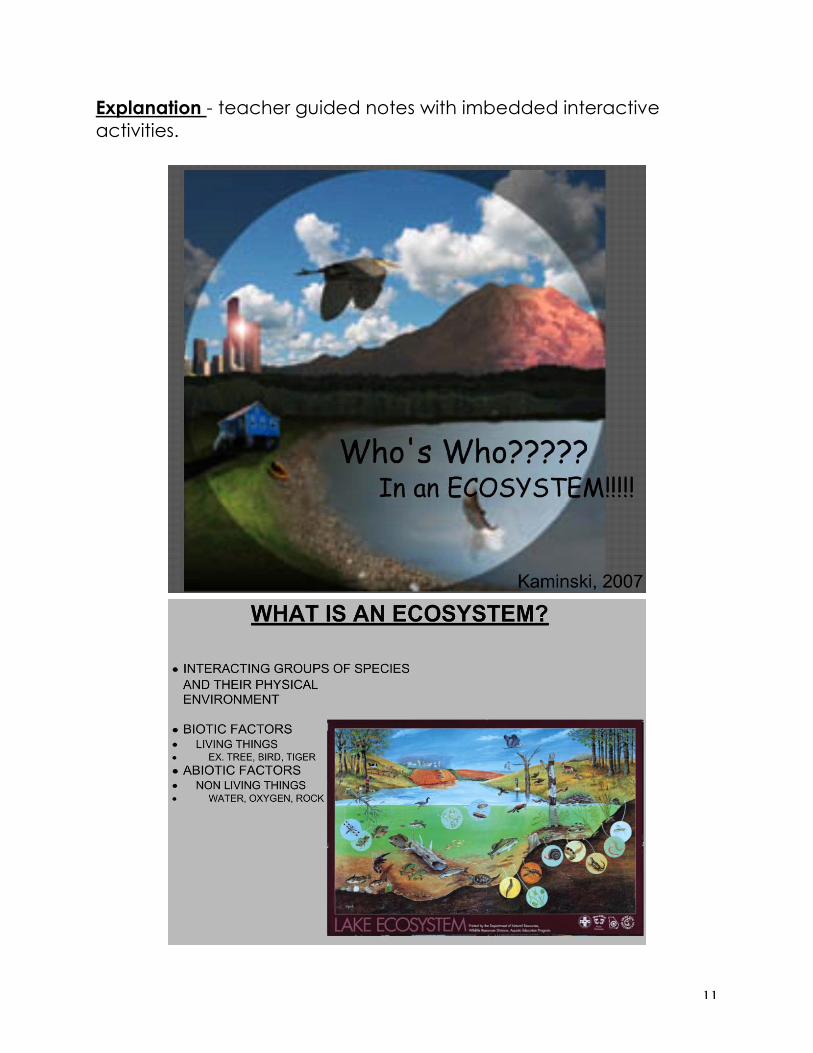
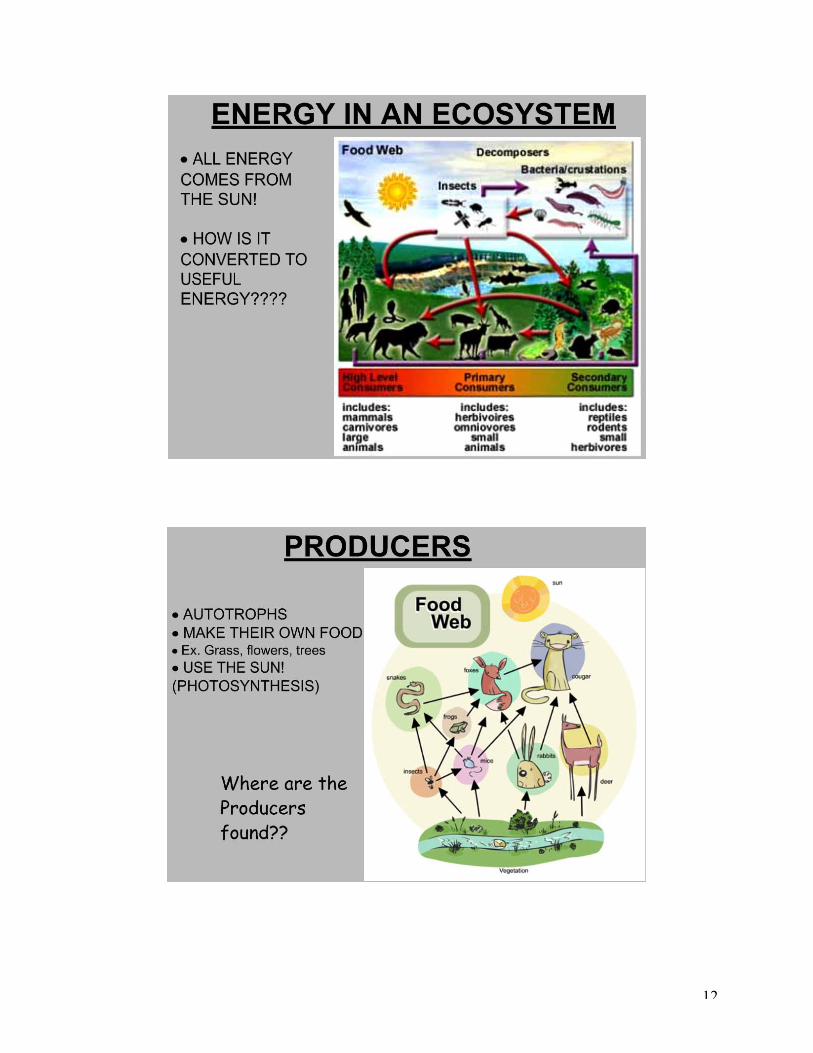
Explanation - teacher guided notes with imbedded interactive activities.
12
13
14
15
16
17
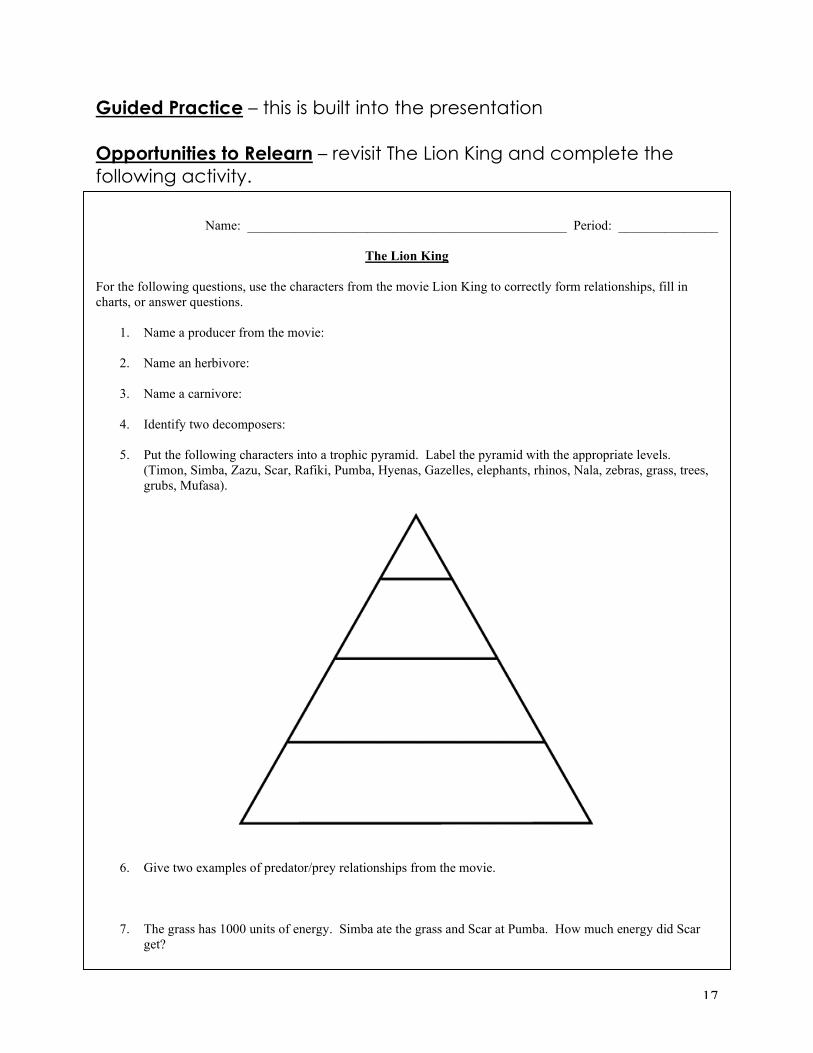
Guided Practice – this is built into the presentation Opportunities to Relearn – revisit The Lion King and complete the following activity.
Name: ________________________________________________ Period: _______________
The Lion King
For the following questions, use the characters from the movie Lion King to correctly form relationships, fill in charts, or answer questions.
1. Name a producer from the movie:
2. Name an herbivore:
3. Name a carnivore:
4. Identify two decomposers:
5. Put the following characters into a trophic pyramid. Label the pyramid with the appropriate levels. (Timon, Simba, Zazu, Scar, Rafiki, Pumba, Hyenas, Gazelles, elephants, rhinos, Nala, zebras, grass, trees, grubs, Mufasa).
6. Give two examples of predator/prey relationships from the movie.
7. The grass has 1000 units of energy. Simba ate the grass and Scar at Pumba. How much energy did Scar get?
18
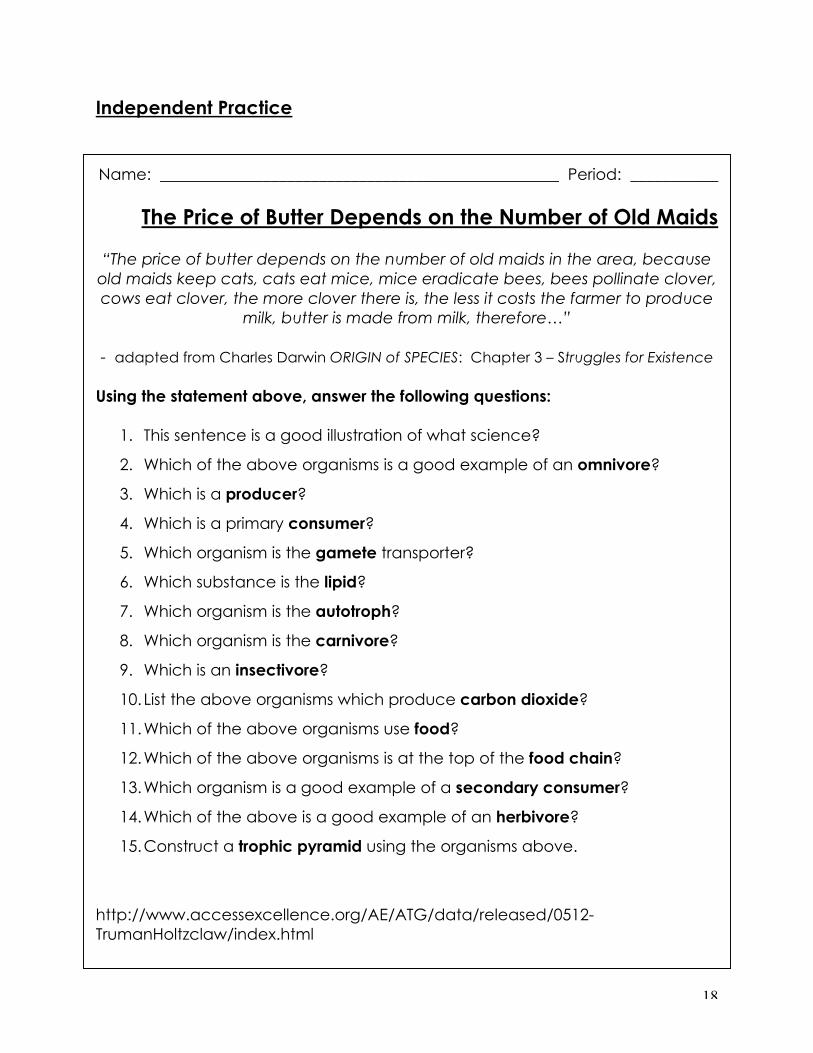
Independent Practice Name: __________________________________________________ Period: ___________
The Price of Butter Depends on the Number of Old Maids
“The price of butter depends on the number of old maids in the area, because old maids keep cats, cats eat mice, mice eradicate bees, bees pollinate clover, cows eat clover, the more clover there is, the less it costs the farmer to produce
milk, butter is made from milk, therefore…”
- adapted from Charles Darwin ORIGIN of SPECIES: Chapter 3 – Struggles for Existence
Using the statement above, answer the following questions:
1. This sentence is a good illustration of what science?
2. Which of the above organisms is a good example of an omnivore?
3. Which is a producer?
4. Which is a primary consumer?
5. Which organism is the gamete transporter?
6. Which substance is the lipid?
7. Which organism is the autotroph?
8. Which organism is the carnivore?
9. Which is an insectivore?
10. List the above organisms which produce carbon dioxide?
11. Which of the above organisms use food?
12. Which of the above organisms is at the top of the food chain?
13. Which organism is a good example of a secondary consumer?
14. Which of the above is a good example of an herbivore?
15. Construct a trophic pyramid using the organisms above.
http://www.accessexcellence.org/AE/ATG/data/released/0512-TrumanHoltzclaw/index.html
19
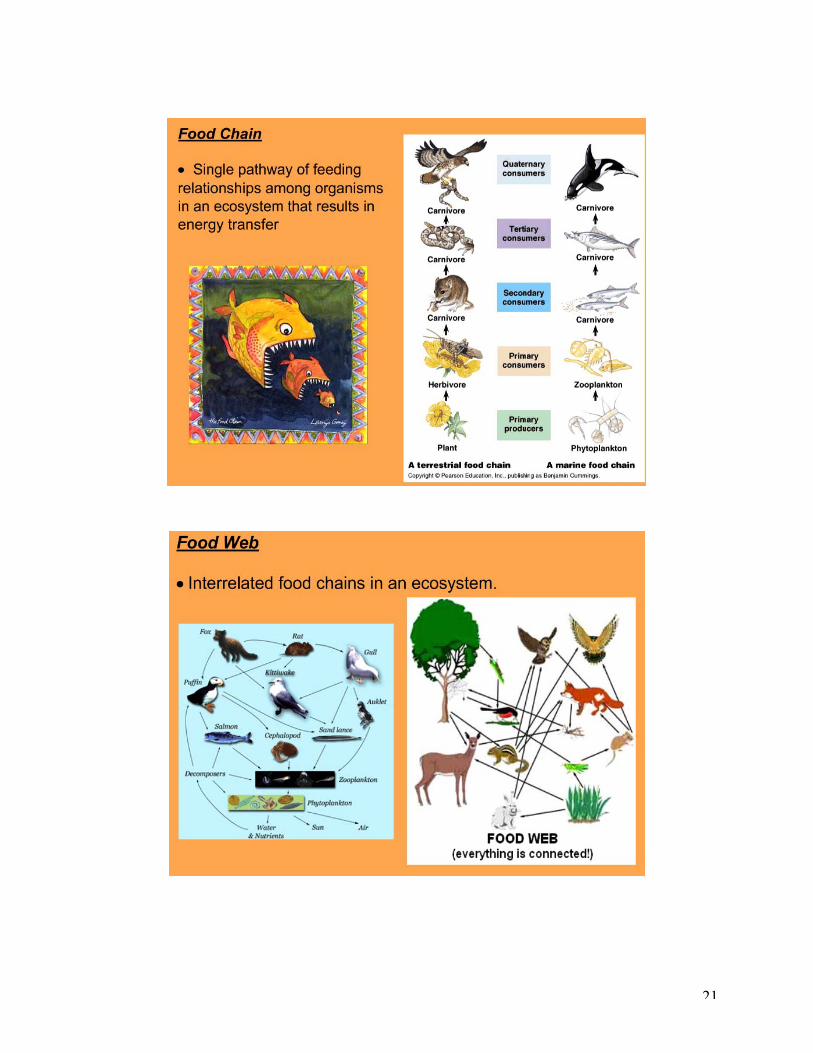
Lesson Two: Food Webs and Chains Title of Lesson Plan Food Chains and Food Webs Grade Level 10 ODE Standard:
Explain the structure and function of ecosystems and relate how ecosystems change over time. GLI(s) Describe how matter cycle and energy flows through different levels of organization in living
systems and between living systems and the physical environment. Explain how some energy is stored and much is dissipated into the environment as thermal energy (e.g., food webs and energy pyramids). (1992/LS-9)
Anticipatory Set Food Chain Pre-Asses (in Ecology Folder) Explanation Food Chain Smart notes Guided Practice Practice with a variety of different websites (found below or on Smart presentation)
http://www.ecokids.ca/pub/eco_info/topics/frogs/chain_reaction/index.cfm http://teacher.scholastic.com/activities/explorer/ecosystems/be_an_explorer/map/line_experiment14.swf http://www.gould.edu.au/foodwebs/kids_web.htm http://www.harcourtschool.com/activity/food/food_menu.html
Opportunities to Relearn
Food Chain and Web wkst
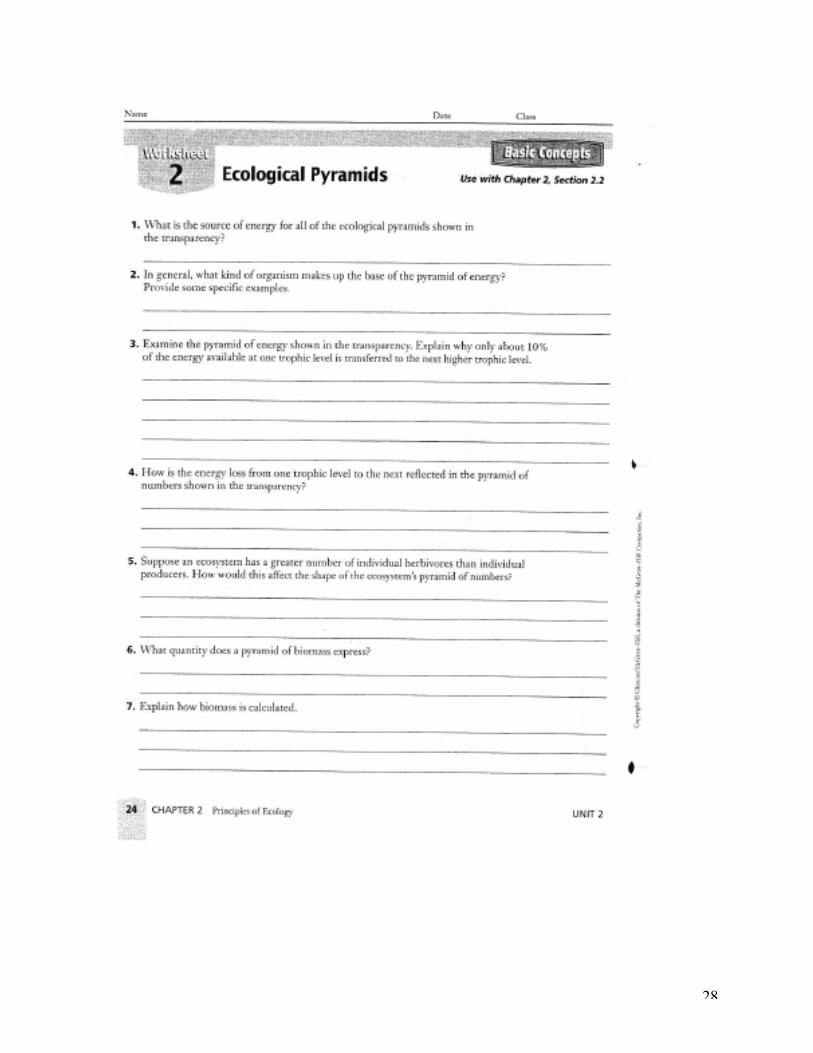
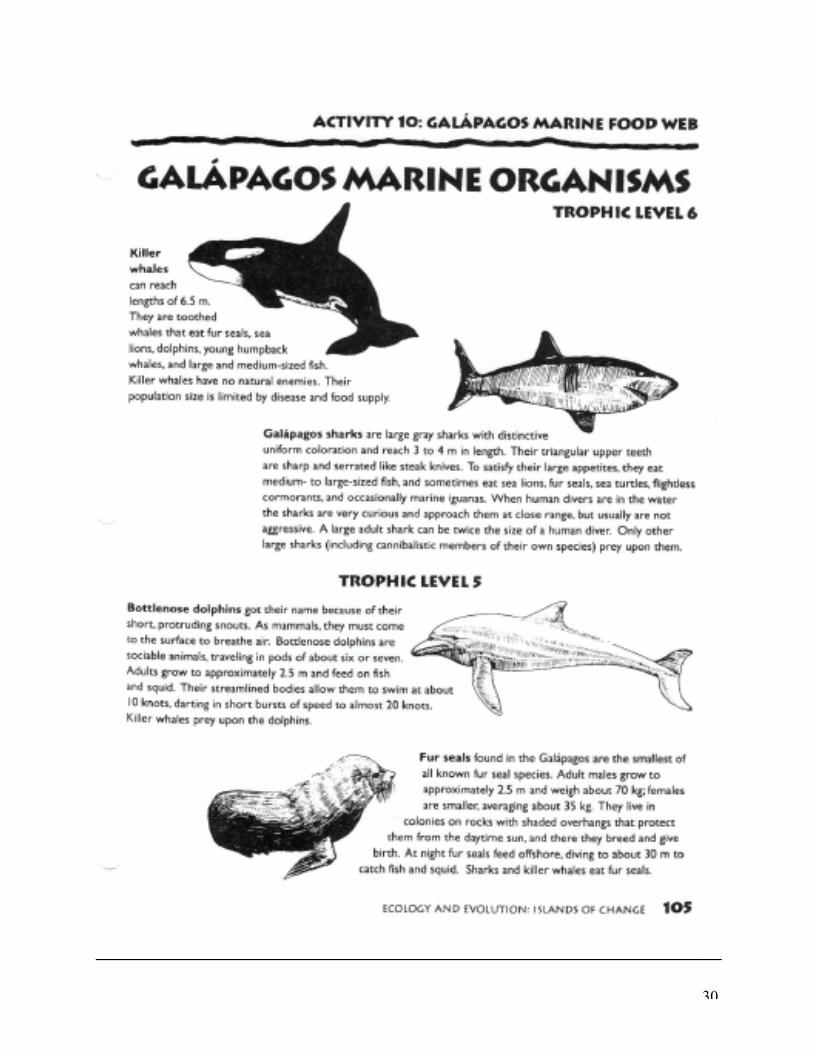
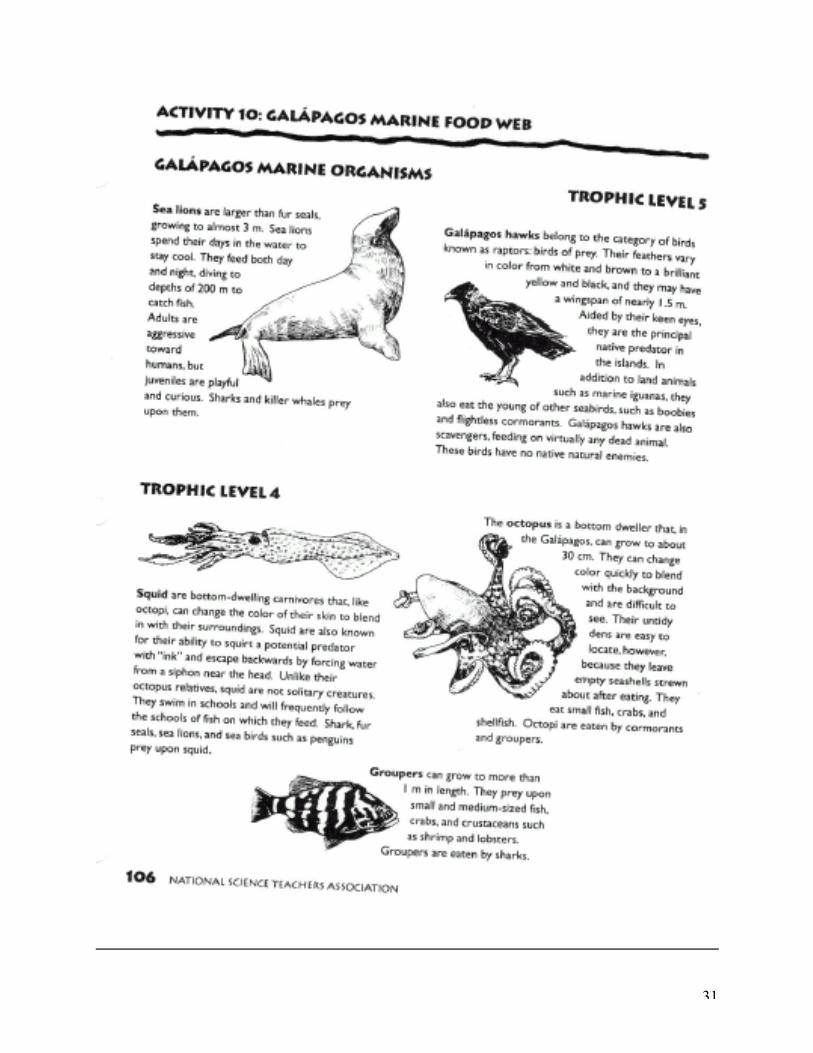
Independent Practice Galapagos Food Web (information is in Ecology Folder w/ instructions
Assessment/Evaluation Food web construction from Independent Practice and District Assessment
Enrichment Students can create a food web based on the plants and animals they eat. United Streaming video "You and the food Web"
Closure Ask students to write down one thing that they enjoyed and one thing that could be improved. Then have a feedback session with the entire class.
Materials (include websites)
At the end of the Unit plan: reference page.
Anticipatory Set
20
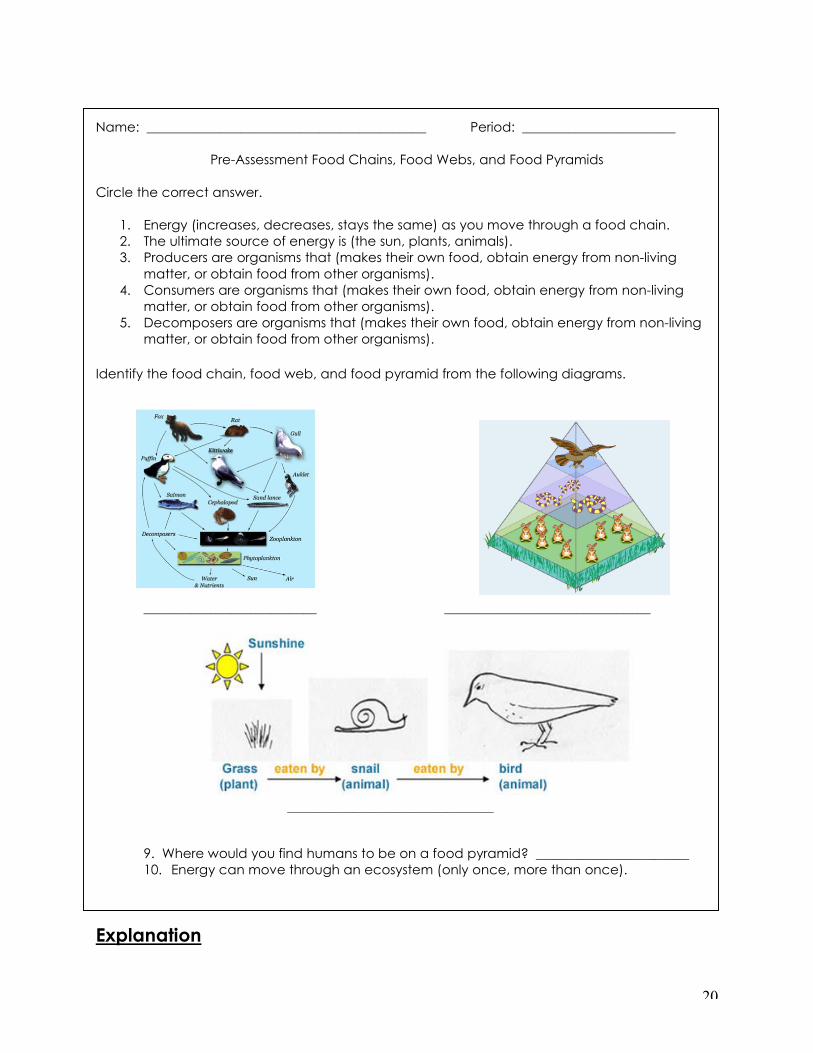
Name: __________________________________________ Period: _______________________
Pre-Assessment Food Chains, Food Webs, and Food Pyramids
Circle the correct answer.
1. Energy (increases, decreases, stays the same) as you move through a food chain. 2. The ultimate source of energy is (the sun, plants, animals). 3. Producers are organisms that (makes their own food, obtain energy from non-living
matter, or obtain food from other organisms). 4. Consumers are organisms that (makes their own food, obtain energy from non-living
matter, or obtain food from other organisms). 5. Decomposers are organisms that (makes their own food, obtain energy from non-living
matter, or obtain food from other organisms).
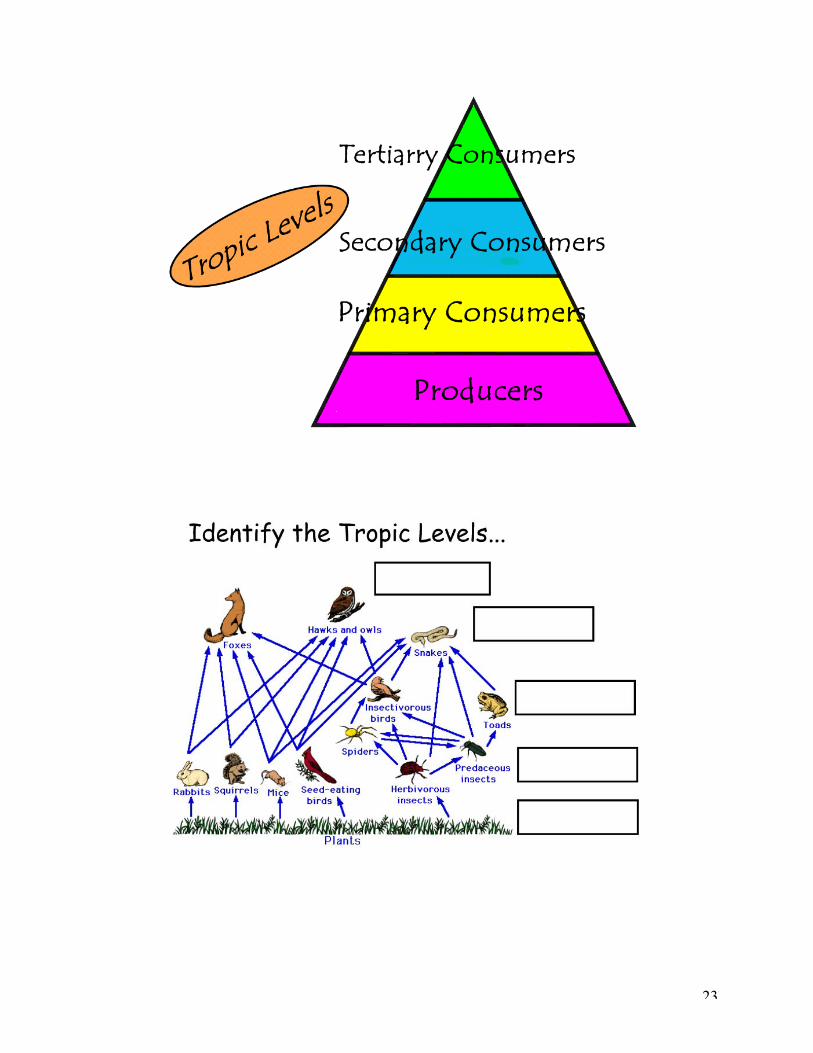
Identify the food chain, food web, and food pyramid from the following diagrams.
__________________________ _______________________________
_______________________________ 9. Where would you find humans to be on a food pyramid? _______________________ 10. Energy can move through an ecosystem (only once, more than once).
Explanation
21

22
23

24
25
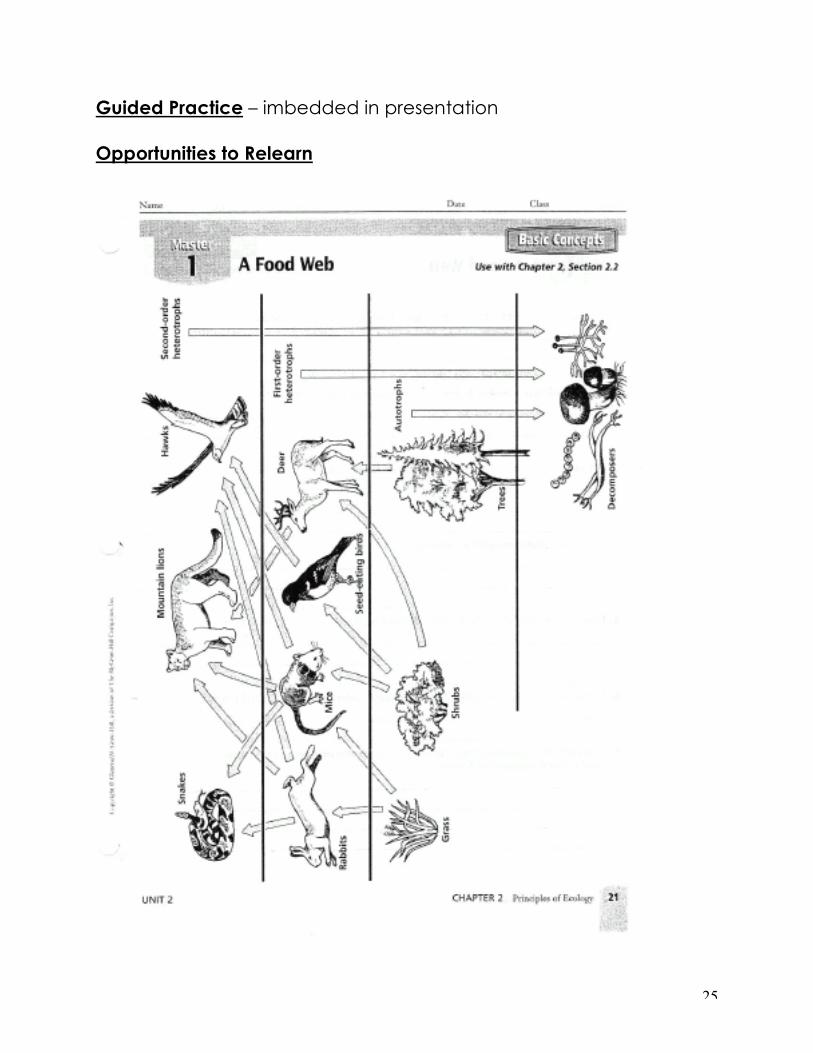
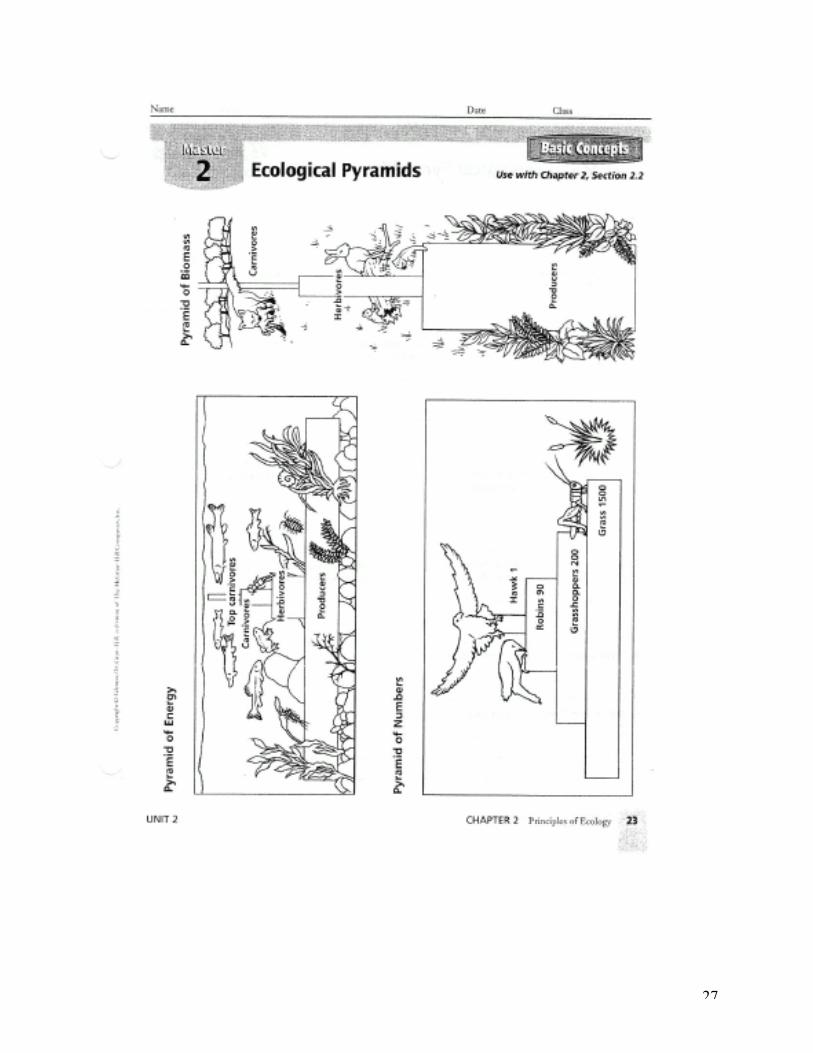
Guided Practice – imbedded in presentation Opportunities to Relearn

26
27
28
29
Independent Practice and Assessment
Ecology and Evolution: Islands of Change By: Richard Benz
30
31

32
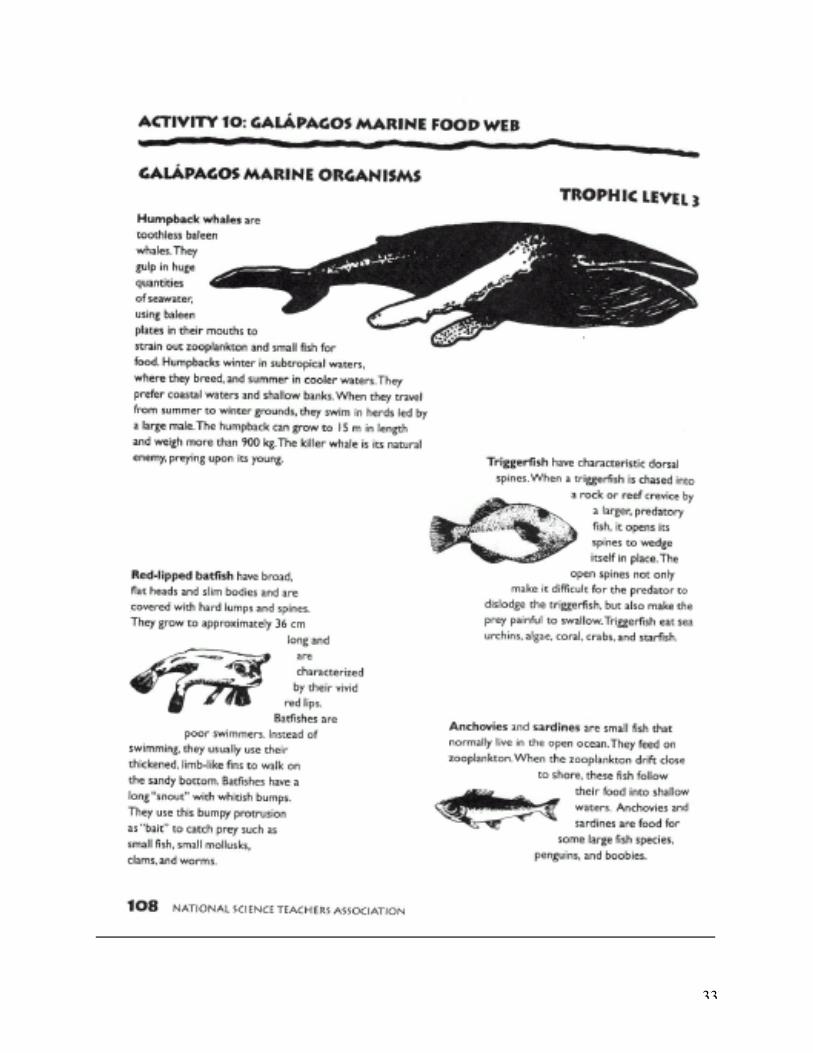
33
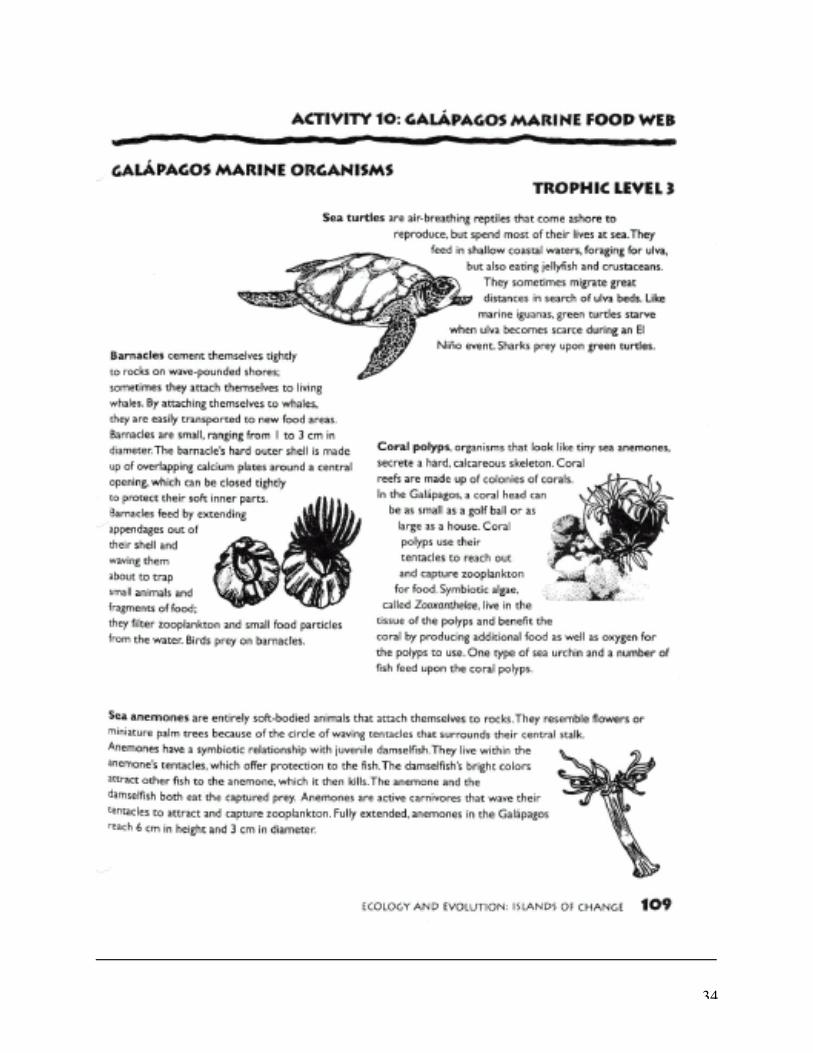
34
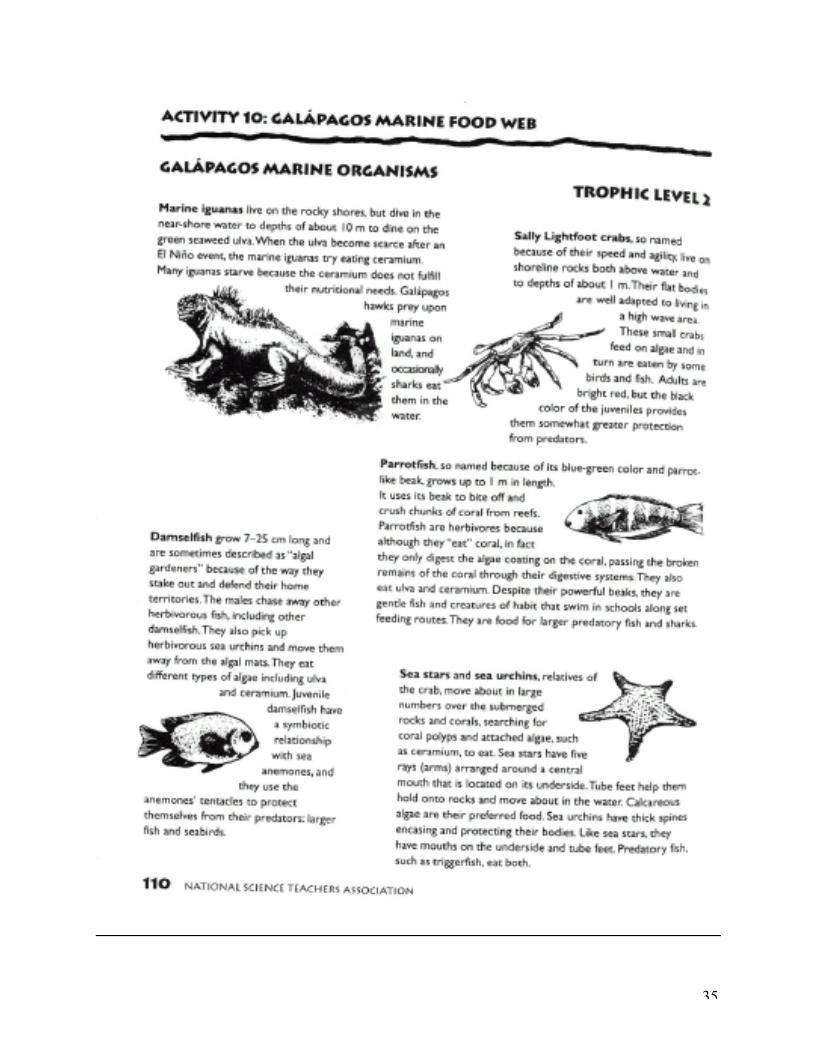
35
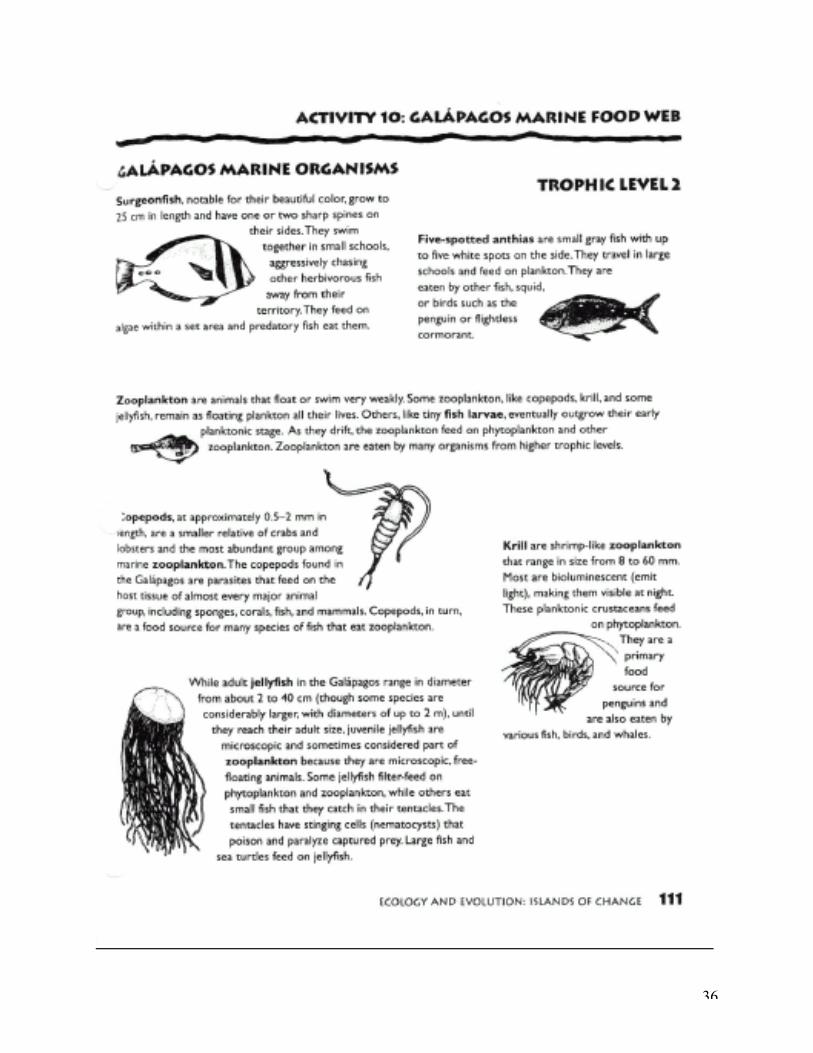
36

37
38
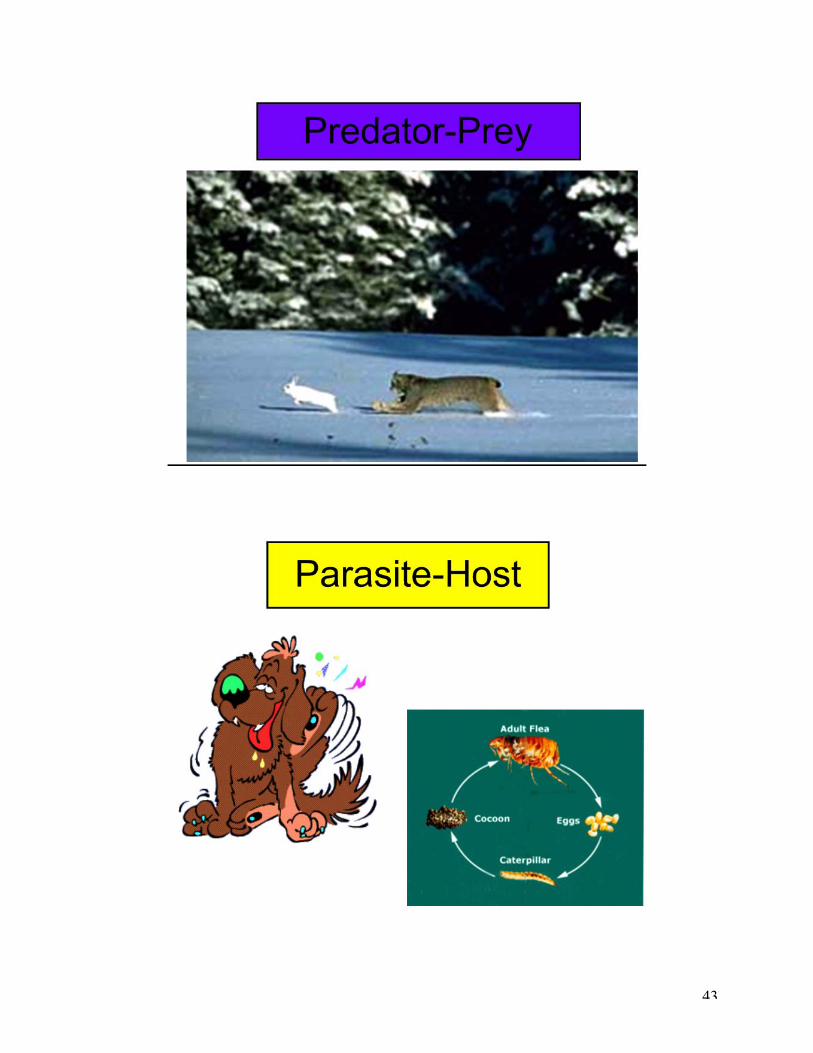
Lesson Three: Ecological Interactions Title of Lesson Plan Interactions Grade Level 10 ODE Standard: Explain the structure and function of ecosystems and relate
how ecosystems change over time. GLI(s) Explain how living things interact with biotic and abiotic
components of the environment (e.g., predation, competition, natural disasters, and weather) (1998 LS - 15)
Anticipatory Set Jeff Corwin: Hyena video (first 20 minutes) Discussion questions prior to viewing in the video and questions to answer after viewing the video can be found in the share drive. (Jeff Corwin Intro doc.)
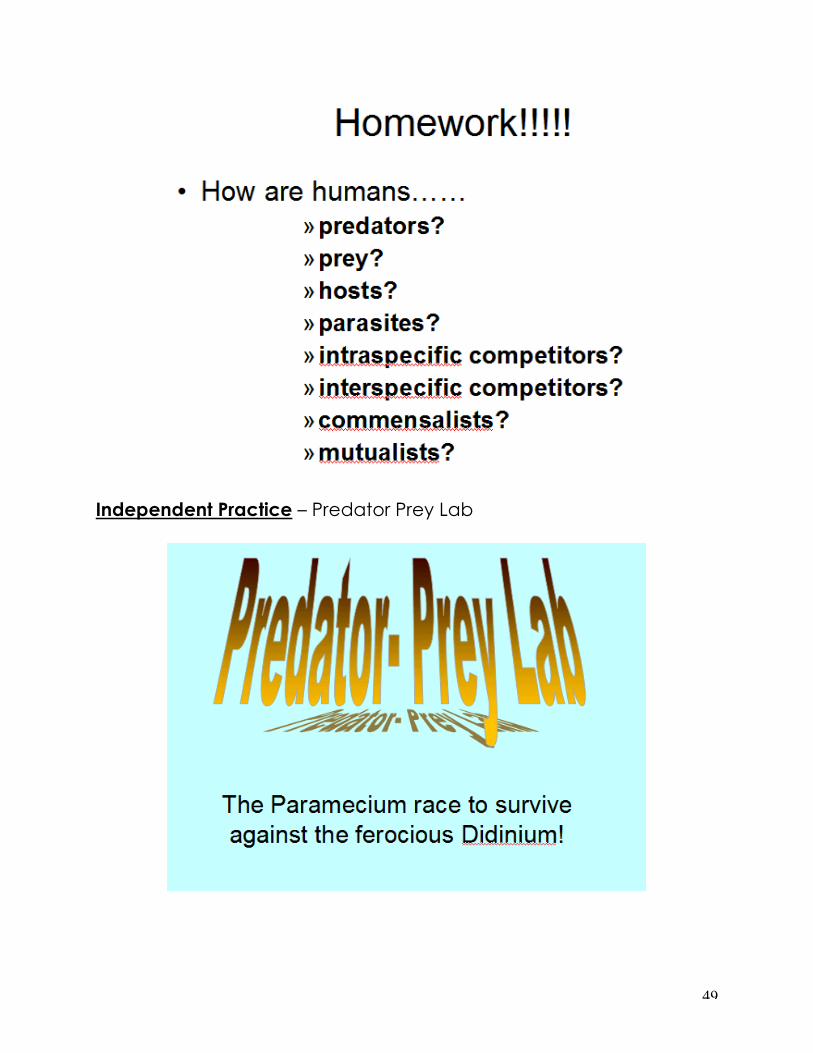
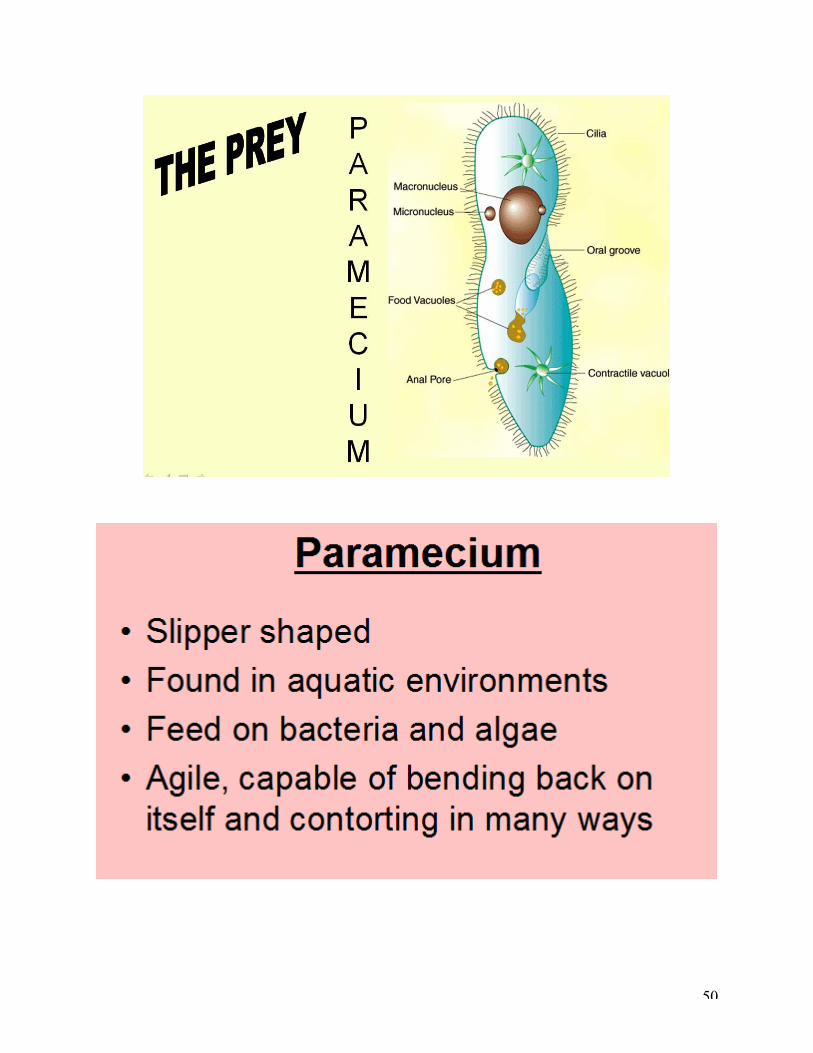
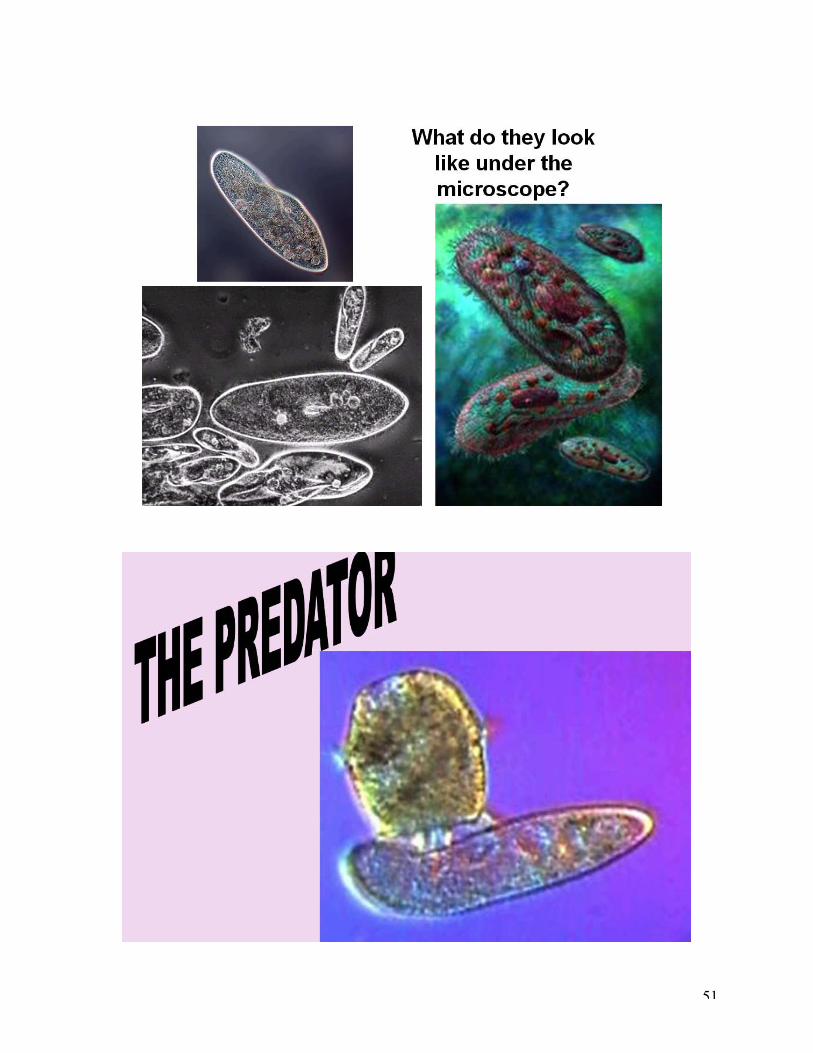
Explanation Notes: Interactions Guided Practice The Far Side Gallery, Interactions Opportunities to Relearn Predator Prey Lab with paramecium and didinium. Independent Practice How are Predator and Prey Related? - concluding with a
graph in the end. Assessment/Evaluation Predator Prey Enrichment: District assessment Enrichment Using Predators to Manage Populations Closure Interactions Concept Map Materials (include websites)
At the end of the Unit plan: reference page.
39
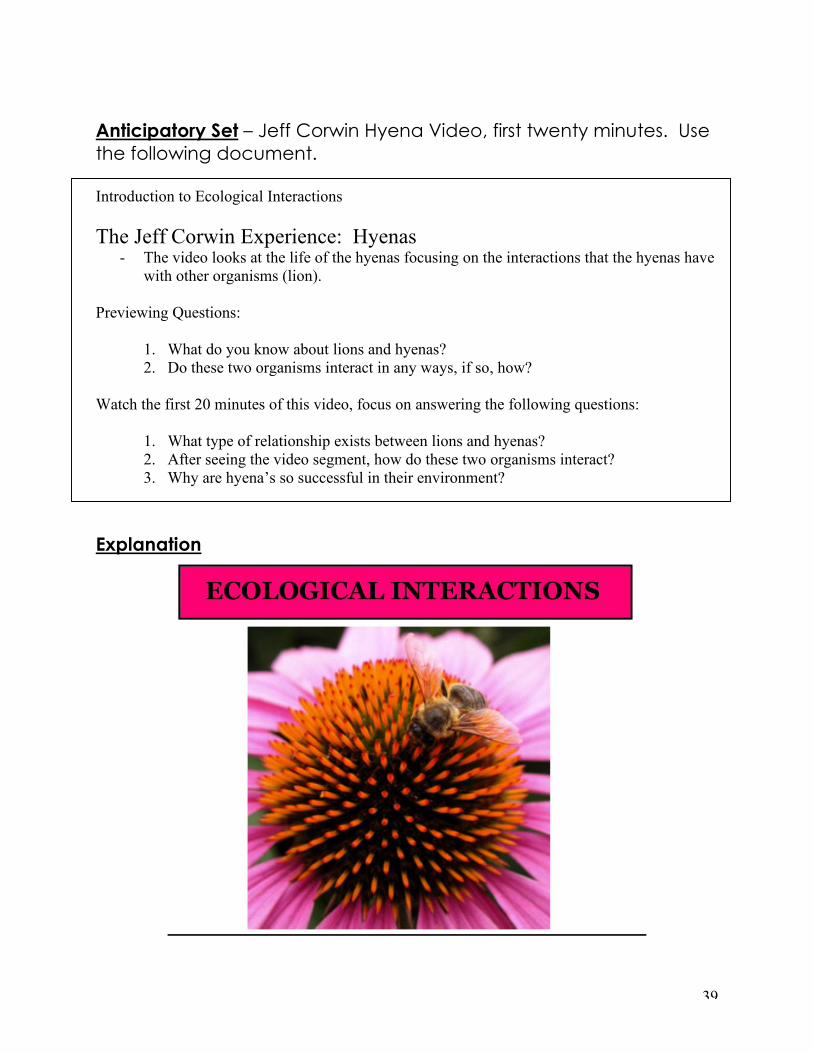
Anticipatory Set – Jeff Corwin Hyena Video, first twenty minutes. Use the following document. Introduction to Ecological Interactions The Jeff Corwin Experience: Hyenas
- The video looks at the life of the hyenas focusing on the interactions that the hyenas have with other organisms (lion).
Previewing Questions:
1. What do you know about lions and hyenas? 2. Do these two organisms interact in any ways, if so, how?
Watch the first 20 minutes of this video, focus on answering the following questions:
1. What type of relationship exists between lions and hyenas? 2. After seeing the video segment, how do these two organisms interact? 3. Why are hyena’s so successful in their environment?
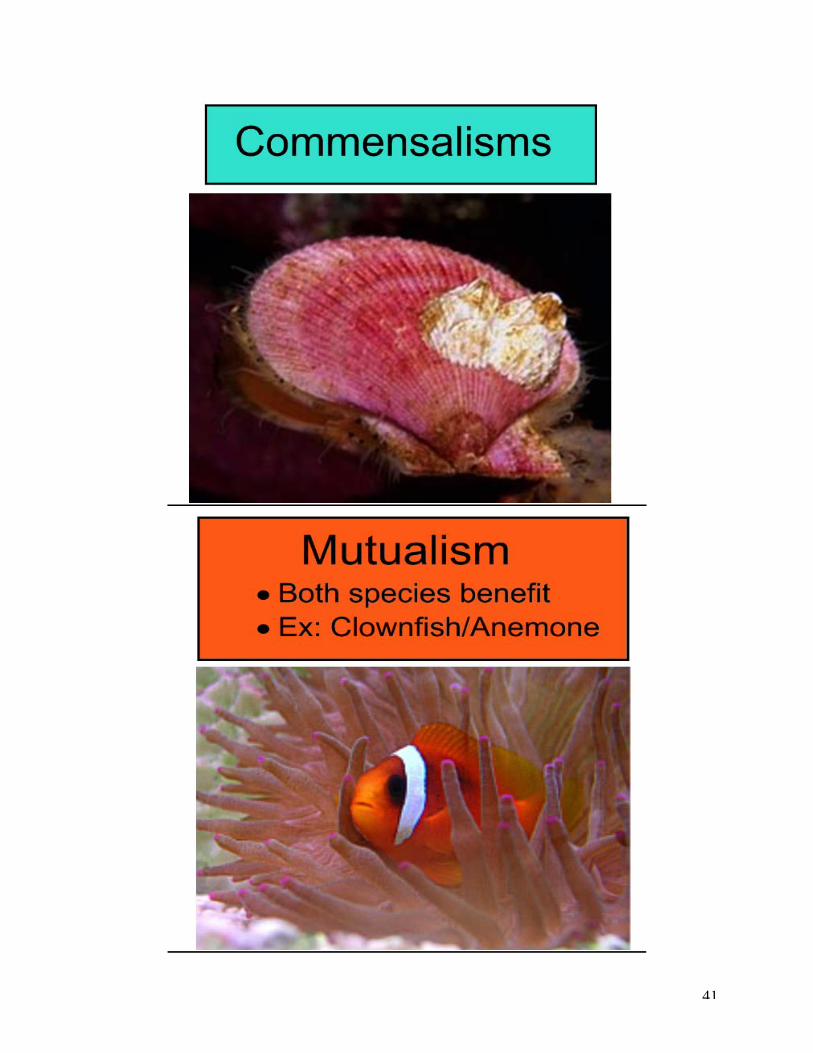
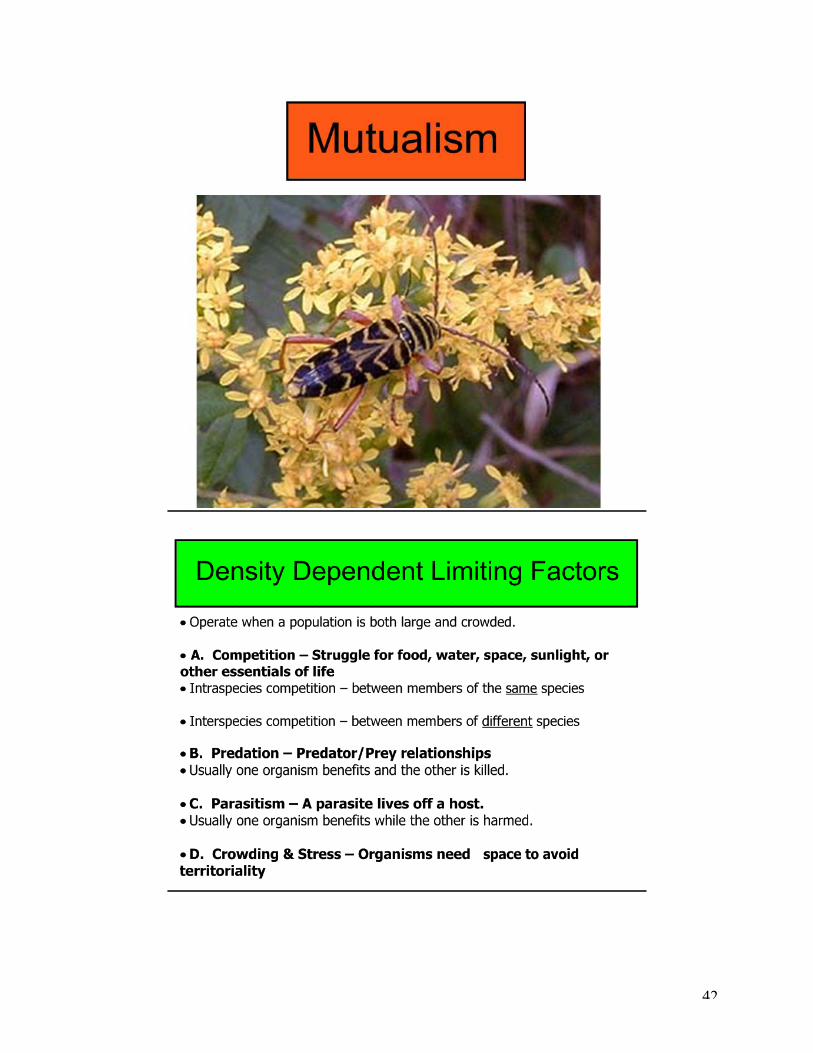
Explanation

40
41
42
43

44
45
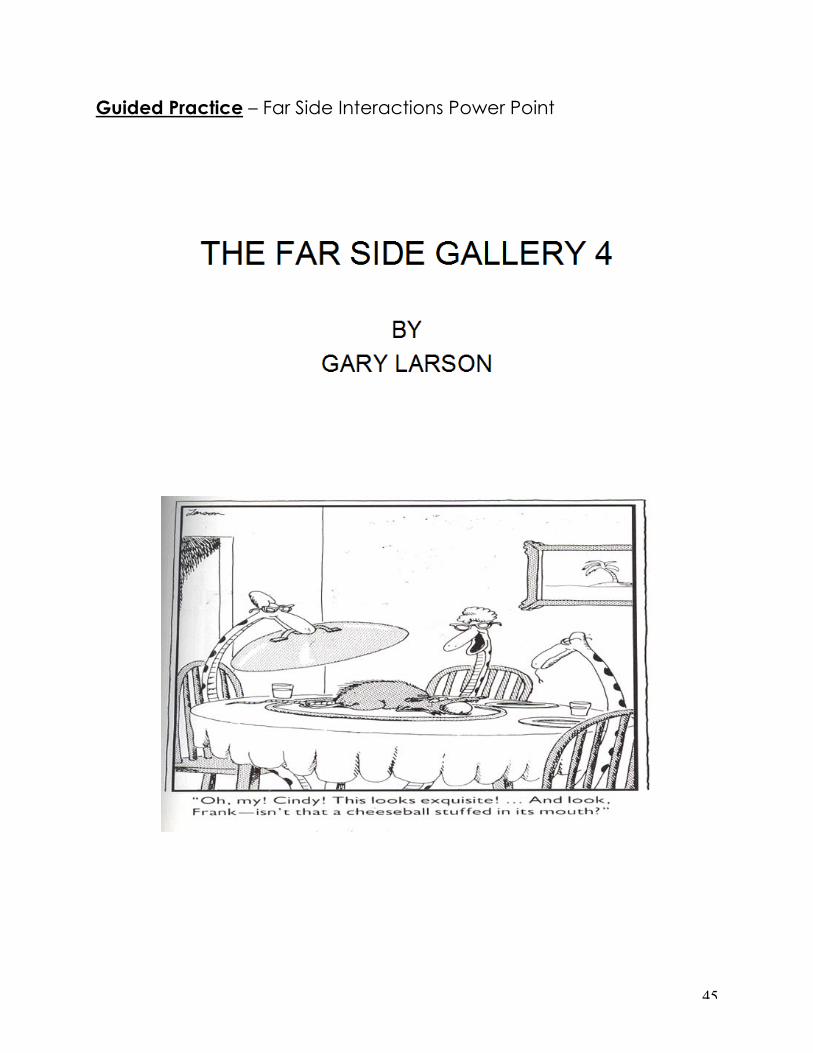
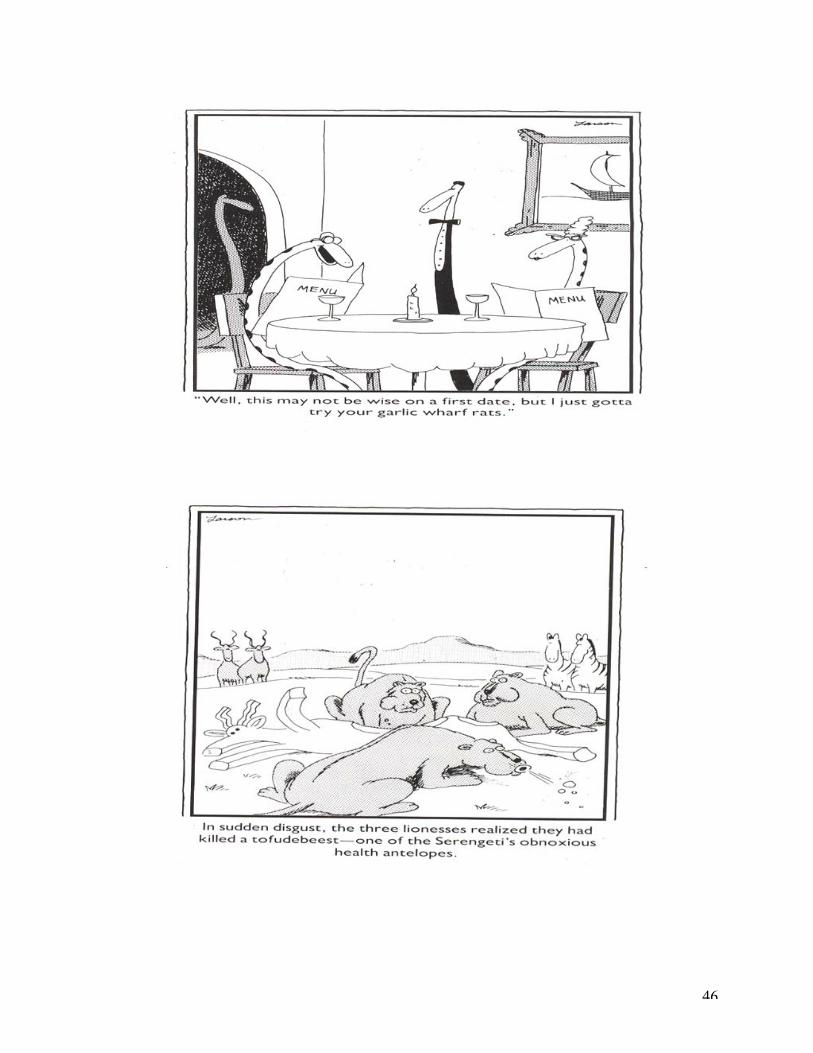
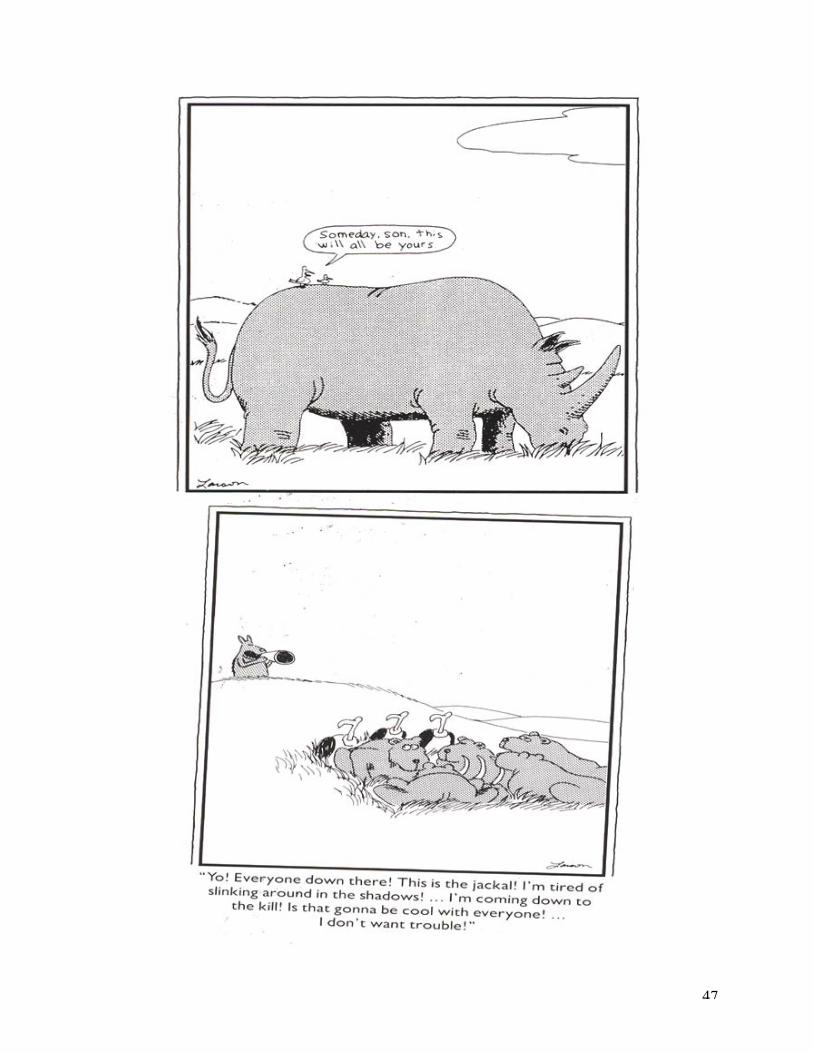
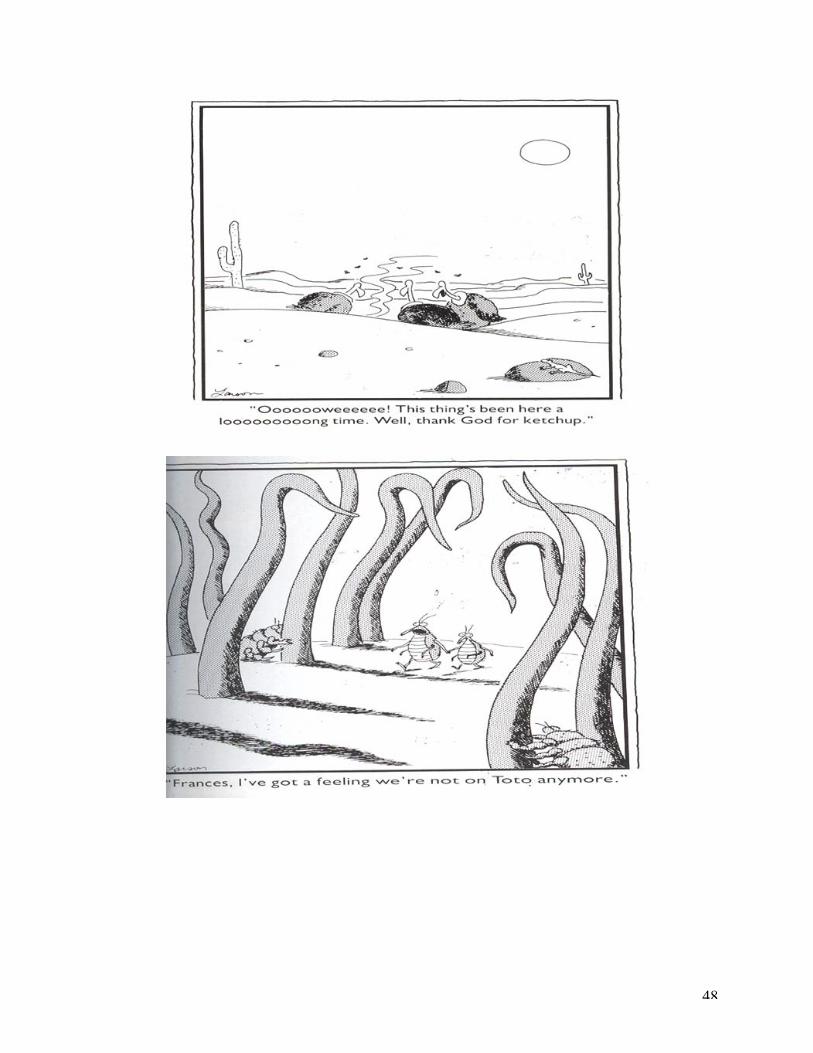
Guided Practice – Far Side Interactions Power Point
46
47
48
49
Independent Practice – Predator Prey Lab
50
51
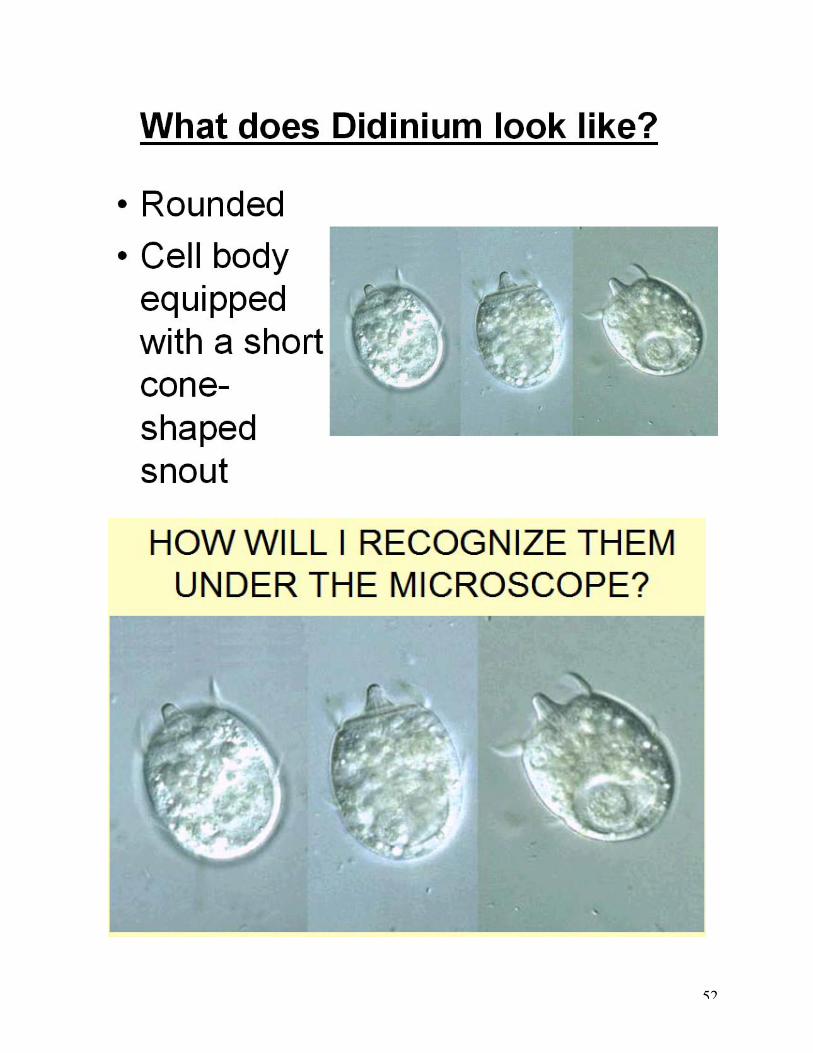
52
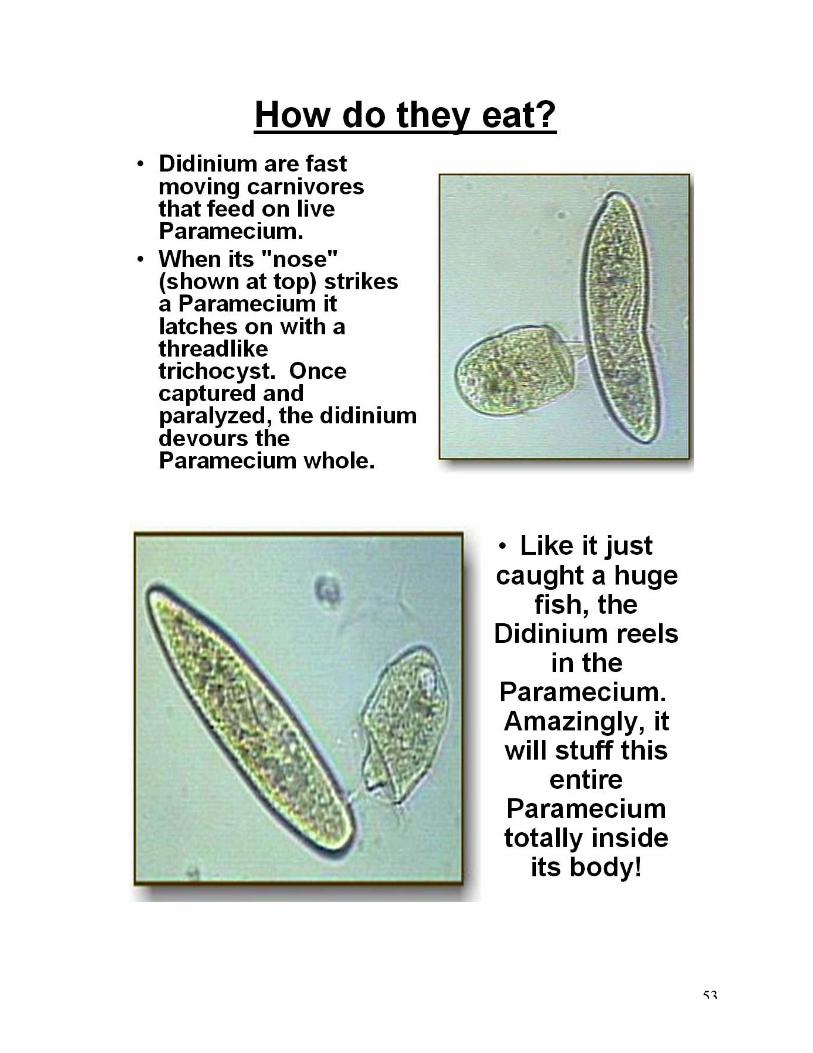
53
54
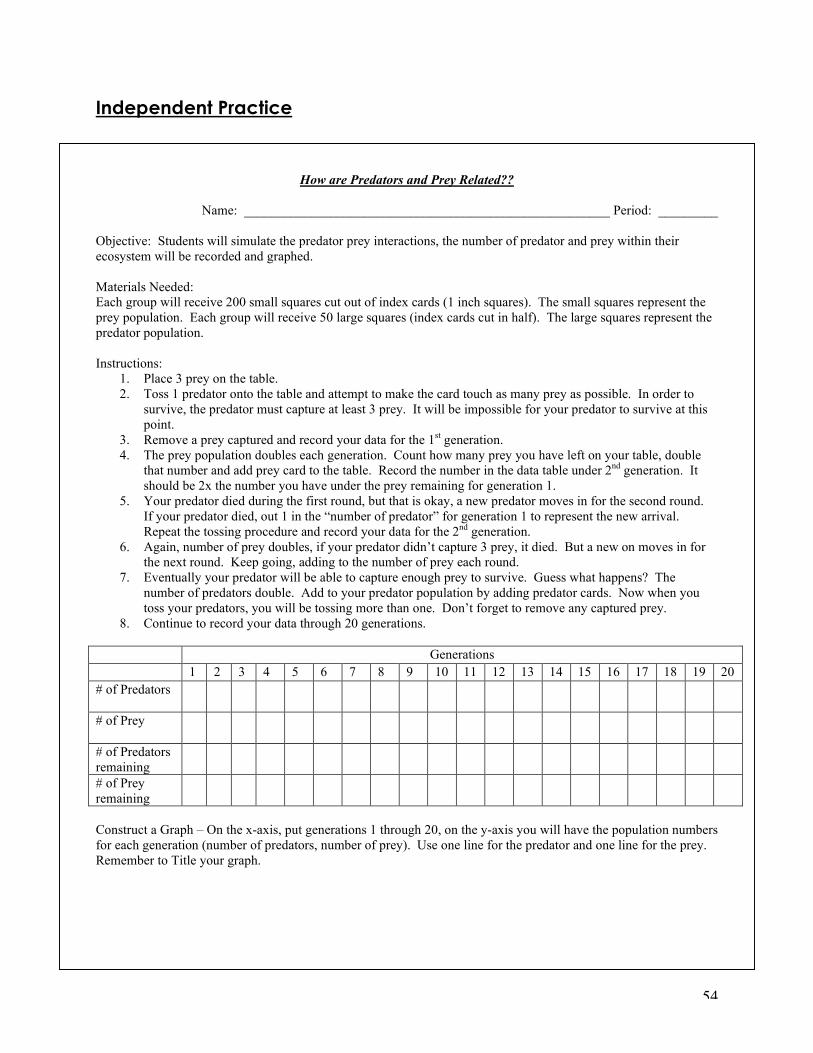
Independent Practice
How are Predators and Prey Related??
Name: _______________________________________________________ Period: _________
Objective: Students will simulate the predator prey interactions, the number of predator and prey within their ecosystem will be recorded and graphed. Materials Needed: Each group will receive 200 small squares cut out of index cards (1 inch squares). The small squares represent the prey population. Each group will receive 50 large squares (index cards cut in half). The large squares represent the predator population. Instructions:
1. Place 3 prey on the table. 2. Toss 1 predator onto the table and attempt to make the card touch as many prey as possible. In order to
survive, the predator must capture at least 3 prey. It will be impossible for your predator to survive at this point.
3. Remove a prey captured and record your data for the 1st generation. 4. The prey population doubles each generation. Count how many prey you have left on your table, double
that number and add prey card to the table. Record the number in the data table under 2nd generation. It should be 2x the number you have under the prey remaining for generation 1.
5. Your predator died during the first round, but that is okay, a new predator moves in for the second round. If your predator died, out 1 in the “number of predator” for generation 1 to represent the new arrival. Repeat the tossing procedure and record your data for the 2nd generation.
6. Again, number of prey doubles, if your predator didn’t capture 3 prey, it died. But a new on moves in for the next round. Keep going, adding to the number of prey each round.
7. Eventually your predator will be able to capture enough prey to survive. Guess what happens? The number of predators double. Add to your predator population by adding predator cards. Now when you toss your predators, you will be tossing more than one. Don’t forget to remove any captured prey.
8. Continue to record your data through 20 generations. Generations 1 2 3 4 5 6 7 8 9 10 11 12 13 14 15 16 17 18 19 20 # of Predators
# of Prey
# of Predators remaining
# of Prey remaining
Construct a Graph – On the x-axis, put generations 1 through 20, on the y-axis you will have the population numbers for each generation (number of predators, number of prey). Use one line for the predator and one line for the prey. Remember to Title your graph.
55
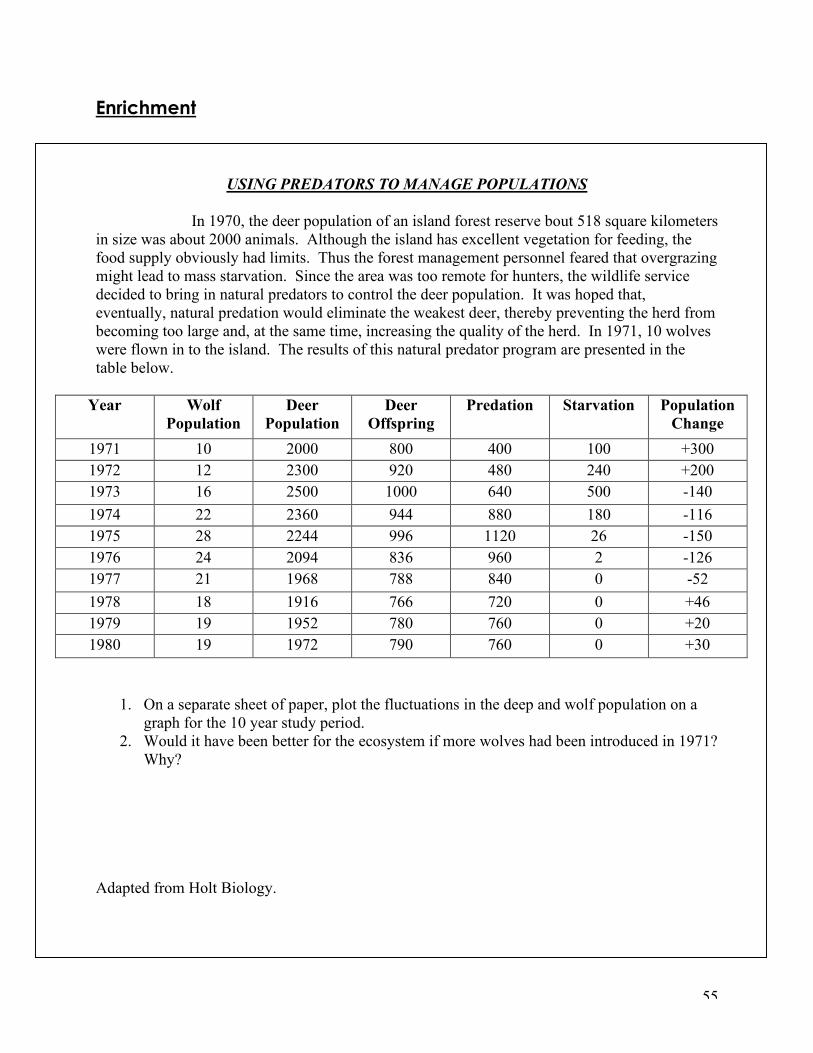
Enrichment
USING PREDATORS TO MANAGE POPULATIONS
In 1970, the deer population of an island forest reserve bout 518 square kilometers in size was about 2000 animals. Although the island has excellent vegetation for feeding, the food supply obviously had limits. Thus the forest management personnel feared that overgrazing might lead to mass starvation. Since the area was too remote for hunters, the wildlife service decided to bring in natural predators to control the deer population. It was hoped that, eventually, natural predation would eliminate the weakest deer, thereby preventing the herd from becoming too large and, at the same time, increasing the quality of the herd. In 1971, 10 wolves were flown in to the island. The results of this natural predator program are presented in the table below.
Year Wolf Population
Deer Population
Deer Offspring
Predation Starvation Population Change
1971 10 2000 800 400 100 +300 1972 12 2300 920 480 240 +200 1973 16 2500 1000 640 500 -140 1974 22 2360 944 880 180 -116 1975 28 2244 996 1120 26 -150 1976 24 2094 836 960 2 -126 1977 21 1968 788 840 0 -52 1978 18 1916 766 720 0 +46 1979 19 1952 780 760 0 +20 1980 19 1972 790 760 0 +30
1. On a separate sheet of paper, plot the fluctuations in the deep and wolf population on a graph for the 10 year study period.
2. Would it have been better for the ecosystem if more wolves had been introduced in 1971? Why?
Adapted from Holt Biology.

56
Closure

57
Lesson Four: Water Cycle Title of Lesson Plan Biogeochemical Cycles (Water) Grade Level 10 ODE Standard: Explain the structure and function of ecosystems and relate
how ecosystems change over time. GLI(s) Describe ways that human activity can later
biogeochemical cycles (e.g., carbon dioxide and nitrogen cycles) as well as food webs and energy pyramids (e.g., pest control, legume rotation crops vs. chemical fertilizers) (1982 ES-7)
Anticipatory Set Poems about water cycle: Attached Explanation Notes on Energy Movement: Water Cycle Guided Practice Video embedded in presentation
Opportunities to Relearn The Incredible Journey Independent Practice Water Cycle Worksheet Assessment/Evaluation Explanation of Incredible Journey (what did you learn) Enrichment Article: How we are affected by water cycle. Read article
and complete reading activity attached. Video: Water to the Last Drop
Closure Discussion of Ohio's water cycle article. Video: Water to the Last Drop
Materials (include websites)
At the end of the Unit plan: reference page.
58
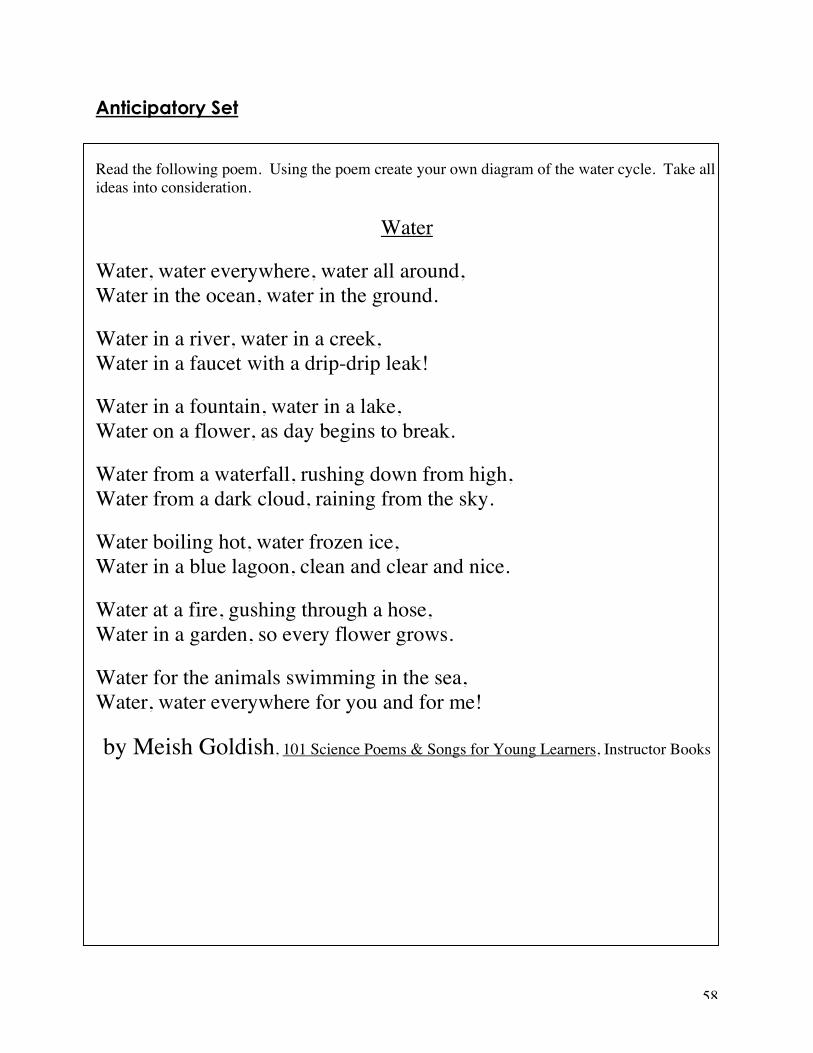
Anticipatory Set
Read the following poem. Using the poem create your own diagram of the water cycle. Take all ideas into consideration.
Water
Water, water everywhere, water all around, Water in the ocean, water in the ground.
Water in a river, water in a creek, Water in a faucet with a drip-drip leak!
Water in a fountain, water in a lake, Water on a flower, as day begins to break.
Water from a waterfall, rushing down from high, Water from a dark cloud, raining from the sky.
Water boiling hot, water frozen ice, Water in a blue lagoon, clean and clear and nice.
Water at a fire, gushing through a hose, Water in a garden, so every flower grows.
Water for the animals swimming in the sea, Water, water everywhere for you and for me!
by Meish Goldish, 101 Science Poems & Songs for Young Learners, Instructor Books

59
Explanation
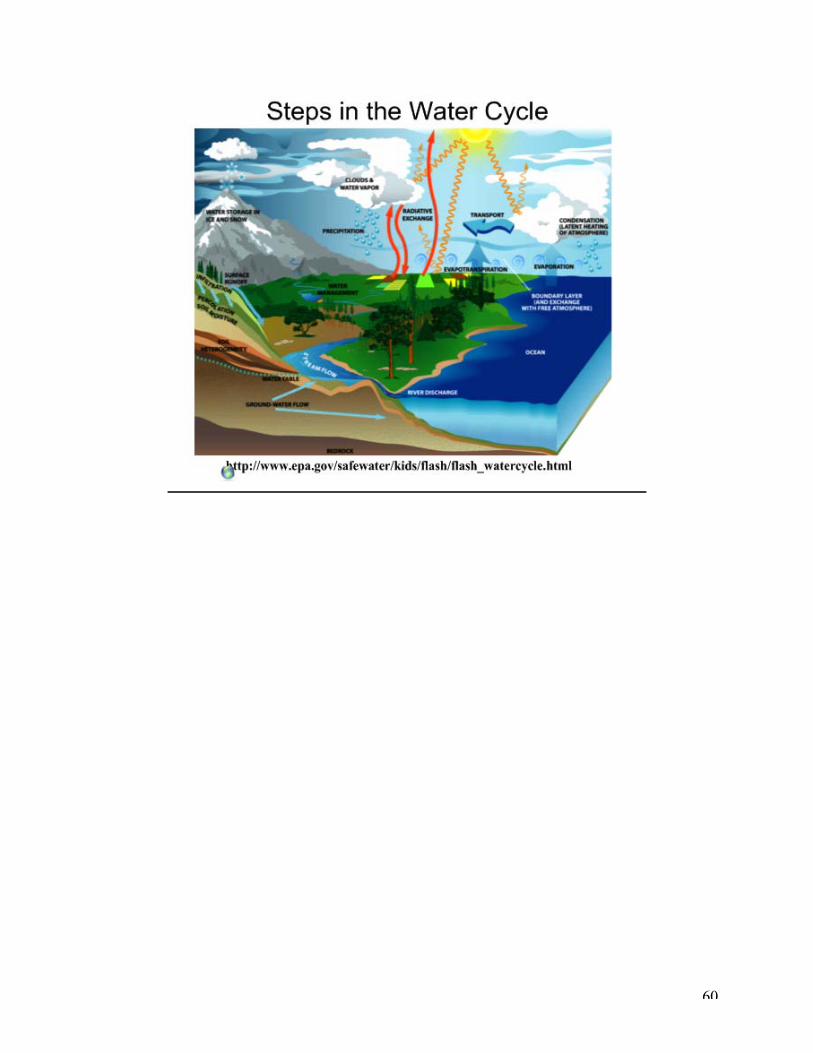
60
61
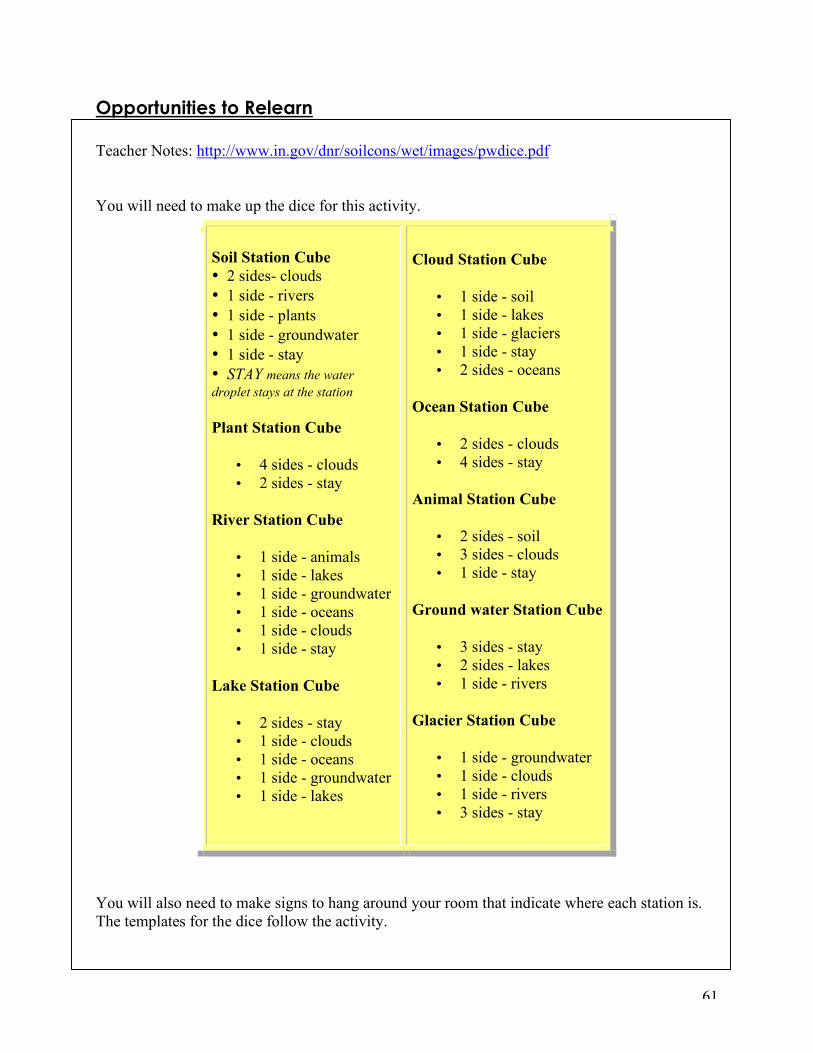
Opportunities to Relearn Teacher Notes: http://www.in.gov/dnr/soilcons/wet/images/pwdice.pdf You will need to make up the dice for this activity.
Soil Station Cube • 2 sides- clouds • 1 side - rivers • 1 side - plants • 1 side - groundwater • 1 side - stay • STAY means the water droplet stays at the station
Plant Station Cube
• 4 sides - clouds • 2 sides - stay
River Station Cube
• 1 side - animals • 1 side - lakes • 1 side - groundwater • 1 side - oceans • 1 side - clouds • 1 side - stay
Lake Station Cube
• 2 sides - stay • 1 side - clouds • 1 side - oceans • 1 side - groundwater • 1 side - lakes
Cloud Station Cube
• 1 side - soil • 1 side - lakes • 1 side - glaciers • 1 side - stay • 2 sides - oceans
Ocean Station Cube
• 2 sides - clouds • 4 sides - stay
Animal Station Cube
• 2 sides - soil • 3 sides - clouds • 1 side - stay
Ground water Station Cube
• 3 sides - stay • 2 sides - lakes • 1 side - rivers
Glacier Station Cube
• 1 side - groundwater • 1 side - clouds • 1 side - rivers • 3 sides - stay
You will also need to make signs to hang around your room that indicate where each station is. The templates for the dice follow the activity.

62
Student pages
THE INCREDIBLE JOURNEY
Background:
While water does circulate from one point of state to another in the water cycle, the paths it can take are variable.
Heat energy directly influences the rate of motion of water molecules. When the motion of the molecule increases because of an increase in heat energy, water will change from solid to liquid to gas. With each change in state, physical movement from one location to another usually follows. Glaciers melt to pools which overflow to streams, where water may evaporate into the atmosphere.
Gravity further influences the ability of water to travel over, under, and above Earth's surface.
One of the most visible states in which water moves is the liquid form. Water is seen flowing in streams and rivers and tumbling in ocean waves. Water travels slowly underground, seeping and filtering through particles of soil and pores within rocks.
Although unseen, water's most dramatic movements take place during its gaseous phase. Water is constantly evaporating, changing from a liquid to a gas. As a vapor, it can travel through the atmosphere over Earth's surface. In fact, water vapor surrounds us all the time. Where it condenses and returns to Earth depends upon loss of heat energy, gravity, and the structure of Earth's surface.
Water condensation can be seen as dew on plants or water droplets on the outside of a glass of cold water. In clouds, water molecules collect on tiny dust particles. Eventually, the water droplets become too heavy and gravity pulls the water to Earth.
Living organisms also help move water. Humans and other animals carry water within their bodies, transporting it from one location to another. Water is either directly consumed by animals or is removed from foods during digestion. Water is excreted as a liquid or leaves as a gas, usually through respiration. When water is present on the skin of an animal (for example, as perspiration), evaporation may occur.
The greatest movers of water among living organisms are plants. The roots of plants absorb water. Some of this water is used within the body of the plant, but most of it travels up through the plant to the leaf surface. When water reaches the leaves, it is exposed to the air and the sun's energy and is easily evaporated. This process is called transpiration.
All these processes work together to move water around, through and over Earth.
63
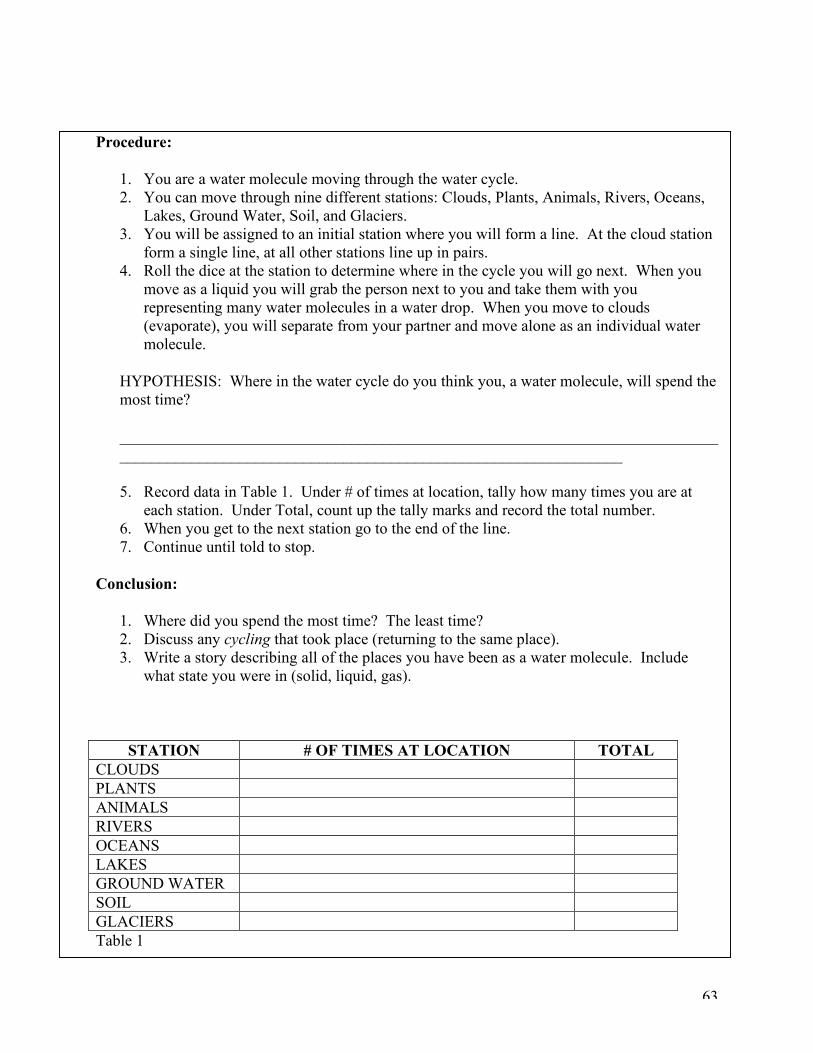
Procedure:
1. You are a water molecule moving through the water cycle. 2. You can move through nine different stations: Clouds, Plants, Animals, Rivers, Oceans,
Lakes, Ground Water, Soil, and Glaciers. 3. You will be assigned to an initial station where you will form a line. At the cloud station
form a single line, at all other stations line up in pairs. 4. Roll the dice at the station to determine where in the cycle you will go next. When you
move as a liquid you will grab the person next to you and take them with you representing many water molecules in a water drop. When you move to clouds (evaporate), you will separate from your partner and move alone as an individual water molecule.
HYPOTHESIS: Where in the water cycle do you think you, a water molecule, will spend the most time?
__________________________________________________________________________________________________________________________________________
5. Record data in Table 1. Under # of times at location, tally how many times you are at each station. Under Total, count up the tally marks and record the total number.
6. When you get to the next station go to the end of the line. 7. Continue until told to stop.
Conclusion:
1. Where did you spend the most time? The least time? 2. Discuss any cycling that took place (returning to the same place). 3. Write a story describing all of the places you have been as a water molecule. Include
what state you were in (solid, liquid, gas).
STATION # OF TIMES AT LOCATION TOTAL CLOUDS PLANTS ANIMALS RIVERS OCEANS LAKES GROUND WATER SOIL GLACIERS Table 1
64
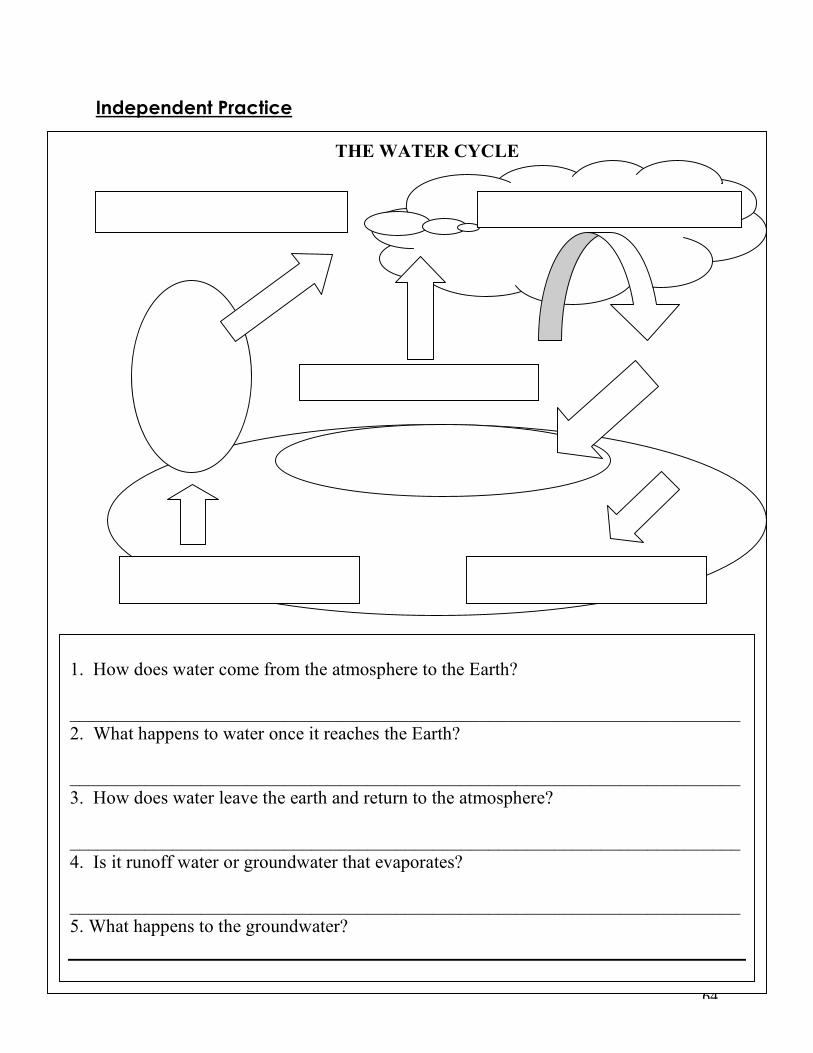
Independent Practice THE WATER CYCLE
1. How does water come from the atmosphere to the Earth? ________________________________________________________________________ 2. What happens to water once it reaches the Earth? ________________________________________________________________________ 3. How does water leave the earth and return to the atmosphere? ________________________________________________________________________ 4. Is it runoff water or groundwater that evaporates? ________________________________________________________________________ 5. What happens to the groundwater?

65
Enrichment: Article that follows in addition to the questions pertaining to the article.
Ohio State University Extension Fact Sheet Food, Agricultural and Biological Engineering
Ohio's Hydrologic Cycle AEX-461-94
Larry C. Brown
Water is Important!
Recent estimates indicate that Ohioans use approximately 11,700 million gallons of water per day (MGD) for various purposes. Over 9,000 MGD of the 11,700 MGD is for thermo-electric use. This water is supplied by our state's abundant water resources, which include surface- and ground-water supplies (see Table 1). Surface-water resources, such as ponds, lakes, reservoirs, streams and rivers, supply water to about 55 percent of the state's population. These resources include 43,900 miles of streams and 2,200 lakes. The remaining 45 percent of the population is served by ground water, which is extracted from water-bearing geologic formations beneath the Earth's surface. These formations, called aquifers, are of two types in Ohio: unconsolidated deposits and sedimentary bedrock, which are confined or unconfined.
Table 1. Water Facts for Ohio 1 Estimated Percent of the Total
Population Served Estimated
Percent Totals Estimated Water
Use (MGD)2 Water Resource From Public
Supply Systems From Rural Water
Self-Supplied Systems
Surface Water 54.4 0.3 54.7 932.7
Ground Water 29.1 16.2 45.3 534.8
Totals 83.5 16.5 100.0 1,467.5
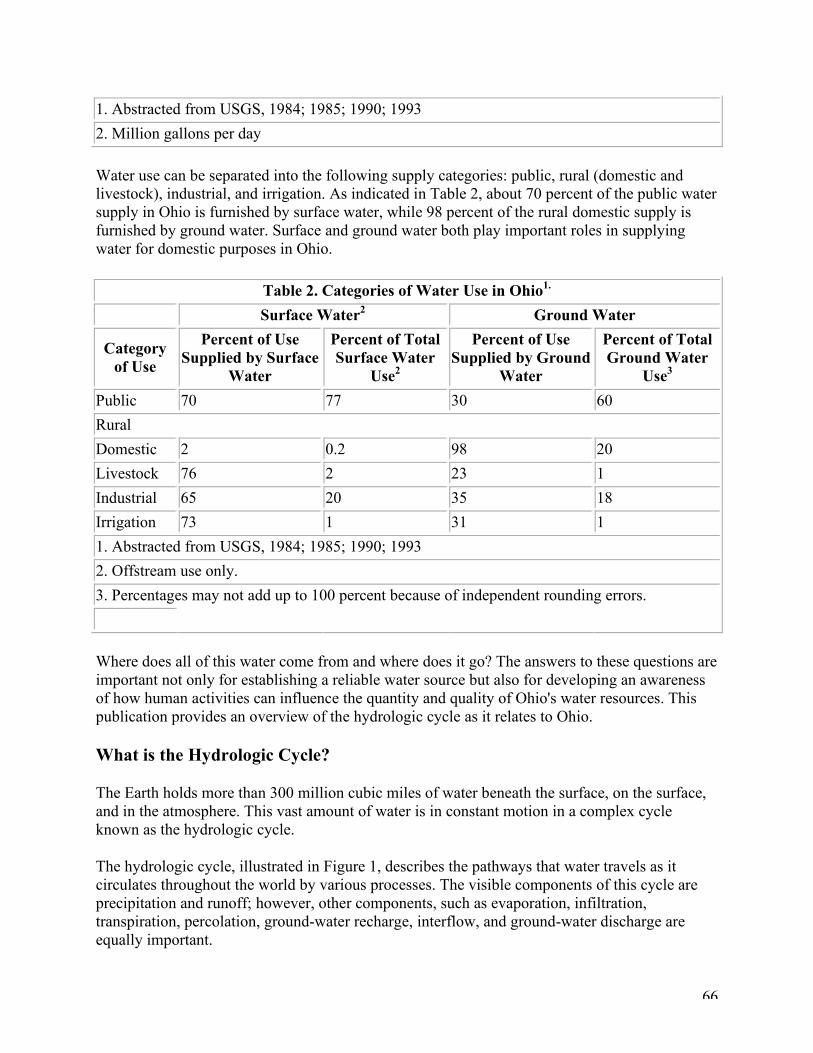
66
1. Abstracted from USGS, 1984; 1985; 1990; 1993 2. Million gallons per day
Water use can be separated into the following supply categories: public, rural (domestic and livestock), industrial, and irrigation. As indicated in Table 2, about 70 percent of the public water supply in Ohio is furnished by surface water, while 98 percent of the rural domestic supply is furnished by ground water. Surface and ground water both play important roles in supplying water for domestic purposes in Ohio.
Table 2. Categories of Water Use in Ohio1. Surface Water2 Ground Water
Category of Use
Percent of Use Supplied by Surface
Water
Percent of Total Surface Water
Use2
Percent of Use Supplied by Ground
Water
Percent of Total Ground Water
Use3 Public 70 77 30 60 Rural Domestic 2 0.2 98 20 Livestock 76 2 23 1 Industrial 65 20 35 18 Irrigation 73 1 31 1 1. Abstracted from USGS, 1984; 1985; 1990; 1993 2. Offstream use only. 3. Percentages may not add up to 100 percent because of independent rounding errors.
Where does all of this water come from and where does it go? The answers to these questions are important not only for establishing a reliable water source but also for developing an awareness of how human activities can influence the quantity and quality of Ohio's water resources. This publication provides an overview of the hydrologic cycle as it relates to Ohio.
What is the Hydrologic Cycle?
The Earth holds more than 300 million cubic miles of water beneath the surface, on the surface, and in the atmosphere. This vast amount of water is in constant motion in a complex cycle known as the hydrologic cycle.
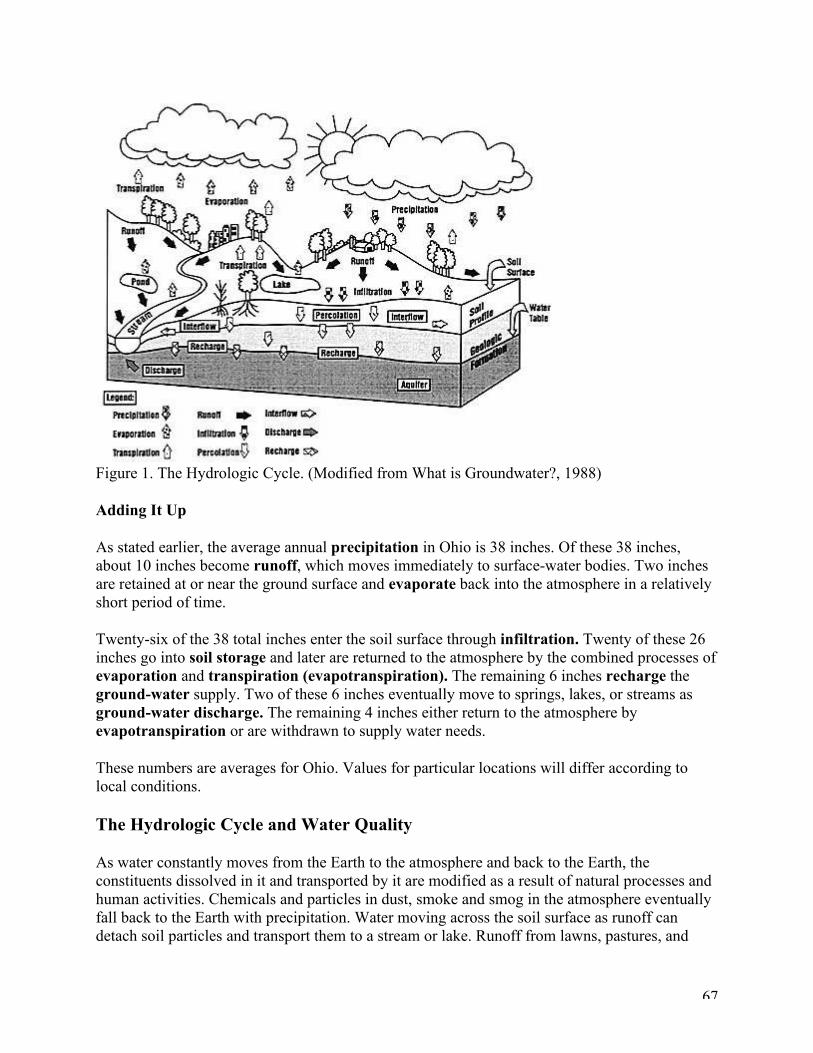
The hydrologic cycle, illustrated in Figure 1, describes the pathways that water travels as it circulates throughout the world by various processes. The visible components of this cycle are precipitation and runoff; however, other components, such as evaporation, infiltration, transpiration, percolation, ground-water recharge, interflow, and ground-water discharge are equally important.
67
Figure 1. The Hydrologic Cycle. (Modified from What is Groundwater?, 1988)
Adding It Up
As stated earlier, the average annual precipitation in Ohio is 38 inches. Of these 38 inches, about 10 inches become runoff, which moves immediately to surface-water bodies. Two inches are retained at or near the ground surface and evaporate back into the atmosphere in a relatively short period of time.
Twenty-six of the 38 total inches enter the soil surface through infiltration. Twenty of these 26 inches go into soil storage and later are returned to the atmosphere by the combined processes of evaporation and transpiration (evapotranspiration). The remaining 6 inches recharge the ground-water supply. Two of these 6 inches eventually move to springs, lakes, or streams as ground-water discharge. The remaining 4 inches either return to the atmosphere by evapotranspiration or are withdrawn to supply water needs.
These numbers are averages for Ohio. Values for particular locations will differ according to local conditions.
The Hydrologic Cycle and Water Quality
As water constantly moves from the Earth to the atmosphere and back to the Earth, the constituents dissolved in it and transported by it are modified as a result of natural processes and human activities. Chemicals and particles in dust, smoke and smog in the atmosphere eventually fall back to the Earth with precipitation. Water moving across the soil surface as runoff can detach soil particles and transport them to a stream or lake. Runoff from lawns, pastures, and
68
agricultural fields can also carry dissolved nutrients and pesticides. Certain chemicals attach to soil particles and also are transported to receiving waters. Runoff from roadways and parking lots wash grit and metal particles directly into storm sewers and streams.
Water that percolates to the underlying aquifer can be polluted by the leaching of chemicals, nutrients and/or organic wastes from the land surface or from materials buried in landfills. Aquifers close to the surface or in porous, unconsolidated strata (sands and gravels) can be very vulnerable to pollution. Deep aquifers are also vulnerable, especially if connected to the surface by fissures or sinkholes in underlying formations as in limestone rock areas. Certainly, surface and underground conditions differ all across Ohio. However, human activities in any part of the state can have a dramatic impact on the quality of our surface- and ground-water resources.
Bibliography
Estimated Use of Water in the United States in 1990. 1993. W. B. Solley, R. R. Pierce, and H. A. Perlman. U. S. Geological Survey Circular 1081.
Estimated Water Use in Ohio, 1990. Livestock, Animal Specialities, and Irrigation Data. 1993. R. J. Veley. U. S. Geological Survey Open- File Report 93-646.
Estimated Water Use in Ohio, 1990. Mining Data. 1993. R. J. Veley. U. S. Geological Survey Open-File Report 93-453.
Estimated Water Use in Ohio, 1990. Public-Supply Data. 1993. R. J. Veley. U. S. Geological Survey Open-File Report 93-72.
Estimated Water Use in Ohio, 1990. Thermoelectric PowerData. 1993. R. J. Veley. U. S. Geological Survey Open-File Report 93-645.
Gazetteer of Ohio Streams. 1960. Report No. 12, Ohio Water Plan Inventory. ODNR Division of Water.
Ground- and Surface-Water Terminology. 1994. L. C. Brown and L. P. Black. AEX 460. Ohio State University Extension.
Hydrologic Atlas for Ohio: Average Annual Precipitation, Temperature, Streamflow, and Water Loss for the 50-Year Period 1931-1988. 1990. L. J. Hartstine. Water Inventory Report No. 28. ODNR Division of Water.
Inventory of Ohio's Lakes. 1980. Ohio Water Inventory Report No. 26. ODNR Division of Water.
Ohio Ground-Water Quality. USGS National Water Summary- Ohio. 1986. U.S. Geological Survey Water-Supply Paper 2325.
Ohio Ground-Water Resources. USGS National Water Summary- Ohio. 1984. U.S. Geological Survey Water-Supply Paper 2275.
Ohio Surface-Water Resources. USGS National Water Summary- Ohio. 1985. U.S. Geological Survey Water-Supply Paper 2300.
Soil and Water Conservation Engineering. 1993. G. O. Schwab, D. D. Fangmeier, W. J. Elliot, and R. K. Frevert. Wiley and Sons, NY.
69
What is Groundwater? 1988. L. S. Raymond. Bulletin No. l. New York State Water Resources Institute, Center for Environmental Research, Cornell University.
Acknowledgments
This publication was originally produced through the Water Resources Educational Materials Project funded by the Innovative Grant Program of Ohio State University Extension. Project Team: Larry C. Brown (Project Leader), Ron Overmyer (Sandusky County), John Hixson (Union County), Gary Wilson (Hancock County), Marcus Dresbach (Northwest District), Glen Arnold (Putnam County), Jay Johnson (School of Natural Resources), and Robert Roth (School of Natural Resources), The Ohio State University, and Leonard Black and Margo Fulmer (ODNR, Division of Water).
The author thanks Kim Wintringham (Associate Editor, Section of Communications and Technology) for editorial and graphic production.
70
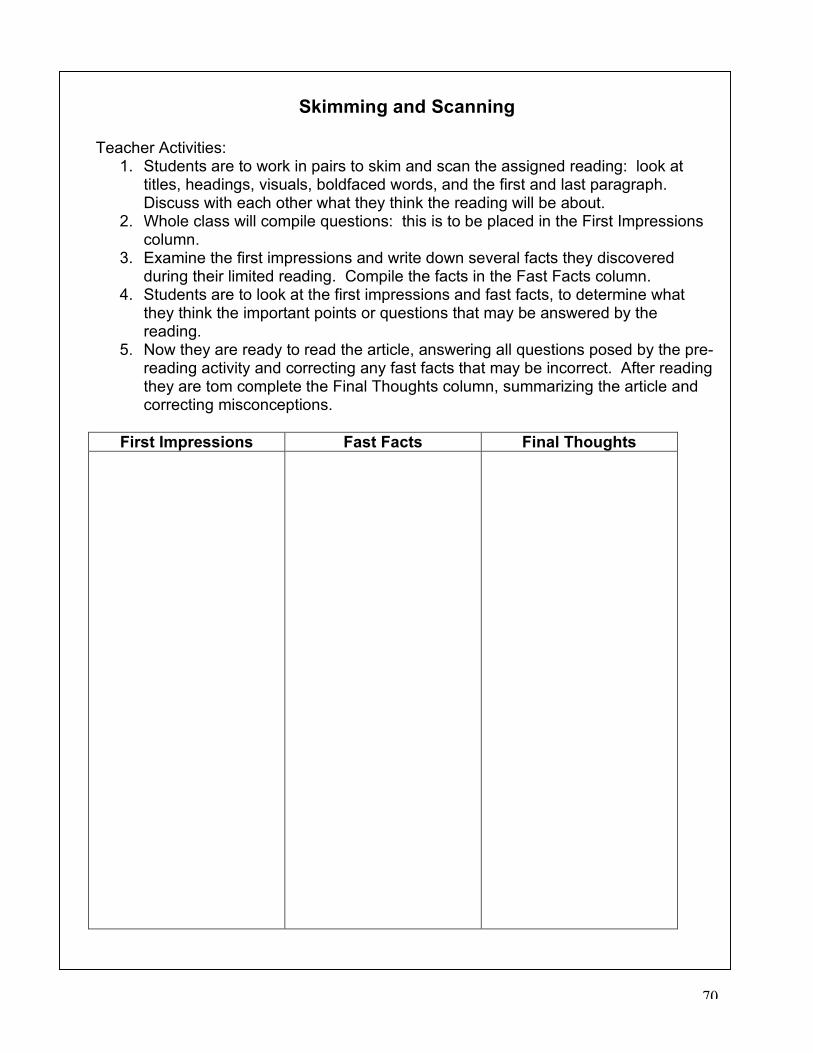
Skimming and Scanning
Teacher Activities: 1. Students are to work in pairs to skim and scan the assigned reading: look at
titles, headings, visuals, boldfaced words, and the first and last paragraph. Discuss with each other what they think the reading will be about.
2. Whole class will compile questions: this is to be placed in the First Impressions column.
3. Examine the first impressions and write down several facts they discovered during their limited reading. Compile the facts in the Fast Facts column.
4. Students are to look at the first impressions and fast facts, to determine what they think the important points or questions that may be answered by the reading.
5. Now they are ready to read the article, answering all questions posed by the pre-reading activity and correcting any fast facts that may be incorrect. After reading they are tom complete the Final Thoughts column, summarizing the article and correcting misconceptions.
First Impressions Fast Facts Final Thoughts
71
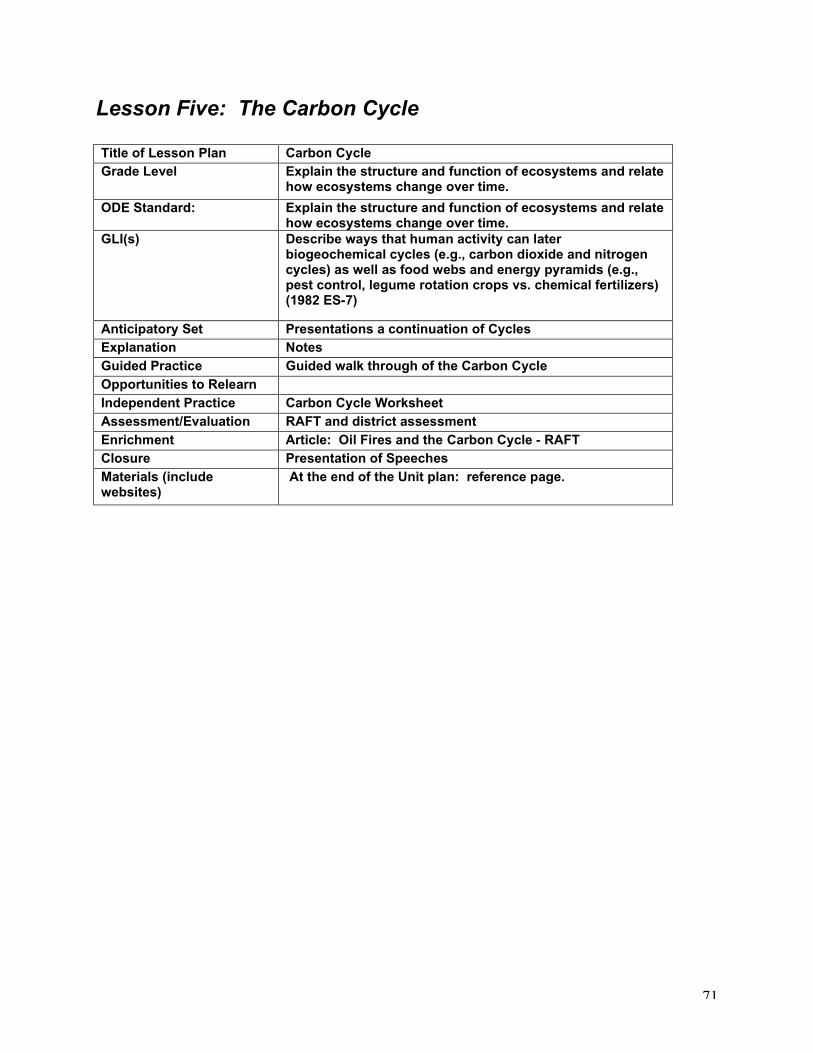
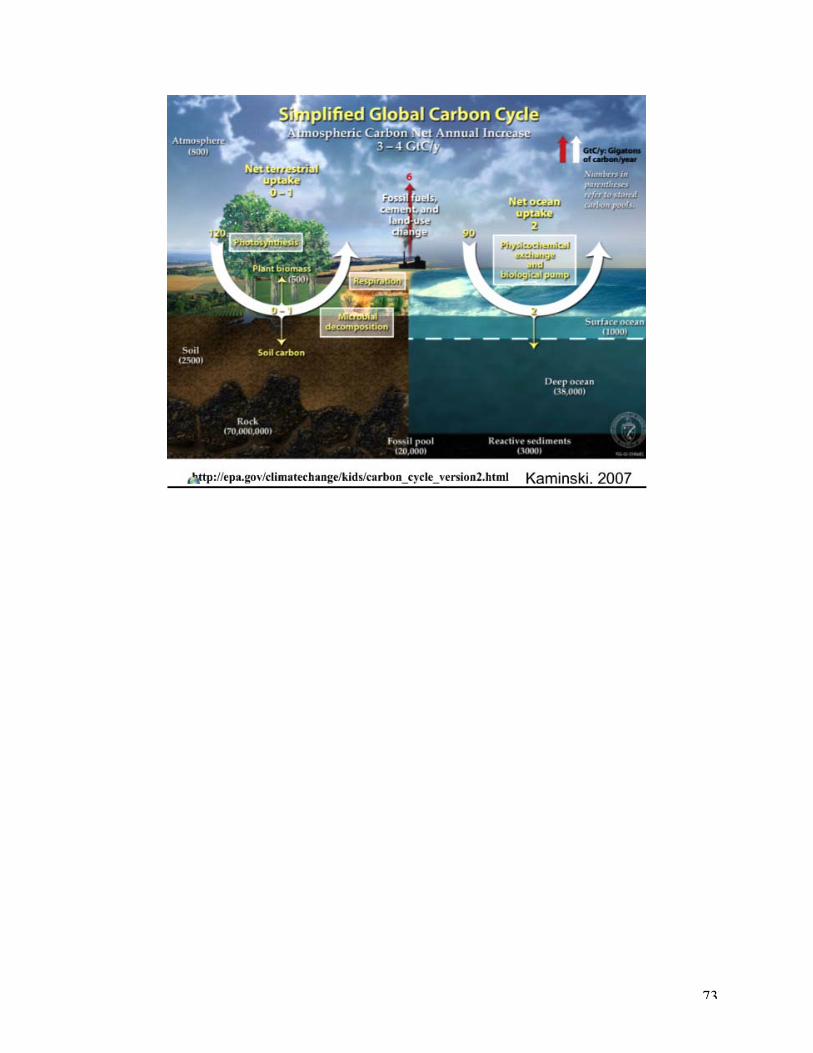
Lesson Five: The Carbon Cycle Title of Lesson Plan Carbon Cycle Grade Level Explain the structure and function of ecosystems and relate
how ecosystems change over time. ODE Standard: Explain the structure and function of ecosystems and relate
how ecosystems change over time. GLI(s) Describe ways that human activity can later
biogeochemical cycles (e.g., carbon dioxide and nitrogen cycles) as well as food webs and energy pyramids (e.g., pest control, legume rotation crops vs. chemical fertilizers) (1982 ES-7)
Anticipatory Set Presentations a continuation of Cycles Explanation Notes Guided Practice Guided walk through of the Carbon Cycle Opportunities to Relearn Independent Practice Carbon Cycle Worksheet Assessment/Evaluation RAFT and district assessment Enrichment Article: Oil Fires and the Carbon Cycle - RAFT Closure Presentation of Speeches Materials (include websites)
At the end of the Unit plan: reference page.
72
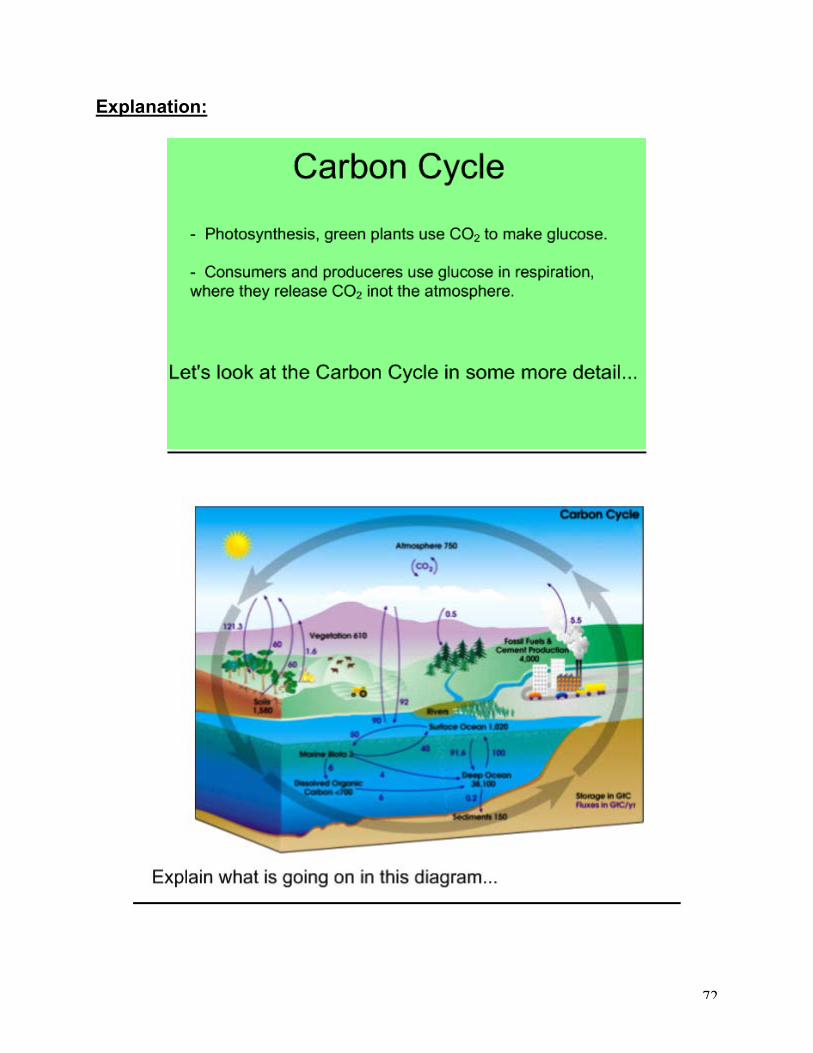
Explanation:
73
74
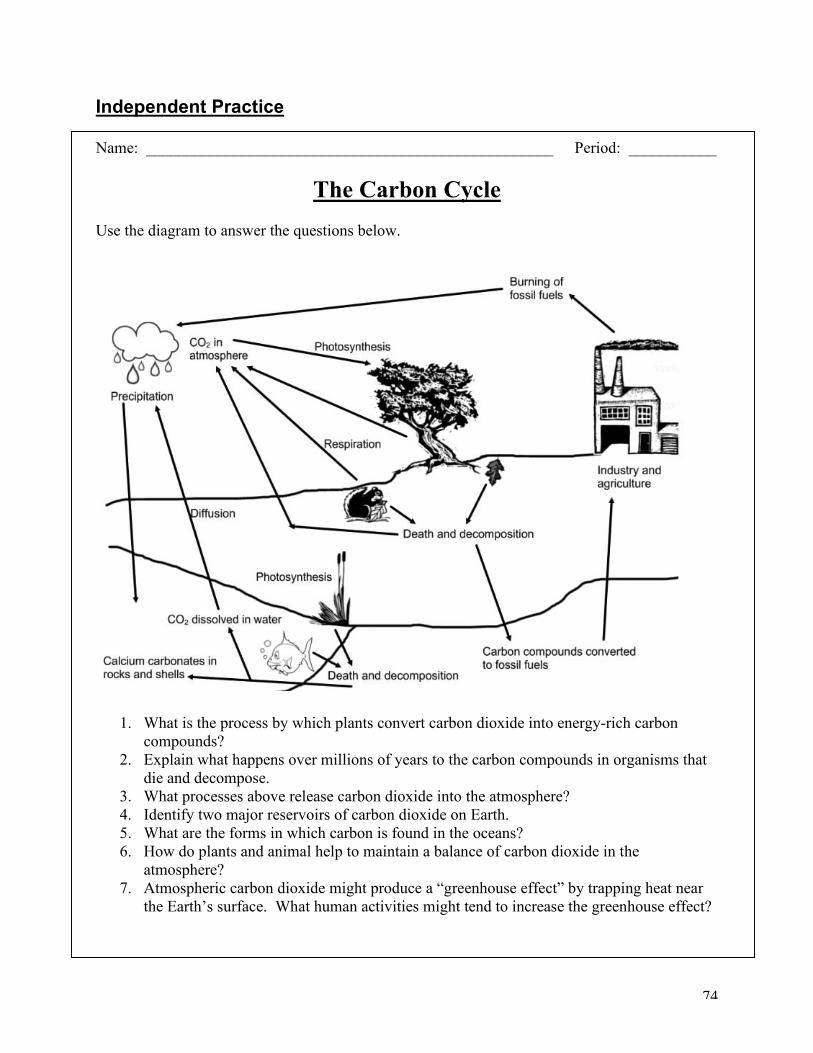
Independent Practice Name: ___________________________________________________ Period: ___________
The Carbon Cycle Use the diagram to answer the questions below.
1. What is the process by which plants convert carbon dioxide into energy-rich carbon compounds?
2. Explain what happens over millions of years to the carbon compounds in organisms that die and decompose.
3. What processes above release carbon dioxide into the atmosphere? 4. Identify two major reservoirs of carbon dioxide on Earth. 5. What are the forms in which carbon is found in the oceans? 6. How do plants and animal help to maintain a balance of carbon dioxide in the
atmosphere? 7. Atmospheric carbon dioxide might produce a “greenhouse effect” by trapping heat near
the Earth’s surface. What human activities might tend to increase the greenhouse effect?

75
Assessment/Enrichment RAFT Role – Environmentalist whose area of expertise is the Carbon Cycle and the human activities that alter the cycle. Audience – high school science teachers Format – Speech (you will be writing this out first, them presenting) Topic – the carbon cycle and the effects of the Middle East oil fires on the environment.
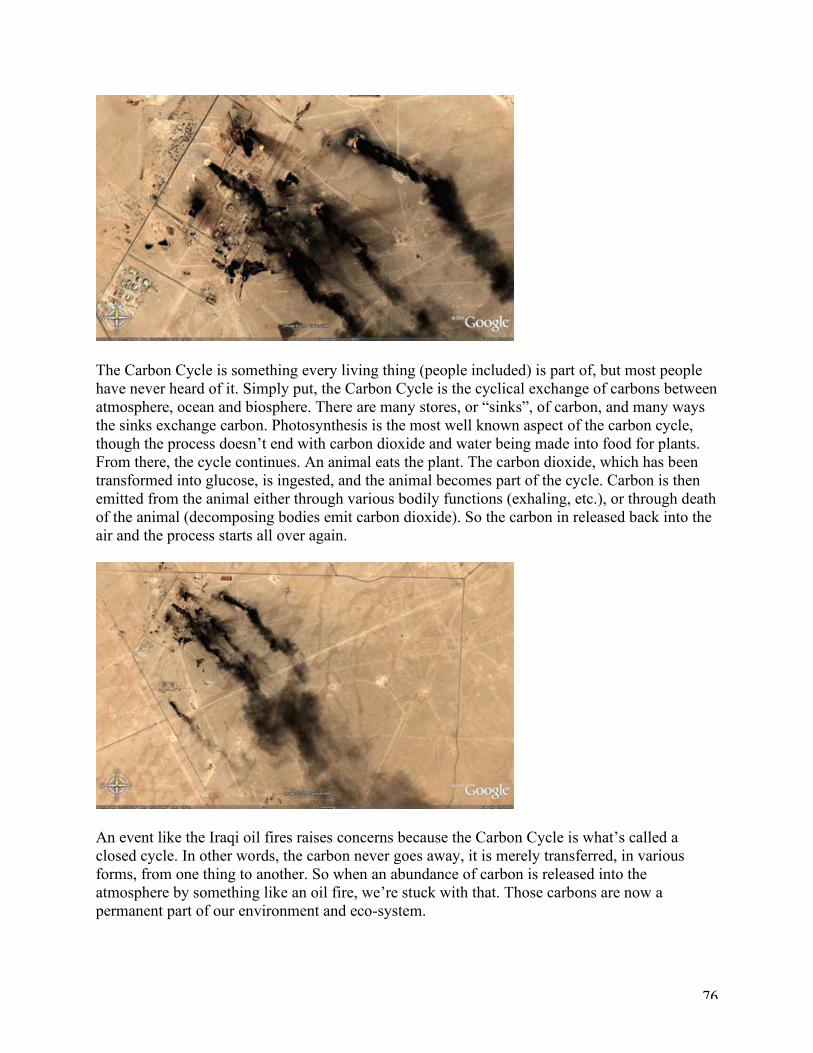
July 27, 2005 Oil Fires and the Carbon Cycle by Stefanie Hamilton
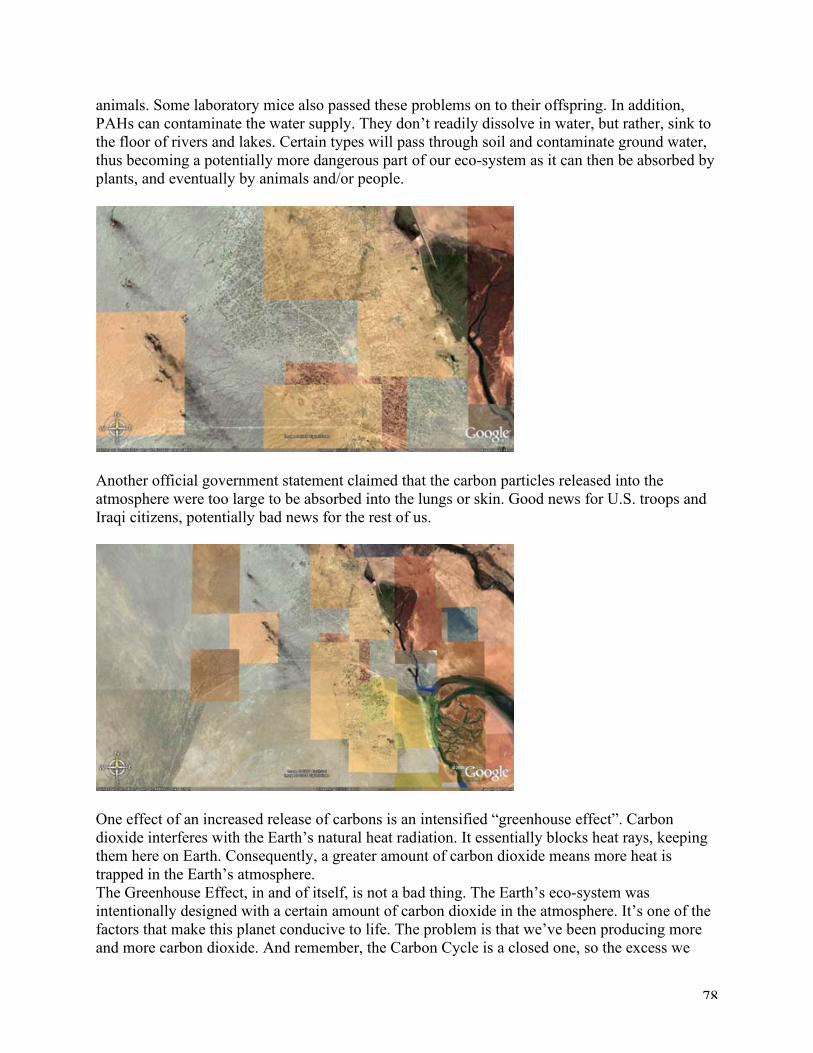
In 1991, and again in March of 2003, oil fires became a serious environmental concern. In 1991, it was the Kuwait oil fields, set ablaze by Sadaam Hussein. In March of 2003, it was the oil fields in Iraq itself, also believed to have been set on fire by Sadaam’s people.
This satellite imagery shows some of the burning oil wells of 2003. The intense, black smoke created a litany of environmental and human concerns, one of which focused on the carbon dioxide released by the smoke.
76
The Carbon Cycle is something every living thing (people included) is part of, but most people have never heard of it. Simply put, the Carbon Cycle is the cyclical exchange of carbons between atmosphere, ocean and biosphere. There are many stores, or “sinks”, of carbon, and many ways the sinks exchange carbon. Photosynthesis is the most well known aspect of the carbon cycle, though the process doesn’t end with carbon dioxide and water being made into food for plants. From there, the cycle continues. An animal eats the plant. The carbon dioxide, which has been transformed into glucose, is ingested, and the animal becomes part of the cycle. Carbon is then emitted from the animal either through various bodily functions (exhaling, etc.), or through death of the animal (decomposing bodies emit carbon dioxide). So the carbon in released back into the air and the process starts all over again.
An event like the Iraqi oil fires raises concerns because the Carbon Cycle is what’s called a closed cycle. In other words, the carbon never goes away, it is merely transferred, in various forms, from one thing to another. So when an abundance of carbon is released into the atmosphere by something like an oil fire, we’re stuck with that. Those carbons are now a permanent part of our environment and eco-system.
77
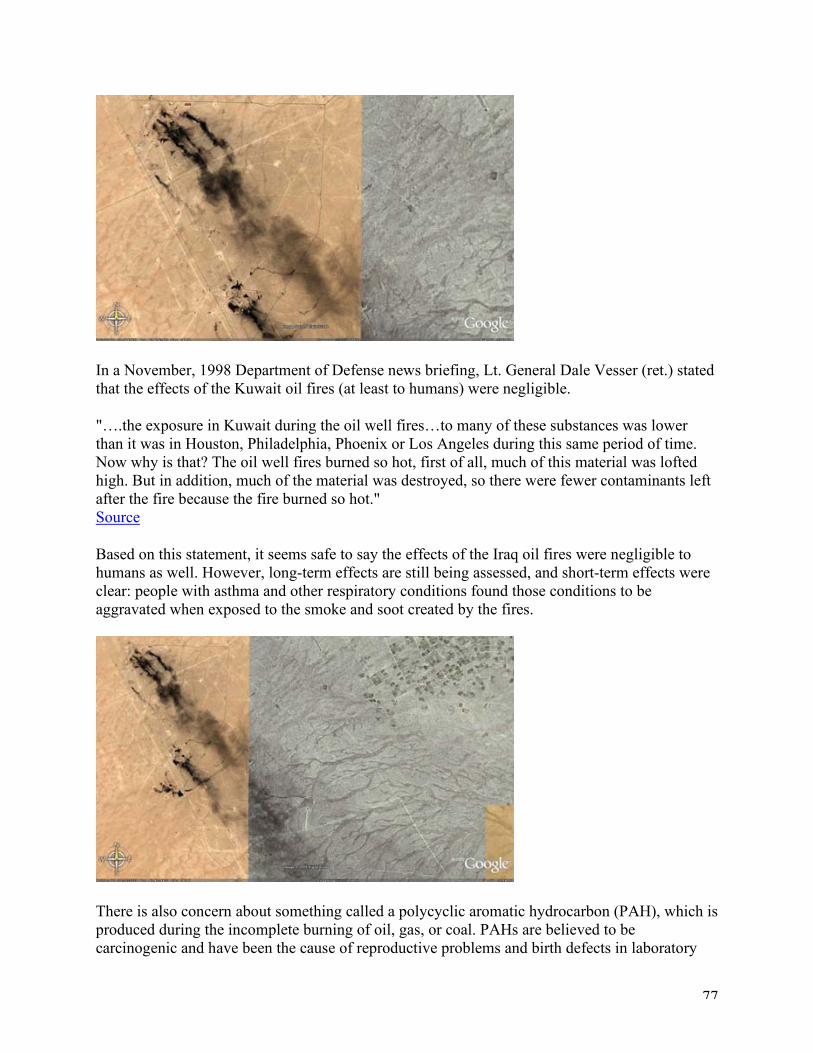
In a November, 1998 Department of Defense news briefing, Lt. General Dale Vesser (ret.) stated that the effects of the Kuwait oil fires (at least to humans) were negligible.
"….the exposure in Kuwait during the oil well fires…to many of these substances was lower than it was in Houston, Philadelphia, Phoenix or Los Angeles during this same period of time. Now why is that? The oil well fires burned so hot, first of all, much of this material was lofted high. But in addition, much of the material was destroyed, so there were fewer contaminants left after the fire because the fire burned so hot." Source
Based on this statement, it seems safe to say the effects of the Iraq oil fires were negligible to humans as well. However, long-term effects are still being assessed, and short-term effects were clear: people with asthma and other respiratory conditions found those conditions to be aggravated when exposed to the smoke and soot created by the fires.
There is also concern about something called a polycyclic aromatic hydrocarbon (PAH), which is produced during the incomplete burning of oil, gas, or coal. PAHs are believed to be carcinogenic and have been the cause of reproductive problems and birth defects in laboratory
78
animals. Some laboratory mice also passed these problems on to their offspring. In addition, PAHs can contaminate the water supply. They don’t readily dissolve in water, but rather, sink to the floor of rivers and lakes. Certain types will pass through soil and contaminate ground water, thus becoming a potentially more dangerous part of our eco-system as it can then be absorbed by plants, and eventually by animals and/or people.
Another official government statement claimed that the carbon particles released into the atmosphere were too large to be absorbed into the lungs or skin. Good news for U.S. troops and Iraqi citizens, potentially bad news for the rest of us.
One effect of an increased release of carbons is an intensified “greenhouse effect”. Carbon dioxide interferes with the Earth’s natural heat radiation. It essentially blocks heat rays, keeping them here on Earth. Consequently, a greater amount of carbon dioxide means more heat is trapped in the Earth’s atmosphere. The Greenhouse Effect, in and of itself, is not a bad thing. The Earth’s eco-system was intentionally designed with a certain amount of carbon dioxide in the atmosphere. It’s one of the factors that make this planet conducive to life. The problem is that we’ve been producing more and more carbon dioxide. And remember, the Carbon Cycle is a closed one, so the excess we
79
produce sticks around. This means that all the additional carbon produced by the Iraqi oil fires hasn’t dissipated, and never will. It’s now a permanent part of the cycle.
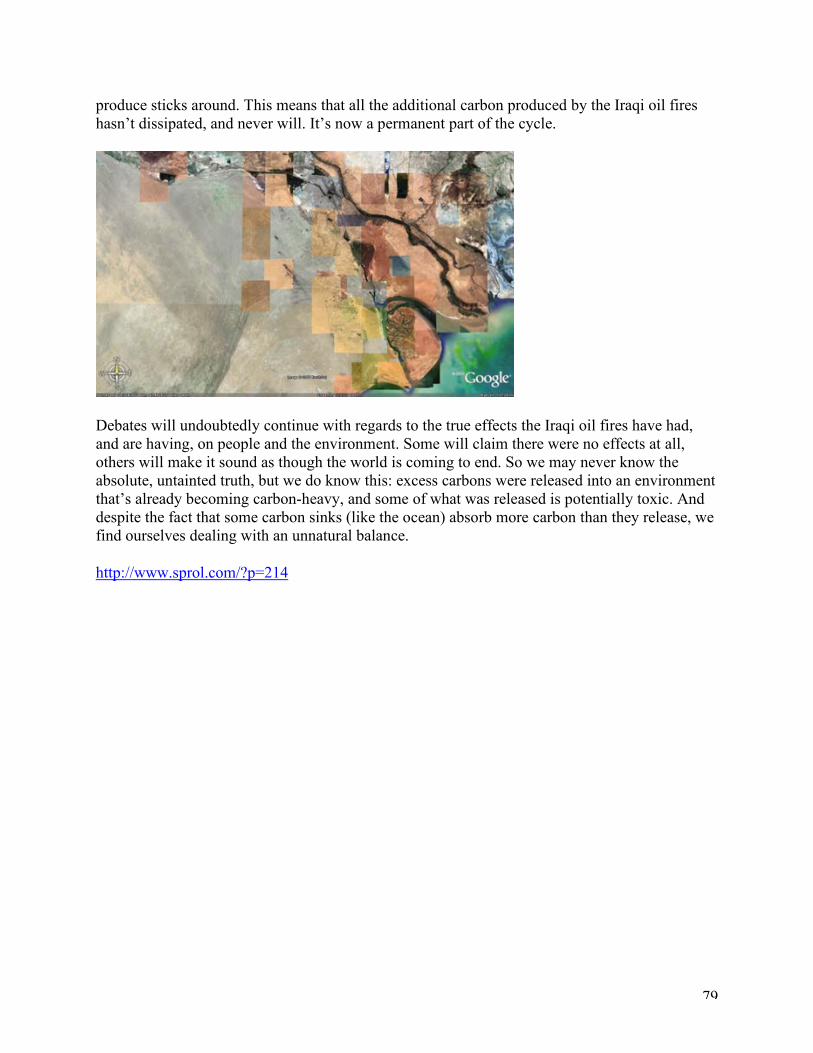
Debates will undoubtedly continue with regards to the true effects the Iraqi oil fires have had, and are having, on people and the environment. Some will claim there were no effects at all, others will make it sound as though the world is coming to end. So we may never know the absolute, untainted truth, but we do know this: excess carbons were released into an environment that’s already becoming carbon-heavy, and some of what was released is potentially toxic. And despite the fact that some carbon sinks (like the ocean) absorb more carbon than they release, we find ourselves dealing with an unnatural balance.
http://www.sprol.com/?p=214
80
Lesson Six: The Nitrogen Cycle Title of Lesson Plan Nitrogen Cycle Grade Level 10 ODE Standard: Explain the structure and function of ecosystems and relate
how ecosystems change over time. GLI(s) Describe ways that human activity can later
biogeochemical cycles (e.g., carbon dioxide and nitrogen cycles) as well as food webs and energy pyramids (e.g., pest control, legume rotation crops vs. chemical fertilizers) (1982 ES-7)
Anticipatory Set Continuation of Cycles presentations Explanation Notes Guided Practice Walk through the Nitrogen Cycle: embedded in
presentation Opportunities to Relearn Nitrogen, Farms, Fish, Bears, and Salmon Independent Practice Pesticide Spraying Lab Assessment/Evaluation Pesticide Spraying Lab: District Assessment Enrichment Cycle Series: The Nitrogen Cycle Video - United Streaming
Closure Question to discuss in pairs: How are all of the cycles discussed (water, nitrogen, and carbon) all related to some of the environmental and atmospheric issues happening worldwide?
Materials (include websites)
At the end of the Unit plan: reference page.

81
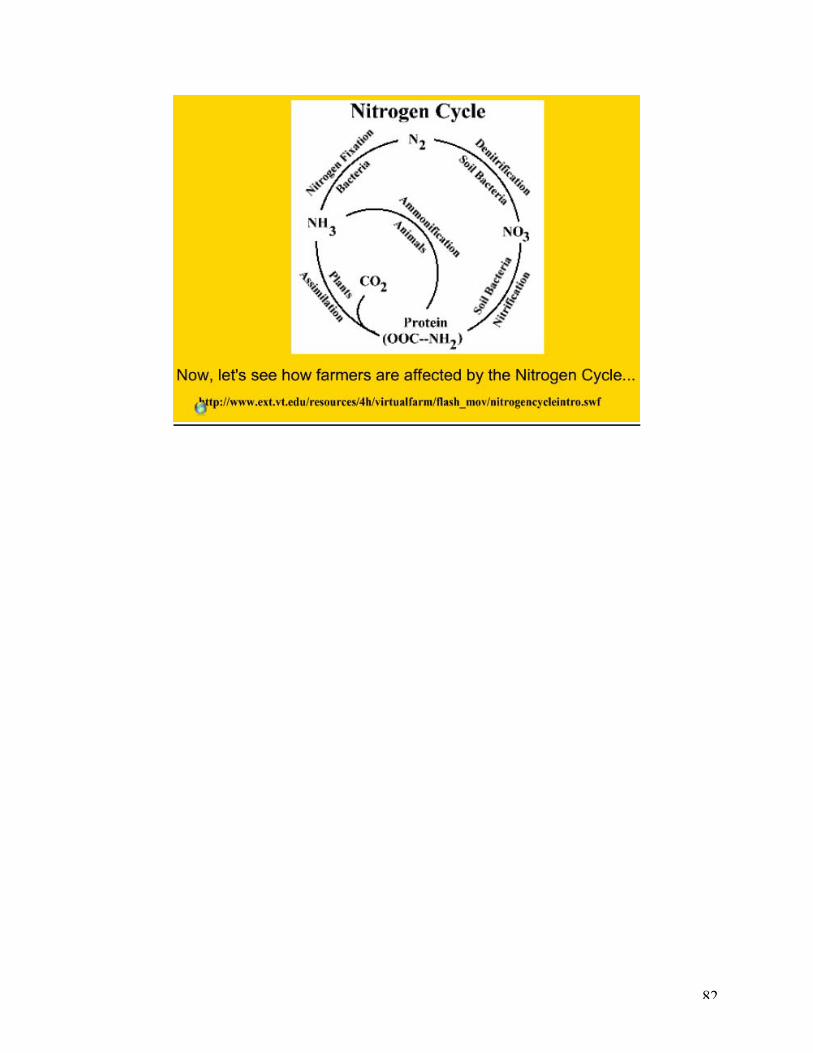
Explanation
82

83
Opportunities to Relearn:
Name: ___________________________________________
Nitrogen, Farms, Fish, Bears, and Salmon Farmer A has a large farm on which he grows corn. Through his farm flows a small creek which empties into a lake. This farmer sprays nitrogen fertilizer on his crops several times a year. Due to the weather patterns where he lives it often rains within several days of the application of the fertilizer. The lake near him has been a major recreation area with clear water and good fishing. Recently, clear water has become brownish green with mats of algae floating on the surface by late summer, resulting in fish kills. In the fall and winter there are many dead fish floating on the surface of the lake and drifting to shore. Recreation at the lake is coming to a halt because of the murky water and the dead fish. Farmer B has a similar large farm in which he grows corn one year and soybeans the next. Through his farm also flows a small creek, which empties into a similar lake. This farmer does not spray any nitrogen fertilizer on his crops. He knows that soybeans have bacteria on their roots which take the atmospheric oxygen and convert it into a form of nitrogen that the plants can use. The rainfall is similar to Farmer A’s area. The lake near him is and remains a major recreation area. The water is clear and there is good fishing. There is no algae floating in the late summer and there are no fish kills. Answer the following questions on a separate sheet of paper. 1. What is the most probable cause of the algae growing in the lake near farmer A’s farm? 2. Why would increased nitrogen cause the algae to grow? 3. What would cause the fish to die? 4. Why did the algae not increase in the lake near farmer B? Extended Questions 1. If fossil fuels contain nitrogen what happens to the nitrogen oxide gas (NO) that is produced when they are burned? 2. As human populations increase, more food is needed. To meet the increasing demand crops are grown using fertilizer to increase their yield. What happens to the excess fertilizer? 3. What would happen to the coastal marine fisheries when nitrogen fertilizer follows the rivers to the ocean? 4. Farmers raise cattle, hogs and chickens in large numbers. Their waste contains large amounts of nitrogen. What takes place when that waste enters a water system such as a creek, lake or river?
84
Independent Practice and Assessment
Name: ___________________________________
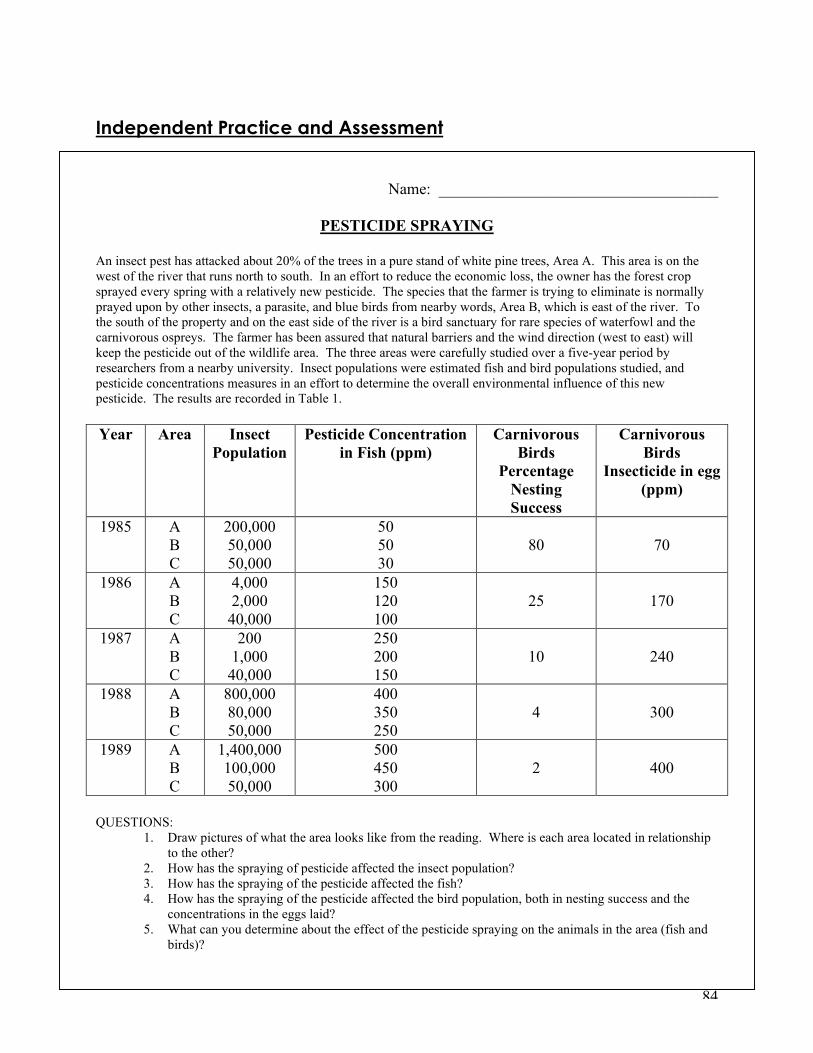
PESTICIDE SPRAYING
An insect pest has attacked about 20% of the trees in a pure stand of white pine trees, Area A. This area is on the west of the river that runs north to south. In an effort to reduce the economic loss, the owner has the forest crop sprayed every spring with a relatively new pesticide. The species that the farmer is trying to eliminate is normally prayed upon by other insects, a parasite, and blue birds from nearby words, Area B, which is east of the river. To the south of the property and on the east side of the river is a bird sanctuary for rare species of waterfowl and the carnivorous ospreys. The farmer has been assured that natural barriers and the wind direction (west to east) will keep the pesticide out of the wildlife area. The three areas were carefully studied over a five-year period by researchers from a nearby university. Insect populations were estimated fish and bird populations studied, and pesticide concentrations measures in an effort to determine the overall environmental influence of this new pesticide. The results are recorded in Table 1. Year Area Insect
Population Pesticide Concentration
in Fish (ppm) Carnivorous
Birds Percentage
Nesting Success
Carnivorous Birds
Insecticide in egg (ppm)
1985 A B C
200,000 50,000 50,000
50 50 30
80
70
1986 A B C
4,000 2,000 40,000
150 120 100
25
170
1987 A B C
200 1,000 40,000
250 200 150
10
240
1988 A B C
800,000 80,000 50,000
400 350 250
4
300
1989 A B C
1,400,000 100,000 50,000
500 450 300
2
400
QUESTIONS:
1. Draw pictures of what the area looks like from the reading. Where is each area located in relationship to the other?
2. How has the spraying of pesticide affected the insect population? 3. How has the spraying of the pesticide affected the fish? 4. How has the spraying of the pesticide affected the bird population, both in nesting success and the
concentrations in the eggs laid? 5. What can you determine about the effect of the pesticide spraying on the animals in the area (fish and
birds)?
85
Lesson Seven: Atmospheric Issues Title of Lesson Plan Atmospheric Issues Grade Level 10 ODE Standard: Explain the structure and function of ecosystems and relate
how ecosystems change over time. GLI(s) Explain how the acquisition and use of resources, urban
growth, and waste disposal can accelerate natural change and impact the quality of life. (1981/EES - 5) Describe ways that human activity can alter biogeochemical cycles (e.g., carbon and nitrogen cycles) as well as food webs and energy pyramids (e.g., pest control, legume crop rotation vs. chemical fertilizers) (1982 ES - 7) Describe advances and issues in Earth and space science that have important long-lasting effects on science and society (e.g., geological time scales, global warming, depletion of resources, exponential population growth). (1983 / ES - 7)
Anticipatory Set Cartoon Motivation: Based on what they know about biogeochemical cycles and previous topics throughout the year students should be able to infer from the cartoon that Global Warming is the main topic. This will lead into a brief introduction to how humans affect biogeochemical cycles and the atmospheric issues associated.
Explanation Notes: Atmospheric Issues Guided Practice Video: Global Warming (EHS science dept) Opportunities to Relearn Global Warming Connections Independent Practice Assessment Questions related to Lab and Video Assessment/Evaluation Lab and Video Questions; District assessment Enrichment In order to bring the lessons on cycles and atmospheric
issues together students will complete a grafiti on several issues.
Closure Discussion of Enrichment Materials (include websites)
At the end of the Unit plan: reference page.

86
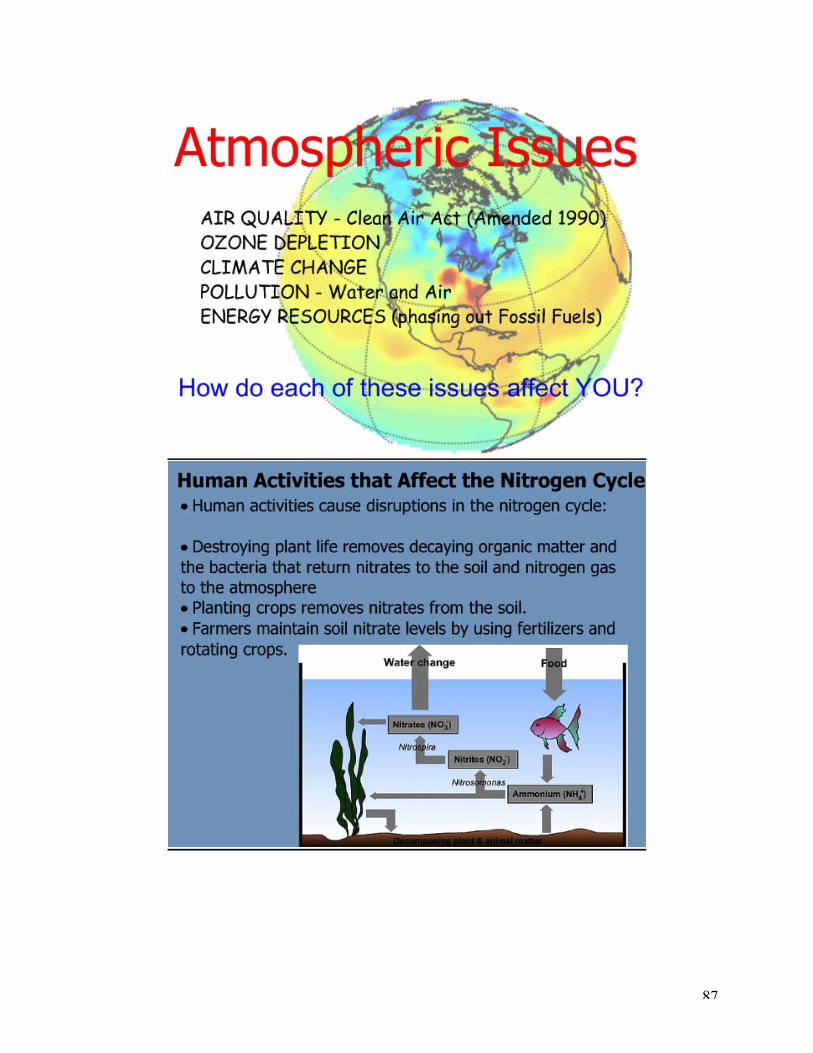
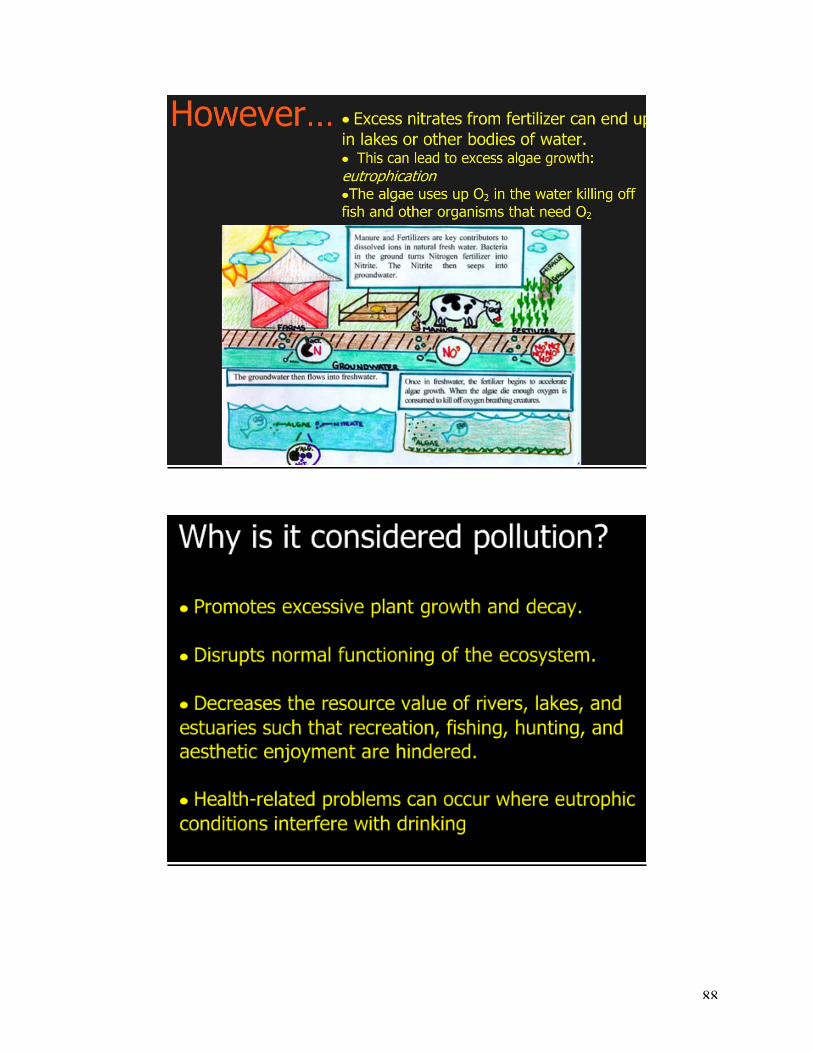
Anticipatory Set:
Explanation:
87
88

89

90
91
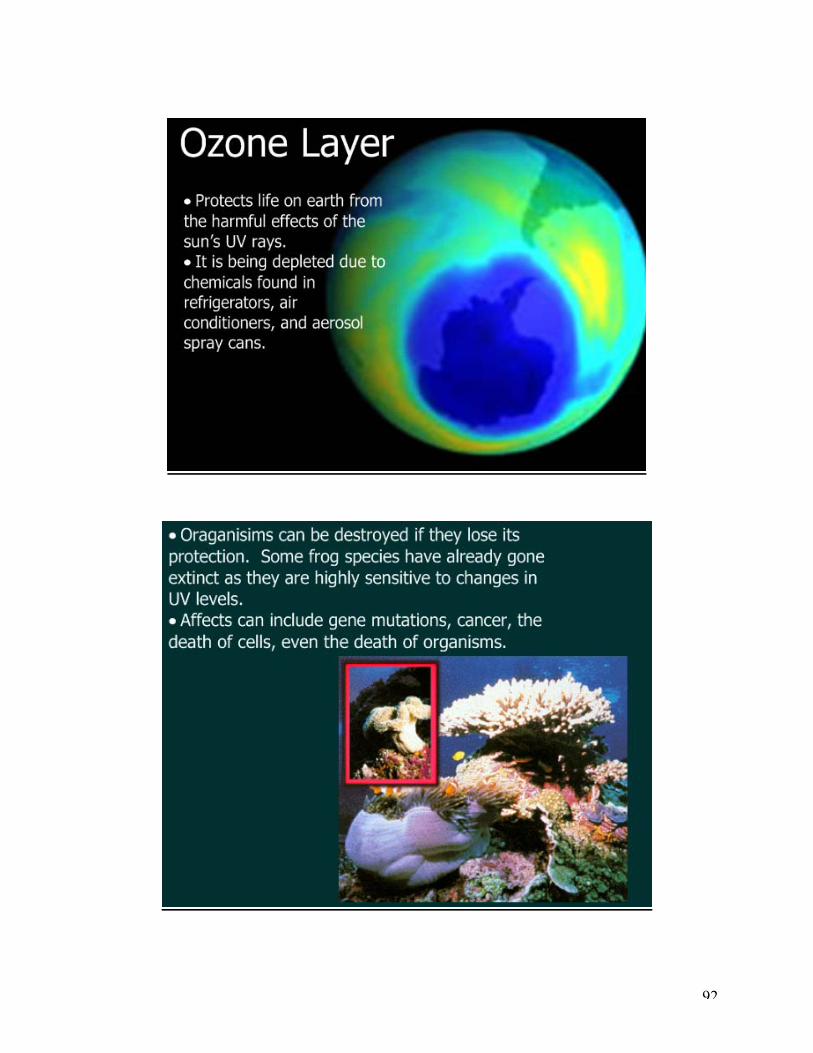
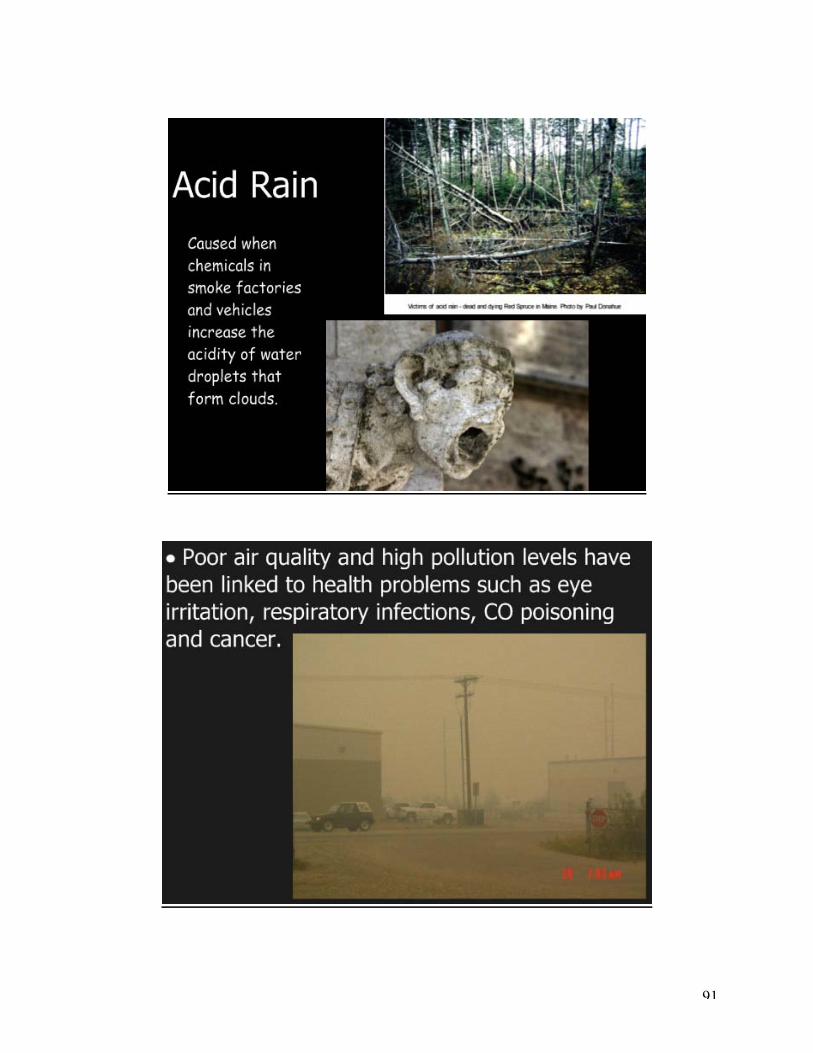
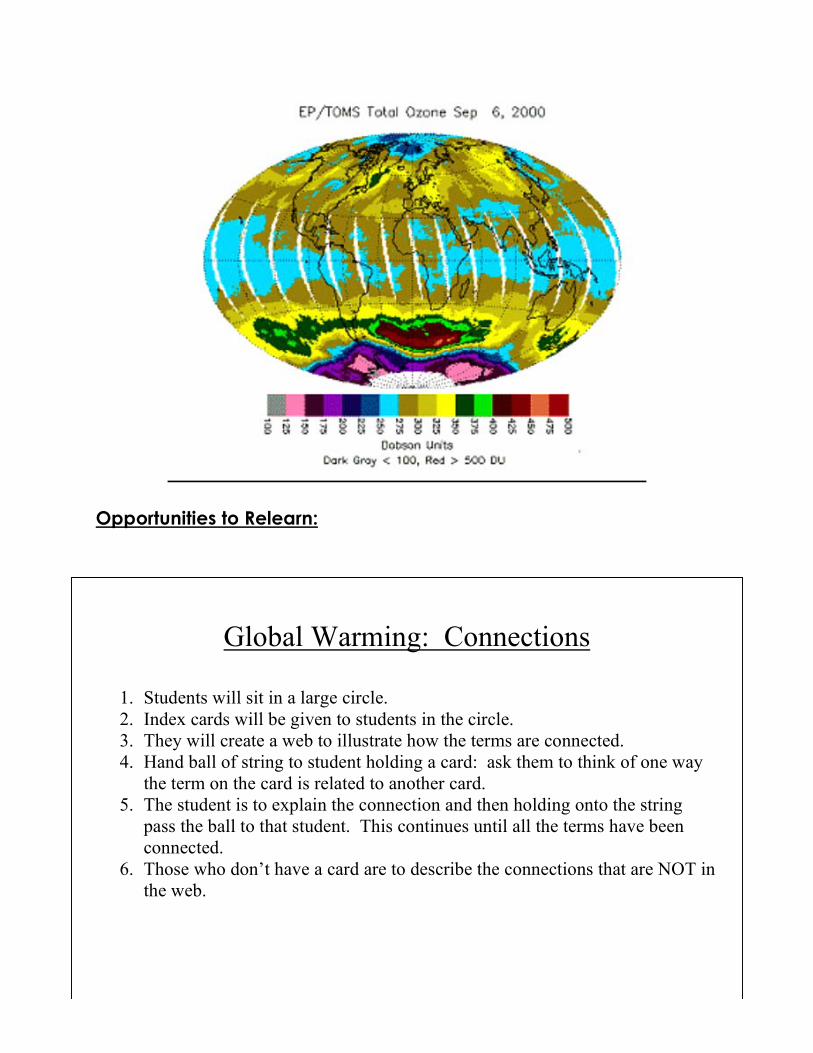
92
93
Opportunities to Relearn:
Global Warming: Connections
1. Students will sit in a large circle. 2. Index cards will be given to students in the circle. 3. They will create a web to illustrate how the terms are connected. 4. Hand ball of string to student holding a card: ask them to think of one way
the term on the card is related to another card. 5. The student is to explain the connection and then holding onto the string
pass the ball to that student. This continues until all the terms have been connected.
6. Those who don’t have a card are to describe the connections that are NOT in the web.
94
Terms to be written on note cards: Global Warming Greenhouse Effect Gulf Stream Ocean water Sea ice Glacier Permafrost Climate in Western Europe Polar bear Large waves Fossil fuel Coastline erosion SUV Methane Severe weather events Name: _____________________________________________ Period: ________
Global Warming: Connections
1. Why are natural greenhouse gases beneficial?
2. What does the global climate system do?
3. If the polar ice disappears, what problems could result?
4. Is global warming a natural or human-induced event? Explain.

95
5. Where do most carbon emissions come from?
6. Why is the artic an ideal place to study climate?
7. How do ocean movements control global temperatures?
8. Why is it important to research and study global warming? Enrichment and Closure:
Atmospheric Issues
Instructions: You will rotate the “poster papers” around the room, when it gets to your group, you are to use the colored markers given to you and fill in any ideas that you have regarding the topic. You are not to repeat statements.
- The comments or statements do not need to be in complete sentences; you can draw pictures and
96
keep it simple or as complex as you want. Remember, you cannot repeat ideas.
- When we are finished then we will look for
overlapping ideas and look for misconceptions.
1. Carbon Cycle 2. Water Cycle 3. Nitrogen Cycle 4. Pollution 5. Global Warming
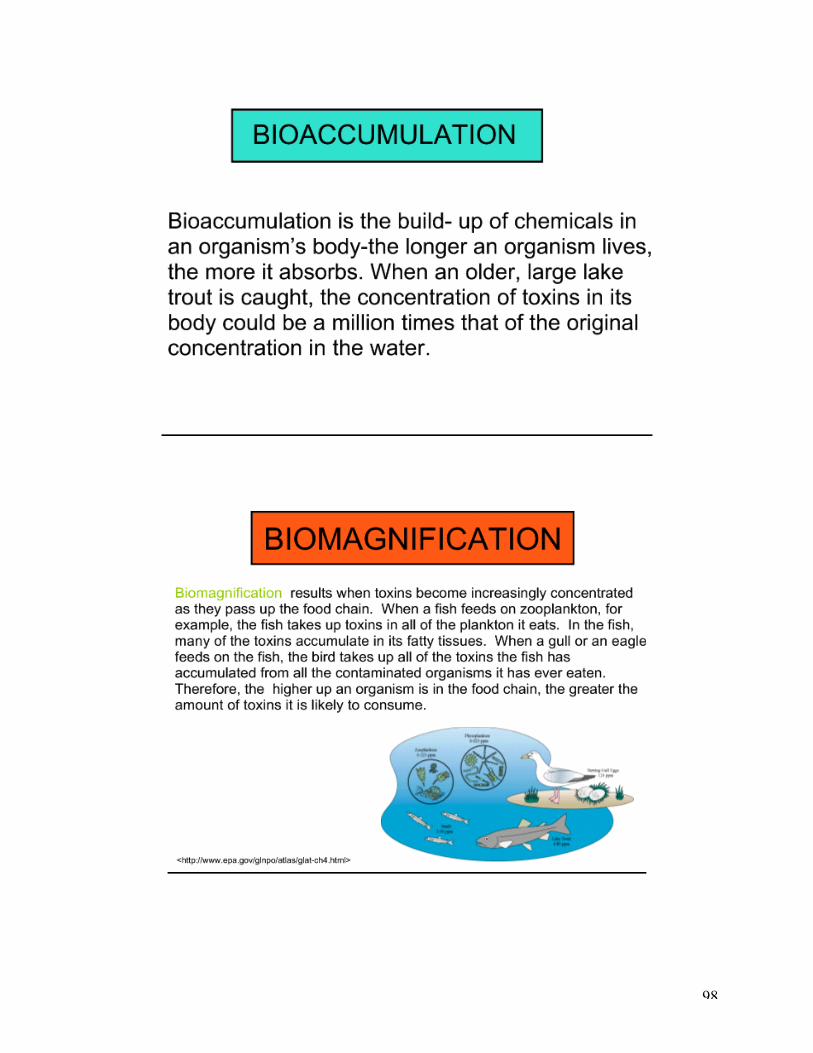
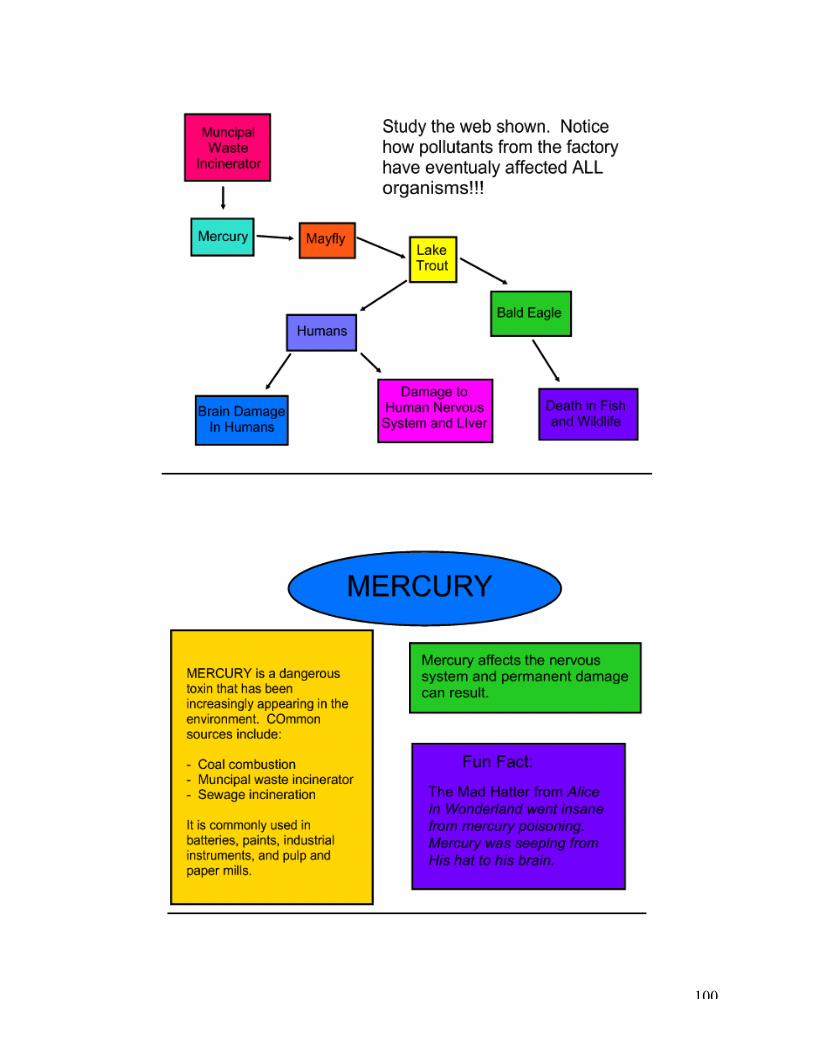
Lesson Eight: Biomagnification Title of Lesson Plan Biomagnification Grade Level 10 ODE Standard: Explain the structure and function of ecosystems and
relate how ecosystems change over time. GLI(s) Explain how the acquisition and use of resources, urban
growth, and waste disposal can accelerate natural change and impact the quality of life. (1981/EES - 5) Describe ways that human activity can alter biogeochemical cycles (e.g., carbon and nitrogen cycles) as well as food webs and energy pyramids (e.g., pest control, legume crop rotation vs. chemical fertilizers) (1982 ES - 7) Describe advances and issues in Earth and space science that have important long-lasting effects on science and society (e.g., geological time scales, global warming, depletion of resources, exponential population growth). (1983 / ES - 7)
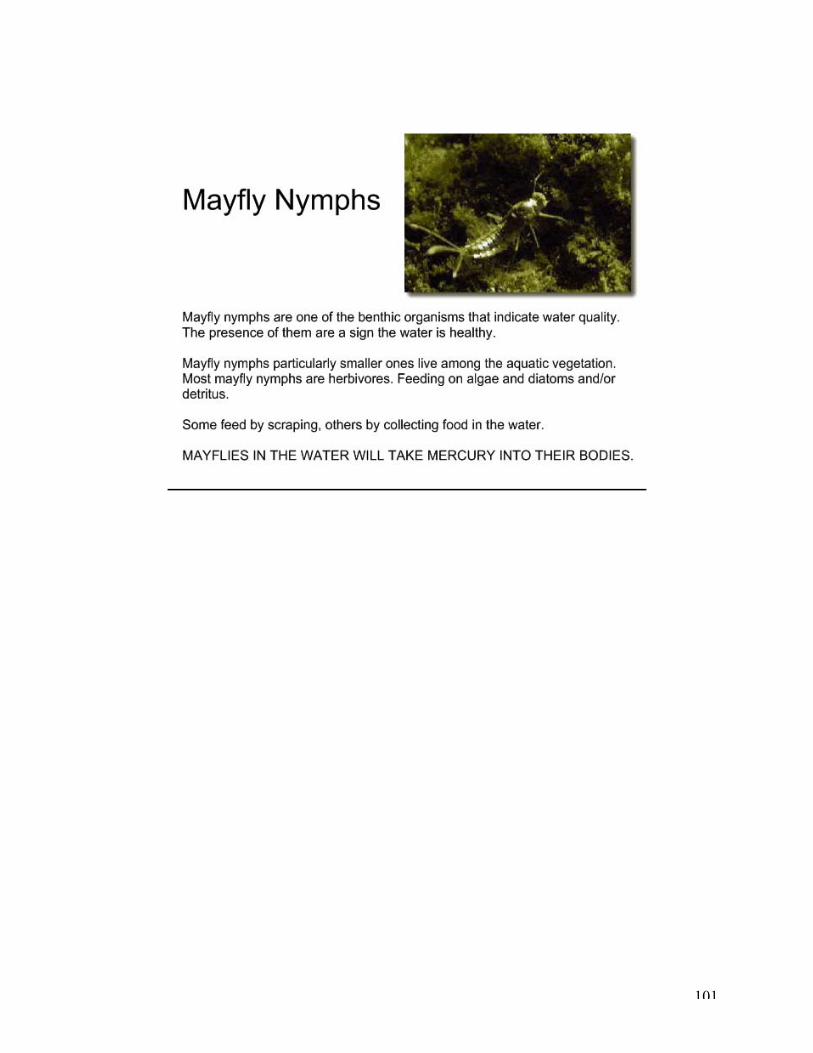
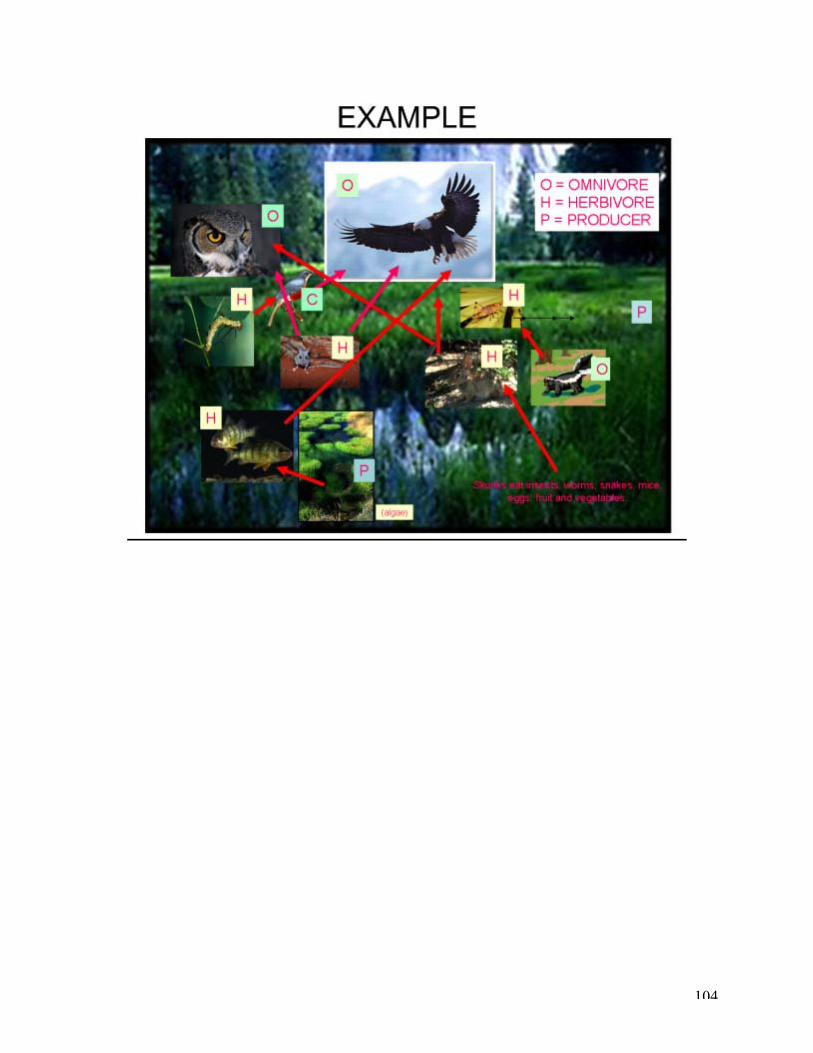
Anticipatory Set Extension of Atmospheric Issues Explanation Notes: Where do all the toxins go? Guided Practice Trace the path of mercury through the food web Opportunities to Relearn Extensions Independent Practice Biomagnification Project Assessment/Evaluation Biomagnification Project; District assessment

97
Enrichment Closure Presentation of Project Materials (include websites)
At the end of the Unit plan: reference page.
98

99
100
101
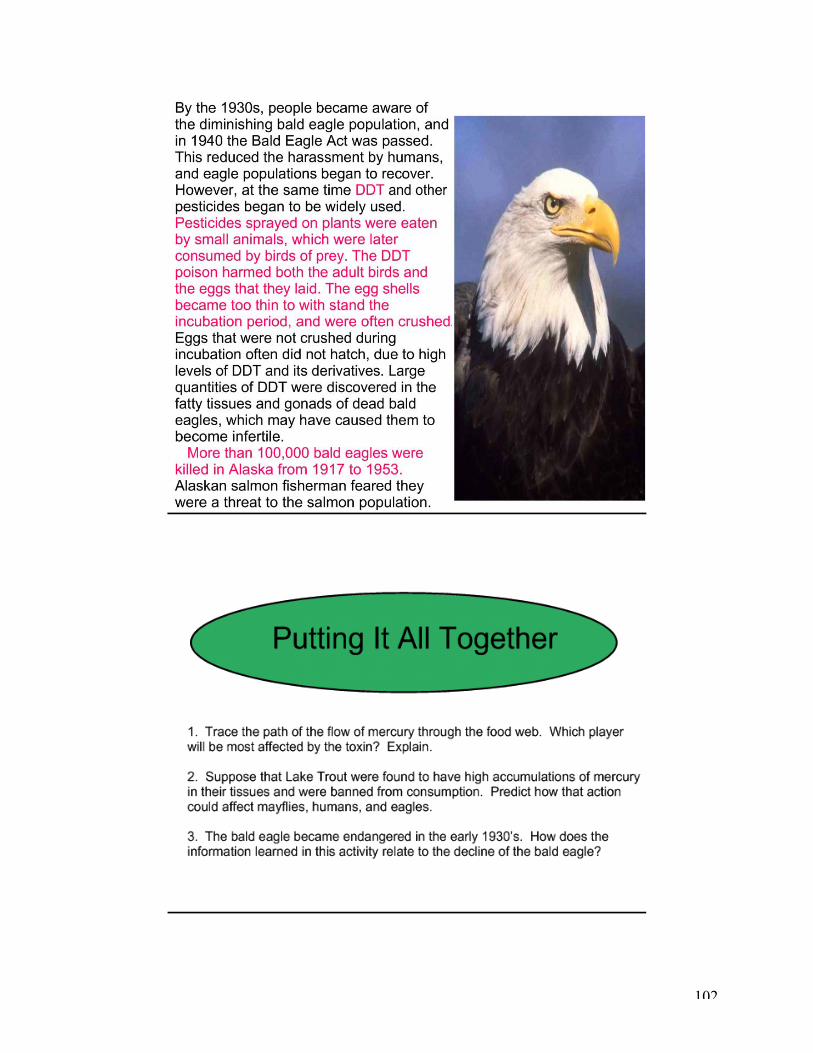
102

103
104

105
References
Who’s Who in an Ecosystem http://www.pse.com/images/spot/ecosystem.jpg http://gastateparks.org/content/Georgia/parks/education/LakeEcosystem_Poster.jpg http://www.globalchange.umich.edu/globalchange1/current/lectures/ecol_com/foodweb2.jpg http://www.jaredchapman.com/Images/illustration/food_web.jpg http://yennadon.sd42.ca/online/science/ecology/animalfoodweb.html http://knicelybiology.pbwiki.com/3-2+How+Organisms+Interact http://www.cals.ncsu.edu/course/ent525/soil/soilpix/pages/termites_jpg.htm http://techalive.mtu.edu/meec/module10/Decomposition2.html http://pubs.usgs.gov/of/1998/of98-805/lessons/chpt7/index.htm http://www.niles-hs.k12.il.us/jacnau/chpt54.html Food Webs and Food Chains http://www.intarttiles.com/robertekennedy.htm http://www.niles-hs.k12.il.us/jacnau/chpt54.html http://www.absc.usgs.gov/research/seabird_foragefish/marinehabitat/home.html http://www.sciencebob.com/lab/webchainpics.html http://www.agen.ufl.edu/~chyn/age2062/lect/lect_28/40_07.GIF http://www.ecokids.ca/pub/eco_info/topics/frogs/chain_reaction/index.cfm http://teacher.scholastic.com/activities/explorer/ecosystems/be_an_explorer/map/line_experiment14.swf http://www.gould.edu.au/foodwebs/kids_web.htm http://www.harcourtschool.com/activity/food/food_menu.html Biological Interactions http://www.physicalgeography.net/fundamentals/9f.html http://www.wordinfo.info/words/index/info/view_unit/3560 http://www.oceanlight.com/lightbox.php?sp=eschrichtius_robustus http://www.aims.gov.au/pages/research/project-net/marine-creatures/clownfish.html http://www.nearctica.com/ecology/pops/symblink.htm http://www.scar.utoronto.ca/~olaveson/A02Y-S2006.html http://www.downlandvets.co.uk/Pages/Clinical/Pages/Fleas.html http://www.austinpestcontrolservice.com/austin_tx_texas/fleaandtickcontrol.htm http://www.entomon.net/viceroy-monarch-butterfly-mimicry.htm http://www.sparknotes.com/biology/microorganisms/protista/section2.rhtml http://www.microscopy-uk.org.uk/mag/indexmag.html?http://www.microscopy-uk.org.uk/mag/artmay99/jevimag.html http://www.ndpteachers.org/perit/paramecium1.jpg http://www.rkm.com.au/imagelibrary/CELL-SET.html http://ebiomedia.com/prod/ProtistsVideoDVD.html http://protist.i.hosei.ac.jp/pdb/Images/Ciliophora/Didinium/index.html

106
http://www.microscope-microscope.org/applications/pond-critters/protozoans/ciliphora/didinium.htm http://ebiomedia.com/gall/micronat/relationships.html http://www.hrw.com/ Larson, Gary. Far Side Gallery 4, 1993. Water Cycle http://www.sws.uiuc.edu/nitro/biogen.asp http://www.cityofsalem.net/export/departments/spubwork/operations/s-water/ http://www.usgcrp.gov/usgcrp/images/ocp2003/ocpfy2003-fig5-1.htm http://www.epa.gov/safewater/kids/flash/flash_watercycle.html Carbon Cycle http://genomicsgtl.energy.gov/benefits/simple.shtml http://www.solar4schools.co.uk/teachers/solar_explained.html http://epa.gov/climatechange/kids/carbon_cycle_version2.html http://www.robert-hutchinson.co.uk/images/animal08a.gif http://www.fotosearch.com/clip-art/oak-tree.html http://www.sprol.com/?p=214 Nitrogen Cycle http://www.answers.com/topic/nitrogen-cycle-jpg http://www.ext.vt.edu/resources/4h/virtualfarm/flash_mov/nitrogencycleintro.swf http://www.cas.muohio.edu/scienceforohio/Composting/images/Atr1.pdf https://ims.ode.state.oh.us/ODE/IMS/Lessons/Web_Content/CSC_LP_S01_BD_L10_I06_01.pdf http://www.britannica.com/eb/art-6/The-nitrogen-cycle Atmospheric Issues http://science.nasa.gov/headlines/y2000/ast08sep_1.htm http://www.fishlore.com/NitrogenCycle.htm http://drake.marin.k12.ca.us/stuwork/rockwater/Dissolved%20Ions/eutrophication.html http://www.marietta.edu/~biol/biomes/mangroves.htm http://www.guardian.co.uk/globalwarming/graphic/0,,397352,00.html http://www.maf.govt.nz/mafnet/rural-nz/sustainable-resource-use/climate/impact-on-industries/ http://www.environmentwaikato.govt.nz/enviroinfo/indicators/air/quality/index.htm http://earthobservatory.nasa.gov/Newsroom/NewImages/images.php3?img_id=4490 http://commons.wikimedia.org/wiki/Image:-_Acid_rain_damaged_gargoyle_-.jpg