Embed Size (px)
Citation preview

Ecology IntroductionChapter 13
What is ecology?
Ecology is the study of interactions
among living things and their
surroundings.
Ecologists study organisms and
how they interact in their
environment and with other
organisms.
Levels of Organization
Ecologists study nature on
different levels, from a local to a
global scale.
They reveal complex relationships
in nature

Levels of OrganizationOrganism
Population
Community
Ecosystem
Biome

Organism
Organism
An organism is an
individual living
thing, such as an
alligator.

Organism
Organism
Population
Population
• A population is a
group of the same
species that lives in
one area.
Organism
Organism
Population
Population
Community
Community
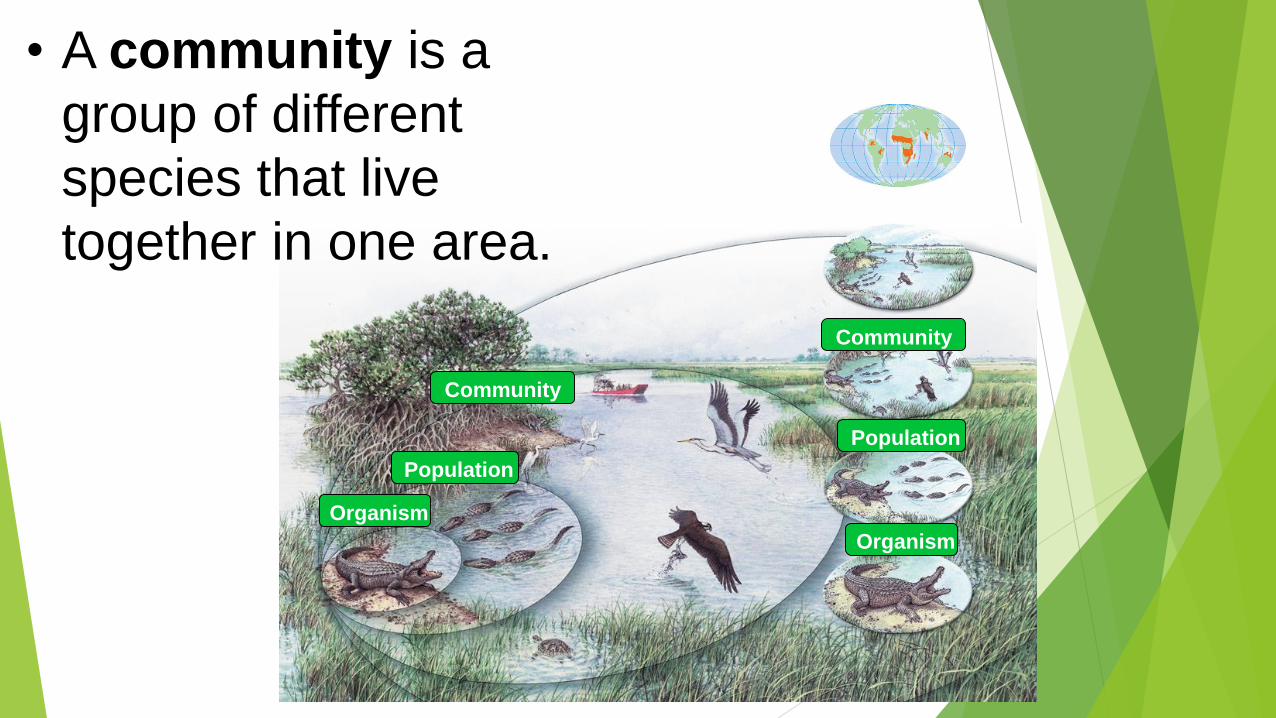
• A community is a
group of different
species that live
together in one area.
Organism
Organism
Population
Population
Community
Community
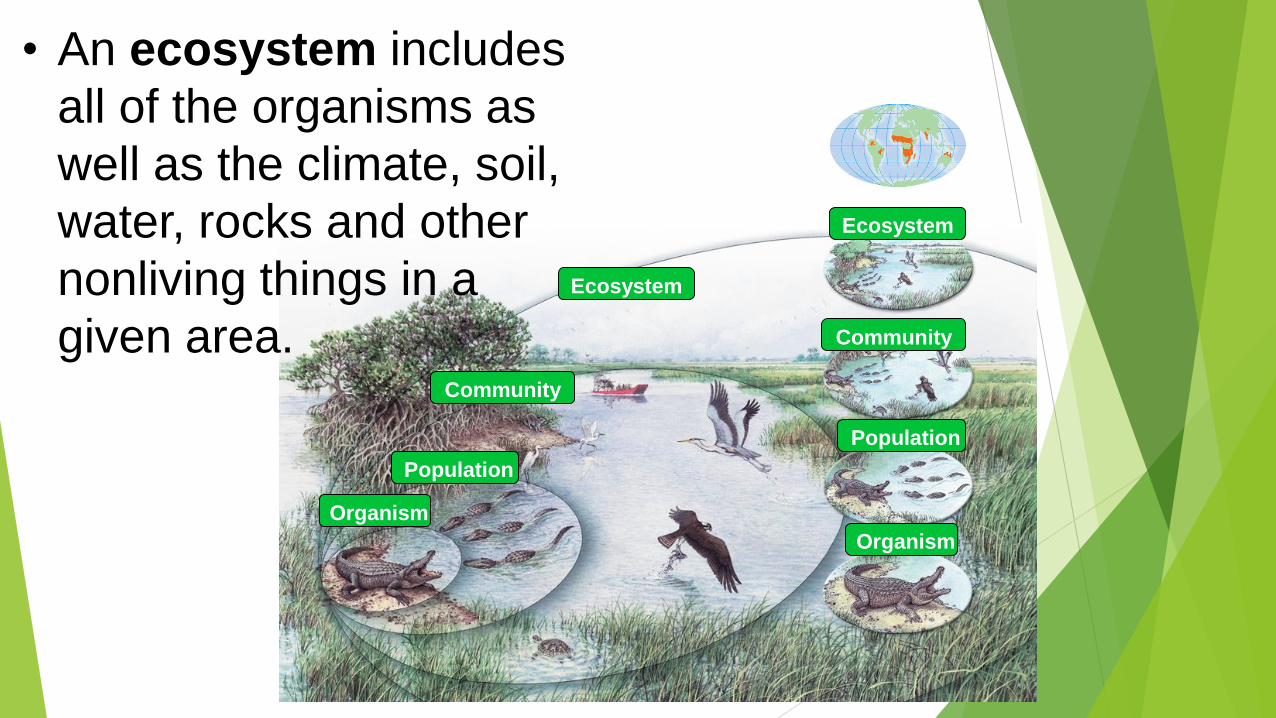
Ecosystem
Ecosystem
• An ecosystem includes
all of the organisms as
well as the climate, soil,
water, rocks and other
nonliving things in a
given area.

Organism
Organism
Population
Population
Community
Community
Ecosystem
Ecosystem
Biome
• A biome is a major
regional or global
community of organisms
characterized by the
climate conditions and
plant communities that
thrive there.

Research Methods
Observation
Direct surveys
Indirect surveys
Radio telemetry
Quadrat sampling

Research Methods
Experimentation
Lab experiments
Field experiments
Modeling
Computer models
Mathematical models
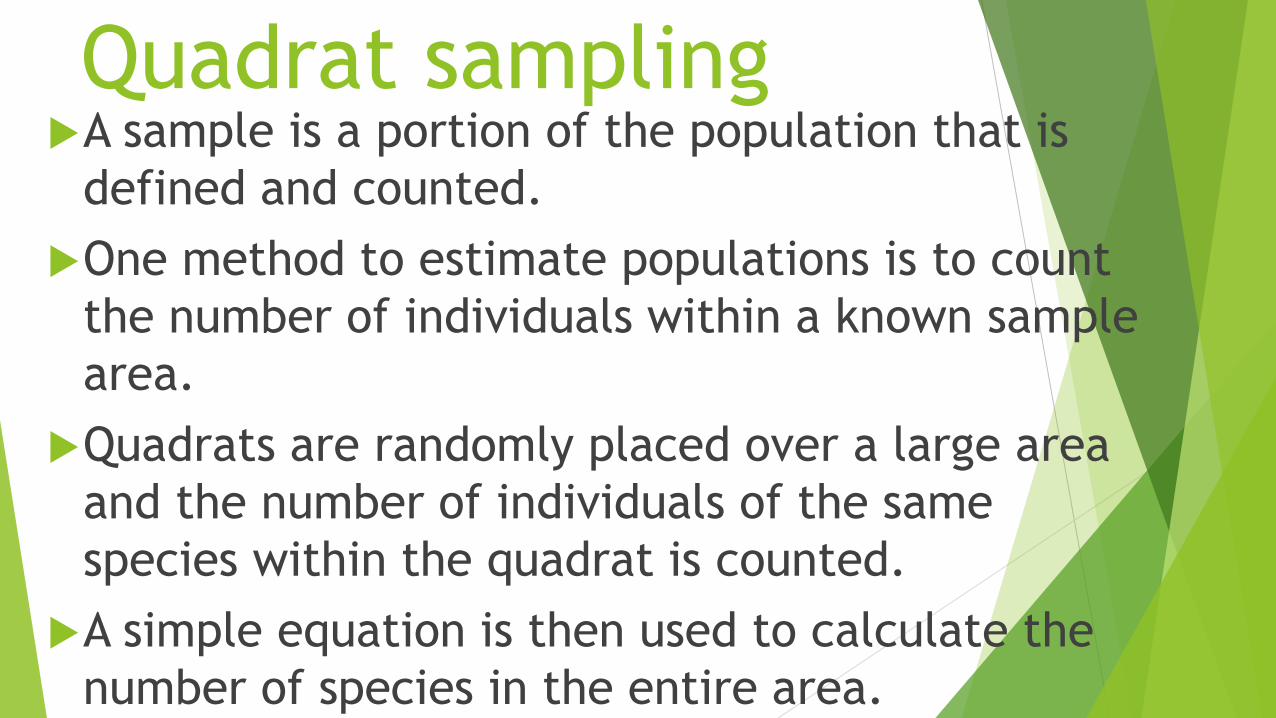
Quadrat samplingA sample is a portion of the population that is
defined and counted.
One method to estimate populations is to count
the number of individuals within a known sample
area.
Quadrats are randomly placed over a large area
and the number of individuals of the same
species within the quadrat is counted.
A simple equation is then used to calculate the
number of species in the entire area.
ExampleEach darkly shaded area represents a
quadrat.
Six shrubs were counted in five quadrats.
The area of each quadrat is 1m2. The total
area of the sampling plot is 200m2.


Equation
T = NA
T = Total population estimate
N = Total number of individuals counted Number of quadrats
A = Total area
Area of quadrat

In the example…
T = NA
T = 6 x 200 m2
5 1 m2
T = 1.20 x 200 = 240
T = 240 individuals = estimated population
of shrubs in the field