Embed Size (px)
Citation preview

Ecology CalculationsEcology Calculations
Dominican College, Griffith AveDominican College, Griffith Ave

Quantitative AnalysisQuantitative Analysis
Numbers!!Numbers!!

Our HabitatOur Habitat
The Rocky SeashoreThe Rocky Seashore

The Rocky SeashoreThe Rocky Seashore
Description:
Sitting on the boulders facing the sea, we mark off a section of the seashore 20m wide and 50m towards the sea
The total area is 1000m2
The Rocky SeashoreThe Rocky Seashore
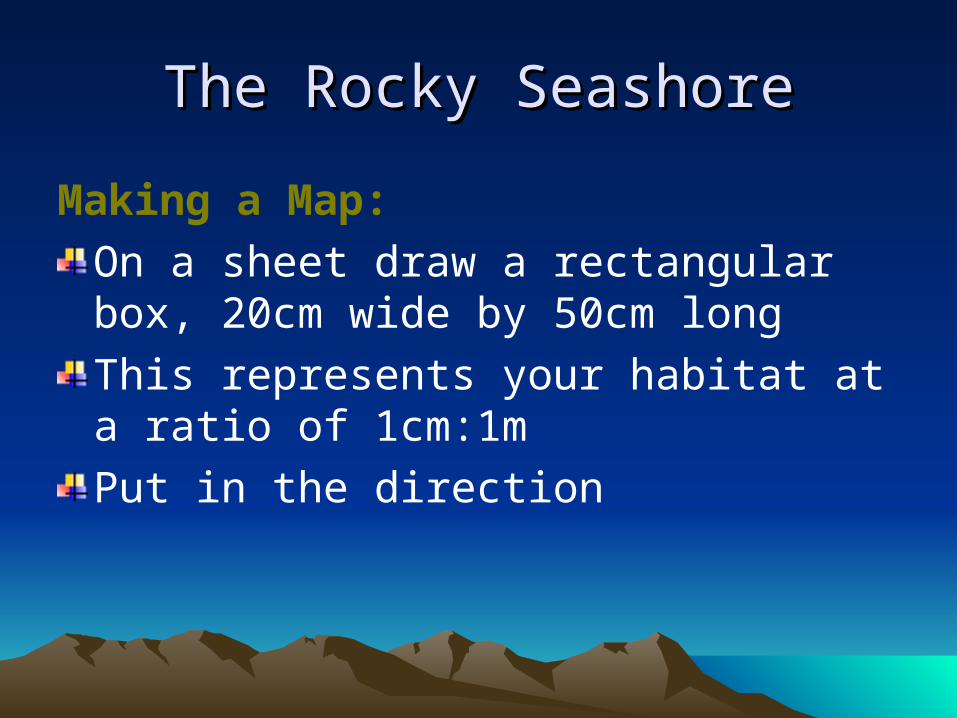
Making a Map:
On a sheet draw a rectangular box, 20cm wide by 50cm long
This represents your habitat at a ratio of 1cm:1m
Put in the direction

The Rocky SeashoreThe Rocky Seashore
Making a Map:
Put in main parts of what you see
These include rock pools, large boulders/rocks, large quantities of named algae…..
MAKE A KEY

EquipmentEquipment
• Mammal trap
• Pitfall trap• Insect net• Pooter
• Quadrat• Grid Quadrat

Method 1 – Method 1 – Capture/RecaptureCapture/Recapture
Used for AnimalsUsed for Animals

Capture/Recapture Cntd.Capture/Recapture Cntd.The Pitfall TrapThe Pitfall Trap
As we are on a rocky seashore, the type of animal I have selected is the rough periwinkle which is found on the upper seashore.
The upper seashore will not flood (except during a storm/lunar high tide)

Capture/Recapture Cntd.Capture/Recapture Cntd.The Pitfall TrapThe Pitfall Trap
• Dig a hole and insert a jar
• The jar should be at sand level
• Put a flat stone over the lid of the jar
• Using two pebbles, ensure that the flat stone has a gap to allow rough periwinkles fall into the jar

Capture/Recapture Cntd.Capture/Recapture Cntd.The Pitfall trapThe Pitfall trap
• Set up a number of Pitfall Traps on the upper seashore
• Leave for 24 hours
• Inspect the jars after 24 hours and count and mark the rough periwinkles

Capture/Recapture Cntd.Capture/Recapture Cntd.The Pitfall trapThe Pitfall trap
Marking the Rough Periwinkles:• Mark with a non-toxic paint (Not to harm
the animal)
• Mark on the underside (To protect it from predators)
• Mark with a temporary paint (So that it clears quickly to prevent predation)

Capture/Recapture Cntd.Capture/Recapture Cntd.The Pitfall trapThe Pitfall trap
• Release the rough periwinkles in the vicinity and re-set the pitfall traps.
• After another 24 hours, check the traps and count the number of rough periwinkles, noting also the number which have a paint mark on them

Capture/Recapture Cntd.Capture/Recapture Cntd.The Pitfall trapThe Pitfall trap
Calculations:
Total Population =
No. caught on 1st visit x No. caught on 2nd visit
No. of marked animals recaptured on the 2nd visit

Capture/Recapture Cntd.Capture/Recapture Cntd.The Pitfall trapThe Pitfall trap
Calculations:Sample Answers
• No. caught and marked on 1st visit = 20
• No. caught on 2nd visit =15• No. of marked animals caught on 2nd visit = 5
• Total population = 20 x 15 = 60
5

Method 2 – Percentage Method 2 – Percentage FrequencyFrequency

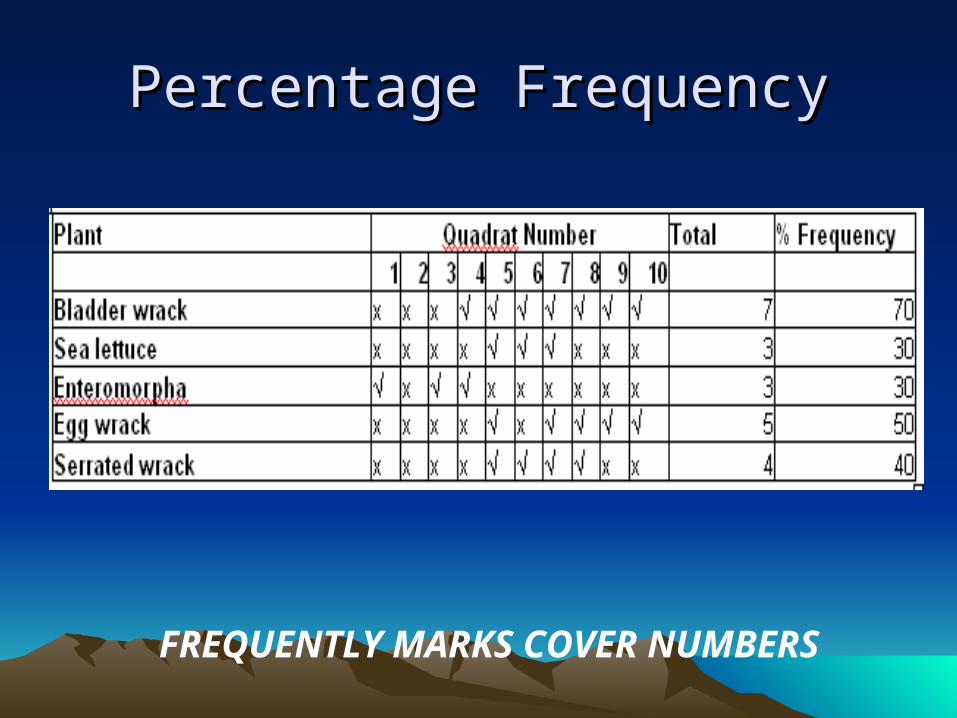
Percentage FrequencyPercentage Frequency
Throw Ten Quadrats (1m X 1m)
FREQUENTLY MARKS COVER NUMBERS

Percentage FrequencyPercentage Frequency
If Present, Tick Yes
• If Absent, Tick No
• Calculate the fraction, then the percentage
FREQUENTLY MARKS COVER NUMBERS
Percentage FrequencyPercentage Frequency
FREQUENTLY MARKS COVER NUMBERS

Percentage FrequencyPercentage Frequency
Calculations:Sample Answers For Bladder Wrack• Found in 7 out of 10 quadrats• Hence 70 % Frequency
FREQUENTLY MARKS COVER NUMBERS

Method 3 – Percentage Method 3 – Percentage CoverCover

Percentage CoverPercentage Cover
• A grid quadrat is used.• This is 1m X 1m divided into 100 squares
which is 1m2 in area• Some quadrats may be 0.5m X 0.5m divided
into 25 squares, which is 0.25m2
• Great care must be taken to read any data that you may have to use in a question
FREQUENTLY MARKS COVER NUMBERS

Percentage CoverPercentage Cover
FREQUENTLY MARKS COVER NUMBERS

Percentage CoverPercentage Cover
• We select 10 ‘hits’ on every quadrat
• A pen is placed at this point and if it touches an organism it is recorded as a “hit” for that organism
FREQUENTLY MARKS COVER NUMBERS

Percentage CoverPercentage Cover
FREQUENTLY MARKS COVER NUMBERS

Percentage CoverPercentage Cover
Calculations:Sample Answers For Bladder Wrack• Found in 34 ‘hits’ from a potential of 100• Hence 34 % Cover
FREQUENTLY MARKS COVER NUMBERS

Method 4 – Population Method 4 – Population Density Density

Population DensityPopulation Density
The number of each plant in each quadrat is counted and recorded and then extrapolated as per the whole habitat

Population DensityPopulation Density
Population DensityPopulation Density
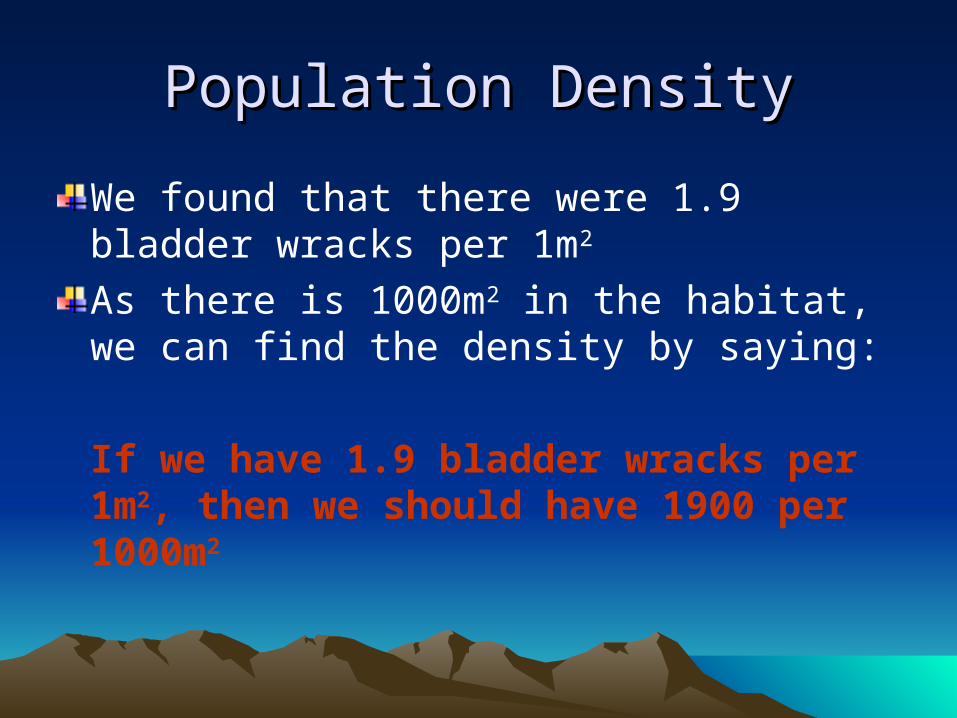
We found that there were 1.9 bladder wracks per 1m2
As there is 1000m2 in the habitat, we can find the density by saying:
If we have 1.9 bladder wracks per 1m2, then we should have 1900 per 1000m2

Method 5 – Distribution Method 5 – Distribution

A)A) -- DistributionDistribution
We use a line transect:
Unfurl a 50m rope marked at 1m intervals from the upper shore to the lower shore
Note the organism that ‘touches’ the ‘mark’

B)B) -- Population DistributionPopulation Distribution
We use a belt transect:
Unfurl two 50m ropes marked at 1m intervals from the upper shore to the lower shore, with a separation of exactly 1m2
In essence this is now 50 X 1m2 quadrats
Name these, 1 to 50

B)B) -- Population DistributionPopulation Distribution
We use a belt transect:0 1 2 3 4 5 6 7 8 9 10 11 12 13 14 15 16 17 18 …………… 50
To Lower Shore
B)B) -- Population DistributionPopulation Distribution
• Take the populations of the organisms chosen
• Graph these

B)B) -- Population DistributionPopulation Distribution

Section 2 – Calculation ErrorsSection 2 – Calculation Errors

Calculation ErrorsCalculation Errors
No. caught on 1st visit x No. caught on 2nd visit
No. of marked animals recaptured on the 2nd visit
Getting the formula incorrect

Calculation ErrorsCalculation Errors
The use of a quadrat that ISN’T 1m2
The use of a quadrat that ISN’T 1m2
The use of a quadrat that ISN’T 1m2

Calculation ErrorsCalculation Errors
EG. 1 - Percentage Cover:
A grid quadrat 0.5m X 0.5m, was thrown 10 times in a habitat of 3600m2.
25 hits are taken in each quadrat
Quadrat No.
1 2 3 4 5 6 7 8 9 10
No. Hits for Bladder Wrack
11 5 0 0 0 23 21 2 9 9

Calculation ErrorsCalculation Errors
EG. 1 - Percentage Cover Cntd.
How many ‘hits’ did you get?.................80
How many potential ‘hits’ were there…250
As a fraction, this is 80
250
As a Percentage, 80 * 100= 32%
250

Calculation ErrorsCalculation Errors
EG. 2 - Population Density:
A Grid quadrat 0.5m X 0.5m, was thrown 10 times in a habitat of 3600m2.
25 hits are taken in each quadrat
Quadrat No.
1 2 3 4 5 6 7 8 9 10
No. Hits 11 5 0 0 0 23 21 2 9 9

Calculation ErrorsCalculation Errors
EG. 2 - Population Density:
Find the population per 1m2 and extrapolate

Calculation ErrorsCalculation Errors
EG. 2 - Population Density:
80 in 10 quadrats, so the number of Bladder wracks per 1m2 is

Calculation ErrorsCalculation Errors
EG. 2 - Population Density:
NOT 8 per 1m2
Because the 10 quadrats do not amount to 10m2
Because each quadrat is only 0.25m2
Calculation ErrorsCalculation Errors
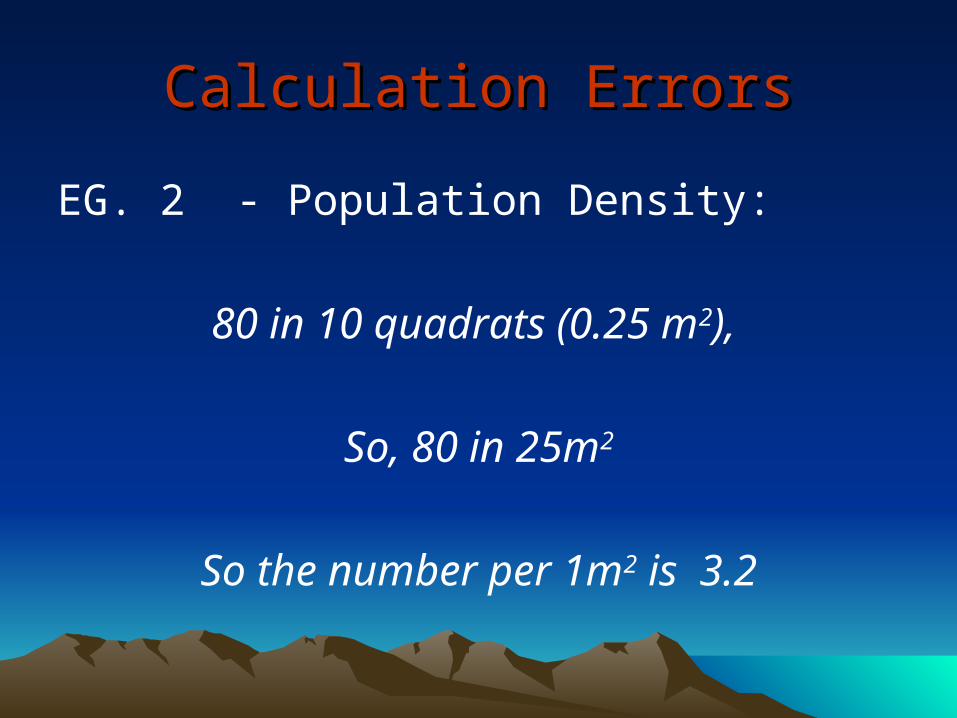
EG. 2 - Population Density:
80 in 10 quadrats (0.25 m2),
So, 80 in 25m2
So the number per 1m2 is 3.2

Calculation ErrorsCalculation Errors
EG. 2 - Population Density:But we’re not finished yet!!
• 3.2 per 1m2
• (3.2 X 3600) in 3600m2
• Answer = 11520 in habitat