Embed Size (px)
Citation preview

By Kathryn Kelsey and Ashley Steel
Ecologyby
Inquiry


Ecology by InquiryEdition 1: March 2007Available at www.nwfsc.noaa.gov/education
By Kathryn Kelsey and Ashley Steel

About the AuthorsKathryn Kelsey began teaching science in 1983. From 1990 through 1997, she worked as a wildlife biologist and earned a Ph.D. in Wildlife Ecology. Kathryn conducted field research to quan-tify the response of wildlife populations to forest management practices near streams. Currently, she teaches high school science and works with middle school science teachers in the Seattle School District. Kathryn’s dream is to provide every student and teacher with the experience of conducting real science investigations.
Ashley Steel has conducted scientific research and taught the scientific process for over 15 years. She holds M.S. degrees in River Ecology and Statistics and a Ph.D. in Quantitative Ecology and Resource Management. Ashley currently investigates the effects of landscape conditions such as urbanization, ag-riculture, or forest cover on river habitat and salmon populations. She has done fieldwork and published research on small mammals, birds, salmon, and urban recycling programs. Her goal is to provide future citizens with scientific skills to enable better decision making in all aspects of their lives.

LESSONS
Slippery Sleuths
L1
L2
L3
L4
L5
L6
L7
A Leaf Lunch
Leave it to the Sun
Mapping Madness
Buggin’ Out
Organizing Organisms
1
10
20
25
34
49
58

iv Ecology by Inquiry: The Truth about Science
PrefaceA good science experiment generates more new questions to pursue than definitive answers. Good curriculum ideas seem also to generate new possibilities. With the completion of a book on teaching the scientific method (Kelsey and Steel, 2002, The Truth About Science, NSTA Press; Arlington VA), we identi-fied a need for content-based lessons that combine true inquiry with ecological principles.
Through a contract with the Highline School District in Washington State, we developed this series of lessons to be used as stand-alone activities or to be integrated with the published activities in Kelsey and Steel (2002). These lessons have been tested in the classroom and piloted at Waskowitz Outdoor School, North Bend WA. For nearly five years, these lessons have remained in draft form and publicly inacces-sible. A grant from the NOAA Education Office in 2006 enabled the lessons to be updated and polished.
AcknowledgementWe are grateful to the many individuals and agencies that have contributed to the development of these lessons. The Highline School District provided the original inspiration and funding for the project. We thank, in particular, the 6th grade teachers for piloting the lessons and providing valuable feedback. We also thank the Waskowitz Outdoor School staff for working with us to incorporate these lessons into their existing curriculum, for allowing us to pilot the lessons at their campus, and for constructive suggestions. We are grateful to the NOAA Education Office for support to revamp the lessons and to make them pub-licly available.
Artists Sarah Silverman, Chloe Lytle, and Megan Stearns provided illustrations for the Organizing Organ-isms Cards. Alabama Water Watch provided illustrations for the Slippery Sleuths cards. And, we thank Sarah Morley for the use of her data to create the Slippery Sleuths cards. Bill Richards, City of Seattle, created the maps for Mapping Madness.
Finally, we would like to gratefully acknowledge the work of Su Kim, the graphic artist who created the layout, managed the details of so many cards and worksheets, created the map for Slippery Sleuths, and patiently incorporated many rounds of edits. She also designed the fabulous title page for this collection of lessons and all the creative lesson titles.

IntroductionInquiry-based science involves the students in asking testable questions and in designing appropriate methods to answer those questions as well as in analyzing and interpreting data and in communicating results. This series of seven lessons is designed to teach fundamental ecological principles to middle school students, using an inquiry approach. Many of the lessons are designed around animals and eco-systems found in the Pacific Northwest USA but the lessons can be customized and adapted to incorpo-rate any local wildlife and habitats.
The lessons, taught in sequence, would take approximately 18 50-minute classroom periods. This series of lessons covers a wide range of scientific skills and ecological concepts: quantitative versus qualita-tive observations (L1), the four parts of a scientific report (L1, L5), invertebrates (L1, L2, L6, L7), Linnaean classification (L2), food webs (L3), predators and prey (L3), mapping (L4), habitats and adaptations (L4), photosynthesis (L5), decomposition (L6), aquatic insects (L6, L7), scientific inference (L7), water quality (L7). Concepts in later lessons build on concepts in earlier lessons; however each lesson is also designed to stand alone and can be used out of sequence and/or in coordination with other science activities. Note that L6: A Leaf Lunch requires 2-3 weeks of lead-time. The leaf-packs must simply be created and then placed in a nearby stream or lake to decompose and attract aquatic invertebrates. It would be ideal to initiate this lesson at the beginning of the full sequence (or at the beginning of the unit in which the lesson is being incorporating).
The first lesson, L1: Buggin’ Out, is designed to teach fundamental skills in scientific inquiry. Students observe an invertebrate and use quantitative observations to describe its anatomy or behavior. Students then have the chance to design their own experiment about the invertebrate. This lesson can be used as a mini-model of the steps needed to design, implement, and present a successful science fair or term project.
L2: Organizing Organisms introduces students to the Linnaean classification system and to a wide range of invertebrate taxa. Students must classify these invertebrates in several different ways and speculate on the value of scientific classification systems. Scientific nomenclature is introduced, as are the con-cepts of habitat and food source.
Food webs are explored in L3: Eating for Energy. Students use what they have learned about inverte-brates to begin a food web and then incorporate higher-level predators. They become familiar with the terms predator and prey.
L4: Mapping Madness uses geographic information to identify potential tailed frog habitat. Students ex-plore the multiple uses of maps and investigate the concept of habitat in-depth. In this lesson, students examine one of the tasks faced by environmental managers.
L5: Leave it to the Sun is the longest lesson and integrates essential ecological knowledge with true inquiry-based learning. Students use experiments on live plants, they use a carbon dioxide indicator in a lab setting, and they design their own experiments to gain a deep appreciation of photosynthesis and its essential role in nearly all ecosystems. At the end of this lesson, students will be able to describe where the mass of a giant tree really comes from.
vIntroduction

vi Ecology by Inquiry: The Truth about Science
In L6: A Leaf Lunch, students explore decomposition by observing the community of decomposers that colonize a pile of dead leaves in a stream. This lesson must be set up in advance and is exciting because live invertebrates are captured and brought into the classroom. Students discuss ideas of replication and experimental design as they plan how and where to leave their leaf packs. At the end of the lesson, decomposers are added to the food webs developed earlier.
In L7: Slippery Sleuths, aquatic invertebrates are again a focus. Concepts of habitat and adaptation are reinforced through a card game that simulates research on stream ecosystems. Students learn tasks conducted by stream ecologist and explore the nature of random samples and scientific inference. On day two, they also measure water clarity and use chemistry testing kits to quantify water quality. At the end of the lessons students have the opportunity to integrate all of their learning by designing research to further explore aquatic ecosystems.
Culminating projects and summative assessments might involve students preparing a second indepen-dent investigation, a grant proposal, or a persuasive essay on introduced species in a local ecosystem. The second investigation could be modeled on the one in L1: Buggin’ Out but could use a different organism such as a walking stick, a fish, or a crayfish. The grant proposal might be to get money to study the watershed in Slippery Sleuths. Students could propose additional sampling sites with modified research questions and experimental design. The essay might address the removal of an introduced spe-cies and speculate on its impact on local food webs. It is also easy to imagine extensions that incorpo-rate maps of local habitat features or water samples/invertebrate samples from local streams.

L1
Buggin’ Out 1
(Three 50-minute classes)
OverviewIn this lesson, students use living invertebrates (pill bugs, lady bugs or bugs found around the school) to practice making observations and to design and conduct their first experiment. Making observations is one of the most fundamental skills in conducting scientific research. Scientists make two types of ob-servations: qualitative and quantitative. Qualitative observations describe how something looks, feels, behaves, smells, etc., with adjectives that are not numbers. Quantitative observations describe some-thing with numbers. To help students learn the difference between qualitative and quantitative observa-tions, teachers provide an assortment of tools that can be used to make quantitative observations. On the second day, students explore the creative side of science while learning some fundamental issues in research design: planning, safety, making and recording observations, and drawing conclusions. As students design their own mini-experiments with the invertebrates, they are introduced to the four com-ponents of a scientific report: introduction, methods, results, discussion. On the third day, students carry out invertebrate experiments according to experimental methods written the previous day. Students fol-low their original plan carefully, noting any changes that must be made. Each group makes at least one type of quantitative observation. Once students finish their experiment, they write up their results and discussion. Through this process, students become familiar with the structure of scientific report writing. The process also allows the teacher to understand what students currently know about designing and conducting experiments. Only basic guidance is given. In this respect, the lesson serves as a pre-assess-ment on designing and conducting experiments. This lesson is modified from a series of three lessons on ooze, a mixture of cornstarch and water (Kelsey and Steel 2002).
Focus Questions1. How do we make qualitative and quantitative observations?2. What is the general structure used when planning and conducting an experiment?3. What are the four components of a scientific report?
Science SkillsnStudents will be able to make and record qualitative and quantitative observations.nStudents will be able to ask questions that can be answered by doing a small experiment.nStudents will be able to write procedures for their experiment.nStudents will be able to describe the type of information in each of the 4 parts of a scientific re-
port: introduction, methods, results, discussion.nStudents will be able to follow their proposed experimental design.nStudents will be able to make observations and draw conclusions from them.
National StandardsnUnifying concepts and processes standard: Evidence, models, and explanations;nScience as inquiry standard: Abilities necessary to do scientific inquiry.
Ecology by Inquiry: The Truth about Science
L1
2
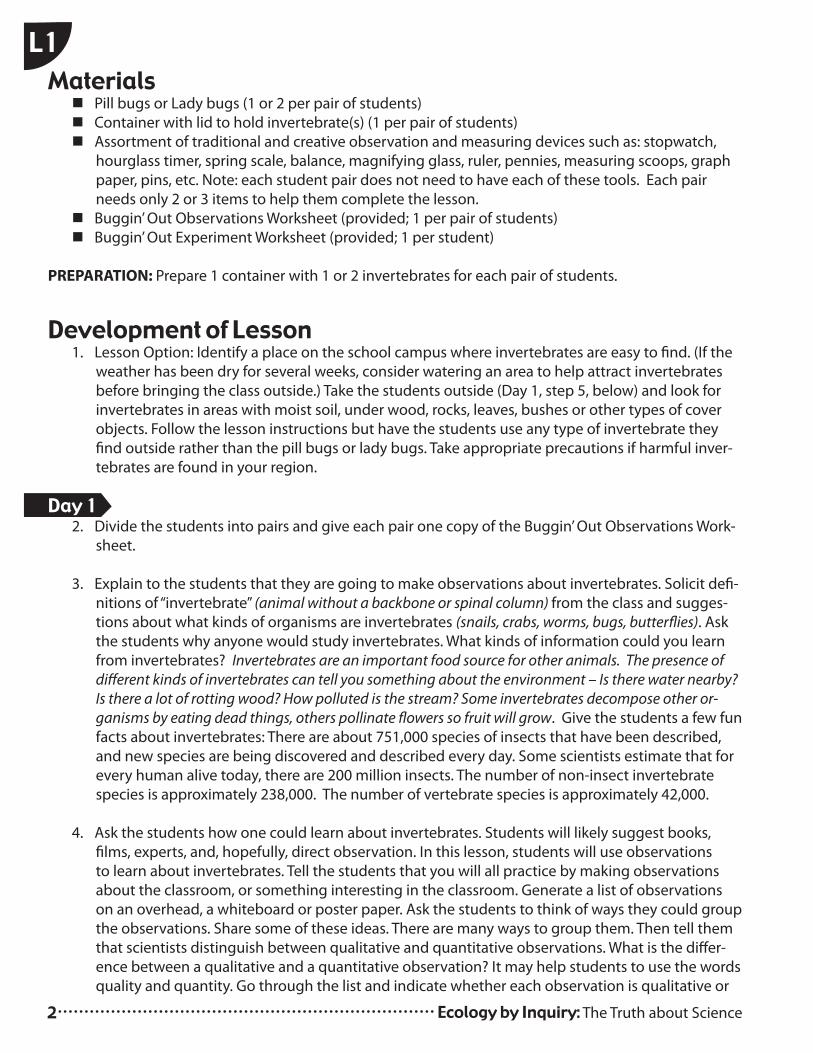
MaterialsnPill bugs or Lady bugs (1 or 2 per pair of students)nContainer with lid to hold invertebrate(s) (1 per pair of students)nAssortment of traditional and creative observation and measuring devices such as: stopwatch,
hourglass timer, spring scale, balance, magnifying glass, ruler, pennies, measuring scoops, graph paper, pins, etc. Note: each student pair does not need to have each of these tools. Each pair needs only 2 or 3 items to help them complete the lesson.
nBuggin’ Out Observations Worksheet (provided; 1 per pair of students)nBuggin’ Out Experiment Worksheet (provided; 1 per student)
PREPARATION: Prepare 1 container with 1 or 2 invertebrates for each pair of students.
Development of Lesson1. Lesson Option: Identify a place on the school campus where invertebrates are easy to find. (If the
weather has been dry for several weeks, consider watering an area to help attract invertebrates before bringing the class outside.) Take the students outside (Day 1, step 5, below) and look for invertebrates in areas with moist soil, under wood, rocks, leaves, bushes or other types of cover objects. Follow the lesson instructions but have the students use any type of invertebrate they find outside rather than the pill bugs or lady bugs. Take appropriate precautions if harmful inver-tebrates are found in your region.
Day 12. Divide the students into pairs and give each pair one copy of the Buggin’ Out Observations Work-
sheet.
3. Explain to the students that they are going to make observations about invertebrates. Solicit defi-nitions of “invertebrate” (animal without a backbone or spinal column) from the class and sugges-tions about what kinds of organisms are invertebrates (snails, crabs, worms, bugs, butterflies). Ask the students why anyone would study invertebrates. What kinds of information could you learn from invertebrates? Invertebrates are an important food source for other animals. The presence of different kinds of invertebrates can tell you something about the environment – Is there water nearby? Is there a lot of rotting wood? How polluted is the stream? Some invertebrates decompose other or-ganisms by eating dead things, others pollinate flowers so fruit will grow. Give the students a few fun facts about invertebrates: There are about 751,000 species of insects that have been described, and new species are being discovered and described every day. Some scientists estimate that for every human alive today, there are 200 million insects. The number of non-insect invertebrate species is approximately 238,000. The number of vertebrate species is approximately 42,000.
4. Ask the students how one could learn about invertebrates. Students will likely suggest books, films, experts, and, hopefully, direct observation. In this lesson, students will use observations to learn about invertebrates. Tell the students that you will all practice by making observations about the classroom, or something interesting in the classroom. Generate a list of observations on an overhead, a whiteboard or poster paper. Ask the students to think of ways they could group the observations. Share some of these ideas. There are many ways to group them. Then tell them that scientists distinguish between qualitative and quantitative observations. What is the differ-ence between a qualitative and a quantitative observation? It may help students to use the words quality and quantity. Go through the list and indicate whether each observation is qualitative or

Buggin’ Out
L1
3
quantitative. If you don’t have very many quantitative observations, ask the students to come up with a few more. Solicit enough examples to convince yourself that the students understand the difference between the two types of observation. Now tell them that they will make qualitative and quantitative observations about an invertebrate.
5. This is where you can go outside, or give one invertebrate container to each pair of students. Ask each pair to write down five qualitative observations about the invertebrate(s). Suggest that stu-dents be creative and original in their observations.
6. Now ask the students to write down 5 quantitative observations about the invertebrate(s). Hand out some of the measuring devices you have gathered. Generating quantitative observations may be hard for some students. Ask them, again, to be creative. Prompt struggling students with questions such as: how far can a pill bug or lady bug move in a minute? How long or wide is the invertebrate? How many legs does your invertebrate have? How long is a particular body part? How much does the invertebrate weigh? How tall (in pennies) is the invertebrate? How many invertebrates fit in a small scoop?
7. Circulate from group to group, handing out or exchanging measuring equipment and helping the students generate ideas for quantitative observations.
8. After the students have had about 15 minutes to complete their quantitative observations, have the students return the invertebrates and measuring equipment to the equipment area.
9. As a class, share the ideas that were generated for both quantitative and qualitative observations. You can use Discussion Questions 1-3 for follow-up and reflection.
Day 210. Begin with a class discussion about observations and invertebrates. Have the students share their
qualitative and quantitative observations from the previous lesson. Can the students determine rules for differentiating between qualitative and quantitative observations?
11. As a group, discuss the question, “What steps does a scientist consider when doing scientific research?” The group discussion should move toward the following conclusions: research is used to answer a question; research must be planned; all the details have to be specified in advance including safety precautions; research is made up of a series of observations; the observations must be recorded systematically; observations are used to draw conclusions about the original question.
12. In pairs, have students brainstorm a list of questions about their invertebrate(s). Ask them to record ideas on a piece of scratch paper. Once they have at least 5 questions, ask them to imag-ine experiments that might help answer the questions. These questions and experiments can be either reasonable or ridiculous.
13. After students have time to generate some creative ideas, announce that tomorrow they will actually be able to do their own experiment with their invertebrate(s). The only requirements are that (1) the experiment includes some sort of quantitative observation and (2) the invertebrate(s) comes to no harm. Their task for the rest of the lesson is to design an experiment on their

Ecology by Inquiry: The Truth about Science4
L1invertebrate(s) that they can complete the next day in class with materials in the classroom or that they bring from home.
14. Have the students work together in pairs to choose one invertebrate experiment that can be completed in a class period. Hand out one worksheet to each student. Students should fill in the first two sections of the worksheet: introduction and methods. The pair must agree on a common set of methods. Each student should write out a detailed description of the proposed methods or procedures for the group experiment including the materials required, safety precautions, what steps will be carried out, and what exactly will be recorded (some observations must be quantita-tive). Methods can be continued on a separate sheet of paper if required. Tell the students that while their methods should be the same as their partner’s, they should each introduce the experi-ment in their own words.
15. Circulate between groups to make sure that everyone has something simple and feasible. If students are stuck, the following make interesting experiments. How many times does the inver-tebrate move or chirp in warm compared to cold temperatures? Does the invertebrate move or make more noise in the light or the dark? What kind of materials does the invertebrate climb on more easily? How long will it take the invertebrate to cross a small stream of water or a strip of petroleum jelly? How does the invertebrate respond to various stimuli (e.g., tapping on the table, blowing on the invertebrate, exposure to a particular smell).
16. If there is time, students can share their craziest question and wacky experiment ideas as a class and/or they can share their experimental design for the next day and other groups can provide suggestions.
17. REMIND STUDENTS to bring in any materials or preparations that they will need for the inverte-brate experiments in the next class period.
Day 318. Before beginning the experiments, lead students in a discussion of what should be in a scientific
report. A scientific report should answer several questions: (1) Why were they interested in doing this experiment? (2) What exact steps did the experiment include? (3) What are the results? (4) What can be learned from the experiment? Ask the students why the answers to these questions are important. What kind of information will they need to report to answer each one of the ques-tions? What other questions might be answered in a scientific report. Introduce the four parts of a scientific report: introduction, methods, results, and discussion. Students can underline each of these parts on their Buggin’ Out Experiment Worksheet.
19. Have the students carry out their research plan. Emphasize that they need to follow their origi-nal plan. If they need to make changes in their methods, they must make those changes in the methods section of the worksheet. All experimental methods need to remain humane; no inver-tebrates should come to any physical harm.
20. As each group finishes, show the groups how to clean up their area and equipment.
21. Each student should finish his or her Buggin’ Out Experiment Worksheet, reporting results and discussing conclusions. When students each write up a group project, they can expect the meth-

Buggin’ Out 5
L1ods and the results sections to be similar, if not identical. However, each student must write an introduction and discussion in their own words.
22. Meet as a group and share the results of the experiments. Students enjoy listening and learning from the experiences of other students. Review the four parts of reporting an experiment: intro-duction (including the research question), methods, results, and discussion. Have each group describe their quantitative observation.
23. Look over the student work. Do they include: nA research question with a comparison (indicates the independent or manipulated
variable) and a quantitative measure (indicates the dependent or responding variable)? nA hypothesis stating how they think the independent/manipulated variable and
dependent/responding variable are related? nAll the materials they used? nQuantitative data? nReplicates or instructions to repeat the experiment several times? nClearly written procedures that someone else could repeat?
The students will learn that these are all important parts of planning science research experi-ments, so don’t grade them on these points now. Use their work from this lesson to learn what they already know about experimental design.
Discussion Questions Followingthefirstday:
1. Are qualitative or quantitative observations easier to measure? Why? What kind of things are easier to measure qualitatively? Quantitatively?
2. What are some advantages of using qualitative versus quantitative observations? Qualitative ob-servations can convey attitudes and feelings that may be difficult to quantify. They can provide a more artistic description of something. Quantitative versus qualitative? Quantitative observations are more easily replicated. They can be graphed. They are less subjective. They can be easily compared.
3. How could you take a qualitative observation and make it quantitative? Can you think of an example? He is tall. He is 5 feet tall. Roses have a strong smell. On a scale of 1 to 10, the strength of a rose smell is an 8 or 9.
Following the third day:4. What makes a scientific experiment different from just trying different stuff?
5. If you were going to conduct an experiment and you were going to repeat it over and over to make sure you get the same results each time, would you want to be recording qualitative or quantitative observations? Why? Why might you want to repeat the experiment over and over? Why might a scientist want to repeat someone else’s experiment?
6. Did you notice any interesting patterns, features or behaviors while observing your invertebrates? What were they? What questions do you have about the invertebrate? How could you answer each question?

Ecology by Inquiry: The Truth about Science6
L17. Why is creativity a big part of science research? Scientists have to think creatively about what ques-
tions they want to ask and investigate. Often they have to design new tools or methods to effectively measure what they are investigating. Then they have to think openly and creatively about their results and what they mean. This leads to asking more questions and designing more studies.
8. What things did you have to change in your experimental design? Why?
9. What was the hardest part of designing the research project? Why?
10. Do you think you would get the same results if you repeated the experiment over and over? Why or why not?
11. What is the difference between results and discussion?
ReferencesnHickman, Jr., C.P., L.S. Roberts, and A. Larson. 1995. Animal Diversity. McGraw-Hill Companies,
Boston, Mass., U.S.A.nKelsey and Steel. 2002. The Truth About Science. NSTA Press, Arlington, VA, U.S.A.nWilson, E.O. 1992. Diversity of Life. Harvard University Press, Cambridge, Mass., U.S.A.

Buggin’ Out 7
L1Buggin’ Out
Observation Worksheet
Qualitative Observations:
1. _______________________________________________________________________
2. _______________________________________________________________________
3. _______________________________________________________________________
4. _______________________________________________________________________
5. _______________________________________________________________________
Quantitative Observations:
1. _______________________________________________________________________
2. _______________________________________________________________________
3. _______________________________________________________________________
4. _______________________________________________________________________
5. _______________________________________________________________________

Ecology by Inquiry: The Truth about Science8
L1Buggin’ Out
Experiment Worksheet
1. To INTRODUCE your experiment, explain any details about your invertebrate(s) that you think someone might need to know to understand or be interested in your experiment. You can use some of your qualitative and quantitative observations from the first day.
What question are you trying to answer?
2. What METHODS will you use? Describe your experimental procedures. Later, you can add any modifications that you made while actually conducting the experiment. It might help to write the plan as a series of steps.

9
L1
Buggin’ Out
3. What happened when you did your experiment? What qualitative and quantitative observations did you make? These are your RESULTS.
4. Based on the evidence from your results, what do you conclude about your invertebrate(s)? Can you answer the original question you had? Write a brief DISCUSSION of what you discovered from your experiment.
Buggin’ Out Experiment Worksheet

Ecology by Inquiry: The Truth about Science10
L2
(One 50-minute class)
OverviewIn this lesson, students make quantitative and qualitative observations to classify cards with pictures of invertebrates. Students share and compare their classification systems with the class. Standard biologi-cal classification system and scientific naming conventions are introduced and discussed. Students then name and classify a mystery organism.
Focus Questions1. How and why are organisms classified?
Science SkillsnStudents will be able to describe the standard species classification system. nStudents will be able to classify pictures of invertebrates and give reasons to explain their groupings.
National StandardsnUnifying concepts and processes standard: Systems, order, and organizationnLife science standard: Diversity and adaptations of organisms
MaterialsnInvertebrate cards (provided; 1 set per pair of students)nMystery Organism cards (provided; 1 card per pair of students)nKingdom table (provided; – 1 transparency for the class)
Development of Lesson1. Distribute one set of invertebrate cards to each pair of students. Drawings on the cards are from
Acorn and Sheldon (2001). Explain to the students that they will use their skills of making qualita-tive and quantitative observations to sort the cards into 2 groups in a way that makes sense to them. They must be able to explain how the invertebrates in one group are different from the invertebrates in the other group.
2. Share the classification systems as a class. Record the attributes that each pair used to classify their invertebrates.
3. Ask the students to re-classify the organisms using a quantitative observation to distinguish between groups of organisms (for example, all invertebrates with 6 legs, more than 6 legs, less than 6 legs, or no legs). Indicate that they should have at least 3 groups but that they may have as many groups as they need. They should be able to explain how the invertebrates in any one group are similar and how each group differs from the other groups. Encourage them to avoid groups with only one card.

11
L2
Organizing Organisms
4. Again share the classification systems as a class. What would the importance of classifying inver-tebrates be? There are so many invertebrates that classifying them helps us understand which organ-isms are most similar to each other and to keep track of them. Classification systems can also reflect the evolutionary relationships of species. In other words, scientists put species that are closely related into the same group. Classifying invertebrates might help us predict what an invertebrate eats, what eats the invertebrate, where it lives, how it eats, or how it moves. What are some other possible ways to classify invertebrates?
5. Tell students that there are lots of different ways in which all living things can be classified. In fact, many scientists don’t agree on the best groupings. Some scientists are accused of being lumpers; they lump species together in very few groups. Other scientists are thought of as splitters be-cause they divide organisms into many different groups. A widely accepted classification system for living organisms is the Linnaean taxonomic system, named after Carolus Linneaus who first developed the system. This taxonomy is hierarchical and has changed over the more than 150 years since it was developed. Today, most texts separate all living things into 5 or 6 kingdoms. Ask students to suggest what the standard 5 kingdoms might be. (Monera (bacteria), Protista (single-celled organisms, Fungi, Plantae, Animalia – Note that in most systems, biologists consider viruses to be non-living and therefore do not fit into any of the kingdoms. The Monerans are commonly split into two kingdoms: Bacteria and Archaea.) Ask students which kingdom they think has the most species? Over half of all known animal species are insects! Next put up the kingdom table and discuss the 5 major kingdoms. Explain that kingdoms are further divided into the following levels. The classification of a squirrel is in parentheses.
nKingdom (Animalia, or “animal”) nPhylum (Chordata, or “has a backbone”) nClass (Mammalia, or “has a backbone and nurses its young”) nOrder (Rodentia, or “has a backbone, nurses its young and has long, sharp front teeth) nFamily (Scuridae, or “has a backbone, nurses its young, has long, sharp front teeth, and
has a bushy tail) nGenus (Tamiasciurus, or “has a backbone, nurses its young, has long, sharp front teeth, has
a bushy tail, and climbs trees) nSpecies (hudsonicus, or “has a backbone, nurses its young, has long, sharp front teeth, has
a bushy tail, and has brown fur on its back and white fur on its underparts) The name of an organism includes all these categories but it is usually referred to by its genus and
species. Give a few examples of common animals along with the animal’s scientific name: dogs (Canis familiaris), wolves (Canis lupus) and crow (Corvus brachyrhynchos). When writing the sci-entific name, the first word is always capitalized and the second word is not capitalized. The two words together (genus species) are either underlined or italicized. Humans can be classified as follows:
nKingdom Animalia (animals) nPhylum Chordata (chordates) nSubphylum Vertebrata (vertebrates) nClass Mammalia (mammals) nOrder Primates nFamily Hominidae (hominids) nGenus Homo nSpecies sapiens

Ecology by Inquiry: The Truth about Science12
L2 Ask the students what purpose the naming and classification system might have. Scientists who
speak different languages can identify species. Organisms often have common names, such as “dog” or “crow.” These may refer to the same species in several different locations, to different species in different places, or even to several similar-looking species in one place. Scientific names and classifica-tion provide a consistent and organized naming system. It can also help to identify which species are most closely related genetically.
6. Ask the students to look at the scientific names of the invertebrates on their cards. There is also in-formation about what the invertebrate eats, and what habitats it prefers. As you discuss habitats you might want to introduce two ideas. First, organisms are often adapted to particular habitats. That means that certain features of their bodies or behavior are well-suited for a particular habi-tat. Have the student suggest some adaptations they can observe or guess about the inverte-brates on the cards. How might these adaptations help them survive in a particular environment? Adaptations might include coloration, feeding mechanism, breathing mechanism, locomotion mechanism, or diet. Second, some species are specialists and some are generalists. Rats and squir-rels, for example, can live almost anywhere. They are generalists. Most animals we see regularly are generalists and can thrive in cities or other non-natural areas. Other species, such as spotted owls or chinook salmon survive in more specialized environments such as old, big trees or wide, cool, clean rivers. These are specialists. The concepts of adaptations and of specialists versus gen-eralists will be built on in future lessons.
7. Ask each pair to create a final invertebrate classification system based on the information on the cards. Once they have devised their system, they can name their groups, record the names and group members and a common character shared by every organism in that group on a piece of paper.
8. Hand out the mystery organism cards to each pair. Tell them that a scientist has just discovered this new species and has asked for your help to classify and name it. Instruct the students to determine in which of their groups the new species belongs. On their paper, ask students to write a paragraph describing the group the mystery species best fits and why. They may have to in-vent adaptations and life history characteristics about the mystery organism. Have each student invent an appropriate name for the organism. The mystery organism is a Trilobite. Trilobites are in the Phylum Arthropoda, jointed leg invertebrates which includes insects. They were abundant and diverse during the Cambrian Period, 570-500 million years ago. The most recent trilobite fossils have been dated to 200 million years ago, just before they became extinct. Since the first trilobite fossils were found, they have been classified several different ways. As more and more fossils have been found and studied, scientists feel more confident in their classification and their interpretation of how they lived. Trilobites lived in shallow seas and scavenged off the bottom. Some have been identified as filter feeders, sifting out particles in the water to get their food. Some were quite large and fierce predators, grabbing their prey and shredding them to pieces before ingesting them.
9. Meet again as a class. Have the students share their classification system, the rational for the clas-sification system, and the classification and naming of the mystery organism. Would they describe themselves as lumpers, splitters, or neither?

13
L2
Organizing Organisms
Discussion Questions1. How many possible classification systems might there be for the invertebrates on the cards? For
organisms in general?
2. What other things are classified besides organisms? Books in libraries, food in grocery stores, types of rocks, baseball cards, etc.
3. If a scientist discovers a new species how do you think they give it a scientific name?
4. What kinds of classifications do you make in your everyday life? How do they help you?
5. Create a scientific name for an imaginary insect with particular features – a long head, lives in pol-luted water, huge wings, tiny feet etc.
6. How do quantitative observations help classify organisms?
7. How might classification systems tell us about the history or evolution of species? What species do you think are closely related?
ReferencesnAcorn, J. and I. Sheldon. 2001. Bugs of Washington and Oregon. Lone Pine Publishing, Edmonton,
AB, Canada.
AcknowledgementsnWe thank Sara Silverman, Chloe Lytle, and Megan Stearns for the artwork on the Invertebrate
Cards.

Ecology by Inquiry: The Truth about Science14
L2 KINGDOMS OF LIVING THINGS IN THE LINNAEAN CLASSIFICATION SYSTEM
KINGDOM STRUCTURAL ORGANIZATION
METHOD OF NUTRITION
TYPES OF ORGANISMS
NAMED SPECIES
TOTAL SPECIES (estimate)
Monera small, simple single prokaryotic cell (nucle-us is not enclosed by a membrane); some form chains or mats
absorb food bacteria, blue-green algae, and spirochetes
4,000 1,000,000
Protista large, single eukary-
otic cell (nucleus is enclosed by a mem-brane); some form chains or colonies
absorb, ingest, and/or photo-synthesize food
protozoans and algae of various types
80,000 600,000
Fungi multicellular filamen-
tous form with special-ized eukaryotic cells
absorb food funguses, molds, mushrooms, yeasts, mildews, and smuts
72,000 1,500,000
Plantae multicellular form with
specialized eukaryotic cells; do not have their own means of locomo-tion
photosynthe-size food
mosses, ferns, woody and non-woody flowering plants
270,000 320,000
Animalia multicellular form with
specialized eukaryotic cells; have their own means of locomotion
ingest food sponges, worms, insects, fish, am-phibians, reptiles, birds, and mam-mals
1,326,239 9,812,298
NOTE: A growing number of researchers now divide the Monera into two distinct kingdoms: Eubacteria (the true bacteria) and Archaebacteria (bacteria-like organisms that live in extremely harsh anaerobic environments such as hot springs, deep ocean volcanic vents, sewage treatment plants, and swamp sediments). Viruses, prions, and other non-cellular entities are not included in the five kingdoms.
The numbers of named and estimated total species were derived from Gibbs, W. Wayt (2001) “On the Termination of Species”, Scientific American Vol. 285, No. 5.
This table and information are from http://anthro.palomar.edu/animal/table_kingdoms.htm.

15
L2
Organizing Organisms
Mystery Organism
Habitat: __________________________
Diet: _____________________________
Mystery Organism
Habitat: __________________________
Diet: _____________________________
Mystery Organism
Habitat: __________________________
Diet: _____________________________
Mystery Organism
Habitat: __________________________
Diet: _____________________________
Mystery Organism
Habitat: __________________________
Diet: _____________________________
Mystery Organism
Habitat: __________________________
Diet: _____________________________

Ecology by Inquiry: The Truth about Science16
L2 Invertebrate Card - Sheet 1

17
L2
Organizing Organisms
Invertebrate Card - Sheet 2

Ecology by Inquiry: The Truth about Science18
L2 Invertebrate Card 3

19
L2
Organizing Organisms
Invertebrate Card 4

Ecology by Inquiry: The Truth about Science20
L3
(Two 50-minute classes)
OverviewStudents will extend their learning of invertebrate species to the relationships between invertebrates and other plants and animals that interact within an ecosystem. In this activity, students construct a food web using invertebrate cards from Organizing Organisms and pictures of additional organisms found in western Washington forests. The lesson highlights one unique Pacific Northwest food web that includes fungi, northern flying squirrels, and spotted owls, an endangered species. The pictures of organisms are attached to a poster to show the interdependencies between organisms. Students use arrows to show the flow of energy from food to consumers. Students are required to create a food web that has a speci-fied degree of complexity, in terms of number of arrows and number of connections from bottom (pro-ducers) to top (consumers).
Focus Questions1. How do organisms interact with each other and with the environment in which they live?2. How does energy flow through a food web?
Science SkillsnStudents will be able to identify relationships between organisms based on the food an organism
eats.nStudents will be able to place organism cards in a diagram using arrows to show the flow of en-
ergy from food to consumer.nStudents will be able to label organisms as predator, prey, consumer or producer.nStudents will be able to explain how changes in the environment or the introduction of a new
species could change the system of interactions within their food web.
National StandardsnUnifying concepts and process standard: Systems, order, and organizationnLife science standard: Populations and ecosystemsnPhysical science standard: Transfer of Energy
MaterialsnInvertebrate cards from Organizing Organisms (1 card per student; note: 1 set has 24 cards)nFood Web Animals hand out (can be made into stickers; 1 set per pair of students)nScissors to cut out Food Web Animals (1 per student)nLarge piece of butcher or poster paper (1 for each pair of students)nGreen, yellow and red markers or colored pencils (1 for each pair of students)nSticky pads (1 for each pair studentsnTape or glue sticks (1 for each pair of students)

21
L3
Eating for Energy
Development of Lesson
Note: Students will work in pairs in this lesson except during steps 2-4 when work is completed individually.
1. Ask the class for examples of how an organism, such as a mosquito, interacts with other organ-isms in its environment. After brainstorming a list that includes eating or obtaining food, ask the class why animals need to eat. Continue to ask questions until they come up with the answer that food provides energy for animals to survive. Then tell the class they will be discovering many interactions between various organisms found in the Pacific Northwest (PNW).
2. Hand each student an invertebrate card from Lesson 1. It is essential that students working to-gether have cards with different organisms. Hand out two pads of sticky paper to each group. Ask students to read their card and then sketch the organism and copy the name onto one piece of sticky paper. Direct the students to sketch and label the organisms quickly. The purpose is for them to have representations of the organisms on papers they can rearrange when necessary. The purpose is not to see who can draw the best picture of an invertebrate. Sketch a picture of an animal that eats the invertebrate on another sticky. Write the name of the new animal and its diet on the sticky. Sketch a picture of something the invertebrate eats on a third sticky.
3. Ask students to discuss with their partner (or as a group of 4) their invertebrate, what it eats, and what eats it. Students are to look for any overlaps between their invertebrates. Did anyone identi-fy the same food item (prey or plant) or the same predator? Have the students arrange their stick-ies (each person will have 3 stickies: an invertebrate picture, a picture of what the invertebrate eats, a picture of a predator of the invertebrate) on the butcher paper and draw lines between food and eater. Can they think of other prey or predators that might link any of their organisms?
4. Give the Food Web Animals handout to each pair of students. This handout contains informa-tion on PNW animals and their diets. Have the students try to find any of the animals they just sketched on this sheet. Ask the students for a word that is often used to describe food that an-other organism hunts and then eats. Some should be able to come up with the word prey. Ask the students for a word that is often used to describe an organism that hunts and then eats prey. Some should be able to come up with the word predator. Notice the handout uses the words carnivore (eats other animals), herbivore (eats plants) and omnivore (eats both plants and ani-mals) to describe the animals. Review with the students the meaning of these words.
5. Tell the students they’ve begun to create a model that represents interactions between organ-isms in a PNW forest ecosystem. This model is called a food web and is used by scientists to describe and understand how forest ecosystems function. A very unique part of the forest food web includes Northern Spotted Owls, flying squirrels, Pileated Woodpeckers and fungi (truffles). See http://www.nps.gov/archive/noca/treas4.htm (Spotted Owl, fungi, and Pileated Woodpecker information) and http://www.EnchantedLearning.com/subjects/mammals/rodent/Flyingsquirrel-printout.shtml (flying squirrel) for additional background information.
6. Discuss with the students some of the reasons why the Northern Spotted Owl is an endangered species. Northern Spotted Owls build nests in very large, old conifer trees (old growth) and there are very few of these trees left now. Without the very large trees, the spotted owl can’t repro-
Day 1

Ecology by Inquiry: The Truth about Science22
L3duce. The owl feeds on flying squirrels as well as other rodents, amphibians and birds. The Pileated Woodpecker excavates holes in trees. When they abandon these holes, flying squirrels use them as nest sites. The fungi grow on the forest floor. Their roots spread across tree roots and help the trees acquire important nutrients. Flying squirrels eat the fungi.
7. Ask the students to add this unique food chain (owl eats squirrel which eats fungi) to the food webs they are creating. Ask them how a food chain is different from a food web. Food chain is a linear model and food webs show multiple branches and interactions.
8. Students can now add the other organisms from their handout to their food web. Remind them that these organisms live in the Pacific Northwest. Have them cut out and tape or glue the pictures to their butcher paper. They must draw lines to show interactions between different organisms (e.g., who eats whom). Encourage them to draw pictures of any additional organisms they think of that can be included in their food webs. The materials do not include pictures of plants (trees, grass, leaves, seeds, fruits, etc.). They will need to include these on their food webs. Give the stu-dents 20-30 minutes to finish. If you have time, ask each group to list all of the predators and all of the prey in their food web.
Day 2 (Discussion)9. Today, students will be finishing food webs and designating the flow of energy in their food webs.
Review with students the terms producer (plants who produce their own energy), primary con-sumers (organisms that eat plants, herbivores), and higher consumers (organisms that eat other animals, carnivores). Ask the students to circle all the producers in green, primary consumers in yellow, and secondary or higher consumers in red.
10. Discuss again with students why animals need to eat. They should remember that animals eat to obtain energy so they can survive. Students may also mention that energy is needed to grow and reproduce. Ask the students what else organisms need to survive and why each of these is impor-tant. Be sure to emphasize the importance of obtaining or conserving energy in some of the ideas they bring up. Make sure that oxygen and shelter are on the list. Oxygen is important for all organ-isms to use or “burn” energy in their bodies (even plants). Shelter helps animals save or conserve energy as shelter can protect them from predators and inclement weather.
11. Now ask the students how they might show the flow of energy between organisms in their food webs. After they have come up with various ideas, state that ecologists use arrows to show the direction that energy flows in a food web. This illustrates how chemical energy can be transferred from one organism to another. Ask them to finish their food webs by drawing dark arrows to show that energy flows FROM the food TO the eater. State that you expect their food webs to include at least 20 organisms and 30 arrows.
12. As a class or in small groups, ask the students to consider what might happen if a population of wolves were introduced to the area. How would the presence of wolves affect the organisms in their food web? What do wolves eat? Smaller mammals they can catch. What eats wolves? Nothing, except they are often killed by humans. You can remind them that wolves were once found in much of North America, including the Pacific Northwest. Then ask them to think of an animal that could be introduced that might not affect the food web very much.

23
L3
Eating for Energy
13. Have each group share their food web with the class. You can do this by having each group give a 2-3 minute presentation of their food web, or you can hang food web posters around the room and encourage students to view posters from the other groups. You may want to hang all, or just 1 exemplary food web in the classroom to refer to during subsequent lessons. Save all the food webs for Lesson 5: Leave it to the Sun.
Discussion Questions1. Why is this type of model called a food web? Can you think of any other names that might also
describe these interactions?
2. What are some of the strengths and weaknesses of using a food web to model interactions be-tween different organisms? Strengths – shows how energy flows from producers to consumers, shows many of the organisms in an ecosystem, can help you think about the effects of changes to the environment and the organisms; Weaknesses – doesn’t show how many of one type of organism is eaten by another, can’t show all the organisms and all the connections because there are too many.
3. How can one organism be both prey and predator?
4. Describe three things that could happen if a new organism is introduced? 1)The organism is not able to survive within the new system and it dies out. 2)The organism survives and the system contin-ues without much change. 3)The organism survives and obtains more food and can reproduce quickly, thus changing the system and possibly causing some of the original organisms to disappear. 4)The organism could alter the habitat in such a way (e.g., grazing, burrowing) that it becomes less suitable for other organisms and the other organisms die off. Other answers are also possible.
5. Explain what might happen to the various organisms in your food web if unusually high amounts of rain fell and all the creeks and rivers flooded. What other types of natural disturbances might affect the food web? Fire, drought, volcanic eruptions.
6. Think of as many organisms as you can that live in the ocean. Create an ocean food web to show the relationships between these organisms.
7. Why are animals called consumers and plants called producers? How do animals, also called con-sumers, obtain energy? How do plants, also called producers, obtain energy?

Ecology by Inquiry: The Truth about Science24
L3 Food Web Animals
Frog: Carnivore - Eats bugsEaten by hawks, owls, snakes
Black Bear: Omnivore - Eats berries, plants, fish, roots, insects, mice
Turkey Vulture: Carnivore - Eats flesh from already dead animals;Top Carnivore
Insect: Herbivore - Eats leaves, grassEaten by birds, salamanders, frogs, snakes, lizards
Mountain Lion: Carnivore - Eats deer, young or sick bear, skunks, porcupine, young elk; Top Carnivore
Deer: Herbivore - Eats leaves, grassEaten by Mountain lions
Eagle: Carnivore - Eats small mam-mals, salmon, ducks, gulls; Top Carnivore
Fish: Carnivore - Eats aquatic insects, other fishEaten by eagles, bear, whales, seals
Grasshopper: Herbivore - Eats grass, leavesEaten by birds, frogs, salamanders
Lizard: Carnivore - Eats insectsEaten by birds, snakes
Mouse: herbivore - Eats seeds, fruitsEaten by owls, hawks, snakes, coyotes
Bat: Insectivore - Eats insectsEaten by owls, snakes
Otter: Carnivore - Eats fish, frogs, turtles, crayfish, insects, young birds;Top Carnivore
Raccoon: Omnivore - Eats crayfish, fish, turtles, frogs, small mammals, birds, eggs, insects, seeds, fruits
Skunk: Carnivore - Eats insects, snails, miceEaten by owls
Snail: Herbivore - Eats leavesEaten by birds, skunks
Snake: Carnivore - Eats mice, sala-manders, snailsEaten by owls, hawks
Pileated Woodpecker: Omnivore - Eats insects, fruits, seedsEaten by hawks, owls
Spotted Owl: Carnivore - Eats mice, rabbitsEaten by hawks
Flying Squirrel: Herbivore - Eats seeds, fungiEaten by coyote, bobcat, hawk, owl
Fungi: (mushrooms)Eaten by Flying squirrels
Songbird: Carnivore - Eats worms, insects Eaten by hawks
Porcupine: Herbivore - Eats leaves, grass, shrubs, barkEaten by Mountain lions, bobcats, fishers, wolverines
Salamander: Carnivore - Eats insects, wormsEaten by snakes, hawks

25
L4
Mapping Madness
(One 50-minute class)
OverviewIn this lesson, students use mylar overlays of maps to identify tailed frog habitat. The mylar maps de-scribe habitat features in a Cascade mountain watershed near Seattle, WA. Landscape features, such as forest age, topography, roads, and stream gradient, are important to tailed frogs. The lesson begins by describing tailed frog life history to the students. Students then use the mylar overlays to identify prime tailed frog habitat as well as possible areas where land management activities could improve tailed frog habitat. Students gain a greater understanding of how habitat needs, such as older forests, limit the places a species can live. Students also consider how land management decisions, such as where to cut or preserve forests and where to build or remove roads, can be tailored to the needs of particular species. Students glimpse the methods by which mapping software and Geographic Information Systems (GIS) use spatial data to provide important information for land managers. Students preview the concept of variability by comparing solutions to the same problem.
Focus Questions1. How can information about species’ habitat requirements help scientists make decisions?2. How can maps be used to help answer scientific questions?
Science SkillsnStudents will be able to define the word “habitat.”nStudents will be able to explain how maps can be used to combine multiple types of information.nStudents will be able to describe tailed frog life history and habitat requirements.
National StandardsnUnifying concepts and processes: Evidence, models, and explanationnAbilities necessary to do scientific inquiry: Use appropriate tools and techniques to gather, ana-
lyze, and interpret data; recognize and analyze alternative explanations and predictionsnLife science standard: Populations and ecosystems
MaterialsnInternet access or tailed frog information sheet (provided, 1 sheet per student)nMylar maps of features – stream gradient, topography, roads, forest age (provided, 1 set per group)nBlank transparencies (2 per group)nOverhead markers – multiple colors (2 per group)nMapping Madness worksheet (provided; 1 per student)
Development of Lesson1. Solicit a list of features of a landscape that one might put on a map. The student list may include
roads, streams and lakes, elevation (topographic lines), forest types, trails, and buildings. Encour-age the students to brainstorm other things that might be mapped – land ownership, soil type, forest type, individual trees, average tree sizes, animal sightings, logs, bare ground, cliffs etc. Describe

Ecology by Inquiry: The Truth about Science26
L4to the students that it is difficult to include all these things on a map at the same time. Maps of different features can be combined to answer all sorts of questions.
2. Tell the students that today they will be wildlife managers. Their job is to figure out a plan to protect a species of frog called a tailed frog, Ascaphus truei, and its habitat. They will use maps to identify areas where they think tailed frogs might live currently and areas where they might be able to live if parts of their habitat were repaired. The first step in this process will be to learn about tailed frogs. You can ask students to do some research on the Internet and then report back (this will add a day to the lesson) or you can hand out the background information sheet on tailed frogs (provided) and ask students to read it in class.
3. Hand out the Mapping Madness worksheet. After the students have found information on the Internet (see References at end of lesson) or reviewed the handout, meet back again as a class. Ask the students to identify the most important habitat elements for tailed frogs. These should include steep-streams, small streams, clean, cold water, rocks, boulders, and little or no sediment. Ask the students to close their eyes and try to imagine the perfect tailed frog habitat. What ele-ments on a map would be useful to identify tailed frog habitat? Students should suggest ele-ments such as streams, steepness of streams or land, forests, tree size, and maybe roads or soils. Tell the students that you have maps of streams that describe gradient (or steepness), roads, topography (you may need to explain how a topo map works), trails, and forest age. These maps are on mylar transparencies so that you can see information on more than one map at the same time.
4. Briefly demonstrate how to use the registration marks (small crosses) to line up the mylar trans-parencies correctly. To ensure that the maps are overlaid correctly, students must line up all 3 registration marks.
5. Have the students break into groups of 2 to 4 and assign each a number. Groups must decide which map layers are the most important. Each group may have up to 3 map layers, 2 blank trans-parencies, and a few overhead markers of different colors.
6. Have the students lay the mylars on top of each other to identify the following areas: (1) Areas where you think tailed frogs are likely to live, (2) areas where roads or forests could be changed to improve tailed frog habitat. Before marking the areas, have students discuss in their groups why they think tailed frogs would or would not live in particular areas. Have the students circle the areas they think are good tailed frog habitat on one of the blank transparencies. Then have the students look at the maps again to find areas that might be good habitat if only the forest next to the stream were older or the road were not so close to the stream. Have them identify the area on the second blank transparency and discuss what actions a land manager might take to improve it. They should label (in small text at the top) each transparency and put their group number on one corner. They should also copy the 3 registration marks onto both transparencies. Use the Mapping Madness worksheet to help guide the students through the activity.
7. Meet as a class and discuss the project. Was it easy? Were some areas very obvious? Did some layers help more than others? Were some more difficult? Put all of the designations for best tailed frog habitat on the overhead projector at the same time (lining up the registration marks). Did most groups identify the same locations? Which information worked best for identifying prime habitat? What other information would have been useful? All groups will have identified slightly

27
L4
Mapping Madness
different areas. This is a good time to introduce variability. For example, why didn’t we all come up with the exact same areas? If we were going to provide this information to the manager, how would we describe it? For example, one could list just the areas identified by all groups or one could list all areas identified by any group. Would there be a way to show areas that you are very certain are tail-frog habitat versus areas about which you are less certain? You might color code areas by how many groups selected the area.
8. Repeat the discussion for the second set of transparencies in which students identified areas that are potential tail-frog habitat but which currently have some problems. Are there any problem areas that were identified by all groups? What kinds of actions could you take to improve condi-tions for tailed frogs? If you had a grant for a large amount of money and could do one thing (take out a road or preserve a forest) what would you do and where? Do you think, overall, that roads or young forests are a bigger problem for tailed frogs? Is there more variability in the designations of the problem areas than there was in the habitat identification exercise (step 7)?
Discussion Questions1. What other questions could be answered using mapped information? What features would have
to be combined? Prime habitat areas for any species, projected logging schedules for the watershed, easier routes for establishing hiking trails, areas where roads and traffic might send excessive dirt into streams, areas prone to erosion during heavy rains.
2. Can you identify where you might go and catch tailed frogs in order to confirm the conclusions of the map analyses?
3. What features could you map of the area around your school? How many different things might there be to map? Be creative. Who might benefit from using these maps?
4. What could you learn by plotting animal sightings on maps? How might that help you manage the land and improve it for those species?
5. Use the internet and various field guides to learn more about tailed frogs. For example: Where in North America are they found? What frogs are believed to be their closest relations? How long do they live? What do the tadpoles look like?
Referencesnhttp://www.naturepark.com/tfinfo.htm, Dec. 3, 2006nhttp://www.env.gov.bc.ca/wld/frogwatch/whoswho/factshts/tailed.htm, Dec. 3, 2006nhttp://www.washington.edu/burkemuseum/collections/herpetology/ascaphus.htm, Dec. 3, 2006nhttp://www.californiaherps.com/frogs/pages/a.truei.html, Dec. 3, 2006
AcknowledgementsnWe thank Bill Richards, Cedar River Watershed, City of Seattle, for map-making and assistance with
lesson creation.

Ecology by Inquiry: The Truth about Science28
L4 The Tailed FrogAscaphus truei
The Tailed Frog belongs to a family of frogs called Ascaphidae that use a ‘tail’ to internally fertilize a female’s eggs. Tailed frogs can be recognized by their small size (up to 5 cm/2 inches from tip of snout to tip of tail), vertical pupils in their eyes, no visible eardrums and a light colored triangular patch that extends from between the eyes to the end of the snout. They have webbed toes and fe-males are slightly bigger than males. Tailed frogs make no known sounds.
Habitats: where to look for themThis small frog is rarely seen. Tailed frogs live in and near rocky, mountain streams that have cold, fast-flowing water. They come out at night to look for food and to breed. They can leave the stream and travel through the forest on rainy nights but they usually spend their time in the stream. During the day they hide beneath stones in the stream. Tailed frog streams need rocks that adults can hide under, and flat, moss-free stones that tadpoles can cling onto. Tailed frogs are almost never found in open, sunny creeks or heavily silted water.
Human activities can impact tailed frog habitatLogging can destroy tailed frog habitat by removing the old trees that shade the stream, keep the water cold, and reduce erosion of the stream bank. Roads next to the stream are also a prob-lem for tailed frogs. Any silt from roads or logging that gets in the stream can kill the eggs and tadpoles. Today, regulations exist which require logging operations to leave trees that are next to streams, rivers, ponds and lakes. Rules also regulate how and where roads are built in relation-ship to steep hills and bodies of water. It is not yet known how well these new rules protect tailed frog streams and habitat.
Status in the food webA typical menu for a tailed frog adult would be snails and slugs, various delectable slow moving invertebrates such as spiders and insects. Although adults are carnivores, they are not known to eat tailed frog tadpoles.
On the other hand, tailed frogs tend to be a favorite menu item for many animals. Known preda-tors of this frog are snakes. Garter snakes have been seen preying on adults and larvae. Other amphibians and predatory freshwater fish, such as trout, are also known to have an appetite for these frogs.

29
L4
Mapping Madness
Mapping MadnessWorksheet
After reading the tailed frog information sheet, answer the following questions.1. Describe the perfect tailed frog habitat.
2. What elements on a map would be useful to identify tailed frog habitat?
Directions for working with maps and mylar overlays:1. Match up the registration marks (crosses) on all of your maps.2. Look at the maps and overlays. Discuss with your group members where you think the best tailed
frog habitat is found. You must be able to state why it is good tailed frog habitat.3. On a blank transparency, outline the area with the best tailed frog habitat. Be sure to label it or to
make a key. Draw a registration mark to help you line up the overlays.4. Discuss with your group areas that could become good tailed frog habitats if certain improve-
ments were made. What improvements would you recommend to create good tailed frog habitat?
5. On a second blank transparency, outline the area(s) that could be improved to create good tailed frog habitat. Be sure to label the area or to make a key. Draw a registration mark to help you line up the overlays.
6. Which information (map layer) was the most helpful in creating your tailed frog habitat maps? Why?
7. What is your top priority recommendation for restoring parts of the area to good tailed frog habitat?

Ecology by Inquiry: The Truth about Science30
L4

31
L4
Mapping Madness

Ecology by Inquiry: The Truth about Science32
L4

33
L4
Mapping Madness

Ecology by Inquiry: The Truth about Science34
L5
(Six 50-minute classes)
OverviewStudents examine food webs more closely, asking the question “What is the source of energy flowing through food webs?” To understand how plants transform energy from sunlight to chemical energy, they perform two experiments. As a class, they cover 4 leaves on 2 geranium plants and observe changes in leaf color and size over 7 days. This first experiment models the process of designing an experiment and collecting data. In the second experiment, students investigate the role of carbon dioxide in photosyn-thesis. Students then design their own experiment to investigate the influence of one of several variables on rates of photosynthesis. This experiment reinforces concepts in experimental design. At the conclu-sion of this lesson, students reexamine their food webs from Lesson 3: Eating for Energy, identifying and labeling producers and consumers as well as the role of the sun.
Focus Question1. Where does the energy for life come from?2. How do plants use sunlight?3. How is energy transferred and transformed through a food web?
Science SkillsnStudents will be able to identify the sun as the original source of energy for food webs in various
communities.nStudents will be able to describe the evidence indicating that plants use carbon dioxide to trans-
form energy from sunlight to sugar (stored chemical energy) in a process called photosynthesis.nStudents will be able to distinguish between producers (plants) and consumers (animals) in their
food webs.
National Science StandardsnUnifying concepts and processes standard: Systems, order, and organization; Evidence, models
and ExplanationnScience as inquiry standard: Abilities necessary to do scientific inquirynPhysical science standard: Transfer of energynLife science standard: Populations and ecosystems
MaterialsnGeranium plants (2 per class)nEmpty 0.5L plastic bottles (reusable; 1 per pair of students)nStraws (not reusable; 1 per pair of students)n30ml dropper bottles with bromthymol blue (0.04% aqueous solution; 1 per group of 4)nClear plastic tubes or vials with caps (3 per pair of students)nAluminum foilnPermanent markers (1 per pair of students)nMetric rulers (1 per pair of students)nGrow lights with full spectrum bulb (if necessary)

L5
35Leave it to the Sun
n3” sprigs of elodea (or equivalent; not reusable; 3 per pair of students) Elodea is a common aquar-ium plant that is considered a noxious invasive species in some areas. You can purchase elodea at many pet stores that sell fish and aquarium supplies. DO NOT DISPOSE OF IT IN A POND OR LAKE. Give what’s left to someone with an aquarium, compost it, or throw it in the garbage.
nSafety goggles (1 per student)nStudent Worksheet: Leave It To The Sun (provided; 1 per student)nStudent Worksheet: Leave It To The Sun, Part 2 (provided; 1 per student)nFood Web Posters from Lesson 3: Eating for Energy
Development of LessonNote: the development of this lesson occurs over 6 class periods. These are summarized here:
1st period – set up geranium experiment (Part 1)2nd period – do BTB exploration (Part 2; may need time at the beginning of the 3rd period to finish)3rd period – plan elodea/photosynthesis experiment (Part 3)4th period – observe geranium plants (Part 1), finish experiment plan (Part 3)5th period – do BTB experiment (Part 3)6th period – observe geranium plants (Part 1), wrap-up discussion.
Part 1 (Geranium experiment)1. Begin by brainstorming with the class some of the differences and similarities between plants
and animals. Refer to the food webs made by the students to spark ideas. Using the overhead or a large piece of poster paper, record the students’ ideas. Try to obtain consensus on all of the ideas presented. If there are disagreements, create an additional list of ideas the class is not 100% sure of. Save all of the lists to review at the end of the lesson. Consider using the graphic organizer pro-vided.
2. One idea students will come up with is that plants need sunlight. (They may or may not agree as to whether animals need sunlight.) Ask them how they know plants need sunlight. The students may respond that without sunlight plants will die. Ask students, “What happens when a leaf does not get sunlight?” Accept any answers the students may provide. Explain that the class will inves-tigate this question over the next few days.
3. Distribute the student worksheet “Leave It To The Sun.” The format of this worksheet will guide students through the main steps of designing an experiment. Review the Research Question and the Procedures with the class. If you have not discussed experimental variables (manipulated/in-dependent, responding/dependent, controlled/kept the same) you’ll need to do that now. You may choose whether to complete the remainder of the experiment plan together as a class or have the students work on it in small groups. It may be instructive to have the students struggle with it for 10 minutes and then finish it as a class. The students will use a more open-ended form of this worksheet in Part 3. An example answer sheet is provided.
4. Set up the experiment as a class. Follow the procedures, asking for volunteers to complete each step. Student volunteers can sketch the different leaves on overhead transparencies so the entire class can see. Each plant will have two uncovered and two covered leaves. These need to be on the same side of the plant so they can get a similar amount of light, especially if they are placed next to a window. Note that one plant will have leaves labeled 1U, 1C, 2U, 2C and the second plant will have leaves labeled 3U, 3C, 4U, 4C. (U - uncovered, C - covered) You will need two plants for each section of science you teach.

Ecology by Inquiry: The Truth about Science36
L55. Place plants by the window or under grow lights where they will all receive roughly equal
amounts of light and be kept at about the same temperature.
6. Have the students water plants as needed and make observations after 3 days and after 7 days. For the observations on day 3, students must gently remove and then replace the foil coverings. The students will observe the covered leaves becoming less green and more yellow. It may take a while to see any change as plants are fairly hardy and can survive for some time without sunlight. If they haven’t seen any changes in a week, continue the experiment. Double check to make sure they haven’t over-looked some yellowing on the edges of the leaf.
7. To summarize this experiment, see the final wrap up at the end of this lesson.
Part 2 (BTB exploration)8. Remind students that they will be continuing their investigation about how plants use sunlight.
Today they will set up another experiment to learn more about this. Tell them that first they must become familiar with a type of tool used by scientists. Show them the materials they will be us-ing, empty 0.5L bottles, straws, and BTB (Bromthymol blue) indicator solution. (BTB indicates the presence of carbon dioxide by changing from blue to greenish yellow. Don’t tell the students this now. Let them discover it.) Tell the students that when using the BTB, they need to be wearing goggles. Goggles are always worn when using chemicals to protect the eyes in the event of an accident. Instruct them to work in pairs and do the following:
1) put on their goggles; 2) fill the bottle half full with water; 3) add 20 drops of BTB; 4) insert the straw and choose 1 person to blow into the bottle; 5) stop blowing once the color stops changing 6) record observations. Use the student worksheet provided (Leave It to the Sun, Part 2).
SAFETY NOTE: Remind students that in the science lab we do not eat and drink. The straws are for blowing air into the bottles. They should blow gently so the bubbles do not leave the bottles. They should NOT inhale through the straws.
9. Once students have finished, ask them to put their materials aside so you can discuss what hap-pened. Ask the students to describe what happened and why. If they are having difficulty, remind them that the BTB is an indicator solution. What does it appear to indicate? Students will respond that it indicates the presence of carbon dioxide. The main point here is that the BTB turns yellow in the presence of carbon dioxide. (Note, while this is an acceptable answer, the BTB is actually a pH indicator and turns yellow in the presence of an acid, in this case carbonic acid that forms when carbon dioxide mixes with water. This detail is not important for the students to know.)
10. Ask the students if they think the BTB could turn back to its original blue color. How might they do this? After hearing various ideas from the students, select one that you have materials for and is safe. One way is to put a cap on the bottle and shake it. This will mix more oxygen and nitrogen from the air into the solution, thus diluting the amount of carbon dioxide. Another way is to take a pipet or eye dropper and squeeze air back into the solution. The students might have to trans-fer some of the yellow BTB solution into a smaller container to use the eye droppers. The main point here is that the BTB will turn from yellow back to blue when the carbon dioxide is diluted or removed from the solution. The students will also notice an intermediate green color as the BTB

37
L5
Leave it to the Sun
changes between blue and yellow. NOTE: the longer the students blow into the BTB solution, the longer it takes to turn the color back to blue when adding oxygen. The students should now be able to write a conclusion for this activity on their student worksheet.
11. Remind students of the geranium experiment set up the day before and that one of the big focus questions for this lesson is “How do plants use sunlight?” Ask the students how they might use the indicator BTB to learn more about plants and how plants use sunlight. After some discussion, guide the students to the idea that they can use the BTB to determine whether or not plants use carbon dioxide during the day (with sunlight) or night (no sunlight).
12. Review the Investigation Question and Procedures for Investigation 2 on the second half of the Leave It To The Sun, Part 2, student worksheet. Have the students follow the procedures to set up the experiment. Depending on how much carbon dioxide they have blown into their solution, they may not see changes until the next day. You can leave the vials in front of the grow lights overnight. If you don’t have grow lights, place the vials in a sunny window. The control vial (BTB without elodea) will stay yellow; the vial with BTB, elodea and foil will stay yellow; the vial with BTB, elodea and no foil will turn blue. This happens because the plant is exposed to light and is using the energy in the light to convert carbon dioxide to sugar. This process is called photosyn-thesis. The plant needs carbon dioxide for photosynthesis so it is using up the carbon dioxide in the BTB solution. As the carbon dioxide is used up, the BTB turns back to blue.
13. Once the students have completed their observations (this might be the following day), you will need to discuss the results as a class. You can begin the discussion by asking the students to describe what happened. They should have seen that only the vial with yellow BTB and the elo-dea changed from yellow to blue. Why did this happen? The plant in the light used up the carbon dioxide in the solution and the BTB changed back to blue. Why did we include the vial covered with foil? To test whether or not the light was necessary. Why did we include the vial without the plant? To test whether or not the plant was necessary for the reaction to occur. These were our experimental controls.
14. Not all vials may look exactly as they are “supposed” to. Temperature can affect the results. Plants also use oxygen and give off carbon dioxide, as all living organisms do, to obtain energy from the sugars they produce. This might affect some of the vials of elodea without foil. The variability in the results provides a great springboard for a discussion on why scientists do multiple trials and repeat experiments. There are so many different factors that can affect the results of this type of experiment, that to get a good idea of what happens most of the time, the experiment has to be repeated many times. Evaluating inconsistent results is an important part of science, as well as science standards.
15. The big idea from this experiment is the evidence that plants use carbon dioxide when in the presence of sunlight. This is part of the process of photosynthesis. You can diagram this with the class on an overhead or whiteboard:
PHOTOSYNTHESIS: SUNLIGHT + CARBON DIOXIDE ???
Ask the students what they think the process of photosynthesis produces. You may get a wide variety of answers. The correct answer is sugar and oxygen. Some students will already know that

Ecology by Inquiry: The Truth about Science38
L5plants use carbon dioxide and give off oxygen. Water is also a reactant and a product in this pro-cess. Complete the diagram above with the students. Emphasize the ability of plants to transform energy from sunlight into chemical energy stored in the plant, sugar. Although scientists have tried for years to develop a machine that can transform energy from the sun into chemical en-ergy, they have never been successful. To date, only plants are capable of this process. Scientists and engineers have developed solar devices that transform energy from the sun into electrical energy and thermal energy, but the process is much different from photosynthesis.
PHOTOSYNTHESIS: SUNLIGHT + CARBON DIOXIDE (+ water) SUGAR + OXYGEN (+ water)
16. Discuss with the students how to write their conclusions. They should include the above diagram of photosynthesis and observations from their experiment to support their conclusions. (NOTE: For advanced students, you can use the chemical abbreviations for carbon dioxide (CO2), oxygen (O2), sugar (C6H12O6) and water (H2O). Discuss with the students that each of the capital letters represents an element. If you have a Periodic Chart of the Elements in your classroom or in a textbook, take it out and have the students figure out the name of each of the elements. These elements represent every kind of atom in this world. Everything in our world, living and nonliving, is made up of various combinations of just these elements. The numbers after each letter indicate the number of atoms of that element in the molecule. For example, in one molecule of carbon dioxide, there is one atom of carbon and 2 atoms of oxygen all hooked or bonded together. Because the atoms on one side of the equation must equal the atoms on the other side (Conser-vation of Matter), students can play with the equation to figure out the necessary proportions of each of the ingredients.)
Part 3 (Planning the elodea/photosynthesis experiment)17. Now, the students have an opportunity to design their own experiment and determine how one
variable affects the rate at which elodea uses carbon dioxide. The students will use a worksheet similar to the one used on the first day. This time, all the boxes will be blank. Each group of stu-dents (groups of 2 or 4) will plan their own experiment. Brainstorm with the class a list of variables that could affect the rate of photosynthesis in elodea. Some ideas include:
n The amount of elodea n The concentration of BTB n The temperature n The type of plant (if you or the students are willing to buy a different aquarium plant) n The distance of the vial from the light source n The use of blue BTB vs. yellow BTB n The amount of carbon dioxide in the BTB (how long you blow)
Each of the variables could be tested to see how they affect photosynthesis in elodea. Each group of students will choose one variable to test (the manipulated or independent variable). They will have to keep all of the remaining variables the same for each of their trials (controlled variables) to avoid bias and to have a “fair” and valid test.
18. Ask the students how they will know if there is an effect or not? What will they measure? In this system they will be looking for a color change in the BTB as a way to measure the amount of carbon dioxide used by the plant. The color of the BTB is the responding or dependent variable.

39
L5
Leave it to the Sun
Once they have identified the variables, they can write their Research Question. To help them, suggest using one of the following prompts to phrase their research question: “Is there a differ-ence between _________” or “How does _____________ affect _____________?” (e.g., Is there a difference in the amount of carbon dioxide in the water as shown by the color of the BTB solution when you use 3” or 6” of elodea?, How does the amount of elodea affect the amount of carbon dioxide in the water as shown by the color of the BTB solution?)
19. Once the students seem to have a good idea of what they want to investigate, hand out the stu-dent worksheet and let them begin to plan their experiment. If you think the students are having difficulty designing an experiment, you can complete a mock one with them. Choose one of the ideas above and plan it together with the class. You can make transparencies of the worksheet and fill it out for them. Require the students to design a different experiment for their own work. If students can quickly set up their vials at the beginning of a class period, they can record color of the BTB at regular intervals during the remainder of the period. If there is not enough time during class, they will have to leave the vials over night. Once students have planned their experiment, ask them to show it to you to get your approval. Challenge the students to find quantitative mea-sures of color change, for example using a color chart or timing the process.
20. On the beginning of the 4th day of this series of experiments, provide time to examine the gera-nium leaves that have been covered for 3 days. Then have students continue planning and con-ducting their elodea photosynthesis experiments.
21. Students will need at least one full day to do their experiments, record observations and write conclusions. Once they have finished, have them share their results with the class. They can give 3 minute presentations of what they did and what they found out. Having each group make one or two overheads to describe their results will help structure their presentations. Giving presenta-tions to the class of their results may add an extra day onto the lesson.
22. After completing the elodea photosynthesis experiments, provide time for the class to do a final observation of the geranium leaves that have been covered for a week. Ideally, this should be done before conducting the final discussion.
Final Discussion23. Once the students have finished all their experiments you will want to have a discussion to tie
all of the investigations and concepts together. Begin by holding up an acorn or other tree seed and a branch, log or picture of a tree. Ask the class how the tree goes from being a small seed to a very large plant? Where does the mass of the tree (roots, trunk, branches, leaves, etc.) come from? Make a list of responses. These will include soil, water, sun and possibly air (carbon dioxide and oxygen).
24. Tell the students the true story of an experiment conducted by Jan Baptista van Helmont (1580–1644). Here’s how Van Helmont describes his own experiment:
“…I took an earthenware vessel, placed in it 200 pounds of soil dried in an oven, soaked this with rainwater, and planted in it a willow branch weighing five pounds. At the end of five years, the tree grown from it weighed 169 pounds and about three ounces. Now, the earthenware vessel

Ecology by Inquiry: The Truth about Science40
L5was always moistened (when necessary) only with rainwater or distilled water, and it was large enough and embedded in the ground, and, lest dust flying about should be mixed with the soil, an iron plate coated with tin and pierced by many holes covered the rim of the vessel. I did not compute the weight of the fallen leaves of the four autumns. Finally, I dried the soil in the vessel again, and the same 200 pounds were found, less about two ounces. Therefore 164 pounds of wood, bark, and root had arisen from water only.”
Ask the students if the mass of the willow tree (164 pounds of growth in 5 years) came from the soil. How do they know? The mass of the tree could not have come from the soil because the soil did not lose 164 pounds and the matter that makes the mass cannot be magically created from nothing. What do they think Van Helmont’s own conclusions were? Van Helmont actually concluded that “164 pounds of wood, bark, and roots, arose out of water only.” Ask the students if they think this conclusion is correct? How could they test it? Grow a plant without soil and just water. Is it possible to grow plants in water with no soil? Yes, this is called hydroponics. Minerals are added to the water similarly to fertilizer. What else is the plant using beside sunlight and water? Air or carbon dioxide. Ask the students to think about what Van Helmont might say if he had done the experiments they just completed with elodea and BTB? Answers will vary, but may include that carbon dioxide is necessary for plants to live. The goal is to get the students to think about what a plant needs to grow and which of those needs actually supplies the material (matter) for that growth (building new leaves, roots, stems, branches, trunk, etc.).
25. Now put up the formula for photosynthesis.
PHOTOSYNTHESIS: SUNLIGHT + CARBON DIOXIDE + WATER SUGAR + OXYGEN + WATER
OR
SUNLIGHT + CO2 + H2O C6H12O6 + O2 + H2O
Ask the students what evidence they have to support the formula above. sunlight – geranium experiment, elodea experiment; carbon dioxide – elodea experiment; water – plants at home, des-ert plants At this point, we have to accept that the plants actually produce sugar in their leaves from sunlight, carbon dioxide and water. (We have not tested for sugar in the leaves.) If you have looked at the chemical nomenclature for each of the products and reactants, you can discuss how the atoms get rearranged to make the sugar and oxygen molecules. The atoms on the right side of the equation (Carbon, Oxygen, Hydrogen) are all the same as those on the left side. You might also have the students do their own research to find out the chemical composition of sugar. Then they will figure out that the carbon dioxide and the water are chemically reconfigured to make sugar, oxygen and water. Point out that soil is not in the formula. So, where does the mass of the tree come from? Mostly carbon dioxide in the air along with some water! In fact, 93% of the dry weight of a plant comes from carbon dioxide! How do plants get food? They make it using energy from the sun and using carbon dioxide from the air. Plants are called producers because they produce their own food that they use to grow through the process of photosynthesis.
26. Refer to the initial list of similarities and differences between plants and animals in Step 1 of the procedures for this lesson. Add to this list new concepts from the last week. Also, look at the list

41Leave it to the Sun
L5of ideas the students were not sure about. Can they answer any of these now? Do they have ideas for designing experiments that might help them answer the questions?
27. Have the students look at the food webs they made in Lesson 3: Eating for Energy. What is missing from them? The answer is The Sun! Have each group draw a sun on the food web poster. Using ar-rows, show the flow of energy from the sun to all of the plants included in the food web. Now ask the students to label the plants “Producers” because they produce their own food. Animals that eat plants or eat other animals are consumers because they must consume food to obtain energy. Have students label the consumers in their food webs. Conclude this lesson by asking several stu-dents to point out how energy is transformed and transferred in nature (e.g., in their food webs).
Discussion Questions1. What important nutrients does soil provide for plants? Minerals such as phosphate, nitrogen, iron,
magnesium, zinc
2. How might removing all of one type of organism alter a food web? If all the large, old growth trees disappeared from a forest, the number of Northern Spotted Owls would decrease because they wouldn’t be able to find limbs big enough for building nests. They would also have a hard time flying in a forest with lots of small trees that grow close together.
3. Can you think of any food webs that don’t include the sun? 1.5 miles below the surface of the ocean are deep sea ridge areas where hot, hydrothermal fluids bubble up from underneath the ocean floor carrying dissolved minerals. Bacteria that live in these areas use hydrogen sulfide in the waters, along with carbon dioxide to make sugar. There is no sunlight and no plants. Various marine animals, includ-ing tube worms, crabs, mussels and clams rely on the bacteria to produce sugars which the animals can consume. For more information go to ridge2000.bio.psu.edu/
4. How do you think plants grow in the forest when there is so much shade? What kind of adapta-tions might plants have?
5. Look at some branches of different plants. Why do plants arrange their leaves in particular ways? To maximize exposure to the sun in many cases.
6. If the mass of a tree comes from carbon dioxide, where does the flesh of a lion come from? What are the original sources of that energy? The flesh of a lion comes from the flesh of the prey the lion eats. The prey are often grazers or browsers like zebra, wildebeast, or gazelle that eat plants. Thus, the lion’s flesh can be traced back through the food web to plants and to the carbon dioxide the plants use. The original source of energy is the sun.
ReferencesnKeeton, W.T. and J.L. Gould. 1986. Biological Science, 4th edition. W.W. Norton & Co.: New York, NY,
USA.
Leave it to the Sun

Ecology by Inquiry: The Truth about Science42
L5Leave it to the Sun
Observation Worksheet
Similarities between Plants and Animals:
Differences:
Plants Animals

43Leave it to the Sun
L5
The Manipulated/Independent Variable we want to change:
The Responding/Dependent Variable we will measure:
The number of Repeated Trials we will do:
The step-by-step Procedures we will follow:
1) Cut 8 pieces of aluminum foil into 10-12cm strips (like a twist tie). Use a permanent marker to label the strips 1U, 1C, 2U, 2C, 3U, 3C, 4U, and 4C. (U-uncovered; C-covered)
2) Select 4 leaves on the same side of each of the geranium plants. Loosely attach an aluminum foil strip to each leaf. Strips 1-2 should be on one plant and 3-4 on the other.
3) In your data table, sketch and label a diagram of both sides of all 8 leaves. Record the color. Mea-sure the width of each leaf at the widest point. Record your measurements.
4) Cut 4 pieces of aluminum foil big enough to cover the leaves labeled “C” on both sides. Wrap the foil gently around the leaf to block out ALL of the sunlight.
5) After 3 days and after 7 days, make observations as you did in step 3. Remove the foil and then gently replace it when making observations.
The Controlled Variables we will keep the same:
Our Hypothesis/Prediction and Reasoning:
What our experiment will look like:
Leave it to the Sun(Part 1)
Our Research Question:
How does covering a leaf with foil affect the color and size of the leaf?

Ecology by Inquiry: The Truth about Science44
L5
Our Results:
Our Conclusions:
nAnswer your research question. Use evidence from your data tables to support your answer.
nDo your results make sense to you? Why or why not?
nWhat new questions do you have about this system?
1U 2U 3U 4U 1C 2C 3C 4C
Leaf Obs. & Color After
3 Days
Leaf Obs. & Color After
7 Days
1U 2U 3U 4U Average 1C 2C 3C 4C Average
Leaf Size After 3 Days
Leaf Size After 7 Days
Leave it to the Sun(Part 1)
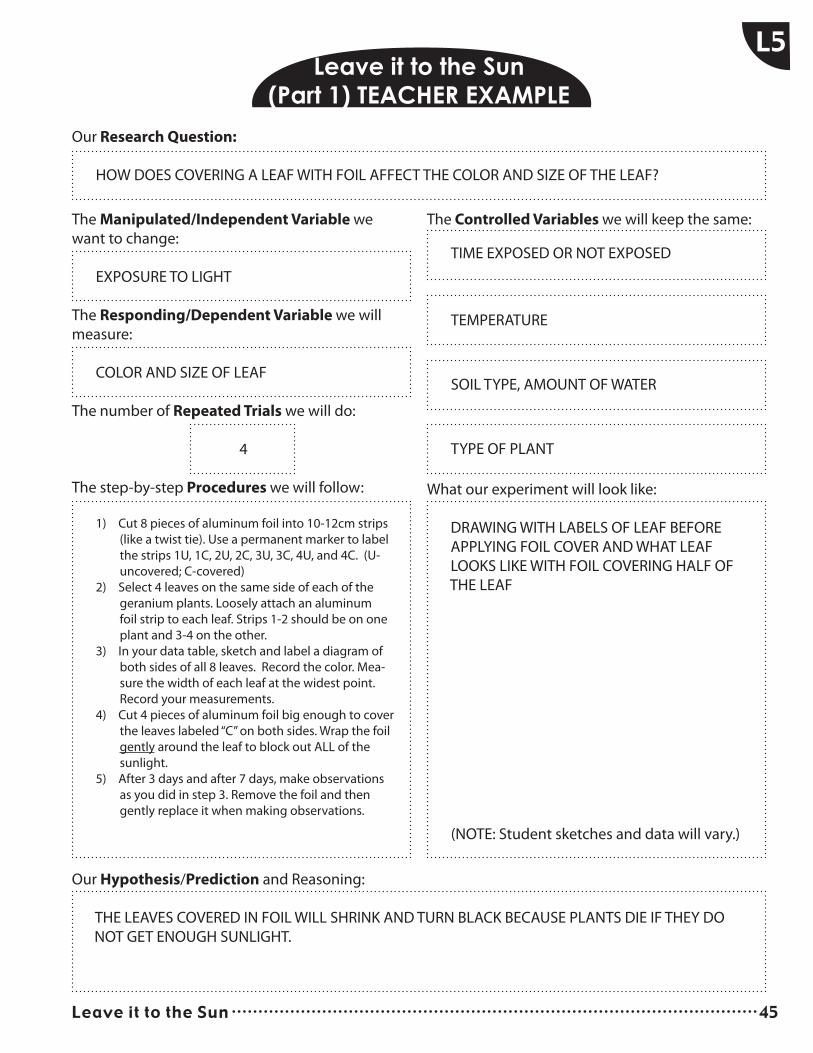
Leave it to the Sun
L5
45
Leave it to the Sun(Part 1) TEACHER EXAMPLE
Our Research Question:
HOW DOES COVERING A LEAF WITH FOIL AFFECT THE COLOR AND SIZE OF THE LEAF?
The Manipulated/Independent Variable we want to change:
EXPOSURE TO LIGHT
The Responding/Dependent Variable we will measure:
COLOR AND SIZE OF LEAF
The number of Repeated Trials we will do:
4
The step-by-step Procedures we will follow:
1) Cut 8 pieces of aluminum foil into 10-12cm strips (like a twist tie). Use a permanent marker to label the strips 1U, 1C, 2U, 2C, 3U, 3C, 4U, and 4C. (U-uncovered; C-covered)
2) Select 4 leaves on the same side of each of the geranium plants. Loosely attach an aluminum foil strip to each leaf. Strips 1-2 should be on one plant and 3-4 on the other.
3) In your data table, sketch and label a diagram of both sides of all 8 leaves. Record the color. Mea-sure the width of each leaf at the widest point. Record your measurements.
4) Cut 4 pieces of aluminum foil big enough to cover the leaves labeled “C” on both sides. Wrap the foil gently around the leaf to block out ALL of the sunlight.
5) After 3 days and after 7 days, make observations as you did in step 3. Remove the foil and then gently replace it when making observations.
The Controlled Variables we will keep the same:
TIME EXPOSED OR NOT EXPOSED
TEMPERATURE
SOIL TYPE, AMOUNT OF WATER
TYPE OF PLANT
Our Hypothesis/Prediction and Reasoning:
THE LEAVES COVERED IN FOIL WILL SHRINK AND TURN BLACK BECAUSE PLANTS DIE IF THEY DO NOT GET ENOUGH SUNLIGHT.
What our experiment will look like:
DRAWING WITH LABELS OF LEAF BEFORE APPLYING FOIL COVER AND WHAT LEAF LOOKS LIKE WITH FOIL COVERING HALF OF THE LEAF
(NOTE: Student sketches and data will vary.)

Ecology by Inquiry: The Truth about Science
L5
46
Leave it to the Sun (Part 2)
Investigation 1 Question: What does the indicator Bromthymol Blue (BTB) do?
Procedures: 1) Put on your goggles.2) Fill the bottle half full with water.3) Add 20 drops of BTB.4) Insert the straw and choose 1 person to blow into the bottle.5) Stop blowing when the color stops changing.6) Record observations.
Observations:
Conclusions: (Use complete sentences. What did you do? What happened? Why?)
Investigation 2 Question: Do plants use carbon dioxide during the day or night?
Procedures: (work in groups of 2) 1) You will need yellow BTB to begin this investigation. If you don’t have any ready, make some by blowing through a straw into a bottle of blue BTB as you did above. 2) Cut two pieces of elodea, 3 inches long. Place each piece into a vial. 3) Add yellow BTB to each vial. Be sure to fill each vial as close to the top as possible. Place a cap on each vial. Pour yellow BTB into a third vial, without elodea. Fill it to the top and cap it. 4) Wrap one vial containing elodea and yellow BTB with foil so that the foil seals out all light. Wrap the foil neatly so the vial is still able to stand up on its own. 5) Use masking tape or small labels to label the caps with your initials. 6) Place the vials under a grow light or in a window that gets lots of light. Make sure each vial is the same distance from the light source so the temperature is the same for all vials. 7) Record observations in the table below.
8) On a separate sheet of paper, write a conclusion. In your conclusion be sure to: n Answer the investigation question. n Include evidence from the experiment to support your answer. n Explain how the evidence supports your conclusion.
SAFETY NOTE: The straws are for blowing air into the bottles. DO NOT inhale through the straws. Blow gently so the bubbles do not leave the bottle.
Before placing vials in the light End of this class period Beginning of the next day

Leave it to the Sun
L5
47
Leave it to the Sun(Part 3)
Our Research Question:
The Manipulated/Independent Variable we want to change:
The Responding/Dependent Variable we will measure:
The number of Repeated Trials we will do:
The step-by-step Procedures we will follow:
The Controlled Variables we will keep the same:
Our Hypothesis/Prediction and Reasoning:
What our experiment will look like:

Ecology by Inquiry: The Truth about Science
L5
48
Quantitative Observations
Qualitative Observations
nAnswer your research question. Use evidence from your observations to support your answer.
nDo your result make sense to you? Why or why not?
nWhat additional questions do you have about this system?
Leave it to the SunObservation Worksheet

A Leaf Lunch
L6
49
(Three 50-minute classes)
OverviewStudents examine decomposition processes in a package of leaves placed in a stream or pond. This lesson extends the exploration of energy flow in ecosystems. Students learn to identify species of inver-tebrate decomposers and they observe the conversion of matter and energy from dead to living organ-isms. They discuss what happens to the leaf tissue after the invertebrates and bacteria do their work. Where does the energy go? Where does the matter go? To relate these ideas to earlier concepts, students build a new food web, including decomposers. They learn about trophic levels and identify them in their food web.
NOTE: This experiment must be set up in advance. The leaf packs must stay in the stream or pond 2-4 weeks before the students collect the data, draw conclusions, and relate the concepts to previously studied concepts.
Focus QuestionWhat happens to the matter and energy in living organisms after they die?
Science SkillsnStudents will be able to identify orders and families of some invertebrates that decompose plant
material in a stream.nStudents will be able to create an aquatic food web, correctly placing arrows to show the direc-
tion of the flow of energy.nStudents will be able to design a repeatable experiment, include replicates and identify manipu-
lated/independent, responding/dependent and controlled variables.
National Science StandardsnUnifying concepts and processes standard: Systems, order, and organization; Evidence, models
and explanationnScience as inquiry standard: Abilities necessary to do scientific inquirynPhysical science standard: Transfer of energynLife science standard: Populations and ecosystems
Materialsn1/2” Plastic mesh bags (similar to produce mesh bags)nPlastic twist ties or 6” lengths of string for closing the mesh bagsnMagnifying glasses (at least 4x; 1 per pair of students)nPetri dishes (6 per group of 4 students)nTweezers (1 per pair of students)nPlastic spoons (1 per student)nRope (16 meters per class)n Scissors or knife to cut the rope (for teacher use)n Small, white garbage bags (75 per class)

Ecology by Inquiry: The Truth about Science
L6
50
n Aquatic Invertebrate keyn Duct tape and permanent markers for labeling the leaf packsn Worksheet (provided pages 54-56, 1 per student)n Functional groups of stream invertebrates table (provided, 1 per student per site)
Development of Lesson Before the Lesson
1. Before beginning this activity, select a convenient pond or stream where students can place their leaf packs for up to a month. If the students are not familiar with the location, you may want to show some pictures or draw a sketch of the area and major features on a piece of poster paper. Students will need this information to design their experiments.
2. Decide whether you want the class to design one experiment together, and have lots of repli-cates, or have groups of four students design different experiments. Base your decision on the size of the class and number of groups you will end up with. If they do independent, group experiments, each group will need to have at least 4 leaf packs, 2 per treatment type, and plenty of pond or stream area for distributing the packs. Designing the experiment as a class allows for a more guided discussion of the design and a simpler implementation of the experiment.
3. The day before you begin this activity, ask the students to gather some leaves from the ground and bring them to class in a plastic bag.
Planning the Experiment4. Look back at the food web posters. Ask a few students to explain what happens to the sun’s
energy in the food webs. The sun’s energy is transformed to chemical energy by plants. When con-sumers eat plants, the chemical energy is transferred from the plant to the consumer. What happens to the plant and animal material (matter) in the food webs? The matter passes through the food web. Waste products produced by organisms eliminate some of the matter from the web. As we have not talked about decomposers yet, many of the food webs may end with top consumers. Ask the students what happens to the bodies of the top consumers when they die? What happens to the energy and matter in the bodies of the top consumers? How do they know this? What evidence do they have to support their answers? Some students will have the understanding that the bod-ies will “rot” or decompose, but they may also have misconceptions that the energy and matter simply disappear after an animal dies. Ask them what happens to food left in the refrigerator for too long? Accept all reasonable answers. By the end of the lesson, they will be able to state that this process of “rotting” or decomposition transfers the energy and the matter to different organ-isms, whether it is mold (fungus), bacteria, or some other type of decomposer. As they have not necessarily seen the evidence for this, they do not need to know this yet.
5. Show some of the leaves the students have brought in and ask what they think happens to the leaves once they are on the ground. What happens to leaves that fall in a pond or stream? Some students may respond that energy and matter are stored in the dead leaves. Some animals might even eat dead leaves. Many students will respond that the leaves will rot or break down. Ask them how they think this happens. You will get a variety of responses. Don’t tell them which ones are right or wrong at this point.

A Leaf Lunch
L6
51
6. Tell the students that they will investigate what happens to leaves when they fall into a pond or stream. Show them the mesh and how it can be wrapped and tied around a bundle of leaves. Use the twist ties or string to secure the edges. Scientists use this method to study what happens to leaves in streams or ponds and to understand better the community of organisms who depend on plant material that falls in the water. Specifically, the leaf packs attract aquatic invertebrates that feed on the leaves. (See one of the references below for more information on the inverte-brate community of leaf eaters.)
7. Describe to students the pond or stream where the leaf packs will be placed. Let them know whether the entire class will design one experiment of if each group of 4 will design an experi-ment.
8. Ask students for suggestions as to how they could design an experiment using leaf packs to learn more about what happens to a leaf once it is in a pond or stream and what types of invertebrates are attracted to the leaf pack. To get a more complete understanding of what happens, encour-age students to think about interesting comparisons. To formulate a testable research question, brainstorm with the students the different variables that might affect the number or species of invertebrates in a leaf pack. The list of variables could include:
n Type of leaves (e.g., maple vs. alder) n Current (e.g., fast vs. slow area of a stream, pond vs. stream) n Cover object (e.g., under a rock vs. next to a rock, under a rock vs. under a log) n Depth of water n Exposure to sunlight (e.g., sunny area vs. shady area) Students can choose one of these variables to test (manipulated/independent variable) while
they keep all the other variables the same (controlled variables). The responding/dependent vari-able the students will measure will either be the number of species, the number of invertebrates of all species, or the number of one species of invertebrates.
9. After selecting the manipulated/independent variable you will test (this is the comparison) and the responding/dependent variable you will measure, write a testable research question that includes both variables. Here are a few examples:
n Is there a difference between the types of aquatic invertebrates attracted to a leaf in a fast moving part of the stream or a slow moving part?
n Are there the same number of invertebrates in leaf packs in ponds and streams? n Are there the same number of invertebrate species in leaf packs in ponds and streams? n Is there a difference in the aquatic invertebrate numbers or species attracted to leaves
next to wood in streams and far away from wood in streams? n What is the effect of the depth of the water on the numbers or species of invertebrates? n How does the type of leaf in the pack affect the number of aquatic invertebrates?
10. Continue to design the experiment around the research question. The research question and experimental design must be workable within the chosen field site (see procedure 1 above). Use the experiment plan from Lesson 5: Leave It To The Sun again as a guide for designing the ex-periment. If groups are working independently to design experiments, approve all experiments before students begin. You may want to take a day and have each group present their plan to the class. This allows the students to think about other research designs and make suggestions

Ecology by Inquiry: The Truth about Science
L6
52
as well as gives you time to evaluate the plans. This is also a good point to check in on how well students understand the process of designing an experiment.
Conducting the Experiment11. You have three options. One is to do the experiment and collect the data near your school. You
can take two days to have the students walk to a nearby park with a stream or pond, place their leaf packs (set up the experiment) and return to school. They must return in 2-4 weeks to retrieve their leaf packs.. The second option is to take the leaf packs to a stream or pond yourself after school and leave them according to the sampling plan and then pick them up in 2-4 weeks. In general, the longer the leaf packs sit in the stream or pond, the more invertebrates they will col-lect. Try to select a site where the leaf packs are less likely to be disturbed. Consider laminating tags that read: PLEASE DO NOT DISTURB. SCIENCE EXPERIMENT IN PROGRESS.
2-4 Weeks Later12. To transport the wet leaf packs back to school, place each pack in a small, double garbage bag
and secure it so that none of the invertebrates will sneak out. Try to leave a little water and as much air as possible in the bag. Once you have collected the leaf packs from the field site, stu-dents can begin sorting and identifying the invertebrates. Plan to investigate the leaf packs in a well-ventilated room or you may choose to work outside. Have the students place one of the white garbage bags with a leaf pack on the table or in a shallow pan, tub or tray with a lip. Show them how to open the garbage bag and roll down the sides so the bag acts like a flexible, shal-low bucket. Carefully cut the ties on the leaf pack and dump the leaves and invertebrates into the bag. Use the plastic spoons and tweezers to remove the invertebrates from the cluster of leaves in the bag. Place the invertebrates in the petri dishes with some water. If the invertebrates are alive, you will need to cover the petri dishes to discourage escapees. After demonstrating the proce-dures to the students, let them get started.
13. Hand a laminated, invertebrate key to each team of students and a hand lens. As the students sort and identify the invertebrates they have found. They can begin recording their results in a data table. A model table has been provided. Have the students design their own data table if you feel they are ready and that this is a good use of time.
Data Analysis14. Have the students complete the experiment by finishing the worksheet. After identifying the in-
vertebrates, they will assign them to functional groups. A functional group classifies organisms by what they eat and how they feed. The students have already learned about herbivores (plant eat-ers) and carnivores (animal eaters). The aquatic invertebrate functional groups include shredders, collectors, scrapers and predators. Shredders chew and tear both living and dead plant tissue, part of the leaf decomposition process. Collectors feed by filtering very small particles of living algae and decomposing organic matter out of the water. Collectors are also part of the decompo-sition process. Scrapers scrape algae and periphyton off of rocks, wood and other surfaces. They primarily consume living plant material. Predators are drawn to leaf packs to eat other insects either by consuming all or part of an animal or by piercing the exoskeleton and sucking out tissue fluids. Students are most likely to find shredders and predators in their leaf packs.
15. Once students have assigned animals to functional groups, you may want to look at class data. This is particularly important if the class designed one experiment and each group’s leaf pack counts as a replicate. Create a data table on the board or overhead that lists the functional groups

L6
53A Leaf Lunch
(e.g., shredders, scrapers, unknowns) as rows and the different replicates as columns. The class will need the data to write a conclusion to the experiment. You can discuss sources of variability with the class and how they might improve their procedures to reduce the amount of variability.
16. Have the students continue the worksheet and put together a small food web. In this food web, students see that certain types of organisms break down dead material. They are called decom-posers. Many shredders and collectors are decomposers. They consume and digest dead plant material (the dead leaves) and recycle the nutrients, energy and matter into the food web. Have the students share their food webs with the class. Point out that each step, beginning with the producers (plants) is called a trophic level. Trophic comes from the Greek root meaning nourish or food. Producers (plants) are in the first trophic level. The primary consumers (herbivores) are the second trophic level, and so on. Counting the trophic levels is a way to quantify the information in a food web. This discussion will help students answer the last questions on the worksheet.
17. The final discussion should focus on whether or not students think their data supports the hy-pothesis or not. What evidence do they have (data from their results) to help them answer the research question. Ask students to justify their answers and remind them to examine the variabil-ity in the data.
Discussion Questions1. Describe what happens to the bodies of plants and animals after they die.
2. Do you think you would get the same species of invertebrates in a different stream or pond? What about in a different part of the country? Why or why not?
3. Why types of questions might an ecologist using leaf packs in streams be trying to answer?
4. Name some decomposers found in other types of environments, such as forests, meadows, oceans. Are all decomposers invertebrates?
5. When someone says he is trying to eat more foods from lower trophic levels, what types of foods is he referring to?
6. What additional questions do you have about decomposers in streams? Suggest additional ex-periments to help find answers to these experiments.
References:nhttp://www.stroudcenter.org/lpn/more/trees2streams.htm, visited 12-18-06;nhttp://www.stroudcenter.org/lpn/video/index.htm, visited 12-18-06;nhttp://www.seanet.com/~leska/Online/Guide.html, visited 12-21-06, excellent guide to freshwater
stream invertebrates commonly found in Pacific Northwest streams;nhttp://ww.epa.gov/bioindicators/html/benthosclean.html, visited 12-21-06, excellent pictures and
information on freshwater stream invertebrates.

Ecology by Inquiry: The Truth about Science
L6
54
A Leaf LunchExperiment Planning
Our Research Question:
The Manipulated/Independent Variable we want to change:
The Responding/Dependent Variable we will measure:
The number of Repeated Trials we will do:
The step-by-step Procedures we will follow:
The Controlled Variables we will keep the same:
Our Hypothesis/Prediction and Reasoning:
What our experiment will look like:

L6
55A Leaf Lunch
A Leaf Lunch Food Web
1. Use the identification guide at www.seanet.com/~leska/Online/Guide.html to identify the spe-cies of invertebrates in your leaf packs. Record the number of each type of aquatic invertebrate you found in the data table, functional groups of stream invertebrates. Use a new table for each location.
2. Using the information about the freshwater invertebrates you found, create an aquatic food web and include leaves that fall into the stream. Don’t forget to include arrows to show the direction energy flows through the web. Hint: most of the freshwater invertebrates are eaten by fish and invertebrate predators.
3. Which species of aquatic invertebrates help decompose dead leaves?
These are called “Decomposers.” Make sure you have included them in your food web.
4. In your food web, circle each of the following organisms with the color listed: nproducers - - - - green nherbivores/primary consumers - - - - yellow ncarnivores/secondary consumers or greater - - - - red ndecomposers - - - - black Note: you may need to circle an organism in more than one color.

Ecology by Inquiry: The Truth about Science
L6
56
5. Each of the colors you used in question 4 may be referred to as a trophic level. Trophic comes from a Greek root meaning nourishment or food. Producers make up the first trophic level. Herbi-vores make up the second trophic level. Carnivores make up the higher trophic levels. For exam-ple, carnivores that eat herbivores are in the third trophic level. Carnivores that eat carnivores are in the fourth trophic level. Matter and energy are transferred from one trophic level to another as an animal eats. How many trophic levels are in your food web? _______ Are there any animals you think are in more than 1 trophic level? ________ How could this be possible?
6. What is the primary source of energy for this food web?
7. How might understanding a food web for an ecosystem be useful for a scientist?
8. What additional questions do you have about the aquatic invertebrates, leaf packs, or food webs? Please list 3 questions.
9. Look back at your research question and hypothesis. Write a conclusion to your leaf pack experi-ment. In the conclusion, be sure to:
n Answer the research question n Support your answer with data from the data tables n Explain how the data support your answer n Describe any part of your procedures that may have influenced or biased your results n Suggest a new research question that could help you understand the role of invertebrates
in freshwater ponds or streams.
A Leaf Lunch Food Web

L6
57A Leaf Lunch
Functional Groups of Stream Invertebrates (grouped by what and how they eat)
SHREDDERS(chew and tear both living and dead plant tissue)
Isopods _______
Cranefly larvae _______
Midgefly larvae _______
Stonefly nymphs _______
TOTAL NUMBER FOUND: __________
COLLECTORS(filter small particles of living algae and decom-posing organic matter out of the water)
Mayfly nymphs _______
Riffle beetles and larvae _______
Mussels _______
Clams _______
Amphipods (scuds) _______
Blackfly larvae _______
Midgefly larvae _______
Worms _______
Caddisfly larvae
(with case or net-spinning) _______
TOTAL NUMBER FOUND: __________
SCRAPERS(scrape plants off of rocks, wood and other sur-faces)
Caddisfly larvae _______
Snails _______
Limpits _______
Mayfly nymphs _______
TOTAL NUMBER FOUND: __________
PREDATORS(eat all or part of other insects or pierce the exo-skeleton and suck out fluids)
Stonefly nymphs _______
Caddisfly larvae (no case) _______
Damselfly nymph _______
Dragonfly nymph _______
TOTAL NUMBER FOUND: __________
UNKNOWN INDIVIDUALS FOUND: _______________
LOCATION: _________________________________________________________________
DATE LEAF PACK WAS PLACED IN WATER: ________________________________________
DATE LEAF PACK WAS COLLECTED: _____________________________________________
SORTED AND COUNTED BY: ___________________________________________________

Ecology by Inquiry: The Truth about Science
L7
58
(Two 50-minute classes)
OverviewStudents explore water quality concepts and inference in this lesson. They discuss common ways to describe, measure, or estimate water quality and the importance of water quality to the organisms that live in lakes or streams. First, students play a game using aquatic invertebrate cards. The game describes a method for using aquatic insects to infer the water quality of a stream or lake. The types of aquatic invertebrates living in a particular habitat can tell a scientist a lot about that habitat, for example: is the water fast or slow? Clean or polluted? Next, students use a standard chemical water quality test for nitro-gen and measure turbidity of a water sample. The closing discussion brings together the ecological ideas in previous lessons by considering classification of invertebrates, food webs, decomposition, and habitat quality in aquatic ecosystems. This lesson is modified from BIO-ASSESS (1996), Alabama Water Watch.
Focus Question1. What is water quality and how is it assessed?2. How does water quality influence the distribution of aquatic invertebrates?
Science SkillsnStudents will be able to describe how adaptations of aquatic invertebrates are clues to the condi-
tion of the habitat in which they are found.nStudents will be able to describe methods for measuring turbidity and nitrogen. They will be able
to explain how human activities affect water quality and aquatic organisms.
National Science Standards
Materialsn Slippery Sleuth cards (provided, 1 set of each site per group) Sites A, B, and C must be copied onto different colors of card stock so they are easily distinguish-
able, for example, A = pink, B=blue, and C= green. Six copies of each of the 2 sheets should be used to create a set of cards for each site for a total of 12 sheets, 120 cards per site.
n Envelopes to hold each set of cards (3 per group)n Common Suspects cards – the fronts need to be photocopied onto overhead transparencies and
cut into transparent cards; make 1 set of paper cards (printed front and back)n Watershed map (provided; photocopy onto a transparency)n Slippery Sleuths scoring sheet (provided; photocopy onto transparency)n A jug of water from a local streamn Graduated cylinder (1 per group)n Nitrite, nitrate, and/or ammonium testing kit (1 per group)n Plastic cups (2 per group)n A pitcher of tap watern Slippery Sleuths Water Clarity and Nitrogen handouts (provided; 1 per student)

L7
59Slippery Sleuths
Development of LessonDay 1
1. Discuss as a class the number and type of aquatic invertebrates found in the leaf pack experi-ment, Lesson 6: A Leaf Lunch. If your students have not done the lesson, ask if anyone has ever looked for invertebrates or bugs in a pond or stream. You can also refer to aquatic invertebrates from Lesson 2: Organizing Organisms and Lesson 3: Eating for Energy lessons.
2. Explain that today the students will learn more about aquatic invertebrates and what scientists can learn from them regarding the pond, lake, stream and river habitats in which they live. Put the first Common Suspect on the overhead and solicit descriptions. How is this organism best suited or adapted to living in water? In what type of conditions might it be found? Why? For example, do you think it would be found in still or fast-moving water, under rocks, in leaves, in the mud or on the surface? What other adaptations does this aquatic invertebrate have? How might these help it to survive in a particular habitat? Teacher information on each of the Common Suspects is found on the reverse side of the card. This information does not need to be photocopied. Use the infor-mation to tell the story of how the invertebrate is adapted to survive in a particular habitat.
3. Define habitat and adaptation. An organism’s habitat is the environment where the organism lives, grows and reproduces. An adaptation is a body structure, a behavior, or a physiological process that allows an organism to survive and reproduce in a particular habitat. Organisms must be able to ob-tain oxygen, water, food and nutrients from the environment. They must be able to defend themselves from predators and from diseases. They must be able to respond to changes around them such as tem-perature and light. Adaptations develop over long periods of time through the process of natural selec-tion. Adaptations are traits that are inherited from parents; they are not acquired during an organism’s lifetime.
4. Go through the other Common Suspect overheads and ask students to describe possible adapta-tions (you may have to provide some good hints) and guess from that information what kind of habitat it lives in. Students can take turns reading the information from the back of the cards to the class following the discussion of each organism. Remind the students that there are lots of other species of aquatic invertebrates and other adaptations; these are just samples of common aquatic invertebrates. Remind the students about specialists and generalists from the Organizing Organisms lesson. Specialists tend to live only in areas that are perfectly suited to their needs while generalists can live in a wide range of conditions. More information on aquatic invertebrates can be found in the websites listed as References for Lesson 6: A Leaf Lunch.
5. With aquatic invertebrates, scientists often use the words tolerant and intolerant. Tolerant means that they can live in areas that have low amounts of oxygen in the water due to pollution, high water temperatures, or stagnant water. They are tolerant of low oxygen levels. Intolerant means that they cannot tolerate low oxygen levels. How might a scientist use information about toler-ance or intolerance to learn from aquatic invertebrates? If only intolerant organisms are found in an area, it suggests that there is good water quality and little pollution. What would a sample that was composed of nothing but tolerant organisms suggest about the habitat? Poor or damaged habitat.
6. Explain to the students that they are going to learn more about stream water quality by “sam-pling” aquatic invertebrates. Water quality describes the physical, chemical and biological char-acteristics of a body of water. Put up the Watershed map. Trace the river’s path from the forested mountains through agricultural land and urban areas and finally into the lake. Ask the students

Ecology by Inquiry: The Truth about Science
L7
60
where they would expect to find the most polluted water. Why? Point out the three sampling locations, Sites A, B, and C, on the map. Aquatic insects were sampled at all three locations and the results of the research have been put into a deck of cards that contains one card for each invertebrate found. There is one deck of cards for each site. The cards for each site are a different color so the cards don’t get mixed up. The invertebrates on the cards are based on the results of aquatic invertebrate surveys in urban areas. These surveys were done by Sarah Morley who was a graduate student at the University of Washington in Seattle. Ask students what they might expect to learn by studying aquatic invertebrates at three different places in a watershed?
7. Hand out one deck of cards for each site to each group of students. Don’t tell the students what color card indicates what site. You may need to rotate the decks between samplings if you have a large number of student groups. Explain to the students that they are going to “sample” the three sites. They have to take just a sample because, like real scientists, they don’t have time to count and identify every single invertebrate at any one particular site.
8. To sample a site, students will select 40 cards from the deck for one site. Before the students do anything, ask how they plan to take the sample of 40 cards. How could they take a random sam-ple? Random sampling means that each card has the same chance of being selected. To randomly select 40 cards, students need to shuffle the cards and draw 40 without looking at the pictures.
9. Once students have selected their random sample of 40 invertebrate cards, they can sort the invertebrates into piles by family. They should have one pile for each family but the piles can then be clustered by order and the orders arranged in groups by phylum. Ask the students to count how many different types of invertebrates are in their sample and also to identify the most com-mon type of invertebrate in their sample.
10. Discuss richness. Richness is simply the number of types of invertebrates found in a particular place. Ask the students whether they think that a clean, site or a poor site with low oxygen would have more different types of invertebrates. Usually, a clean, undisturbed site has lots of different types and no one type is present in vastly greater numbers than the others. In a more polluted or disturbed site, there tend to be fewer types and often one type is present in much larger numbers than any of the other types.
11. As a group, fill out the scoring matrix for the samples. It works best if all the groups report data for one site first. Repeat steps 8 and 9 for the remaining 2 sites and record the data in the scoring matrix.
12. Discuss the results as a class. Each group can be considered a replicate because the sampling was done in exactly the same way. Which site seems to have the best water quality? What evidence did the samples provide? How different were samples from the same site? Would this happen in real life? How many samples would one need to take to be confident in the results? Is there any conflicting evidence?
13. Discuss the idea of inference, drawing conclusions about one thing from observations made on another. In this lesson, students are making inference about water quality from observations of aquatic insects. They are also making inference about all aquatic insects from the sample, or set of samples.

L7
61Slippery Sleuths
14. Now put up the map of the three sites again. Which site do they think was which? A = pink, B=blue, and C= green. Which site was the easiest to predict? Based on the aquatic insect samples, which areas of the watershed are likely to have water quality problems? Where else would you want to sample to find out more? How could you design a study to test for impacts of the factory?
Day 2 Note: If the stream sample is very clear, you may want to add some very fine silt or a bit of clay
to it to make the water clarity test more interesting. Do this before the class begins. If collecting stream water is impossible, a sample could be created by mixing tap water with a bit of dirt/silt and a small amount of plant fertilizer. Test this in advance.
15. Review the information from yesterday. How did sampling aquatic invertebrates at different sites give us information on stream water quality? Tell the students that today they will examine two other methods for assessing water quality. They will try measuring properties of the water directly rather than inferring the condition of the water by sampling invertebrates. Solicit examples of things students might measure.
16. Describe water clarity. How might human activities affect water clarity? How does water clarity af-fect aquatic organisms? You can ask students to read the Slippery Sleuths – Water Quality hand-out before or after the discussion. Put the Watershed map back up and ask students where they might expect problems with water clarity. Demonstrate how water clarity can be tested by follow-ing the instructions on the student handout. Select which dot the class will use.
17. Describe nitrogen. How might human activities affect levels of nitrogen? How does nitrogen af-fect aquatic organisms? Again, you can ask students to read the Slippery Sleuths - Nitrogen hand-out before or after the discussion. Refer to the watershed map and ask students where they might expect more problems with nitrogen. Show the students the nitrogen testing kit.
18. Break the students into groups of 4. Give each group a graduated cylinder, a nitrogen testing kit, a cup of the sample stream water and a cup of tap water. Tell them that are going to try the two wa-ter quality testing methods on their two water samples. Make sure that each group understands how to conduct the two tests. Instructions for water clarity are in the handout. Instructions for nitrogen will come with the testing kit. A place for recording their results is also provided on the handout.
19. Share the results as a class. You can make a quick data table and record each group’s results for the two samples. Did both tests detect a difference between the stream and tap water? What might this mean for aquatic organisms living in the stream?
20. If available, show students a map of where the samples were collected. Tell them where you col-lected the water or how you mixed it. Are there other locations students are interested in testing? Students can bring in water samples to test from ponds or streams near their homes.
21. Save a good amount of time for a wrap up discussion of the series of ecology lessons. Ask the students how classification of the aquatic invertebrates helped us understand water quality. Ask about how decomposer aquatic invertebrates might be affected by water quality. Would you expect more decomposers in a healthy or polluted stream? Why or why not? Ask how water quality might affect stream food webs. What changes might you expect if a site is disturbed and

Ecology by Inquiry: The Truth about Science
L7
62
the water gets warm or silty? Would you expect the stream food web to become simpler (fewer organisms) or more complex? Would you be able to use map layers to identify areas with expect-ed water quality problems? If you had a map of water quality, would it help you to identify good habitats for particular species? How? Would it help you to identify management actions? How? How might submerged plants impact aquatic invertebrate communities through photosynthesis?
Discussion Questions1. Compare and contrast biological and chemical water quality tests.
2. Why would it ever be better to use aquatic invertebrates instead of chemical water quality tests? If there were big spill of a toxic chemical or if the water were heating up in the middle of the day, your water samples might not detect it (the toxic chemical would be washed away quickly and the water might be quite cool in the morning when samples are taken). Aquatic invertebrates describe the aver-age conditions at that site over a long time period (at least over the life-cycle of the invertebrates).
3. Why would it be important to get a random sample of aquatic invertebrates? What are some ways that you could ensure a random sample?
4. What actions can you take to protect water quality? What actions could land managers or com-munities take to protect water quality?
ReferencesnMorley, Sarah. 2000. Effects of urbanization on the biological integrity of Puget Sound lowland
streams: restoration with a biological focus. M.S. thesis. University of Washington, Seattle. Also available from http://depts.washington.edu/cuwrm/
nMorley, S.A. and J.R. Karr. 2002. Assessing and restoring the health of urban streams in the Puget Sound Basin. Conservation Biology. 16:1498-1509.
AcknowledgementsnWe thank Alabama Water Watch for allowing us to reproduce aquatic insect images from
BIO-ASSESS: An environmental game that simulates stream biological assessment and watershed evaluation in the classroom. Copyright 1996. William Deutsch and Auburn University.

L7
63Slippery Sleuths
Slip
per S
leut
hs –
Aqua
tic In
vert
ebra
te S
cori
ng S
heet
Site
Fam
ily R
ichn
ess
(Num
ber o
f fam
ilies
)Do
min
ant F
amily
Tole
ranc
e of
do
min
ant f
amily
Pink
card
s__
___
Blue
card
s__
___
Gree
n ca
rds
____
_

Ecology by Inquiry: The Truth about Science
L7
64
Slippery SleuthsWater Quality
Water Clarity:Water clarity describes how clear the water is. Water that is turbid or murky is said to have low water clar-ity. In some streams, low water clarity is normal. Often, however, low water clarity (murky water) is a sign that too much sediment is coming into the stream or river. Sediment can enter the river from landslides, from glaciers as they melt, from roads, from river banks that don’t have many plants, and from other hu-man activities such as construction.
Sediment causes problems for aquatic animals. It can coat the bottom of streams and make it difficult for bottom-dwelling invertebrates and fish eggs to get enough oxygen. When sediment collects on the bottom, it can fill spaces between rocks making it hard for aquatic organisms to hide. It can also clog the gills of fish and aquatic invertebrates. Sediment also collects energy from the sun as it shines on the wa-ter and can lead to increased water temperatures. Increased water temperatures can also have negative impacts on aquatic organisms.
We can measure water clarity by placing a dot underneath of a graduated cylinder and then slowly pour-ing in water until the dot is no longer visible. The steps are described below:
1) As a class, choose the dot below that you will use. You should use the same dot for both water samples. It will help to try the dots under the graduated cylinder to find one that is visible but not too big. If your water sample appears quite clear, you may want to choose from the lighter gray dots.
2) Cut out around the dot and place under the cylinder.3) Pour in 1 cm of water. Look straight down through the water at the dot and see if it is still visible.4) Add more water, 1 cm at a time, until the dot is no longer visible. Record the water depth the first
time it is no longer visible. If it is visible all the way to the top of the cylinder then report that the water clarity is greater than the maximum amount of water.
Water Clarity = _________________________

L7
65Slippery Sleuths
Slippery SleuthsWater Quality
NitrogenNitrogen, in the forms of nitrate, nitrite, or ammonium, is a nutrient needed for plant growth. About 78% of the air that we breathe is composed of nitrogen gas, and in some areas of the United States, particu-larly the northeast, certain forms of nitrogen are commonly deposited in rainwater (acid rain).
Although nitrogen is naturally abundant in the environment, it is also introduced through sewage and fertilizers. Chemical fertilizers or animal manure are commonly applied to crops and lawns to add nutri-ents. It may be difficult or expensive to retain on site all nitrogen brought on to farms for feed or fertilizer and generated by animal manure. Unless specialized structures have been built on the farms, heavy rains can generate runoff containing nitrogen into nearby streams and lakes. Wastewater-treatment facilities that do not specifically remove nitrogen can also increase levels of nitrogen in surface or ground water. Two of the major problems with excess nitrogen in the environment are:
• Excessnitrogencancausetoomuchgrowthofaquaticplantsandalgae.Excessivegrowthofthese organisms, in turn, can clog water intakes, use up dissolved oxygen as they decompose, and block light to deeper waters. This seriously reduces the ability of fish and aquatic inverte-brates to breathe, leads to a decrease in animal and plant diversity, and affects our use of the water for fishing, swimming, and boating.
• Toomuchnitrateindrinkingwatercanbeharmfultoyounginfantsoryounglivestock.
Modified from the US Geological Survey “Water Sciences for Schools” webpage at http://ga.water.usgs.gov/edu/urbannitrogen.html
Water Quality Testing ResultsDraw a data table to record your results for water clarity and nitrogen in the two water samples.

Ecology by Inquiry: The Truth about Science
L7
66
Watershed Map

L7
67Slippery Sleuths
Common Suspects Card
Snail
Phylum: Mollusca Class: Gastropoda
Midge
Phylum: Arthropoda Order: Diptera (flies) Family: Chironomidae
Mayfly larvae
Phylum: Arthropoda Order: Ephemeroptera Family: Baetidae
Caddisfly larvae
Phylum: Arthropoda Order: Trichoptera Family: Hydropsychidae
Stoneflies larvae
Phylum: Arthropoda Order: Plecoptera Family: Gomphidae
Tubificid worm
Phylum: Annelida Order: Clitellata Family: Tubificidae

Ecology by Inquiry: The Truth about Science
L7
68
Common Suspects Card
Snails can live in muck and mud that has very little oxygen. They cannot survive in fast-moving water. They are very tolerant of pollution.
Snail Phylum: Mollusca Class: Gastropoda
Midges are flies. They tend to be very tolerant of low oxygen levels and thrive in still water. Some midges have adaptations for breathing oxygen from the air rather than the water. The rat-tailed maggot, for example, hangs from a breathing tub (like a tail) which has an opening above the water.
Midge Phylum: Arthropoda Order: Diptera (flies) Family: Chironomidae
Mayflies can be both tolerant and intoler-ant of poor water quality. Some have very flat bodies for clinging to rocks in fast-mov-ing water. Some have gills that look like tails which can be waved around in the water to get oxygen. Some mayflies can live in water that is not moving as fast.
Mayfly larvae Phylum: Arthropoda Order: Ephemeroptera Family: Baetidae
Caddisflies tend to be intolerant of poor water quality. They may live in fast moving water. They can build a web and catch insects floating through the current. Most species build cases of material such as twigs or rocks to protect themselves.
Caddisfly larvae Phylum: Arthropoda Order: Trichoptera Family: Hydropsychidae
Stoneflies live in fast-moving water that is cool and clean. The gills on their bodies are difficult to move so they require fast water which flows over their gills to pro-vide oxygen.
Stoneflies larvae Phylum: Arthropoda Order: Plecoptera Family: Gomphidae
Tubificid worms are red because they have hemoglobin to store oxygen. This adapta-tion allows them to live in very polluted waters.
Tubificid worm Phylum: Annelida Order: Clitellata Family: Tubificidae

L7
69Slippery Sleuths
Slippery Sleuth Card - Sheet 1 (Site A - Pink)
MidgePhylum: ArthropodaOrder: Diptera (flies)Family: Chironomidae
Mayfly larvaePhylum: ArthropodaOrder: EphemeropteraFamily: Baetidae
Caddisfly larvaePhylum: ArthropodaOrder: TrichopteraFamily: Glossosomatidae
Tolerant
Intolerant
Caddisfly larvaePhylum: ArthropodaOrder: TrichopteraFamily: Glossosomatidae
Intolerant
Caddisfly larvaePhylum: ArthropodaOrder: TrichopteraFamily: Limnephilidae
Intolerant
Caddisfly larvaePhylum: ArthropodaOrder: TrichopteraFamily: Limnephilidae
Intolerant
Partially Tolerant
Mayfly larvaePhylum: ArthropodaOrder: EphemeropteraFamily: Ephemerellidae
Intolerant
Mayfly larvaePhylum: ArthropodaOrder: EphemeropteraFamily: Ephemerellidae
Intolerant
Mayfly larvaePhylum: ArthropodaOrder: EphemeropteraFamily: Ephemerellidae
Intolerant
Mayfly larvaePhylum: ArthropodaOrder: EphemeropteraFamily: Ephemerellidae
Intolerant

Ecology by Inquiry: The Truth about Science
L7
70
Slippery Sleuth Card - Sheet 2(Site A - Pink)
MidgePhylum: ArthropodaOrder: Diptera (flies)Family: Chironomidae
Mayfly larvaePhylum: ArthropodaOrder: EphemeropteraFamily: Baetidae
Caddisfly larvaePhylum: ArthropodaOrder: TrichopteraFamily: Hydropsychidae
Tolerant
Partially Tolerant
Beetle larvaePhylum: ArthropodaOrder: ColeopteraFamily: Dystidiae
Partially Tolerant
Beetle larvaePhylum: ArthropodaOrder: ColeopteraFamily: Dystidiae
Partially Tolerant
Stonefly larvaePhylum: ArthropodaOrder: PlecopteraFamily: Nemouridae
Intolerant
Partially Tolerant
Stonefly larvaePhylum: ArthropodaOrder: PlecopteraFamily: Gomphidae
Intolerant
Stonefly larvaePhylum: ArthropodaOrder: PlecopteraFamily: Nemouridae
Intolerant
Stonefly larvaePhylum: ArthropodaOrder: PlecopteraFamily: Chloroperlidae
Intolerant
Stonefly larvaePhylum: ArthropodaOrder: PlecopteraFamily: Chloroperlidae
Intolerant

L7
71Slippery Sleuths
Slippery Sleuth Card - Sheet 3(Site B - Blue)
MidgePhylum: ArthropodaOrder: Diptera (flies)Family: Chironomidae
Mayfly larvaePhylum: ArthropodaOrder: EphemeropteraFamily: Baetidae
Caddisfly larvaePhylum: ArthropodaOrder: TrichopteraFamily: Hydropsychidae
Tolerant
Partially Tolerant
Tubificid wormPhylum: AnnelidaOrder: Clitellata Family: Tubificidae
Tolerant
SnailPhylum: MolluscaClass: Gastropoda Tolerant
Stonefly larvaePhylum: ArthropodaOrder: PlecopteraFamily: Gomphidae
Intolerant
Partially Tolerant
MidgePhylum: ArthropodaOrder: Diptera (flies)Family: Chironomidae
Tolerant
MidgePhylum: ArthropodaOrder: Diptera (flies)Family: Chironomidae
Tolerant
MidgePhylum: ArthropodaOrder: Diptera (flies)Family: Chironomidae
Tolerant
SnailPhylum: MolluscaClass: Gastropoda Tolerant

Ecology by Inquiry: The Truth about Science
L7
72
Slippery Sleuth Card - Sheet 4(Site B - Blue)
MidgePhylum: ArthropodaOrder: Diptera (flies)Family: Chironomidae
Mayfly larvaePhylum: ArthropodaOrder: EphemeropteraFamily: Baetidae
Caddisfly larvaePhylum: ArthropodaOrder: TrichopteraFamily: Hydropsychidae
Tolerant
Partially Tolerant
Caddisfly larvaePhylum: ArthropodaOrder: TrichopteraFamily: Glossosomatidae
Intolerant
Caddisfly larvaePhylum: ArthropodaOrder: TrichopteraFamily: Limnephilidae
Intolerant
Mayfly larvaePhylum: ArthropodaOrder: EphemeropteraFamily: Baetidae
Partially Tolerant
Partially Tolerant
Mayfly larvaePhylum: ArthropodaOrder: EphemeropteraFamily: Ephemerellidae
Intolerant
SnailPhylum: MolluscaClass: Gastropoda Intolerant
Tubificid wormPhylum: AnnelidaOrder: Clitellata Family: Tubificidae
Tolerant
Mayfly larvaePhylum: ArthropodaOrder: EphemeropteraFamily: Baetidae
Partially Tolerant

L7
73Slippery Sleuths
Slippery Sleuth Card - Sheet 5(Site C - Green)
MidgePhylum: ArthropodaOrder: Diptera (flies)Family: Chironomidae
Mayfly larvaePhylum: ArthropodaOrder: EphemeropteraFamily: Baetidae
Tolerant
Tubificid wormPhylum: AnnelidaOrder: Clitellata Family: Tubificidae
Tolerant
SnailPhylum: MolluscaClass: Gastropoda Tolerant
Mayfly larvaePhylum: ArthropodaOrder: EphemeropteraFamily: Baetidae
Partially Tolerant
Partially Tolerant
Mayfly larvaePhylum: ArthropodaOrder: EphemeropteraFamily: Baetidae
Partially Tolerant
SnailPhylum: MolluscaClass: Gastropoda Tolerant
SnailPhylum: MolluscaClass: Gastropoda Tolerant
SnailPhylum: MolluscaClass: Gastropoda Tolerant
SnailPhylum: MolluscaClass: Gastropoda Tolerant

Ecology by Inquiry: The Truth about Science
L7
74
MidgePhylum: ArthropodaOrder: Diptera (flies)Family: Chironomidae
Mayfly larvaePhylum: ArthropodaOrder: EphemeropteraFamily: Baetidae
Caddisfly larvaePhylum: ArthropodaOrder: TrichopteraFamily: Hydropsychidae
Tolerant
Partially Tolerant
Partially Tolerant
Slippery Sleuth Card - Sheet 6(Site C - Green)
Mayfly larvaePhylum: ArthropodaOrder: EphemeropteraFamily: Baetidae
Partially Tolerant
Tubificid wormPhylum: AnnelidaOrder: Clitellata Family: Tubificidae
Tolerant
SnailPhylum: MolluscaClass: Gastropoda Tolerant
Tubificid wormPhylum: AnnelidaOrder: Clitellata Family: Tubificidae
Tolerant
Tubificid wormPhylum: AnnelidaOrder: Clitellata Family: Tubificidae
Tolerant
Tubificid wormPhylum: AnnelidaOrder: Clitellata Family: Tubificidae
Tolerant
Tubificid wormPhylum: AnnelidaOrder: Clitellata Family: Tubificidae
Tolerant


NOAA Fisheries Service