Embed Size (px)
Citation preview

Ecology 3 Star
Name: Date:
1. The greatest number of relationships between theorganisms in an ecosystem is best shown in
A. a food chain
B. an energy pyramid
C. a food web
D. an ecological succession diagram
2. Base your answer(s) to following question(s) onthe diagram below, which represents a pond foodweb, and on your knowledge of biology.
Which statement best describes what will mostlikely happen if the amphipod population isremoved from this food web?
A. Population sizes of species at feeding levelsboth before and after amphipods will decrease.
B. Population sizes of species at feeding levelsboth before and after amphipods will increase.
C. Population sizes of species at feeding levelsafter amphipods will increase and beforeamphipods will decrease.
D. Population sizes of species at feeding levelsafter amphipods will decrease and beforeamphipods will increase.
3. Base your answer(s) to the following question(s)on the information below and on your knowledgeof biology.
An ecologist made some observationsin a forest ecosystem over a period of severaldays. Some of the data collected are shownin the table below.
On the diagram below, complete the food webby placing the names of all the organisms in thecorrect locations.
4. The process illustrated in the sequence belowoccurs constantly in the biosphere.
Which type of organism is most likely representedby X?
A. decomposer B. producer
C. herbivore D. carnivore
page 1

5. Base your answer(s) to the following question(s)on the information and food web below and onyour knowledge of biology.
The organisms in the food web belowlive near large cattle ranches. Over manyyears, mountain lions occasionally killed afew cattle. One year, a few ranchers huntedand killed many mountain lions to preventfuture loss of their cattle. Later, ranchersnoticed that animals from this food web wereeating large amounts of grain from theirfields.
Identify two specific populations that most likelyincreased in number after the mountain lionpopulation decreased. Support your answer.
6. Base your answer(s) to the following question(s)on the data table below and on your knowledgeof biology. The data table shows the number ofbreeding pairs of bald eagles in New York Statefrom 1991 to 2003.
Number of Breeding Pairs ofBald Eagles in New YorkState from 1991 to 2003
Year Number of Breeding pairs
1991 15
1993 20
1995 25
1997 35
1999 45
2001 65
2003 75
State one possible reason for the increase in thenumber of breeding pairs of bald eagles in NewYork State.
7. Base your answer(s) to the following question(s)on the information below and on your knowledgeof biology.
The chart describes the beaks ofvarious types of birds that live in a smallisland ecosystem containing flowering landplants, aquatic plants, many small mammals,amphibians, and several species of trees.
Beak Shape Beak Type Adaptation and Use
Cracker Seed eaters like sparrows andcardinals have short, thick beaks forcracking seeds.
Shredder Birds of prey like hawks and owlshave sharp, curved beaks for tearingmeat.
Chisel Woodpeckers have beaks that arelong and chisel-like for boring intowood to eat insects.
Probe Hummingbirds have beaks that arelong and thin for probing flowersfor nectar.
Strainer Some ducks have long, flat beaksthat strain small plants and animalsfrom the water.
Identify one kind of bird that would show animmediate decrease in number if the floweringland plants were destroyed by an environmentalchange. Support your answer.
8. Due to overfishing, the number of fish in theocean could drastically decrease. This will cause
A. an increase in the stability of the oceans
B. an increase in the salt content of the oceans
C. a decrease in the stability of the oceans
D. a decrease in the oxygen available in theoceans
page 2 Ecology 3 Star
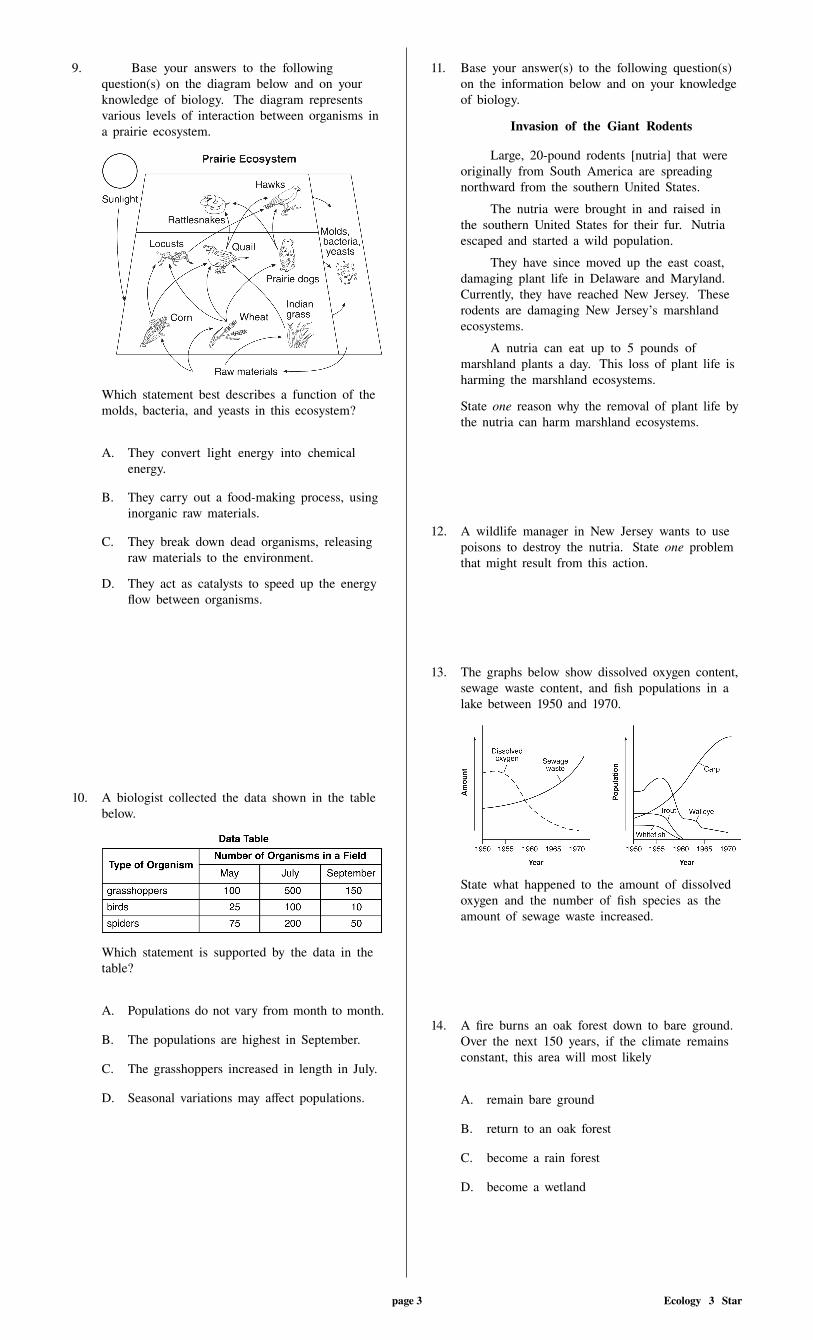
9. Base your answers to the followingquestion(s) on the diagram below and on yourknowledge of biology. The diagram representsvarious levels of interaction between organisms ina prairie ecosystem.
Which statement best describes a function of themolds, bacteria, and yeasts in this ecosystem?
A. They convert light energy into chemicalenergy.
B. They carry out a food-making process, usinginorganic raw materials.
C. They break down dead organisms, releasingraw materials to the environment.
D. They act as catalysts to speed up the energyflow between organisms.
10. A biologist collected the data shown in the tablebelow.
Which statement is supported by the data in thetable?
A. Populations do not vary from month to month.
B. The populations are highest in September.
C. The grasshoppers increased in length in July.
D. Seasonal variations may affect populations.
11. Base your answer(s) to the following question(s)on the information below and on your knowledgeof biology.
Invasion of the Giant Rodents
Large, 20-pound rodents [nutria] that wereoriginally from South America are spreadingnorthward from the southern United States.
The nutria were brought in and raised inthe southern United States for their fur. Nutriaescaped and started a wild population.
They have since moved up the east coast,damaging plant life in Delaware and Maryland.Currently, they have reached New Jersey. Theserodents are damaging New Jersey’s marshlandecosystems.
A nutria can eat up to 5 pounds ofmarshland plants a day. This loss of plant life isharming the marshland ecosystems.
State one reason why the removal of plant life bythe nutria can harm marshland ecosystems.
12. A wildlife manager in New Jersey wants to usepoisons to destroy the nutria. State one problemthat might result from this action.
13. The graphs below show dissolved oxygen content,sewage waste content, and fish populations in alake between 1950 and 1970.
State what happened to the amount of dissolvedoxygen and the number of fish species as theamount of sewage waste increased.
14. A fire burns an oak forest down to bare ground.Over the next 150 years, if the climate remainsconstant, this area will most likely
A. remain bare ground
B. return to an oak forest
C. become a rain forest
D. become a wetland
page 3 Ecology 3 Star

15. Which ecological term includes everythingrepresented in the illustration?
A. ecosystem B. community
C. population D. species
16. Which statement describes the ecosystemrepresented in the diagram below?
A. This ecosystem would be the first stage inecological succession.
B. This ecosystem would most likely lackdecomposers.
C. All of the organisms in this ecosystem areproducers.
D. All of the organisms in this ecosystem dependon the activities of biological catalysts.
17. Base your answers to the following question(s) onthe information below and on your knowledge ofbiology.
Euglena are single-celled organisms thatlive in ponds. All euglena have chloroplastsand can make their own food. They can alsotake in food from the environment. Thediagram below represents a euglena.
An experiment was set up to determinethe effect of nitrates, a pollutant, on thenumber of chloroplasts present in euglena.Five tanks were set up, each with euglenaand a different concentration of nitratesolution: 0%, 5%, 1.0%, 1.5%, and 2.0%.The tanks were placed in a sunny locationwhere each tank received the same amountof light.
Euglena can be classified as both
A. an autotroph and a parasite
B. a decomposer and a heterotroph
C. a producer and a parasite
D. an autotroph and a heterotroph
18. Base your answer(s) to following question(s) onthe information below and on your knowledge ofbiology.
In the abyssal zones (deepest zones)of oceans, organisms live in an ecosystemthat lacks sunlight. Other environmentalconditions include temperatures of 4◦ C andextremely high water pressure. Dead materialfrom upper ocean zones sinks and settles inthe abyssal zone.
State one possible way that some organisms livingpermanently in the abyssal zone could obtainenergy.
page 4 Ecology 3 Star
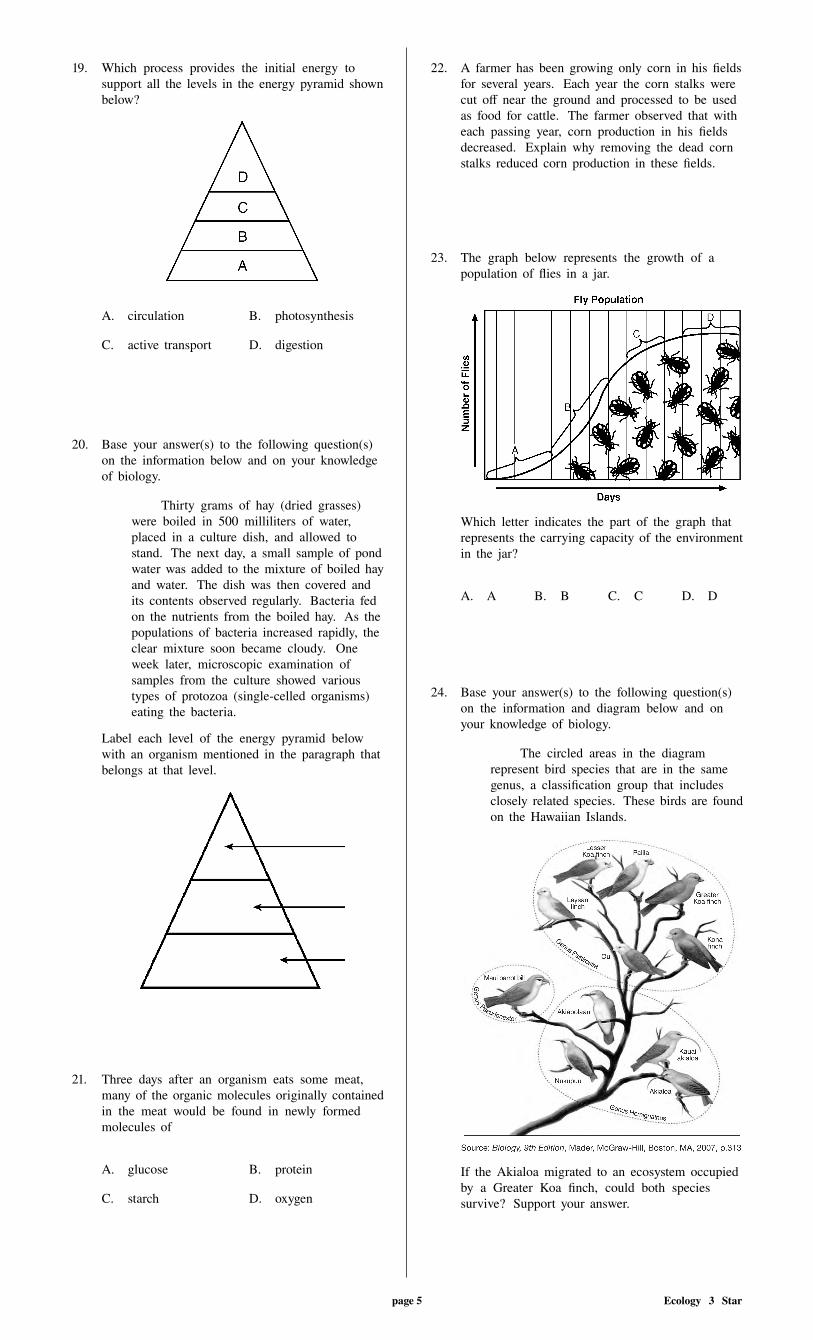
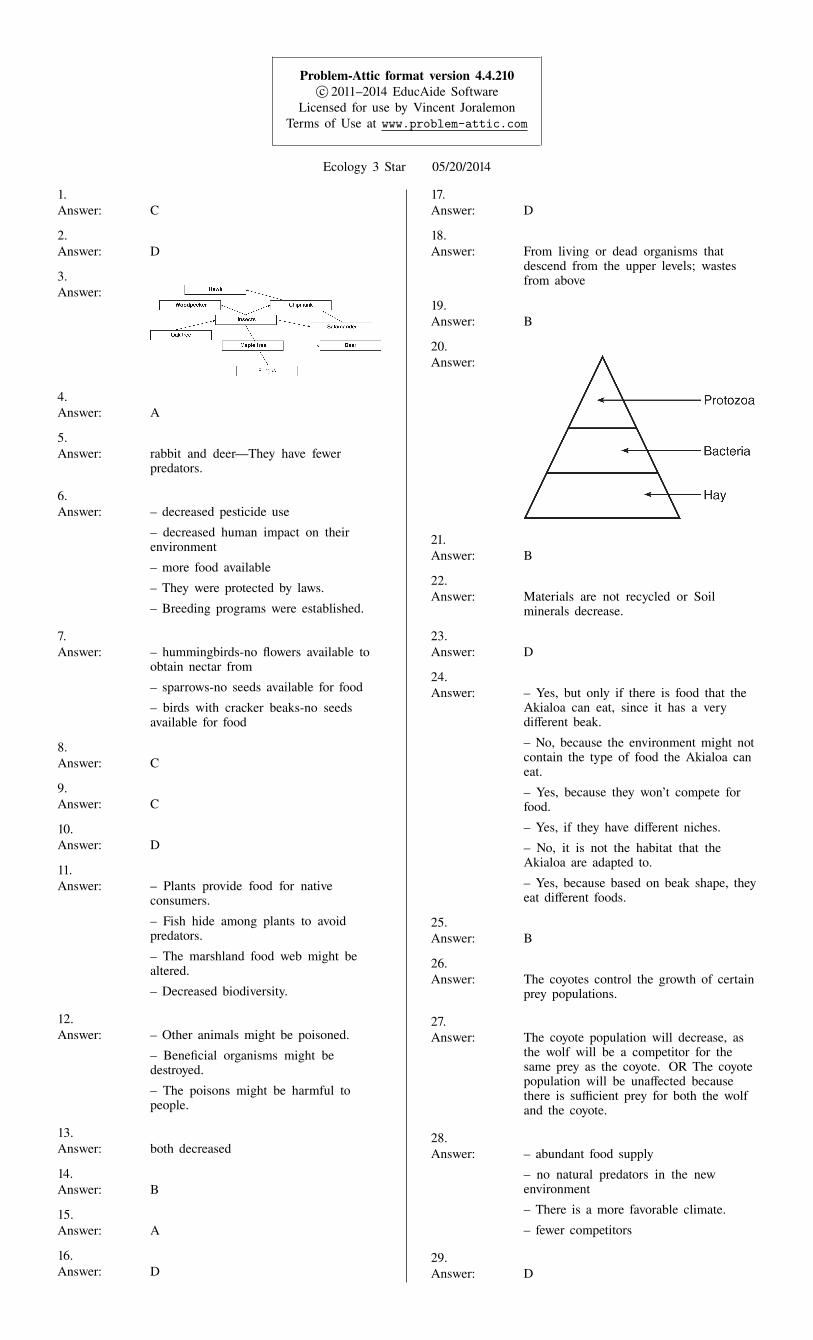
19. Which process provides the initial energy tosupport all the levels in the energy pyramid shownbelow?
A. circulation B. photosynthesis
C. active transport D. digestion
20. Base your answer(s) to the following question(s)on the information below and on your knowledgeof biology.
Thirty grams of hay (dried grasses)were boiled in 500 milliliters of water,placed in a culture dish, and allowed tostand. The next day, a small sample of pondwater was added to the mixture of boiled hayand water. The dish was then covered andits contents observed regularly. Bacteria fedon the nutrients from the boiled hay. As thepopulations of bacteria increased rapidly, theclear mixture soon became cloudy. Oneweek later, microscopic examination ofsamples from the culture showed varioustypes of protozoa (single-celled organisms)eating the bacteria.
Label each level of the energy pyramid belowwith an organism mentioned in the paragraph thatbelongs at that level.
21. Three days after an organism eats some meat,many of the organic molecules originally containedin the meat would be found in newly formedmolecules of
A. glucose B. protein
C. starch D. oxygen
22. A farmer has been growing only corn in his fieldsfor several years. Each year the corn stalks werecut off near the ground and processed to be usedas food for cattle. The farmer observed that witheach passing year, corn production in his fieldsdecreased. Explain why removing the dead cornstalks reduced corn production in these fields.
23. The graph below represents the growth of apopulation of flies in a jar.
Which letter indicates the part of the graph thatrepresents the carrying capacity of the environmentin the jar?
A. A B. B C. C D. D
24. Base your answer(s) to the following question(s)on the information and diagram below and onyour knowledge of biology.
The circled areas in the diagramrepresent bird species that are in the samegenus, a classification group that includesclosely related species. These birds are foundon the Hawaiian Islands.
If the Akialoa migrated to an ecosystem occupiedby a Greater Koa finch, could both speciessurvive? Support your answer.
page 5 Ecology 3 Star
25. Rabbits introduced into Australia over one hundredyears ago have become a serious pest. Rabbitpopulations have increased so much that theyhave displaced many native species of herbivores.Which statement best explains the reason for theirincreased numbers?
A. Rabbits have a high metabolic rate.
B. There are few native predators of rabbits.
C. Additional rabbit species have been introduced.
D. There is an increase in rabbit competitors.
26. Base your answer(s) to the following question(s)on the information below and on your knowledgeof biology.
The last known wolf native to theAdirondack Mountains of New York Statewas killed over a century ago. Severalenvironmental groups have recently proposedreintroducing the wolf to the Adirondacks.These groups claim there is sufficientprey to support a wolf population in thisarea. These prey include beaver, deer, andmoose. Opponents of this proposal state thatthe Adirondacks already have a dominantpredator, the Eastern coyote.
Explain why the coyote is considered a limitingfactor in the Adirondack Mountains.
27. State one effect the reintroduction of the wolfmay have on the coyote population within theAdirondacks. Explain why it would have thiseffect.
28. When insects are accidentally transported fromone country to a new habitat in another country,the population of these insects often increasesrapidly. State one environmental factor in the newhabitat that would account for this increase in thepopulation.
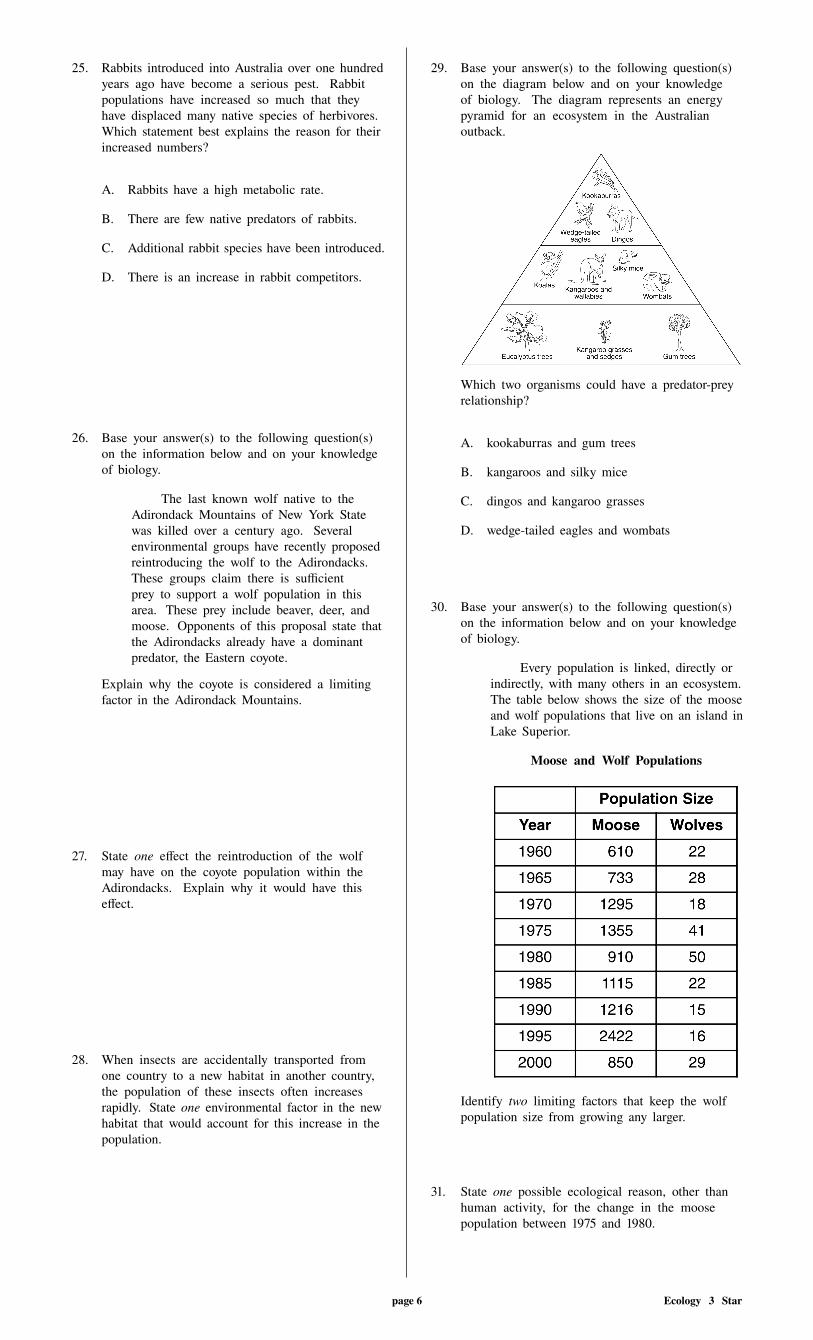
29. Base your answer(s) to the following question(s)on the diagram below and on your knowledgeof biology. The diagram represents an energypyramid for an ecosystem in the Australianoutback.
Which two organisms could have a predator-preyrelationship?
A. kookaburras and gum trees
B. kangaroos and silky mice
C. dingos and kangaroo grasses
D. wedge-tailed eagles and wombats
30. Base your answer(s) to the following question(s)on the information below and on your knowledgeof biology.
Every population is linked, directly orindirectly, with many others in an ecosystem.The table below shows the size of the mooseand wolf populations that live on an island inLake Superior.
Moose and Wolf Populations
Identify two limiting factors that keep the wolfpopulation size from growing any larger.
31. State one possible ecological reason, other thanhuman activity, for the change in the moosepopulation between 1975 and 1980.
page 6 Ecology 3 Star

32. State how the information in the table can be usedto determine that the wolves are the predators.
33. Base your answer(s) to the following question(s)on the diagrams below and on your knowledgeof biology. The diagrams represent how variouspopulations interact in a forest environment.
A B
State what would most likely happen to one otherpopulation in this food web if all the squirrels andrabbits were suddenly killed by a viral disease.Support your answer.
34. Which diagram, A or B, most accurately representsinteractions between biotic and abiotic factors in aforest environment? Support your answer.
35. Years after the lava from an erupting volcanodestroyed an area, grasses started to grow in thatarea. The grasses were gradually replaced byshrubs, evergreen trees, and finally, by a forest thatremained for several hundred years. This entireprocess is an example of
A. feedback
B. ecological succession
C. plant preservation
D. deforestation
36. Base your answer(s) to the following question(s)on the information below and on your knowledgeof biology.
The year 2010 was declared theInternational Year of Biodiversity. However,significant loss of biodiversity is stilloccurring. Researchers around the world areworking on a variety of ways to protectnatural resources. According to an article inScience News, March 13, 2010, “reversing thedownward spiral of biodiversity will takemore than protecting wild places, but that’swhere scientists are starting.”
Explain the importance of biodiversity to anecosystem. In your answer, be sure to:
• state one effect of a loss of biodiversity inan ecosystem
• identify a source of variation within aspecies that leads to biodiversity
• identify one specific ecosystem that hasshown a decrease in biodiversity and stateone cause of the decrease in biodiversityin the ecosystem you identified
• identify one human activity, other thansetting up protected wildlife areas, that hashelped to preserve biodiversity
page 7 Ecology 3 Star
Problem-Attic format version 4.4.210c_ 2011–2014 EducAide Software
Licensed for use by Vincent JoralemonTerms of Use at www.problem-attic.com
Ecology 3 Star 05/20/2014
1.Answer: C
2.Answer: D
3.Answer:
4.Answer: A
5.Answer: rabbit and deer—They have fewer
predators.
6.Answer: – decreased pesticide use
– decreased human impact on theirenvironment
– more food available
– They were protected by laws.
– Breeding programs were established.
7.Answer: – hummingbirds-no flowers available to
obtain nectar from
– sparrows-no seeds available for food
– birds with cracker beaks-no seedsavailable for food
8.Answer: C
9.Answer: C
10.Answer: D
11.Answer: – Plants provide food for native
consumers.
– Fish hide among plants to avoidpredators.
– The marshland food web might bealtered.
– Decreased biodiversity.
12.Answer: – Other animals might be poisoned.
– Beneficial organisms might bedestroyed.
– The poisons might be harmful topeople.
13.Answer: both decreased
14.Answer: B
15.Answer: A
16.Answer: D
17.Answer: D
18.Answer: From living or dead organisms that
descend from the upper levels; wastesfrom above
19.Answer: B
20.Answer:
21.Answer: B
22.Answer: Materials are not recycled or Soil
minerals decrease.
23.Answer: D
24.Answer: – Yes, but only if there is food that the
Akialoa can eat, since it has a verydifferent beak.
– No, because the environment might notcontain the type of food the Akialoa caneat.
– Yes, because they won’t compete forfood.
– Yes, if they have different niches.
– No, it is not the habitat that theAkialoa are adapted to.
– Yes, because based on beak shape, theyeat different foods.
25.Answer: B
26.Answer: The coyotes control the growth of certain
prey populations.
27.Answer: The coyote population will decrease, as
the wolf will be a competitor for thesame prey as the coyote. OR The coyotepopulation will be unaffected becausethere is sufficient prey for both the wolfand the coyote.
28.Answer: – abundant food supply
– no natural predators in the newenvironment
– There is a more favorable climate.
– fewer competitors
29.Answer: D

Teacher’s Key Page 2
30.Answer: – number of moose – living space on the
island – diseases – competition with otherpredators – weather conditions – hunting
31.Answer: – There were more wolves, so the moose
were being killed off. – There may havebeen less food available for the moose,since the moose population had beengrowing for 20 years. – Disease mayhave affected the moose population. –There may have been really bad winters.
32.Answer: – There are fewer predators than there are
prey, so the wolf is the predator. – In afood chain/food pyramid, there are moreprey animals than there are predators.
33.Answer: – The fox/weasel/cougar population would
decrease because of less food.
– The oak trees would increase becausethere would be more acorns.
– The deer population might increase dueto less competition for available food.
– The deer population might decrease dueto greater predation by cougars.
– There would be more competitionamong foxes/weasels/cougars because of adecrease in food.
34.Answer: – The diagram shows the Sun and living
things.
– There are both biotic and abiotic factorsshown in diagram A.
– Diagram A includes the Sun and rawmaterials.
– There are no abiotic factors in foodweb B.
– Diagram B does not show the originalsource of energy.
– Diagram B is missing an energy sourceand raw materials from the soil.
35.Answer: B
36.Answer: – the less biodiversity there is in an
ecosystem, the less stable the ecosystemwill be; a loss of biodiversity wouldmake it harder for the ecosystem tomaintain stability; it would reduceresources/food/shelter that are used by theorganisms in the ecosystem; a speciesmight become extinct
– a tropical rain forest:deforestation; Lake Erie: agriculturalrunoff/overfishing/introduction ofnon-native species; Gulf of Mexico: oilspill; lakes in Adirondack Mountains:acid rain; arctic seas: global warming
– establishing endangered species listsand laws that protect endangered speciesand their habitats; setting up laws thatregulate the release of pollutants; enactinghunting or fishing regulations thatprotect endangered species; recyclingof metals and plastics; replanting trees;stopping/slowing deforestation; breedingprograms; regulating what chemicals canbe used on farms