Embed Size (px)
Citation preview
RESEARCH ARTICLE
Ecological risk assessment of predicted
marine invasions in the Canadian Arctic
Jesica GoldsmitID1,2*, Christopher McKindsey1, Philippe ArchambaultID
2, Kimberly
L. HowlandID3
1 Fisheries and Oceans Canada, Maurice Lamontagne Institute, Mont-Joli, Quebec, Canada, 2 Department
of Biology, Science and Engineering Faculty, Laval University, Quebec City, Quebec, Canada, 3 Fisheries
and Oceans Canada, Arctic Research Division, Freshwater Institute, Winnipeg, Manitoba, Canada
* [email protected], [email protected]
Abstract
Climate change is impacting environmental conditions, especially with respect to tempera-
ture and ice cover in high latitude regions. Predictive models and risk assessment are key
tools for understanding potential changes associated with such impacts on coastal regions.
In this study relative ecological risk assessment was done for future potential introductions
of three species in the Canadian Arctic: periwinkle Littorina littorea, soft shell clam Mya are-
naria and red king crab Paralithodes camtschaticus. These species occur in locations con-
nected to Canadian Arctic ports through shipping and have the potential to be introduced via
ballast water discharge. The methodology proposed in this study is unique in the sense that
it considers not only ballast water origin, but also the distribution of the species being
assessed and the sensitivity of the receiving habitat. It combines detailed information (bal-
last water source of each tank, transit time, time of the year when the water is released, envi-
ronmental suitability of receiving habitat, impact, and habitat sensitivity) in order to assess
ecological risk. Through the use of this approach it is highlighted that domestic discharge
events pose a higher relative overall risk on a vessel-specific and cumulative annual bases
than international discharges. The main ports of Deception Bay and Churchill were classi-
fied as being at moderate to high relative risk for L. littorea and M. arenaria, especially from
domestic vessels, while relative overall risk for P. camtschaticus was low for international
vessels and null for domestic vessels due to few ships transiting from its range of distribution
to Canadian Arctic ports. This work can serve as an approach to help build a list of potential
high risk species–a “grey” watch list–for the Canadian Arctic, and provides useful informa-
tion for consideration in future decision making actions such as the identification of high risk
pathways, species and ports.
Introduction
Invasive species and global warming are among the most serious drivers of global environmen-
tal change and threaten marine biodiversity [1–3]. Successful establishment of an invasive spe-
cies depends upon it completing a series of transitions, each with independent probabilities of
PLOS ONE | https://doi.org/10.1371/journal.pone.0211815 February 7, 2019 1 / 28
a1111111111
a1111111111
a1111111111
a1111111111
a1111111111
OPEN ACCESS
Citation: Goldsmit J, McKindsey C, Archambault P,
Howland KL (2019) Ecological risk assessment of
predicted marine invasions in the Canadian Arctic.
PLoS ONE 14(2): e0211815. https://doi.org/
10.1371/journal.pone.0211815
Editor: Judi Hewitt, University of Waikato, NEW
ZEALAND
Received: September 12, 2018
Accepted: January 20, 2019
Published: February 7, 2019
Copyright: © 2019 Goldsmit et al. This is an open
access article distributed under the terms of the
Creative Commons Attribution License, which
permits unrestricted use, distribution, and
reproduction in any medium, provided the original
author and source are credited.
Data Availability Statement: All relevant data are
within the paper and its Supporting Information
files.
Funding: This study was funded by Natural
Sciences and Engineering Research Council’s
(http://www.nserc-crsng.gc.ca) to KLH, Canadian
Aquatic Invasive Species Network (385408-09) to
PA, Fisheries and Oceans Canada: Aquatic Climate
Change Adaptation Service Program to KLH,
Nunavut Wildlife Management Board (3-14-07;
https://www.nwmb.com) to KLH, and Quebec-
Ocean (2016-RS-!86795; http://www.quebec-
failure [4, 5]. Vectors must uptake, transport, and deliver a sufficient number of viable propa-
gules to an area outside of the species’ historic range. These individuals must be capable of sur-
viving, reproducing, and establishing under ambient physico-chemical and biological-
ecological conditions [6].
The principal global vector for unintentional introductions of aquatic non-indigenous spe-
cies (NIS) is shipping [3, 4, 7]. Species may be transported unintentionally during ballast water
uptake/discharge and through the accumulation and transport of organisms on vessel surfaces
(biofouling), including hulls and protected areas, such as sea chests [8, 9]. The global shipping
network is responsible for approximately 90% of global trade [10, 11], posing a substantial con-
cern as it is the dominant vector of aquatic introductions. The “path length” between any two
ports is the minimum number of connections or steps required to travel between them (based
on recorded voyages in a given year) [10]. Most source-arrival destination pairs are connected
by two or less steps, with a maximum of eight [10]. This global connectivity highlights the
importance of understanding shipping pathways to evaluate risks associated with NIS since,
once established, it is rarely possible to eliminate them [12].
Commercial shipping has thus been estimated to have contributed between 44% to 78% of
primary invasions of all NIS to North America [13]. Mid-ocean ballast water exchange (BWE)
has been the primary means of reducing the risks of introducing NIS by transoceanic vessels
[14]. Water and associated aquatic organisms from coastal ports in ballast tanks of merchant
vessels can be effectively replaced with oceanic water and species through BWE (e.g., 97–99%
efficiency) [15]. This not only removes a great proportion of all organisms taken up with bal-
last in source ports but also helps reduce invasion risk by some organisms due to the salinity
shock encountered by individuals remaining in tanks following BWE. Although this method
has been shown to be very effective for freshwater species [16], its efficacy for coastal marine
species is variable [14] and may even increase invasion risk if novel (to receiving ports) oceanic
species are taken up during BWE [17].
Sea surface temperature in the Arctic is warming faster than in other parts of the globe [18].
It is predicted that by 2070 a complete open water season will last half of the year [19].
Although predicted changes may sound extreme they may in fact be conservative given that
current reductions in sea ice are happening faster than model predictions [20]. Seasonal mini-
mal sea ice extent is estimated to be declining at a rate of 12.4% per decade [21, 22]. Minimum
sea ice extent records are increasingly being broken, consistent with the inclusion of anthropo-
genic forcing in climate modeling [23]. To date, most introductions have occurred in warmer,
temperate regions, where there is greater shipping activity [24]. However, the Arctic is increas-
ingly at risk of introductions due to global warming, resource exploitation, increased project
developments, and the associated increased shipping activity [25–28]. Indeed, Arctic shipping
traffic has increased over the last few years [29] and is expected to raise the risk of NIS intro-
ductions to Arctic waters [30–32]. This trend is expected to continue with new shipping routes
predicted to open across the Arctic (e.g., the Northwest Passage linking the Atlantic and Pacific
oceans through the Canadian Arctic) by mid-century [25, 28].
As most reported marine NIS are benthic [33], it is of particular interest to evaluate the
potential for these organisms to be introduced to the Canadian Arctic. Recent studies have
demonstrated that potentially NIS benthic species are being transported to the region [34, 35].
To date, three potential shipping-mediated NIS have been described–the red alga Dumontiacontorta, the tunicate Polycarpa pomaria, and the tube-dwelling crustacean Monocorophiuminsidosium [36, 37]. In addition, there are species that have recently been identified as crypto-
genic (species that could be either native or non-native) [36–38]. In contrast to the Canadian
Arctic, numerous NIS and novel species have recently been reported from other high-latitude
areas [35, 39–47]. However, the Canadian Arctic benthic community has generally been poorly
Risk of marine invasions in the Arctic
PLOS ONE | https://doi.org/10.1371/journal.pone.0211815 February 7, 2019 2 / 28
ocean.ulaval.ca/) to PA. The funders had no role in
study design, data collection and analysis, decision
to publish, or preparation of the manuscript.
Competing interests: The authors have declared
that no competing interests exist.
sampled because of its size and remoteness, with few systematic surveys having been con-
ducted, making the detection of newly established species difficult [48–50]. Given that high-
latitude regions are predicted to experience a significant number of NIS introductions [31, 32,
44], we can only project how these changes could affect the region.
In cases where information is scarce, risk assessments can serve as an effective tool to esti-
mate risk potential in a systematic way [51]. A risk assessment is the process by which unde-
sired events (e.g., NIS introduction and impact) are identified and their consequences
parameterized, including uncertainties related to the assessment process [52]. These types of
studies can be used to evaluate the invasion potential associated with different shipping path-
ways and management strategies [53]. Species-level risk assessments provide information
about the particular risk of a given species and risk is calculated with direct consideration of
the characteristics of the organism [54]. Performing assessments that predict the risk of poten-
tial invasion and impact of a given species in regions where species have not yet arrived and/or
established can be useful to identify and prevent undesirable future impacts [55, 56]. The
development and use of watch lists, combined with monitoring efforts in regions where these
types of assessments have been done, can lead to the discovery of NIS before they negatively
impact the ecosystem [57, 58].
The aim of the present study is to characterize the relative ecological risk of potential future
NIS introductions in Canadian Arctic ports, with special emphasis on the development of a
species-specific assessment protocol. The proposed methodology is a unique combination of
risk components that allows for comparative analyses between species and shipping pathways
being assessed, and ports that have the potential to receive their propagules through ballast
water discharge. This risk assessment framework provides information to support manage-
ment decisions regarding the development of preventive actions to limit new introductions
and serves as a starting point to build a list of species with potential risk for the Canadian
Arctic.
Materials and methods
Study area
Eight ecoregions of the Canadian Arctic, as delineated by Spalding et al. [59], were considered
in this study (Fig 1). Shipping plays a key role in supporting Arctic communities, for the econ-
omy and transporting resources by domestic and international shipping. A total of 35 ports
are situated in the Canadian Arctic with most in the Hudson Complex (Fig 1). Of these, Chur-
chill, Deception Bay and Iqaluit were most actively used over the period considered in this risk
assessment (2005–2014).
Churchill is located on the southwestern shore of Hudson Bay and, until its recent closure
(2016), was the major seaport in the region, its main activity being the export of grain by inter-
national traffic. Churchill was previously shown to receive the highest number of vessels and
volume of ballast discharge, and to be environmentally similar to a large number of connected
source ports with established high risk NIS (relative to other ports in the Canadian Arctic)
[60]. Shipping activity for the port of Deception Bay is related to two nickel mining sites, one
of which exports concentrate to Quebec, and the other to Europe [27, 61, 62]. It is among the
top 3 ports in the Canadian Arctic with respect to number of arrivals and volume of untreated
ballast water released from international and coastal domestic merchant vessels. This port has
high environmental similarity to a large number of its source ports, thus increasing the survival
probability of NIS from linked ports [60]. Moreover, NIS have recently been found in ballast
water from ships arriving to the port of Deception Bay [63, 64]. Iqaluit’s port is used for vari-
ous activities: dry cargo handling (government, commercial and private use), petroleum,
Risk of marine invasions in the Arctic
PLOS ONE | https://doi.org/10.1371/journal.pone.0211815 February 7, 2019 3 / 28
fisheries, tourist cruise ships, military and research vessels, Canadian Coast Guard, and small
craft operators, including hunters and fishers [65]. The annual volumes of dry goods and
petroleum products shipped to Iqaluit have been increasing dramatically, as have tourism and
other marine activities [65]. The construction of a deep water port is scheduled to begin in
2018. Iqaluit is characterized by receiving a high level of international and coastal domestic
merchant and international non-merchant vessels, and is among the top ports in the Canadian
Arctic for invasion risk via hull fouling [60]. The other ports in the Canadian Arctic (Fig 1) are
less active and receive mostly domestic vessels and a few international vessels with very few
ballast discharge events [60]. Exceptions are ports opening with new developments that are
expected to experience rapid increases in shipping over coming years [27]. Although the ship-
ping activity in some of these ports (e.g., Milne Inlet, Nunavut, Baffinland Inc.) is expected to
exceed that of current top ports in the Canadian Arctic, they are not considered within the
scope of the present assessment, which relies on shipping data from the recent past.
Species characterization
One of the first steps in this study was to identify potential NIS to use as case studies to evaluate
the developed risk assessment protocol. Species were selected based on the following main fac-
tors: capacity for introduction outside of their native range, potential impacts, type and
strength of ecological interactions, current distribution, and relationship with vectors (e.g., bal-
last water) [66]. The species included in this study (common periwinkle Littorina littorea; soft-
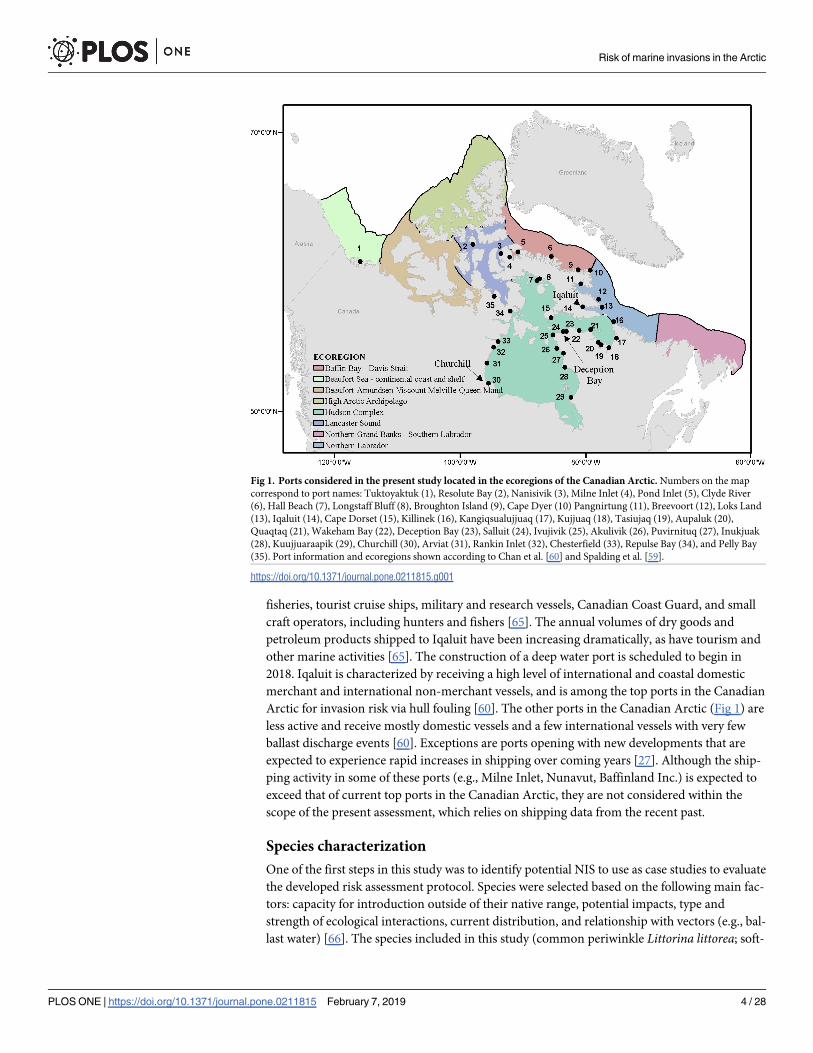
Fig 1. Ports considered in the present study located in the ecoregions of the Canadian Arctic. Numbers on the map
correspond to port names: Tuktoyaktuk (1), Resolute Bay (2), Nanisivik (3), Milne Inlet (4), Pond Inlet (5), Clyde River
(6), Hall Beach (7), Longstaff Bluff (8), Broughton Island (9), Cape Dyer (10) Pangnirtung (11), Breevoort (12), Loks Land
(13), Iqaluit (14), Cape Dorset (15), Killinek (16), Kangiqsualujjuaq (17), Kujjuaq (18), Tasiujaq (19), Aupaluk (20),
Quaqtaq (21), Wakeham Bay (22), Deception Bay (23), Salluit (24), Ivujivik (25), Akulivik (26), Puvirnituq (27), Inukjuak
(28), Kuujjuaraapik (29), Churchill (30), Arviat (31), Rankin Inlet (32), Chesterfield (33), Repulse Bay (34), and Pelly Bay
(35). Port information and ecoregions shown according to Chan et al. [60] and Spalding et al. [59].
https://doi.org/10.1371/journal.pone.0211815.g001
Risk of marine invasions in the Arctic
PLOS ONE | https://doi.org/10.1371/journal.pone.0211815 February 7, 2019 4 / 28
shell clam Mya arenaria; and red king crab Paralithodes camtschaticus) are known to be inva-
sive elsewhere, not present in the Canadian Arctic but present in ports that are connected to
Canadian Arctic ports, and have predicted habitat suitability under present environmental
conditions [32]. In addition to certain regions of the Canadian Arctic already being suitable
for these three species, the predicted extent of suitable habitat will increase due to climate
change [32]. The three case species are benthic invertebrates with different invasion histories
and survival strategies, but all have a larval phase that is long enough so that they may be trans-
ported by ballast water (Table 1). The three species are also ecosystem engineers and thus
regarded as high impact/risk species that may influence ecosystem properties and biodiversity
[67].
Risk characterization
Risk is defined as the combination of the likelihood of an event occurring and the conse-
quences of the event if it were to occur [88]. In this study, “likelihood of an event” is defined as
the likelihood of the establishment process of a non-indigenous species (a combination of
introduction -arrival and release-, survival, and establishment), and “consequence” as the con-
sequence of occurrence that a species could have if it arrives and establishes in a specific loca-
tion. Overall risk is calculated as the product of establishment and consequence of occurrence
per port, year, and species associated with vessel discharges (Fig 2). Methods for this relative
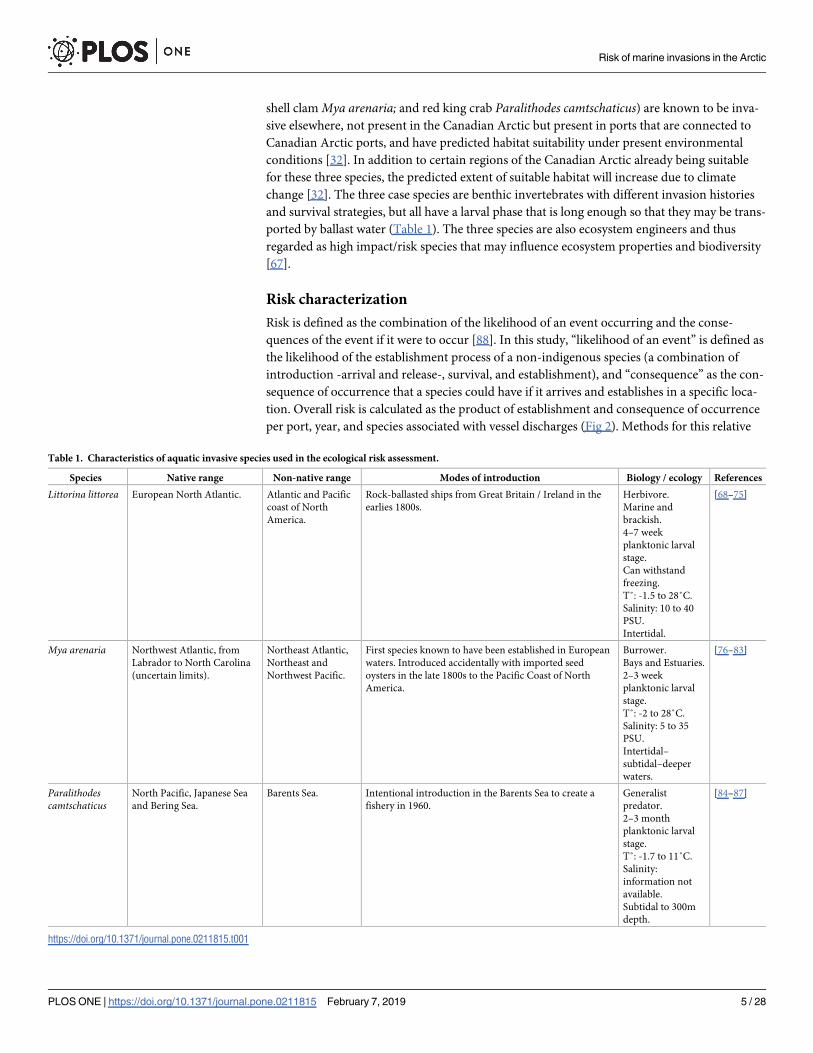
Table 1. Characteristics of aquatic invasive species used in the ecological risk assessment.
Species Native range Non-native range Modes of introduction Biology / ecology References
Littorina littorea European North Atlantic. Atlantic and Pacific
coast of North
America.
Rock-ballasted ships from Great Britain / Ireland in the
earlies 1800s.
Herbivore.
Marine and
brackish.
4–7 week
planktonic larval
stage.
Can withstand
freezing.
T˚: -1.5 to 28˚C.
Salinity: 10 to 40
PSU.
Intertidal.
[68–75]
Mya arenaria Northwest Atlantic, from
Labrador to North Carolina
(uncertain limits).
Northeast Atlantic,
Northeast and
Northwest Pacific.
First species known to have been established in European
waters. Introduced accidentally with imported seed
oysters in the late 1800s to the Pacific Coast of North
America.
Burrower.
Bays and Estuaries.
2–3 week
planktonic larval
stage.
T˚: -2 to 28˚C.
Salinity: 5 to 35
PSU.
Intertidal–
subtidal–deeper
waters.
[76–83]
Paralithodescamtschaticus
North Pacific, Japanese Sea
and Bering Sea.
Barents Sea. Intentional introduction in the Barents Sea to create a
fishery in 1960.
Generalist
predator.
2–3 month
planktonic larval
stage.
T˚: -1.7 to 11˚C.
Salinity:
information not
available.
Subtidal to 300m
depth.
[84–87]
https://doi.org/10.1371/journal.pone.0211815.t001
Risk of marine invasions in the Arctic
PLOS ONE | https://doi.org/10.1371/journal.pone.0211815 February 7, 2019 5 / 28
risk assessment were adapted and modified from Hewitt et al. [89], Therriault et al. [90] and
Mandrak et al. [91]. The assessment focuses on ecological effects; economic and social impacts
were not considered. It must be noted that the assessment is relative, meaning that overall risk
depends on the ports and species assessed.
Establishment
The potential for successful species introduction resulting in its establishment in the region
was calculated as the product of: a) likelihood of arrival (only via ballast water); and b) likeli-
hood of survival-establishment (probability of suitable conditions and habitat being available
for a given species released in the receiving environment); modified from Mandrak et al. [91]
(Section 1 in Fig 2). A particular effort was made to gather detailed information on tank-spe-
cific ballast water sources, transit times, type of exchange performed and volume of ballast
water discharged as outlined below.
The likelihood of arrival was restricted to shipping information for vessels that arrived at
Canadian Arctic ports and reported on ballast management activities over a ten- year period
(2005–2014). This information was collected from several sources: Transport Canada Ballast
Reporting Database, FedNav Ballast Reporting Forms, and Casas-Monroy et al. [92]. Vessels
were of both domestic (N = 75) and international (N = 178) origin and included mainly bulk
carriers and merchant vessels, but also passenger ships and tugboats. The latter usually submits
ballast water reports only when they carry ballast in their tanks, although reports with no bal-
last discharge have been submitted (P. Mudroch Transport Canada pers. comm.). Ballast dis-
charge information was summarized by arrival port, type of BWE, pre-exchange ballast water
source, and last port of call for vessel categories. When possible, data on tank-specific pre-
exchange ballast water source(s) for each vessel were used for the analysis as ballast water from
individual tanks can have different histories and may not originate from the last port of call.
When tank-specific information was not available (NDomestic = 47, NInternational = 68), the bal-
last source was assumed to be the last port of call. Since this ecological risk assessment is spe-
cies-specific, only ballast water sources originating from ports where the species of concern
was known to be present (either in their native or non-native range) were included in the
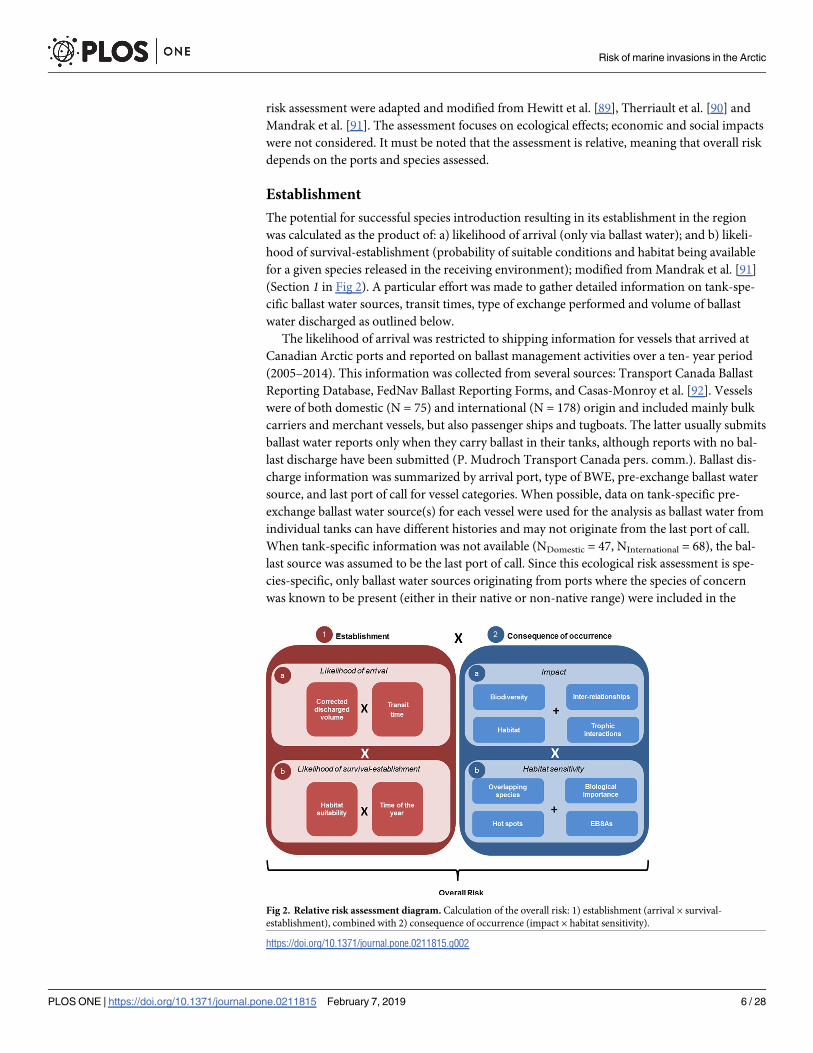
Fig 2. Relative risk assessment diagram. Calculation of the overall risk: 1) establishment (arrival × survival-
establishment), combined with 2) consequence of occurrence (impact × habitat sensitivity).
https://doi.org/10.1371/journal.pone.0211815.g002
Risk of marine invasions in the Arctic
PLOS ONE | https://doi.org/10.1371/journal.pone.0211815 February 7, 2019 6 / 28
analyses described below. Both per-vessel and cumulative annual risk (based on total volumes
discharged at a given port) were calculated.
Spread from the initial introduction location is normally included in the calculation of like-
lihood of introduction and establishment [91], given that it has an important influence as
shown in other risk assessments analyses [90]. However, spread was not included in the pres-
ent study since much of the required information, including high resolution data on oceano-
graphic currents and ice-ocean modelling systems, is not available for nearshore coastal areas
of the Arctic where the ports included in this assessment are located.
Likelihood of arrival. Relative likelihood of arrival for each vessel was estimated as the
product of the volume of ballast water discharged (using a correction factor for BWE, see
below) at an arrival port and the risk score for vessel transit time (section 1a in Fig 2). Individ-
ual ballast water sources related to a given port of arrival in a given year were then combined
to calculate an average likelihood of arrival per vessel, pathway (international or domestic),
port, year, and species. International vessels were defined as those that operated outside of the
Canadian exclusive economic zone, performed mid-ocean exchange (MOE) prior to entering
Canadian waters, and are required to submit ballast water reporting information. Domestic
vessels were defined as those that operated entirely within Canadian waters, and are exempt
from submitting ballast water reports or performing BWE. Although these vessels are not
required to perform BWE, if they do, it is typically a coastal BWE and records of ballast man-
agement activities are kept internally by the shipping companies. It has been shown that this
practice may in some cases decrease BWE efficacy by increasing the abundance, and in some
cases, diversity of species beyond that which was originally taken up in ballast in source ports
[63, 64, 93].
A correction factor was applied to the volume discharged to account for propagule supply
reduction due to ballast water management activities. To this end, ballast water discharge
information was categorized according to if, and where, BWE was done. When information
on the type of BWE was missing, it was assumed that international vessels had performed
MOE (N = 5) and that domestic vessels did not undertake any ballast water management
(N = 15). An exception was for domestic vessels known to conduct voluntary BWE as part of
their regular operations [63, 64] which were assumed to have done so for all transits. In cases
where a vessel was known to have discharged ballast water in a given port, but the volume was
not provided, the volume discharged was assumed to be equivalent to the volume of ballast
water on board (NDomestic = 11, NInternational = 38). Following categorization of BWE practices,
correction factors were applied to the reported volumes of exchanged ballast water: 0.1 for
ships with a saline/brackish ballast water source and 0.01 for freshwater source. These values
are based on published BWE efficacy rates from total zooplankton abundance after BWE (90%
for saline water and 99% for freshwater) [94, 95] and have been applied in other risk assess-
ments [60]. Global annual mean salinity from source ports was obtained from Keller, Drake
[96], and salinity categories were classified as: 0–5 ppt as freshwater, 5.1–18 ppt as brackish,
and>18.1 ppt as marine [92]. When BWE was not performed, no correction factor was
applied and the complete volume discharged was considered in the calculation.
The corrected discharged volume was combined with a factor for transit time, which was
calculated as the difference between the date the pre-exchange ballast water was taken up at
the source port and the date when the ballast water was discharged at the arrival port. Transit
time was included to reflect the fact that the faster an organism reaches the destination port,
the greater the chance it has of surviving the voyage and establishing a viable population in the
new environment [97]. In particular, benthic taxa with a single planktonic life stage (e.g., gas-
tropods and bivalves with planktonic larval stages) are less vulnerable to mortality in transit
[98]. Details on the planktonic life stages of all case species (normal and maximal larval
Risk of marine invasions in the Arctic
PLOS ONE | https://doi.org/10.1371/journal.pone.0211815 February 7, 2019 7 / 28
periods) (Table 1) were taken into consideration in ranking the transit times as low, moderate,
and high (scored from 1 to 3, respectively). A low score was assigned when the transit time was
longer than the maximum duration known for the larval stage of the species. Conversely, a
high score was assigned when the transit time was lower than the average larval stage duration.
Moderate scores were assigned to transit times that were between the average and maximum
larval stage duration. In cases where information on the date of ballast water uptake was miss-
ing for transits (NDomestic = 51, NInternational = 46), an average of all other transit times was used
to complete the missing information. Final values for likelihood of arrival were normalized
from 0 to 1 (with 1 being the highest).
Likelihood of survival-establishment. Likelihood of survival and establishment was cal-
culated as the product of habitat suitability for each species assessed and a score for the time of
year when ballast water was discharged (section 1b in Fig 2). These values were then combined
to calculate an average likelihood of survival-establishment per pathway (international or
domestic), port, year, and species. Habitat suitability was estimated based on the predicted
suitability of regions for a given case species, resulting from species distribution modelling
using MaxEnt [99, 100]. To this end, sea surface and bottom temperature, sea surface and bot-
tom salinity, bathymetry and ice coverage were employed as environmental predictors [32].
The model predictions of habitat suitability were interpreted as likelihood of survival and
establishment [101] of each species for a given region of the Arctic. To standardize results
among organisms, the maximum absolute probability value generated by the model in the
region of study was considered to be the highest likelihood of survival-establishment across all
three species combined.
Since likelihood of survival and establishment likely vary among seasons [14, 102], the time
of the year ballast water was discharged was considered. Low, moderate, and high scores were
assigned when the ballast water was discharged in winter, spring/autumn, and summer
according to northern hemisphere calendar seasons (ranked from 1 to 3, respectively). These
ranked scores reflect the idea that most temperate species–those most likely to be transported–
reproduce and recruit during the warmer seasons and would be best able to survive when
waters are at their warmest [102]. This is of particular interest in the present study given that
domestic and international arrivals from temperate regions represent 76% and 70% of ship-
ping arrivals, respectively.
Consequence of occurrence
Consequence of occurrence is defined as the potential consequence that a species may have if
it is introduced in a new receiving environment. This was calculated as the product of the
scores of impact and habitat sensitivity of the receiving habitat (section 2, Fig 2).
Impact. Impact (section 2a, Fig 2) is defined as a measurable change in the ecological
state of an invaded ecosystem that can be attributed to NIS [103]. This includes any change in
ecological or ecosystem properties. The impact that a species has had elsewhere has been
shown to be a good predictor of impact in the new environment [104]. This risk component
was therefore ranked based on documented information from other locations where the focal
species are known to be invasive. Web of Science was used to search for documented informa-
tion on each species. The name of each species was combined with “impact” and “invasion” as
key words. The reported effects were divided into four categories and scored using impact
rankings adapted from Hewitt et al. [89] (Table 2). These categories include: 1) changes in
biodiversity, abundance and distribution, 2) changes in interspecific interactions (e.g., compe-
tition with native species for resources or space), 3) habitat (changes in the physical environ-
ment) and 4) trophic interactions (e.g., predation on native species). These four factors were
Risk of marine invasions in the Arctic
PLOS ONE | https://doi.org/10.1371/journal.pone.0211815 February 7, 2019 8 / 28
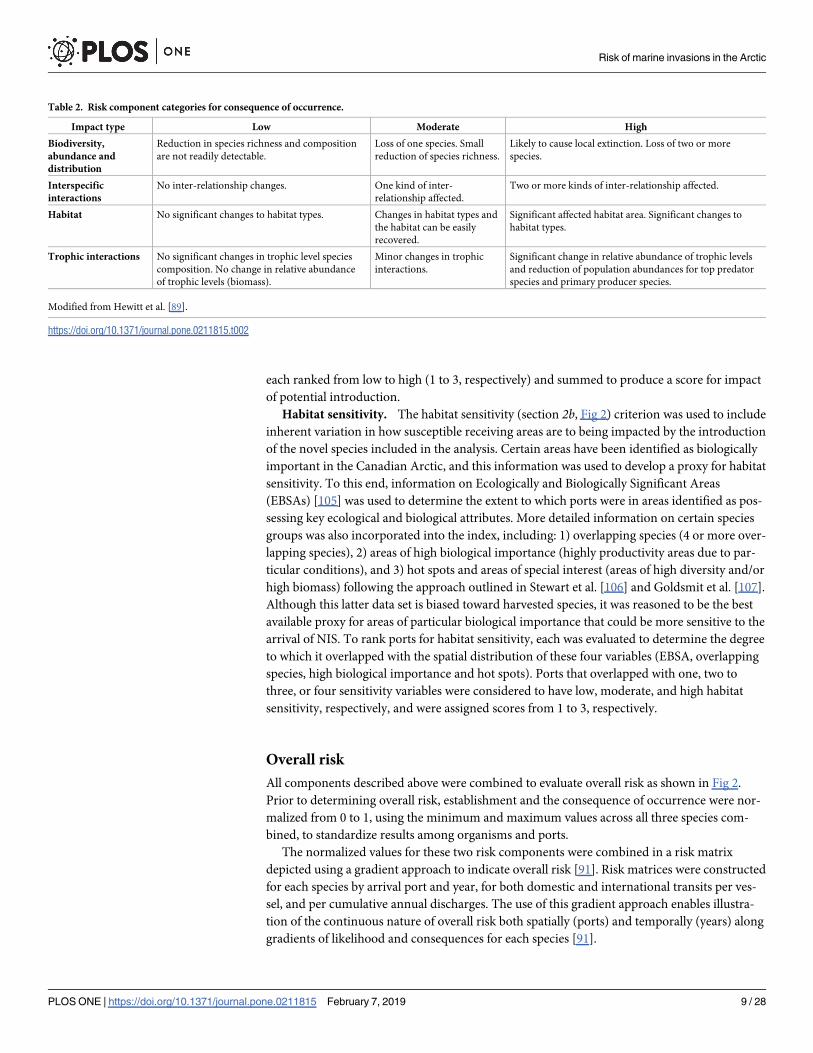
each ranked from low to high (1 to 3, respectively) and summed to produce a score for impact
of potential introduction.
Habitat sensitivity. The habitat sensitivity (section 2b, Fig 2) criterion was used to include
inherent variation in how susceptible receiving areas are to being impacted by the introduction
of the novel species included in the analysis. Certain areas have been identified as biologically
important in the Canadian Arctic, and this information was used to develop a proxy for habitat
sensitivity. To this end, information on Ecologically and Biologically Significant Areas
(EBSAs) [105] was used to determine the extent to which ports were in areas identified as pos-
sessing key ecological and biological attributes. More detailed information on certain species
groups was also incorporated into the index, including: 1) overlapping species (4 or more over-
lapping species), 2) areas of high biological importance (highly productivity areas due to par-
ticular conditions), and 3) hot spots and areas of special interest (areas of high diversity and/or
high biomass) following the approach outlined in Stewart et al. [106] and Goldsmit et al. [107].
Although this latter data set is biased toward harvested species, it was reasoned to be the best
available proxy for areas of particular biological importance that could be more sensitive to the
arrival of NIS. To rank ports for habitat sensitivity, each was evaluated to determine the degree
to which it overlapped with the spatial distribution of these four variables (EBSA, overlapping
species, high biological importance and hot spots). Ports that overlapped with one, two to
three, or four sensitivity variables were considered to have low, moderate, and high habitat
sensitivity, respectively, and were assigned scores from 1 to 3, respectively.
Overall risk
All components described above were combined to evaluate overall risk as shown in Fig 2.
Prior to determining overall risk, establishment and the consequence of occurrence were nor-
malized from 0 to 1, using the minimum and maximum values across all three species com-
bined, to standardize results among organisms and ports.
The normalized values for these two risk components were combined in a risk matrix
depicted using a gradient approach to indicate overall risk [91]. Risk matrices were constructed
for each species by arrival port and year, for both domestic and international transits per ves-
sel, and per cumulative annual discharges. The use of this gradient approach enables illustra-
tion of the continuous nature of overall risk both spatially (ports) and temporally (years) along
gradients of likelihood and consequences for each species [91].
Table 2. Risk component categories for consequence of occurrence.
Impact type Low Moderate High
Biodiversity,
abundance and
distribution
Reduction in species richness and composition
are not readily detectable.
Loss of one species. Small
reduction of species richness.
Likely to cause local extinction. Loss of two or more
species.
Interspecific
interactions
No inter-relationship changes. One kind of inter-
relationship affected.
Two or more kinds of inter-relationship affected.
Habitat No significant changes to habitat types. Changes in habitat types and
the habitat can be easily
recovered.
Significant affected habitat area. Significant changes to
habitat types.
Trophic interactions No significant changes in trophic level species
composition. No change in relative abundance
of trophic levels (biomass).
Minor changes in trophic
interactions.
Significant change in relative abundance of trophic levels
and reduction of population abundances for top predator
species and primary producer species.
Modified from Hewitt et al. [89].
https://doi.org/10.1371/journal.pone.0211815.t002
Risk of marine invasions in the Arctic
PLOS ONE | https://doi.org/10.1371/journal.pone.0211815 February 7, 2019 9 / 28
Uncertainty
The strength of a risk assessment is dependent on the uncertainty associated with the data [91]
and must be explicitly considered for each step of the risk assessment based on the extent of
available information and gaps. Three types of uncertainty exist: stochastic, imperfect knowl-
edge, and human error. In this study, the greatest uncertainty affecting the assessment is
imperfect knowledge, namely, lack of knowledge. The quality and quantity of data available to
assess establishment process and magnitude of consequences needs to be incorporated in
uncertainty [101]. Uncertainty was considered in each step of the risk assessment according to
the availability and type of information used, as modified from Therriault et al. [90]. As sug-
gested in Mandrak et al. [91], it was included with the risk ranking by describing the amount
of information available, but it was not incorporated into the scores. Uncertainty was consid-
ered high when limited scientific information was available and low when the analysis was
based on substantial scientific information. It was also considered low when quantitative
methods, such as the habitat suitability modelling used to calculate the likelihood of survival/
establishment, were included in the risk assessment. Uncertainty was considered moderate
when there was a moderate level of peer-reviewed information and expert opinion available.
Overall uncertainty was considered to be equivalent to the highest uncertainty associated with
any variable used in the analysis [91].
Results
General shipping results
Among vessels that conducted ballast management activities from 2005 to 2014, Deception
Bay received the highest average number of domestic arrivals annually (7.5), followed by Chur-
chill (3.6) and Iqaluit (2.5) (Table 3). For international vessels, that conducted ballast manage-
ment, Churchill received the highest average annual number of arrivals (16.1), followed by
Pond Inlet (3.5) and Iqaluit (2.5) (Table 3). Overall, 93.3% of domestic ships and 70.8% of
international ships for which ballast reporting information was available, discharged their bal-
last at Canadian Arctic ports (for a complete list of results see Table 3, and refer to Fig 1 for
port geographic locations). Of these, pre-exchange ballast water sources differed from the last
visited ports for 11.1% and 31.1% of domestic and international arrivals, respectively.
Mean corrected ballast water discharge for domestic arrivals was highest for Deception Bay,
Churchill, Aupaluk and Broughton Island, while total discharges were higher for Deception
Bay, Churchill, and Iqaluit (Table 3). For international arrivals, the mean and total corrected
ballast water was highest for Churchill, followed by Cape Dyer and Deception Bay (Table 3).
For domestic vessels ports that had the highest number of arrivals also had the highest total
corrected discharge per port (Table 3). This was not the case for international arrivals, since
many vessels arrived but did not discharge ballast in the Arctic. Thus, Deception Bay had the
second highest total discharge of ballast water from international vessels although it only had a
mean of 1.3 arrivals per year (Table 3).
Establishment
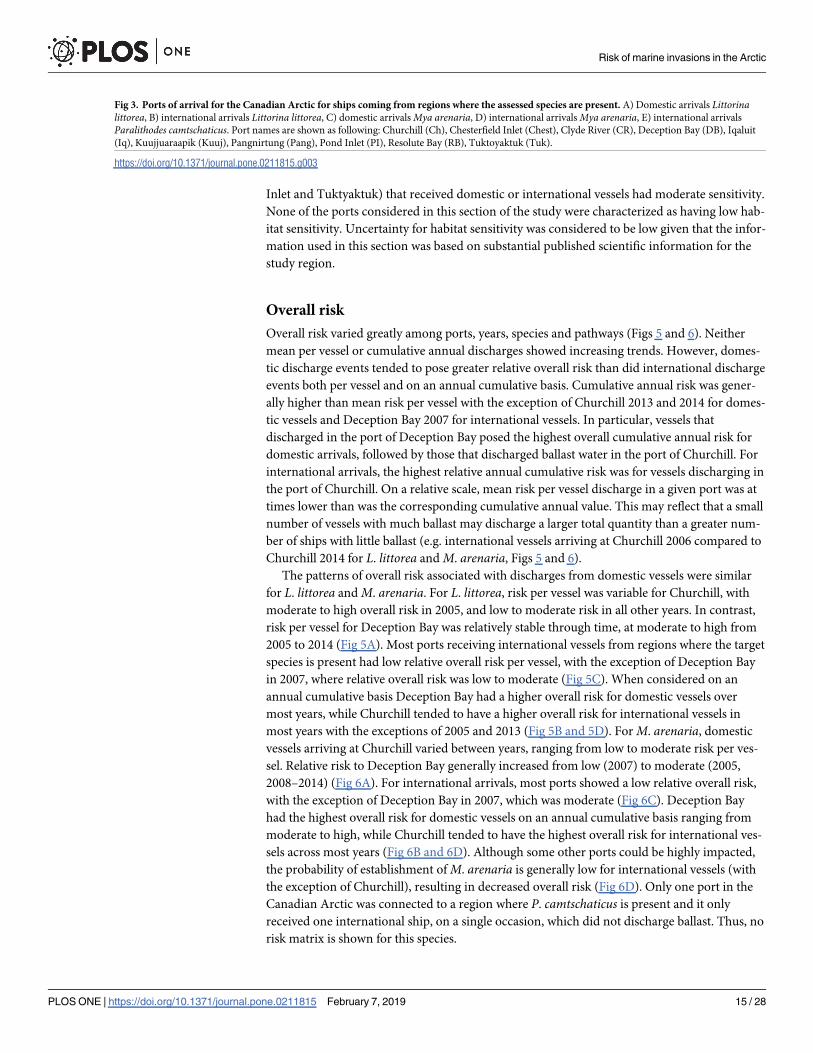
Likelihood of arrival. Four ports received vessels with domestic ballast water originating
from regions where both the periwinkle L. littorea and the soft shell clam M. arenaria are pres-
ent (Fig 3A and 3C). Among these, Deception Bay (years 2005, 2006, 2008, 2013 and 2014)
and Churchill (year 2005) received the highest corrected volumes of discharged ballast water
per vessel for both species (S1 and S2 Tables). Ballast water age (considered here as transit
time) varied from 5 to 37 days in domestic vessels, resulting in a high score for L. littorea with
Risk of marine invasions in the Arctic
PLOS ONE | https://doi.org/10.1371/journal.pone.0211815 February 7, 2019 10 / 28
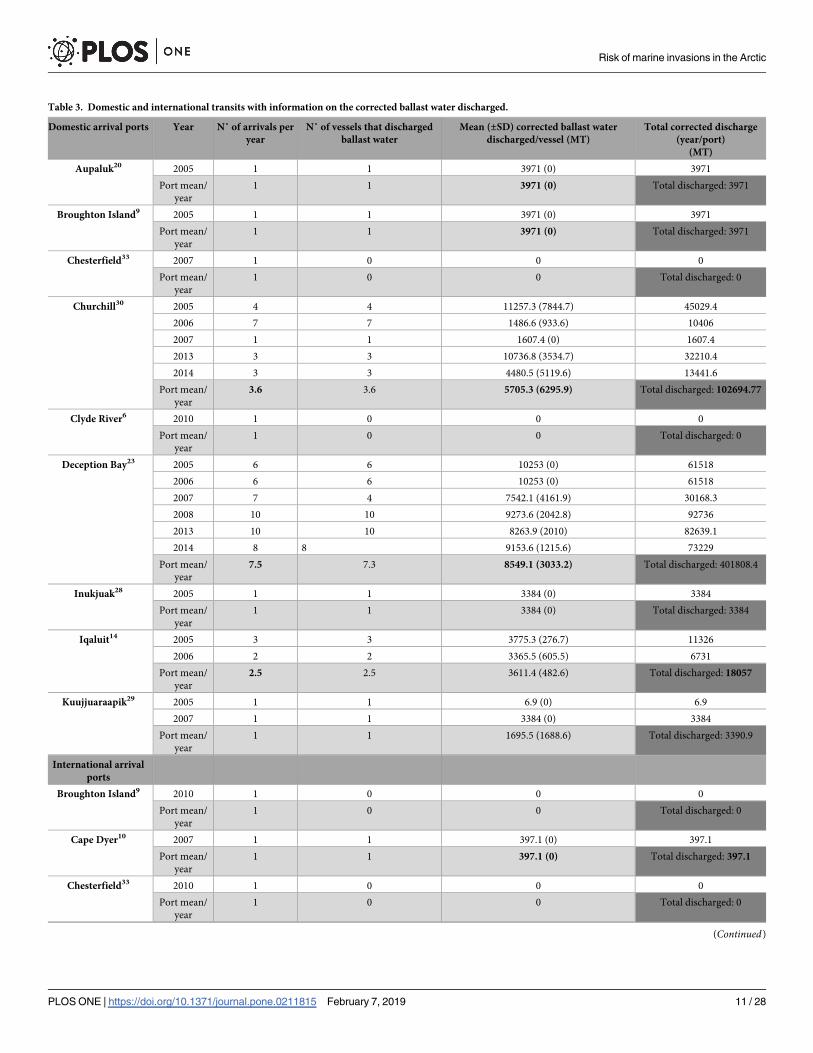
Table 3. Domestic and international transits with information on the corrected ballast water discharged.
Domestic arrival ports Year N˚ of arrivals per
year
N˚ of vessels that discharged
ballast water
Mean (±SD) corrected ballast water
discharged/vessel (MT)
Total corrected discharge
(year/port)
(MT)
Aupaluk20 2005 1 1 3971 (0) 3971
Port mean/
year
1 1 3971 (0) Total discharged: 3971
Broughton Island9 2005 1 1 3971 (0) 3971
Port mean/
year
1 1 3971 (0) Total discharged: 3971
Chesterfield33 2007 1 0 0 0
Port mean/
year
1 0 0 Total discharged: 0
Churchill30 2005 4 4 11257.3 (7844.7) 45029.4
2006 7 7 1486.6 (933.6) 10406
2007 1 1 1607.4 (0) 1607.4
2013 3 3 10736.8 (3534.7) 32210.4
2014 3 3 4480.5 (5119.6) 13441.6
Port mean/
year
3.6 3.6 5705.3 (6295.9) Total discharged: 102694.77
Clyde River6 2010 1 0 0 0
Port mean/
year
1 0 0 Total discharged: 0
Deception Bay23 2005 6 6 10253 (0) 61518
2006 6 6 10253 (0) 61518
2007 7 4 7542.1 (4161.9) 30168.3
2008 10 10 9273.6 (2042.8) 92736
2013 10 10 8263.9 (2010) 82639.1
2014 8 8 9153.6 (1215.6) 73229
Port mean/
year
7.5 7.3 8549.1 (3033.2) Total discharged: 401808.4
Inukjuak28 2005 1 1 3384 (0) 3384
Port mean/
year
1 1 3384 (0) Total discharged: 3384
Iqaluit14 2005 3 3 3775.3 (276.7) 11326
2006 2 2 3365.5 (605.5) 6731
Port mean/
year
2.5 2.5 3611.4 (482.6) Total discharged: 18057
Kuujjuaraapik29 2005 1 1 6.9 (0) 6.9
2007 1 1 3384 (0) 3384
Port mean/
year
1 1 1695.5 (1688.6) Total discharged: 3390.9
International arrival
ports
Broughton Island9 2010 1 0 0 0
Port mean/
year
1 0 0 Total discharged: 0
Cape Dyer10 2007 1 1 397.1 (0) 397.1
Port mean/
year
1 1 397.1 (0) Total discharged: 397.1
Chesterfield33 2010 1 0 0 0
Port mean/
year
1 0 0 Total discharged: 0
(Continued)
Risk of marine invasions in the Arctic
PLOS ONE | https://doi.org/10.1371/journal.pone.0211815 February 7, 2019 11 / 28
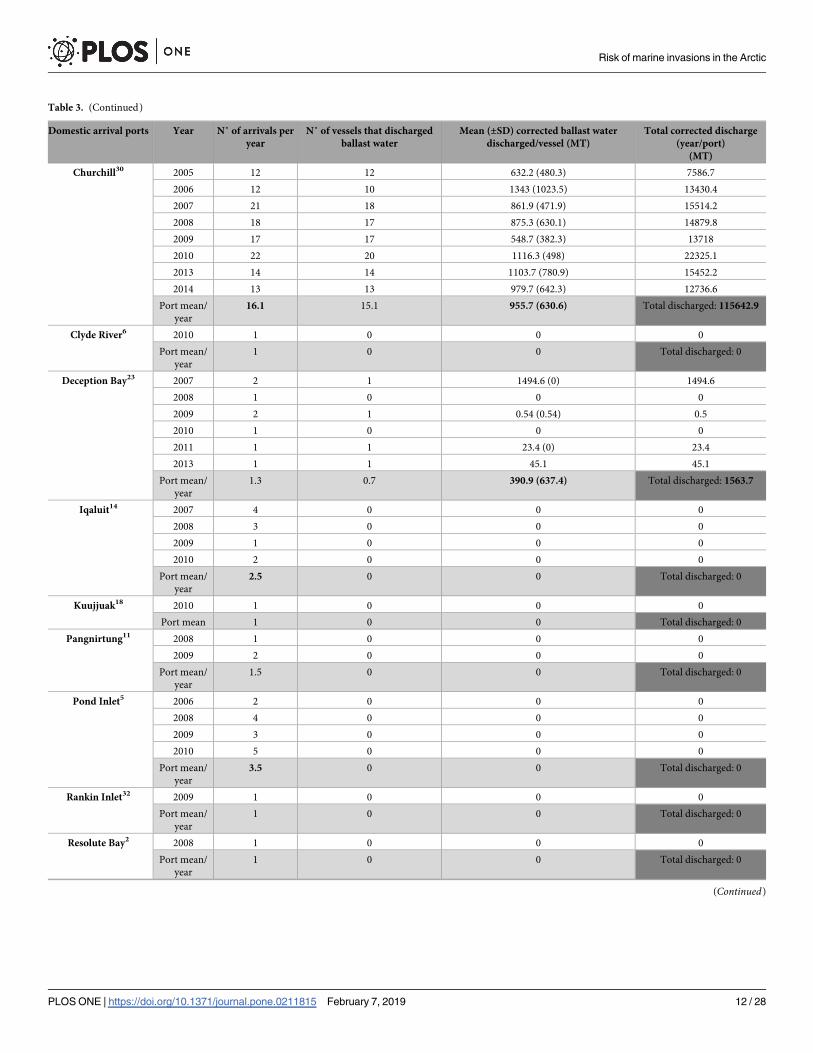
Table 3. (Continued)
Domestic arrival ports Year N˚ of arrivals per
year
N˚ of vessels that discharged
ballast water
Mean (±SD) corrected ballast water
discharged/vessel (MT)
Total corrected discharge
(year/port)
(MT)
Churchill30 2005 12 12 632.2 (480.3) 7586.7
2006 12 10 1343 (1023.5) 13430.4
2007 21 18 861.9 (471.9) 15514.2
2008 18 17 875.3 (630.1) 14879.8
2009 17 17 548.7 (382.3) 13718
2010 22 20 1116.3 (498) 22325.1
2013 14 14 1103.7 (780.9) 15452.2
2014 13 13 979.7 (642.3) 12736.6
Port mean/
year
16.1 15.1 955.7 (630.6) Total discharged: 115642.9
Clyde River6 2010 1 0 0 0
Port mean/
year
1 0 0 Total discharged: 0
Deception Bay23 2007 2 1 1494.6 (0) 1494.6
2008 1 0 0 0
2009 2 1 0.54 (0.54) 0.5
2010 1 0 0 0
2011 1 1 23.4 (0) 23.4
2013 1 1 45.1 45.1
Port mean/
year
1.3 0.7 390.9 (637.4) Total discharged: 1563.7
Iqaluit14 2007 4 0 0 0
2008 3 0 0 0
2009 1 0 0 0
2010 2 0 0 0
Port mean/
year
2.5 0 0 Total discharged: 0
Kuujjuak18 2010 1 0 0 0
Port mean 1 0 0 Total discharged: 0
Pangnirtung11 2008 1 0 0 0
2009 2 0 0 0
Port mean/
year
1.5 0 0 Total discharged: 0
Pond Inlet5 2006 2 0 0 0
2008 4 0 0 0
2009 3 0 0 0
2010 5 0 0 0
Port mean/
year
3.5 0 0 Total discharged: 0
Rankin Inlet32 2009 1 0 0 0
Port mean/
year
1 0 0 Total discharged: 0
Resolute Bay2 2008 1 0 0 0
Port mean/
year
1 0 0 Total discharged: 0
(Continued)
Risk of marine invasions in the Arctic
PLOS ONE | https://doi.org/10.1371/journal.pone.0211815 February 7, 2019 12 / 28
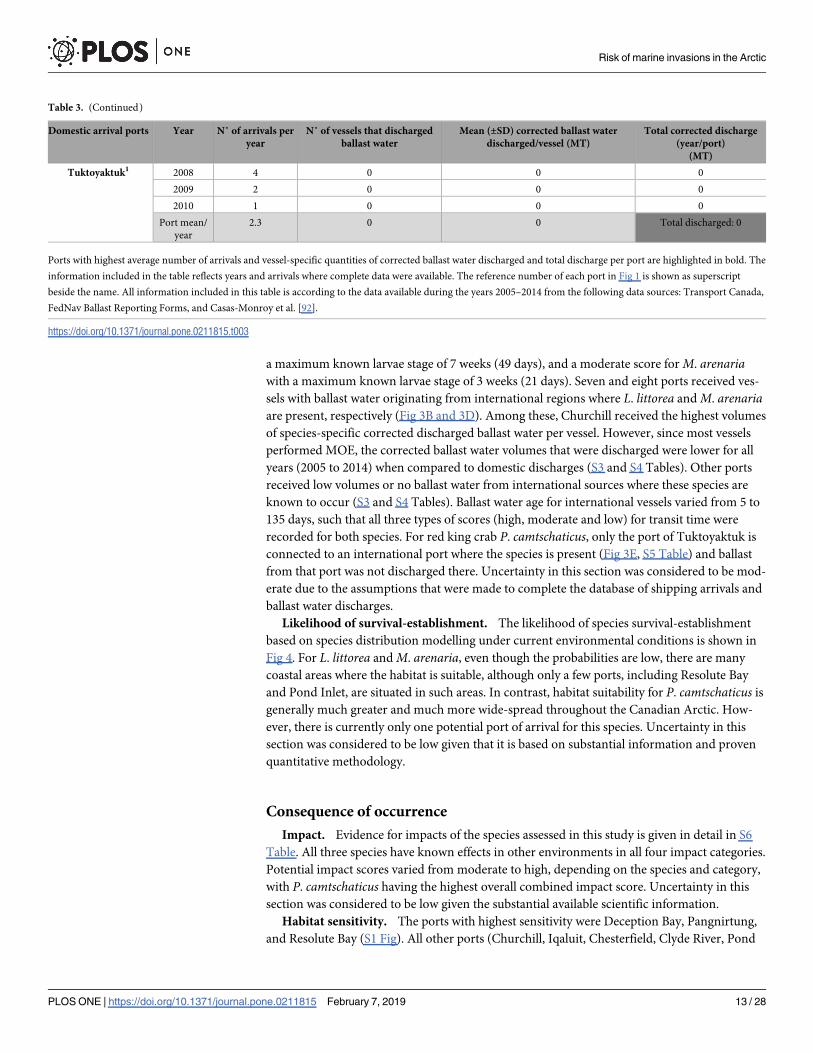
a maximum known larvae stage of 7 weeks (49 days), and a moderate score for M. arenariawith a maximum known larvae stage of 3 weeks (21 days). Seven and eight ports received ves-
sels with ballast water originating from international regions where L. littorea and M. arenariaare present, respectively (Fig 3B and 3D). Among these, Churchill received the highest volumes
of species-specific corrected discharged ballast water per vessel. However, since most vessels
performed MOE, the corrected ballast water volumes that were discharged were lower for all
years (2005 to 2014) when compared to domestic discharges (S3 and S4 Tables). Other ports
received low volumes or no ballast water from international sources where these species are
known to occur (S3 and S4 Tables). Ballast water age for international vessels varied from 5 to
135 days, such that all three types of scores (high, moderate and low) for transit time were
recorded for both species. For red king crab P. camtschaticus, only the port of Tuktoyaktuk is
connected to an international port where the species is present (Fig 3E, S5 Table) and ballast
from that port was not discharged there. Uncertainty in this section was considered to be mod-
erate due to the assumptions that were made to complete the database of shipping arrivals and
ballast water discharges.
Likelihood of survival-establishment. The likelihood of species survival-establishment
based on species distribution modelling under current environmental conditions is shown in
Fig 4. For L. littorea and M. arenaria, even though the probabilities are low, there are many
coastal areas where the habitat is suitable, although only a few ports, including Resolute Bay
and Pond Inlet, are situated in such areas. In contrast, habitat suitability for P. camtschaticus is
generally much greater and much more wide-spread throughout the Canadian Arctic. How-
ever, there is currently only one potential port of arrival for this species. Uncertainty in this
section was considered to be low given that it is based on substantial information and proven
quantitative methodology.
Consequence of occurrence
Impact. Evidence for impacts of the species assessed in this study is given in detail in S6
Table. All three species have known effects in other environments in all four impact categories.
Potential impact scores varied from moderate to high, depending on the species and category,
with P. camtschaticus having the highest overall combined impact score. Uncertainty in this
section was considered to be low given the substantial available scientific information.
Habitat sensitivity. The ports with highest sensitivity were Deception Bay, Pangnirtung,
and Resolute Bay (S1 Fig). All other ports (Churchill, Iqaluit, Chesterfield, Clyde River, Pond
Table 3. (Continued)
Domestic arrival ports Year N˚ of arrivals per
year
N˚ of vessels that discharged
ballast water
Mean (±SD) corrected ballast water
discharged/vessel (MT)
Total corrected discharge
(year/port)
(MT)
Tuktoyaktuk1 2008 4 0 0 0
2009 2 0 0 0
2010 1 0 0 0
Port mean/
year
2.3 0 0 Total discharged: 0
Ports with highest average number of arrivals and vessel-specific quantities of corrected ballast water discharged and total discharge per port are highlighted in bold. The
information included in the table reflects years and arrivals where complete data were available. The reference number of each port in Fig 1 is shown as superscript
beside the name. All information included in this table is according to the data available during the years 2005–2014 from the following data sources: Transport Canada,
FedNav Ballast Reporting Forms, and Casas-Monroy et al. [92].
https://doi.org/10.1371/journal.pone.0211815.t003
Risk of marine invasions in the Arctic
PLOS ONE | https://doi.org/10.1371/journal.pone.0211815 February 7, 2019 13 / 28
Risk of marine invasions in the Arctic
PLOS ONE | https://doi.org/10.1371/journal.pone.0211815 February 7, 2019 14 / 28
Inlet and Tuktyaktuk) that received domestic or international vessels had moderate sensitivity.
None of the ports considered in this section of the study were characterized as having low hab-
itat sensitivity. Uncertainty for habitat sensitivity was considered to be low given that the infor-
mation used in this section was based on substantial published scientific information for the
study region.
Overall risk
Overall risk varied greatly among ports, years, species and pathways (Figs 5 and 6). Neither
mean per vessel or cumulative annual discharges showed increasing trends. However, domes-
tic discharge events tended to pose greater relative overall risk than did international discharge
events both per vessel and on an annual cumulative basis. Cumulative annual risk was gener-
ally higher than mean risk per vessel with the exception of Churchill 2013 and 2014 for domes-
tic vessels and Deception Bay 2007 for international vessels. In particular, vessels that
discharged in the port of Deception Bay posed the highest overall cumulative annual risk for
domestic arrivals, followed by those that discharged ballast water in the port of Churchill. For
international arrivals, the highest relative annual cumulative risk was for vessels discharging in
the port of Churchill. On a relative scale, mean risk per vessel discharge in a given port was at
times lower than was the corresponding cumulative annual value. This may reflect that a small
number of vessels with much ballast may discharge a larger total quantity than a greater num-
ber of ships with little ballast (e.g. international vessels arriving at Churchill 2006 compared to
Churchill 2014 for L. littorea and M. arenaria, Figs 5 and 6).
The patterns of overall risk associated with discharges from domestic vessels were similar
for L. littorea and M. arenaria. For L. littorea, risk per vessel was variable for Churchill, with
moderate to high overall risk in 2005, and low to moderate risk in all other years. In contrast,
risk per vessel for Deception Bay was relatively stable through time, at moderate to high from
2005 to 2014 (Fig 5A). Most ports receiving international vessels from regions where the target
species is present had low relative overall risk per vessel, with the exception of Deception Bay
in 2007, where relative overall risk was low to moderate (Fig 5C). When considered on an
annual cumulative basis Deception Bay had a higher overall risk for domestic vessels over
most years, while Churchill tended to have a higher overall risk for international vessels in
most years with the exceptions of 2005 and 2013 (Fig 5B and 5D). For M. arenaria, domestic
vessels arriving at Churchill varied between years, ranging from low to moderate risk per ves-
sel. Relative risk to Deception Bay generally increased from low (2007) to moderate (2005,
2008–2014) (Fig 6A). For international arrivals, most ports showed a low relative overall risk,
with the exception of Deception Bay in 2007, which was moderate (Fig 6C). Deception Bay
had the highest overall risk for domestic vessels on an annual cumulative basis ranging from
moderate to high, while Churchill tended to have the highest overall risk for international ves-
sels across most years (Fig 6B and 6D). Although some other ports could be highly impacted,
the probability of establishment of M. arenaria is generally low for international vessels (with
the exception of Churchill), resulting in decreased overall risk (Fig 6D). Only one port in the
Canadian Arctic was connected to a region where P. camtschaticus is present and it only
received one international ship, on a single occasion, which did not discharge ballast. Thus, no
risk matrix is shown for this species.
Fig 3. Ports of arrival for the Canadian Arctic for ships coming from regions where the assessed species are present. A) Domestic arrivals Littorinalittorea, B) international arrivals Littorina littorea, C) domestic arrivals Mya arenaria, D) international arrivals Mya arenaria, E) international arrivals
Paralithodes camtschaticus. Port names are shown as following: Churchill (Ch), Chesterfield Inlet (Chest), Clyde River (CR), Deception Bay (DB), Iqaluit
(Iq), Kuujjuaraapik (Kuuj), Pangnirtung (Pang), Pond Inlet (PI), Resolute Bay (RB), Tuktoyaktuk (Tuk).
https://doi.org/10.1371/journal.pone.0211815.g003
Risk of marine invasions in the Arctic
PLOS ONE | https://doi.org/10.1371/journal.pone.0211815 February 7, 2019 15 / 28
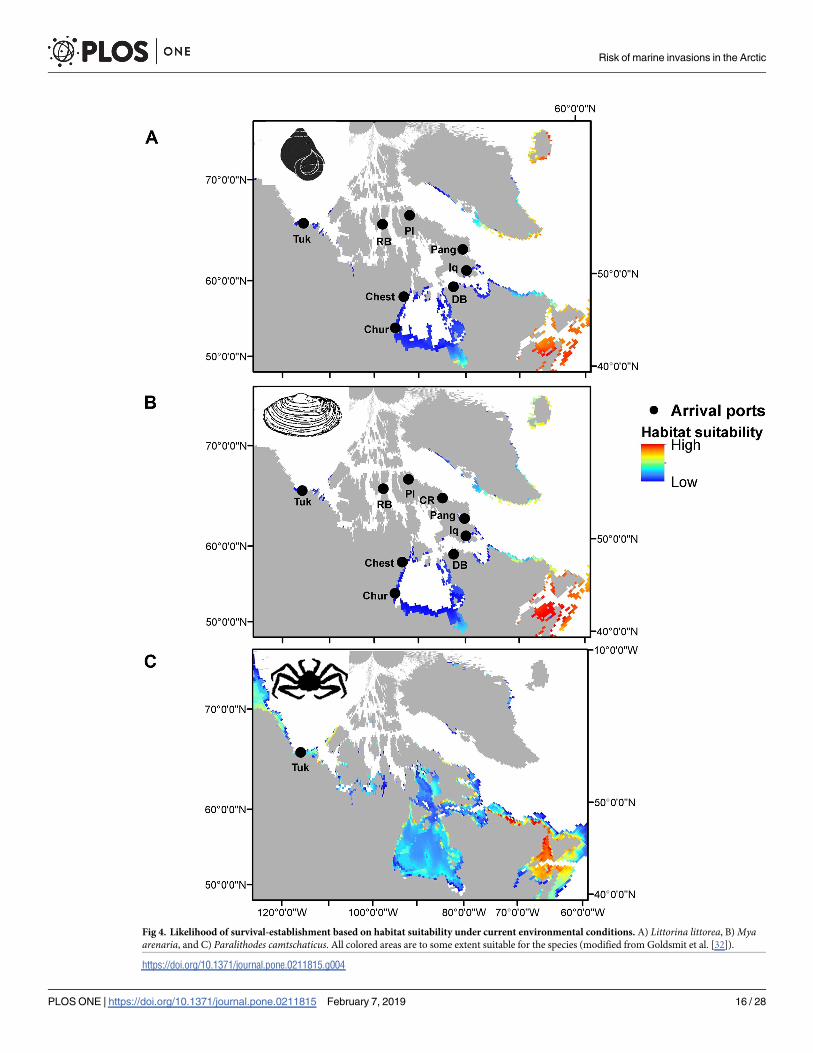
Fig 4. Likelihood of survival-establishment based on habitat suitability under current environmental conditions. A) Littorina littorea, B) Myaarenaria, and C) Paralithodes camtschaticus. All colored areas are to some extent suitable for the species (modified from Goldsmit et al. [32]).
https://doi.org/10.1371/journal.pone.0211815.g004
Risk of marine invasions in the Arctic
PLOS ONE | https://doi.org/10.1371/journal.pone.0211815 February 7, 2019 16 / 28
The uncertainty associated with establishment process was moderate (combination of mod-
erate uncertainty for likelihood of arrival and low uncertainty for likelihood of survival/estab-
lishment), and low for consequence of occurrence (combination of low uncertainty for impact
and low uncertainty for habitat sensitivity). Hence, the overall uncertainty for overall risk was
moderate.
Discussion
This relative risk assessment provides information on the potential risk of introduction, estab-
lishment, and impact for three species that are not, to our knowledge, currently present in the
Canadian Arctic, but for which there is likely suitable habitat for their survival and establish-
ment in the region. The methodology used in the present study is unique in that it considers
ballast water sources and the distribution of NIS (i.e., the potential availability of NIS propa-
gules in ballast water sources). Moreover, it evaluates the relative risk of the combination of
each port, year, and species considered, thus allowing for a more realistic, comprehensive eco-
logical risk assessment at the species-level. The results show that ports in the Canadian Arctic
have likely been exposed to propagules of NIS that are established in connected ports or BWE
locations, especially via domestic vessels. Although the current probabilities of establishment
for the species considered in this study are generally low, it is important to note that the conse-
quence of their establishment ranges from moderate to high for most ports considered in the
study. Thus, if vessel-specific ballast water discharges increase in the future, so too will relative
overall risk. This is a plausible scenario given that shipping activity in the Canadian Arctic is
expected to increase in the future due to the opening of seasonal trading routes through the
North West Passage and increasing resource exploitation in the region [25, 27, 28]. The level
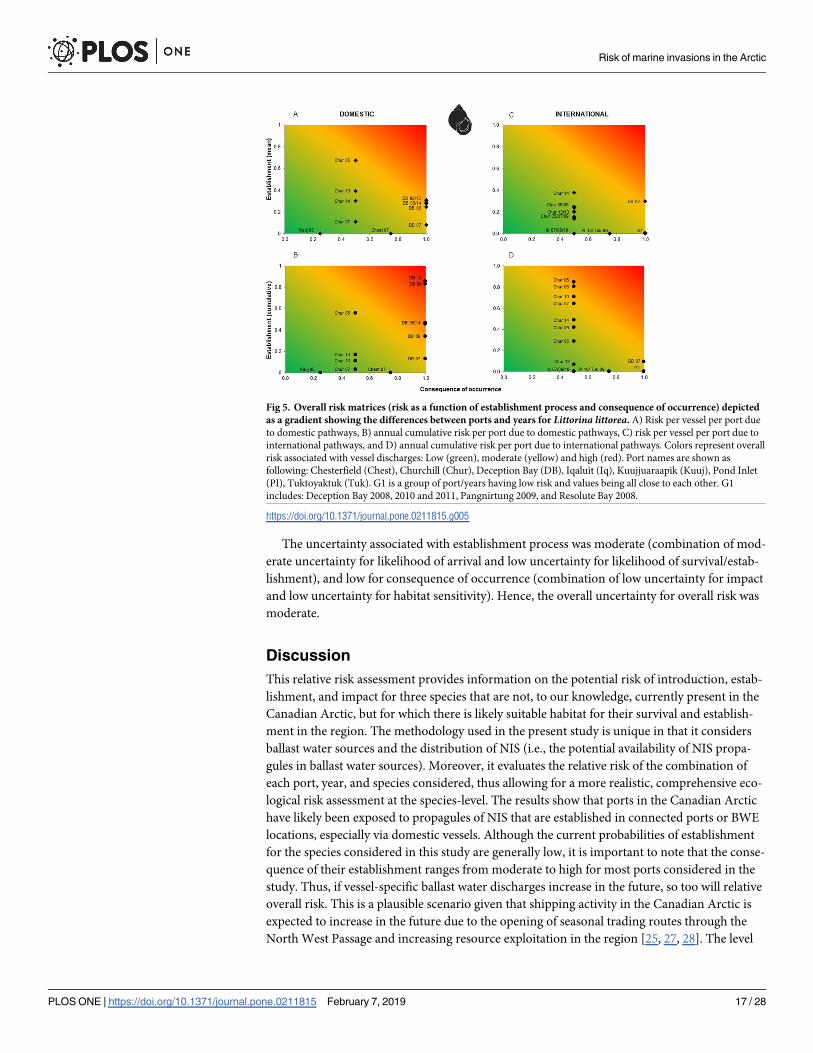
Fig 5. Overall risk matrices (risk as a function of establishment process and consequence of occurrence) depicted
as a gradient showing the differences between ports and years for Littorina littorea. A) Risk per vessel per port due
to domestic pathways, B) annual cumulative risk per port due to domestic pathways, C) risk per vessel per port due to
international pathways, and D) annual cumulative risk per port due to international pathways. Colors represent overall
risk associated with vessel discharges: Low (green), moderate (yellow) and high (red). Port names are shown as
following: Chesterfield (Chest), Churchill (Chur), Deception Bay (DB), Iqaluit (Iq), Kuujjuaraapik (Kuuj), Pond Inlet
(PI), Tuktoyaktuk (Tuk). G1 is a group of port/years having low risk and values being all close to each other. G1
includes: Deception Bay 2008, 2010 and 2011, Pangnirtung 2009, and Resolute Bay 2008.
https://doi.org/10.1371/journal.pone.0211815.g005
Risk of marine invasions in the Arctic
PLOS ONE | https://doi.org/10.1371/journal.pone.0211815 February 7, 2019 17 / 28
of risk could be also influenced by projected increases in the habitat suitability for these species
in the region as a result of global climate change [32].
Mean and cumulative ballast water discharges were temporally and spatially variable such
that potential for introduction was not uniform among Canadian Arctic ports, consistent with
findings of Chan et al. [108]. On the other hand, potential impacts varied more by species and
location. Thus, overall risk of vessel discharges may fluctuate according to location, time, and
species when all factors are considered. In general, the Hudson Bay Complex can currently be
considered to be at higher relative risk compared to the other regions in the Canadian Arctic.
This is due to the region receiving a greater proportion of vessels coming from regions where
the species of concern are present, the type of exchange performed, and because most vessels’
destination ports are in this area. Moreover, ports in the region have higher environmental
similarity with their connected ports relative to ports in other Canadian Arctic regions [60]
and thus could provide suitable habitat to potential NIS [32]. In particular, vessel discharges in
Deception Bay were found to pose greater overall risk across most years and species, relative to
other ports receiving a higher number of vessel discharges, such as Churchill, because of the
unique combination of ballast history/discharges and consequences of occurrence.
Management actions vary by vessel origin. International vessels are required to perform
MOE prior to entering Canadian waters. In contrast, as outlined in the Ballast Water Control
and Management Regulations (SOR/2011-237), domestic vessels operating within Canadian
waters are exempt from BWE requirements, although some do so on a voluntary basis.
Depending on the source port, domestic vessels that do not conduct BWE may transport large
volumes of ballast from other marine regions of Canada that may include some of the NIS con-
sidered in this study. Discharge of un-exchanged ballast water can thus represent an increase
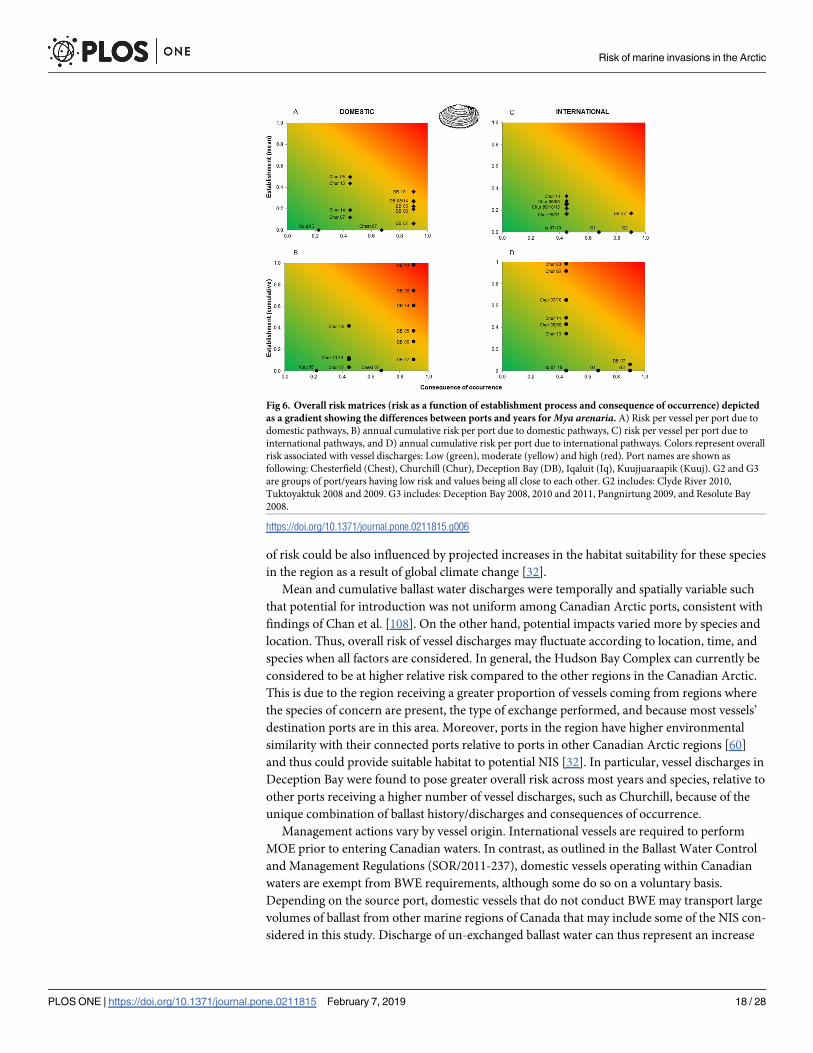
Fig 6. Overall risk matrices (risk as a function of establishment process and consequence of occurrence) depicted
as a gradient showing the differences between ports and years for Mya arenaria. A) Risk per vessel per port due to
domestic pathways, B) annual cumulative risk per port due to domestic pathways, C) risk per vessel per port due to
international pathways, and D) annual cumulative risk per port due to international pathways. Colors represent overall
risk associated with vessel discharges: Low (green), moderate (yellow) and high (red). Port names are shown as
following: Chesterfield (Chest), Churchill (Chur), Deception Bay (DB), Iqaluit (Iq), Kuujjuaraapik (Kuuj). G2 and G3
are groups of port/years having low risk and values being all close to each other. G2 includes: Clyde River 2010,
Tuktoyaktuk 2008 and 2009. G3 includes: Deception Bay 2008, 2010 and 2011, Pangnirtung 2009, and Resolute Bay
2008.
https://doi.org/10.1371/journal.pone.0211815.g006
Risk of marine invasions in the Arctic
PLOS ONE | https://doi.org/10.1371/journal.pone.0211815 February 7, 2019 18 / 28
in the probability of establishment of these NIS species due to a higher actual likelihood of
arrival [109]. However, domestic vessels originating from freshwater ports and undertaking
voluntary ballast water exchange in brackish/saline coastal waters may inadvertently increase
the probability of propagules of the marine species considered in the present study of arriving
and which would not otherwise have been present in the original freshwater ballast [63, 64].
Hence, risk is expected to vary among ports as a function of source, discharge, and treatment
of ballast water, in agreement with Verling et al. [110] and Cordell et al. [17]. However, suc-
cessful invasion may require multiple introductions [111] such that frequency of propagule
supply [112], together with the timing, volume, and location of ballast water release may play a
fundamental role. This is of importance as this study shows that some ports receive frequent
but low volumes of ballast water. The repetitive discharge of ballast water increases risk as
reflected by the annual cumulative ballast water discharge. These factors may all be more
important to introduction success than is the number of organisms contained in the released
water [113]. Notwithstanding this, the number of propagules released in a given event may
also be important, since the greater the number of individuals released, the more likely some
will survive stochastic events [97]. In any case, the combination of environmental conditions
must be appropriate for released individuals to establish [114].
Ballast water release and hull fouling are thought to be the most important vectors for the
introduction of aquatic organisms [13, 115]. Therefore, accurate ship history is of great impor-
tance to assess risk of ballast discharge. Importantly, distinguishing between the last port of
call and the ballast water source, as was done in this risk assessment, should logically increase
the accuracy of assessing the risk of any given discharge event and, when available, this infor-
mation should be used. This is particularly important when assessing the risk of a given species
for which distributional data is available to evaluate environmental similarity donor and
receiving ports [66]. If ballast origin is incorrectly attributed, risk assessments may be mislead-
ing. To our knowledge, no other pathway risk assessment study has considered ballast water
source differently from the source port. Another important component of ship history is tran-
sit time (time since ballast uptake until it is discharged) which impacts biological communities
in ballast water [116]. Natural mortality in ballast water tanks has been observed [14] and, all
else being equal, proximity of donor region and ballast water age will affect propagule condi-
tions [97], such that propagules that spend less time in ballast will be more able to survive tran-
sit and establish. Despite propagule mortality due to ballast water treatment, degrading
conditions, and natural senescence, some individuals may continue to survive transits, as
shown by sampling organisms in ballast water upon arrival in receiving ports [97]. In particu-
lar, benthic invertebrates that spend only part of their lives as plankton (e.g., gastropods and
bivalves) appear to be less vulnerable to mortality en route [98]. Thus, although it is not possi-
ble to predict when arrivals may occur, a precautionary approach is recommended given the
possibility of propagules being discharged in recipient ports [66]. This study has also shown
that some ports that receive international vessels do not receive any ballast water. Such vessels
most likely transport cargo to communities and appear to mainly originate from other cold/
Arctic regions. In fact, this type of behavior could mean that ballast is being taken up in Cana-
dian Arctic ports and transported elsewhere, thus becoming a potential source of NIS else-
where, as highlighted in Goldsmit et al. [38].
Predicting the establishment of a species in an environment needs to be carefully evaluated
by considering life stages, seasonal variations, and abiotic tolerances [54, 66]. The present risk
assessment took all these factors into consideration in the overall risk calculation by including
transit time relative to the length of planktonic stage for each species and the season when the
ballast water was discharged. These factors, when combined with the use of predicted habitat
suitability, should improve risk assessment precision, allowing analyses to be done at a species-
Risk of marine invasions in the Arctic
PLOS ONE | https://doi.org/10.1371/journal.pone.0211815 February 7, 2019 19 / 28
level. The present study assessed the overall risk of two mollusks (Littorina littorea and Myaarenaria) and one crustacean (Paralithodes camtschaticus). A common characteristic of these
three species is that they all include a long-lived feeding planktonic larval period. Larval ecol-
ogy (i.e., planktotrophic larvae versus short-lived non-feeding ones or lecitotrophic larvae)
may influence how dispersal rates vary for organisms with different reproductive strategies
[117]. The risk of introduction may be affected by the fact that some species can delay meta-
morphosis in the absence of suitable substrate for settlement, thus extending their planktonic
larval phase from weeks to months [118]. This may increase risk of introduction as such larvae
may survive extended periods by feeding in the water column. In addition, MOE is not always
effective for certain species, including L. littorea and M. arenaria [116]. For these two species
in the current risk assessment, the overall risk was higher for discharges from domestic rather
than international arrivals. Given that both are presently distributed in regions where the
coastal exchange of ballast water of domestic vessels was performed, the management action in
this case is likely increasing risk. Although ballast water exchange logically reduces the likeli-
hood of arrival of new species, in some cases, the efficacy of ballast water exchange as a mitiga-
tion strategy is questionable [4, 119–122]. In contrast, the likelihood of P. camtschaticus arrival
by domestic transits was null and was low for international transits, but the likelihood of sur-
vival-establishment and consequence of occurrence of this species is considered to be very
high, highlighting the need for extreme caution if the likelihood of arrival increases in the
future. Interestingly, trans-Arctic exchange of species is expected in the future [123] and envi-
ronmental niche modelling suggests that most Canadian Arctic regions are suitable for this
species [32]. Given these predictions, the risk of introduction could be then increased by
marine transportation or from natural dispersion via currents or migration. There is evidence
that some shallow water organisms have been able to extend their ranges from the Bering Sea
to the Atlantic as a results of warmer Arctic conditions [124].
In general, known consequences of a species in one location are good predictors of conse-
quences in new non-native ranges and this information is commonly used in risk assessments
[104, 125]. The most widely documented consequences include declines in native populations,
altered nutrient cycling, food web alterations with changes in competitor and consumer pres-
sure, and physical habitat changes [126–128]. There is no way to precisely predict the impact
that a given NIS will cause in a new environment unless it becomes established [66, 129]. The
consequence of occurrence assessed in the present study included the combination of the
known consequences of each species when it had established elsewhere and the sensitivity of
receiving habitats. Impacts are species-specific, while habitat sensitivity is port-specific. The
latter is essential to include in these types of assessment as it is reasoned that the severity of
consequences will also be a function of receiving habitat characteristics [130]. In the present
study, most ports showed moderate to high potential consequence of occurrence. If impacts
and habitat sensitivity remain constant, the overall risk will increase as the probability of estab-
lishment process increases, varying with ballast water source and the species assessed. This
demonstrates the importance of preventing the introduction of new species and highlights the
need for good management actions and preventive measures for ballast water management in
the region.
In this study, a particular effort was made to gather detailed information on the number of
arrivals, tank-specific ballast water sources, transit times, type of exchange performed and vol-
ume of ballast water discharged. However, it should be noted that, under the new IMO regula-
tions which came into force in September 2017 [131], ships arriving from outside of Canada
will be required to treat ballast with an approved treatment system (e.g., filtration, with chlori-
nation and/or UV irradiation). While this is not yet mandatory for all vessels, may not be effec-
tive for all species [92], and efficacy under different environmental conditions, particularly in
Risk of marine invasions in the Arctic
PLOS ONE | https://doi.org/10.1371/journal.pone.0211815 February 7, 2019 20 / 28
colder waters, is not well understood [132]. Under future conditions when more vessels are
conducting treatment and when efficacy is better understood, the methodology proposed in
the current assessment should be revised together with treatment-specific correction factors
used to weight the known volume of ballast water discharged and/or treated.
This assessment only considered risks associated with ballast water, however other vectors
directly related to shipping such as biofouling and ballast sediments, are also potential sources
of NIS. Thus, the actual overall risk for a species may be even greater if it is associated with hull
fouling [34, 133], hull refuges, including sea chests [134], or with ballast sediments, which have
been shown to include viable resting stages of many species with the potential of being released
during de-ballasting in the receiving port due to resuspension [135–137]. However the com-
plete history of these kinds of vectors should be captured (not only last port of call) and their
importance will depend on the species being assessed and their life histories. While an impor-
tant consideration, adequately characterizing history for these types of vectors requires going
back several steps (multiple ports of call) and was therefore beyond the scope of this study.
The ecological risk assessment protocol developed in the present study allowed for assess-
ment of ports through time and enabled comparison between species, shipping pathways, and
volume of ballast water discharge. Using this detailed methodology can help identify the relative
risks of key entry points and pathways for early detection monitoring [101]. Currently, many
countries are developing blacklists (i.e. lists of NIS with presumed invasive potential in the area
of interest) [138]. These lists are developed with the aim of preventing introductions of new
harmful species and regulating the spread of species that are already present in a given region
[139]. Recently, “grey” watch lists, which contain species of potential risk [140], have also been
developed. The present ecological risk assessment can provide a starting point to build a grey
watch list of NIS for the Canadian Arctic. This ecological risk assessment is the first to incorpo-
rate detailed shipping vector information at a species specific level, allowing for comparison of
risk across pathways and locations over time. Although, only three species were assessed in this
particular study, the proposed methodology may be used for any species of interest and provides
an ideal tool for comprehensively assessing the relative risk of potential NIS arriving in areas
that have not yet been invaded. Such information can help guide prevention and management
efforts in frontier regions where knowledge is lacking, such as the Canadian Arctic.
Supporting information
S1 Fig. Ports showing locations and habitat sensitivity according to the overlap of sensitiv-
ity variables.
(PDF)
S1 Table. Complete information on ballast water discharged at each Canadian Arctic port
through domestic vessels with ballast water from regions where Littorina littorea is pres-
ent. Volumes are given in metric tons (MT). Correction factor for ballast water exchange: 1
(no exchange), 0.1 (mid ocean exchange (MOE), considered for ships with a saline/brackish
ballast water source), 0.01 (MOE for ships with freshwater ballast water source).
(DOCX)
S2 Table. Complete information on ballast water discharged at each Canadian Arctic port
through domestic vessels with ballast water from regions where Mya arenaria is present.
Volumes are given in metric tons (MT). Correction factor for ballast water exchange: 1 (no
exchange), 0.1 (mid ocean exchange (MOE), considered for ships with a saline/brackish ballast
water source), 0.01 (MOE for ships with freshwater ballast water source).
(DOCX)
Risk of marine invasions in the Arctic
PLOS ONE | https://doi.org/10.1371/journal.pone.0211815 February 7, 2019 21 / 28
S3 Table. Complete information on ballast water discharged at each Canadian Arctic port
through international vessels with ballast water from regions where Littorina littorea is
present. Volumes are given in metric tons (MT). Correction factor for ballast water exchange:
1 (no exchange), 0.1 (mid ocean exchange (MOE), considered for ships with a saline/brackish
ballast water source), 0.01 (MOE for ships with freshwater ballast water source).
(DOCX)
S4 Table. Complete information on ballast water discharged at each Canadian Arctic port
through international vessels with ballast water from regions where Mya arenaria is pres-
ent. Volumes are given in metric tons (MT). Correction factor for ballast water exchange: 1
(no exchange), 0.1 (mid ocean exchange (MOE), considered for ships with a saline/brackish
ballast water source), 0.01 (MOE for ships with freshwater ballast water source).
(DOCX)
S5 Table. Complete information on ballast water discharged at each Canadian Arctic port
through international vessels with ballast water from regions where Paralithodes camtschati-cus is present. Volumes are given in metric tons (MT). Correction factor for ballast water
exchange: 1 (no exchange), 0.1 (mid ocean exchange (MOE), considered for ships with a saline/
brackish ballast water source), 0.01 (MOE for ships with freshwater ballast water source).
(DOCX)
S6 Table. Potential impact of the species assessed according to known effects in invaded
environments.
(DOCX)
Acknowledgments
Special thanks to Paul Mudroch from Transport Canada, to FedNav, and to Nathalie Simard
from Institut Maurice Lamontagne, Fisheries and Oceans Canada for providing detailed ship-
ping data and providing general knowledge. The author sequence follows the ‘first-last-
author-emphasis’ norm.
Author Contributions
Conceptualization: Jesica Goldsmit, Christopher McKindsey, Kimberly L. Howland.
Formal analysis: Jesica Goldsmit.
Funding acquisition: Philippe Archambault, Kimberly L. Howland.
Methodology: Jesica Goldsmit, Christopher McKindsey, Kimberly L. Howland.
Resources: Philippe Archambault.
Supervision: Philippe Archambault, Kimberly L. Howland.
Visualization: Jesica Goldsmit.
Writing – original draft: Jesica Goldsmit.
Writing – review & editing: Jesica Goldsmit, Christopher McKindsey, Philippe Archambault,
Kimberly L. Howland.
References1. Stachowicz JJ, Terwin JR, Whitlatch RB, Osman RW. Linking climate change and biological invasions:
ocean warming facilitates nonindigenous species invasions. Proc Natl Acad Sci. 2002; 99(24):15497–
500. https://doi.org/10.1073/pnas.242437499 PMID: 12422019
Risk of marine invasions in the Arctic
PLOS ONE | https://doi.org/10.1371/journal.pone.0211815 February 7, 2019 22 / 28
2. Occhipinti-Ambrogi A. Global change and marine communities: alien species and climate change. Mar
Pollut Bull. 2007; 55(7):342–52.
3. Molnar JL, Gamboa RL, Revenga C, Spalding MD. Assessing the global threat of invasive species to
marine biodiversity. Front Ecol Environ. 2008; 6(9):485–92.
4. Carlton JT. Transoceanic and interoceanic dispersal of coastal marine organisms: the biology of bal-
last water. Oceanography and Marine Biology. 1985; 23:313–71.
5. Kolar CS, Lodge DM. Ecological predictions and risk assessment for alien fishes in North America.
Science. 2002; 298(5596):1233–6. https://doi.org/10.1126/science.1075753 PMID: 12424378
6. Herborg L-M, Jerde CL, Lodge DM, Ruiz GM, MacIsaac HJ. Predicting invasion risk using measures
of introduction effort and environmental niche models. Ecol Appl. 2007; 17(3):663–74. PMID:
17494387
7. Ruiz GM, Fofonoff PW, Carlton JT, Wonham MJ, Anson HH. Invasion of coastal marine communities
in North America: Apparent patterns, processes, and biases. Annu Rev Ecol Syst. 2000; 31:481–531.
8. Coutts ADM, Dodgshun TJ. The nature and extent of organisms in vessel sea-chests: a protected
mechanism for marine bioinvasions. Mar Pollut Bull. 2007; 54(7):875–86. https://doi.org/10.1016/j.
marpolbul.2007.03.011 PMID: 17498747
9. Minchin D, Gollasch S, Cohen AN, Hewitt CL, Olenin S. Characterizing vectors of marine invasion.
Biological invasions in marine ecosystems: Springer; 2009. p. 109–16.
10. Kaluza P, Kolzsch A, Gastner MT, Blasius B. The complex network of global cargo ship movements.
Journal of the Royal Society Interface. 2010; 7(48):1093–103.
11. Xu J, Wickramarathne TL, Chawla NV, Grey EK, Steinhaeuser K;, Keller RP, et al., editors. Improving
management of aquatic invasions by integrating shipping network, ecological, and environmental
data: data mining for social good. In Proceedings of the 20th ACM SIGKDD international conference
on Knowledge discovery and data mining. 2014. pp. 1699–1708.
12. Thresher RE, Kuris AM. Options for managing invasive marine species. Biol Invasions. 2004; 6
(3):295–300.
13. Ruiz GM, Fofonoff PW, Steves BP, Carlton JT. Invasion history and vector dynamics in coastal marine
ecosystems: A North American perspective. Aquat Ecosyst Health Manage. 2015; 18(3):299–311.
14. Simard N, Plourde S, Gilbert M, Gollasch S. Net efficacy of open ocean ballast water exchange on
plankton communities. J Plankton Res. 2011; 33(9):1378–95.
15. Ruiz GM, Reid DF. Current state of understanding about the effectiveness of ballast water exchange
(BWE) in reducing aquatic nonindigenous species (ANS) introductions to the Great Lakes Basin and
Chesapeake Bay, USA: synthesis and analysis of existing information: NOAA Tech. Memo. GLERL-
142: p. xiv + 126 2007.
16. Bailey SA, Deneau MG, Jean L, Wiley CJ, Leung B, MacIsaac HJ. Evaluating efficacy of an environ-
mental policy to prevent biological invasions. Environ Sci Technol. 2011; 45(7):2554–61. https://doi.
org/10.1021/es102655j PMID: 21388172
17. Cordell JR, Lawrence DJ, Ferm NC, Tear LM, Smith SS, Herwig RP. Factors influencing densities of
non-indigenous species in the ballast water of ships arriving at ports in Puget Sound, Washington,
United States. Aquat Conserv: Mar Freshwat Ecosyst. 2009; 19(3):322–43.
18. Doney SC, Ruckelshaus M, Emmett Duffy J, Barry JP, Chan F, English CA, et al. Climate change
impacts on marine ecosystems. Ann Rev Mar Sci. 2012; 4(1):11–37.
19. Barnhart KR, Miller CR, Overeem I, Kay JE. Mapping the future expansion of Arctic open water. Nat
Clim Chang. 2016; 6(3):280–5.
20. Meier WN, Hovelsrud GK, Oort BEH, Key JR, Kovacs KM, Michel C, et al. Arctic sea ice in transforma-
tion: A review of recent observed changes and impacts on biology and human activity. Rev Geophys.
2014; 52(3):185–217.
21. Stroeve J, Serreze M, Holland M, Kay J, Malanik J, Barrett A. The Arctic’s rapidly shrinking sea ice
cover: a research synthesis. Clim Change. 2012; 110(3–4):1005–27.
22. Stroeve J, Holland MM, Meier W, Scambos T, Serreze M. Arctic sea ice decline: Faster than forecast.
Geophys Res Lett. 2007;34(9).
23. Kirchmeier-Young MC, Zwiers FW, Gillett NP. Attribution of extreme events in Arctic sea ice extent. J
Clim. 2017; 30(2):553–71.
24. Drake JM, Lodge DM. Global hot spots of biological invasions: Evaluating options for ballast–water
management. Proceedings of the Royal Society of London B: Biological Sciences. 2004; 271
(1539):575–80.
25. Smith LC, Stephenson SR. New Trans-Arctic shipping routes navigable by midcentury. Proc Natl
Acad Sci. 2013; 110(13):E1191–E5. https://doi.org/10.1073/pnas.1214212110 PMID: 23487747
Risk of marine invasions in the Arctic
PLOS ONE | https://doi.org/10.1371/journal.pone.0211815 February 7, 2019 23 / 28
26. Miller AW, Ruiz GM. Arctic shipping and marine invaders. Nat Clim Chang. 2014; 4(6):413–6.
27. Gavrilchuk K, Lesage V. Large-scale marine development projects (mineral, oil and gas, infrastruc-
ture) proposed for Canada’s North. Can Tech Rep Fish Aquat Sci. 2014.
28. Melia N, Haines K, Hawkins E. Sea ice decline and 21st century trans-Arctic shipping routes. Geophys
Res Lett. 2016; 43(18):9720–8.
29. Pizzolato L, Howell SEL, Dawson J, Laliberte F, Copland L. The influence of declining sea ice on ship-
ping activity in the Canadian Arctic. Geophys Res Lett. 2016; 43(23):12,146–12,54.
30. Niimi AJ. Environmental and economic factors can increase the risk of exotic species introductions to
the Arctic region through increased ballast water discharge. Environ Manage. 2004; 33(5):712–8.
https://doi.org/10.1007/s00267-004-3072-4 PMID: 15503388
31. Ware C, Berge J, Sundet JH, Kirkpatrick JB, Coutts ADM, Jelmert A, et al. Climate change, non-indig-
enous species and shipping: assessing the risk of species introduction to a high-Arctic archipelago.
Divers Distrib. 2014; 20(1):10–9.
32. Goldsmit J, Archambault P, Chust G, Villarino E, Liu G, Lukovich JV, et al. Projecting present and
future habitat suitability of ship-mediated aquatic invasive species in the Canadian Arctic. Biol Inva-
sions. 2018; 20(2):501–17.
33. Streftaris N, Zenetos A, Papathanassiou E. Globalisation in marine ecosystems: the story of non-indig-
enous marine species across European seas. Oceanogr Mar Biol Annu Rev. 2005; 43:419–53.
34. Chan FT, MacIsaac HJ, Bailey SA. Relative importance of vessel hull fouling and ballast water as
transport vectors of nonindigenous species to the Canadian Arctic. Can J Fish Aquat Sci. 2015; 72
(8):1230–42.
35. Chan FT, Stanislawczyk K, Sneekes AC, Dvoretsky A, Gollasch S, Minchin D, et al. Climate change
opens new frontiers for marine species in the Arctic: Current trends and future invasion risks. Global
Change Biol. 2019; 25(1):25–38.
36. Mathieson AC, Moore GE, Short FT. A floristic comparison of seaweeds from James Bay and three
contiguous northeastern Canadian Arctic sites. Rhodora. 2010; 112(952):396–434.
37. Golder. (Golder Associates Ltd.) 2017 marine environmental effects monitoring program (MEEMP)
and aquatic invasive species (AIS) monitoring program. Report No. 1663724-048-R-Rev0. Mary River
Project; submitted to Baffinland Iron Mines Corporation, Oakville, ON. 2018. Available from http://
www.baffinland.com/document-portal-new/?cat=4&archive=1&lang=en
38. Goldsmit J, Howland KL, Archambault P. Establishing a baseline for early detection of non-indigenous
species in ports of the Canadian Arctic. Aquat Invasions. 2014; 9(3):327–42.
39. Gıslason OS, Halldorsson HP, Palsson MF, Palsson S, Davıðsdottir B, Svavarsson J. Invasion of the
Atlantic rock crab (Cancer irroratus) at high latitudes. Biol Invasions. 2014; 16(9):1865–77.
40. Svavarsson J, Dungal P. Leyndardomar sjavarins við Island. Gloð, editor. Reykjavık2008.
41. Ashton GV, Riedlecker EI, Ruiz GM. First non-native crustacean established in coastal waters of
Alaska. Aquatic Biol. 2008; 3(2):133–7.
42. Lambert G, Shenkar N, Swalla BJ. First Pacific record of the north Atlantic ascidian Molgula citrina-
bioinvasion or circumpolar distribution. Aquat Invasions. 2010; 5(4):369–78.
43. Hines AH, Ruiz GM, Fofonoff PW. Summary of NIS in Prince William Sound and Alaska. Biological
invasions of cold-water coastal ecosystems: ballast-mediated introductions in Port Valdez / Prince Wil-
liam Sound, Alaska. Prince William Sound: Regional Citizens’ Advisory Council of Prince William
Sound; 2000.
44. Ruiz GM, Hewitt CL. Latitudinal patterns of biological invasions in marine ecosystems: a polar per-
spective. Smithsonian Institution Scholarly Press, Washington DC. 2009:347–58.
45. Alvsvåg J, Agnalt AL, Jørstad KE. Evidence for a permanent establishment of the snow crab (Chionoe-
cetes opilio) in the Barents Sea. Biol Invasions. 2009; 11(3):587–95.
46. MacDonald IR, Bluhm BA, Iken K, Gagaev S, Strong S. Benthic macrofauna and megafauna assem-
blages in the Arctic deep-sea Canada Basin. Deep Sea Res Part 2 Top Stud Oceanogr. 2010; 57
(1):136–52.
47. Landeira JM, Matsuno K, Tanaka Y, Yamaguchi A. First record of the larvae of tanner crab Chionoe-
cetes bairdi in the Chukchi Sea: A future northward expansion in the Arctic? Polar Science. 2018;
16:86–9.
48. Archambault P, Snelgrove PVR, Fisher JAD, Gagnon JM, Garbary DJ, Harvey M, et al. From sea to
sea: Canada’s three oceans of biodiversity. PLoS ONE. 2010; 5(8):e12182. https://doi.org/10.1371/
journal.pone.0012182 PMID: 20824204
Risk of marine invasions in the Arctic
PLOS ONE | https://doi.org/10.1371/journal.pone.0211815 February 7, 2019 24 / 28
49. Piepenburg D, Archambault P, Ambrose WG Jr, Blanchard AL, Bluhm BA, Carroll ML, et al. Towards a
pan-Arctic inventory of the species diversity of the macro-and megabenthic fauna of the Arctic shelf
seas. Mar Biodiv. 2011; 41(1):51–70.
50. Conservation of Arctic Flora and Fauna (CAFF). Arctic biodiversity assessment: status and trends in
Arctic biodiversity. Akureyri: CAFF; 2013.
51. Force USANST. Report to the aquatic nuisance species task force. Generic nonindigenous aquatic
organisms risk analysis review process (For Estimating Risk Associated with the Introduction of Nonin-
digenous Aquatic Organisms and how to Manage for that Risk). US Fish & Wildlife Service and
National Oceanic & Atmospheric Administration. Risk Assessment and Management Committee.
1996.
52. Hewitt CL, Hayes KR. Risk assessment of marine biological invasions. Invasive aquatic species of
Europe Distribution, impacts and management: Springer; 2002. p. 456–66.
53. Ricciardi A, Rasmussen JB. Predicting the identity and impact of future biological invaders: A priority
for aquatic resource management. Can J Fish Aquat Sci. 1998; 55(7):1759–65.
54. Barry SC, Hayes KR, Hewitt CL, Behrens HL, Dragsund E, Bakke SM. Ballast water risk assessment:
principles, processes, and methods. ICES J Mar Sci. 2008; 65(2):121–31.
55. Kumschick S, Gaertner M, VilàM, Essl F, Jeschke JM, Pysek P, et al. Ecological impacts of alien spe-
cies: quantification, scope, caveats, and recommendations. Bioscience. 2015; 65(1):55–63.
56. Kumschick S, Richardson DM. Species-based risk assessments for biological invasions: advances
and challenges. Divers Distrib. 2013; 19(9):1095–105.
57. Moore AM, Vercaemer B, DiBacco C, Sephton D, Ma KCK. Invading Nova Scotia: first records of
Didemnum vexillum Kott, 2002 and four more non-indigenous invertebrates in 2012 and 2013. BioIn-
vasions Rec. 2014; 3(4):225–34.
58. Locke A. A screening procedure for potential tunicate invaders of Atlantic Canada. Aquat Invasions.
2009; 4(1):71–9.
59. Spalding MD, Fox HE, Allen GR, Davidson N, Ferdaña ZA, Finlayson MAX, et al. Marine ecoregions
of the world: a bioregionalization of coastal and shelf areas. Bioscience. 2007; 57(7):573–83.
60. Chan FT, Bronnenhuber JE, Bradie JN, Howland KL, Simard N, Bailey SA. Risk Assessment for ship-
mediated introductions of aquatic nonindigenous species to the Canadian Arctic. Can Sci Advis Sec
Res Doc. 2012.
61. Arctic-Council. Arctic Marine Shipping Assessment. 2009. Available from: http://library.arcticportal.
org/id/eprint/1400
62. Têtu P-L, Pelletier J-F, Lasserre F. The mining industry in Canada north of the 55th parallel: a maritime
traffic generator? Polar Geogr. 2015; 38(2):107–22.
63. Laget F. Transport d’espèces de dinoflagelles potentiellement non-indigènes dans l’Arctique cana-
dien, suite au deversement des eaux de ballast par un navire domestique. Rimouski: Universite du
Quebec à Rimouski. 2017.
64. Tremblay P. Evaluation du risque potentiel d’introduction d’espèces non-indigènes de mesozooplanc-
ton suite au deversement des eaux de ballast d’un navire domestique dans l’Arctique canadien.
Rimouski: Univeriste du Quebec à Rimouski. 2017.
65. Aarluk-Consulting, Gartner Lee Limited, Chris Anderson. Strategic plan for the Iqaluit deepwater port
project. 2005. Available from: http://www.tunngavik.com/documents/publications
66. David M, Gollasch S, Leppakoski E, Hewitt C. Risk assessment in ballast water management. Global
Maritime Transport and Ballast Water Management: Springer; 2015. pp. 133–69.
67. Bouma TJ, Olenin S, Reise K, Ysebaert T. Ecosystem engineering and biodiversity in coastal sedi-
ments: posing hypotheses. Helgol Mar Res. 2009; 63(1):95–106.
68. Murphy DJ. A comparative study of the freezing tolerances of the marine snails Littorina littorea (L.)
and Nassarius obsoletus (Say). Physiol Zool. 1979; 52(2):219–30.
69. Carlton JT. Introduced marine and estuarine mollusks of North America: an end-of-the-20th-century
perspective. J Shellfish Res. 1992; 11(2):489–505.
70. Chase ME, Thomas MLH. The effect of the rate and onset of temperature increase on spawning of the
periwinkle, Littorina littorea (L.). J Exp Mar Biol Ecol. 1995; 186(2):277–87.
71. Reid DG. Systematics and evolution of Littorina: Ray society London; 1996.
72. Chang AL, Blakeslee AMH, Miller AW, Ruiz GM. Establishment failure in biological invasions: a case
history of Littorina littorea in California, USA. PLoS ONE. 2011; 6(1):e16035. https://doi.org/10.1371/
journal.pone.0016035 PMID: 21264336
73. Brawley SH, Coyer JA, Blakeslee AMH, Hoarau G, Johnson LE, Byers JE, et al. Historical invasions of
the intertidal zone of Atlantic North America associated with distinctive patterns of trade and
Risk of marine invasions in the Arctic
PLOS ONE | https://doi.org/10.1371/journal.pone.0211815 February 7, 2019 25 / 28
emigration. Proc Natl Acad Sci. 2009; 106(20):8239–44. https://doi.org/10.1073/pnas.0812300106
PMID: 19416814
74. Fretter V, Graham A. The prosobranch molluscs of Britain and Denmark. J Moll Stud (Suppl. 15).
1985.
75. Thorson G, Jørgensen CB. Reproduction and larval development of Danish marine bottom inverte-
brates. Medd Komm Dan Fisk Havunders Ser Plankt, 1946; 4:1–523.
76. Morgan RP, Block SB, Ulanowicz NI, Buys C. Genetic variation in the soft-shelled clam, Mya arenaria.
Estuaries. 1978; 1(4):255–8.
77. Goshima S. Population dynamics of the soft clam, Mya arenaria L., with special reference to its life his-
tory pattern. Publ Amakusa Mar Biol Lab. 1982; 6:119–65.
78. Englund VPM, Heino MP. In situ measurement of seasonal variation in burial depth of Mya arenaria
Linne. J Molluscan Stud. 1994; 60(4):465–7.
79. Strasser M. Mya arenaria—an ancient invader of the North Sea coast. Helgolander Meeresuntersu-
chungen. 1998; 52(3–4):309–24.
80. Obolewski K, Piesik Z. Mya arenaria (L.) in the Polish Baltic Sea Coastal (Kołobrzeg-Władysławowo).
Balt Coast Zone. 2005; 9:13–27.
81. Byers JE. Marine reserves enhance abundance but not competitive impacts of a harvested nonindige-
nous species. Ecology. 2005; 86(2):487–500.
82. Petersen JK, Hansen JW, Laursen MB, Clausen P, Carstensen J, Conley DJ. Regime shift in a coastal
marine ecosystem. Ecol Appl. 2008; 18(2):497–510. PMID: 18488611
83. Carlton JT. The Inviolate Sea? Charles Elton and Biological Invasions in the World’s Oceans. Fifty
Years of Inavasion Ecology. 2011: 25.
84. Orlov YI, Ivanov BG. On the introduction of the Kamchatka king crab Paralithodes camtschatica (Dec-
apoda: Anomura: Lithodidae) into the Barents Sea. Mar Biol. 1978; 48(4):373–5.
85. Rodin VE. Population biology of the king crab Paralithodes camtschatica Tilesius in the North Pacific
Ocean. Report AK-SG-90-04. University of Alaska. 1989.
86. Pavlova LV, Britayev TA, Rzhavsky AV, editors. Benthos elimination by juvenile red king crabs Para-
lithodes camtschaticus (Tilesius, 1815) in the Barents Sea coastal zone: Experimental data. Springer.
2007.
87. Oug E, Cochrane SKJ, Sundet JH, Norling K, Nilsson HC. Effects of the invasive red king crab (Para-
lithodes camtschaticus) on soft-bottom fauna in Varangerfjorden, northern Norway. Mar Biodiv. 2011;
41(3):467–79.
88. Gibbs MT, Browman HI. Risk assessment and risk management: a primer for marine scientists. ICES
J Mar Sci. 2015:fsu232.
89. Hewitt CL, Campbell ML, Gollasch S. Alien species in aquaculture: considerations for responsible use:
IUCN; 2006.
90. Therriault TW, Herborg LM, Locke A, McKindsey CW. Risk assessment for European green crab (Car-
cinus maenas) in Canadian waters. Can Sci Advis Sec Res Doc. 2008.
91. Mandrak NE, Cudmore B, Chapman PM. National detailed-level risk assessment guidelines: assess-
ing the biological risk of aquatic invasive species in Canada. Can Sci Advis Sec Res Doc. 2011.
92. Casas-Monroy O, Linley RD, Adams JK, Chan FT, Drake DAR, Bailey SA. Relative invasion risk for
plankton across marine and freshwater systems: Examining efficacy of proposed international ballast
water discharge standards. PLoS ONE. 2015; 10(3):e0118267. https://doi.org/10.1371/journal.pone.
0118267 PMID: 25763859
93. McCollin T, Shanks AM, Dunn J. Changes in zooplankton abundance and diversity after ballast water
exchange in regional seas. Mar Pollut Bull. 2008; 56(5):834–44. https://doi.org/10.1016/j.marpolbul.
2008.02.004 PMID: 18348891
94. Ruiz GM, Smith G. Biological study of container vessels at the Port of Oakland. Final report. 2005.
95. Gray DK, Johengen TH, Reid DF, MacIsaac HJ. Efficacy of open-ocean ballast water exchange as a
means of preventing invertebrate invasions between freshwater ports. Limnol Oceanogr. 2007; 52
(6):2386–97.
96. Keller RP, Drake JM, Drew MB, Lodge DM. Linking environmental conditions and ship movements to
estimate invasive species transport across the global shipping network. Divers Distrib. 2011; 17
(1):93–102.
97. Lockwood JL, Hoopes MF, Marchetti MP. Invasion ecology: John Wiley & Sons; 2007.
98. Wonham MJ, Walton WC, Ruiz GM, Frese AM, Galil BS. Going to the source: role of the invasion path-
way in determining potential invaders. Mar Ecol Prog Ser. 2001; 215(1–12).
Risk of marine invasions in the Arctic
PLOS ONE | https://doi.org/10.1371/journal.pone.0211815 February 7, 2019 26 / 28
99. Phillips SJ, Anderson RP, Schapire RE. Maximum entropy modeling of species geographic distribu-
tions. Ecol Model. 2006; 190(3):231–59.
100. Elith J, Phillips SJ, Hastie T, Dudık M, Chee YE, Yates CJ. A statistical explanation of MaxEnt for ecol-
ogists. Divers Distrib. 2011; 17(1):43–57.
101. Mandrak NE, Cudmore B. Risk assessment: Cornerstone of an aquatic invasive species program.
Aquat Ecosyst Health Manage. 2015; 18(3):312–20.
102. Simard N, Hardy M. The Laurentian Channel as an alternative ballast water exchange zone: risks,
analysis and recommendations. Can Sci Advis Sec Res Doc 2004.
103. Ricciardi A, Hoopes MF, Marchetti MP, Lockwood JL. Progress toward understanding the ecological
impacts of nonnative species. Ecol Monogr. 2013; 83(3):263–82.
104. Hayes KR, Barry SC. Are there any consistent predictors of invasion success? Biol Invasions. 2008;
10(4):483–506.
105. Kenchington E, Link H, Roy V, Archambault P, Siferd T, Treble M, et al. Identification of mega- and
macrobenthic ecologically and biologically significant areas (EBSAs) in the Hudson Bay Complex, the
western and eastern Canadian Arctic. DFO, Ottawa. 2011.
106. Stewart DB, Nudds SH, Howland KL, Hannah CG, Higdon JW. An ecological and oceanographical
assessment of alternate ballast water exchange zones in the Canadian eastern Arctic. Can Sci Advis
Sec Res Doc. 2015.
107. Goldsmit J, Nudds SH, Stewart DB, Higdon JW, Hannah CG, Howland KL. Where else? Assessing
zones of alternate ballast water exchange in the Canadian eastern Arctic. Mar Pollut Bull. 2019;
139:74–90. https://doi.org/10.1016/j.marpolbul.2018.11.062 PMID: 30686452
108. Chan F, Bailey S, Wiley C, MacIsaac H. Relative risk assessment for ballast-mediated invasions at
Canadian Arctic ports. Biol Invasions. 2013; 15(2):295–308.
109. DiBacco C, Humphrey DB, Nasmith LE, Levings CD. Ballast water transport of non-indigenous zoo-
plankton to Canadian ports. ICES J Mar Sci. 2012; 69(3):483–91.
110. Verling E, Ruiz GM, Smith LD, Galil B, Miller AW, Murphy KR. Supply-side invasion ecology: charac-
terizing propagule pressure in coastal ecosystems. Proc R Soc Lond B Biol Sci. 2005; 272
(1569):1249–57.
111. Lockwood JL, Cassey P, Blackburn T. The role of propagule pressure in explaining species invasions.
Trends Ecol Evol. 2005; 20(5):223–8. https://doi.org/10.1016/j.tree.2005.02.004 PMID: 16701373
112. Hedge LH, O’Connor WA, Johnston EL. Manipulating the intrinsic parameters of propagule pressure:
implications for bio-invasion. Ecosphere. 2012; 3(6):1–13.
113. Drake JM, Lodge DM, Lewis M. Theory and preliminary analysis of species invasions from ballast
water: controlling discharge volume and location. Am Midl Nat. 2005; 154(2):459–70.
114. Carlton JT. Pattern, process, and prediction in marine invasion ecology. Biol Conserv. 1996; 78(1):97–
106.
115. Ruiz GM, Carlton JT, Grosholz ED, Hines AH. Global invasions of marine and estuarine habitats by
non-indigenous species: mechanisms, extent, and consequences. Am Zool. 1997; 37(6):621–32.
116. Briski E, Ghabooli S, Bailey SA, MacIsaac HJ. Invasion risk posed by macroinvertebrates transported
in ships’ ballast tanks. Biol Invasions. 2012; 14(9):1843–50.
117. Johannesson K. The paradox of Rockall: why is a brooding gastropod (Littorina saxatilis) more wide-
spread than one having a planktonic larval dispersal stage (L. littorea)? Mar Biol. 1988; 99(4):507–13.
118. Thorson G. Reproductive and larval ecology of marine bottom invertebrates. Biol Rev. 1950; 25(1):1–
45. PMID: 24537188
119. Carlton JT. Introduced species in US coastal waters. PewOceans Commission, Arlington, Virginia,
USA. 2001.
120. Carver CE, Mallet AL. An assessment of the risk of ballast water-mediated introduction of non-indige-
nous phytoplankton and zooplankton into Atlantic Canadian waters. Dartmouth, NS: Transport Can-
ada. 2002.
121. Gollasch S, Lenz J, Dammer M, Andres H-G. Survival of tropical ballast water organisms during a
cruise from the Indian Ocean to the North Sea. J Plankton Res. 2000; 22(5):923–37.
122. McCollin T, Shanks AM, Dunn J. The efficiency of regional ballast water exchange: Changes in phyto-
plankton abundance and diversity. Harmful Algae. 2007; 6(4):531–46.
123. Renaud PE, Sejr MK, Bluhm BA, Sirenko B, Ellingsen IH. The future of Arctic benthos: expansion,
invasion, and biodiversity. Prog Oceanogr. 2015; 139:244–57.
124. Vermeij GJ, Roopnarine PD. The coming Arctic invasion. Science. 2008; 321(5890):780–1. https://doi.
org/10.1126/science.1160852 PMID: 18687946
Risk of marine invasions in the Arctic
PLOS ONE | https://doi.org/10.1371/journal.pone.0211815 February 7, 2019 27 / 28
125. Bomford M. Risk assessment models for establishment of exotic vertebrates in Australia and New
Zealand: Invasive Animals Cooperative Research Centre Canberra, Australia; 2008.
126. Falk-Petersen J, Renaud P, Anisimova N. Establishment and ecosystem effects of the alien invasive
red king crab (Paralithodes camtschaticus) in the Barents Sea–a review. ICES Jf Mar Sci. 2011; 68
(3):479–88.
127. Sousa R, Gutierrez JL, Aldridge DC. Non-indigenous invasive bivalves as ecosystem engineers. Biol
Invasions. 2009; 11(10):2367–85.
128. Papacostas KJ, Rielly-Carroll EW, Georgian SE, Long DJ, Princiotta SD, Quattrini AM, et al. Biological
mechanisms of marine invasions. Mar Ecol Prog Ser. 2017; 565:251–68.
129. Harley CDG, Anderson KM, Lebreton CAM, MacKay A, Ayala-Dıaz M, Chong SL, et al. The introduc-
tion of Littorina littorea to British Columbia, Canada: potential impacts and the importance of biotic
resistance by native predators. Mar Biol. 2013; 160(7):1529–41.
130. Drolet D, DiBacco C, Locke A, McKenzie CH, McKindsey CW, Moore AM, et al. Evaluation of a new
screening-level risk assessment tool applied to non-indigenous marine invertebrates in Canadian
coastal waters. Biol Invasions. 2016; 18(1):279–94.
131. IMO. International Convention for the Control and Management of Ships’ Ballast Water and Sedi-
ments, 2004 (BWM 2004). Status of IMO treaties [14 May 2018], p. 506–513. 2018
132. Jing L, Chen B, Zhang B, Peng H. A review of ballast water management practices and challenges in
harsh and arctic environments. Environ Rev. 2012; 20(2):83–108.
133. Williams SL, Davidson IC, Pasari JR, Ashton GV, Carlton JT, Crafton RE, et al. Managing multiple vec-
tors for marine invasions in an increasingly connected world. Bioscience. 2013; 63(12):952–66.
134. Frey MA, Simard N, Robichaud DD, Martin JL, Therriault TW. Fouling around: vessel sea-chests as a
vector for the introduction and spread of aquatic invasive species. Manag Biol Invasion. 2014; 5
(1):21–30.
135. Villac MC, Kaczmarska I. Estimating propagule pressure and viability of diatoms detected in ballast
tank sediments of ships arriving at Canadian ports. Mar Ecol Prog Ser. 2011; 425:47–61.
136. Casas-Monroy O, Roy S, Rochon A. Ballast sediment-mediated transport of non-indigenous species
of dinoflagellates on the East Coast of Canada. Aquat Invasion. 2011; 6:231–48.
137. Villac MC, Persich G, Fernandes L, Paranhos R, Bonecker S, Garcia V, et al. Ballast water exchange:
testing the dilution method. Harmful Algae. 2000:470–3.
138. Garcıa-de-Lomas J, VilàM. Lists of harmful alien organisms: Are the national regulations adapted to
the global world? Biol Invasions. 2015:1–11.
139. Burgiel S, Foote G, Orellana M, Perrault A. Invasive alien species and trade: integrating prevention
measures and international trade rules. The Center for International Environmental Law and Defend-
ers of Wildlife, Washington, DC. 2006:66–74.
140. Genovesi P, Shine C. European strategy on invasive alien species: Convention on the Conservation
of European Wildlife and Habitats (Bern Convention): Council of Europe; 2011.
Risk of marine invasions in the Arctic
PLOS ONE | https://doi.org/10.1371/journal.pone.0211815 February 7, 2019 28 / 28


![The British Invasions[1]](https://img.pdfslide.us/doc/110x75/554fbdc4b4c90542018b4978/the-british-invasions1.jpg)