Embed Size (px)
Citation preview
Ecological Genomics
GWAS point of view
Long term Goals
• Data conversation between different popular software in the field
• Develop scripts to qualitatively filter data using R
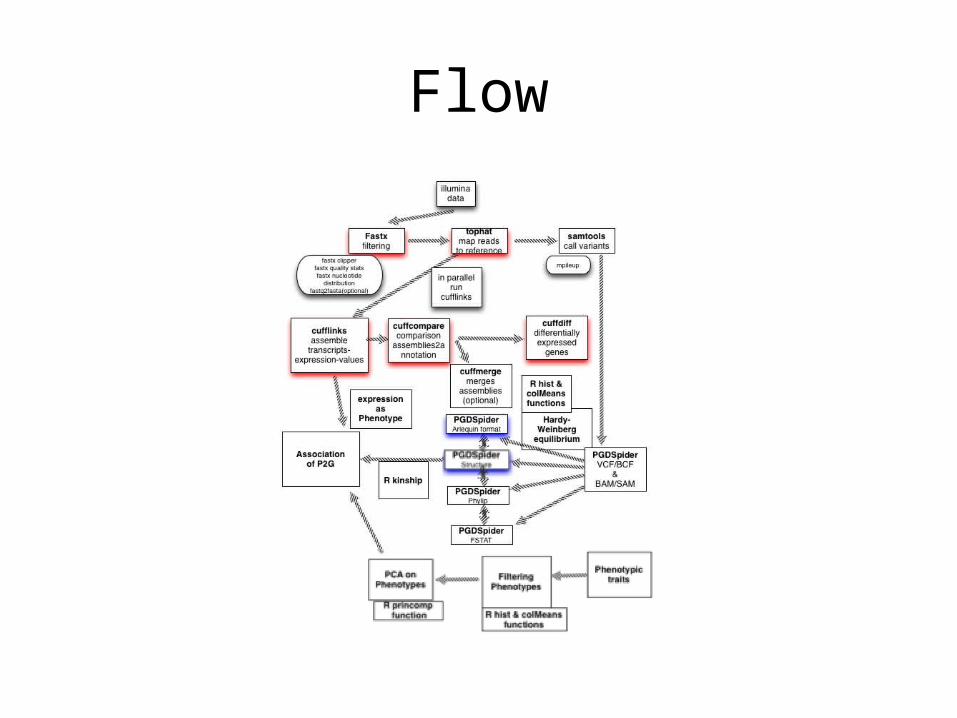
Flow
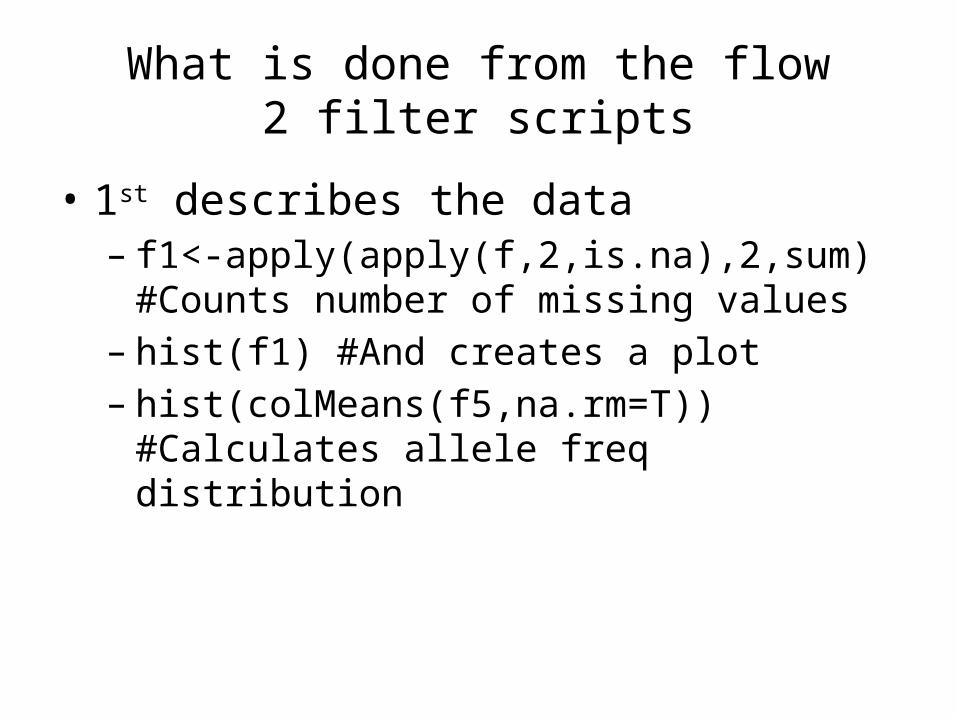
What is done from the flow2 filter scripts
• 1st describes the data – f1<-apply(apply(f,2,is.na),2,sum) #Counts number
of missing values– hist(f1) #And creates a plot– hist(colMeans(f5,na.rm=T)) #Calculates allele freq
distribution
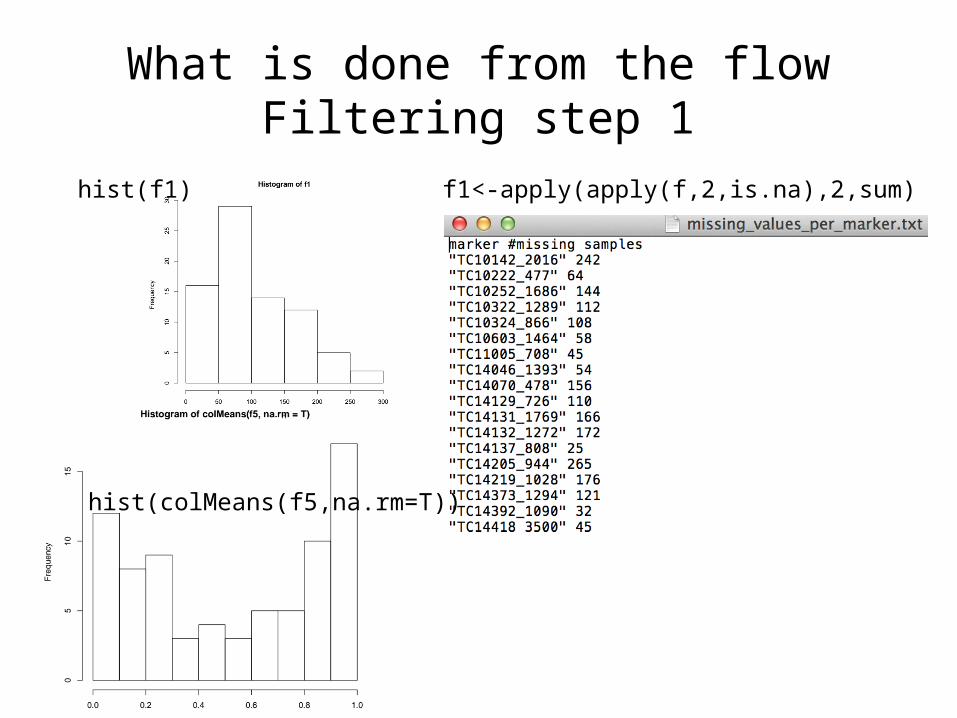
What is done from the flowFiltering step 1
hist(f1) f1<-apply(apply(f,2,is.na),2,sum)
hist(colMeans(f5,na.rm=T))

• Once user evaluates the data and decides on the selection of markers/phenotypes.– drop.col.kna <- function(mydf, l)
mydf[sapply(mydf, function(x) sum(is.na(x))) < l] f1<-drop.col.kna(mydf, l)
What is done from the flowFiltering step 2
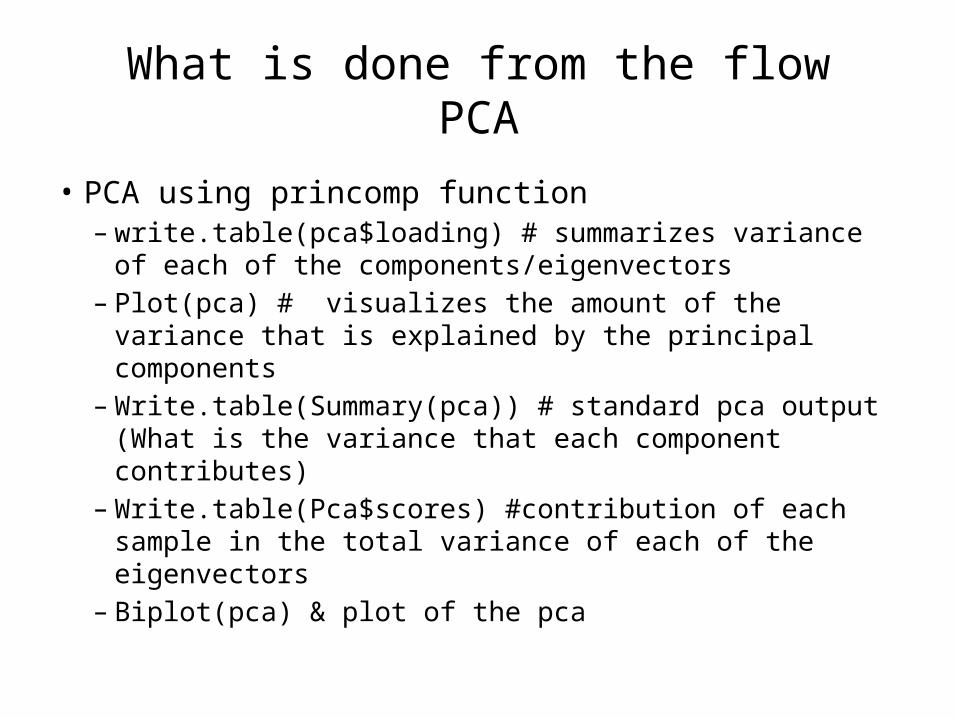
What is done from the flowPCA
• PCA using princomp function– write.table(pca$loading) # summarizes variance of each
of the components/eigenvectors– Plot(pca) # visualizes the amount of the variance that is
explained by the principal components– Write.table(Summary(pca)) # standard pca output (What
is the variance that each component contributes)– Write.table(Pca$scores) #contribution of each sample in
the total variance of each of the eigenvectors– Biplot(pca) & plot of the pca
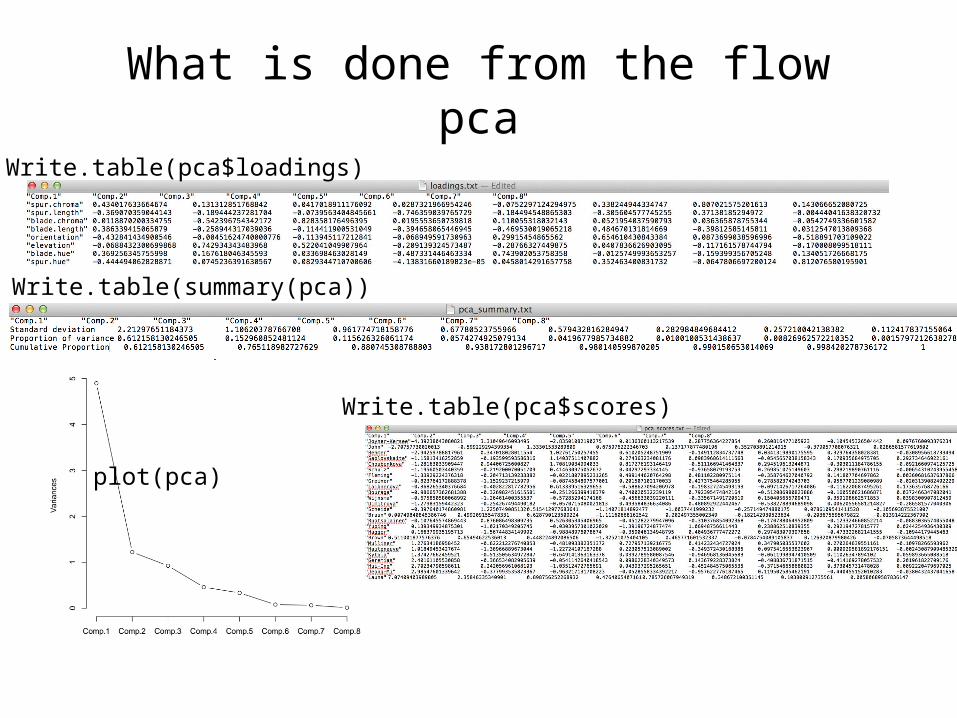
What is done from the flowpca
Write.table(pca$loadings)
plot(pca)
Write.table(summary(pca))
Write.table(pca$scores)
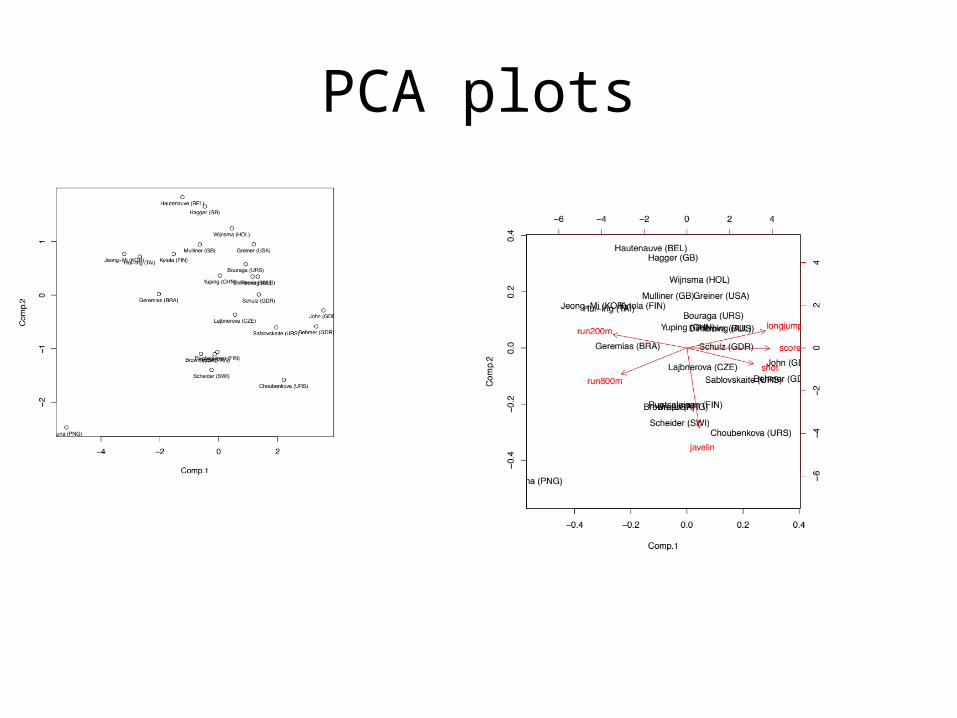
PCA plots
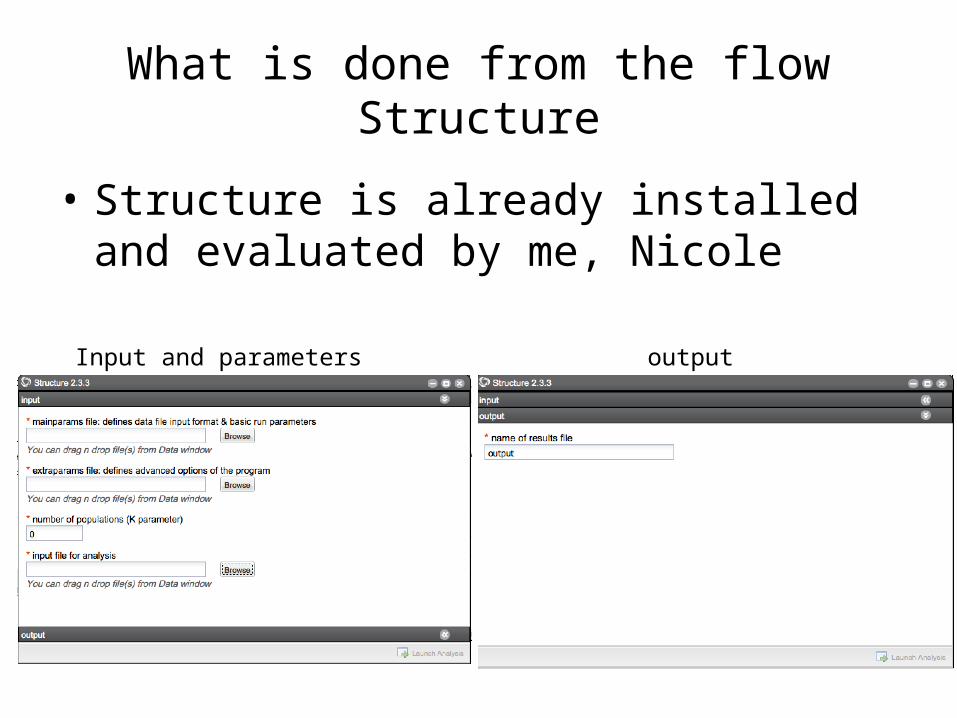
What is done from the flowStructure
• Structure is already installed and evaluated by me, Nicole
Input and parameters output
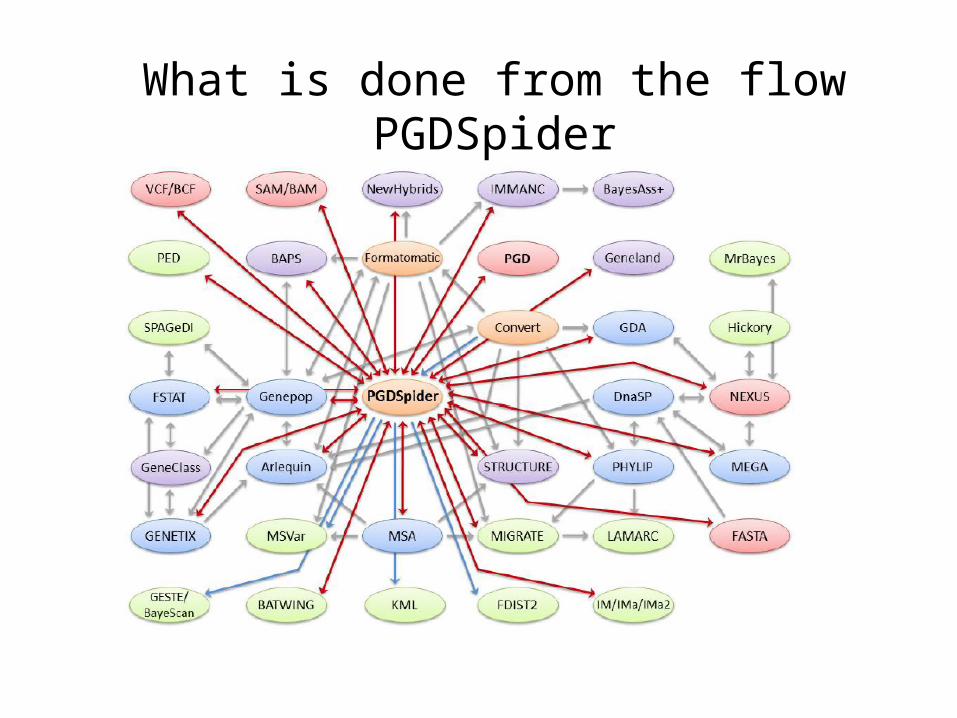
What is done from the flowPGDSpider

PGDSpider
Documentation needs polishingNew version was installed and deployed needs to be tested
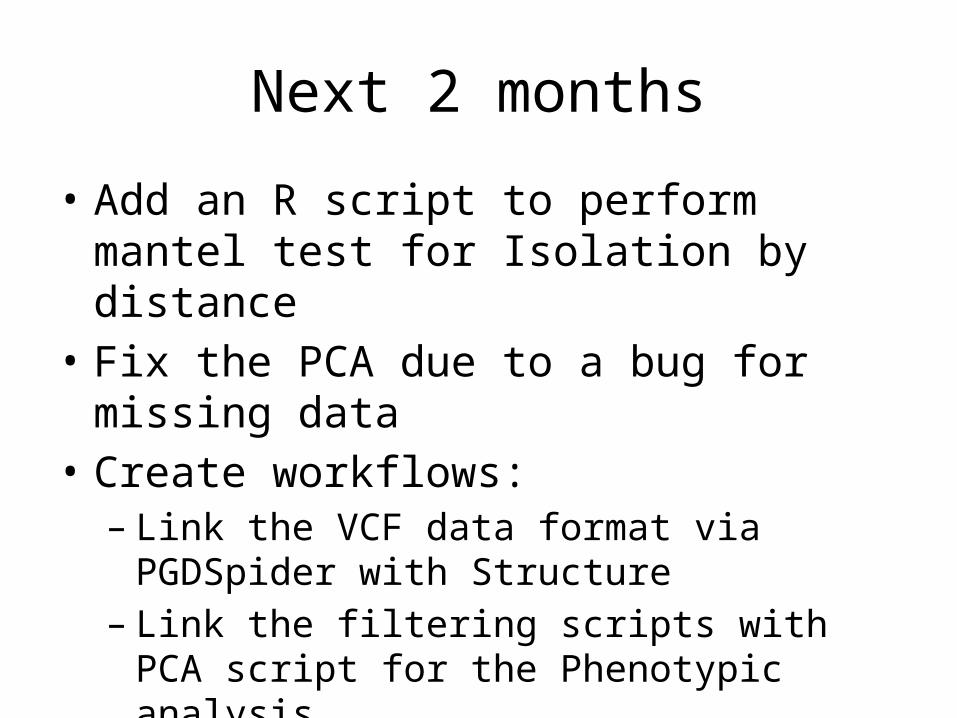
Next 2 months
• Add an R script to perform mantel test for Isolation by distance
• Fix the PCA due to a bug for missing data• Create workflows:– Link the VCF data format via PGDSpider with
Structure– Link the filtering scripts with PCA script for the
Phenotypic analysis