Embed Size (px)
Citation preview

ECOLOGICAL ASPECTS OF SPONGES IN MESOPHOTIC CORAL ECOSYSTEMS
by
Sara Rivero Calle
A thesis submitted in partial fulfillment of the requirements for the degree of
MASTER OF SCIENCE in
MARINE SCIENCES
UNIVERSITY OF PUERTO RICO MAYAGÜEZ CAMPUS
2010 Approved by: ________________________________ Roy A. Armstrong, PhD President, Graduate Committee
__________________ Date
________________________________ Jorge R. García, PhD Member, Graduate Committee
__________________ Date
________________________________ Vance Vicente, PhD Member, Graduate Committee
__________________ Date
________________________________ Félix Fernández, PhD Representative of Graduate Studies
__________________ Date
________________________________ Nilda E. Aponte, PhD Chairperson of the Department
__________________ Date

ii
ABSTRACT Mesophotic Coral Ecosystems (MCE) represent a new realm of unexplored habitats that range from 30-100m deep. Given the worldwide coral reef decline, MCE research has created great expectations because of their potential as refugia and as a viable source of larvae and nursery for commercial and endangered reef species. Within these deep reef systems sponges play an important ecological role in terms of abundance and richness of species, coupling water column productivity to the benthos and providing rugosity, complexity and refuge for other species. However, information regarding the taxonomic composition and ecology of sponges in MCE is scarce. The main goal of this study was to characterize MCE distribution in five areas of Puerto Rico (La Parguera, Guánica, Vieques, Desecheo and Bajo de Sico) with special emphasis on coral and sponge species. Thirteen (km-long) photo-transects obtained with the Seabed Autonomous Underwater Vehicle (AUV) provided the 1116 images that were analyzed, covering over 3.7 km2, to derive percent cover and species richness for eight categories (sponges, corals, gorgonians, black corals, algae, other, unknown, and abiotic cover). The possible influence of several factors (location, transect, depth, geomorphology, water turbidity, distance from land, chlorophyll a concentration, level of analysis) in the distribution of MCE communities was statistically evaluated with ANOSIM, SIMPER, NMDS, cluster and regression analyses. Sponge data were further analyzed in terms of species richness, color and morphology. Slope is a determinant factor for community composition benthic group dominance and sponge species composition, but not for coral species composition. Coral cover, macroalgal cover and total live cover tend to increase with distance from land and decrease with water turbidity. Depth is an indirect factor affecting MCE ecology. Regression analysis results suggest that effects of the studied factors on MCEs are stronger with depth and that MCEs between 50-100m depth are possibly more sensitive to these factors. Results suggest that in the upper mesophotic range, coral reef characteristics represent an extension of the shallow coral reefs. The lower mesophotic range is subject to low light regimes and perhaps higher sedimentation rates. These factors are limiting to coral growth resulting in sparse plate-like colonies and favoring development of other groups such as black corals, sponges or algae. For this reason it may be more useful to refer to these ecosystems as MREs (Mesophotic Reef Ecosystems), where corals are not dominant. The gorgonian to black coral transition, together with the Agaricia-dominance transition pattern and a coral-to-sponge dominance transition may be indicating a change from euphotic to mesophotic ecosystems. The number of sponge species found (77) is higher than that of corals (28), but in both cases species richness tend to decrease with increasing depth. Morphology of sponges seems to be related to depth and location, whereas color seems to be related to geomorphology, turbidity and location. Sponges with carotenoid pigmentation are the most abundant and widely distributed. Tube, cup-like and massive forms not only provide rugosity and microhabitats for other organisms, but they may conform the most adaptive morphologies to an optimal water-circulation in MCEs. Branching and erect forms may represent an adaptation to steep slopes, while encrusting morphologies are probably opportunistic.

iii
RESUMEN Los ecosistemas de arrecifes coralinos mesofóticos (MCE) representan todo un mundo de hábitats inexplorados entre los 30-100m de profundidad. Dado el deterioro de los arrecifes de coral a escala mundial, la investigación de arrecifes mesofóticos ha suscitado gran expectación, ya que se cree que estos ecosistemas puedan ser fuente de larvas y refugio y guardería de especies de arrecife protegidas o de interés comercial. Dentro de estos ecosistemas profundos, las esponjas juegan un importante papel ecológico en términos de abundancia y riqueza de especies, transfiriendo la productividad de la columna de agua al bentos, proveyendo rugosidad, complejidad y refugio para otras especies, etc. Sin embargo, la información taxonómica y ecológica disponible acerca de este grupo en estos ecosistemas es muy escasa. El principal objetivo de este estudio era caracterizar la distribución de MCE en cinco áreas de Puerto Rico (La Parguera, Guánica, Vieques, Desecheo and Bajo de Sico) poniendo énfasis en los escleractinios y las esponjas. Por medio del Seabed Autonomous Underwater Vehicle (AUV) se obtuvieron trece foto-transectos de al menos un kilómetro de longitud. De las 1116 imágenes analizadas, que cubren más de 3.7 km2, se estimó el porcentaje de cobertura y la riqueza de especies para cada una de las ocho categorías (coral, esponja, alga, gorgonio, coral negro, otro, desconocido y abiótico). Mediante las pruebas estadísticas ANOSIM, SIMPER, NMDS, cluster y regresiones lineales, se evaluó la posible influencia de varios factores (área, transecto, profundidad, geomorfología, transparencia del agua, distancia a tierra, concentración de clorofila a, nivel de análisis) en la distribución de las comunidades de MCE. Adicionalmente, los datos específicos de esponjas se analizaron en términos de riqueza de especies, color y morfología. La pendiente es un factor determinante para la composición de la comunidad, dominancia de grupos bénticos y composición de especies de esponjas, pero no de corales. La cobertura de coral, macroalgas y cobertura viva total tienden a incrementar con la distancia a tierra y disminuir con la turbidez del agua. La profundidad es un factor indirecto que afecta a la ecología de arrecifes mesofóticos. Los resultados de regresión lineal sugieren que los efectos de los factores estudiados son más fuertes a mayor profundidad y que los MCE localizados entre 50-100m de profundidad son posiblemente más sensibles a estos factores. Las características de los arrecifes en el rango mesofótico superior (30-50m) sugieren que estos son una continuación de los arrecifes someros. El rango mesofótico inferior (50-100m) está sujeto a unos regímenes de luz más tenue y posiblemente mayor sedimentación, los cuales son factores limitantes para el crecimiento de los corales y resulta en pequeñas colonias aisladas y aplanadas y favorece el desarrollo de otros grupos, como los corales negros, algas o esponjas. Por esta razón, tal vez es más adecuado referirse a estos ecosistemas como ecosistema arrecifal mesofótico (MRE), donde los corales no son dominantes. El cambio de un ecosistema eufótico a mesofótico puede estar indicado por: la transición de gorgonios a corales negros, la transición de dominancia de coral a dominancia de esponjas y la dominancia de Agarícidos en el rango mesofótico inferior. La riqueza de especies de esponjas (77) es mayor que la de corales (28), pero en ambos casos la riqueza disminuye con el aumento de profundidad. Los resultados sugieren que la morfología de esponjas parece estar relacionada con la profundidad y el sitio,

iv
mientras que el color parece estar relacionado a la geomorfología, turbidez del agua y sitio. Las esponjas de pigmentación carotenoide fueron las más ampliamente distribuidas y abundantes. Las formas tubulares, masivas y de copa no sólo proveen rugosidad y micro-hábitats para otros organismos, sino que también conforman las morfologías mejor adaptadas para una óptima circulación del agua. Las formas ramosas y erectas pueden ser una adaptación especial a la pendiente, mientras que las incrustantes probablemente sean oportunistas.

v
COPYRIGHT In presenting this dissertation in partial fulfillment of the requirements for a Master in Marine Sciences degree at the University of Puerto Rico, I agree that the library shall make its copies freely available for inspection. I therefore authorize the Library of the University of Puerto Rico at Mayaguez to copy my MS Thesis totally or partially. Each copy must include the title page. I further agree that extensive copying of this dissertation is allowable only for scholarly purposes. It is understood, however, that any copying or publication of this dissertation for commercial purposes, or for financial gain, shall not be allowed without my written permission. Signed: Date:

vi
A mi familia.
Quiero dedicar este trabajo a toda mi familia, pero en especial a mi madre, quien no sólo me
dio la vida, sino cariño y apoyo incondicional todos estos años, y a mis abuelos, de quienes
he aprendido tanto como ser humano. GRACIAS por tener tanta fe en mí y apoyarme en
todas mis decisiones, por enseñarme a ser una persona humilde, a respetar y a dar sin esperar
nada a cambio. Abuelo Julio, tu me enseñaste a amar la vida y la naturaleza, eres un
extraordinario ejemplo de lo que debe ser un hombre, un excelente esposo, padre y abuelo,
dondequiera que estés puedes estar satisfecho y feliz. Abuelo Isaías, tú me enseñaste lo que
es el trabajo duro y el buen humor. Abuelas, ambas me enseñasteis lo fuertes e importantes
que son las mujeres y a sentirme orgullosa de ser mujer. A mis padres por sacrificarse por
darnos la mejor educación posible. A Irene, que siempre será “mi hermanita”, un “cachito”
del cielo. A todos mis “titos”. No sé si algún día llegaré a ser como Madame Curie, pero sin
vosotros no habría llegado hasta aquí. Os quiero.

vii
ACKNOWLEDGEMENTS
I would like to thank all my committee members, specially my advisor and friend Dr. Roy
Armstrong for his unconditional support throughout these years.
I have to thank my lab mates, friends and all the Magueyes community.
Special thanks I owe to CenSSIS, Dr. Vance Vicente and Sea Grant-Puerto Rico for
economical support.
Gracias también a toda mi familia, amigos (aquí y en España) y, en especial, a Leo, “mi
compañero”.

viii
TABLE OF CONTENTS
ABSTRACT............................................................................................................................ II
RESUMEN.............................................................................................................................III
ACKNOWLEDGEMENTS ............................................................................................... VII
TABLE OF CONTENTS ..................................................................................................VIII
TABLE LIST......................................................................................................................... IX
FIGURE LIST........................................................................................................................ X
1 INTRODUCTION........................................................................................................... 2
1.1 JUSTIFICATION ........................................................................................................... 2 1.2 LITERATURE REVIEW................................................................................................. 6
2 OBJECTIVES ............................................................................................................... 11
3 COMMUNITY ECOLOGY / CHARACTERIZATION OF FIVE MESOPHOTIC CORAL ECOSYSTEMS (MCE) IN PUERTO RICO. ..................................................... 12
3.1 INTRODUCTION ........................................................................................................ 12 3.2 MATERIAL AND METHODS....................................................................................... 16
3.2.1 Reef Characterization ......................................................................................... 17 3.2.2 Sponges Distribution........................................................................................... 18 3.2.3 Diffuse attenuation of light (K490) ..................................................................... 18 3.2.4 Statistics and GIS................................................................................................ 19
3.3 RESULTS .................................................................................................................. 21 3.3.1 Spatio-temporal variation of K490. .................................................................... 21 3.3.2 Community structure: ......................................................................................... 21 3.3.3 Live cover results:............................................................................................... 26 3.3.4 Coral species composition:................................................................................. 40 3.3.5 Sponge species composition: .............................................................................. 45 3.3.6 Sponge color and morphology distribution patterns:......................................... 46
3.4 DISCUSSION ............................................................................................................. 59
4 CONCLUSIONS AND FUTURE WORK.................................................................. 70
REFERENCES...................................................................................................................... 73
APPENDIX A........................................................................................................................ 79

ix
Table List
Tables Page Table 1. Transects per site and number of images analized per depth range (a to g) and
transect and number of random points used. 17 Table 2. ANOSIM results for each factor at each different level. a) Community level, b)
Sessile-benthic groups, c) Total live cover, d) Coral species, e) Sponge species. Red numbers represent significant results (p<0.05). 23
Table 3. Table showing sponge species richness per transect and depth 45 Table 4. ANOSIM results for a) sponge color and b) morphology. 48

x
Figure List
Figures Page
Figure 1. Average monthly K490 values for each site beween 2003-2008. Error bars represent range of variation. ........................................................................................... 21
Figure 2. NMDS results for the community level and factor area location............................ 24 Figure 3. NMDS results for the community level and factor slope. ....................................... 24 Figure 4. NMDS for factor water turbidity in ranks. .............................................................. 25 Figure 5. NMDS excluding LPtr7 samples. Three groups can be distinguished.................... 25 Figure 6. NMDS comparing live cover among sites. Results show two clear groups............ 26 Figure 7. Live percent cover per transect and depth range ..................................................... 30 Figure 8. Algae percent cover per transect and depth range................................................... 31 Figure 9. Coral percent cover per transect and depth range ................................................... 32 Figure 10. Sponge percent cover per transect and depth range .............................................. 33 Figure 11. Black coral percent cover per transect and depth range. ....................................... 34 Figure 12. Gorgonian percent cover per transect and depth range ......................................... 35 Figure 13. Regression between live percent cover and vertical attenuation of light. Rhombus,
dotted line and unshaded equation correspond to the upper mesophotic range (30-50m deep) results. Triangles, solid line and shaded equation correspond to the lower mesophotic range (50-100m) results............................................................................... 36
Figure 14. Regression between live percent cover and distance from land. Rhombus, dotted line and unshaded equation correspond to the upper mesophotic range (30-50m deep) results. Triangles, solid line and shaded equation correspond to the lower mesophotic range (50-100m) results. ................................................................................................. 36
Figure 15. Regression between algae percent cover and vertical attenuation of light. Rhombus, dotted line and unshaded equation correspond to the upper mesophotic range (30-50m deep) results. Triangles, solid line and shaded equation correspond to the lower mesophotic range (50-100m) results............................................................................... 37
Figure 16. Regression between algae percent cover and distance from land. Rhombus, dotted line and unshaded equation correspond to the upper mesophotic range (30-50m deep) results. Triangles, solid line and shaded equation correspond to the lower mesophotic range (50-100m) results. ................................................................................................. 37
Figure 17. Regression between coral percent cover and vertical attenuation of light. Rhombus, dotted line and unshaded equation correspond to the upper mesophotic range (30-50m deep) results. Triangles, solid line and shaded equation correspond to the lower mesophotic range (50-100m) results............................................................................... 38
Figure 18. Regression between coral percent cover and distance from land. Rhombus, dotted line and unshaded equation correspond to the upper mesophotic range (30-50m deep)

xi
results. Triangles, solid line and shaded equation correspond to the lower mesophotic range (50-100m) results. ................................................................................................. 38
Figure 19. Regression between sponge percent cover and vertical attenuation of light. Rhombus, dotted line and unshaded equation correspond to the upper mesophotic range (30-50m deep) results. Triangles, solid line and shaded equation correspond to the lower mesophotic range (50-100m) results............................................................................... 39
Figure 20. Regression between sponge percent cover and distance from land. Rhombus, dotted line and unshaded equation correspond to the upper mesophotic range (30-50m deep) results. Triangles, solid line and shaded equation correspond to the lower mesophotic range (50-100m) results............................................................................... 39
Figure 21. Regression between vertical attenuation of light and distance from land. ............ 40 Figure 22. Coral species richness per depth and transect. ...................................................... 42 Figure 23. Sponge species richness per depth and transect. ................................................... 42 Figure 24. Regression between coral species richness and vertical attenuation of light.
Rhombus, dotted line and unshaded equation correspond to the upper mesophotic range (30-50m deep) results. Triangles, solid line and shaded equation correspond to the lower mesophotic range (50-100m) results............................................................................... 43
Figure 25. Regression between coral species richness and distance from land. Rhombus, dotted line and unshaded equation correspond to the upper mesophotic range (30-50m deep) results. Triangles, solid line and shaded equation correspond to the lower mesophotic range (50-100m) results............................................................................... 43
Figure 26. Regression between sponge species richness and vertical attenuation of light. Rhombus, dotted line and unshaded equation correspond to the upper mesophotic range (30-50m deep) results. Triangles, solid line and shaded equation correspond to the lower mesophotic range (50-100m) results............................................................................... 44
Figure 27. Regression between sponge species richness and distance from land. Rhombus, dotted line and unshaded equation correspond to the upper mesophotic range (30-50m deep) results. Triangles, solid line and shaded equation correspond to the lower mesophotic range (50-100m) results............................................................................... 44
Figure 28. Relative percentages of sponge color categories................................................... 47 Figure 29. Cluster analysis of distribution patterns of sponge color categories. .................... 47 Figure 30. Comparison of the relative percentages of color types at shallow coral reefs
(<30m: Wulff, 1994), intermediate (this study) and deep slopes (>90m: Maldonado and Young, 1999). ................................................................................................................. 48
Figure 31. Relative percentages of morphological types of sponges..................................... 49 Figure 32. Cluster analysis of distribution patterns of sponge morphologies......................... 49 Figure 33. NMDS showing: a) ordination of colors superimposed on an ordination of
sampling sites and depths of sponge species. b) ordination of morphologies superimposed on an ordination of sampling sites and depths of sponge species............ 50
Figure 34. Average red sponge species cover per depth and site. .......................................... 51 Figure 35. Average orange sponge species cover per depth and site...................................... 51

xii
Figure 36. Average brown sponge species cover per depth and site. ..................................... 52 Figure 37. Average yellow sponge species cover per depth and site...................................... 52 Figure 38 Average cream sponge species cover per depth and site........................................ 53 Figure 39. Average blue sponge species cover per depth and site.......................................... 53 Figure 40. Average green sponge species cover per depth and site........................................ 54 Figure 41. Average black sponge species cover per depth and site........................................ 54 Figure 42. Average white sponge species cover per depth and site........................................ 55 Figure 43. Average pink-purple sponge species cover per depth and site.............................. 55 Figure 44. Average cup-like sponge species cover per depth and site. .................................. 56 Figure 45. Average tube or pipe sponge species cover per depth and site. ............................ 56 Figure 46. Average branching sponge species cover per depth and site. ............................... 57 Figure 47. Average erect sponge species cover per depth and site......................................... 57 Figure 48. Average encrusting sponge species cover per depth and site................................ 58 Figure 49. Average massive sponge species cover per depth and site.................................... 58

1 INTRODUCTION 1.1 Justification
Coral reefs worldwide are thought to be in general decline, but available data are
practically limited to reefs shallower than 25m (Bak et al., 2005). Protected by their difficult
access, mesophotic coral reefs (30 to 100 meters deep) may represent a genetic reservoir
(García-Sais, 2005: Kahng et al., 2010) for the endangered shallow reefs. There are
extremely few quantitative data sets that allow an assessment of deep coral reefs (Bak et al.,
2005; Kahng et al., 2010). Extensive research has been conducted on coral reefs above 30
meters, some from 30 to 50 (e.g. Bak et al., 2005) and some below 100 meters (e.g. Barthell
and Gutt, 1992; Maldonado and Young, 1996). However, there is a realm of unexplored reef
habitat at depths between about 40 and 150 m- the “twilight zone” (Feitoza et al., 2005).
Insular slopes are important ecological transition zones “from the highly complex and
diverse coral reef environments that are fueled by sunlight, to the relatively barren and
perpetually dark abyssal depths where no photosynthesis can occur” (Feitoza et al., 2005;
Maldonado and Young, 1996). Steep slopes are particularly interesting because physical
gradients change so rapidly that ecological patterns are compressed into short distances,
making the patterns more obvious to the observer (Maldonado and Young, 1996). Slopes
often have unique faunal assemblages and high species diversity (Maldonado and Young,
1996).
Since the edge of the insular shelf of Puerto Rico and the U. S. Virgin Islands is typically
found at depths between 20 to 30 m, reef systems deeper than 30 m are considered
mesophotic reefs (García-Sais, 2005). The mesophotic reef systems of Puerto Rico and the
2

USVI (United States Caribbean Virgin Islands) are composed of hermatypic coral reefs in
deep terraces of the outer shelf, rocky outcrops and vertical wall features of the insular slope,
submerged volcanic ridges and oceanic seamounts (García-Sais, 2005). The existence of both
shallow and deep coral reefs near the coast of Puerto Rico renders it an excellent area of
study because it allows for comparison of shallow photic reefs (less than 30m deep) and
mesophotic reefs (30-100m deep). This research work at mesophotic depth ranges contributes
to fill in the gap in coral reef ecosystems characterization between the well known shallow
photic reefs and the aphotic depths beyond 100m.
While numerous assessments of coral reef habitat have been conducted throughout the
Caribbean islands and elsewhere using SCUBA, there is limited information on the deeper
reefs zones that lie beyond the range of safe diving operations (Singh et al. 2004, Armstrong
et al., 2002; Armstrong et al., 2006). In the deeper coral reef zones, the in-situ digital imagery
obtained by submersibles and AUV (Autonomous Underwater Vehicles)’s provide the only
source of information to characterize and map these benthic habitats (Singh et al., 2004).
“The technologies associated with manned submersibles, remotely operated vehicles (ROVs)
and towed vehicles that service such needs today, are expensive, require large ships and
infrastructure, and are in short supply” (Singh et al., 2004). Specifically designed for use in
waters down to 2000 m (Singh et al., 2004), the SeaBED autonomous underwater vehicle
(AUV) is a promising cost-effective tool to explore large extensions of deep marine habitats.
This vehicle is a new imaging platform designed for high resolution optical and acoustic
sensing, representing a good tool for both descriptive-qualitative and quantitative studies as it
can carry out photo transects and acoustic surveys. SeaBED was deployed off the shelf edge
3

of Puerto Rico for the first time during March of 2002 and was successful in returning high
quality color imagery of deep coral habitats (Singh et al., 2004; Armstrong et al., 2002).
Deep water (>30m) zonation patterns of particular phyla have been determined for only a
few taxa (e.g. algae in Aponte and Ballantine, 2001), and community-wide zonation
determinations are even rarer (Maldonado and Young, 1996, Kahng et al. 2010).
The marine demosponges (Porifera: Demospongea) are one of the most important benthic
groups “owing to their high diversity, large biomass, complex physiology and chemistry, and
a long evolutionary history, sponges (and their endosymbionts) play a key role in ecological
processes: space competition, habitat provision, predation, chemical defense, primary
production, nutrient cycling, nitrification, food chains, bioerosion, mineralization and
cementation” (Rützler 2004 in Wulff, 2006).
Many studies indicate that sponges are a very important epibenthic component of the
slope fauna (Maldonado and Young, 1996). In the West Indies, it has been estimated that
about 252 species inhabit the depths between 55 and 2000m (van Soest and Stentoft, 1988).
Some authors have compiled bathymetric data of a wide variety of taxa to extract the
corresponding data on sponges; however, since most of the collecting effort has been based
on trawling, sponge bathymetric knowledge is still poorly understood. Quantitative
approaches are also rare. To date there is no detailed study on sponges’ distribution in
mesophotic reefs of Puerto Rico- defined as the range of depths that comprise from 30 to 100
meters. Potential factors that may influence the distribution of sponges in the marine
environment range from intra and/or interspecific competition with other sponges or even
with other benthic groups (e.g. macroalgae, corals), availability of suitable substrate, and
4

predation. Among the abiotic factors, geomorphology and hydrology/currents may influence
larvae recruitment or adult morphology as well as water column conditions such as turbidity,
suspended nutrients and organic matter that may determine an adequate food supply and
water renewal.
Given that scleractinian corals receive up to 80% of the energy from their phototrophic
partners, the incident light quantity and quality in the water column is a key factor in coral
reefs. Some sponges also harbor photosynthetic endosymbionts (cyanobacteria,
dinoflagellates) in a manner comparable to that of corals (Vicente, 1990: Wulff, 2006;
Schönberg et al., 2005) as nutrient translocation from symbiotic cyanobacteria in some
tropical sponges can fulfill most of the host sponge’s energy requirements (Wilkinson, 1983).
The autotrophic endosymbiotic symbionts have beneficial effects on their hosts, and it is
thought that they function in a mutualistic relationship (Schönberg et al., 2005). The
association is not random: all of over 100 sponge species found to host cyanobacteria are in
only 26 of the recognized 72 demosponge families (Díaz and Ward, 1999). Four genera
(Aplysina, Xestospongia, Disidea and Theonella) are particularly rich in these associations,
with 5-10 species in each genus hosting cyanobacteria (Díaz and Ward, 1999). Associations
between sponges and dinoflagellates are comparatively scarce, they appear to be restricted to
only a few sponge genera, most of which are bioeroding sponges from warm-temperate to
tropical waters (Schönberg et al., 2005). Some of these associations are generalistic, while
others are species-specific.
Light penetration is dependent on the turbidity of the water column. Water masses can be
classified as case 1 waters (oceanic) for those whose optical properties are derived from
5

phytoplankton and their associated products and case 2 waters (coastal) for those whose
optical properties are also influenced by resuspended sediments and terrigenous sources of
sediments and dissolved organic matter. KdPAR is the downwelling attenuation coefficient
with depth and it is the best parameter to characterize different water masses in terms of
photosynthetic available radiation (PAR). Kd PAR is typically low for oligotrophic waters and
high for eutrophic waters. Therefore light penetration/ attenuation could serve as an indicator
of several other potential factors in sponge distribution: organic matter, resuspended
sediments and nutrients in the water column. Puerto Rican waters are subject to seasonal
river plume influence with terrigenous content from the Amazon and Orinoco Rivers
(Müller-Karger, 1988, 1995; Del Castillo, 1999; Hu et al., 2004). Kd490 and near-surface
chlorophyll a can also be estimated with remote sensing techniques (such as MODIS) and it
can be used as an indirect indicator of organic and inorganic matter in superficial waters that
will eventually reach the sea bottom and affect the sponge community. Little work has been
done correlating light attenuation with sponge distribution, mainly those of Wilkinson (1983,
1985, 1987, 1989), Thacker, 2005; Díaz and Ward, 1999; Schönberg et al., 2005, etc. This
study will show patterns of sponges’ distribution throughout a depth gradient (30-100m) in
Puerto Rico, as well as provide a broad characterization of mesophotic ecosystems, including
the depth ranges of the most abundant coral and sponge species found.
1.2 Literature Review
“A series of exploratory cruises have sampled the submerged ridges, seamounts and
insular slope habitats of PR and the USVI producing highly valuable collections from which
the taxonomic record of our deep reef communities has been constructed” (García-Sais,
6

2005). In the Caribbean, this includes the H. M. S. Challenger, which sampled the north coast
of St. Thomas (USVI) at 390 fathoms (709 m) in 1873, the U. S. Coast Survey Steamer
“Blake”, which sampled insular slope stations of the Lesser Antilles during 1878-79 (García-
Sais, 2005); and the Nekton Gamma submersible that described the deep fore reef slope off
Discovery Bay (Jamaica) to depths of 305 m. More locally, the expedition by the U. S. Fish
Commission “Fish Hawk” sampled 17 stations below 20 fathoms (36 m) off San Juan,
Mayagüez, Aguadilla, Vieques and St. Thomas in 1899 (García-Sais, 2005); and the
Johnson-Smithsonian expedition to the Puerto Rican Deep, which sampled 109 stations in
Mona Passage, the north coast of Puerto Rico (including the Puerto Rico Trench), and the
USVI in 1933 (García-Sais, 2005), and Laubenfels (1934) described sponge species from the
Puerto Rico Trench. More recently, Nelson and Appeldoorn (1985) aboard the Johnson Sea-
Link II submersible conducted an evaluation of deep-water fish habitats and abundance
around Puerto Rico and the US Virgin Islands, at depths ranging from 36 to 758 m.
It was not until 2002 that the Seabed AUV was deployed in Puerto Rico with successful
results. Although the main purpose of this deployment was to perform engineering tests of
the vehicle, a deep transect along the insular slope south of La Parguera starting at 20 m over
the shelf edge to 125 m depth was also included (Singh et al., 2004). The photo transect
provided data on zonation patterns, species composition and abundance, and
geomorphological features of the insular shelf slope off southwestern Puerto Rico
(Armstrong et al., 2002; Singh et al., 2004). Then in 2003, the Seabed AUV was used again
to study the benthic communities of the deep insular shelf at Hind Bank Marine Conservation
District, an important spawning aggregation site for groupers in the US Virgin Islands
7
(Armstrong et al., 2006), revealing well-developed coral reefs with 43% mean living coral
cover at depths between 32 and 54 m and a maximum of 70% at depths of 38- 40m.
Barbados deep-water sponges were studied by van Soest and Stentoft (1988). In 1993
van Soest studied the distribution of sponges on the Mauritanian shelf pointing out the
importance of a hard substrate for sponge abundance. Barthell and Gutt (1992) combined
bottom trawling and photography to study the sponge fauna along the eastern coast of Wedell
Sea shelf and slope (i.e. below 100 m). They also found that species associations are related
to different substrates, not to depth. Maldonado & Young (1996) analyzed the bathymetric
patterns of sponge distribution on the Bahamanian slope using a manned submersible
equipped with a high resolution camera. They showed that for the depth range between 100-
320 m sponge abundance is not linearly related to depth but has a bimodal distribution that is
not explained by a temperature/salinity profile. Some patterns are seen related to color and
morphology and a general trend of greater abundance on vertical surfaces. Wilkinson & Trott
(1985) had already suggested light as a factor determining the distribution of sponges across
the central Great Barrier Reef. Wilkinson (1983) showed that 80% of the sponge individuals,
and 9 out of the 10 most abundant species of the Great Barrier Reef sites far from shore
hosted endosymbiont cyanobacteria and many sponges presented growth forms that appear to
be designed to expose their hosts to sunlight. Wilkinson was the first to consider the
possibility of classifying sponges into heterotrophic, mixed and phototrophic, and found that
some sponges relied on their photosynthetic symbionts for at least 50% of their energy
requirements. Certain genera in the Indo-West Pacific have adapted to this symbiosis to such
an extent, that their net production: respiration rate (P/R ratio) is positive, thus suggesting
8

that they may be phototrophs. Wilkinson also found differences in the proportion of
photosymbiont harboring sponge species according to their location: 0% near shore, 20-64%
intermediate distances, 5-90% far from shore (Wilkinson, 1987). Wilkinson suggested that
these differences might be due to nutrient content in the water column and therefore reflects
the relative ability of sponges to thrive in nutrient poor waters relying solely on filter feeding,
i.e. photoautotrophy may be an adaptation to oligotrophy. This was consistent with the
hypothesis that the rarity of phototrophic sponges in the Caribbean compared to the Pacific
reflects ocean-scale differences in water column nutrient availability in tropical seas
(Wilkinson, 1983). Vicente (1990) produced an updated list of sponges with algal
endosymbionts including new records for Puerto Rico and the Caribbean. Thirty five species
of common Caribbean sponges possess photosynthetic endosymbionts. Thirty-one common
sponge species were inspected for bleaching during coral-bleaching months (July-September
1987) and then in January (1988) in Puerto Rico. Anthosigmella varians, Xestospongia muta
and Petrosia pellasarca bleached partially, but only few individuals within any given
population became bleached and the bleaching of sponges was much localized.
In 1989 Wilkinson and Evans continued studying the sponge distribution across Davies
Reef, Great Barrier Reef, relative to location, depth, and water movement, finding that depth
is the major discriminatory factor as few sponges are found within the first 10 m depth and
maximal populations occur between 15 m and 30 m: physical factors are considered to be the
major influences behind these patterns. Insufficient photosynthetic radiation limited the
growth of the sponge population below 30 m depth as many of the species are phototrophic
with a dependence on cyanobacterial symbionts for nutrition. However, while there were
9

10
correlations between sponge populations and environmental parameters, data were
insufficient to enable more definitive conclusions. Thacker (2005) found that in situ shading
the sponge Lamellodysidea chlorea for two weeks resulted in loss of 40% of the area covered
by shaded individuals, indicating dependence of the host sponge on the symbionts
(Oscillatoria spongeliae (Schulze) Hauck, 1879). Chesire et al., (1997) worked with the
phototrophic sponge Phyllospongia lamellosa which is found to depths of 30 m on Davies
Reef. Photophysiology show that this corresponds to the depth at which the sponge–symbiont
system can meet 80% of its daily respiratory carbon needs photosynthetically. At depths
greater than 20 m it could not compensate for the reduced light intensity. The respiration rate
of Phyllospongia was significantly greater than that of the heterotrophic sponge Ianthella to
an extent that depended on season and location. The photosynthetic activity of the symbionts
also appears to have an important influence on the sponges’ distribution patterns e.g. Cliona
viridis complex sponges are more successful in well-lit environments (Schönberg et al.,
2005). The photosynthetic behavior of two Cliona species was used to generate additional
taxonomic information. Sponge–dinoflagellate symbioses were well adapted to low light due
to the hosts’ endolithic lifestyle. Zooxanthellae are able to enhance tissue growth and
bioerosion rates of the sponges, but the study indicates that the metabolic activity of C.
viridis depends on photosynthetic activity of its symbionts, whereas C. nigricans appears to
have a higher pumping intensity and is more actively filter feeding.

11
2 OBJECTIVES The present study uses the Seabed AUV platform to characterize five known MCE areas in
Puerto Rico: La Parguera, Guánica, Vieques, Desecheo, and Bajo de Sico. This study will fill in
some gaps in knowledge for other depth ranges at these sites, provide valuable information on
both coral and sponge communities in these areas, and provide baseline sessile-benthic
community characterizations as well as a water quality database, all of which are necessary for
mapping, monitoring and conservation of MCEs.
The main objective of this study is to increase the understanding between biotic and abiotic
aspects of mesophotic reef ecosystems and to address the following questions:
Question 1: Is there a spatial and temporal (seasonal and interannual) variation of penetration of
light in the water column as measured by the diffuse attenuation coefficient (K490)?
Question 2: Is MCE structure affected by geomorphology, area, transect, depth, distance to land,
K490 or chlorophyll a concentration?
Question 3: Is the level of analysis (species, groups, communities) important?
Question 4: Do any of the above factors, if any, explain patterns of distribution of sponges in
terms of color or morphology?

12
3 Community Ecology / Characterization of Five Mesophotic Coral Ecosystems (MCE) in Puerto Rico.
3.1 Introduction
Definition and Importance of MCEs:
The term mesophotic was recently adopted to refer to deep but light-dependent coral
ecosystems, starting at 30-40 m to the bottom of the euphotic zone, which varies by location and
extends to over 100 m in some regions (Kahng et al., 2010). Mesophotic Coral Ecosystems
(MCEs) are important because according to the “deep reef refugia” (DRRH) hypothesis (first
postulated by Glynn in 1996):
1. MCEs are protected from disturbances that affect shallow areas (e.g. non-point source
pollution sources such as sediment/nutrient runoff, storms, bleaching, sediment resuspension by
industrial transport),
2. they can potentially provide a viable reproductive source/sink of larvae, including endangered
shallow scleractinian corals, fishes, decapods or mollusks of commercial or conservational
importance; and
3. serve as nursery for these critical reef populations (Lesser et al., 2009).
This “deep reef refugia” hypothesis has gained popularity over the last years (Riegl and
Piller, 2003; West and Salm, 2003; Armstrong et al., 2006; Lesser, 2009). However, MCEs
remain largely unexplored and consequently very poorly understood due to the difficulties
associated with working near or below the depth limits of recreational diving (Pyle, 1996; Menza
et al., 2008). Understanding of MCEs is critical for a broader understanding of our shelf

13
resources, and the ecology, biodiversity and connectivity of all coral reef ecosystems (Lesser et
al., 2009).
Distribution of MCEs:
The relatively small amount of information on mesophotic coral reefs greatly contrasts with
that of shallow coral communities (Bak et al., 2005; Menza et al., 2008). However, the
increasing availability of deep-water technologies (rebreathers, ROVs, AUVs, manned
submersibles) has revealed a whole new realm of unexplored habitats. Jamaica, Bahamas,
Northern Gulf of Mexico, and Puerto Rico are some of the best studied areas (Bongaerts et al.,
2010; Kahng et al., 2010, Locker et al., 2010). According to Locker et al. (2010) they estimate
that 46% of the potential MCE habitat corresponds to the US Caribbean (3892 km2).
Distribution of MCEs is determined by a combination of factors including geomorphology,
sedimentation, light availability and temperature gradients (Locker et al., 2010). In terms of
geomorphology there are two broad categories of MCE habitat: low-gradient platforms and high
gradient slopes (Locker et al., 2010). Low gradient platform MCE habitats include “outer insular
shelves that dip gently into mesophotic depths and more isolated banks with relatively flat tops
that rise into the mesophotic zone” (Locker et al., 2010). These type of MCEs have been
described for large areas between the islands of St. Thomas, Culebra and Vieques (García-Sais et
al., 2008; Rivero-Calle et al., 2009), and more isolated banks such as Bajo de Sico (García-Sais
et al., 2008). On the other hand, “slope habitats refer to the steeper margins of insular shelves
and banks that extend from the platform break to the adjacent basin” (Locker et al., 2010).
Examples of these include: La Parguera, Guánica and Desecheo (Armstrong et al., 2008; García-
Sais et al., 2008).

14
Consistent and comprehensive synoptic information on geomorphology, sedimentation, light
availability and temperature gradients at appropriate spatial scales is presently unavailable,
preventing statistically robust means of predicting mesophotic distribution” (Locker et al., 2010).
Temperature decrease with depth is probably not a significant abiotic factor affecting community
structure of MCEs in tropical regions (Lesser et al., 2009). The deepest records for zooxanthellae
corals by location are generally associated with the highest optical water quality as measured by
Kd PAR (Kahng et al., 2010). This study tackles the parameter light availability in MCEs by
means of the vertical attenuation of light in the water column.
MCES in Puerto Rico:
Previous studies in Puerto Rico include: 1. the Seward Johnson-SeaLink submersible survey
in 1985 to perform a qualitative characterization of benthic communities and fishes from 100 to
1250m, 2. Seabed AUV benthic characterization surveys at la Parguera shelf edge (Armstrong et
al., 2002; Singh et al., 2004, Armstrong et al., 2008) and Vieques (Rivero-Calle et al., 2009); and
3. diving surveys of the benthic and fish communities in Desecheo, Bajo de Sico and Vieques
(García-Sais et al., 2008; García-Sais 2010). The Seabed AUV long (km-scale) photo transects
represents the first large-scale efforts to effectively map and characterize MCEs using high
resolution optical imagery (Locker et al., 2010).
Sponge’s role in MCEs
Sponges are abundant and functionally important members of the benthic communities on
coral reefs (Lesser 2009). They couple water column productivity to the benthos (Gili and Coma,
1998), are a major component of coral reefs biodiversity and provide habitat to many fish and

15
invertebrates species which are managed by local or state regulations as well as by treaties or
conventions (Díaz and Rützler, 2001).
Sponges throughout the Caribbean show a pattern of increasing biomass and diversity with
depth down to 150 m (Lesser 2004). Sponge biomass on Caribbean reefs is 5-6 times greater
than on the Great Barrier Reef (Wilkinson, 1983). In Jamaica, Lang et al. (1975) described how
slow growing demosponges were the primary substrate builders at depths of 70-100m. Sponges
are suspected to be responsible for supplying complexity/rugosity in the deeper parts of MCEs
where scleractinians are scarce and mostly plate-like. Local physical differences that change with
depth, such as the influence of wind-driven currents, tidal currents, solar irradiance, and water
temperature, can significantly influence sponge biology (Lesser 2004). The responses of
demosponges to different physical conditions (in shape, pigmentology, consistency) make them
potential indicators of changes in physical conditions. Nonetheless, most studies examining the
effects of biotic and abiotic processes on coral reefs have long focused on scleractinian corals
(Lesser et al., 2009).
Despite sponge abundance, functionality and dominance in many MCEs, information
regarding the taxonomic composition and ecology is scarce. A quantitative understanding of
MCE community structure is required to monitor change across time and gain insight into
processes that affect change (Kahng et al., 2010). It is critical to monitor not only coral but
sponge species that occur in Caribbean MCEs.
16
3.2 Material and Methods
Two survey efforts with the Seabed AUV were performed during 2004 and 2008 to assess and
characterize previously known and potential MCEs around Puerto Rico and St. Thomas, U.S.
Virgin Islands. Five areas were selected for this study: La Parguera, Guánica, Desecheo,
Vieques, and Bajo de Sico. The first two representing steep slope MCEs and the other three
representing gentle slopes or platform MCEs. The Seabed AUV platform provided 13 photo
transects, where each frame has bathymetry and GPS positioning associated to it. The
phototransects were of approximately 1 km in length, starting at the insular shelf and down the
slope to depths up to 120 m. Each AUV photo transect is composed of several hundreds (in some
cases thousands) of images. Frames taken above 30m depth or below 100m were discarded from
the analysis, overlapping images were also discarded. All the remaining images that had optimal
quality were analyzed with CPCe program version 3.6 (Kohler & Gill, 2006). The number of
optimal frames obtained was over 2000. CPCe is a Windows-based software that provides a tool
for the determination of percent cover, diversity indices, and richness and evenness using
transect images. It is in our best interest to document as many frames as possible, not only to
account for natural variation but to be able to produce better quality GIS maps that provide an
extra spatial insight into the study. Due to time constraints, in those cases were the number of
frames to be analyzed greatly exceeded those from other transects (Bajo de Sico, Vieques at 30-
40m depth ranges), 25-26 images were selected at random for each given depth range.

17
2004 2008
LP GUA Bajo de Sico Desecheo Vieques depth LP5 LP6 LP7 LP8 GUA04 GUA08 BAJO1 BAJO2 DES1 DES2 VIE6 VIE71 VIE72a=30-40m 21 19 11 14 24 25 9 41 26 25b=40-50m 10 2 10 6 28 8 34 49 20 30c=50-60m 6 6 7 6 19 7 25 42 40 d=60-70m 8 5 7 8 23 6 25 26 28 32 e=70-80m 10 6 6 8 7 8 25 26 29 24 f=80-90m 10 6 12 11 10 10 25 25 24 17 g=90-100m 10 5 8 1 14 6 21 18 16 total N 75 30 69 51 115 69 121 77 200 187 41 46 55# of random points 80 60 70 60 60 60 60 60 60 60 60 60 60
Table 1. Transects per site and number of images analyzed per depth range (a to g) and transect and number of random points used.
3.2.1 Reef Characterization
CPCe software randomly placed a certain number of points over the image. The organism under
each point is identified to the lowest possible taxon and is assigned to one of the eight categories:
scleractinian corals, sponges, macroalgae, gorgonians, black corals, sand, other or unknown
organisms and shadow. The software automatically generated an average percent cover per
frame, which was then averaged for every 10 m depth range. Percent cover values are expressed
as the number of points intercepting each species, divided by the total of points in the quadrat.
As a result, species richness and percent cover of the major benthic groups for each depth range
along a gradient was obtained for each transect. Special attention was given to the sponge and
coral species.
To determine the representative number of random points required for the frame analysis three
images per transect were chosen to represent high, medium and low coral cover areas in the
transect. Each of them were analyzed using different numbers of random points in order to
evaluate the least number of random points required for estimating the percent coral cover

18
present in the image. The number of random points that would give a cost-effective estimation of
the true cover variability of the major benthic groups was determined from the relationship
between percent cover and the number of random points. This number must provide a good
estimate of cover in all three situations of coral cover (high, medium, low) and was maintained
for the whole transect. In most transects, sixty random points were enough to estimate percent
cover and return a representative sample of the species richness. Only some transects of La
Parguera (transect 5 and transect 8) required a higher number of random points (80 and 70
random points respectively). Distance from camera to seabed was kept constant and it provided a
photoquadrat of approximately 4m2.
Number of individuals/colonies was not chosen as a measure of abundance because of the clonal
nature of colonial invertebrates. Ultimately, percent cover can be a more informative parameter
in terms of reef characterization and use of space, which is the goal of this study.
3.2.2 Sponges Distribution
Special emphasis was made on sponges: number of species, color (brown, red, orange,
yellow, cream, blue, green, pink-purple), and morphology (tubes and pipes, boring and
encrusting, massive, cup-like (barrel or vase), branching, erect). Species identification guides
used include: Humman (1999), “Sponge Guide” (Zea et al., 2009), “Coralpedia” v.1.0, Gammill
(1999).
3.2.3 Diffuse attenuation of light (K490)
Temporal and spatial variation in light attenuation coefficient (K490) were obtained using
MODIS Aqua level 3 satellite imagery at 4km resolution, producing monthly averages from
2003-2008. MODIS was chosen because it is readily available (http://oceancolor.gsfc.nasa.gov/)

19
it has a multispectral sensor, including a band at 490nm, its Aqua satellite was chosen because of
the range of years that were of interest to the study and its daily revisit cycle. The orbit is sun-
synchronous, meaning that the satellite always passes over a particular part of the Earth at about
the same local time each day. Aqua always crosses the equator from south to north at about 1:30
PM local time. This meant that the cloud cover that usually forms over Puerto Rico during the
afternoon (especially during the rainy season) sometimes hampered the chances of obtaining
information from the satellite. For this reason, data collected in a daily or even weekly basis for
the sites chosen presented too many gaps, thus selecting a monthly average instead. The highest
spatial resolution available at level three (4 km) was chosen.
3.2.4 Statistics and GIS
Geophysical, hydrographic and biological information was georeferenced and included
on a GIS map using ArcGIS 9x. Biological data was statistically analyzed using non-parametric
methods, classification and ordination analyses were performed with CLUSTER, NMDS,
ANOSIM and SIMPER routines in Primer 6.0 statistical package1. Double standardization of the
data was performed to smooth the effects of dominant species/groups. Data ordination was based
on Bray-Curtis euclidean distances.
Variations in percent cover as a function of depth were evaluated in terms of community
structure, sessile-benthic groups (i.e. sponges, corals, algae, gorgonians, black coral cover), live
cover (pooling together algae, coral, sponge, gorgonian and black coral cover vs. bare substrate),
1 ANOSIM is a permutation-based hypothesis testing, an analogue of univariate ANOVA which tests for differences between groups of (multivariate) samples. SIMPER identifies the species primarily providing the discrimination between two observed sample clusters. CLUSTER routine performs a hierarchical agglomerative/divisive classification into sample groups. the non-metric multidimensional scaling (NMDS) is a visualization method for patterns in species composition and environmental variables

20
coral species and sponge species. For each of the former categories ANOSIM analyses were
performed to evaluate differences between samples due to slope, area, transects, depth, average
k490, chlorophyll a concentrations and distance to land. Average light attenuation values (k490)
and chlorophyll a concentrations were obtained from MODIS Aqua imagery (see Chapter 3).
Distance to land was calculated using ArcGIS tools. Following Locker et al. (2010) only two
broad categories were considered under factor slope: steep slope and gentle slope or platform.
Five areas were established: La Parguera (LP), Guánica (GUA), Vieques (VIE), Bajo de Sico
(BAJO) and Desecheo Island (DES). Within each area there were 2-4 different transects for a
total of 13 transects. Each transect was divided into depth ranges 30-40m (a), 40-50m(b), 50-
60m(c), 60-70m(d), 70-80m(e), 80-90m(f), 90-100m(g).
K490 averages were classified in three ranks 0.03-0.04 m-1 (low), 0.04-0.05 m-1
(medium), 0.05-0.06 m-1 (high). Similarly, average chlorophyll a concentrations were classified
in three ranks 0.01-0.02 mg/m-3 (low), 0.02-0.03 mg/m-3 (medium), 0.03-0.04 mg/m-3 (high).
Distance to land was also divided into three ranks 1-10 km (1), 10-15 km (2), 15-25 km(3).
Regressions between biotic and abiotic factors were performed with Statistica 7.0 after
appropriate transformation. Square-root transformations were applied to vertical attenuation of
light (K490) data, distance from land was log transformed and percent cover was arcsine root
transformed.

21
3.3 Results
A total of 1116 images were selected, analyzed and revised, covering a total area of over 3.7
km2. A total of 77 species of sponges and 28 species of coral were identified to the lowest
taxonomic level.
3.3.1 Spatio-temporal variation of K490.
Bajo de Sico, Desecheo and Vieques locations exhibited the clearest waters, La Parguera (except
transect 7) and Guánica had the highest average K490 values and the greatest variations (Fig. 1).
Figure 1. Average monthly K490 values for each site between 2003-2008. Error bars represent range of variation.
3.3.2 Community structure:
Significant differences were found in community structure for all the factors considered: slope
(ANOSIM R=0.446, P<0.001), area (ANOSIM R=0.444, P<0.001), depth (ANOSIM R=0.137,

22
P<0.001), transects (ANOSIM R=0.605, P<0.001), distance to land (ANOSIM R=0.375,
P<0.001), average k490 (ANOSIM R=0.52, P<0.001) and average chlorophyll a (ANOSIM
R=0.375, P<0.001) (Table 2). Ordination by non-metric multidimensional scaling analysis
(NMDS) plotted communities in three groups according to area (fig. 2) or two distinct groups
according to slope (fig 3). Pairwise tests showed that there were significant differences among all
areas. In terms of the depth factor, pairwise tests showed that there are significant differences
between 30-40m (a) and the deeper ranges 50-100m (c, d, e, f, g) (p<0.002 in all cases) and
between 40-50m ranges and the deepest ranges 80-100m (p<0.04), the rest of pairwise tests were
not significant (p>0.05). There were no significant differences between transects within Vieques
(p>0.66), or Bajo de Sico (p>0.56), but there were significant differences between transects
within Guánica ( p<0.02), within Desecheo (p<0.003), and all transects within La Parguera area
(p<0.028), except between tr7 and tr8 (p=0.234). Significant differences among k490 ranks
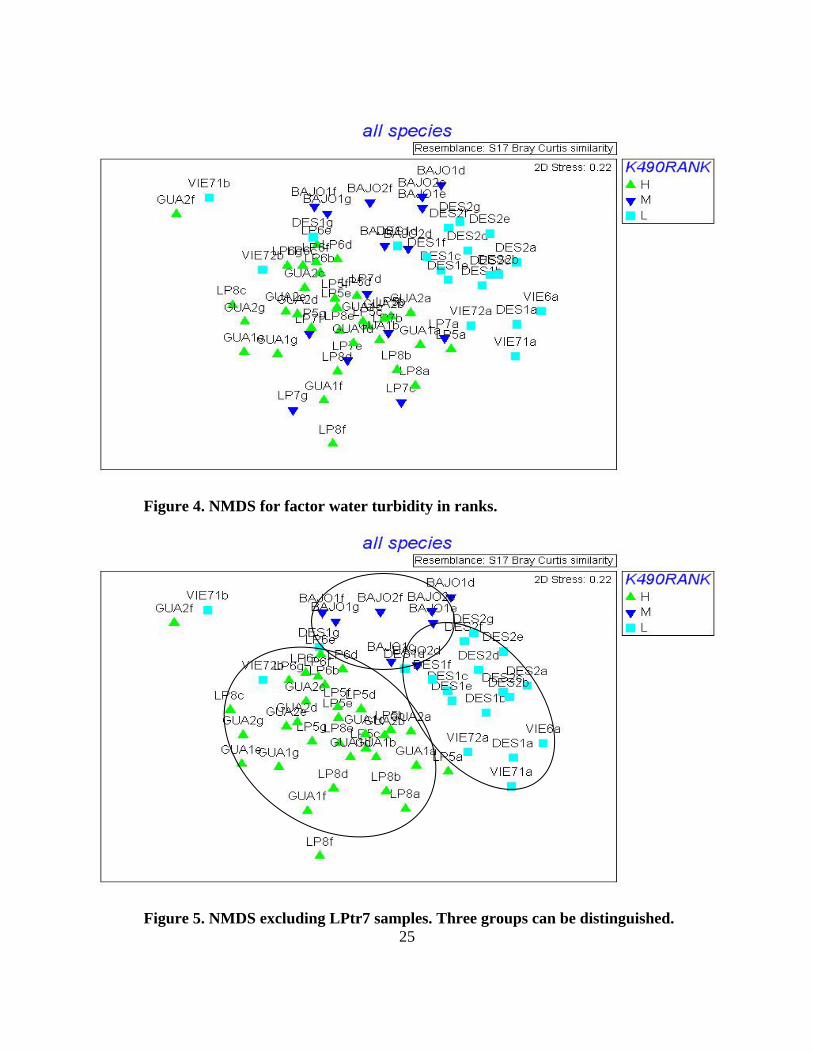
(p<0.001) were also reflected on NMDS ordination, communities arranged in three groups
according to k490 ranks, only one transect (LPtr7) did not follow the trend which had a
intermediate k490 and was grouped with the low k490 group (Fig. 4). However, when this
transect was removed from the analysis, differences between the three k490 groups were more
evident (fig 5). With or without this transect, the pairwise tests showed significant differences
(p<0.002) among transects. In the same way, distance to land factor pairwise tests revealed that
there were no significant differences between group1 and 2 (R= 0.025, p=0.398) and significant
differences (p<0.001) between 1 and 3 and 2 and 3. Chlorophyll a results followed the same
pattern, showing significant differences between groups 2 and 3 (p=0.007) and 1 and 3
(p<0.001), but not between 1 and 2 (p=0.139).

23
communities R P significance
slope 0.446 0.001 area 0.444 0.001 depth 0.137 0.001 transects 0.605 0.001 k490 0.52 0.001 k490R 0.373 0.001 chla 0.375 0.001 chlaR 0.161 0.001 distance to land 0.375 0.001
distanceR 0.322 0.001
A
groups R P significance
slope 0.536 0.001 area 0.518 0.001 depth 0.09 0.008 transects 0.481 0.001 k490 0.479 0.001 k490R 0.344 0.001 chla 0.479 0.001 chlaR 0.306 0.001 distance to land 0.314 0.001
distance to landR 0.412 0.001
B
Live cover R P significanceslope 0.115 0.031 area 0.501 0.001 depth -0.04 0.899 transects 0.434 0.001 k490 475 0.001 k490R 0.323 0.001 chla 0.475 0.001 chlaR 0.176 0.002 distance to land 0.37 0.001
distance to landR 0.476 0.001
C
corals R P significance slope 0.082 0.018 area 0.114 0.016 depth 0.068 0.012 transects 0.19 0.001 k490 0.207 0.001 k490R 0.031 0.225 chla 0.207 0.001 chlaR 0.105 0.01 distance to land 0.114 0.001
distance to landR 0.037 0.209
D
sponges R P significance
slope 0.397 0.001
area 0.392 0.001 depth 0.067 0.021
transects 0.697 0.001 k490 0.479 0.001
k490R 0.282 0.001 chla 0.479 0.001
chlaR 0.186 0.001 distance to land 0.386 0.001 distance to landR 0.283 0.001
E
Table 2. ANOSIM results for each factor at each different level. a) Community level, b) Sessile-benthic groups, c) Total live cover, d) Coral species, e) Sponge species. Red numbers represent significant results (p<0.05).

24
Figure 2. NMDS results for the community level and factor area location.
Figure 3. NMDS results for the community level and factor slope.
25
Figure 4. NMDS for factor water turbidity in ranks.
Figure 5. NMDS excluding LPtr7 samples. Three groups can be distinguished.

26
When pooling together coral, sponge, gorgonian and black corals in a “live cover” category,
significant differences were found for the following factors: slope (ANOSIM R=0.115,
P=0.031), area (ANOSIM R=0.501, P<0.001), transects (ANOSIM R=0.434, P<0.001), distance
to land (ANOSIM R=0.37, P<0.001), average k490 (ANOSIM R=0.475, P<0.001) ), and average
chlorophyll a (ANOSIM R=0.475, P<0.001) (Table 2). No significant differences were found for
factor: depth (ANOSIM R=-0.404, P=0.899). No significant differences were found for any
pairwise comparison between depth ranges. Live cover was similar at all depth ranges. ANOSIM
results showed significant differences in live cover among chlorophyll a groups but paired tests
showed no significant differences between intermediate and extremes (p>0.48). There were
significant differences (p>0.01) in live cover paired comparisons between any two areas except
between LP&GUA (p>0.062). Significant differences (p<0.001, each) were found in live cover
with distance to land 1&3 (coastal and oceanic) and 2 & 3 (intermediate and oceanic), but no
significant differences between distance to land 1 and 2 (p>>0.001) coastal and intermediate
distances.
3.3.3 Live cover results:
Figure 6. NMDS comp
aring live cover among sites. Results show two clear groups.

27
1.1.1 Sessile-benthic groups:
Significant differences were found in sessile-benthic groups structure for all the factors
considered: slope (ANOSIM R=0.0536, P<0.001), area (ANOSIM R=0.0518, P<0.001),
transects (ANOSIM R=0.481, P<0.001), depth (ANOSIM R=0.09, P=0.008), distance to land
(ANOSIM R=0.314, P<0.001), average k490 (ANOSIM R=0.479, P<0.001) and average
chlorophyll a (ANOSIM R=0.479, P<0.001) (Table 2). Even though benthic groups showed
significant differences with depth, pairwise tests only showed significant differences (p<0.006)
between the shallow waters (30-40m) and any other depth range (50-100m). SIMPER test within
depth similarities ranged from 37 to 57%. In the shallow depth range (30-40m) gorgonians
contributed the most to the similarity (35%) and corals added another 22% to cumulative
similarity. Sponges percent cover was the greatest single contributor (ranging between 31-37%)
to within depth similarities for the intermediate depths (40-80m). Whereas in the deepest ranges
(80-100m) it was black corals and abiotic that contributed the most (28-33%) to these
similarities. Area pairwise tests showed significant differences among all areas (<0.017).
SIMPER tests revealed that La Parguera area shared a 62% similarity and this was due to the
joint contribution by abiotic components (sand, pavement rubble) and sponges for a 63%
cumulative contribution. Results are similar for Vieques transects (41% similarity within area)
for a 75% cumulative contribution by abiotic and sponges. Guánica is different in that the major
contributor to the 54 % similarity here is black coral with a 45% contribution. Algae is the major
contributor in Bajo de Sico (41%) and Desecheo (50%) followed by corals and sponges,
respectively. Chlorophyll a pairwise tests results were different to those for community structure,

28
because now the significant differences are between 1 and 2 (p<0.002), and 1 and 3 (p<0.001),
but there are no significant differences between 2 and 3 (p=0.191). Major contributors to k490
rank similarities are as follows: 27% black coral cover (high), 29% sponges (medium), 39%
algae (low). Groups where 60% dissimilar according to the SIMPER test for differences between
“steep slope” and “low-gradient or platform samples”. [“Steep slope” samples had an average
57.3% similarity within group, whereas “platform” samples had a 49% similarity (SIMPER
test)]. Algae contributed to 41% of the similarities within the group of platform samples and
abiotic cover and black corals accounted for 60 % cumulative similarities in steep slope groups.
Sponges contributed to these similarities in 23% and 24% respectively. Transect results showed
no significant differences (p>0.05) within Bajo de Sico, Desecheo, Vieques or La Parguera
transects but showed significant differences between Guánica transects (p<0.023).
The highest average percent live cover was found in Bajo de Sico and Desecheo (up to
95% at Bajo de Sico 90m), corresponding with the lower mesophotic zone (50-100m). The upper
mesophotic zone exhibited the highest live cover in the other three locations, but never matched
values of the other two. Guánica showed up to 80% live cover at 40m. The lowest average
percent cover (1-2 %) was found in Vieques 40-50m depth range coinciding with extensive
sandy areas.
Maximum average percent coral cover was 21% in Vieques at 30-40m. Coral cover was
highest at 30m and decreased with increasing depth until it practically disappeared after 70 m
depth. Bajo de Sico and Desecheo were the exception; they showed its maximum (16%) at 70-
80m depth.

29
Sponges had a somewhat constant behavior for all sites and depths, its cover ranging on
average between 6-16%, except for Vieques that had very low values. Maximum values
corresponded to the shallowest ranges except for LPtr8 and both transects in Bajo de Sico where
the maximum occurred in the lower mesophotic zone (below 60m).
Algae average cover was higher in Bajo de Sico and Desecheo sites as opposed to La
Parguera, Guánica and Vieques. Algae cover was usually higher at the lower mesophotic depths
for the first two cases and at shallow depths in the rest of the cases.
Black corals were typically found in steep slope areas below 40m especially beyond 60m
depth and particularly in one of the two transects in Guánica. Black corals exhibited a low
average cover, starting at 40m depths and increasing with depth, but they did not exceed 10%
(with the exception of GUA1 transect). They were not reported in Vieques and were practically
inexistent in Bajo and Desecheo. A practical disappearance of gorgonians below 40m depth
should also be noted as it seems that this functional group appears to be replaced by black corals.
Live cover, algae cover and coral cover showed a significant negative relationship with
water turbidity for depths beyond 50m (fig. 13, 15, 17) and almost no relationship in the upper
mesophotic zone (30-50m). At the same time, they all showed a positive correlation with
distance from land but the regression tends to be considerably stronger at lower mesophotic
depth ranges (fig. 14, 16, 18). These relationships are not so clear for sponge cover, where a
weak correlation between sponge cover and water turbidity was found but a positive relationship
between sponge cover and distance from land was evident (Fig. 19, 20). This correlation was
stronger at the upper mesophotic zone (30-50m). Distance from land showed a significant
negative correlation with water turbidity (R2= 0.746).

30
Figure 7. Live percent cover per transect and depth range

31
Figure 8. Algae percent cover per transect and depth range

32
Figure 9. Coral percent cover per transect and depth range

33
Figure 10. Sponge percent cover per transect and depth range

34
Figure 11. Black coral percent cover per transect and depth range.

35
Figure 12. Gorgonian percent cover per transect and depth range

36
Figure 13. Regression between live percent cover and vertical attenuation of light. Rhombus, dotted line and unshaded equation correspond to the upper mesophotic range (30-50m deep) results. Triangles, solid line and shaded equation correspond to the lower mesophotic range (50-100m) results.
Figure 14. Regression between live percent cover and distance from land. Rhombus, dotted line and unshaded equation correspond to the upper mesophotic range (30-50m deep) results. Triangles, solid line and shaded equation correspond to the lower mesophotic range (50-100m) results.

37
Figure 15. Regression between algae percent cover and vertical attenuation of light. Rhombus, dotted line and unshaded equation correspond to the upper mesophotic range (30-50m deep) results. Triangles, solid line and shaded equation correspond to the lower mesophotic range (50-100m) results.
Figure 16. Regression between algae percent cover and distance from land. Rhombus, dotted line and unshaded equation correspond to the upper mesophotic range (30-50m deep) results. Triangles, solid line and shaded equation correspond to the lower mesophotic range (50-100m) results.

38
Figure 17. Regression between coral percent cover and vertical attenuation of light. Rhombus, dotted line and unshaded equation correspond to the upper mesophotic range (30-50m deep) results. Triangles, solid line and shaded equation correspond to the lower mesophotic range (50-100m) results.
Figure 18. Regression between coral percent cover and distance from land. Rhombus, dotted line and unshaded equation correspond to the upper mesophotic range (30-50m deep) results. Triangles, solid line and shaded equation correspond to the lower mesophotic range (50-100m) results.

39
Figure 19. Regression between sponge percent cover and vertical attenuation of light. Rhombus, dotted line and unshaded equation correspond to the upper mesophotic range (30-50m deep) results. Triangles, solid line and shaded equation correspond to the lower mesophotic range (50-100m) results.
Figure 20. Regression between sponge percent cover and distance from land. Rhombus, dotted line and unshaded equation correspond to the upper mesophotic range (30-50m deep) results. Triangles, solid line and shaded equation correspond to the lower mesophotic range (50-100m) results.

40
Figure 21. Regression between vertical attenuation of light and distance from land. 3.3.4 Coral species composition:
Significant differences were found in coral species composition for the following factors: slope
(ANOSIM R=0.082, P=0.018), area (ANOSIM R=0.114, P=0.016), transects (ANOSIM R=0.19,
P<0.001), depth (ANOSIM R=0.068, P=0.012), average chlorophyll a (ANOSIM R=0.107,
P<0.001), (Table 2). Significant differences were also found with average k490 (ANOSIM
R=0.207, P<0.001) and distance to land (ANOSIM R=, P<0.001), but there were no significant
differences when compared in terms of ranks of k490 (ANOSIM R=0.031, P=0.225), and ranks
of distance to land (ANOSIM R=0.037, P=0.209). Significant differences between areas were
found between Guánica and Desecheo (p<0.001), Desecheo and Vieques (p<0.008), Bajo and
Vieques (p<0.003), Bajo and Desecheo (p<0.029). The only significant differences in depth were
between 30-40m depth range and any other depth beyond 40m (p<0.046). SIMPER revealed that

41
Montastraea cavernosa, Diploria spp. and Siderastrea spp. (for the 30-50m depth ranges) were
the species that contributed the most to these similarities, they each contributed from 22-30% to
within depth range similarities. The species that contributed the most to differences between and
within depth ranges was Agaricia sp. It contributed anywhere from 40-94% to within depth
similarities for the all the depth ranges from 50 to100m, but it was also the first contributor
(responsible for anywhere from 15-56% dissimilarities) in any pairwise dissimilarities
comparison. In terms of distance to land, significant differences (p<0.001) were only found
between intermediate and oceanic distances. Agaricia spp. and Diploria spp. were the genera that
together contributed the most to dissimilarities between groups (38-40% cumulative percent).
Diploria contributed greatly for the similarities within groups 1 and 2 (41% and 68%
respectively), whereas Agaricia contributed the most (69%) to group 3 (oceanic) percent
similarities.

42
Figure 22. Coral species richness per depth and transect.
Figure 23. Sponge species richness per depth and transect.

43
Figure 24. Regression between coral species richness and vertical attenuation of light. Rhombus, dotted line and unshaded equation correspond to the upper mesophotic range (30-50m deep) results. Triangles, solid line and shaded equation correspond to the lower mesophotic range (50-100m) results.
Figure 25. Regression between coral species richness and distance from land. Rhombus, dotted line and unshaded equation correspond to the upper mesophotic range (30-50m deep) results. Triangles, solid line and shaded equation correspond to the lower mesophotic range (50-100m) results.

44
Figure 26. Regression between sponge species richness and vertical attenuation of light. Rhombus, dotted line and unshaded equation correspond to the upper mesophotic range (30-50m deep) results. Triangles, solid line and shaded equation correspond to the lower mesophotic range (50-100m) results.
Figure 27. Regression between sponge species richness and distance from land. Rhombus, dotted line and unshaded equation correspond to the upper mesophotic range (30-50m deep) results. Triangles, solid line and shaded equation correspond to the lower mesophotic range (50-100m) results.

45
3.3.5 Sponge species composition:
Significant differences were found in sponge species composition for all factors considered:
slope (ANOSIM R=0.397, P<0.001), area (ANOSIM R=0.392, P<0.001), transects (ANOSIM
R=0.0697, P<0.001), depth (ANOSIM R=0.67, P=0.021), distance to land (ANOSIM R=0.386,
P<0.001), average k490 (ANOSIM R=0.479, P<0.001) and average chlorophyll a (ANOSIM
R=0.479, P<0.001) (Table 2). Significant differences were found for pairwise comparison
between 30-40m depth ranges and anything below 70m (p<0.027) and between 40m and 70m
depth ranges (p<0.017). Pairwise tests revealed no significant differences (p>0.077) between La
Parguera and Guánica sponge species composition. Pairwise tests showed significant differences
between any two other transects in Desecheo (p<0.007). Significant differences were found for
pairwise test between any two k490 ranks (p<0.002). Same thing occurred when comparing
chlorophyll a groups (p<0.021). SIMPER analysis did not point to a single dominant species, no
species contributed more than 6% to the similarities within each factor level.
Table 3. Table showing sponge species richness per transect and depth

46
3.3.6 Sponge color and morphology distribution patterns:
Brown species were the most frequent (fig 28), followed by yellow, orange and red sponges,
accounting for 72 % of the species. The remaining color categories accounted for less than 10%
each. Blue and green sponges tended to be limited to Desecheo and Bajo de Sico, whereas white
sponges where mostly seen in Guánica and La Parguera. Black and pink-purple sponges were
seen at all sites and depth ranges, but never exceeded 2% absolute average cover or 10% relative
cover. Cream-colored sponge cover was not very high either (ca. 4%) but it could reach to 32%
of the relative sponge cover in Desecheo transect 2. Brown, yellow, red and orange sponges were
found at all depths and sites and exhibited the highest relative percent cover, which could range
from 30-100%, but was typically over 50% relative cover. Both the Cluster and NMDS analysis
(fig 29, 33a, respectively) supported the idea that these categories have a similar distribution.
Results were compared with previous studies performed in coral reefs in Panama at shallower
depths (<30m: Wulff, 1994) and deeper down a slope in the Bahamas (>90m: Maldonado and
Young, 1999). It required combining some some categories to allow for comparison of data sets
(fig. 33). Significant differences were observed between red-orange sponges at mesophotic
depths and the other two depth ranges. Results for white, yellow and pink-purple sponges were
similar to that of a shallow reef described by Wulff (1994) and the blue, black and green results
were more similar to those found for a deep slope by Maldonado (1999).

47
Figure 28. Relative percentages of sponge color categories.
Figure 29. Cluster analysis of distribution patterns of sponge color categories.

48
Figure 30. Comparison of the relative percentages of color types at shallow coral reefs (<30m: Wulff, 1994), intermediate (this study) and deep slopes (>90m: Maldonado and Young, 1999). ANOSIM results revealed significant differences in sponge color with all factors except depth
(Table 4a). Results for sponge morphology showed no significant differences with factor slope,
K490 ranks or Chlorophyll a concentration ranks (Table 4b).
Sponge color R
P significance
P significance
slope 0.347 0.001 area 0.322 0.001 depth 0.038 0.127
a
Sponge morphology R slope 0.017 0.266 area 0.125 0.003 depth 0.071 0.013
transects 0.436 0.001 transects 0.33 0.001 k490 0.313 0.001 k490 0.288 0.001 k490R 0.204 0.001 k490R 0.039 0.164 chla 0.313 0.001 chla 0.288 0.001 chlaR 0.117 0.002 chlaR 0.148 0.001 distance to land 0.254 0.001 distance to land 0.307 0.001
distance to landR 0.249 0.001 distance to landR 0.028 0.244
b
Table 4. ANOSIM results for a) sponge color and b) morphology.

49
Over 70% of the sponge species presented a massive or tube-like or cup-like morphology, 12%
corresponded to encrusting sponges, and erect or branching types were the least frequent
morphologies (fig. 31). Massive, cup-like and tube sponges were seen at all depth ranges and
depths although there was a tendency to decrease with depth (fig 49). These categories had a
highest cover in Desecheo transects, whereas the erect morphology was typical of La Parguera
and branching forms where common in La Parguera, Guánica and Bajo de Sico. Encrusting
morphologies were found to be almost equally distributed at all sites and depths (with some
exceptions). These distribution patterns are also reflected in the cluster and NMDS analysis (fig.
32 and 33b).
Figure 31. Relative percentages of morphological types of sponges.
. Figure 32. Cluster analysis of distribution patterns of sponge morphologies.

50
a
b
Figure 33. NMDS showing: a) ordination of colors superimposed on an ordination of sampling sites and depths of sponge species. b) ordination of morphologies superimposed on an ordination of sampling sites and depths of sponge species.

51
Figure 34. Average red sponge species cover per depth and site.
Figure 35. Average orange sponge species cover per depth and site.

52
Figure 36. Average brown sponge species cover per depth and site.
Figure 37. Average yellow sponge species cover per depth and site.

53
Figure 38 Average cream sponge species cover per depth and site.
Figure 39. Average blue sponge species cover per depth and site.

54
Figure 40. Average green sponge species cover per depth and site.
Figure 41. Average black sponge species cover per depth and site.

55
Figure 42. Average white sponge species cover per depth and site.
Figure 43. Average pink-purple sponge species cover per depth and site.
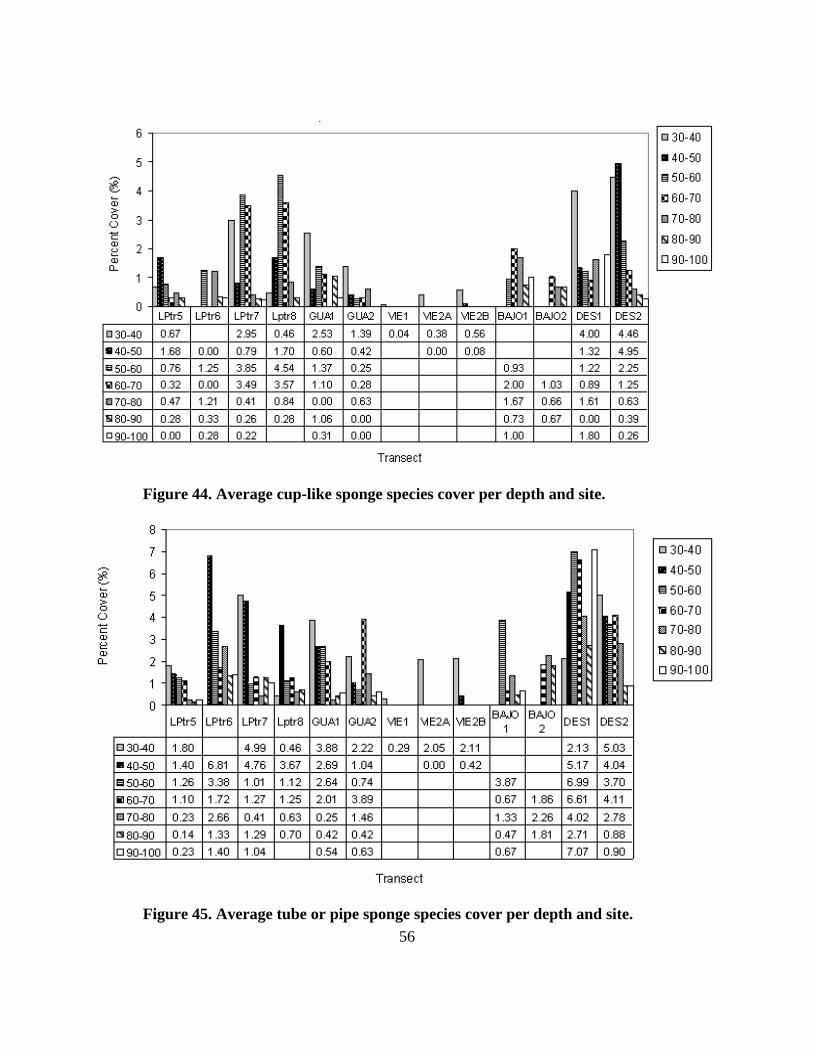
56
Figure 44. Average cup-like sponge species cover per depth and site.
Figure 45. Average tube or pipe sponge species cover per depth and site.
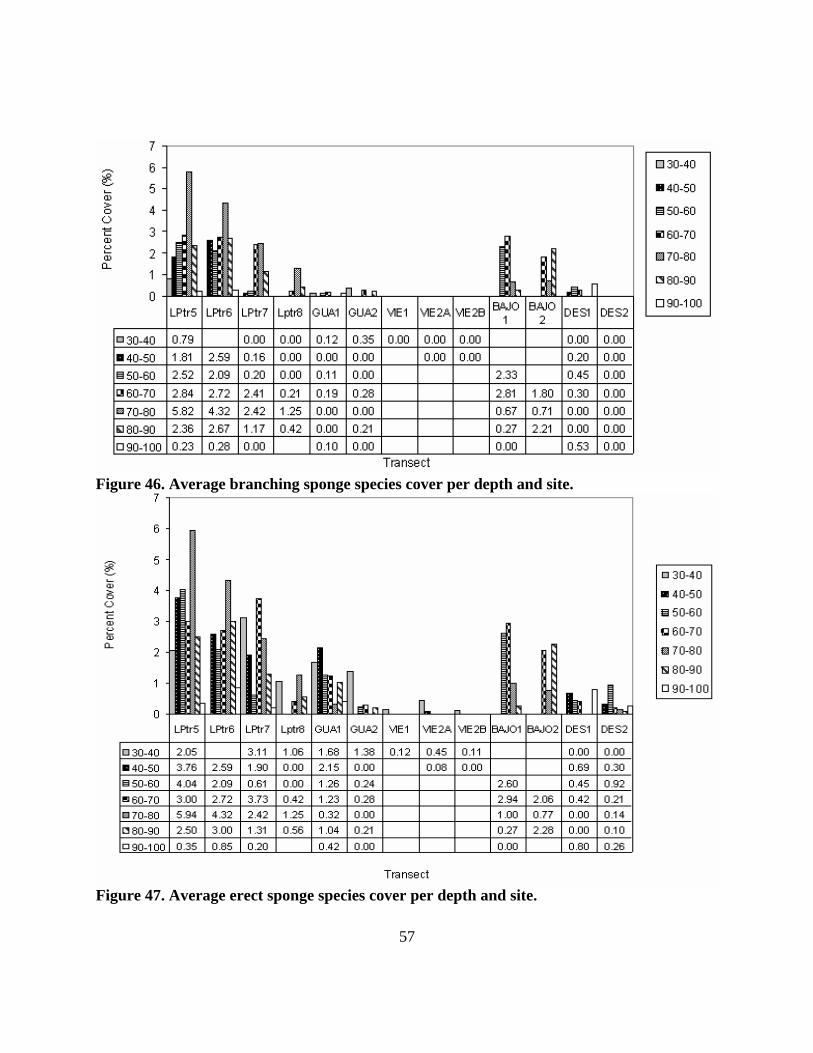
57
Figure 46. Average branching sponge species cover per depth and site.
Figure 47. Average erect sponge species cover per depth and site.

58
Figure 48. Average encrusting sponge species cover per depth and site.
Figure 49. Average massive sponge species cover per depth and site.

59
3.4 Discussion
This study shows that water turbidity, geomorphology, depth, and distance from land are
factors affecting the community structure of MCEs in Puerto Rico. There is not one single factor
that can explain most of the variability observed. Each area features a unique combination of
these factors, thus molding a unique MCE in itself. This uniqueness makes it difficult to describe
general characteristics of MCEs, at least in Puerto Rico.
Level of Analysis
Given the difficulties and constraints related to MCE studies, it is important to evaluate
what level of analysis is the most cost-effective. MCEs in Puerto Rico exhibit significant
differences with all of the factors evaluated (geomorphology, location, depth, transect, k490 and
chlorophyll a concentration, distance from land) at all different levels (live cover, groups,
species, communities).
Only three factors exerted a different response depending on the level of analysis
(community level, live cover, benthic groups, sponge species, coral species), these are depth,
distance to land-ranks and k490-ranks. When comparing different MCEs in terms of species
composition (whether that is sponge species, coral species or the whole community structure) or
sessile-benthic groups there are very significant differences among depths. On the contrary, if the
level of analysis is too general (i.e. total live cover), differences are not significant. Distance to
land and K490 can be confounding factors as well when only coral species are considered. Results
suggest that if only coral species are considered in MCE studies, these may not respond well to
differences in water turbidity ranges or distance to land ranges, whereas these differences were

60
well noted with exact values or using any other level of study or even sponge species instead of
coral species. This is important because the vast majority of MCE research is coral-oriented and
in many cases factors are evaluated in the form of ranks. Studying the communities as a whole is
therefore crucial to avoid this kind of bias.
Geomorphology
This study demonstrates that the geomorphological categories of MCEs (low-gradient
platform (insular shelves and banks) and high gradient slope) proposed by Locker et al. (2010) is
useful to describe or classify MCEs in Puerto Rico. Slope is a determinant factor in terms of
community composition, benthic group dominance and sponge’s species composition. However,
slope did not affect the percent of total live cover or the coral species composition. Live cover
was similar for all depth ranges and areas, so geomorphology might be favoring some groups in
detrimental of others. If live cover is constant among depth ranges regardless of
geomorphological differences, then differences in live cover with area may suggest that the
different benthic groups share the space in a different manner, with some groups/species
compensating for other group/species dominance/absence.
Results showed that low gradient platforms exhibited very high algal cover (the brown
alga Lobophora sp., and the calcareous green alga Halimeda sp.) in Desecheo and Bajo de Sico,
or high coral cover in shallow parts of Vieques, whereas in La Parguera and Guánica live cover
was mostly due to sponges and gorgonians or black corals (depending on depth range). Presence
of Anthipatharids was a major differentiation factor between the two types of MCEs, this could
be used as a potential indicator of geomorphology effects. Results can be explained by the effect
that slope has on exposure to light. The angle of the slope limits light quality and quantity, light

61
incidence is almost direct for gentle slopes as compared to steep slopes that will be mostly
diffuse and this is further limited by depth and turbidity of water column. Angle of slope and
orientation can also limit the number of hours of direct sunlight as opposed to gentle slopes or
platforms that can receive almost constant direct solar irradiance throughout the day. For this
reasons, steep slopes limit development of light-dependent species, whereas low gradient slopes
will give advantage to fast growing photosynthetic groups. Even if availability of light is very
important in molding MCEs, geomorphology and its implications in sedimentation rates should
also be considered. This could be the case in Vieques where water transparency is high and has
the highest percent of coral cover at 30m but mostly sand at the 40-50m depth range, thus
difficulting coral larvae settlement.
Turbidity, distance to land and depth
It is generally assumed that shallow coral reefs have higher coral cover higher diversity
and less disease incidence when they are far from anthropogenic influences. Results suggest that
coral cover and richness have some positive relationship with distance to land, but it is not very
strong. This may be due to the fact that only 5 MCE locations were considered, but it may also
be that this may not be the general rule for MCEs at least not in Puerto Rico where there has
been found surprisingly high coral cover densities in areas such as those found in the south and
east end off Vieques (e.g. Black Jack Reef in García Sais et al., 2008 and Rivero-Calle et al.,
2009), and this study where distance to land is only 2km. The answer may be that may be the
best known coral reefs are more degraded than those that are unknown, as suggested by Menza
(2007); not knowing of its existence may have protected them more than distance itself.

62
Coral cover, macroalgae cover and total live cover tend to increase with distance from
land and decrease with water turbidity. This is not surprising given that they are light-dependent
groups and considering that water turbidity is generally higher in coastal waters. Results were
consistent with previous studies (Bejarano-Rodríguez, 2006, Cardona-Maldonado, 2008) that
showed a negative linear relationship between Kd and distance to land. An interesting addition to
it is that our results were also depth-dependent and regressions were considerably stronger in the
lower mesophotic ranges (50-100m) than the upper mesophotic ranges (30-50m), suggesting that
50m is a critical threshold. The other two studies made comparisons between reefs at a fixed
depth (10m). It should be remarked that results show a linear relationship between coral cover
and Kd, instead of the exponential relationship in Cardona (2008) and that Cardona-Maldonado
studied this relationship in 30 different locations encompassing a relatively high turbidity
gradient whereas this study only considered 8 stations with a narrow range of Kd values. Results
suggest that effects of the cited factors on MCEs are stronger with depth and that MCEs under
50m depth are possibly more sensitive to these factors. Sponges responded somewhat differently
in that 1) there is a positive relationship between percent cover and water turbidity in the 30-50m
depth range and then became negative at the 50-100m depth range, and 2) the positive
relationship between percent cover and distance to land was stronger in the upper instead of the
lower mesophotic ranges. The effect of depth is indirect and related to the amount of incident
light since light is attenuated exponentially with depth.
Coral and sponge species richness
In terms of species richness, there are more species of sponges than corals, which is
expected given the average numbers in the Caribbean. La Parguera exhibited the highest richness

63
of sponge species (60), although this could be due to the fact that it was the only location with
four transects. However, Vieques was the location with the least number of sponge species (27)
even though it included three transects. Bajo de Sico, Desecheo and Guánica had exactly the
same number of species (49). It should be noted that in order to balance the number of frames
analyzed per transect and since Bajo de Sico transects were significantly longer than the rest, a
relatively low number of frames were analyzed, but many other sponge species were observed
that had not been seen on any other locations. Bajo de Sico is a good candidate location to
further study sponge species richness and diversity. Its isolated location may have favored
further speciation and become a sponge hotspot. On the other hand, other platform areas such as
Vieques, MCD, Grammanik Bank, generally have low sponge cover and richness and a higher
coral richness and cover in comparison (personal observation). It was interesting to find such a
high richness in Guánica considering that it is an area subject to very high sedimentation rates,
and turbidity. It would be expected to find few species adapted to such conditions and very
different to anywhere else, however, the high number of sponge species found was very similar
to La Parguera, a clear-water community. It is also interesting to note that both coral and sponge
species richness tends to decrease with depth increase but in both cases there are two peaks, one
at 30-40m and a second one at 60-80m. Furthermore, this kind of bimodal distribution is also
seen on sponge and coral cover. Some possible explanations for the second peak could be the
thermocline, mid-euphotic depth, or a more suitable substrate.
Sponge distribution patterns
Sponges are well known for their intraspecific and interspecific variability in color and
shape. However the causes that explain color and morphology shifts are still poorly understood.

64
In a previous study by Maldonado & Young (1996) they found bathymetric patterns for the
morphology and color of sponges in a Bahamanian deep slope. Results here suggest that
morphology of sponges seem to be related to depth and location, whereas color seems to be
related to geomorphology, turbidity and location, rather than depth. It is important to consider
that color is a subjective character and that the way in which organisms appear under artificial
light is different to those under natural light ranges. However, the goal of this study is to describe
general trends in color distribution patterns of sponges. Furthermore, the categories that may
create conflicts can be grouped together as the carotenoid group, which comprehends red,
orange, yellow, brown sponges.
The causes and ecological significance of sponge color remains unclear for most species
an has puzzled scientists for years, but there is three main hypothesis: 1) pigments such as
melanin or carotenoids may serve as an ultraviolet screen (Jokiel, 1980), 2) bright colors have an
aposematic warning function to predators as toxic or unpalatable (Wulff, 1994), and 3) color is a
random, non adaptative result of some metabolic product (Wicksten, 1989, Maldonado & Young,
1996). Black color is due to melanin pigments, whereas red, orange, brown and yellow pigments
are derived from carotenoids. Red, brown, orange, yellow sponges were the most abundant of all
coloration categories, exhibited very similar distribution patterns across sites and depths and
clustered together in ordination and classification analysis. Since they also had in common the
carotenoid pigmentation, they were artificially grouped as the “carotenoid sponges”. Sponges
cannot synthesize carotenoids de novo, but they have a well developed capacity to modify those
of dietary origin: prokaryotes, fungi, zooplankton and phytoplankton (Lee & Gilchirst, 1985).
Pigments can also be obtained from endosymbiotic bacteria and cyanobacteria (Maldonado and

65
Young, 1999). The existence of black as well as carotenoid sponges at the deepest sites suggest
that these colors are not functioning as a U.V. screen and that carotenoids can be obtained
throughout the water column. Leys et al. (2002) found that larvae of Reniera species show a
phototactic response of cilia to 440nm wavelengths, this spectral sensitivity to blue light has
been attributed to carotenoid pigments. Given that blue light is the spectral range that is subject
to less attenuation by the water column, this specificity is probably not random, it may have been
evolutionary selected and suggests that carotenoids may be playing an important role in sponge
ecology at the photic range.
Distribution of blue, green, pink-purple, white and black sponges were restricted to
certain sites and depths and they were not as common as the carotenoid category. Blue and green
sponges were generally found in Bajo de Sico and Desecheo, which are considered to be
“platform” MCEs, whereas, black or white sponges were seen in “steep-slope” MCEs of La
Parguera and Guánica. The causes for green and blue coloration are poorly understood, but it is
thought that blue color is derived from bacteria or cyanobacteria and green sponges may also
contain algal symbionts (Maldonado and Young, 1999). In the same way, purple pigments are
also derived from symbiotic cyanobacteria. If this is the case and these pigments are derived
from photosynthetic organisms, it is reasonable to expect that these three groups would better
develop in areas where there is a better exposure to light, this being due to water quality,
geomorphology and/or depth. For this reasons, Maldonado & Young did not find any green
sponges in the Bahamas (>90m deep) and almost all of the blue and pink-purple sponges in the
shallow part of the slope. On the other hand, it is not surprising that in turbid or steep-slope areas
where there is less exposure to light there are more black and white sponges. Wulff (1994) found

66
evidence that sponge color was related to predation, so black coloration might be serving here as
camouflage or even as a light trap. Absence of pigmentation or inability to store pigments in
white sponges is probably not critical in deep or cryptic areas, given the absence of visual
predators and explains the remarkable increase shown by this category in Maldonado & Young
(1996). For white sponges, it may be more important to invest resources in a mechanical defense
(provided by spicules), chemical toxicity, or even preventing burial by sediments, rather than an
investment in pigmentation. In deep water, photosynthetic symbionts are replaced by colorless
bacterial symbionts (Maldonado & Young, 1996).
In terms of morphological distribution patterns, tube, cup-like and massive forms may
conform the most adaptive morphologies to an optimal water-circulation in MCEs. These
morphologies also play an important ecological role by providing rugosity and microhabitats for
other organisms. Branching and erect forms may represent an additional adaptation to steep
slopes to enhance water circulation and take advantage of prevailing perpendicular currents in a
comparable manner to black corals and gorgonians in these slope environments. Encrusting
morphologies are often opportunistic, explaining why the distribution pattern is so homogenous.
The number of encrusting species is probably underestimated considering the constraints with
visual-id for this morphology and its abundance in cryptic habitats.
Definition of MCEs
The upper mesophotic ranges (30-50m) share some common characteristics: high coral
cover composed of Montastraea annularis complex species, Diploria and Siderastrea,
gorgonians abundance, few black corals, and highest coral and species richness. Results suggest
that the upper mesophotic range coral reef characteristics are basically a continuation of the

67
shallow coral reefs. The lower mesophotic range is subject to higher sedimentation rates and
lower light environments, limiting coral growth to sparse plate-like colonies and favoring
development of other groups such as black corals, sponges or algae, it is more useful then to
refer to these ecosystems as MREs (Mesophotic Reef Ecosystems), where corals are not
dominant. The gorgonian to black coral transition, together with the Agaricia-dominance
transition pattern and a coral-to-sponge dominance transition may be indicating a change from
euphotic to mesophotic ecosystems. This transition was also noted by García-Saís (2010). True
MCEs maybe should be restricted or redefined as those dense coral-dominant reefs (not just
patches of corals) mainly composed of Agaricids, found in the lower mesophotic range, (usually
between 50-100m, although it may vary according to light penetration in the water column), and
that tend to be associated with the midpoint of the photic range (aprox. 10% of the surface PAR),
typically around 70m deep. This definition is also supported by the fact that response to factors
such as water turbidity, chlorophyll a concentration, and distance to land were different
depending on the depth ranges considered.
Resilience and Connectivity with shallow coral reefs
In 2010 Bongaerts and co-investigators re-assessed the DRRH (Deep Reef Resilience
Hypothesis) focusing on the available data of Caribbean MCES and concluded that 1) although
there is evidence to support that although deep reefs (>30m) may be able to escape the impact of
some shallow water disturbances, they may be affected by others; and 2) the potential for deep
reefs to provide propagules for shallow reef areas seems limited to depth-generalist coral species,
which constitute only ~25% of the total coral biodiversity and may be further limited by specific
historic traits (e.g. reproductive strategy or symbiont acquisition).

68
In terms of reef resilience, this study did not evaluate temporal variations in MCEs,
transects were only conducted once and bleaching incidence was not an original objective.
However, it is worth mentioning that a significant amount of corals in Desecheo and Bajo de
Sico, particularly in the lower mesophotic ranges, showed a degree of “whitening” or
discoloration, whether this was due to bleaching, disease or other causes could not be evaluated
from the image due to the distance from camera to object. However, in 2005 there was a major
bleaching event in the northeastern Caribbean and our transects were conducted in 2004 and
2008. The most recent images were taken in April and the effect was not limited to corals, it also
affected some sponges. Bleaching of sponges has been described by Vicente (1990), but it is
rare. Since date and depth ranges are not consistent with a typical summer bleaching event, one
possible explanation could be internal waves or an upwelling event (Leichter et al., 1998;
Leichter and Genovese, 2006).
There is currently no direct evidence that there is an ongoing larval exchange between
deep and shallow coral populations and it is even more doubtful in the case of sponges, which
generally have very reduced dispersion ranges and many of their larvae are benthic. Sponge
larvae are considered to exhibit short dispersal distances (Mariani et al., 2006) not allowing for
an efficient genetic exchange between deep and shallow habitats. Some sponge species have
been seen over a wide depth range (e.g. Xestospongia muta) but these may be depth-generalist
species. This is not the case with coral species which tend to show a vertical zonation pattern
restricting the chances of generating a pool of genetically adaptative recruits that can help restore
the declining shallow coral reefs. In conclusion, to say that MCEs are resilient to environmental

69
stressors and a genetic reservoir for shallow reefs should be further analyzed and treated with
caution.

70
4 CONCLUSIONS AND FUTURE WORK
There is a general consensus on recommendations for the future research on mesophotic
coral reefs which include the following: 1) Improving the scarce information regarding the
taxonomic composition, depth range, and habitat preferences of MCE species (Kahng et al.,
2010). 2) A better understanding on how physical and chemical factors affect these communities
(Bongaerts et al., 2010), 3) A strong effort in mapping distribution and abundance of MCEs
(Locker et al., 2010, Bongaerts et al., 2010; Kahng et al., 2010).
This study contributes to each of the aforementioned aspects by providing: a better
understanding of how some biotic and abiotic factors may explain MCE distribution, provides a
baseline database on sponge and coral taxonomic composition, depth ranges and habitat
preferences in Puerto Rican MCEs. In addition this contribution on MCE mapping of abundance
and distribution in Puerto Rico and the baseline characterization data can be used for future
modeling of potential MCE habitats. Some specific conclusions are:
1. Studying only one sessile benthic group (especially scleractinians) may result in
misleading conclusions, it is crucial to study the communities as a whole to avoid bias.
2. The geomorphological classification of MCEs proposed by Locker et al. 2010 (low-
gradient platform (insular shelves and banks) and high gradient slope) is useful to describe or
classify MCEs in Puerto Rico. Slope is a determinant factor in terms of community composition,
benthic group dominance and sponge species composition, but not coral species composition.

71
3. Coral cover, macroalgal cover and total live cover tend to increase with distance from
land and decrease with water turbidity.
4. Depth is an indirect factor affecting MCE ecology. Results suggest that effects of the
studied factors on MCEs are stronger with depth and that MCEs between 50-100m depth are
possibly more sensitive to these factors.
5. In terms of species richness, there are more species of sponges than corals and both coral
and sponge species richness tend to decrease with increasing depth.
6. Results here suggest that morphology of sponges seem to be related to depth and location,
whereas color seems to be related to geomorphology, turbidity and location, rather than depth.
7. Distribution of blue, green, pink-purple, white and black sponges were restricted to
certain sites and depths and they were not as abundant as the “carotenoid group”.
8. Tube, cup-like and massive forms may conform the most adaptive morphologies to an
optimal water-circulation in MCEs. These morphologies also play an important ecological role
by providing rugosity and microhabitats for other organisms. Branching and erect forms may
represent an adaptation to steep slopes. Encrusting morphologies are probably opportunistic.
9. Results suggest that in the upper mesophotic range, coral reef characteristics are basically
a continuation of the shallow coral reefs. The lower mesophotic range is subject to low light
regimes and perhaps higher sedimentation rates. These factors are limiting to coral growth
resulting in sparse plate-like colonies and favoring development of other groups such as black
corals, sponges or algae. For this reason it may be more useful to refer to these ecosystems as
MREs (Mesophotic Reef Ecosystems), where corals are not dominant.

72
10. The gorgonian to black coral transition, together with the Agaricia-dominance transition
pattern and a coral-to-sponge dominance transition may be indicating a change from euphotic to
mesophotic ecosystems.
11. To say that MREs are resilient to environmental stressors and a genetic reservoir for
shallow reefs should be further analyzed and treated with caution.

73
REFERENCES
Aponte, N. E. and D. Ballantine. 2001. Depth distribution of algal species on the deep insular
fore reef at Lee Stocking Island, Bahamas. Deep-Sea Research I 48: 2185–2194.
Armstrong, R., Singh H., Torres J. 2002. Benthic Survey of insular slope coral reefs using
Seabed AUV. Backscatter 13 (3): 22-25.
Armstrong, R., Singh H., Torres J, Nemeth R.S., Can A., Roman C., Eustice R, Riggs L., García-
Moliner G. 2006. Characterizing the deep insular shelf coral reef habitat of the Hind Bank
marine conservation district (US Virgin Islands) using the SeaBed autonomous underwater
vehicle. Continental Shelf Research, 26: 194-205.
Armstrong RA, Singh H, Rivero S, Gilbes F. 2008. Monitoring Coral Reefs in Optically-Deep
Waters. Proceedings of the 11th International Coral Reef Symposium. 1: 593-597.
Bak, R.P.M., G. Nieuwland, E.H. Meesters. 2005. Coral Reef crisis in deep and shallow reefs:
30 years of constancy and change in reefs of Curacao and Bonaire. Coral Reefs 24: 475-
479.
Barthell, D. and J. Gutt. 1992. Sponge associations in the eastern Weddell Sea. Antarctic Science
4 (2): 137-150.
Bejarano-Rodriguez, I. 2006. Relationships Between Reef Fish Communities, Water and Habitat
Quality on Coral Reefs. Thesis dissertation. University of Puerto Rico, Mayagüez. 61pp.
Bongaerts, P.; T. Ridway, E.M. Sampayo, O. Hoegh-Guldberg. 2010. Assessing the deep reef
refugia hypothesis: focus on Caribbean reefs. Coral Reefs. 29: 309-327.
Cardona-Maldonado, M.A. 2008. Assessment of coral reef community structure using water
optical properties. Thesis dissertation. University of Puerto Rico, Mayagüez. 149 pp.
Cheshire, AC, CR. Wilkinson, S. Seddon and G. Westphalen. 1997. Bathymetric and seasonal
changes in photosynthesis and respiration of the phototrophic sponge Phyllospongia
lamellosa in comparison with respiration by the heterotrophic sponge Ianthella basta on
Davies Reef, Great Barrier Reef. Marine Freshwater Resources. 48: 589–599.

74
Del Castillo, C.E., P.G. Coble, J.M. Morell, J.M. Lopez, J.E. Corredor. 1999. Analysis of the
optical properties of the Orinoco River plume by absorption and fluorescence
spectroscopy. Marine Chemistry 66, 35–51.
Díaz M.C. and B.B. Ward, 1999. Perspectives on sponge-cyanobacterial symbioses. Mem.
Queensland Museum. 44: 154.
Feitoza, BM Rosa, RS Rocha LA. 2005. Ecology and Zoogeography of Deep-Reef Fishes in
Northeastern Brazil. Bulletin of Marine Science. 76(3): 726-742.
Gammill, ER. 1999. Identification of Coral Reef Sponges. Providence Marine Publishing,
Tampa, Florida. 117 pp.
García-Sais, JR. 2005 Inventory and Atlas of Corals and Coral Reefs, with Emphasis on Deep-
Water Coral Reefs from the U. S. Caribbean EEZ (Puerto Rico and the United States
Virgin Islands) FINAL REPORT. Coral Grant 2003 NAØ3NMF4410352. 215 pp.
García-Sais JR, Appeldoorn R, Batista T, Bauer L, Bruckner A, Caldow C, Carrubba, Corredor J,
Díaz E Lilyestrom C, García-Moliner G, Hernández-Delgado E, Menza E, Morell J, Pait A,
Sabater-Clavell J, Weil E, Williams E. 2008. The state of coral reef ecosystems of the of
Puerto Rico. In: Waddell J, Clarke AM (eds) The state of coral reef ecosystems of the
United States and Pacific Freely Associated States. NOAA Technical Memorandum NOS
NCCOS 73. NOAA/NOS/NCCOS. Center for Coastal Monitoring and Assessment’s
Biogeography Team. Silver Spring, MD, pp 75–116
García-Sais, J. 2010. Reef habitats and associated sessile-benthic and fish assemblages across a
euphotic-mesophotic depth gradient in Isla Desecheo, Puerto Rico. Coral Reefs. 29: 277-
288.
Gili, J.-F., Coma, R., 1998. Benthic suspension feeders: their paramount role in littoral marine
food webs. Trends Ecol. Evol. 13, 316–321.
Glynn PW (1996). Coral reef bleaching: facts, hypotheses and implications. Global Change Biol
2:495–509.
Hu C., E.T. Montgomery, R. W. Schmitt, F. E. Muller-Karger.2004. The dispersal of the Amazon
and Orinoco River water in the tropical Atlantic and Caribbean Sea: Observation from
space and S-PALACE flotas. Deep-Sea Research II 51 (2004) 1151–1171.
75
Hu C., Z. Chen, T. Clayton, P. Swarzenski, J. C. Brock, F.E. Müller-Karger. 2004. Assesment of
estuarine water-quality indicators using MODIS medium-resolution bands: Initial results
from Tampa Bay, FL. Remote Sensing of the Environment. 93: 423-441.
Humman, P. 1992. Reef Creature Identification. New World Publications, Florida. 321 pp.
Jokiel PL. 1980. Solar Ultraviolet Radiation and Coral Reef Epifauna. Science, 207(4435):1069-
1071.
Kahng SE, Garcia R, Spalding HL, Brokovich E, Wagner D, Weil E, Hinderstein L, Toonen RJ.
2010. Community ecology of mesophotic coral reef ecosystems. Coral Reefs. 29: 255-275
Kohler, K.E. and S.M. Gill, 2006. Coral Point Count with Excel extensions (CPCe): A Visual
Basic program for the determination of coral and substrate coverage using random point
count methodology. Computers and Geosciences, 32 (9): 1259-1269.
Lang JC, Hartman WD, Land LS. 1975. Sclerosponges: primary framework constructors on the
Jamaican deep fore-reef. J Mar Res 33:223–231.
Laubenfels, M.. 1934. New sponges from the Puerto Rican Deep. Smithson. Misc. Collect. 91,
No.17, 1-28.
Lee W.L. and B.M. Gilchrist. 1985. Carotenoids patterns in twenty-nine species of sponges in
the order Poecilosclerida (Porifera: Demospongiae): a possible tool for chemosystematics.
Marine Biology, 86, 21-35.
Leichter, J.J., Shellenbarger, G., Genovese, S.J.,Wing, S.R.,1998. Breaking internalwaves on a
Florida (USA) coral reef: a plankton pump at work? Mar. Ecol. Prog. Ser. 166, 83–97.
Leichter, J.J., Genovese, S.J., 2006. Intermittent upwelling and subsidized growth of the
scleractinian coral Madracis mirabilis on the deep fore reef slope of Discovery Bay,
Jamaica. Mar. Ecol. Prog. Ser. 316, 95–103.
Lesser MP, Slattery M, Leichter JJ. 2009. Ecology of mesophotic coral reefs. Journal of
Experimental Marine Biology and Ecology. 375: 1-8
Lesser, M.P., 2004. Experimental biology of coral reef ecosystems. J. Exp. Mar. Biol. Ecol. 300,
217–252.
Lesser, M.P., 2006. Benthic–pelagic coupling on coral reefs: feeding and growth of Caribbean
sponges. J. Exp. Mar. Biol. Ecol. 328, 277–288.

76
Leys, S.P., T.W. Cronin, B.M. Degnan, J.N. Marshall. 2002. Spectral sensitivity in a sponge
larva. Journal of Comparative Physiology. 188: 190-202.
Locker, S.D., R.A. Armstrong, T.A. Battista, J.J. Rooney, C. Sherman, and D. Zawada. 2010.
Geomorphology of Mesophotic Coral Ecosystems: Current Perspectives on morphology
distribution, and mapping strategies. Coral Reefs. 29: 329-345.
Maldonado, M., and C.M. Young. 1996. Bathymetric patterns of sponge distribution on the
Bahamanian slope. Deep-Sea Research I. 43 (6): 897-915.
Mariani S., M.J. Uriz, X. Turon, T. Alcoverro. Dispersal strategies in sponge larvae: integrating
the life history of larvae and the hydrologic component. Oecologia 149 (1): 174-184.
Menza C, Kendall M, Rogers C, Miller J. 2007. A deep reef in deep trouble. Cont Shelf Res
27:2224–2230.
Menza C, Kendall M, Hile S. 2008. The deeper we go the less we know. Rev Biol Trop 56:11–
24.
Muller-Karger, F.E., McClain, C.R., Richardson, P.L., 1988. The dispersal of the Amazon’s
water. Nature 333, 56–58. Müller-Karger, F.E., C.R. McClain, T.R. Fisher, W.E. Esaias,
and R. Varela.1989. Pigment distribution in the Caribbean Sea: Observations from Space.
Prog. Oceanography. 23: 23-64.
Muller-Karger, F.E., Richardson, P.L., McGillicuddy, D. 1995. On the offshore dispersal of the
Amazon’s plume in the North Atlantic. Deep-Sea Research I 42, 2127–2137.
Nelson W.R., R.S. Appledoorn. 1985. A submersible survey of the continental slope of Puerto
Rico and the US Virgin Islands, 1-23 October 1985. Cruise Report, R/V Seward Johnson,
National Marine Fisheries Service, Pascagoula, Mississippi Laboratories, 76 pp.
Pyle, R.L., 1996. Exploring coral reefs: how much biodiversity are we missing? Glob. Biodivers.
6, 3–7.
Riegl B, Piller WE (2003). Possible refugia for reefs in time of environmental stress.
International Journal of Earth Sciences. 92:520–531.
Rivero-Calle S, Armstrong RA, Soto-Santiago FJ. 2008. Biological and physical characteristics
of a mesophotic coral reef: Black Jack reef, Vieques, Puerto Rico. Proceedings of the 11th
International Coral Reef Symposium 1: 567-571
77
Sheppard, C. Coralpedia 1.0: A guide to Caribbean corals, octocorals and sponges.
http://coralpedia.bio.warwick.ac.uk/
Singh H, RA Armstrong, F Gilbes, R Eustice, C Roman, O Pizarro, and J Torres. 2004. Imaging
Coral I: Imaging Coral Habitats with the SeaBED AUV. Subsurface Sensing Technologies
and Applications. 5 (1): 25-42.
Schönberg C.H.L., D. Beer and A. Lawton. 2005. Oxygen microsensor studies on zooxanthellate
Clionaid sponges from the Costa Brava, Mediterranean Sea. Journal of Phycology. 41:
774- 779.
Thacker, RW. 2005. Impacts of shading on Sponge-Cyanobacteria symbioses: a comparison
between host-specific and generalist associations. Integrative and Comparative Biology. 45
(2): 369-376.
Trench, R.K., 1979. The cell biology of plant animal symbioses. Annu. Rev. Plant Physiol. 30,
485–531.
van Soest, R.W.M. 1993. Distribution of sponges on the Mauritanian shelf. Hidrobiologia. 258:
95-106
van Soest, R.W.M. and N Stentoft 1988. Barbados deep-water sponges: Studies on the fauna of
Curacao and other Caribbean Islands. 215: 1-175
Vicente, VP. 1990. Response of sponges with autotrophic endosymbionts during the coral-
bleaching episode in Puerto Rico. Coral reefs. 8 (4): 199-202.
Wicksten, M. 1989. Why are there bright colors in sessile marine invertebrates?. Bulletin of
Marine Science. 45(2): 519-530
Wilkinson, CR. 1983. Net Primary Productivity in Coral Reef Sponges. Science 219: 410-412.
Wilkinson C.R. and E. Evans. 1989. Sponge distribution across Davies Reef, Great Barrier Reef,
relative to location, depth, and water movement. Coral Reefs 8 (1): 1-7.
Wilkinson, CR. 1987. Interocean Differences in Size and Nutrition of Coral Reef Sponge
Populations. Science 236 (4809): 1654 – 1657.
Wilkinson, CR. & Trott, L.A. 1985. Light as a factor determining the distribution of sponges
across the central Great Barrier Reef. Proceedings of the 5th Coral Reef Congress, Tahiti.
5: 125-130.

78
West JM, Salm RV (2003) Resistance and resilience to coral bleaching: implications for coral
reef conservation and management. Conservation Biology. 17:956–967
Wulff, JL. 1994. Sponge feeding by Caribbean angelfishes, trunkfishes and filefishes. Sponges in
Time and Space. 265-271.
Wulff, JL. 2006. Ecological interactions of marine sponges. Canadian Journal of Zoology. 84:
146-166.
Zea, S., Henkel, T.P., and Pawlik, J.R. 2009. The Sponge Guide: a picture guide to Caribbean
sponges. Available online at www.spongeguide.org.

79
APPENDIX A
Species accumulation plot for La Parguera transect 5.
Species accumulation plot for La Parguera transect 6.

80
Species accumulation plot for La Parguera transect 7.
Species accumulation plot for La Parguera transect 8.

81
Species accumulation plot for Guánica transect 1.
Species accumulation plot for Guánica transect 2.

82
Species accumulation plot for Vieques transect 6.
Species accumulation plot for Vieques transect 7A.
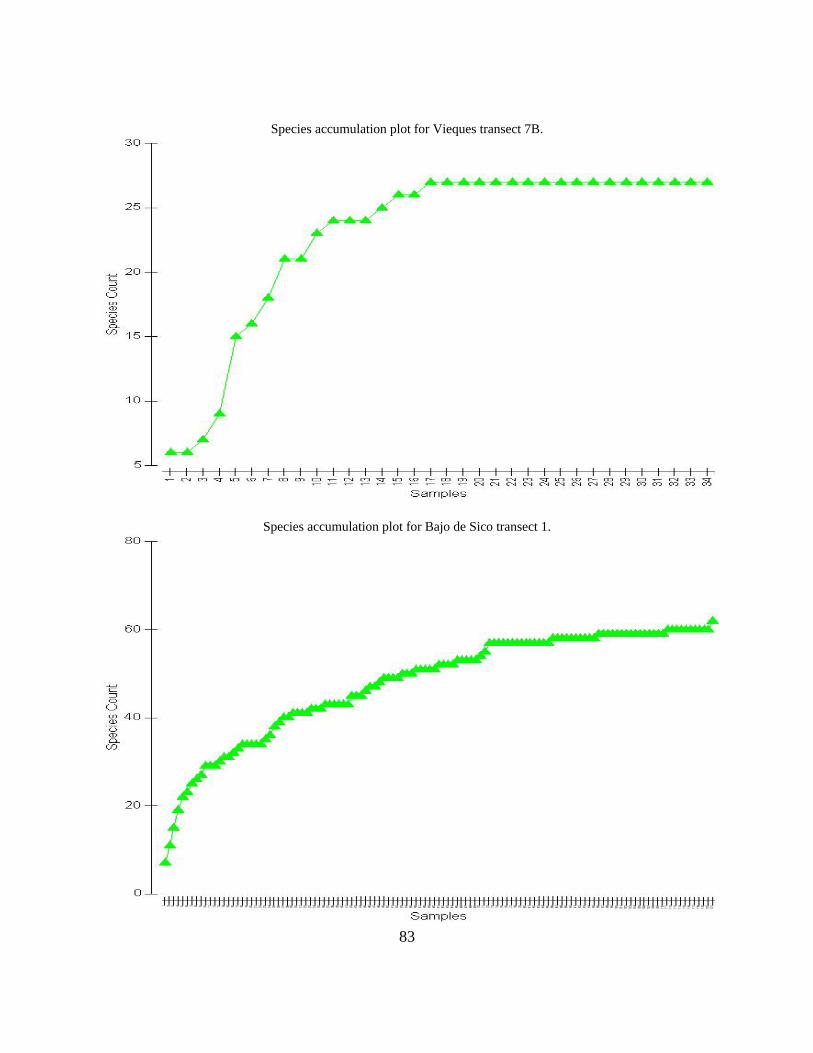
83
Species accumulation plot for Vieques transect 7B.
Species accumulation plot for Bajo de Sico transect 1.

84
Species accumulation plot for Bajo de Sico transect 2.
Species accumulation plot for Desecheo transect 1.

85
Species accumulation plot for Desecheo transect 2.