Embed Size (px)
Citation preview

Ecodesign Preparatory Studies
Lot 25: Non-Tertiary Coffee Machines
1st Stakeholder Meeting1st Stakeholder Meeting
Paris – June 23rd 2010
A study being conducted for DG ENER by BIO Intelligence Service
and ARTS

Agenda of the meeting
10:00 – 10:30Welcome, “Tour de table”, Introduction to the Ecodesign
Directive, schedule update
10:30 – 11:15 Task 1 - Definition: Presentation and discussion
11:15 – 11:30 COFFEE BREAK
11:15 – 12:00Task 2 – Economic and Market Analysis: Presentation and
discussion
2
discussion
12:15 – 13:00Task 3 – Consumer Behaviour: Presentation and
discussion
13:00 – 14:00 LUNCH BREAK
14:00 – 14:30 Task 4 – Technical Analysis: Presentation and discussion
14:30 – 15:00 Task 5 – Base Case Analysis: Preliminary discussion
15:00 – 15:30 Next Steps – Tasks 6, 7 and 8 and Conclusion

BIO Intelligence Service:
� (Shailendra Mudgal)
� Benoît Tinetti
� Perrine Lavelle
� Ian Kuwahara
� Lorcan Lyons
ENER Lot 25 team
ARTS:
� (Alain Cornier)
� Charlotte Sannier
� Marie-Aude Jean-Jean
Commission project officer:
� Villö Lelkes
3

BIO Intelligence Service
Pioneer in quantification tools and support for decision-making
Specialists in the measurement environmental and health quality of products and
services in France and Europe
At the interface of the environment and products, a large range of services for public
and private decisions makers
Energy
Agri-food
Construction
Retail
Industry
Transport
Waste
Services
and private decisions makers
4
Life cycle assessment
Environmental labelling of products
Eco-design of products
Assessment of public policies
Greening the supply chain

BIO’s activities
Since 1989, our references include:
5

ARTS
� ARTS is a Research & Technological Organization.
� ARTS is a non profit organization, created in 1973, whose
aim is to develop strong relationships between the
industrial world and Arts&Métiers ParisTech.
6
� Some key figures:
• Annual turnover : 10 M€
• 130 employees associated with more than 350 Arts&Métiers
ParisTech’s teachers and research staff.
• Over 600 industrial contracts per year.

Directive 2009/125/EC of the European Parliament, Framework
Directive for the setting of ecodesign requirements for Energy-
related Products (ErP)
� Promotion of sustainable development through free movement of
energy using products, environmental protection and increased
security of energy supply
Ecodesign Directive (1/4)
security of energy supply
� Better regulation: efficient decision making, consultation and self
regulation
“Energy-related product means any good that has an impact on energy
consumption during use which is placed on the market and/or put into
service”
This Directive supersedes the former EuP Directive (2005/32/EC)
which covered only Energy-using Products.
7

Scope of the Directive:
� All Energy-related Products (except transport)
� Specific product categories for ecodesign requirements
Ecodesign Directive (2/4)
Measures of action:
� Setting of ecodesign requirements (Implementing Measures)
8
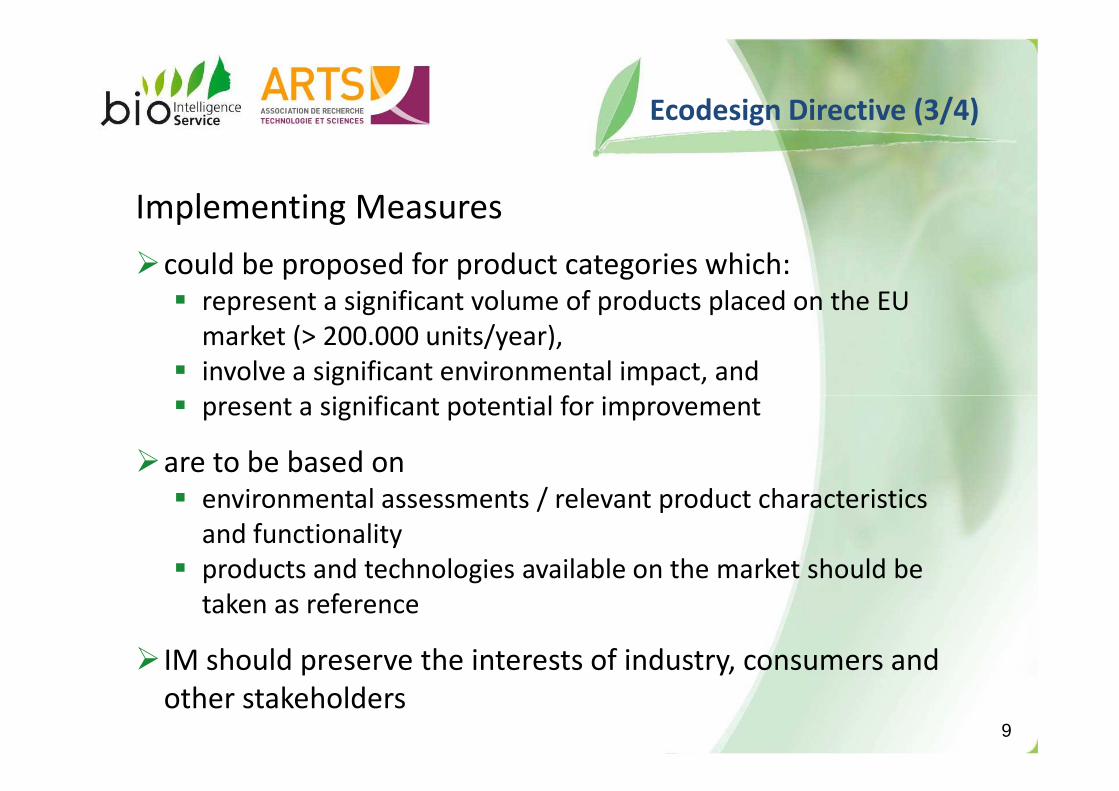
Implementing Measures
�could be proposed for product categories which:
� represent a significant volume of products placed on the EU
market (> 200.000 units/year),
� involve a significant environmental impact, and
� present a significant potential for improvement
Ecodesign Directive (3/4)
� present a significant potential for improvement
�are to be based on
� environmental assessments / relevant product characteristics
and functionality
� products and technologies available on the market should be
taken as reference
� IM should preserve the interests of industry, consumers and
other stakeholders9

From a Preparatory Study to Implementing Measures
Ecodesign Directive (4/4)
European Commission
Consultation ForumImpact
assessment
Working Plan1
3
Draft
Implementing
Measure
10
Eco-design
Preparatory Study
Stakeholder Consultation
Regulatory Committee
2
4
EU Parliament5
Working
Document
Adoption
Consultants

Ecodesign preparatory
studies
2006: 14 lots DG ENER (completed)
lot 1 boilers and combi-boilers
lot 2 water heaters
lot 3 personal computers
lot 4 imaging equipment
lot 5 consumer electronics (TV) *
lot 6 standby and off-mode losses *
lot 7 battery chargers and external power supplies *
lot 8 office lighting *
2007: 5+1 lots DG ENER (completed)
lot 15 solid fuel small
combustion installations
lot 16 laundry dryers
lot 17 vacuum cleaners
lot 18 complex set-top boxes
lot 19 domestic lighting *
+ simple set-top boxes *
2008: 8 lots DG ENERlot 8 office lighting *
lot 9 (public) street lighting *
lot 10 residential room conditioning appliances
lot 11 electric motors 1-150 kW, pumps, circulators, fans *
lot 12 commercial refrigerators and freezers
lot 13 domestic refrigerators and freezers *
lot 14 domestic dishwashers and washing machines
2008: 8 lots DG ENER
lot 20 individual room heating
lot 21 central heating (hot air)
lot 22 ovens
lot 23 hobs and grills
lot 24 washing machines, etc. PRO
lot 25 coffee machines
lot 26 network standby
2008: 3 lots DG ENTR
lot 1 commercial refrigerators and freezers
lot 2 transformers (power and distribution)
lot 3 DVD players, video projectors, etc.11
2009: 3 lots DG ENTR
lot 4 industrial furnaces and ovens
lot 5 machine tools
lot 6 air-co and ventilation systems
* Implementing Measures already in place

A uniform approach adopted for all the lots, Methodology for Eco-
design of Energy-using Products - MEEuP:
Methodology
(1/2)
Present Tasks 1 to 5
Tasks 6 to 8
Present
situation
Improvement
potential
12

Consumer Behaviour
Econ. and Market Analysis
Definition
Technical Analysis
Methodology
(2/2)
13
BAT – BNAT analysis
Improvement Potential
Task 1 Task 2 Task 3 Task 5 Task 6 Task 7 Task 8
Assessment of Base-case
Macro Analyses (Policy, Impact,...)
Task 4
Technical Analysis
13
Task 1 - Definition:
� Define the product category and define the system boundaries of the
‘playing field’ for eco-design
� Identify the harmonised test standards and additional sector-specific
Task 1
procedures for product-testing
� Identify the existing relevant legislation, voluntary agreements, and
labelling initiatives at the EU and MS level, as well as outside Europe
1.1 Product category and performance assessment
1.2 Test Standards
1.3 Existing legislation (including labelling and voluntary programs)
14

Task 2 – Economic & market analysis:
� Place the product group within the total of EU industry and trade policy
� Provide market and cost inputs for the EU-wide environmental impact
of the product group
Task 2
� Provide insight in the latest market trends
� Provide a practical dataset of prices and rates to be used in a Life Cycle
Cost (LCC) calculation
2.1 Generic economic data
2.2 Market and stock data
2.3 Market trends
2.4 Consumer expenditure base data
15

Task 3 – Consumer Behaviour and Local Infrastructure:
� Quantify relevant user-parameters that influence the environmental
impact during product-life and that are different from Standard test
conditions
� Identify barriers and restrictions to possible eco-design measures, due
Task 3
� Identify barriers and restrictions to possible eco-design measures, due
to social, cultural or infra-structural factors
3.1 Real life efficiency
3.2 End-of-life behaviour
3.3 Local infra-structure
16

Task 4 – Technical Analysis Existing Products:
� General technical analysis of current products on the EU market during
the whole life cycle
� Objective is to capture the market on the whole, both “good” and “bad”
products
Task 4
products
� Functional analysis of the system to which the product belongs (e.g.
heating/ventilation), including a rough estimate of the overall impacts
4.1 Production phase
4.2 Distribution phase
4.3 Use phase (product)
4.4 Use phase (system)
4.5 End-of-life phase
4.6 Recommendations on mandates for measurement standards 17

Task 5 – Base-Cases:
� Building on the results of Tasks 1 – 4,
“one or two average EU product(s)” or product category(ies) have to be
defined as the “Base-case” for the whole of the EU-27
� On these Base-Cases most of the environmental and Life Cycle Cost
Task 5
(1/9)
� On these Base-Cases most of the environmental and Life Cycle Cost
analyses will be built throughout the rest of the study
� The Base-Case is a conscious abstraction of reality
(5.0 Base case definition)
5.1 Product-specific inputs
5.2 Base-Case Environmental Impact Assessment
5.3 Base-Case Life Cycle Costs
5.4 EU Totals
5.5 EU-27 Total System Impact18

Task 5 – Base-Cases:
� Base-Cases analysed using EcoReport Tool
� Input from previous tasks:
(1) Bill of materials (BOM)
Task 5
(2/9)
Example BOM: “Imaginary product”
Nr Date
27/02/2008
Pos MATERIALS Extraction & Production Weight Category Mate rial or Processnr Description of component in g Click &select select Category first !
1
2 Iron structure 200000.0 3-Ferro 23-Cast iron
3 Front "window" 1000.0 7-Misc. 54-Glass for lamps
4
Product name
Imaginary average stove
Author
BIO
19

Task 5 – Base-Cases:
� Input from previous tasks:
(2) Manufacturing phase inputs – Percentage of sheetmetal scrap
Example: “Imaginary product”
Task 5
(3/9)
P o s MANUFACTURING Weight PercentageP o s MANUFACTURING Weight Percentagenr Description in g A djust
201 OEM Plastics Manufacturing (fixed) 0
202 Foundries Fe/Cu/Zn (fixed) 0
203 Foundries Al/Mg (fixed) 0
204 Sheetmetal Manufacturing (fixed) 1
205 PWB Manufacturing (fixed) 0
206 Other materials (Manufacturing already included) 20
207 Sheetmetal Scrap (Please adjust percentage only) 0 20%

Task 5 – Base-Cases:
� Input from previous tasks:
(3) Use phase inputs - Energy consumption
Example: “Imaginary product”Pos USE PHASE unit Subtotals
nr Description
Task 5
(4/9)
211 Product Life in years 15 years
Electricity
212 On-mode: Consumption per hour, cycle, setting, etc . 0 kWh 0
213 On-mode: No. Of hours, cycles, settings, etc. / yea r 0 #
214 Standby-mode: Consumption per hour 0 kWh 0
215 Standby-mode: No. Of hours / year 0 #
216 Off-mode: Consumption per hour 0 kWh 0
217 Off-mode: No. Of hours / year 0 #
TOTAL over Product Life 0.00 MWh (=000 kWh) 65
Heat
218 Avg. Heat Power Output 15 kW
219 No. Of hours / year 730 hrs.
220 Type and efficiency (Click & select) 78.0% 16 77-Wood logs, higher eff. 74
TOTAL over Product Life 591.32 GJ

Task 5 – Base-Cases:
� Input from previous tasks:
(4) End-of-life
Example: “Imaginary product”
Pos DISPOSAL & RECYCLING unit Subtotals
Task 5
(5/9)
nr Description
Substances released during Product Life and Landfil lDisposal: Environmental Costs perkg final product
231 Landfill (fraction products not recovered) in g en % 10050 5% 88-fixed
232 Incineration (plastics & PWB not re-used/recycle d) 0 g 91-fixed
233 Plastics: Re-use & Recycling ("cost"-side) 0 g 92-fixed
Re-use, Recycling Benefit in g% of plastics
fraction
234 Plastics: Re-use, Closed Loop Recycling (please edi t%) 0 1% 4
235 Plastics: Materials Recycling (please edit% only) 0 9% 4
236 Plastics: Thermal Recycling (please edit% only) 0 90% 72
237 Electronics: PWB Easy to Disassemble ? (Click&selec t) 0 YES 98
238 Metals & TV Glass & Misc. ( 95% Recycling) 190950 fixed
22

Task 5 – Base-Cases:
� Input from previous tasks:
(5) Economic / market inputs
Example: “Imaginary product”
INPUTS FOR EU-Totals & economic Life Cycle Costs uni tnr Description
A Product Life 15 years
Task 5
(6/9)
B Annual sales 1.5 mln. Units/yearC EU Stock 13 mln. Units
D Product price 2400 Euro/unitE Installation/acquisition costs (if any) 1000 Euro/ unitF Fuel rate (gas, oil, wood) 11.1 Euro/GJG Electricity rate Euro/kWhH Water rate Euro/m3I Aux. 1: None Euro/kgJ Aux. 2 :None Euro/kgK Aux. 3: None Euro/kgL Repair & maintenance costs 420 Euro/ unit
M Discount rate (interest minus inflation) 5.0% %N Present Worth Factor (PWF) (calculated automatically) 10.38 (years)
O Overall Improvement Ratio STOCK vs. NEW, Use Phase 1.00
23
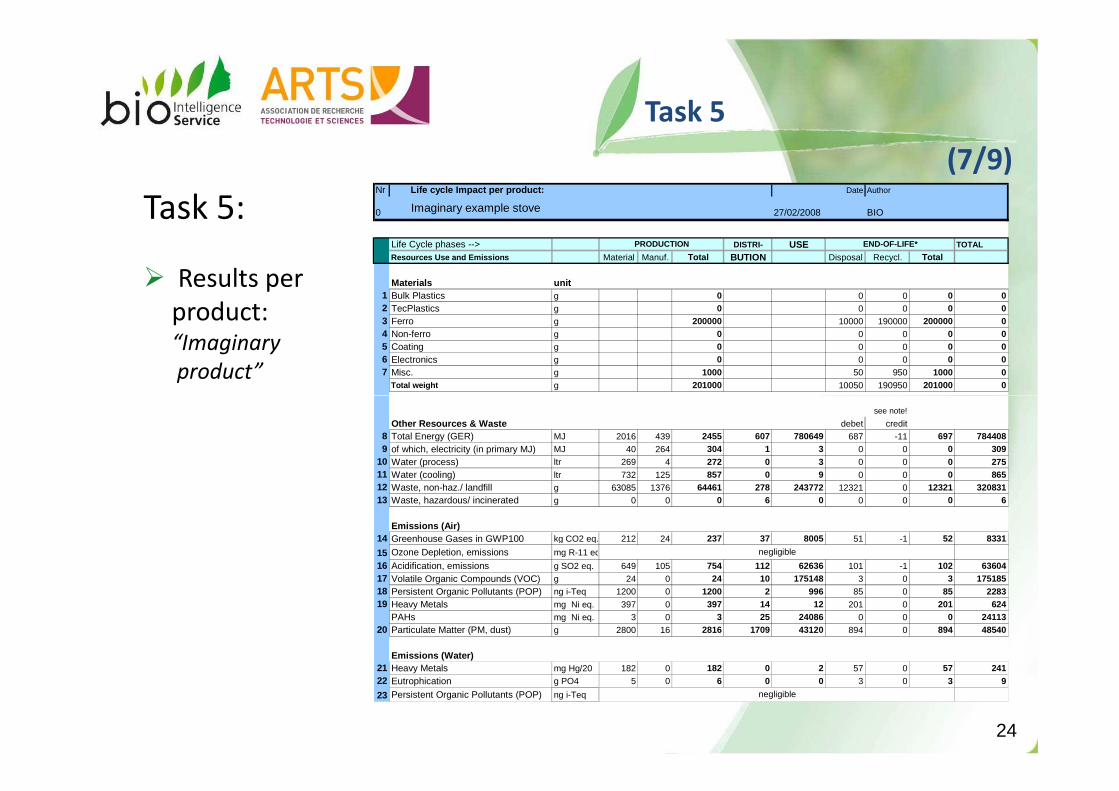
Task 5:
� Results per
product: “Imaginary
product”
Nr
0
Life Cycle phases --> DISTRI- USE TOTAL
Resources Use and Emissions Material Manuf. Total BUTION Disposal Recycl. Total
Materials unit1 Bulk Plastics g 0 0 0 0 02 TecPlastics g 0 0 0 0 03 Ferro g 200000 10000 190000 200000 04 Non-ferro g 0 0 0 0 05 Coating g 0 0 0 0 06 Electronics g 0 0 0 0 07 Misc. g 1000 50 950 1000 0
Total weight g 201000 10050 190950 201000 0
Author
BIO
Life cycle Impact per product:
PRODUCTION
Date
27/02/2008Imaginary example stove
END-OF-LIFE*
Task 5
(7/9)
see note!
Other Resources & Waste debet credit8 Total Energy (GER) MJ 2016 439 2455 607 780649 687 -11 697 7844089 of which, electricity (in primary MJ) MJ 40 264 304 1 3 0 0 0 309
10 Water (process) ltr 269 4 272 0 3 0 0 0 27511 Water (cooling) ltr 732 125 857 0 9 0 0 0 86512 Waste, non-haz./ landfill g 63085 1376 64461 278 243772 12321 0 12321 32083113 Waste, hazardous/ incinerated g 0 0 0 6 0 0 0 0 6
Emissions (Air)14 Greenhouse Gases in GWP100 kg CO2 eq. 212 24 237 37 8005 51 -1 52 8331
15 Ozone Depletion, emissions mg R-11 eq.
16 Acidification, emissions g SO2 eq. 649 105 754 112 62636 101 -1 102 6360417 Volatile Organic Compounds (VOC) g 24 0 24 10 175148 3 0 3 17518518 Persistent Organic Pollutants (POP) ng i-Teq 1200 0 1200 2 996 85 0 85 228319 Heavy Metals mg Ni eq. 397 0 397 14 12 201 0 201 624
PAHs mg Ni eq. 3 0 3 25 24086 0 0 0 2411320 Particulate Matter (PM, dust) g 2800 16 2816 1709 43120 894 0 894 48540
Emissions (Water)21 Heavy Metals mg Hg/20 182 0 182 0 2 57 0 57 24122 Eutrophication g PO4 5 0 6 0 0 3 0 3 9
23 Persistent Organic Pollutants (POP) ng i-Teq negligible
negligible
24
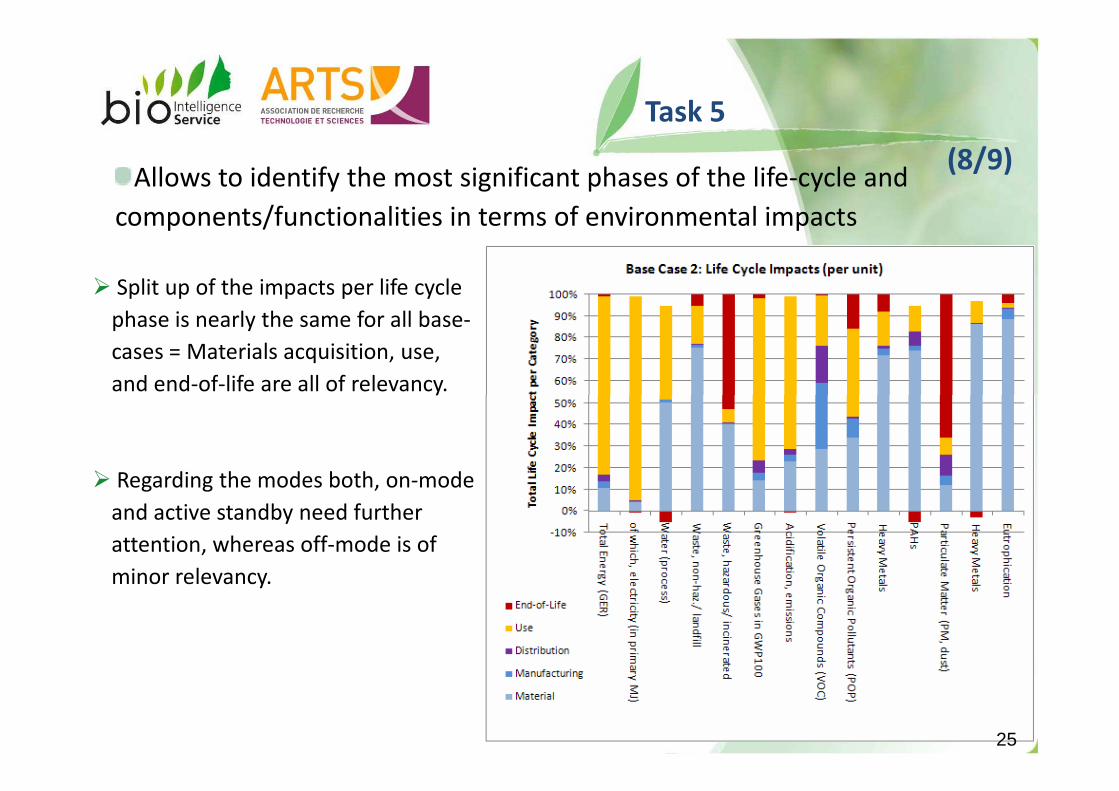
Allows to identify the most significant phases of the life-cycle and
components/functionalities in terms of environmental impacts
� Split up of the impacts per life cycle
phase is nearly the same for all base-
cases = Materials acquisition, use,
and end-of-life are all of relevancy.
Task 5
(8/9)
25
and end-of-life are all of relevancy.
� Regarding the modes both, on-mode
and active standby need further
attention, whereas off-mode is of
minor relevancy.
25

Task 5:
� Example Life Cycle Cost results per product and per product stock:
“Imaginary product”
Table . Life Cycle Costs per product and Total ann ual expenditure (2005) in the EU-25
LCC new productImaginary average stove total annual consumer
Task 5
(9/9)
D € mln.€
E € mln.€
F € mln.€
F € mln.€
G € mln.€
H € mln.€
I € mln.€
J € mln.€
K € mln.€
€ mln.€
Item
Fuel (gas, oil, wood) 5728
12639
LCC new product
3600
1500
0
0
1000
0
expenditure in EU25
9419Total
0
364
0
291Repair & maintenance costs
2400
0
Product price
Installation/ acquisition costs (if any)
Electricity
Water 0
Aux. 3: None
00
0
Aux. 1: None
Aux. 2 :None
7175
26
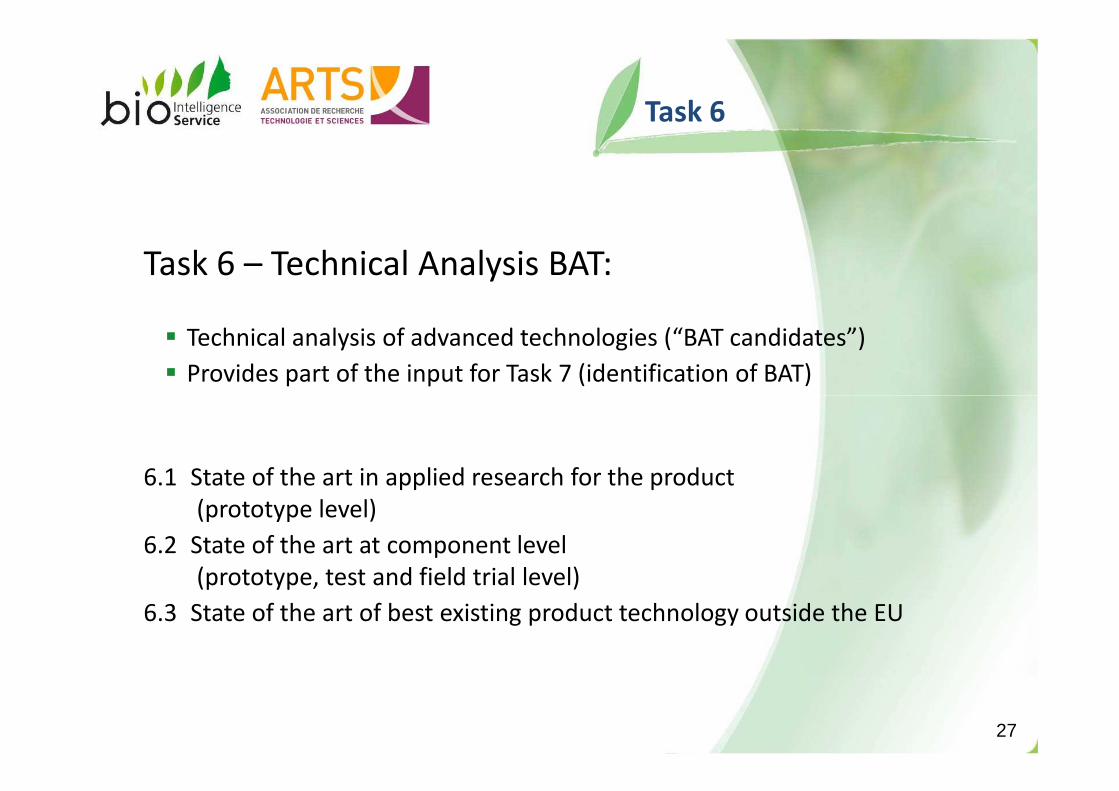
Task 6 – Technical Analysis BAT:
� Technical analysis of advanced technologies (“BAT candidates”)
� Provides part of the input for Task 7 (identification of BAT)
Task 6
6.1 State of the art in applied research for the product
(prototype level)
6.2 State of the art at component level
(prototype, test and field trial level)
6.3 State of the art of best existing product technology outside the EU
27

Task 7 – Improvement potential:
� Identify design options, their monetary consequences in terms of Life
Cycle Cost for the consumer and their environmental costs and benefits
Life Cycle Costs: indicate whether design solutions might negatively or
positively impact the total EU consumer’s expenditure over the total product
life (purchase, running costs, etc.)
Task 7
(1/2)
life (purchase, running costs, etc.)
� Pinpoint the solution with the Least Life Cycle Costs (LLCC) and
the Best Available Technology (BAT)
7.1 Options
7.2 Impacts
7.3 Costs
7.4 Analysis LLCC and BAT
7.5 Long-term targets (BNAT) and systems analysis
28

Task 7 – Improvement potential:
Example of options analysis considering a key environmental indicator & LCC:
2200
2400
2600
50
60
70
LifePrimary
Task 7
(2/2)
1200
1400
1600
1800
2000
BaseCase
1 2 2+3 4 2+4 2+3+4 6 2+6 7
0
10
20
30
40
Options
LifeCycleCosts
[€]
PrimaryEnergy
Consumption[MJ]
29
LLCC BAT

Task 8 – Scenario, Policy, Impact and Sensitivity analysis:
� Summarise and total the outcomes of all previous tasks
� Look at suitable policy means to achieve the potential e.g. implementing
LLCC as a minimum and BAT as a promotional target, using legislative or
voluntary agreements, labeling and promotion
� Scenarios 1990 – 2020 quantifying the improvements that can be achieved
Task 8
(1/2)
� Scenarios 1990 – 2020 quantifying the improvements that can be achieved
vs. a Business-as-Usual scenario
� Impacts on consumers and industry
� Robustness of the outcome
8.1 Policy and scenario analysis
8.2 Impact analysis industry and consumers
8.3 Sensitivity analysis of the main parameters
30

Task 8 – Scenario, Policy, Impact and Sensitivity analysis:
Example scenarios:
50
60 BAU
Option: LLCC
Task 8
(2/2)
20
30
40
50
2005 2010 2015 2020
PJ
.
Option: BAT
Total energy
consumption
31

Consumer Behaviour
Econ. and Market Analysis
Definition
Technical Analysis
Schedule for Lot 25
1st Stakeholder meeting
32
BAT – BNAT analysis
Improvement Potential
Task 1 Task 2 Task 3 Task 5 Task 6 Task 7 Task 8
Assessment of Base-case
Macro Analyses (Policy, Impact,...)
Task 4
Technical Analysis
32

Agenda of the meeting
10:00 – 10:30Welcome, “Tour de table”, Introduction to the Ecodesign
Directive, schedule update
10:30 – 11:15 Task 1 - Definition: Presentation and discussion
11:15 – 11:30 COFFEE BREAK
11:15 – 12:00Task 2 – Economic and Market Analysis: Presentation and
33
11:15 – 12:00Task 2 – Economic and Market Analysis: Presentation and
discussion
12:15 – 13:00Task 3 – Consumer Behaviour: Presentation and
discussion
13:00 – 14:00 LUNCH BREAK
14:00 – 14:30 Task 4 – Technical Analysis: Presentation and discussion
14:30 – 15:00 Task 5 – Base Case Analysis: Preliminary discussion
15:00 – 15:30 Next Steps – Tasks 6, 7 and 8 and Conclusion

1.1. Product Definition
� PRODCOM code 29.71.24.30
Task 1.1 – Findings Lot 25
In this study coffee machines are defined as machines that heat water, with
or without an independent source of energy, and pass it through the
coffee, so as to produce a hot drink. This coffee can be dispensed in various
containers, such as cups, pots or in the machine itself.
� PRODCOM code 29.71.24.30
Domestic electric coffee or tea makers (including percolators)
� Modes of use
� Ready mode
� Standby mode
� Off mode
� Other functions
� Auto-power down (auto-off) / auto-power-down delay (switch-off delay)
� Energy saving mode 34

1.1. Product Definition
� Functional Unit
The functional unit of a coffee machine is basically the part which produces
the coffee. Life Cycle Analyses found in literature propose functional units
which are structured following three main aspects:
� Coffee production
Task 1.1 – Findings Lot 25
� Coffee production
e.g. to produce a 20cL cup of coffee
� Keeping warm function
e.g. to maintain a cup of coffee at a serving temperature (55°C)
for one hour
� Stand-by function
e.g. maintaining stand-by functionality for one hour
In this study, the warming function has been distinguished from the stand-by
function because appliances do not present both functions. 35

1.1. Product Definition� In the scope
The following product types are considered to be within the scope of the
Lot 25 study:
Task 1.1 – Findings Lot 25
36
�Drip / filter coffee machines
� Zero, or very little steam pressure to extract flavors from
coffee beans
� Percolation typically induced with steam entrainment, no
mechanical pressure action

1.1. Product Definition� In the scope
The following product types are considered to be within the scope of the
Lot 25 study:
Task 1.1 – Findings Lot 25
37
� Espresso machines
�High pressure flavor extraction (~15 bars)
�Mechanical pump pressure

1.1. Product Definition� In the scope
The following product types are considered to be within the scope of the
Lot 25 study:
Task 1.1 – Findings Lot 25
38
� Low pressure pod / pad machines
�Low pressure coffee flavor extraction (~3 bars)
�Typically mechanically driven pressure

1.1. Product Definition� In the scope
The following product types are considered to be within the scope of the
Lot 25 study:
Task 1.1 – Findings Lot 25
39
� Electric or traditional percolator, moka pot, vacuum coffee
machine, Neapolitan flip coffee pot
�Low to medium pressure with steam or buoyant forces driving
the flavor extraction
�Independent heat source not necessary at this point in the
study to be included

1.1. Product Definition
Overview of the main product groups to be covered in Lot 25
Task 1.1 – Findings Lot 25
LOT 25 – Non-tertiary Coffee machines
Drip/filter coffee machinesTraditional coffee machinesPod filter coffee
machinesEspresso coffee machines
40
Traditional filter coffee
maker, using ground coffee
Insulated
container
1 insulated
cup
Insulated
carafe
2 insulated
cups
Non insulated
container
1 non-insulated
cup
Non-insulated
carafe
2 non-insulated
cups
Combo filter
coffee maker
Steam/non-pump coffee
espresso machines
Single boiler, heat
exchanger machines
Single boiler, dual
use machines
Dual boiler
machines
Automatic
espresso machines
Pump espresso
machine,
automatic
Pump espresso
machine, fully
automatic
Capsule
espresso
machines
Pump espresso
machine, semi
automatic
Manual
versions
Manual
moka pot
Manual
percolator
Manual
vacuum coffee
machine
Electric
versions
Electric moka
pot
Electric
percolator
Electric vacuum
coffee machine

1.1. Product Definition
� Out of the scope
The following product types are considered NOT to be within the scope
of the Lot 25 study:
Task 1.1 – Findings Lot 25
41
�Manual coffee machines,
without any independent
heat source or direct heat
application
�Tertiary coffee machines
�Kettles

1.1. Product Definition
� Questions
� Any complementary items to mention in/out of the scope of
the study?
Task 1.1 – Comments
42
the study?
� Products in use that are non-compliant with public safety
standards should be in scope of study?
� Are there any other parameters which should be considered
for classification?
� Any comments?

1.2. Test Standards
� Standards at international level
�International Electro-Technical Commission (IEC):
� IEC 60661 - Methods for measuring the performance of electric
household coffee makers
Task 1.2 – Findings Lot 25
43
household coffee makers
� IEC 62301 - Household electrical appliances - Measurement of
standby power

1.2. Test Standards
� Standards at European Community level
�EN 13248:2002 - Coffee makers for domestic use with an independent
heat source - Definitions, requirements and test methods
� Standards at Member State level
�Germany: RAL-UZ 136 – Espresso machines
Task 1.2 – Findings Lot 25
44
�Germany: RAL-UZ 136 – Espresso machines
�Germany: DIN 10764 – 10768 - Analysis of coffee and coffee products
� Third Country Standards
�Switzerland: CECED / FEA
�Switzerland: S.A.F.E. – Topten
�USA: ANSI / AHAM; CM-1-2007
�Russia: Gosudarstvennyy Standart – State Standards; GOST 20888-81
� TC59X/WG15 is currently working to mandate a new performance standard
for coffee machines

1.2. Test Standards
� Focus: Calculation method CECED / FEA
Task 1.2 – Findings Lot 25
Criteria assessment tool energy label Espresso machines Version: 11 May 2009
Declaration for energy use of Coffee Machines
Machine brand: Date:
Type number: Prepared by:
Results reflect energy consumption in Wh over 24 hr use. Signature:
We
igh
t b
ase
d o
n u
se f
req
ue
nc
y
Be
nc
hm
ark
fo
r fu
nc
tio
n
[Wh
]
Ca
lcu
late
d s
td c
on
sum
pti
on
[W
h]
Fu
nc
tio
n a
va
ila
ble
? (
ye
s=1
; n
o=
0)
Be
nc
hm
ark
re
sult
ba
sed
on
ca
lib
rati
on
Me
asu
red
re
sult
fo
r fu
nc
tio
n
Ca
lcu
late
d r
ea
l c
on
sum
pti
on
[W
h]
Re
lati
ve
pe
rfo
rma
nce
pe
r it
em
45
Ref Task Procedure We
igh
t b
ase
d o
n u
se f
req
ue
nc
y
Be
nc
hm
ark
fo
r fu
nc
tio
n
[Wh
]
Ca
lcu
late
d s
td c
on
sum
pti
on
[W
h]
Fu
nc
tio
n a
va
ila
ble
? (
ye
s=1
; n
o=
0)
Be
nc
hm
ark
re
sult
ba
sed
on
ca
lib
rati
on
Me
asu
red
re
sult
fo
r fu
nc
tio
n
Ca
lcu
late
d r
ea
l c
on
sum
pti
on
[W
h]
Re
lati
ve
pe
rfo
rma
nce
pe
r it
em
4.1 Heating up from "off" One time heating up 1 20 20 20 0 0%
4.2 Brewing coffee Sum of 1xsingle and 1x doubles of
40g and same for 120g. 1 55,8 55,8 55,8 0 0%
4.3 Steaming Avrg of 3 measurements 1 15 15 1 15 0 0%
4.4 Ready to use time 60 min measurement5 15 75 75 0 0%
4.5 Standby time According to IEC 6230111 2 22 22 0 0%
Calibration inputs:
4.6 Heating up after
standby
One time heating up2 16 32 32 0 0%
Tcoffee = 76 °C
4.7 "off" mode time According to IEC 62301 8 1 8 8 0 0% Avrg Cup= 80 g
Corrections Twater,brewing 23 °C
(Automatic) rinsing Measured as part of heating up 1 3 3 1 3 0 DeltaTsteam 40 K
Grinding Minor impact, no measurement 1 2 2 1 2 0
Total consumption233 0 0%
Tolerances shall not exceed limits as given in the implementing directive 2005/32/EC on standby energy
Tolerances shall not exceed 10% in case not covered by this directive.
Tolerances include testlab inaccuracy and production tolerances

1.2. Test Standards
� Focus: Calculation method for standard coffee machine use by S.A.F.E -
Topten International Group
Task 1.2 – Findings Lot 25
46

1.2. Test Standards
� Main test standards relevant for coffee machines
Task 1.2 – Findings Lot 25
Reference Title
EN 13248
"Cookware - Coffee makers for domestic use with an independent heat source - Definitions,
requirements and test methods"
Contents: Scope, Normative references, Terms and definitions, Requirements, Tests, Marking and
labelling, Instructions for use and maintenance
47
labelling, Instructions for use and maintenance
EN 60661 (IEC )
“Methods for measuring the performance of electric household coffee makers”
Defines the main performance characteristics which are of interest to the user and describes the
standard methods for measuring these characteristics.
ANSI/AHAM CM-
1-2007
“Method for Measuring Performance of Household Coffee Makers”
Establishes a uniform, repeatable procedure for measuring specified product characteristics of
household electric coffee makers.
CECED/FEA
“Measurement method for the determination of the energy consumption of Espresso machines”
Applicable to all manual and automatic espresso and multipurpose hot beverage machines
characterized by the fact that they are based on high pressure (> 5 bar maximum working
pressure) espresso technology and on a cup by cup system.
S.A.F.E. and
Topten
“Electrical Consumption of Coffee Machines: Measuring Method”
Suggests a measuring method for several operating modes: ready, standby, etc.

1.3. Test Standards
� Questions
� Do you agree with this main list of test standards related to
energy performance?
� Is the CECED/FEA measurement method representative of
Task 1.2 – Comments
48
� Is the CECED/FEA measurement method representative of
the real use of high pressure espresso machines and
applicable at EU level?
� Is the CECED/FEA measurement method applicable to other
types of coffee machines (low pressure and drip filter)?
� Any comments?

1.3. Existing Legislation
At EU level:
Scope Legislation
Environmental Legislation
Waste Electrical and Electronic Equipment Directive
2002/96/EC (category 2. Small household appliances)
Restriction of the use of certain Hazardous Substances in
Task 1.3 – Findings Lot 25
49
Entire Product Restriction of the use of certain Hazardous Substances in
electric and electronic equipment Directive 2002/95/EC
(category 2. Small household appliances)
REACH Regulation No 1907/2006
Energy Legislation
Standby and off mode
power consumption
Commission Regulation (EC) No 1275/2008
of 17 December 2008
Legislation related to Safety
Entire product
General Product Safety Directive 2001/95/EC
Low Voltage Equipment Directive 73/23/EEC
Materials and articles intended to come into contact with
foodstuffs – Directive 89/109/EEC
Electromagnetic Compatibility (EMC) Directive 89/336/EEC

1.3. Existing Legislation
� Legislation and Agreements at Member State level
�France - NF Environnement - NF 397 – Electric Filter Coffee Machines
for Domestic Use
�Germany - Blue Angel (for automatic single-serve coffee makers)
Task 1.3 – Findings Lot 25
50
�Finland, Norway and Sweden - Nordic Swan scheme (for coffee filters)
� Third Country Legislation and Initiatives
�Switzerland – L’EtiquetteEnergie (Energy Label)
�Australia’s Standby Power Strategy 2002-2012
�Korea - The “e-Standby Program”
�Korea - Eco-Label (for domestic electric coffee makers)
�Russia - GOST 20888-81 Standard (for electric household coffee makers)

1.3. Existing Legislation
� Focus – Switzerland (CECED / FEA voluntary initiative)
Task 1.3 – Findings Lot 25
51

1.3. Existing Legislation
� Questions
� Do you agree with this list?
� Any complementary legislation to integrate?
Task 1.3 – Comments
52
� Any complementary legislation to integrate?
� Any comments?

Agenda of the meeting
10:00 – 10:30Welcome, “Tour de table”, Introduction to the Ecodesign
Directive, schedule update
10:30 – 11:15 Task 1 - Definition: Presentation and discussion
11:15 – 11:30 COFFEE BREAK
11:15 – 12:00Task 2 – Economic and Market Analysis: Presentation and
discussion
53
11:15 – 12:00discussion
12:15 – 13:00Task 3 – Consumer Behaviour: Presentation and
discussion
13:00 – 14:00 LUNCH BREAK
14:00 – 14:30 Task 4 – Technical Analysis: Presentation and discussion
14:30 – 15:00 Task 5 – Base Case Analysis: Preliminary discussion
15:00 – 15:30 Next Steps – Tasks 6, 7 and 8 and Conclusion

Task 2 – Economic and market analysis
2.1 Generic economic data
� EU-27 Production
� Extra-EU Trade
Task 2.1 – Data required
54
� Intra-EU Trade
� Apparent EU-consumption = Production + Imports – Exports
Ideally, data should be in physical volume and in money units,
including estimations per country divided on coffee machine type
(drip/filter or espresso, etc.)

Task 2 – Economic and market analysis
2.2 Market and stock data
� Current stock
� Past and estimation of future stock
� Current sales
Task 2.2 – Data required
55
� Current sales
� Annual sales growth rate
� Replacement sales / New sales (derived from annual sales)
� Average product life (both in standard and real life conditions)
Ideally, data should be in physical volume and in money units (for
sales data), including estimations per Member State.

Task 2 – Economic and market analysis
2.3 Market trends
� Distribution structure (directly from the manufacturer to the
end-user, via a distributor, other)
Market structure (number of major manufacturers, and their
Task 2.3 – Data required
56
� Market structure (number of major manufacturers, and their
share of the EU-27 sales)
� Production structure (major EU-27 countries of production,
number of manufacturers in these countries)
� General trends in product-design and product-features (from a
marketing point of view)
� Duration of the product redesign cycle

Task 2 – Economic and market analysis
2.4 Consumer expenditure base data
� Average consumer (end-user) price
� Installation costs, if any
Task 2.4 – Data required
57
� Repair and maintenance costs, if any
� Consumable costs
� Disposal costs

Task 2.1
General Economic Data
Domestic electric coffee
or tea makers (including
percolators)
Production
Quantity
Imports
Quantity
Exports
Quantity
Apparent Consumption
Quantity
(Prod + Imp - Exp)
Prodcom 2007 data:
Units sales totals for EU-27:
percolators) (Prod + Imp - Exp)
EU27 TOTALS 7 364 594 22 732 962 2 199 948 27 897 608
Domestic electric coffee
or tea makers (including
percolators)
Production
Value
Imports
Value
Exports
Value
Apparent Consumption
Value
(Prod + Imp - Exp)
EU27 TOTALS 369 328 860 563 559 550 182 463 230 750 425 180
Value totals for EU-27:
58

Task 2.2
Market Analysis - Sales
59Source: Topten (www.topten.info), Gfk 2007

Task 2.2
Market Analysis - Sales
60Source: Topten (www.topten.info), Gfk 2007

Task 2.2
Market Analysis - Sales
Source: Topten (www.topten.info), Gfk 200761

Task 2.2
Market Analysis - Sales
Prices of electric coffee machines in France
62
(Source: GfK Retail and Technology Conférence PEM GIFAM Benoit LEHUT-Julie KUNLIN, 16 September 2008, Petit Electroménager;
Objectif : Création de Valeur)

Task 2.2
Market Analysis - Sales
Proportions of units sold by categorization in Task 1:
Source: Topten (www.topten.info), Gfk 200763

Task 2.2
Market Analysis - Lifetime
Lot 25 Product Category Lifetime
Filter/drip 10
First proposal for lifetimes:
Pod / pad 6
Espresso capsules 6
Espresso trad. steam / pump / semi auto 10
Espresso full-auto 10
64

Task 2.2
Market Analysis - Lifetime
Lot 25 Product Category Lifetime
Filter/drip 6
New proposal for lifetimes based on the industry’s feedback:
Pod / pad 6
Espresso capsules 5
Espresso trad. steam / pump / semi auto 7
Espresso full-auto 7
65

Task 2.2
Market Analysis – Sales
66
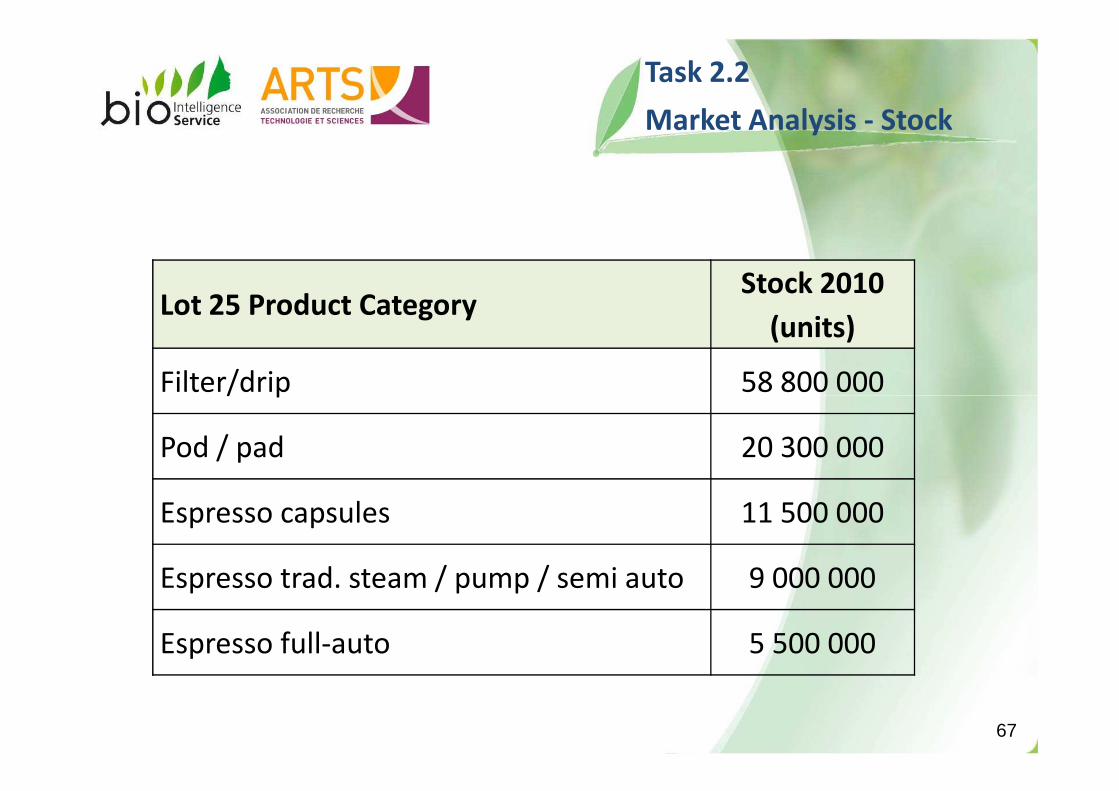
Task 2.2
Market Analysis - Stock
Lot 25 Product CategoryStock 2010
(units)
Filter/drip 58 800 000Filter/drip 58 800 000
Pod / pad 20 300 000
Espresso capsules 11 500 000
Espresso trad. steam / pump / semi auto 9 000 000
Espresso full-auto 5 500 000
67

Task 2.3
Market Analysis – Sales Trends
68

Lot 25 Product CategorySales
2010 2012 2015 2020
Filter drip 9 240 000 9 260 000 8 630 000 6 480 000
Task 2.3
Market Analysis – Sales Trends
Soft pad 3 530 000 3 750 000 4 090 000 4 750 000
Hard capsule espresso 3 010 000 3 770 000 5 110 000 7 510 000
Espresso (trad and semi) 1 160 000 1 040 000 900 000 900 000
Espresso (fully-auto) 810 000 900 000 1 040 000 1 140 000
69

Task 2.3
Market Analysis – Sales Trends
70

Lot 25 Product CategoryStock
2010 2012 2015 2020
Filter drip 58 820 000 57 120 000 54 500 000 45 710 000
Task 2.3
Market Analysis – Stock Trends
Soft pad 20 320 000 21 420 000 22 840 000 26 480 000
Hard capsule espresso 11 450 000 15 240 000 21 220 000 32 390 000
Espresso (trad and semi) 9 010 000 8 290 000 7 320 000 6 310 000
Espresso (fully-auto) 5 550 000 5 820 000 6 360 000 7 520 000
71

Task 2.3
Market Analysis – Stock Trends
72

Task 2.4
Consumer Expenditures
Lot 25 Product CategoryAverage
Price (EUR)
Filter/drip 35
Pod / pad 80
Purchase prices:
73
Pod / pad 80
Espresso capsules 150
Espresso trad. steam / pump / semi
auto300
Espresso full-auto 600

Category Cost items Units Value for Lot 25 Study
Purchase Purchase price PP €/product 35 - 600
Use Electricity rate €/kWh 0.166
Use Water rates €/m3 2.64
Task 2.4
Consumer Expenditures
74
Use Water rates €/m 2.64
Use Ground coffee €/cup of coffee 0.07 – 0.11
Use Coffee filter €/product 0.03
Use Coffee pods – soft €/product 0.15
Use Coffee pods – hard €/product 0.30
UseInterest-inflation
rate% 4.0

2. Economic and market analysis
� Questions
� Are lifetime estimates more accurate?
� Market data (past and future trends) have significant impact
Task 2 – Comments
75
� Market data (past and future trends) have significant impact
� Are there new technology trends foreseeable in the range of
years of this study?
� Any comments?

Agenda of the meeting
10:00 – 10:30Welcome, “Tour de table”, Introduction to the Ecodesign
Directive, schedule update
10:30 – 11:15 Task 1 - Definition: Presentation and discussion
11:15 – 11:30 COFFEE BREAK
11:15 – 12:00Task 2 – Economic and Market Analysis: Presentation and
discussion
76
11:15 – 12:00discussion
12:15 – 13:00Task 3 – Consumer Behaviour: Presentation and
discussion
13:00 – 14:00 LUNCH BREAK
14:00 – 14:30 Task 4 – Technical Analysis: Presentation and discussion
14:30 – 15:00 Task 5 – Base Case Analysis: Preliminary discussion
15:00 – 15:30 Next Steps – Tasks 6, 7 and 8 and Conclusion

Task 3: Consumer Behaviour
and Local infrastructure
Objectives
Quantify relevant user-parameters influencing the use phase of the coffee
machine
77
machine
Identify actual consumer behaviour in maintenance and end-of-life
Identify barriers and restrictions to possible eco-design measures

Task 3: Consumer Behaviour
and Local infrastructure
Switching behaviour at home:
78
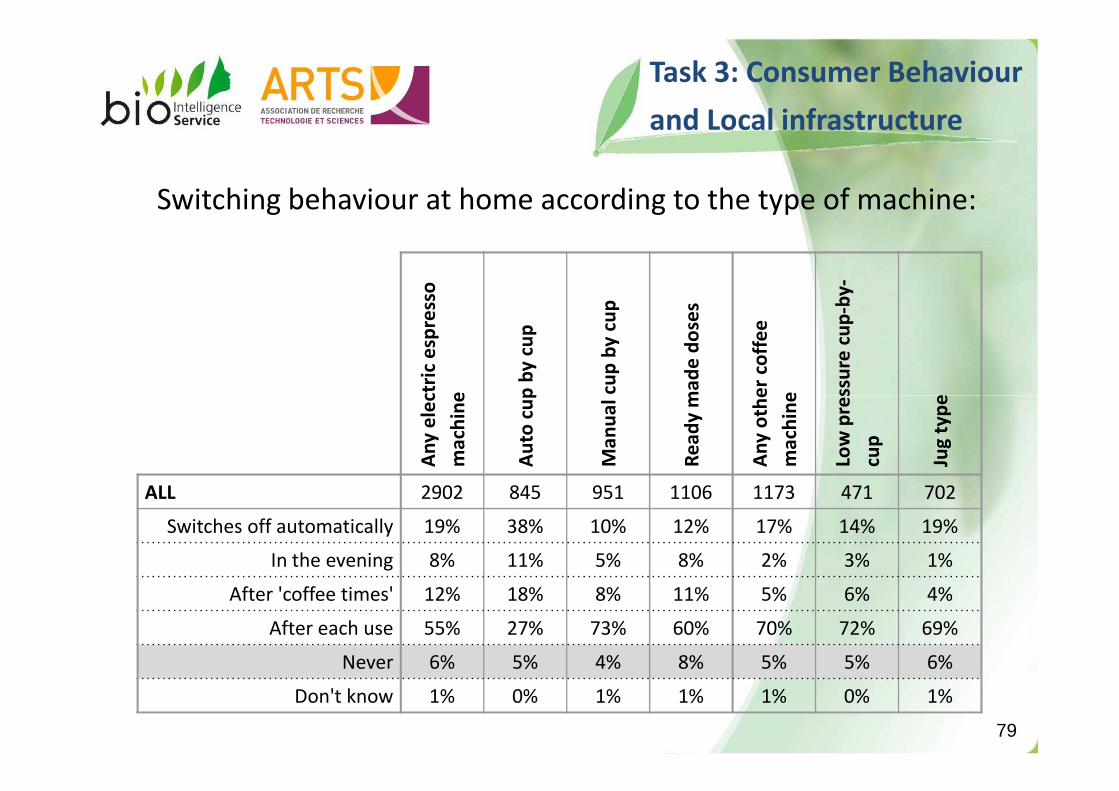
Task 3: Consumer Behaviour
and Local infrastructure
Switching behaviour at home according to the type of machine:
An
y e
lect
ric
esp
ress
o
ma
chin
e
Au
to c
up
by
cu
p
Ma
nu
al
cup
by
cu
p
Re
ad
y m
ad
e d
ose
s
An
y o
the
r co
ffe
e
ma
chin
e
Low
pre
ssu
re c
up
-by
-
Jug
ty
pe
79
An
y e
lect
ric
esp
ress
o
ma
chin
e
Au
to c
up
by
cu
p
Ma
nu
al
cup
by
cu
p
Re
ad
y m
ad
e d
ose
s
An
y o
the
r co
ffe
e
ma
chin
e
Low
pre
ssu
re c
up
cup
Jug
ty
pe
ALL 2902 845 951 1106 1173 471 702
Switches off automatically 19% 38% 10% 12% 17% 14% 19%
In the evening 8% 11% 5% 8% 2% 3% 1%
After 'coffee times' 12% 18% 8% 11% 5% 6% 4%
After each use 55% 27% 73% 60% 70% 72% 69%
Never 6% 5% 4% 8% 5% 5% 6%
Don't know 1% 0% 1% 1% 1% 0% 1%

Task 3: Consumer Behaviour
and Local infrastructure
Switching behaviour at work:
80

Task 3: Consumer Behaviour
and Local infrastructure
Switching behaviour at work according to the type of machine:
An
y e
lect
ric
esp
ress
o
ma
chin
e
Au
to c
up
by
cu
p
Ma
nu
al
cup
by
cu
p
Re
ad
y m
ad
e d
ose
s
An
y o
the
r co
ffe
e
ma
chin
e
Low
pre
ssu
re c
up
-by
-
Jug
ty
pe
81
An
y e
lect
ric
esp
ress
o
ma
chin
e
Au
to c
up
by
cu
p
Ma
nu
al
cup
by
cu
p
Re
ad
y m
ad
e d
ose
s
An
y o
the
r co
ffe
e
ma
chin
e
Low
pre
ssu
re c
up
cup
Jug
ty
pe
ALL 596 244 86 266 607 180 427
Switches off automatically 21% 31% 20% 12% 15% 26% 10%
In the evening 39% 32% 38% 47% 17% 18% 16%
After 'coffee times' 4% 3% 7% 4% 15% 7% 19%
After each use 11% 5% 23% 13% 45% 39% 47%
Never 20% 21% 8% 22% 5% 8% 4%
Don't know 5% 8% 3% 2% 3% 2% 4%

Assumed use pattern of the coffee machine over the whole product
lifetime
Task 3: Consumer Behaviour
and Local infrastructure
82

Task 3: Consumer Behaviour
and Local infrastructure
End-of-life management
All producers of coffee machines are obliged by the WEEE directive
to take responsibility for the collection and treatment of their
product for a fee. The customer might give his coffee machine to the
83
product for a fee. The customer might give his coffee machine to the
municipal recycling authority or take it back to the reseller.
Possible barriers to Ecodesign
Buying decision: focus on first price
Lack of available information

3. Consumer Behaviour and Local Infrastructure
� Questions
� Consensus on user behaviour patterns for performance
testing
Task 3 – Comments
84
testing
� Any comments?

Agenda of the meeting
10:00 – 10:30Welcome, “Tour de table”, Introduction to the Ecodesign
Directive, schedule update
10:30 – 11:15 Task 1 - Definition: Presentation and discussion
11:15 – 11:30 COFFEE BREAK
11:15 – 12:00Task 2 – Economic and Market Analysis: Presentation and
discussion
85
11:15 – 12:00discussion
12:15 – 13:00Task 3 – Consumer Behaviour: Presentation and
discussion
13:00 – 14:00 LUNCH BREAK
14:00 – 14:30 Task 4 – Technical Analysis: Presentation and discussion
14:30 – 15:00 Task 5 – Base Case Analysis: Preliminary discussion
15:00 – 15:30 Next Steps – Tasks 6, 7 and 8 and Conclusion

Task 4: Technical Analysis of
Existing Products
Objectives
Technical analysis of existing coffee machines on the EU-market
Key parameters : Bill of materials and resources consumption during
86
Key parameters : Bill of materials and resources consumption during
product life
General inputs for the definition of the base cases in Task 5

Task 4: Technical Analysis of
Existing Products
Base case selection
A different base case for major product categories sold on the
market is the main driving factor for selecting base cases
The base cases selected must best represent the broadest categories
87
The base cases selected must best represent the broadest categories
of the non-tertiary coffee maker market
Technical differences can justify the distinction of a new base case
such as significant differences in the energy use, materials used, and
process for making coffee

Task 4: Technical Analysis of
Existing Products
Base case selection
1. Drip filter coffee machine
2. Soft pad coffee machine (low pressure, e.g. Senseo)
88
3. Hard cap coffee machine (high pressure, e.g. Nespresso)
4. Espresso coffee maker
5. Fully automatic espresso machine

Task 4: Technical Analysis of
Existing Products
Base case selection
The improvement potential of the product’s environmental impacts
is also a consideration that must be used to distinguish a base case.
� Moka pots and other products not directly consuming energy
themselves do not have a base case
89
themselves do not have a base case
� Electric percolators and electric moka pots were not selected as
their stock at EU-27 level is very low compared to other non-
tertiary coffee machine types (80 000 machines in 2008).
Other functionalities such as automatic on/off options will be
modelled through base cases as they are important, however they
will not justify the distinction of base cases.

• Filter drip machine
– Housing
– Plate unit
– Electric circuit
– Water circuit
Task 4: Technical Analysis of
Existing Products
• Soft pad machine
– Housing
– Percolation system
– Button system
– Electric circuit and resistance
– Pump system
90

• Hard cap espresso machine
– Housing
– Percolator capsule system
– Electric and resistance system
– Pump system
Task 4: Technical Analysis of
Existing Products
• Espresso maker
– Housing
– Percolation system
– Pump system
– Control system
– Resistance system
– Steam system
– Filter holder system91

Energy Consumption (based on EN 60661)
Task 4: Technical Analysis of
Existing Products
92

Maintenance
Ave. Number
coffee per
week
Soft water
(<19°th)
Hard water
(<19-30°th)
Very hard
water (<30°th)
Less than 7 Once a year Every 8 months Every 6 months
From 7 to 20 Every 4 months Every 3 months Every 2 months
Task 4: Technical Analysis of
Existing Products
From 7 to 20 Every 4 months Every 3 months Every 2 months
Over 20 Every 4 months Every 2 months Every month
Power (W) Time for one
descaling (h)
Consumption
for one
descaling (Wh)
Filter drip 1340 0,17 227,8
Soft pad 1120 0,17 190,4
Espresso maker 1380 0,21 289,8
93
Task 4: Technical Analysis of
Existing Products
End-of-Life (1/2)
WEEE status-quo
In 2005, 40% of WEEE arising in the EU 27 (consumer electronics
only) has been collected and treated (WEEE Review Study, UNU
2007)
94
It is not known, where the remaining 60% end up: Some of the
appliances will be stored at home (which just shifts disposal to a
later point in time), some might go for second hand use in
countries outside the EU 27. Assuming that the remaining 60% end
up (sooner or later, inside EU 27 or outside) in the municipal
household waste
In the EU 27 47% of municipal household waste is landfilled.

Pos DISPOSAL & RECYCLING unit Subtotals
nr Description
Substances released during Product Life and Landfil l
227 Refrigerant in the product (Click & select) 0 g 1-none
228 Percentage of fugitive & dumped refrigerant 0%
229 Mercury (Hg) in the product 0 g Hg
WEEE status-quo
Task 4: Technical Analysis of
Existing Products
End-of-Life (2/2)
229 Mercury (Hg) in the product 0 g Hg
230 Percentage of fugitive & dumped mercury 0%
Disposal: Environmental Costs perkg final product
231 Landfill (fraction products not recovered) in g en % 149 5% 88-fixed
232 Incineration (plastics & PWB not re-used/recycled) 1342 g 91-fixed
233 Plastics: Re-use & Recycling ("cost"-side) 149 g 92-fixed
Re-use, Recycling Benefit in g % of plastics
fraction
234 Plastics: Re-use, Closed Loop Recycling (please edit%) 15 1% 4
235 Plastics: Materials Recycling (please edit% only) 134 9% 4
236 Plastics: Thermal Recycling (please edit% only) 1342 90% 72
237 Electronics: PWB Easy to Disassemble ? (Click&select) 0 YES 98
238 Metals & TV Glass & Misc. ( 95% Recycling) 1409 fixed
95

Task 4: Technical Analysis of
Existing Products
� Questions
� Are there further best practices for maintenance of coffee
machines?
� How do older machines perform in performance tests verses
new machines?
96
new machines?
� Any comments?

Agenda of the meeting
10:00 – 10:30Welcome, “Tour de table”, Introduction to the Ecodesign
Directive, schedule update
10:30 – 11:15 Task 1 - Definition: Presentation and discussion
11:15 – 11:30 COFFEE BREAK
11:15 – 12:00Task 2 – Economic and Market Analysis: Presentation and
discussion
97
11:15 – 12:00discussion
12:15 – 13:00Task 3 – Consumer Behaviour: Presentation and
discussion
13:00 – 14:00 LUNCH BREAK
14:00 – 14:30 Task 4 – Technical Analysis: Presentation and discussion
14:30 – 15:00 Task 5 – Base Case Analysis: Preliminary discussion
15:00 – 15:30 Next Steps – Tasks 6, 7 and 8 and Conclusion

Task 5: Definition of Base
Case
Objectives
Assessment of average EU products, the so called “base cases”
� A base case is “a conscious abstraction of reality”
The description of the Base Cases is the synthesis of the results of Tasks
98
The description of the Base Cases is the synthesis of the results of Tasks
1 to 4
Most of the environmental and life cycle cost analysis are built on these
Base Cases throughout the rest of the study and it serves as the point-
of-reference for Task 6 (technical analysis of BAT), Task 7 (improvement
potential), and Task 8 (policy analyses)

Task 5: Definition of Base
Case
Methodology (1/2)
EcoReport tool
material Bulk Plastics
1 LDPE 2 HDPE 3 LLDPE 4 PP
Ferro metals 21 St sheet galv. 22 St tube/profile 23 Cast iron
41 Au/Pt/Pd Electronics
42 LCD per m2 scrn 43 CRT per m2 scrn 44 big caps & coils
99
4 PP 5 PS 6 EPS 7 HI-PS 8 PVC 9 SAN
10 ABS TecPlastics (incl. Fillers, reinforcement, additive s)
11 PA 6 12 PC 13 PMMA 14 Epoxy 15 Rigid PUR 16 Flex PUR 17 Talcum filler 18 E-glass fibre 19 Aramid fibre
Ferro metals
23 Cast iron 24 Ferrite 25 Stainless 18/8 coil
Non ferro metals 26 Al sheet/extrusion 27 Al diecast 28 Cu winding wire 29 Cu wire 30 Cu tube/sheet 31 CuZn38 cast 32 ZnAl4 cast 33 MgZn5 cast
Coating / plating (per g coating) 38 pre-coating coil 39 powder coating 40 Cu/Ni/Cr plating 41 Au/Pt/Pd
44 big caps & coils 45 slots / ext. ports 46 large IC 47 small IC 48 SMD/ LED's avg. 49 PWB 1/2 lay 3.75kg/m2 50 PWB 6 lay 4.5 kg/m2 51 PWB 6 lay 2 kg/m2 52 Solder SnAg4Cu0.5
Miscellaneous 54 Glass for lamps 55 Bitumen 56 Cardboard 57 Office paper 58 Concrete

Task 5: Definition of Base
Case
Methodology (2/2)
Task 5: Definition of Base
Case
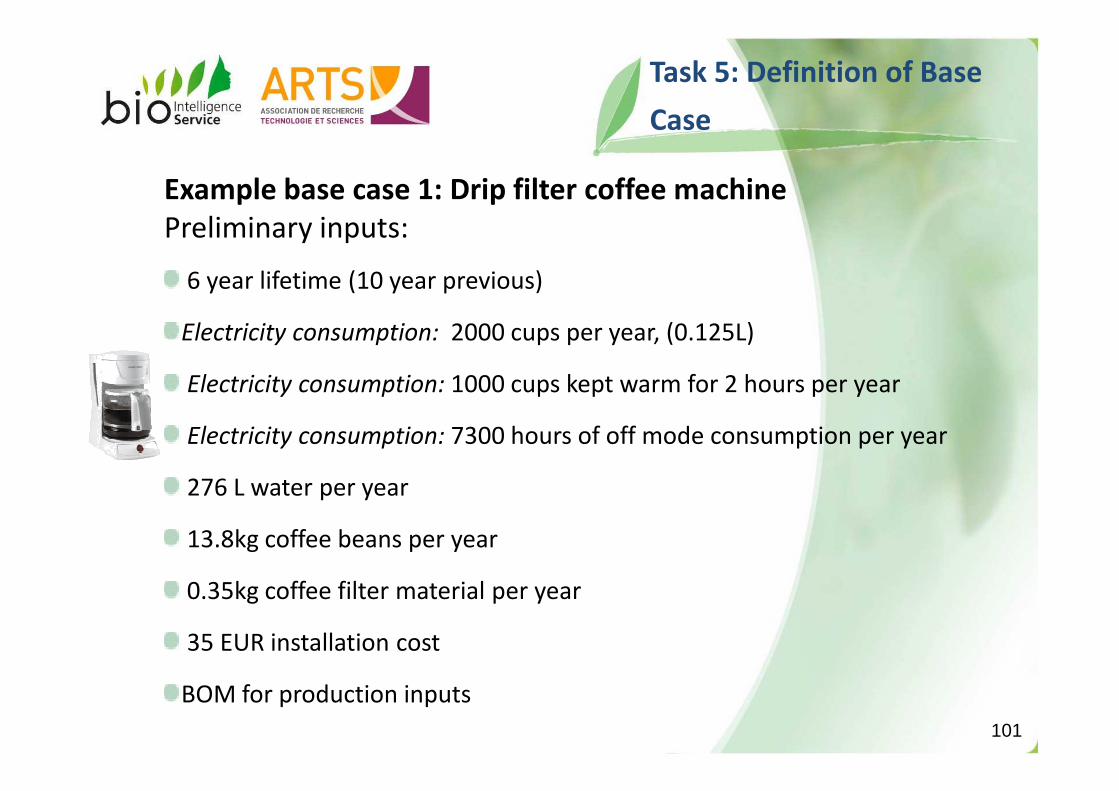
Example base case 1: Drip filter coffee machine
Preliminary inputs:
6 year lifetime (10 year previous)
Electricity consumption: 2000 cups per year, (0.125L)
Electricity consumption: 1000 cups kept warm for 2 hours per year
101
Electricity consumption: 1000 cups kept warm for 2 hours per year
Electricity consumption: 7300 hours of off mode consumption per year
276 L water per year
13.8kg coffee beans per year
0.35kg coffee filter material per year
35 EUR installation cost
BOM for production inputs

Task 5: Definition of Base
Case
Life cycle cost inputs:INPUTS FOR EU-Totals & economic Life Cycle Costs uni t
nr Description
A Product Life 6 yearsB Annual sales 9,24 mln. Units/yearC EU Stock 58,82 mln. Units
D Product price 35 Euro/unitE Installation/acquisition costs (if any) 0 Euro/ unit
102
E Installation/acquisition costs (if any) 0 Euro/ unitF Fuel rate (gas, oil, w ood) 0 Euro/GJG Electricity rate 0,166 Euro/kWhH Water rate 2,64 Euro/m3I Aux. 1: None 12 Euro/kgJ Aux. 2 :None 33 Euro/kgK Aux. 3: None Euro/kgL Repair & maintenance costs Euro/ unit
M Discount rate (interest minus inf lation) 4,0% %N Present Worth Factor (PWF) (calculated automatically) 5,24 (years)
O Overall Improvement Ratio STOCK vs. NEW, Use Phase 1,00

Task 5: Definition of Base
Case
Env. Imp. Assessment (1/5)
Base Case 1: Drip Filter coffee machine
103

Task 5: Definition of Base
Case
Env. Imp. Assessment (2/5)
Base Case 1
Materials acquisition is clearly dominating the total environmental impacts in
the categories:
� Waste, non-hazardous / landfill
Heavy metals emissions to air and to water (mainly from)
104
� Heavy metals emissions to air and to water (mainly from)
� Eutrophication
Manufacturing is not dominating any of the categories.
Distribution is dominating :
� Particulate Matter emissions to air

Task 5: Definition of Base
Case
Env. Imp. Assessment (3/5)
Base Case 1
The use phase is dominating (>70%) :
� Total Energy, and electricity
� Water (process)
� Waste, non haz.
105
� Waste, non haz.
� VOC / POP / PAHs
� Greenhouse Gases
� Acidification
End-of-life impacts are dominating in categories :
� Waste, hazardous / incinerated
� Particulate Matter emissions to air

Task 5: Definition of Base
Case
Env. Imp. Assessment (4/5)
Base Cases: Comparison
Correlations are stable
106
but absolute values differ…
Task 5: Definition of Base
Case
Env. Imp. Assessment (5/5)
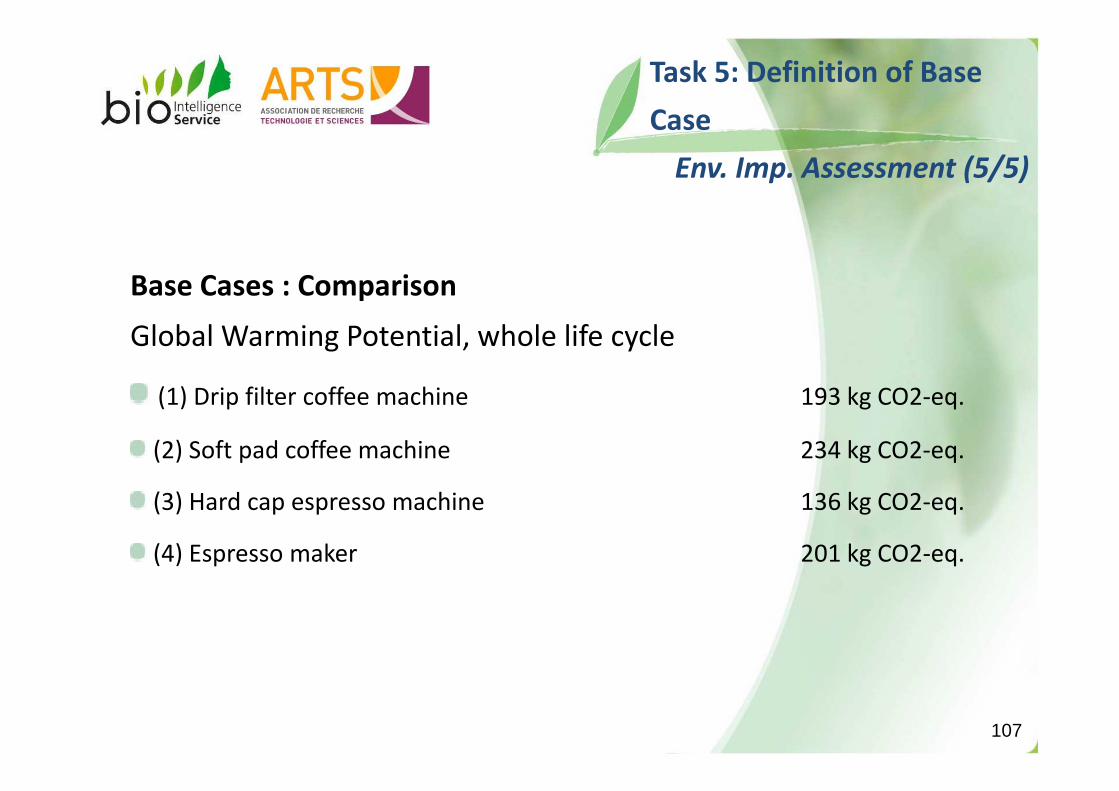
Base Cases : Comparison
Global Warming Potential, whole life cycle
(1) Drip filter coffee machine 193 kg CO2-eq.
107
(1) Drip filter coffee machine 193 kg CO2-eq.
(2) Soft pad coffee machine 234 kg CO2-eq.
(3) Hard cap espresso machine 136 kg CO2-eq.
(4) Espresso maker 201 kg CO2-eq.

Task 5: Definition of Base
Case
Life cycle costs
Base Case 1
Life cycle cost results:
D € mln.€
Products total annual consumer expenditure in EU25
Item
35Product price 323
LCC new product
108
D € mln.€
E € mln.€
F € mln.€
F € mln.€
G € mln.€
H € mln.€
I € mln.€
J € mln.€
K € mln.€
€ mln.€
0
32
4
0
00
355
11141
Fuel (gas, oil, w ood) 0
43
999Total
Repair & maintenance costs
35
868
Product price
Installation/ acquisition costs (if any)
Electricity
Water
Aux. 1: None
61
0
Aux. 2 :None
Aux. 3: None
679
9741
323
0
0
Aux. 1: coffee; Aux. 2: filters

Task 5: Definition of Base
case
� Questions
� Are the 5 base-cases representative of the current EU market?
� According to which measurement method the electricity
109
� According to which measurement method the electricity
consumption should be specified?
� What maintenance costs should be taken into consideration for
the calculation of the LCC?
� Any comments?

Agenda of the meeting
10:00 – 10:30Welcome, “Tour de table”, Introduction to the Ecodesign
Directive, schedule update
10:30 – 11:15 Task 1 - Definition: Presentation and discussion
11:15 – 11:30 COFFEE BREAK
11:15 – 12:00Task 2 – Economic and Market Analysis: Presentation and
discussion
110
11:15 – 12:00discussion
12:15 – 13:00Task 3 – Consumer Behaviour: Presentation and
discussion
13:00 – 14:00 LUNCH BREAK
14:00 – 14:30 Task 4 – Technical Analysis: Presentation and discussion
14:30 – 15:00 Task 5 – Base Case Analysis: Preliminary discussion
15:00 – 15:30 Next Steps – Tasks 6, 7 and 8 and Conclusion

Revise the Task reports 1-3
� Standards and Legislation (Task 1)
� Sales and Stocks until 2020 (Task 2)
� User patterns (Task 3)
Agreement on base-cases and energy consumption per base-case based
on measurement method agreed
Next actions
on measurement method agreed
2nd stakeholder meeting date to be defined
111


![Chirality transcription and amplification by [2 ... · Chirality transcription and amplification by [2]pseudorotaxanes . Shunsuke Kuwahara, †,‡ †Rie Chamura, Sho Tsuchiya ,](https://img.pdfslide.us/doc/110x75/5f3a843bc3f35b6ce73caab6/chirality-transcription-and-amplification-by-2-chirality-transcription-and.jpg)