Embed Size (px)
Citation preview

ECO120 MacroeconomicsRod Duncan
Lecture 6- The business cycle, or why we do well in some years and
worse in others

Business cycle and the labour market
• We saw that GDP has two features over time:
1. The trend for GDP is upwards over time (growth); but
2. Growth is higher in some years than in others (the “business cycle”).
• What’s the impact of the business cycle on the labour market?

What do we care about?
• I want you to think behind the statistics and think about what the statistics represent- what do they mean?
• We saw that female labour force participation has been rising over time. This means that more women are engaged in the labour market- in paid jobs or looking for a job.
• Is a higher LFP rate better? Why?• Why do we think a higher LFP is better for
women, but bad for others (say 12 year olds?)

What do we care about?
• Generally we don’t say “a higher LFP is a better society”.
• Not everyone can, wishes to or would be wanted to work. Should 80 year olds be forced to work if their superannuation runs out?
• What we generally say is that “everyone who wishes to should be able to find a job” and “everyone who is capable and productive should work”.

What do we care about?
• We don’t necessarily worry about everyone who doesn’t have a job, just certain types of people who don’t.– Only those people of “working age” (15 to 69 years)– Only those people not in school or university– Only those people who are actually looking for jobs
• If someone satisfies those categories, do we call them “unemployed”. What about all the other people who don’t have jobs but we don’t call “unemployed”?

Australia’s labour force
• Figure 21.2 (from the ABS in March 2006): – Australia has a population of 20.51m. – Of the 20.51m, 16.48m were of working age, and
4.03m were outside it.– Of the 16.48m, 10.61m were in the labour force, and
5.87m outside it.– Of the 10.61m, 10.07m were employed and 0.54m
were unemployed.– Of the 10.07m, 7.19m had full-time jobs and 2.88m
had part-time jobs.
• Figure 21.2 from the McTaggart book.

Business cycle and the labour market
• Economists think of an Australia-wide market for labour. In this market, firms demand the labour, and households supply the labour.
• We use the standard market model from micro. Hours
worked
Demand for labour
Supply of labour
$
Wage rate
Hours
Australian labour market

Parts of the business cycle
1993
RealGDP
Year
2006
Recession
Boom
Trend GDP orFull-employment GDP
Actual GDP

Recessions and the labour market
• In a recession firms demand less labour than in normal times. (We use “0” to represent normal times and “1” to be the recession.)
• The labour demand curve is to the left of its position in normal times.
• Wages fall, hours/employment falls, and unemployment rises.
L0
D0
S$
W0
Hours
Australian labour market
D1
L1
W1
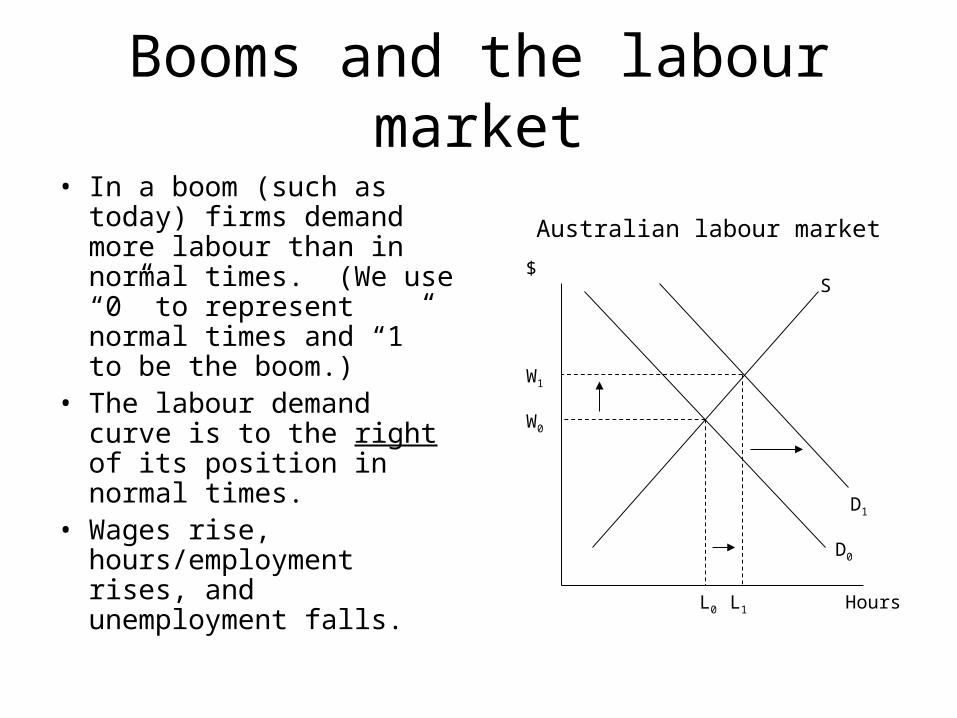
Booms and the labour market
• In a boom (such as today) firms demand more labour than in normal times. (We use “0” to represent normal times and “1” to be the boom.)
• The labour demand curve is to the right of its position in normal times.
• Wages rise, hours/employment rises, and unemployment falls.
L0
D0
S$
W0
Hours
Australian labour market
D1
L1
W1

Can we see this in the data?
• We should see that unemployment rises in the recessions and drops in the booms.
• Figure 21.3 from the McTaggart book.
• Notice that unemployment is still high even after the recession has ended because the economy has to grow back to where it would have been.

What data can we use?Unemployment over the Business Cycle
-4
-2
0
2
4
6
8
10
12
1965 1968 1971 1974 1977 1980 1983 1986 1989 1992 1995
Per
cen
t (%
)
Unemployment
Change in GDP
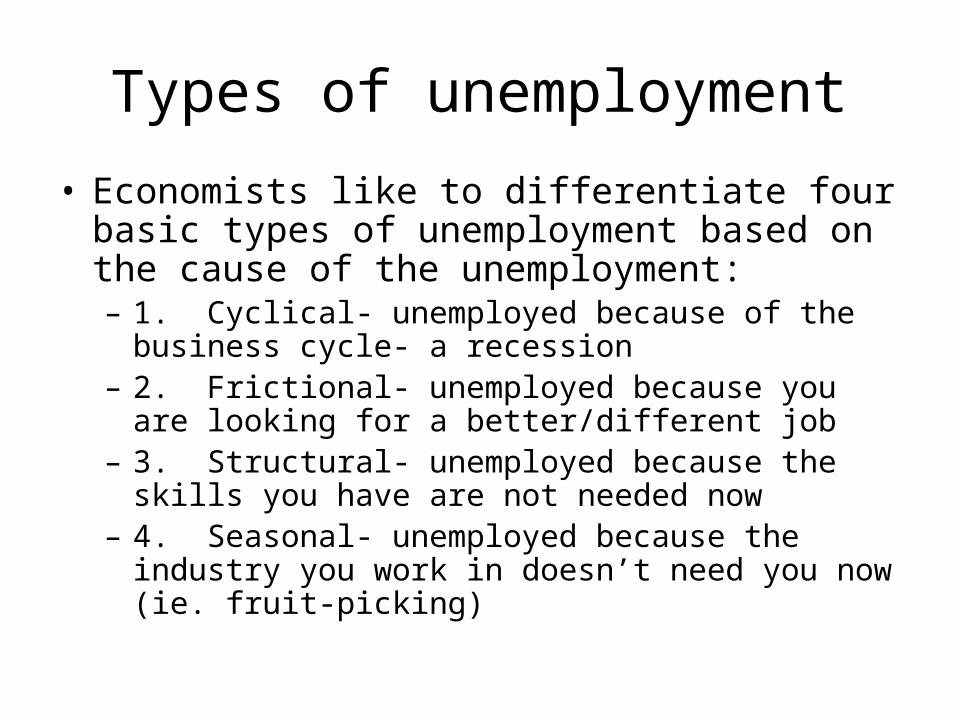
Types of unemployment
• Economists like to differentiate four basic types of unemployment based on the cause of the unemployment:– 1. Cyclical- unemployed because of the business
cycle- a recession– 2. Frictional- unemployed because you are looking
for a better/different job– 3. Structural- unemployed because the skills you
have are not needed now– 4. Seasonal- unemployed because the industry you
work in doesn’t need you now (ie. fruit-picking)
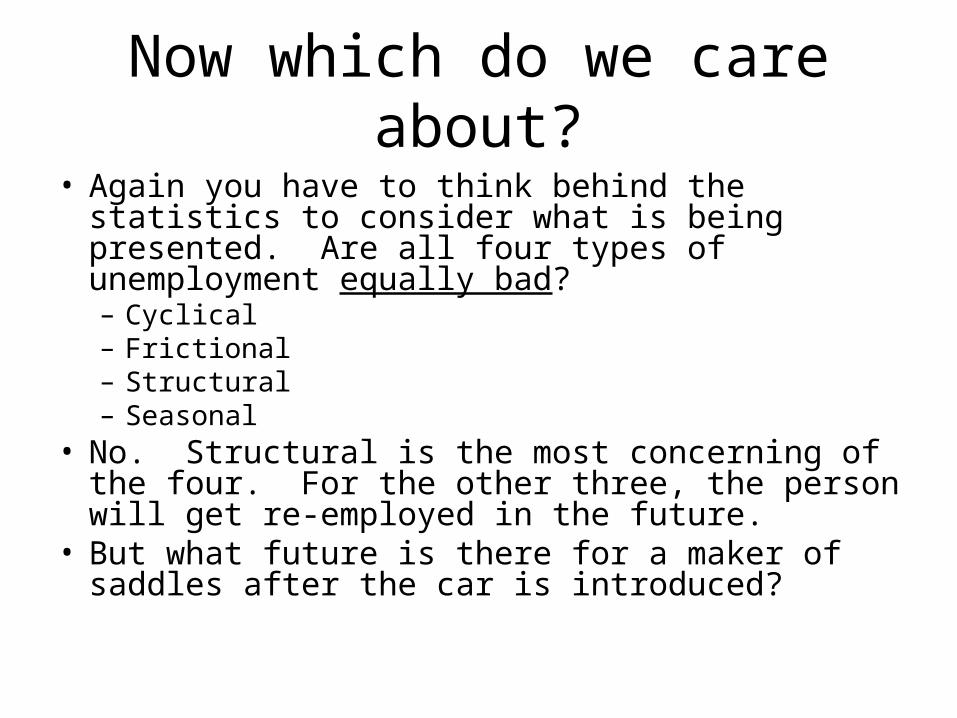
Now which do we care about?
• Again you have to think behind the statistics to consider what is being presented. Are all four types of unemployment equally bad? – Cyclical– Frictional– Structural– Seasonal
• No. Structural is the most concerning of the four. For the other three, the person will get re-employed in the future.
• But what future is there for a maker of saddles after the car is introduced?
Exam question
B1. (a) When the economy is at full employment, is the unemployment rate at 0 per cent? Why or why not?
(b) How would a more generous unemployment benefits system affect the full employment figure?

Prices
• We sense that prices for things in general have gone up over time. You can think of lots of things that were cheaper a long time ago.
• But not all prices go up all the time. The price of petrol has been falling the last few weeks. DVD players were $1,000 each when first introduced.
• And not all goods matter the same. Bananas are just a tiny part of a household’s budget, while housing is a large part. If the price of housing rises, that’s more important than a rise in banana prices.

Inflation
• Inflation is the rate of growth of the average price level over time.
• But how do we arrive at an “average price level”?– The Consumer Price Index surveys
consumers and derives an average level of prices based on the importance of goods for consumers, ie. a change in the price of housing matters a lot, but a change in the price of Tim Tams does not.
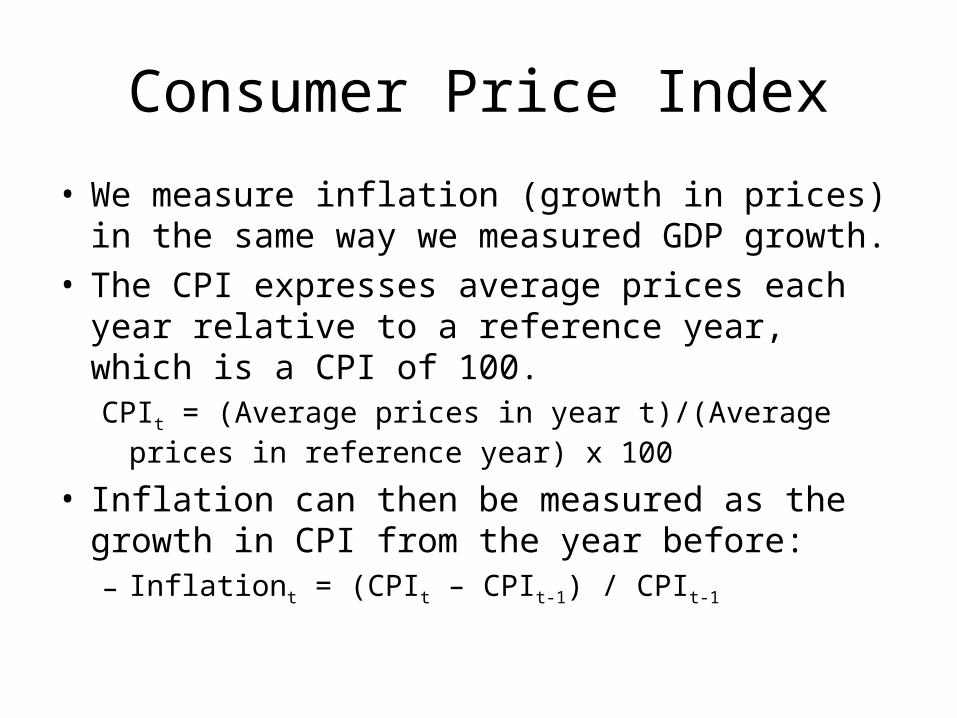
Consumer Price Index
• We measure inflation (growth in prices) in the same way we measured GDP growth.
• The CPI expresses average prices each year relative to a reference year, which is a CPI of 100.CPIt = (Average prices in year t)/(Average prices in
reference year) x 100
• Inflation can then be measured as the growth in CPI from the year before:– Inflationt = (CPIt – CPIt-1) / CPIt-1

Inflation- growth in pricesConsumer Price Inflation
-2.0
0.0
2.0
4.0
6.0
8.0
10.0
12.0
14.0
16.0
18.0
20.0
Sep
-70
Sep
-72
Sep
-74
Sep
-76
Sep
-78
Sep
-80
Sep
-82
Sep
-84
Sep
-86
Sep
-88
Sep
-90
Sep
-92
Sep
-94
Sep
-96
Sep
-98
Sep
-00
Sep
-02
Sep
-04
Inflation

Is there a simple link?
Quarterly growth in Australian GDP
-1.5
-1.0
-0.5
0.0
0.5
1.0
1.5
2.0
2.5
3.0
Oct-1959 Mar-1965
Sep-1970
Mar-1976
Aug-1981
Feb-1987
Aug-1992
Jan-1998
Jul-2003
Consumer Price Inflation
-2.0
0.0
2.0
4.0
6.0
8.0
10.0
12.0
14.0
16.0
18.0
20.0
Sep
-70
Sep
-72
Sep
-74
Sep
-76
Sep
-78
Sep
-80
Sep
-82
Sep
-84
Sep
-86
Sep
-88
Sep
-90
Sep
-92
Sep
-94
Sep
-96
Sep
-98
Sep
-00
Sep
-02
Sep
-04
Inflation
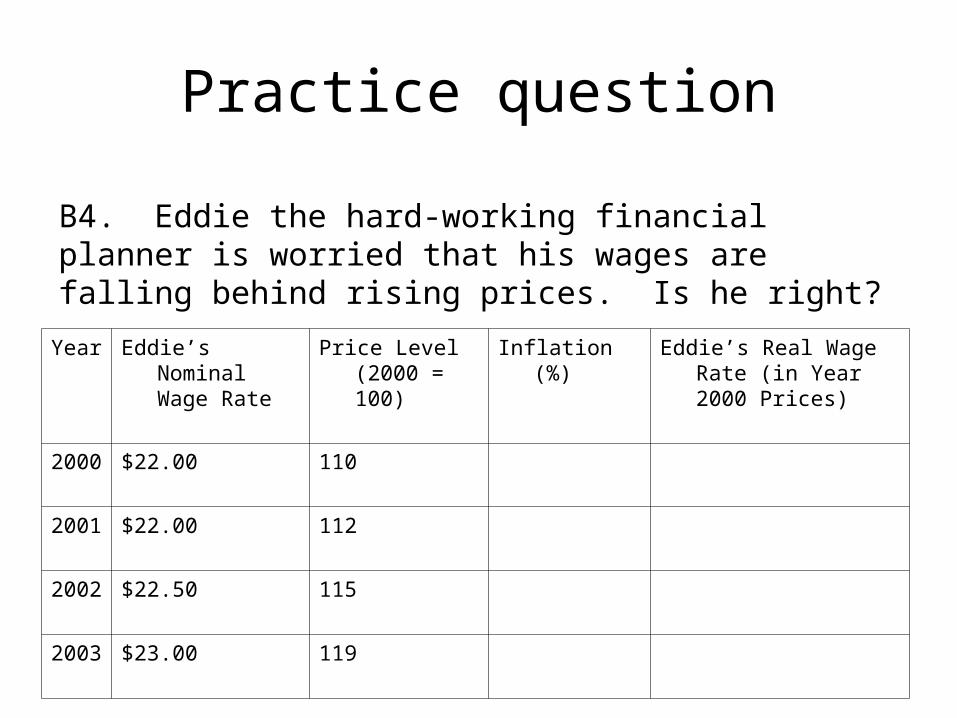
Practice question
Year Eddie’s Nominal Wage Rate
Price Level (2000 = 100)
Inflation (%) Eddie’s Real Wage Rate (in Year 2000 Prices)
2000 $22.00 110
2001 $22.00 112
2002 $22.50 115
2003 $23.00 119
B4. Eddie the hard-working financial planner is worried that his wages are falling behind rising prices. Is he right?