Embed Size (px)
Citation preview
Mon. Not. R. Astron. Soc. 368, 1311–1318 (2006) doi:10.1111/j.1365-2966.2006.10223.x
Eclipsing binaries in the All Sky Automated Survey catalogue
B. Paczynski,1⋆ D. M. Szczygie�l,2⋆ B. Pilecki2⋆ and G. Pojmanski2⋆1Princeton University Observatory, Peyton Hall, Princeton, NJ 08544, USA2Warsaw University Observatory, Al. Ujazdowskie 4, PL-00-478, Poland
Accepted 2006 February 21. Received 2006 February 19; in original form 2005 December 31
ABSTRACT
The All Sky Automated Survey (ASAS) is a long-term project to monitor bright variable
stars over the whole sky. It has discovered 50 099 variables brighter than V < 14 mag south
of declination +28◦, and among them 11 076 eclipsing binaries. We present a preliminary
analysis of 5384 contact, 2949 semi-detached, and 2743 detached systems. The statistics of
the distribution provides a qualitative confirmation of decades old idea of Flannery and Lucy
that the W UMa-type binaries evolve through a series of relaxation oscillations: the ASAS
finds comparable number of contact and semi-detached systems.
The most surprising result is a very small number of detached eclipsing binaries with periods
P < 1 d, the systems believed to be the progenitors of the W UMa stars. As many (perhaps
all) contact binaries have companions, there is a possibility that some were formed in a Kozai
cycle, as suggested by Eggleton and his associates.
Key words: binaries: eclipsing – stars: evolution.
1 I N T RO D U C T I O N TO T H E A S A S
The ASAS – All Sky Automated Survey – is a long-term project
dedicated to the detection and monitoring of the variability of bright
stars. This paper presents the results of several years of observa-
tions carried out at the Las Campanas Observatory with a single
instrument: a telescope with an aperture of 7 cm, a focal length
of 20 cm, done through a standard V-band filter and a 2 K × 2 K
CCD camera with 15-µm pixels from Apogee (Pojmanski 1997,
1998, 2000, 2002, 2003; Pojmanski & Maciejewski 2004, 2005,
Pojmanski, Pilecki and Szczygie�l 2005). More information about
the ASAS is provided on the WWW:
http://www.astrouw.edu.pl/∼gp/asas/asas.html
http://archive.princeton.edu/∼asas/
The variable stars were discovered quasi-uniformly for declina-
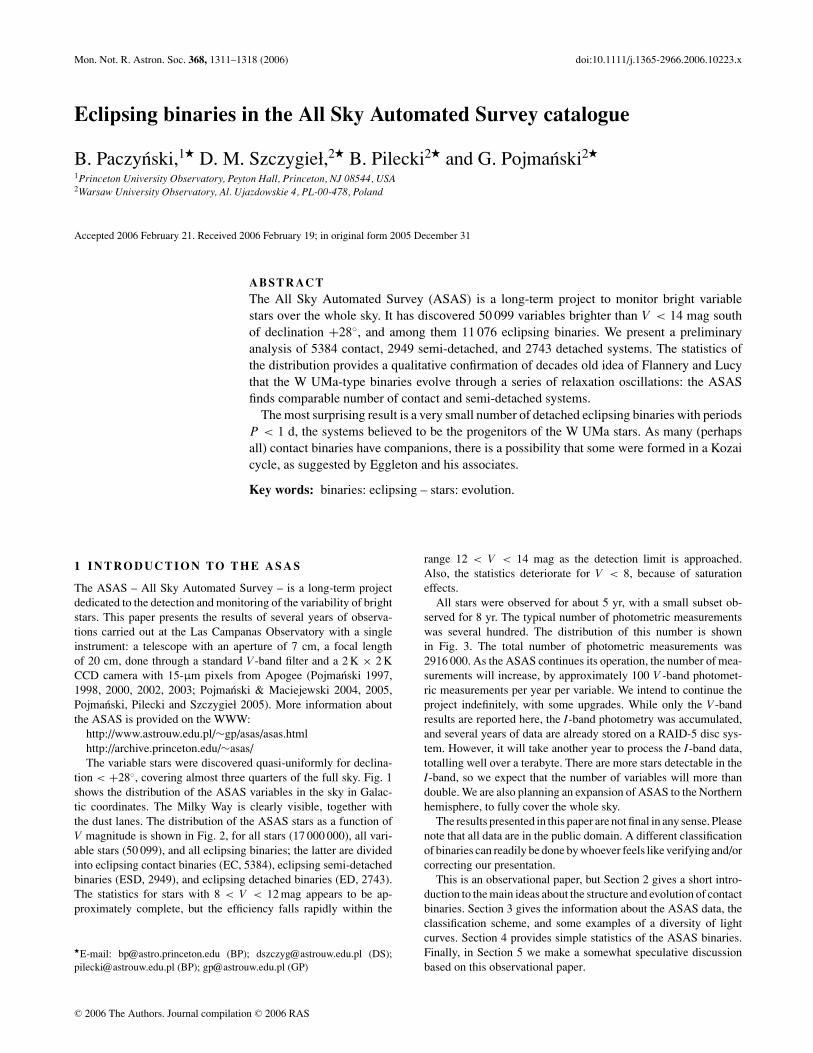
tion < +28◦, covering almost three quarters of the full sky. Fig. 1
shows the distribution of the ASAS variables in the sky in Galac-
tic coordinates. The Milky Way is clearly visible, together with
the dust lanes. The distribution of the ASAS stars as a function of
V magnitude is shown in Fig. 2, for all stars (17 000 000), all vari-
able stars (50 099), and all eclipsing binaries; the latter are divided
into eclipsing contact binaries (EC, 5384), eclipsing semi-detached
binaries (ESD, 2949), and eclipsing detached binaries (ED, 2743).
The statistics for stars with 8 < V < 12 mag appears to be ap-
proximately complete, but the efficiency falls rapidly within the
⋆E-mail: [email protected] (BP); [email protected] (DS);
[email protected] (BP); [email protected] (GP)
range 12 < V < 14 mag as the detection limit is approached.
Also, the statistics deteriorate for V < 8, because of saturation
effects.
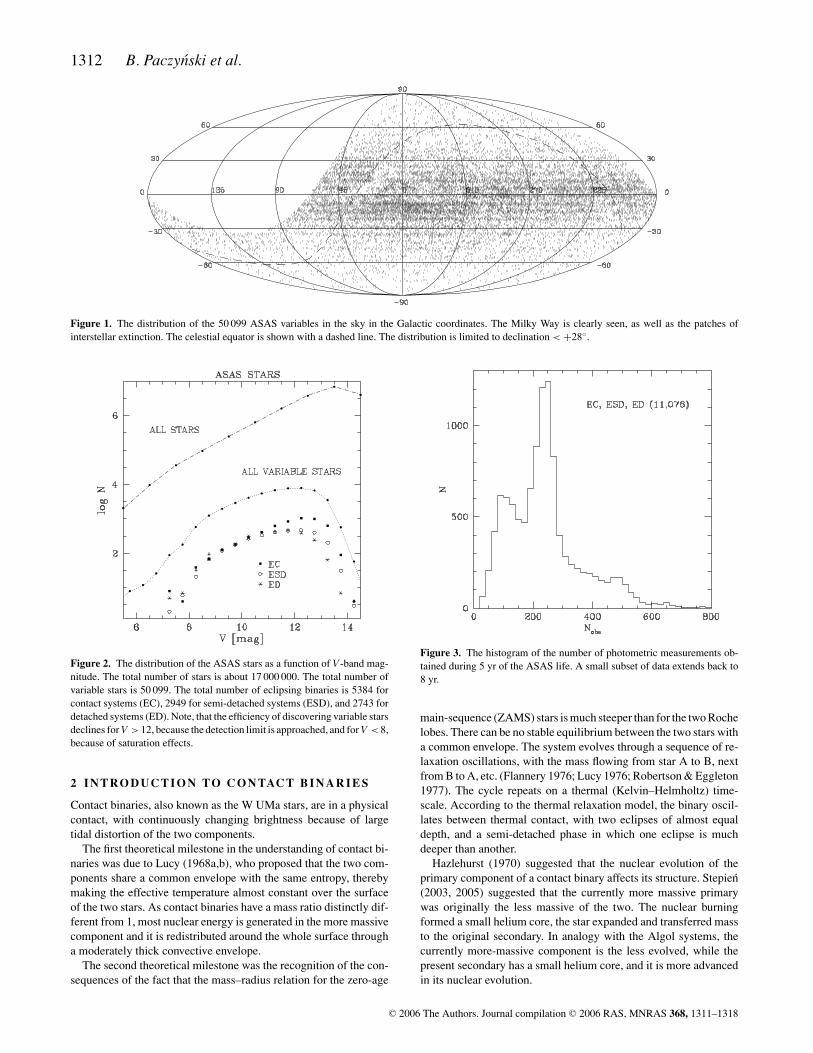
All stars were observed for about 5 yr, with a small subset ob-
served for 8 yr. The typical number of photometric measurements
was several hundred. The distribution of this number is shown
in Fig. 3. The total number of photometric measurements was
2916 000. As the ASAS continues its operation, the number of mea-
surements will increase, by approximately 100 V -band photomet-
ric measurements per year per variable. We intend to continue the
project indefinitely, with some upgrades. While only the V-band
results are reported here, the I-band photometry was accumulated,
and several years of data are already stored on a RAID-5 disc sys-
tem. However, it will take another year to process the I-band data,
totalling well over a terabyte. There are more stars detectable in the
I-band, so we expect that the number of variables will more than
double. We are also planning an expansion of ASAS to the Northern
hemisphere, to fully cover the whole sky.
The results presented in this paper are not final in any sense. Please
note that all data are in the public domain. A different classification
of binaries can readily be done by whoever feels like verifying and/or
correcting our presentation.
This is an observational paper, but Section 2 gives a short intro-
duction to the main ideas about the structure and evolution of contact
binaries. Section 3 gives the information about the ASAS data, the
classification scheme, and some examples of a diversity of light
curves. Section 4 provides simple statistics of the ASAS binaries.
Finally, in Section 5 we make a somewhat speculative discussion
based on this observational paper.
C© 2006 The Authors. Journal compilation C© 2006 RAS
1312 B. Paczynski et al.
Figure 1. The distribution of the 50 099 ASAS variables in the sky in the Galactic coordinates. The Milky Way is clearly seen, as well as the patches of
interstellar extinction. The celestial equator is shown with a dashed line. The distribution is limited to declination < +28◦.
Figure 2. The distribution of the ASAS stars as a function of V-band mag-
nitude. The total number of stars is about 17 000 000. The total number of
variable stars is 50 099. The total number of eclipsing binaries is 5384 for
contact systems (EC), 2949 for semi-detached systems (ESD), and 2743 for
detached systems (ED). Note, that the efficiency of discovering variable stars
declines for V > 12, because the detection limit is approached, and for V < 8,
because of saturation effects.
2 I N T RO D U C T I O N TO C O N TAC T B I NA R I E S
Contact binaries, also known as the W UMa stars, are in a physical
contact, with continuously changing brightness because of large
tidal distortion of the two components.
The first theoretical milestone in the understanding of contact bi-
naries was due to Lucy (1968a,b), who proposed that the two com-
ponents share a common envelope with the same entropy, thereby
making the effective temperature almost constant over the surface
of the two stars. As contact binaries have a mass ratio distinctly dif-
ferent from 1, most nuclear energy is generated in the more massive
component and it is redistributed around the whole surface through
a moderately thick convective envelope.
The second theoretical milestone was the recognition of the con-
sequences of the fact that the mass–radius relation for the zero-age
Figure 3. The histogram of the number of photometric measurements ob-
tained during 5 yr of the ASAS life. A small subset of data extends back to
8 yr.
main-sequence (ZAMS) stars is much steeper than for the two Roche
lobes. There can be no stable equilibrium between the two stars with
a common envelope. The system evolves through a sequence of re-
laxation oscillations, with the mass flowing from star A to B, next
from B to A, etc. (Flannery 1976; Lucy 1976; Robertson & Eggleton
1977). The cycle repeats on a thermal (Kelvin–Helmholtz) time-
scale. According to the thermal relaxation model, the binary oscil-
lates between thermal contact, with two eclipses of almost equal
depth, and a semi-detached phase in which one eclipse is much
deeper than another.
Hazlehurst (1970) suggested that the nuclear evolution of the
primary component of a contact binary affects its structure. Stepien
(2003, 2005) suggested that the currently more massive primary
was originally the less massive of the two. The nuclear burning
formed a small helium core, the star expanded and transferred mass
to the original secondary. In analogy with the Algol systems, the
currently more-massive component is the less evolved, while the
present secondary has a small helium core, and it is more advanced
in its nuclear evolution.
C© 2006 The Authors. Journal compilation C© 2006 RAS, MNRAS 368, 1311–1318
Eclipsing binaries in the ASAS catalogue 1313
It is interesting that there is a controversy about thermal relaxation
oscillations in the W UMa systems. Some authors claim there are
no such oscillations (Webbink 2003), while others claim that such
oscillations exist (Quin 2003; Li, Han & Zhang 2004; Yakut &
Eggleton 2005, and references therein). The controversy seems to
be rooted in the popular conviction that there are only very few
eclipsing binaries in the period range 0.2 < P < 1.3 d which are
not in a thermal contact, while the theory of relaxation oscillations
requires them to be common. We do not try to understand the origin
of this conviction, but we point out that the ASAS statistics resolve
this controversy on purely observational grounds: we demonstrate
there are approximately as many W UMa systems which are in
thermal contact, that is, systems with the two eclipses of about the
same depth, and the W UMa-like binaries with different depths of
the two eclipses, as theoretically expected (cf. Figs 8 and 9).
3 A S A S DATA
Close binaries with a deep common envelope are in thermal con-
tact and they have eclipses of almost equal depth. If the contact is
shallow, or if there is no physical contact, then the effective tem-
peratures of the two stars are different, and the two eclipses have
different depths.
Theoretical models of relaxation oscillations indicate that the radii
of the two components change relatively little throughout the cycle
(Flannery 1976; Lucy 1976; Robertson & Eggleton 1977; Yakut &
Eggleton 2005, and references therein). With the geometry of the
two stars almost unchanged, tidal distortions due to the geometry
remain almost the same, and the most profound difference in the
light curve is the relative depth of the two eclipses.
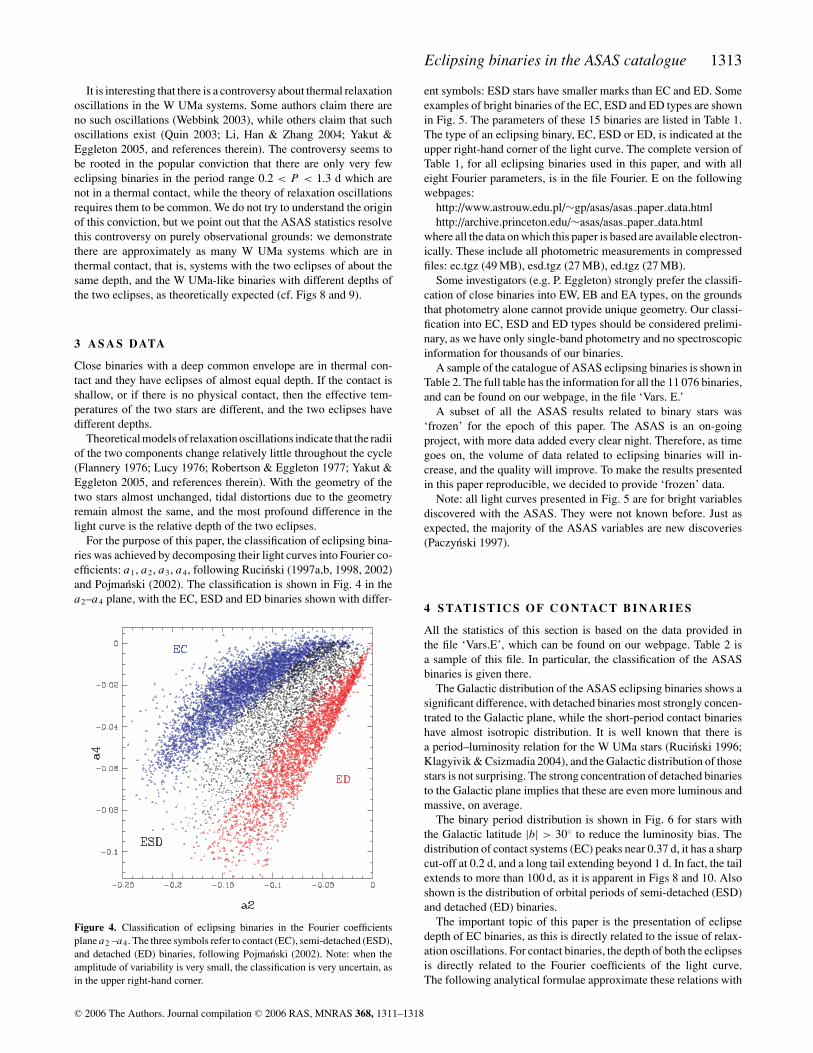
For the purpose of this paper, the classification of eclipsing bina-
ries was achieved by decomposing their light curves into Fourier co-
efficients: a1, a2, a3, a4, following Rucinski (1997a,b, 1998, 2002)
and Pojmanski (2002). The classification is shown in Fig. 4 in the
a2–a4 plane, with the EC, ESD and ED binaries shown with differ-
Figure 4. Classification of eclipsing binaries in the Fourier coefficients
plane a2 –a4. The three symbols refer to contact (EC), semi-detached (ESD),
and detached (ED) binaries, following Pojmanski (2002). Note: when the
amplitude of variability is very small, the classification is very uncertain, as
in the upper right-hand corner.
ent symbols: ESD stars have smaller marks than EC and ED. Some
examples of bright binaries of the EC, ESD and ED types are shown
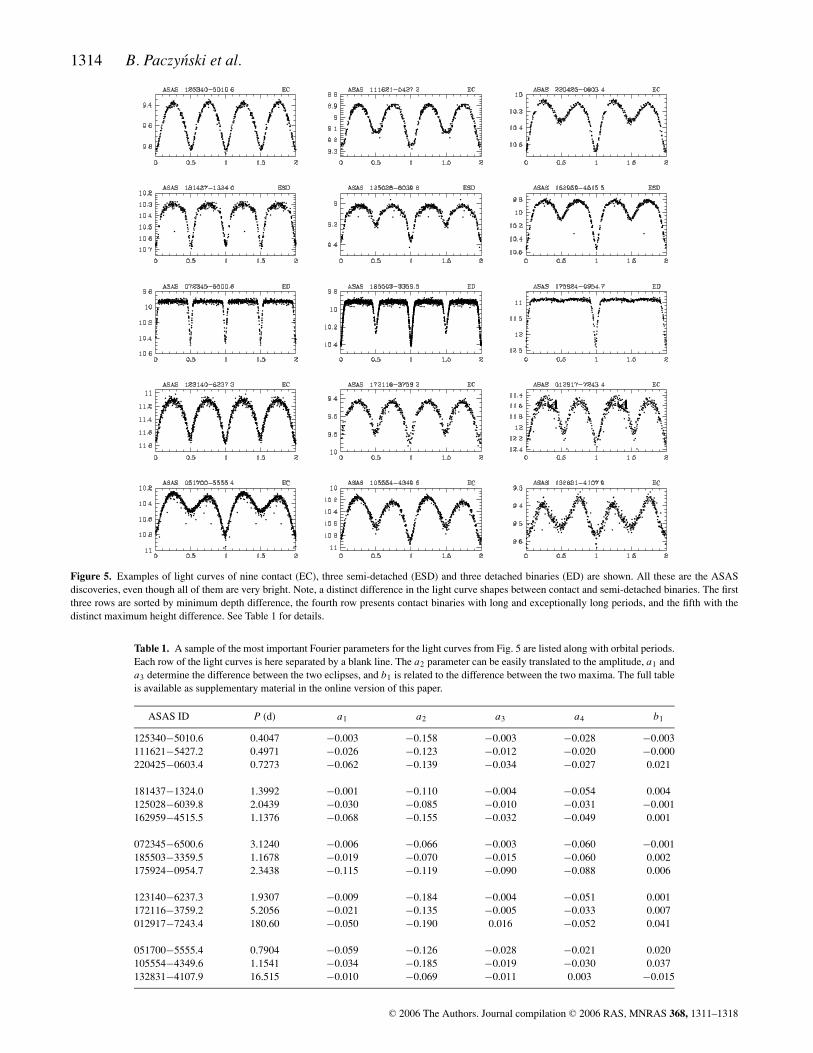
in Fig. 5. The parameters of these 15 binaries are listed in Table 1.
The type of an eclipsing binary, EC, ESD or ED, is indicated at the
upper right-hand corner of the light curve. The complete version of
Table 1, for all eclipsing binaries used in this paper, and with all
eight Fourier parameters, is in the file Fourier. E on the following
webpages:
http://www.astrouw.edu.pl/∼gp/asas/asas paper data.html
http://archive.princeton.edu/∼asas/asas paper data.html
where all the data on which this paper is based are available electron-
ically. These include all photometric measurements in compressed
files: ec.tgz (49 MB), esd.tgz (27 MB), ed.tgz (27 MB).
Some investigators (e.g. P. Eggleton) strongly prefer the classifi-
cation of close binaries into EW, EB and EA types, on the grounds
that photometry alone cannot provide unique geometry. Our classi-
fication into EC, ESD and ED types should be considered prelimi-
nary, as we have only single-band photometry and no spectroscopic
information for thousands of our binaries.
A sample of the catalogue of ASAS eclipsing binaries is shown in
Table 2. The full table has the information for all the 11 076 binaries,
and can be found on our webpage, in the file ‘Vars. E.’
A subset of all the ASAS results related to binary stars was
‘frozen’ for the epoch of this paper. The ASAS is an on-going
project, with more data added every clear night. Therefore, as time
goes on, the volume of data related to eclipsing binaries will in-
crease, and the quality will improve. To make the results presented
in this paper reproducible, we decided to provide ‘frozen’ data.
Note: all light curves presented in Fig. 5 are for bright variables
discovered with the ASAS. They were not known before. Just as
expected, the majority of the ASAS variables are new discoveries
(Paczynski 1997).
4 S TAT I S T I C S O F C O N TAC T B I NA R I E S
All the statistics of this section is based on the data provided in
the file ‘Vars.E’, which can be found on our webpage. Table 2 is
a sample of this file. In particular, the classification of the ASAS
binaries is given there.
The Galactic distribution of the ASAS eclipsing binaries shows a
significant difference, with detached binaries most strongly concen-
trated to the Galactic plane, while the short-period contact binaries
have almost isotropic distribution. It is well known that there is
a period–luminosity relation for the W UMa stars (Rucinski 1996;
Klagyivik & Csizmadia 2004), and the Galactic distribution of those
stars is not surprising. The strong concentration of detached binaries
to the Galactic plane implies that these are even more luminous and
massive, on average.
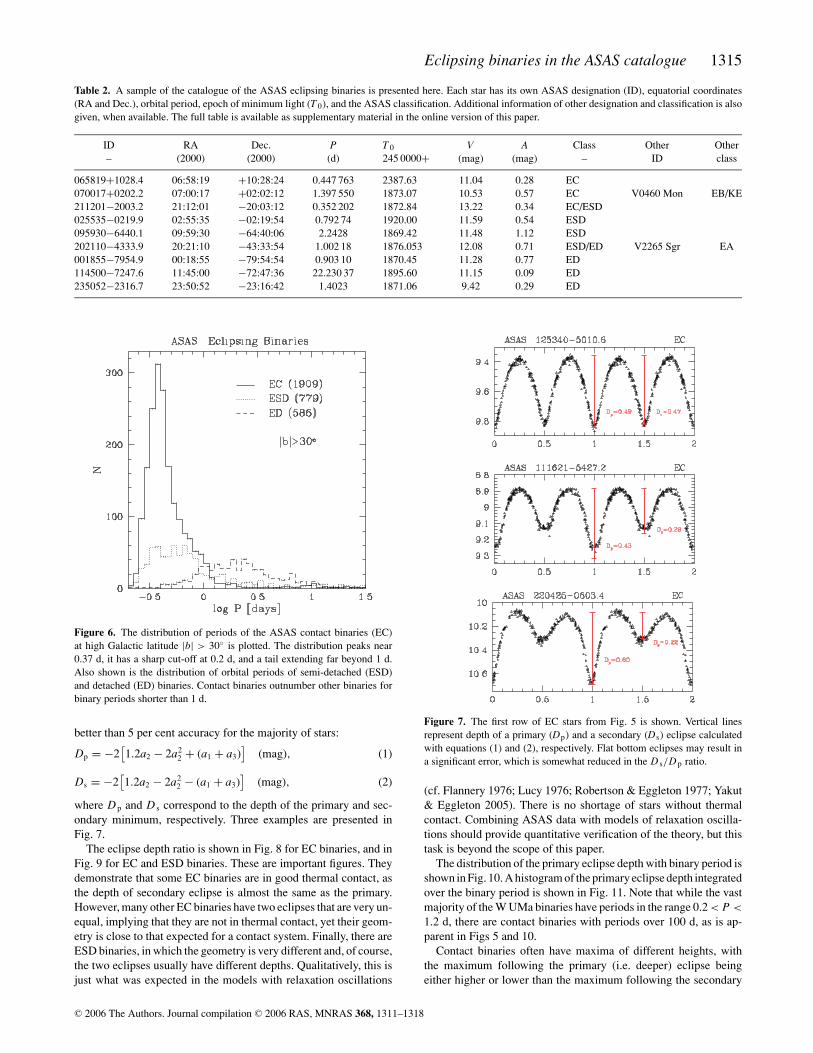
The binary period distribution is shown in Fig. 6 for stars with
the Galactic latitude |b| > 30◦ to reduce the luminosity bias. The
distribution of contact systems (EC) peaks near 0.37 d, it has a sharp
cut-off at 0.2 d, and a long tail extending beyond 1 d. In fact, the tail
extends to more than 100 d, as it is apparent in Figs 8 and 10. Also
shown is the distribution of orbital periods of semi-detached (ESD)
and detached (ED) binaries.
The important topic of this paper is the presentation of eclipse
depth of EC binaries, as this is directly related to the issue of relax-
ation oscillations. For contact binaries, the depth of both the eclipses
is directly related to the Fourier coefficients of the light curve.
The following analytical formulae approximate these relations with
C© 2006 The Authors. Journal compilation C© 2006 RAS, MNRAS 368, 1311–1318
1314 B. Paczynski et al.
Figure 5. Examples of light curves of nine contact (EC), three semi-detached (ESD) and three detached binaries (ED) are shown. All these are the ASAS
discoveries, even though all of them are very bright. Note, a distinct difference in the light curve shapes between contact and semi-detached binaries. The first
three rows are sorted by minimum depth difference, the fourth row presents contact binaries with long and exceptionally long periods, and the fifth with the
distinct maximum height difference. See Table 1 for details.
Table 1. A sample of the most important Fourier parameters for the light curves from Fig. 5 are listed along with orbital periods.
Each row of the light curves is here separated by a blank line. The a2 parameter can be easily translated to the amplitude, a1 and
a3 determine the difference between the two eclipses, and b1 is related to the difference between the two maxima. The full table
is available as supplementary material in the online version of this paper.
ASAS ID P (d) a1 a2 a3 a4 b1
125340−5010.6 0.4047 −0.003 −0.158 −0.003 −0.028 −0.003
111621−5427.2 0.4971 −0.026 −0.123 −0.012 −0.020 −0.000
220425−0603.4 0.7273 −0.062 −0.139 −0.034 −0.027 0.021
181437−1324.0 1.3992 −0.001 −0.110 −0.004 −0.054 0.004
125028−6039.8 2.0439 −0.030 −0.085 −0.010 −0.031 −0.001
162959−4515.5 1.1376 −0.068 −0.155 −0.032 −0.049 0.001
072345−6500.6 3.1240 −0.006 −0.066 −0.003 −0.060 −0.001
185503−3359.5 1.1678 −0.019 −0.070 −0.015 −0.060 0.002
175924−0954.7 2.3438 −0.115 −0.119 −0.090 −0.088 0.006
123140−6237.3 1.9307 −0.009 −0.184 −0.004 −0.051 0.001
172116−3759.2 5.2056 −0.021 −0.135 −0.005 −0.033 0.007
012917−7243.4 180.60 −0.050 −0.190 0.016 −0.052 0.041
051700−5555.4 0.7904 −0.059 −0.126 −0.028 −0.021 0.020
105554−4349.6 1.1541 −0.034 −0.185 −0.019 −0.030 0.037
132831−4107.9 16.515 −0.010 −0.069 −0.011 0.003 −0.015
C© 2006 The Authors. Journal compilation C© 2006 RAS, MNRAS 368, 1311–1318
Eclipsing binaries in the ASAS catalogue 1315
Table 2. A sample of the catalogue of the ASAS eclipsing binaries is presented here. Each star has its own ASAS designation (ID), equatorial coordinates
(RA and Dec.), orbital period, epoch of minimum light (T 0), and the ASAS classification. Additional information of other designation and classification is also
given, when available. The full table is available as supplementary material in the online version of this paper.
ID RA Dec. P T 0 V A Class Other Other
– (2000) (2000) (d) 245 0000+ (mag) (mag) – ID class
065819+1028.4 06:58:19 +10:28:24 0.447 763 2387.63 11.04 0.28 EC
070017+0202.2 07:00:17 +02:02:12 1.397 550 1873.07 10.53 0.57 EC V0460 Mon EB/KE
211201−2003.2 21:12:01 −20:03:12 0.352 202 1872.84 13.22 0.34 EC/ESD
025535−0219.9 02:55:35 −02:19:54 0.792 74 1920.00 11.59 0.54 ESD
095930−6440.1 09:59:30 −64:40:06 2.2428 1869.42 11.48 1.12 ESD
202110−4333.9 20:21:10 −43:33:54 1.002 18 1876.053 12.08 0.71 ESD/ED V2265 Sgr EA
001855−7954.9 00:18:55 −79:54:54 0.903 10 1870.45 11.28 0.77 ED
114500−7247.6 11:45:00 −72:47:36 22.230 37 1895.60 11.15 0.09 ED
235052−2316.7 23:50:52 −23:16:42 1.4023 1871.06 9.42 0.29 ED
Figure 6. The distribution of periods of the ASAS contact binaries (EC)
at high Galactic latitude |b| > 30◦ is plotted. The distribution peaks near
0.37 d, it has a sharp cut-off at 0.2 d, and a tail extending far beyond 1 d.
Also shown is the distribution of orbital periods of semi-detached (ESD)
and detached (ED) binaries. Contact binaries outnumber other binaries for
binary periods shorter than 1 d.
better than 5 per cent accuracy for the majority of stars:
Dp = −2[
1.2a2 − 2a22 + (a1 + a3)
]
(mag), (1)
Ds = −2[
1.2a2 − 2a22 − (a1 + a3)
]
(mag), (2)
where Dp and D s correspond to the depth of the primary and sec-
ondary minimum, respectively. Three examples are presented in
Fig. 7.
The eclipse depth ratio is shown in Fig. 8 for EC binaries, and in
Fig. 9 for EC and ESD binaries. These are important figures. They
demonstrate that some EC binaries are in good thermal contact, as
the depth of secondary eclipse is almost the same as the primary.
However, many other EC binaries have two eclipses that are very un-
equal, implying that they are not in thermal contact, yet their geom-
etry is close to that expected for a contact system. Finally, there are
ESD binaries, in which the geometry is very different and, of course,
the two eclipses usually have different depths. Qualitatively, this is
just what was expected in the models with relaxation oscillations
Figure 7. The first row of EC stars from Fig. 5 is shown. Vertical lines
represent depth of a primary (Dp) and a secondary (Ds) eclipse calculated
with equations (1) and (2), respectively. Flat bottom eclipses may result in
a significant error, which is somewhat reduced in the D s/Dp ratio.
(cf. Flannery 1976; Lucy 1976; Robertson & Eggleton 1977; Yakut
& Eggleton 2005). There is no shortage of stars without thermal
contact. Combining ASAS data with models of relaxation oscilla-
tions should provide quantitative verification of the theory, but this
task is beyond the scope of this paper.
The distribution of the primary eclipse depth with binary period is
shown in Fig. 10. A histogram of the primary eclipse depth integrated
over the binary period is shown in Fig. 11. Note that while the vast
majority of the W UMa binaries have periods in the range 0.2 < P <
1.2 d, there are contact binaries with periods over 100 d, as is ap-
parent in Figs 5 and 10.
Contact binaries often have maxima of different heights, with
the maximum following the primary (i.e. deeper) eclipse being
either higher or lower than the maximum following the secondary
C© 2006 The Authors. Journal compilation C© 2006 RAS, MNRAS 368, 1311–1318

1316 B. Paczynski et al.
Figure 8. The ratio of eclipse depth is shown for contact binaries as a
function of their period. Stars in thermal contact have the eclipse depth ratio
close to 1.
Figure 9. The ratio of the eclipse depths, integrated over binary periods,
is shown for contact (EC) and semi-detached (ESD) systems. Stars in a
thermal contact have the eclipse depth ratio close to 1. Note, the step in the
histogram at D s/Dp ≈ 0.7. The same feature is also apparent in Fig. 8 at
log P ≈ −0.4.
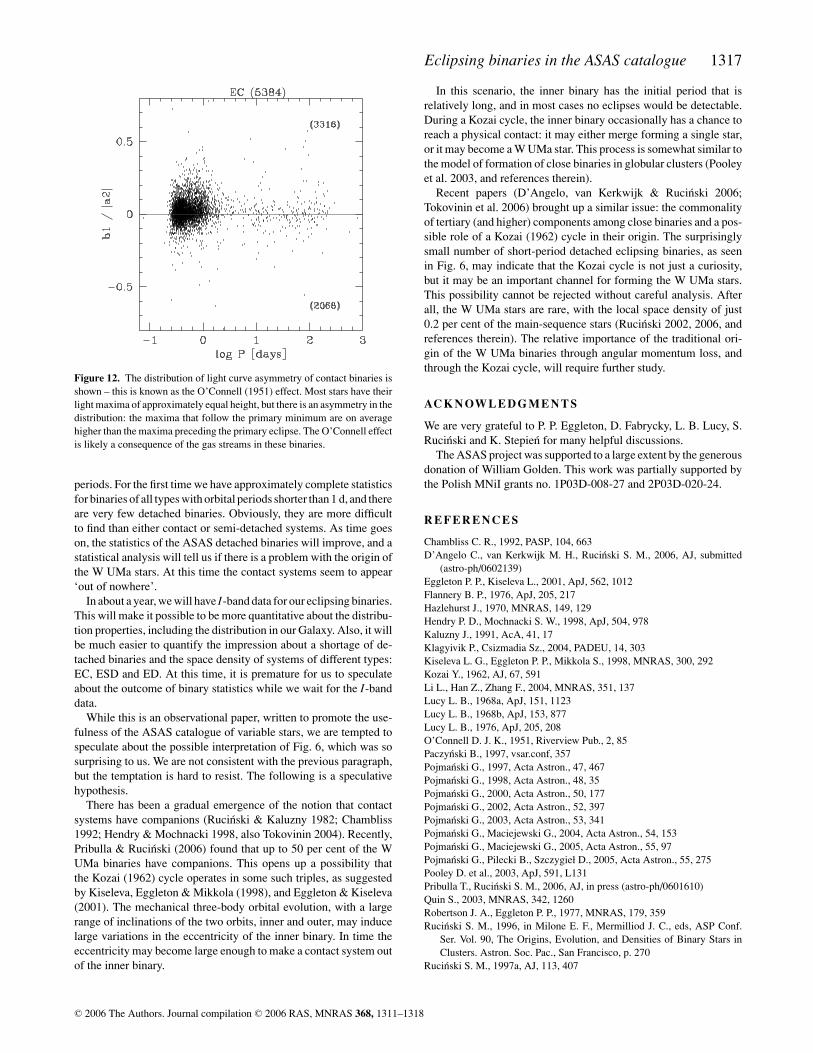
eclipse. The distribution of the difference is shown in Fig. 12. The
positive value of the b1/|a2| parameter indicates that the maximum
following the primary eclipse is brighter of the two. The asymmetry
in distribution, i.e. the excess of the positive values of b1/|a2|, is
known as the O’Connell (1951) effect (cf. also Rucinski 1997b): the
maximum following the primary eclipse is on average brighter, pre-
sumably due to the stream of gas flowing between the two stars. An
extreme case of this phenomenon is shown in V361 Lyr (Kaluzny
1991).
5 D I S C U S S I O N
Our conclusion, based on the distribution of eclipse depths (Figs 8
and 9), is that the relaxation oscillations, first proposed by Lucy and
Figure 10. The distribution of the primary eclipse depth as a function of
orbital period for contact binaries. Dp is the fraction of light obscured in the
primary eclipse.
Figure 11. The distribution of the primary eclipse depth integrated over all
periods.
Flannery, are real. There is no shortage of binaries corresponding to
no thermal contact, with a very different depth of the two eclipses.
Model calculations of the type recently carried out by Yakut &
Eggleton (2005), when combined with the ASAS data, should allow
a quantitative verification of the theory.
A very large number of contact or near-contact systems reveal
features never noted before: the distribution of eclipse-depth ratios
as shown in Figs 8 and 9 has a distinct break around log P ≈ −0.4
and D s/Dp ≈ 0.7. We do not speculate on the origin of this feature,
but we bring this break to the attention of our readers. This break is
best seen in systems with the most robust classification.
The most surprising result of this paper is presented in Fig. 6.
A traditional view for the origin of the W UMa contact binaries
is to assume that they come from detached binaries of comparable
C© 2006 The Authors. Journal compilation C© 2006 RAS, MNRAS 368, 1311–1318
Eclipsing binaries in the ASAS catalogue 1317
Figure 12. The distribution of light curve asymmetry of contact binaries is
shown – this is known as the O’Connell (1951) effect. Most stars have their
light maxima of approximately equal height, but there is an asymmetry in the
distribution: the maxima that follow the primary minimum are on average
higher than the maxima preceding the primary eclipse. The O’Connell effect
is likely a consequence of the gas streams in these binaries.
periods. For the first time we have approximately complete statistics
for binaries of all types with orbital periods shorter than 1 d, and there
are very few detached binaries. Obviously, they are more difficult
to find than either contact or semi-detached systems. As time goes
on, the statistics of the ASAS detached binaries will improve, and a
statistical analysis will tell us if there is a problem with the origin of
the W UMa stars. At this time the contact systems seem to appear
‘out of nowhere’.
In about a year, we will have I-band data for our eclipsing binaries.
This will make it possible to be more quantitative about the distribu-
tion properties, including the distribution in our Galaxy. Also, it will
be much easier to quantify the impression about a shortage of de-
tached binaries and the space density of systems of different types:
EC, ESD and ED. At this time, it is premature for us to speculate
about the outcome of binary statistics while we wait for the I-band
data.
While this is an observational paper, written to promote the use-
fulness of the ASAS catalogue of variable stars, we are tempted to
speculate about the possible interpretation of Fig. 6, which was so
surprising to us. We are not consistent with the previous paragraph,
but the temptation is hard to resist. The following is a speculative
hypothesis.
There has been a gradual emergence of the notion that contact
systems have companions (Rucinski & Kaluzny 1982; Chambliss
1992; Hendry & Mochnacki 1998, also Tokovinin 2004). Recently,
Pribulla & Rucinski (2006) found that up to 50 per cent of the W
UMa binaries have companions. This opens up a possibility that
the Kozai (1962) cycle operates in some such triples, as suggested
by Kiseleva, Eggleton & Mikkola (1998), and Eggleton & Kiseleva
(2001). The mechanical three-body orbital evolution, with a large
range of inclinations of the two orbits, inner and outer, may induce
large variations in the eccentricity of the inner binary. In time the
eccentricity may become large enough to make a contact system out
of the inner binary.
In this scenario, the inner binary has the initial period that is
relatively long, and in most cases no eclipses would be detectable.
During a Kozai cycle, the inner binary occasionally has a chance to
reach a physical contact: it may either merge forming a single star,
or it may become a W UMa star. This process is somewhat similar to
the model of formation of close binaries in globular clusters (Pooley
et al. 2003, and references therein).
Recent papers (D’Angelo, van Kerkwijk & Rucinski 2006;
Tokovinin et al. 2006) brought up a similar issue: the commonality
of tertiary (and higher) components among close binaries and a pos-
sible role of a Kozai (1962) cycle in their origin. The surprisingly
small number of short-period detached eclipsing binaries, as seen
in Fig. 6, may indicate that the Kozai cycle is not just a curiosity,
but it may be an important channel for forming the W UMa stars.
This possibility cannot be rejected without careful analysis. After
all, the W UMa stars are rare, with the local space density of just
0.2 per cent of the main-sequence stars (Rucinski 2002, 2006, and
references therein). The relative importance of the traditional ori-
gin of the W UMa binaries through angular momentum loss, and
through the Kozai cycle, will require further study.
AC K N OW L E D G M E N T S
We are very grateful to P. P. Eggleton, D. Fabrycky, L. B. Lucy, S.
Rucinski and K. Stepien for many helpful discussions.
The ASAS project was supported to a large extent by the generous
donation of William Golden. This work was partially supported by
the Polish MNiI grants no. 1P03D-008-27 and 2P03D-020-24.
R E F E R E N C E S
Chambliss C. R., 1992, PASP, 104, 663
D’Angelo C., van Kerkwijk M. H., Rucinski S. M., 2006, AJ, submitted
(astro-ph/0602139)
Eggleton P. P., Kiseleva L., 2001, ApJ, 562, 1012
Flannery B. P., 1976, ApJ, 205, 217
Hazlehurst J., 1970, MNRAS, 149, 129
Hendry P. D., Mochnacki S. W., 1998, ApJ, 504, 978
Kaluzny J., 1991, AcA, 41, 17
Klagyivik P., Csizmadia Sz., 2004, PADEU, 14, 303
Kiseleva L. G., Eggleton P. P., Mikkola S., 1998, MNRAS, 300, 292
Kozai Y., 1962, AJ, 67, 591
Li L., Han Z., Zhang F., 2004, MNRAS, 351, 137
Lucy L. B., 1968a, ApJ, 151, 1123
Lucy L. B., 1968b, ApJ, 153, 877
Lucy L. B., 1976, ApJ, 205, 208
O’Connell D. J. K., 1951, Riverview Pub., 2, 85
Paczynski B., 1997, vsar.conf, 357
Pojmanski G., 1997, Acta Astron., 47, 467
Pojmanski G., 1998, Acta Astron., 48, 35
Pojmanski G., 2000, Acta Astron., 50, 177
Pojmanski G., 2002, Acta Astron., 52, 397
Pojmanski G., 2003, Acta Astron., 53, 341
Pojmanski G., Maciejewski G., 2004, Acta Astron., 54, 153
Pojmanski G., Maciejewski G., 2005, Acta Astron., 55, 97
Pojmanski G., Pilecki B., Szczygie�l D., 2005, Acta Astron., 55, 275
Pooley D. et al., 2003, ApJ, 591, L131
Pribulla T., Rucinski S. M., 2006, AJ, in press (astro-ph/0601610)
Quin S., 2003, MNRAS, 342, 1260
Robertson J. A., Eggleton P. P., 1977, MNRAS, 179, 359
Rucinski S. M., 1996, in Milone E. F., Mermilliod J. C., eds, ASP Conf.
Ser. Vol. 90, The Origins, Evolution, and Densities of Binary Stars in
Clusters. Astron. Soc. Pac., San Francisco, p. 270
Rucinski S. M., 1997a, AJ, 113, 407
C© 2006 The Authors. Journal compilation C© 2006 RAS, MNRAS 368, 1311–1318
1318 B. Paczynski et al.
Rucinski S. M., 1997b, AJ, 113, 1112
Rucinski S. M., 1998, AJ, 115, 1135
Rucinski S., 2002, PASP, 114, 1124
Rucinski S., 2006, MNRAS, in press (doi:10.1111/j.1365-
2966.2006.10207.x) (astro-ph/0602045)
Rucinski S. M., Kaluzny J., 1982, Ap&SS, 88, 433
Stepien K., 2003, IAUS, 219, 134
Stepien K., 2005, A&A, submitted (astro-ph/0510464)
Tokovinin A., 2004, Rev. Mex. Astron. Astrofis. Ser. Conf., 21, 7
Tokovinin A., Thomas S., Sterzik M., Udry S., 2006, A&A, in press (astro-
ph/0601518)
Webbink R. F., 2003, in Turcotte S., Keller S. C., Cavallo R. M., eds, ASP
Conf. Ser. Vol. 293, 3D Stellar Evolution. Astron. Soc. Pac., San Fran-
cisco, p. 76
Yakut K., Eggleton P. P., 2005, ApJ, 629, 1055
S U P P L E M E N TA RY M AT E R I A L
The following supplementary material is available for this article
online:
Table 1. The most important Fourier parameters for light curves
from Fig. 5 are listed along with orbital periods.
Table 2. The catalogue of the ASAS eclipsing binaries.
This material is available as part of the online article from
http://www.blackwell-synergy.com.
This paper has been typeset from a TEX/LATEX file prepared by the author.
C© 2006 The Authors. Journal compilation C© 2006 RAS, MNRAS 368, 1311–1318


![arXiv:1806.07680v3 [astro-ph.SR] 12 Jan 2019 · Draft version January 15, 2019 Typeset using LATEX default style in AASTeX62 Physics of Eclipsing Binaries. III. Spin-Orbit Misalignment](https://img.pdfslide.us/doc/110x75/5fb4f05c380e295ccb3999a3/arxiv180607680v3-astro-phsr-12-jan-2019-draft-version-january-15-2019-typeset.jpg)