Embed Size (px)
Citation preview


Page | I
Declaration
Concurrent registration for two or more academic awards
I declare that while registered as a candidate for the research degree, I have not been a
registered candidate or enrolled student for another award of the University or other
academic or professional institution
____________________________________________________________________________
Material submitted for another award
I declare that no material contained in the thesis has been used in any other submission for an
academic award and is solely my own work
____________________________________________________________________________
Collaboration
Where a candidate’s research programme is part of a collaborative project, the thesis must
indicate in addition clearly the candidate’s individual contribution and the extent of the
collaboration. Please state below:
Signature of Candidate
Type of Award MSc (by research)
School School of Forensic and Investigative Science
Douglas J Parker

Page | II
Abstract
Glycerol is a plentiful chemical side-product from many industrial processes including
the production of biofuels, simple fermentations and reactions used to synthesise
alkenes such as propene. The rising cost of safely disposing of chemical waste is
forcing companies to find new and innovative ways of either reusing waste products or
ways to minimise the amount of waste produced. Waste glycerol can be converted
into more highly desirable compounds such as glycerol carbonate. However, the most
common method of converting glycerol to glycerol carbonate is to react it with
phosgene which is highly toxic. Glycerol carbonate is a highly sought after compound
because of the magnitude of its uses from polymers and cleaning solvents to cosmetics
and curing agents.
Recent research has started to focus on finding new green methods for synthesising
glycerol carbonate, by way of catalysis. Previous work in this area was carried out by
Aresta et al. in which γ-zirconium phosphate was used to catalyse the reaction
between glycerol and urea to form glycerol carbonate. It is thought that the reaction
proceeds via a two-step reaction. Firstly the glycerol and urea react forming glycerol
carbamate, this intermediate then cyclicises around to form the carbonate. The
advantage in using urea for this reaction as opposed to carbon dioxide is that ammonia
gas is evolved during the reaction, allowing for a potentially greener method to
synthesise another valuable industrial chemical. The work presented here is the
synthesis of a library of novel metal-substituted layered phosphate catalysts and the
assessment of their potential as catalysts, in the synthesis of glycerol carbonate via the
glycerolysis of urea.

Page | III
Acknowledgements
Firstly I would like to thank my supervisors Professor Gary Bond and Dr. Jennifer
Readman, who have provided me with lots of support and encouragement over the
past year and have always found the time to help me. Also a special thank you to Jen
for keeping my spirits high by providing ample quantities of very delicious cake!
I would also like to acknowledge the help and support of Dr Richard McCabe whose
helpful advice and vast knowledge of all things relating to chemistry has proved to be
most insightful and invaluable to me in completing my thesis. Also I like to thank all
the technical staff in the school, especially a big thank you to Jim, Tamar and Pat for
keeping everything running smoothly in the analytical suite and to Dr Runjie Mao for
helping me with the micrometrics equipment. Also I would like to say a big thank you
to Sal who never failed to dig out obscure bits of equipment and chemicals whenever I
asked.
I would like to thank both the School of Forensic and Investigative Sciences and the
School of Pharmacy and Biomedical Sciences for allowing me to use their facilities and
equipment.
And finally I would like to thank all my friends at UCLan for making my time here most
enjoyable and my family for being a constant source of support.
Page | IV
List of Abbreviations
AlPO Aluminium Phosphate
α-ZrP Alpha Zirconium Phosphate
γ-ZrP Gamma Zirconium Phosphate
GTBE Glycerol tert-butyl ether
NMR Nuclear Magnetic Resonance
FoM Figure of Merit
XRD Powder X-Ray Diffraction
XRF X-Ray Fluorescence
MQMAS Multiple Quantum Magic Angle Spinning
SEM Scanning Electron Microscopy
EDX Energy Dispersive X-ray spectroscopy
TGA Thermogravimetric Analysis
BET Brunauer, Emmett and Teller
DRIFTS Diffuse Reflectance Infrared Fourier Transform
Spectroscopy

Page | V
Contents
List of Figures .............................................................................................................................. VII
List of Tables .................................................................................................................................. X
Chapter 1: Introduction
1.1: Glycerol, waste product or valuable raw material? ............................................................ 1
1.2: Existing and new methods of glycerol carbonate synthesis ............................................... 6
1.3: Aluminium phosphates and derivatives .............................................................................. 9
1.4: Zirconium phosphates and derivatives .............................................................................14
1.5: Aims of Research ...............................................................................................................17
Chapter 2: The synthesis and characterisation of doped metal phosphates
2.1: Introduction ......................................................................................................................18
2.2: Synthesis of catalysts ........................................................................................................18
2.3: Materials ...........................................................................................................................19
2.4: Methods of characterisation and analysis ........................................................................21
2.5: Characterisation of Aluminium Phosphate series catalysts ..............................................24
2.5.1: Infrared Spectroscopy ................................................................................................24
2.5.2: X-Ray Diffraction and X-Ray Fluorescence analysis ...................................................30
2.5.3: Solid-state NMR .........................................................................................................33
2.5.4: Surface properties and decomposition analysis ........................................................37
2.6: Characterisation of α-zirconium phosphate catalyst ........................................................43
2.6.1: Infrared Spectroscopy ................................................................................................43
2.6.2: X-Ray Diffraction and X-Ray Fluorescence analysis ...................................................44
2.6.3: Solid-state NMR .........................................................................................................45
2.6.4: Surface properties and decomposition analysis ........................................................45
2.7: Summary ...........................................................................................................................48

Page | VI
Contents
Chapter 3: Catalytic testing and results
3.1: Introduction ......................................................................................................................49
3.2: Method development and reaction set-up .......................................................................50
3.3: Results ...............................................................................................................................52
3.3.1: Ammonia capture results ...........................................................................................52
3.3.2: Glycerol carbonate yields ...........................................................................................53
3.4: Summary ...........................................................................................................................55
Chapter 4: Conclusions and future work
4.1: Conclusions .......................................................................................................................56
4.2: Future work .......................................................................................................................61
4.3: Summary ...........................................................................................................................64
Appendices ...................................................................................................................................65
Appendix 5.1: Ammonia capture data .....................................................................................66
Appendix 5.2: XRF spectra .......................................................................................................70
Appendix 5.3: 27Al NMR spectra ...............................................................................................73
Appendix 5.4: 1D-MQMAS NMR spectra .................................................................................76
Appendix 5.5: Annotated catalytic reaction NMRs ..................................................................79
Appendix 5.6: Refined lattice parameters .............................................................................100
References..................................................................................................................................106
Page | VII
List of Figures
Figure 1.1: Derivatives of glycerol, chemical pathway [3] ............................................................ 2
Figure 1.2: Fine chemical derivatives of glycerol .......................................................................... 3
Figure 1.3: The direct carboxylation of glycerol via n-Bu2Sn(OMe)2 catalysis .............................. 6
Figure 1.4: Crystal structure of berlinite [21] ................................................................................ 9
Figure 1.5: Crystal structure of α-zirconium phosphate [36] ...................................................... 14
Figure 1.6: The glycerolysis of urea via catalytic reaction .......................................................... 17
Figure 2.1: IR spectrum of DJP011 (Ti doped) ............................................................................. 25
Figure 2.2: IR spectrum of DJP015 .............................................................................................. 26
Figure 2.3: IR Spectrum of DJP017 (Zn doped) ........................................................................... 27
Figure 2.4: IR Spectrum of DJP018 (Ga doped) ........................................................................... 28
Figure 2.5: IR spectrum of DJP019 (Co doped) ........................................................................... 29
Figure 2.6: XRD patterns for aluminium phosphate series catalysts .......................................... 32
Figure 2.7: 31P NMR spectrum of DJP011 (Ti doped) .................................................................. 34
Figure 2.8: 31P NMR spectrum of DJP015 ................................................................................... 34
Figure 2.9: 31P NMR spectrum of DJP017 (Zn doped) ................................................................. 35
Figure 2.10: 31P NMR spectrum of DJP018 (Ga doped) ............................................................... 35
Figure 2.11: 31P NMR spectrum of DJP019 (Co doped) ............................................................... 36
Figure 2.12: Scanning electron micrographs of DJP015(a) and DJP017(b) ................................. 38
Figure 2.13: TGA curve of DJP011 (Ti doped).............................................................................. 40
Figure 2.14: TGA curve of DJP015 ............................................................................................... 40
Figure 2.15: TGA curve of DJP017 (Zn doped) ............................................................................ 41
Figure 2.16: TGA curve of DJP018 (Ga doped) ............................................................................ 41
Figure 2.17: TGA curve of DJP019 (Co doped) ............................................................................ 42
Figure 2.18: IR spectrum of DJP016 ............................................................................................ 43
Figure 2.19: 31P NMR spectrum of α-ZrP catalyst ....................................................................... 45
Figure 2.20: Scanning electron micrograph of DJP016 ............................................................... 46
Figure 2.21: TGA curve of DJP016 ............................................................................................... 47
Figure 3.1: Correlation between glycerol carbonate and ammonia evolved ............................. 51
Figure 3.2: Graph showing the cumulative ammonia captured per reaction ............................. 52
Figure 4.1: 13C NMR of catalytic reaction showing no ethylenediamine peak............................ 57
Figure 4.2: Proposed structure of undoped AlPO with template. Adapted from [59] ............... 58
Figure 5.1: XRF spectrum for DJP011 .......................................................................................... 70
Figure 5.2: XRF spectrum for DJP015 .......................................................................................... 70

Page | VIII
List of Figures
Figure 5.3: XRF spectrum for DJP016 .......................................................................................... 71
Figure 5.4: XRF spectrum for DJP017 .......................................................................................... 71
Figure 5.5 XRF spectrum for DJP018 ........................................................................................... 72
Figure 5.6 XRF spectrum for DJP019 ........................................................................................... 72
Figure 5.7: 27Al NMR spectrum of DJP011................................................................................... 73
Figure 5.8: 27Al NMR spectrum of DJP015................................................................................... 73
Figure 5.9: 27Al NMR spectrum of DJP017................................................................................... 74
Figure 5.10: 27Al NMR spectrum of DJP018 ................................................................................ 74
Figure 5.11: 27Al NMR spectrum of DJP019 ................................................................................ 75
Figure 5.12: 1D-MQMAS spectrum of DJP011 ............................................................................ 76
Figure 5.13: 1D-MQMAS spectrum of DJP015 ............................................................................ 76
Figure 5.14: 1D-MQMAS spectrum of DJP017 ............................................................................ 77
Figure 5.15: 1D-MQMAS spectrum of DJP018 ............................................................................ 77
Figure 5.16: 1D-MQMAS spectrum of DJP019 ............................................................................ 78
Figure 5.17: Annotated 13C NMR for DJP000 (reaction 1) ........................................................... 79
Figure 5.18: Annotated 13C NMR for DJP000 (reaction 2) ........................................................... 80
Figure 5.19: Annotated 13C NMR for DJP000 (reaction 3) ........................................................... 81
Figure 5.20: Annotated 13C NMR for DJP011 (reaction 1) ........................................................... 82
Figure 5.21: Annotated 13C NMR for DJP011 (reaction 2) ........................................................... 83
Figure 5.22: Annotated 13C NMR for DJP011 (reaction 3) ........................................................... 84
Figure 5.23: Annotated 13C NMR for DJP015 (reaction 1) ........................................................... 85
Figure 5.24: Annotated 13C NMR for DJP015 (reaction 2) ........................................................... 86
Figure 5.25: Annotated 13C NMR for DJP015 (reaction 3) ........................................................... 87
Figure 5.26: Annotated 13C NMR for DJP016 (reaction 1) ........................................................... 88
Figure 5.27: Annotated 13C NMR for DJP016 (reaction 2) ........................................................... 89
Figure 5.28: Annotated 13C NMR for DJP016 (reaction 3) ........................................................... 90
Figure 5.29: Annotated 13C NMR for DJP017 (reaction 1) ........................................................... 91
Figure 5.30: Annotated 13C NMR for DJP017 (reaction 2) ........................................................... 92
Figure 5.31: Annotated 13C NMR for DJP017 (reaction 3) ........................................................... 93
Figure 5.32: Annotated 13C NMR for DJP018 (reaction 1) ........................................................... 94
Figure 5.33: Annotated 13C NMR for DJP018 (reaction 2) ........................................................... 95
Figure 5.34: Annotated 13C NMR for DJP018 (reaction 3) ........................................................... 96
Figure 5.35: Annotated 13C NMR for DJP019 (reaction 1) ........................................................... 97

Page | IX
List of Figures
Figure 5.36: Annotated 13C NMR for DJP019 (reaction 2) ........................................................... 98
Figure 5.37: Annotated 13C spectrum for DJP019 (reaction 3) ................................................... 99

Page | X
List of Tables
Table 1.1: Glycerol market breakdown [3] ................................................................................... 1
Table 2.1: Summary of starting materials and reaction conditions ........................................... 20
Table 2.2: IR data for DJP011 ...................................................................................................... 25
Table 2.3: IR data for DJP015 ...................................................................................................... 26
Table 2.4: IR data for DJP017 ...................................................................................................... 27
Table 2.5: IR data for DJP018 ...................................................................................................... 28
Table 2.6: IR data for DJP019 ...................................................................................................... 29
Table 2.7: XRF elemental analysis ............................................................................................... 30
Table 2.8: Unit cell parameters of AlPO series catalysts ............................................................. 31
Table 2.9: Refined unit cell parameters for AlPO catalysts ......................................................... 32
Table 2.10: Surface area analysis results for AlPO series ............................................................ 37
Table 2.11: EDX results for AlPO catalysts .................................................................................. 39
Table 2.12: IR data for DJP016 .................................................................................................... 44
Table 2.13: Unit cell parameters of α-ZrP catalyst ...................................................................... 44
Table 2.14: Refined unit cell parameters for α-ZrP ..................................................................... 44
Table 2.15: Surface area analysis results for α-ZrP ..................................................................... 46
Table 2.16: EDX analysis of α-ZrP catalyst................................................................................... 46
Table 3.1: Processed data showing the mass and yields of glycerol carbonate ......................... 54
Table 3.2: Table comparing molar ratios of glycerol carbonate and ammonia .......................... 55
Table 4.1: Potential unknown compounds found in reaction mixtures ..................................... 59
Table 5.1: Ammonia capture data for DJP011 ............................................................................ 66
Table 5.2: Ammonia capture data for DJP015 ............................................................................ 66
Table 5.3: Ammonia capture data for DJP016 ............................................................................ 67
Table 5.4: Ammonia capture data for DJP017 ............................................................................ 67
Table 5.5: Ammonia capture data for DJP018 ............................................................................ 68
Table 5.6: Ammonia capture data for DJP019 ............................................................................ 68
Table 5.7: Ammonia capture data for un-catalysed reaction ..................................................... 69
Table 5.8: Refined lattice parameters for DJP011 .................................................................... 100
Table 5.9: Refined lattice parameters for DJP015 .................................................................... 101
Table 5.10: Refined lattice parameters for DJP016 .................................................................. 102
Table 5.11: Refined lattice parameters for DJP017 .................................................................. 103
Table 5.12: Refined lattice parameters for DJP018 .................................................................. 104
Table 5.13: Refined lattice parameters for DJP019 .................................................................. 105

Page | 1
Chapter 1: Introduction
1.1: Glycerol, waste product or valuable raw material?
Glycerol is a relatively cheap waste product from many industrial processes including
the production of biofuels, fermentations and reactions used to synthesise alkenes.
The rising cost of safely disposing of chemical waste is forcing companies to find new
and innovative ways of either reusing their waste products or ways to minimise the
amount of waste produced.
In the short term, biodiesel is being increasingly seen as an alternative fuel source to
combat the dependence most countries have on petroleum based economies.
Biodiesel requires little or no modification to existing vehicles and infrastructure. The
synthesis of biodiesel produces approximately 10%, with respect to weight, crude
glycerol as one of the main side-products. The price of crude glycerol is valued at
around $0.05 per lb (at 2007 prices) [1]. It is anticipated that by the end of 2013 the
United States alone will produce over 1 billion gallons of biodiesel [2], this potentially
means a stockpile of over 100 million gallons of crude glycerol suitable for refining and
converting into value-added products.
Table 1.1: Glycerol market breakdown [3]
The Table 1.1 shows the market breakdown for refined glycerol. As can be seen from
the table above there are many different products that require glycerol for their
manufacture. Shown in Figure 1.1 is a pathway of currently known reactions and
products involving glycerol as the main starting material. As discussed by Behr et al.
[4] all chemical products derived from glycerol are a result of following one of eight
Drugs / Pharmaceuticals 18% Alkyd resins 6%
Personal Care 16% Tobacco 2%
Polyether / Polyols 14% Detergents 2%
Food 11% Cellophane 2%
Others 11% Explosives 2%
Triacetin 10%
Use Size of market Use Size of market

Page | 2
processes. These processes include synthesis of glycerol esters, ethers, acetals and
ketals, propanediols, epoxides, the oxidation and dehydration products of glycerol and
production of synthesis gas.
Figure 1.1: Derivatives of glycerol, chemical pathway [3]
As shown in Figure 1.1 glycerol can be used as a starting material for many fine
chemical derivatives (Figure 1.2), including tertiary butyl ethers, 1,3-propanediol and
glyceric acid, to name but a few. There are currently several competing and very
different methods for synthesising glyceric acid. One method, as investigated by Habe
et al. [5], is to use bacteria to process crude glycerol into glyceric acid. The advantage
in using bacteria for the synthesis of fine chemicals is that they can be highly specific in
synthesising particular enantiomers of a product, as shown in the results of Habe et al.
where several of the bacteria selected could produce glyceric acid with an
enantiomeric excess of 90-99% [5].
glycerol
highly branched polymers
fermenta on
dehydra on
etheri ca on
elec ve
oxida on
elec ve
oxida on
esteri ca on
diesters
onora upont
acrolein
fuels oxygenate
etomalonic acid
highly branched
polymers triglycerides
saponi ca on
C 2
glycerol carbonate
Polymers
Coa ngs
as separa on
olvents
Cosme cs
Personal care
detergents
glycidol
glycerol carbonate
ethers and esters
polyglycidol
new hyperbranched systems
dendrimers
alcohols catalysis

Page | 3
Figure 1.2: Fine chemical derivatives of glycerol
However, only one strain of bacteria (Gluconobacter frateurii NBRC103471), was able
to produce a relatively good yield of 30g – 40g per litre with a high enantiomeric
excess. If enantiomeric purity is not required then the number of suitable candidate
bacteria rises to 9.
Another method to synthesise glyceric acid from glycerol is to perform a selective
oxidation using a catalyst. Carrettin et al. have studied the use of gold catalysts in mild
reaction conditions to produce 100% selectivity [6]. As with the bacterial method of
synthesis, if higher selectivity is required the amount of glycerol converted decreases.
It was found that a 1% gold/carbon or 1% gold/graphite catalyst compares favourably
with that of Gluconobacter frateurii in the synthesis of glyceric acid, whereas the gold
catalysts not only produce 100% glyceric acid with no side-products, but also a 56%
conversion of the glycerol starting material. However, it is not known whether the
gold catalysts can also produce a high enantiomeric excess of glyceric acid, like
Gluconobacter frateurii.
1,3-propanediol is another derivative of glycerol that can be synthesised either by
catalytic or biological means. According to Zeng et al. [7] there are several suitable
glycerol
1, 3-propanediol
pyruvic acid
glycerol carbonate
tertiary butyl ethers of glycerolglyceric acid

Page | 4
bacteria that can be used in the synthesis of 1,3-propanediol, including Klebsiella
pneumonia, Citrobacter freundii and Clostridium butyricum. However, the problem
with using these bacteria is that the yield of 1,3-propanediol does not generally
increase above that of 70% due to side-products, such as ethanol, being produced.
Hydrogenolysis of glycerol, using noble metal loaded catalysts, can also produce 1,3-
propanediol. Kurosaka et al. [8] have researched the effect of various different noble
metals loaded on to WO3 supported ZrO2 catalysts. These noble metals include
platinum, palladium, ruthenium, rhodium and iridium. The results show that the most
suitable noble metal for use in the catalyst is platinum, where it makes up
approximately 2% (by weight) of the catalyst. The chosen Pt/WO3/ZrO2 catalyst
reported a yield of 24.2% for 1,3-propanediol, but it is still not as efficient as the
bacterial synthesis since approximately 14% of the glycerol is left unreacted and one of
the main side-products is 1,2-propanediol. This shows that there are still problems
with the enantiomeric selectivity of the catalysts towards 1,2-propanediol compared
to bacterial synthesis.
Glycerol tert-butyl ethers (GTBE) can be used in the automotive fuel industry as either
additives to both diesel and biodiesel fuels or as an octane booster for petroleum
fuels. Work carried out by Di Serio et al. [9] studied the effects of using the acid
support resin Amberlyst® 15 as a suitable catalyst for the etherification reaction.
Multiple tests were conducted to find the optimum reaction conditions and maximise
product yield. Under ideal conditions, approximately 90% of the glycerol is converted
to either mono-, di- or tri-ether forms of GTBE with only approximately 5% of the
glycerol left unreacted and the remainder as undesired side-products.
Alternatively, HY zeolite catalysts can be used in the etherification of glycerol. Xiao et
al. [10] have studied the effects of pre-treating HY zeolites with different acids in an
attempt to increase the catalytic properties and yield of GTBEs produced. Both citric
acid and nitric acid were used to wash the HY zeolites. The results from their study

Page | 5
show that treating HY catalysts with either of the above mentioned acids increases the
Brønsted acidity of the catalyst and also increases the surface area pore volume and
pore size of the catalyst improving its catalytic efficiency. Their work also shows that
acid treated HY zeolites are as active as SAC-13 catalysts and have an increased affinity
to synthesise the desired GTBEs.
As reported by Soares et al. [11] glycerol can be used as a fuel source by converting it
into synthesis gas using platinum supported catalysts. Soares et al. studied a wide
variety of catalytic supports including carbon, ZrO2, AlPO and both CeO2/ZrO2 and
MgO/ZrO2. All the catalysts showed deactivation during the reaction except for the
carbon supported platinum catalyst (Pt/C) which lasted for at least 30 hours. It is
apparent from the research that in the metal oxide catalysts, the higher the number of
acid sites, the longer it takes for the deactivation of the catalysts to occur.
Platinum-rhenium carbon catalysts (Pt-Re/C) have also been analysed for their
potential in the production of synthesis gas. Simonetti et al. [12] have been
researching an improved method of increasing the yield of synthesis gas over that of
the use of the traditional Pt/C catalyst. After optimising the reaction conditions for the
new Pt-Re/C catalyst, it has been determined that the bimetallic Pt-Re/C catalyst is 5
times more efficient than the monometallic Pt/C catalyst as long as the atomic Pt:Re
ratio is ≤1. lso, stable catalytic performance can be achieved at low conversions by
co-feeding a H2 stream into the reaction.
However, glycerol carbonate is probably the most desirable chemical to be derived
from glycerol because glycerol carbonate has a large variety of applications, low
toxicity and good biodegradability. Some of these applications and future uses include
use as a curing agent, use in cosmetics, as a starting product for forming chemical
derivatives and many others [13].
Page | 6
1.2: Existing and new methods of glycerol carbonate synthesis
Currently, there are several different methods of synthesising glycerol carbonate. The
two most common types are either phosgenation or the transesterification of glycerol,
both of which are carried out in the presence of a catalyst. Recently, there has been a
shift towards using cleaner, more energy efficient methods such as direct
carboxylation and the glycerolysis of urea.
One of the newer methods of synthesising glycerol carbonate is to use the waste
greenhouse gas carbon dioxide as a starting material along with crude glycerol.
Currently there are several different methods under development using different
catalysts to synthesis glycerol carbonate. These methods make use of either CO2 or
supercritical CO2 and utilise both solid acid and organometallic catalysts.
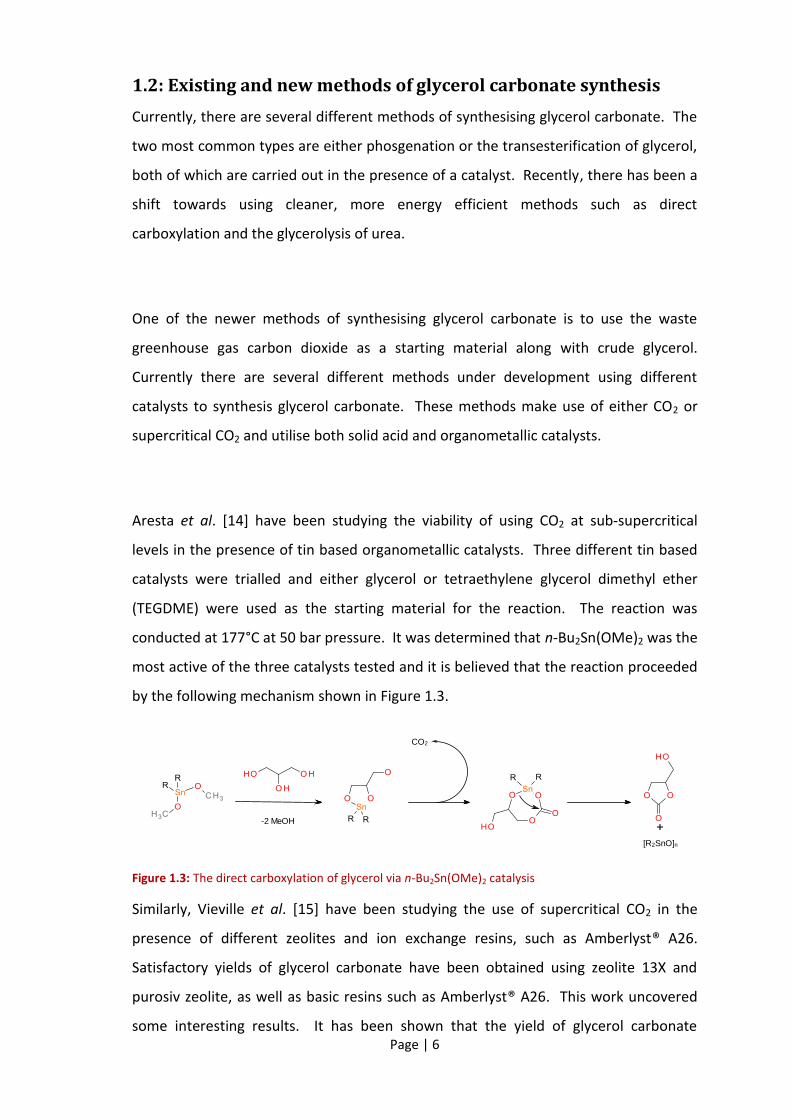
Aresta et al. [14] have been studying the viability of using CO2 at sub-supercritical
levels in the presence of tin based organometallic catalysts. Three different tin based
catalysts were trialled and either glycerol or tetraethylene glycerol dimethyl ether
(TEGDME) were used as the starting material for the reaction. The reaction was
conducted at 177°C at 50 bar pressure. It was determined that n-Bu2Sn(OMe)2 was the
most active of the three catalysts tested and it is believed that the reaction proceeded
by the following mechanism shown in Figure 1.3.
Figure 1.3: The direct carboxylation of glycerol via n-Bu2Sn(OMe)2 catalysis
Similarly, Vieville et al. [15] have been studying the use of supercritical CO2 in the
presence of different zeolites and ion exchange resins, such as Amberlyst® A26.
Satisfactory yields of glycerol carbonate have been obtained using zeolite 13X and
purosiv zeolite, as well as basic resins such as Amberlyst® A26. This work uncovered
some interesting results. It has been shown that the yield of glycerol carbonate
-2 MeOH
CO2
[R2SnO]n
Page | 7
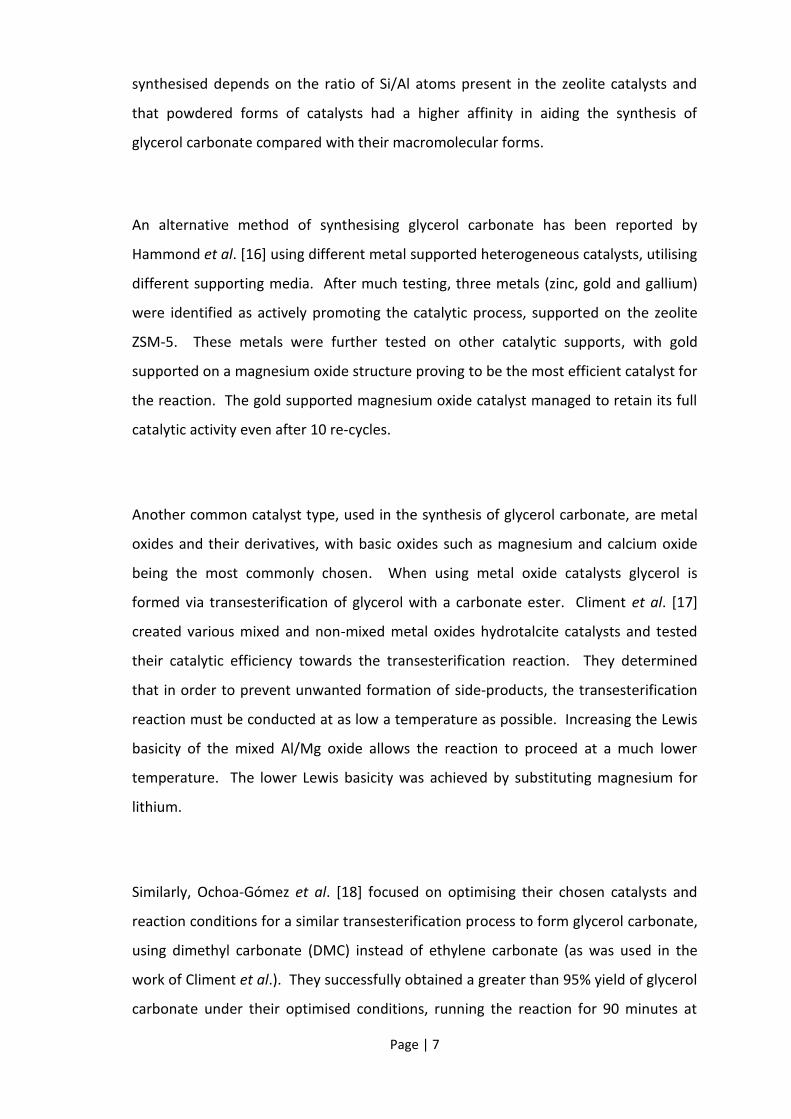
synthesised depends on the ratio of Si/Al atoms present in the zeolite catalysts and
that powdered forms of catalysts had a higher affinity in aiding the synthesis of
glycerol carbonate compared with their macromolecular forms.
An alternative method of synthesising glycerol carbonate has been reported by
Hammond et al. [16] using different metal supported heterogeneous catalysts, utilising
different supporting media. After much testing, three metals (zinc, gold and gallium)
were identified as actively promoting the catalytic process, supported on the zeolite
ZSM-5. These metals were further tested on other catalytic supports, with gold
supported on a magnesium oxide structure proving to be the most efficient catalyst for
the reaction. The gold supported magnesium oxide catalyst managed to retain its full
catalytic activity even after 10 re-cycles.
Another common catalyst type, used in the synthesis of glycerol carbonate, are metal
oxides and their derivatives, with basic oxides such as magnesium and calcium oxide
being the most commonly chosen. When using metal oxide catalysts glycerol is
formed via transesterification of glycerol with a carbonate ester. Climent et al. [17]
created various mixed and non-mixed metal oxides hydrotalcite catalysts and tested
their catalytic efficiency towards the transesterification reaction. They determined
that in order to prevent unwanted formation of side-products, the transesterification
reaction must be conducted at as low a temperature as possible. Increasing the Lewis
basicity of the mixed Al/Mg oxide allows the reaction to proceed at a much lower
temperature. The lower Lewis basicity was achieved by substituting magnesium for
lithium.
Similarly, Ochoa-Gómez et al. [18] focused on optimising their chosen catalysts and
reaction conditions for a similar transesterification process to form glycerol carbonate,
using dimethyl carbonate (DMC) instead of ethylene carbonate (as was used in the
work of Climent et al.). They successfully obtained a greater than 95% yield of glycerol
carbonate under their optimised conditions, running the reaction for 90 minutes at

Page | 8
95°C. The leaching of calcium from the CaO catalyst was kept to a minimum with a
reported calcium content of less than 0.34% in all samples tested. It has been shown
that calcining the CaO catalyst before use increases the yield by approximately 23%.
Also Ochoa-Gómez et al. [18] proposed a very simple method to isolate and purify the
glycerol carbonate. The CaO catalyst is removed via vacuum filtration and washed
with more DMC, the filtrate is then evaporated under vacuum to remove DMC and
methanol leaving the residual glycerol carbonate with a purity of approximately 95%.
Page | 9
1.3: Aluminium phosphates and derivatives
Aluminium phosphate can have several different morphologies and can be either
naturally occurring or synthetically manufactured. Naturally occurring aluminium
phosphate is found in the form of berlinite, which shares a similar crystal structure and
appearance to quartz. Most synthetic aluminium phosphate structures are now
known, the first being successfully synthesised and reported in 1982 [19]. Although
there are several small pore and dense phase naturally occurring AlPOs (e.g. berlinite,
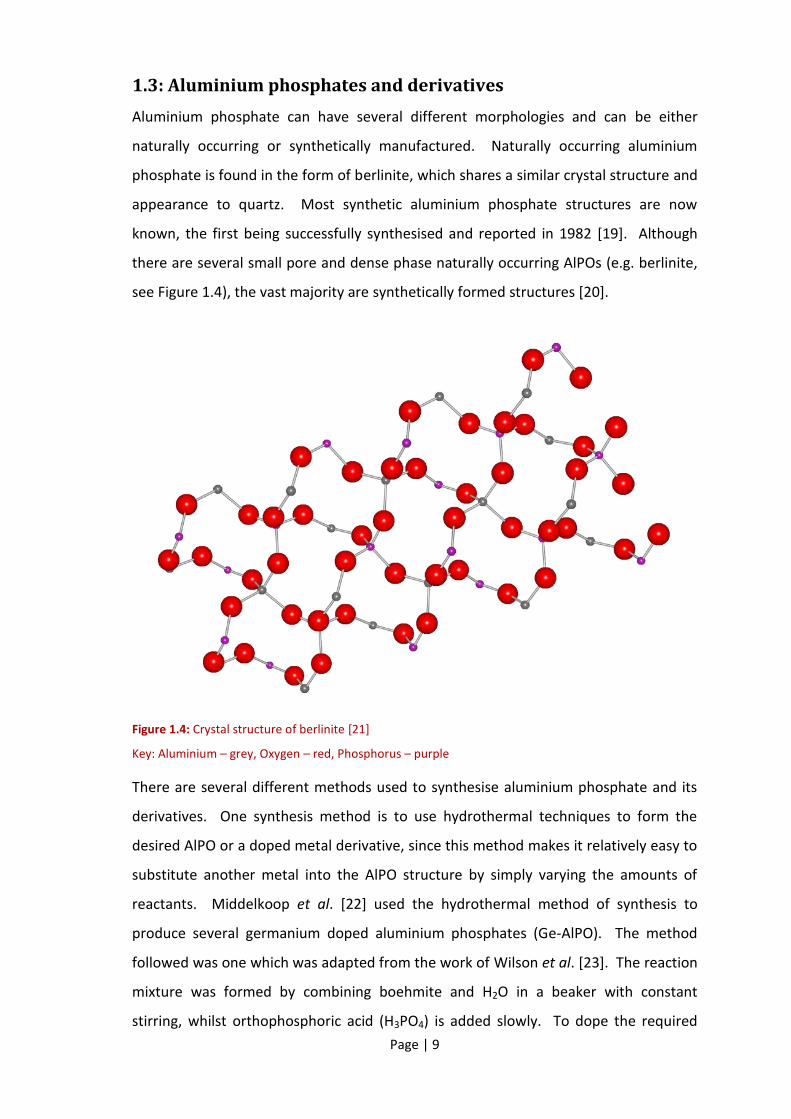
see Figure 1.4), the vast majority are synthetically formed structures [20].
Figure 1.4: Crystal structure of berlinite [21]
Key: Aluminium – grey, Oxygen – red, Phosphorus – purple
There are several different methods used to synthesise aluminium phosphate and its
derivatives. One synthesis method is to use hydrothermal techniques to form the
desired AlPO or a doped metal derivative, since this method makes it relatively easy to
substitute another metal into the AlPO structure by simply varying the amounts of
reactants. Middelkoop et al. [22] used the hydrothermal method of synthesis to
produce several germanium doped aluminium phosphates (Ge-AlPO). The method
followed was one which was adapted from the work of Wilson et al. [23]. The reaction
mixture was formed by combining boehmite and H2O in a beaker with constant
stirring, whilst orthophosphoric acid (H3PO4) is added slowly. To dope the required

Page | 10
amount of germanium into the AlPO structure, the equivalent percentage of
germanium oxide (GeO2) was added to the solution. Finally the structure directing
agent (SDA), also known as the template, was added in the form of triethylamine. This
mixture was stirred at room temperature until a homogenous gel was formed. The
contents were then transferred to an autoclave cell and heated in an oven at 170°C for
the desired amount of time.
Jones et al. [24] synthesised a unique large pore 3-dimensional AlPO ([Al5P6O24H]2-
2[N(C2H5)3H]+·2H2O) using triethylamine (TEA) as the templating agent and conducting
the reaction in a non-aqueous reaction medium. Instead they chose the solvation
method of synthesis using triethylene glycol (TEG) as the reaction medium. It is
interesting to note that Al5P6O24H]2- 2[N(C2H5)3H]+·2H2O (JDF-20) can only be obtained
by using TEA as the template, whereas AlPO4-5 can be synthesised using any one of
around 23 amine containing templates [20]. Similiarly Chippindale and Turner [25]
used a non-aqueous solvent system containing butan-2-ol to synthesise the 1-
dimentional AlPO: [C10N2H9] [Al(PO4)(PO2(OH)2)]. Chippendale and Cowley [26] go on
to state that in order for the solvation reaction to be successful the solvent of choice
must meet certain criteria. For example the solvent must be viscous enough to help
support the growing crystal particles to ensure that large crystals can be formed and
that the phosphate being prepared should be slightly soluble in the chosen solvent
otherwise there will be no crystal formation.
Alternatively, microwave assisted synthesis has been proposed for its ability to rapidly
synthesise high purity single phase AlPOs. Using the ionothermal microwave synthesis
technique, Wragg et al. [27] managed to successfully synthesise several AlPOs in as
little as 20 minutes and after 1 hour the reactions were yielding high amounts of a
single crystalline phase. This method of synthesis has several advantages over the
more traditional hydrothermal method of synthesising AlPOs. First the reaction is
simplified by using an ionic liquid as both the solvent for the reaction and as the SDA.
Likewise compared to a typical hydrothermal reaction in an oven which might take
several days (100+ hours) at continuous high temperatures (>170°C), microwave

Page | 11
synthesis can accomplish the same results in a fraction of that time. This method has
also been proven to work when synthesising doped metal AlPOs, such as cobalt doped
aluminium phosphate (Co-AlPO) [28], allowing this technique to be used to synthesise
solid acid catalysts or materials suitable for lightweight gas storage.
Aluminium phosphate and its derivatives are being extensively investigated for the
catalytic properties afforded by their structures, along with other potential uses such
as lightweight materials to store gases (e.g. hydrogen) cheaply and efficiently which
would allow electric vehicles powered by hydrogen fuels cells to compete with
traditional forms of transport powered by the internal combustion engine. However,
in order to do this, materials with large surface area are required. Although AlPOs
already exhibit some of these properties, Kannan et al. [29] have successfully
synthesised a large pore thermally stable AlPO. The AlPO synthesised had a pore
diameter 153Å and was thermally stable at temperatures greater than 1000°C,
meaning that if this material is used in catalytic reactions it can be easily recycled as
any residue on the used catalysts can be “burned off” and removed. The lP was
also tested for its catalytic properties and as an absorbent to remove chemicals such as
dyes from the environment. Through testing it was proven that this AlPO could
potentially be a very useful catalyst for esterification reactions as it successfully
managed to convert 70% of the n-butanol present with a selectivity as high as 97% in
the optimum conditions. Similarly its absorbent properties were determined by
testing its ability to remove the dye indigo carmine. At a dye concentration of 100
ppm it took only 10 minutes for the AlPO to remove 99% of the dye present. This
presents the possibly that large pore AlPOs could have a significant use in
environmental applications and replace other less environmentally friendly
absorbents.
Both AlPO and Zn-AlPO have been studied by Sreenivasulu et al. [30] for their potential
use in the hydroxylation of benzene to phenol. These catalysts were synthesised using
a solvent free system and the templating agent, tetrapropylammonium bromide
(TPABr), was employed. After synthesis the samples were collected, washed with a

Page | 12
large quantity of ethanol and calcined for 5 hours at 500°C. Although both catalysts
exhibit similar surface areas, the formation and size of the pores present in the
catalysts are remarkably different. The large difference could be explained by the
uneven distribution of the templating agent in the mixture and/or its removal by
calcination. The catalytic abilities of the AlPOs were tested in a reaction involving the
hydroxylation of benzene to phenol using H2O2. Phenol is one of the major chemical
precursors used in the chemical industry with applications in fine chemicals,
pharmaceuticals, dyes and resins. Results from the catalytic testing are promising, the
basic AlPO had a 100% selectivity towards phenol however its conversion rate was very
low (approx. 13%). The results for the Zn-AlPO compare favourably to AlPO whereby it
managed to convert in excess of 85% benzene present with a selectivity of around 85 -
88%, producing a small amount of 1,4-benzoquinone (a similarly useful chemical
precursor). A reference experiment was conducted without any catalysts present,
yielding no phenol or 1,4-benzoquinone confirming the need for a catalyst to be
present in the reaction.
Iron doped aluminium phosphates (Fe-AlPO) have been proven to have numerous uses
including catalytic applications and as a templating agent. Shiju et al. [31] have
reported the use of an Fe doped AlPO-5 as a catalyst suitable for hydroxylation
reactions. In their testing Shiju et al. used Fe-AlPOs to catalyse benzene to phenol via
a hydroxylation reaction using nitrous oxide as the oxidant of choice. With 1% doping
of Fe the catalyst converted 13.4% of the benzene present with a phenol yield of 13%
indicating that Fe-AlPO catalysts have a high selectivity for this reaction. However, it is
also reported that upon calcining Fe-AlPO to form an active FeMFI catalyst the yield of
phenol increases to approximately 23%. Several Fe containing AlPOs have also been
investigated as catalysts for the selective oxidation of cyclohexane to cyclohexanol and
cyclohexanone by Zhou et al. [32]. The oxidation of cyclohexane is important to the
chemical industry as it is a precursor stage to synthesising many man-made synthetic
fibres such as nylon-6 and nylon-6, 6. Zhou et al. used the hydrothermal method of
synthesising the various Fe containing catalysts, with the amount of Fe varied between
0.02% – 0.06% as a molar percentage of the overall catalyst. Reactivity of the Fe
containing catalysts was good, with the FeCoMn-AlPO converting the highest amount

Page | 13
of cyclohexanone and the FeMn-AlPO converting 31.7% of the cyclohexane to
cyclohexanol. As a templating agent Fe-AlPO has been used for the novel application
of speeding up the synthesis of Y-shaped carbon nanotubes (Y-CNT) via chemical
vapour deposition, as reported by ChadraKishore and Pandurangan [33].

Page | 14
1.4: Zirconium phosphates and derivatives
One of the leading authorities in this pioneering research was Abraham Clearfield who,
in 1964 along with James Stynes, reported the synthesis of zirconium phosphate [34],
which is now nown as the alpha form of zirconium phosphate α-ZrP). Clearfield and
Stynes synthesised α-ZrP by refluxing zirconium phosphate gel in phosphoric acid,
obtaining crystalline α-ZrP which could be readily and accurately characterised.
However, this method is rather cumbersome and time consuming and therefore the
process is now accelerated by the use of hydrothermal methods [35]. Today zirconium
phosphate and its derivatives can be synthesised in a variety of different ways and
have a wide range of applications.
Figure 1.5: Crystal structure of α-zirconium phosphate [36]
Key: Zirconium – green, Oxygen – red, Phosphorus – purple, Hydrogen – yellow
One method of obtaining both α-ZrP and crystalline α-ZrP is reported by Trobajo et al.
[37] in which they first form crude ZrP before converting it to its crystalline form. The
crude ZrP was formed by the traditional method of reacting zirconyl chloride, dissolved
in hydrochloric acid, with phosphoric acid and stirred until a precipitate forms. This
precipitate is centrifuged and washed with phosphoric acid to remove any remaining
chloride ions. The remaining solid is air dried at room temperature, giving crude ZrP.

Page | 15
To form crystalline ZrP the crude ZrP is refluxed for 48 hours with 10M phosphoric
acid, then filtered and the precipitate is left to dry.
Similar to the traditional reflux method, hydrothermal synthesis can be used to
synthesise crystalline α-ZrP. However, unlike the traditional reflux method,
hydrothermal synthesis requires a much shorter reaction time. Sun et al. [38] reported
that α-ZrP can be synthesised via the hydrothermal method by combining zirconyl
chloride octahydrate with phosphoric acid in a sealed Teflon® lined pressure vessel
which is then heated for 24 hours at 200°C.
Alternatively, new more novel techniques (such as microwave assisted synthesis) are
being investigated. With the advent of green chemistry and the drive to lower
manufacturing costs (for synthesising chemicals in both industry and for research
purposes) chemists are increasingly turning to microwave synthesis as a method for
quickly synthesising compounds that require large amounts of energy in order for the
reaction to progress. Naik et al. [39] have studied the effects of microwave assisted
synthesis of sodium zirconium phosphate (Na/ZrP) at varying temperatures. Heating
the reaction mixture in a standard resistance furnace for 1 hour at 450°C yielded
poorly crystalline Na/ZrP and only achieved a suitably crystalline product at 650°C,
whereas heating the same reaction mixture for 1 hour in a microwave at 450°C yielded
the largest amount of crystalline Na/ZrP. This indicates that microwave assisted
synthesis could help rapidly produce different zirconium phosphates much more
quickly than traditional methods, with a potentially higher crystallinity.
There have also been a large number of studies into synthesising doped zirconium
phosphates, as they could potentially have enhanced catalytic properties. Burnell et
al. [40] synthesised a mixed layer titanium-zirconium phosphate (Ti/ZrP). The method
of synthesis was based on the work reported by Clearfield and Frianeza [41], in which a
crude gel is first formed by combining 4M H3PO4 with the desired ratios of TiCl4/ZrOCl2
and left to stir overnight. The resultant crude gel is washed with deionised water,

Page | 16
collected by filtration and reslurried with 12M H3PO4. The gel was then sealed in a 23
ml stainless steel autoclave and heated for 1 week at 150°C. The resultant solid
precipitate was collected via centrifugation and washed with deionised water. This
washing process was repeated until the supernatant had reached a pH of 4. Kapoor et
al. [42] have reported the use of a novel Ti/ZrP for aiding hydrogen production from
the splitting of water. This novel catalyst shows a great efficiency towards the
photocatalytic splitting of water and therefore could be potentially useful in the
production of hydrogen as a clean fuel source.
Zirconium phosphate and its derivatives can also be used as molecular sieves. Scheetz
et al. [43] have studied Na/ZrP with the aim of using it as a way of immobilising
radioactive nuclei from commercial radioactive waste by way of an ion-exchange
substitution. Several different methods of synthesising Na/ZrP were employed
including, both sol-gel and hydrothermal methods. Results show that Na/ZrP could
potentially be very useful in the use of nuclear waste remediation as its structure will
accept approximately two thirds of all potential cations from the periodic table,
including those that are found in radioactive waste. In addition, its long lifetime
(before starting to decompose) means that it could be suitable as a long term storage
medium.
Tungsten oxide supported ZrP catalysts with various tungsten loadings have been
synthesised and tested by Rao et al. [44] for their potential use in the esterification of
palmitic acid. ZrP catalysts were synthesised using the hydrothermal method, then a
method of wet impregnation was used to add the designed percentage of tungsten
oxide to the catalysts. The samples were stored in air before being analysed and
tested. It was proven that the tungsten supported ZrP catalysts contained a greater
number of acid sites and therefore possessed a greater acidity to that of normal ZrP.
All catalysts were highly active in increasing the esterification of palmitic acid, were
resistant to the leaching of tungsten into the reaction mixture and because of the
heterogeneous nature of the catalyst it was easy to recover and re-use the catalysts.

Page | 17
This shows that there is future potential in using tungsten or other metal oxide
supported catalysts in esterification reactions.
1.5: Aims of research
The main aim of this thesis is to synthesise several aluminium substituted layered
phosphate catalysts and analyse their potential as novel heterogeneous catalysts for
the glycerolysis of urea. In order to accomplish this, a library of doped and un-doped
AlPOs will be synthesised along with α-ZrP as a control and comparison since its
catalytic properties have already been extensively reported. In the glycerolysis
method of synthesis, glycerol and urea are combined in the presence of a doped or un-
doped metal phosphate catalyst and then reacted under vacuum at 140°C for three
hours. The synthesis proceeds via a simple two-step reaction. Firstly the carbamate is
formed, evolving ammonia. Then the carbamate cyclicises to form glycerol carbonate,
evolving another molecule of ammonia (shown in Figure 1.6).
Figure 1.6: The glycerolysis of urea via catalytic reaction
To quantify results and to characterise the catalysts synthesised, a range of analytic
techniques and computational methods will be employed. This project will build upon
the research and findings of Aresta et al. [45] into using zirconium phosphate (both
doped and α forms) as catalysts for the glycerolysis of urea and the work of Readman
[46] into synthesising different forms of layered doped AlPOs for catalytic applications.
Catalyst
Catalyst

Page | 18
Chapter 2: The synthesis and characterisation of doped
metal phosphates
2.1: Introduction
All the aluminium phosphates and zirconium phosphates were prepared by modified
hydrothermal methods of synthesis. The method chosen for synthesising the
zirconium phosphates is very similar to a method used by Poojary et al. [35] for the
synthesis of metal substituted α-ZrP and γ-ZrP forms of the catalysts. As reported in
the literature of Chippindale and Walton [47] and Bond et al. [48], the synthesis of
aluminium or substituted gallium phosphate(s) via the hydrothermal/solvothermal
process is an almost identical approach and will be used to synthesise the metal
substituted aluminium phosphate catalysts for this project. The synthesised metal
substituted catalysts will be characterised using various analytical techniques including
Scanning Electron Microscopy (SEM), powder X-Ray Diffraction (XRD), X-Ray
Fluorescence (XRF) and both 31P and 27Al Nuclear Magnetic Resonance (NMR) analysis.
2.2: Synthesis of catalysts
Aluminium phosphate [Al3P4O16] was synthesised via the following method [46]. 2.0 g
of aluminium isopropoxide (C9H21O3Al), 3.0 ml ethylenediamine (C2H8N2), 1.75 ml 85%
orthophosphoric acid (H3PO4) and 20.0 ml of deionised water were combined in the
PTFE liner of the hydrothermal stainless steel autoclave and left to stir for several
hours until a white gel had formed. The crude gel was then sealed in a hydrothermal
stainless steel autoclave and heated for 120 hours at 195°C. The precipitate was then
washed with deionised water, filtered under vacuum and left to dry.
Synthesis of the doped aluminium catalysts was achieved using a similar method to
that employed to synthesise aluminium phosphate. However, the appropriate metal
salt was added to the reaction mixture so as to give a dopant metal to aluminium ratio
of 1:5. The molar ratios used in the reactions are shown in Table 2.1.

Page | 19
The zirconium phosphate [Zr(HPO4)2·H2O] was synthesised in a similar manner to the
aluminium phosphate. The method of synthesis was derived from the work of Burnell
et al. [40]. Crude zirconium phosphate gel was prepared by combining 2.5 ml of 1M
zirconyl chloride (ZrCl4) solution and 20.0 ml of 4M H3PO4 in a beaker. The resulting
solution was stirred for several hours at room temperature. The crude gel was then
collected by centrifugation, reslurried with 20.0 ml of 12M H3PO4 and heated to 150°C
in a 25.0 ml hydrothermal stainless steel autoclave for 126 hours. The product was
collected by centrifugation and washed with deionised water and re-centrifuged. The
process was repeated until the pH of the supernatant reached approximately 4.
2.3: Materials
A summary of the starting materials, molar ratios and reaction conditions used to
synthesis the catalysts produced is shown in Table 2.1. Experiments DJP001 to DJP004
and DJP010 were excluded from the table as these reaction did not yield the correct
product. All chemicals were obtained from either Sigma Aldrich or Alfa Aesar. All
chemicals were of analytical grade quality and used as supplied.

Page | 20
Table 2.1: Summary of starting materials and reaction conditions
Al(
O-i
-Pr)
3 :
H2O
: H
3P
O4 :
T
1 : 1
13.4
0 : 3
.43
: 4.6
0
Al(
O-i
-Pr)
3 : V
OSO
4 :
H2O
: H
3PO
4 : T
1 : 0
.33
: 152
.18
: 4.6
0 : 6
.17
Al(
O-i
-Pr)
3 :
Zn(N
O3) 2
: H
2O
: H
3P
O4 :
T
1 : 0
.34
: 152
.18
: 4.6
0 : 6
.17
Al(
O-i
-Pr)
3 :
Ga(
NO
3) 2
: H
2O
: H
3P
O4 :
T
1 : 0
.34
: 152
.18
: 4.6
0 : 6
.17
Al(
O-i
-Pr)
3 :
Co
(NO
3) 2
: H
2O
: H
3P
O4 :
T
1 : 0
.33
: 152
.18
: 4.6
0 : 6
.17
Al(
O-i
-Pr)
3 :
Ti[O
CH
(CH
3) 2
] 4 :
H2O
: H
3P
O4 :
T
1 : 0
.34
: 152
.18
: 4.6
0 : 6
.17
Al(
O-i
-Pr)
3 :
Cr(
NO
3) 3
: H
2O
: H
3P
O4 :
T
1 : 0
.34
: 152
.18
: 4.6
0 : 6
.17
Al(
O-i
-Pr)
3 :
HA
uC
l 4 :
H2O
: H
3P
O4 :
T
1 : 0
.15
: 126
.69
: 3.8
3 : 5
.13
Al(
O-i
-Pr)
3 :
Pr(
NO
3) 3
: H
2O
: H
3P
O4 :
T
1 : 0
.11
: 126
.69
: 3.8
3 : 5
.13
Al(
O-i
-Pr)
3 :
H2O
: H
3P
O4 :
T
1 : 1
13.4
0 : 3
.43
: 4.6
0
ZrO
Cl 2
: H
Cl :
H2O
: H
3P
O4
1 :
5.25
: 67
5.41
: 70
5.64
Al(
O-i
-Pr)
3 :
Zn(N
O3) 2
: H
2O
: H
3P
O4 :
T
1 : 0
.34
: 152
.18
: 4.6
0 : 6
.17
Al(
O-i
-Pr)
3 :
Ga(
NO
3) 2
: H
2O
: H
3P
O4 :
T
1 : 0
.34
: 152
.18
: 4.6
0 : 6
.17
Al(
O-i
-Pr)
3 :
Co
(NO
3) 2
: H
2O
: H
3P
O4 :
T
1 : 0
.33
: 152
.18
: 4.6
0 : 6
.17
DJP
019
Eth
yle
ne
dia
min
e12
019
5°C
Use
d in
cat
alyt
ic
test
ing
Cat
alys
tTe
mp
late
(T)
Ge
l Co
mp
osi
tio
n
(mo
lar
rati
o)
Tim
e
(ho
urs
)Te
mp
era
ture
DJP
005
Eth
yle
ne
dia
min
e16
016
0°C
DJP
006
DJP
007
DJP
008
DJP
009
DJP
0011
160°
C
Eth
yle
ne
dia
min
e12
019
5°C
Eth
yle
ne
dia
min
e16
0
195°
C
Eth
yle
ne
dia
min
e
Eth
yle
ne
dia
min
e
Eth
yle
ne
dia
min
e
195°
C
195°
C
195°
C
Eth
yle
ne
dia
min
e12
0
120
120
DJP
016
DJP
018
Eth
yle
ne
dia
min
e12
019
5°C
195°
C
DJP
017
Eth
yle
ne
dia
min
e12
019
5°C
----
----
----
---
195°
C
195°
C
112
DJP
012
120
120
120
120
Eth
yle
ne
dia
min
e19
5°C
DJP
013
DJP
014
DJP
015
Eth
yle
ne
dia
min
e
Eth
yle
ne
dia
min
e

Page | 21
2.4: Methods of characterisation and analysis
This project can be divided into two distinct but complementary parts. First a series of
lP and α-ZrP catalysts were synthesised and then characterised using standard
procedures. The main methods of characterising the catalysts were XRD, XRF, SEM,
EDX, TGA, physisorption analysis (BET), FT-IR and solid state NMR. The second part of
the project involved analysing the catalytic reactions, determining products and yields.
Both GC-MS and NMR techniques were employed.
Powder X-Ray Diffraction
Powder X-ray diffraction patterns were collected using a Bruker D2 PHASER
diffractometer using CuKα radiation source α1 = 1.54060Å, α2 = 1.54439Å). A small
amount of a finely powdered sample was affixed to a Si low background sample holder
using a very small quantity of petroleum jelly. A customised experimental set-up file
was created using the DiFFR C. UITE™ measurement software [49], setting the sample
to rotate at 30 rpm and setting the detector 2θ range between 3.0° and 80.0°.
X-Ray Fluorescence
X-ray fluorescence data was collected using a Bruker TRACER IV-SD using a rhodium
radiation source. Sample data was collected using the following parameters: no filter,
15.00 kV, 55.00 μA and 15 second acquisition time. Sample holders were prepared
with Mylar® film. The XRF was primarily used to quickly determine the structural
composition of the catalysts and to assess whether there were any impurities, as this
could not only effect the ability of the catalyst to work but it could also affect the
ability to correctly categorise and characterise the catalysts synthesised.
Scanning Electron Microscopy
Scanning electron microscopy was used in two different ways. First the FEI Quanta™
200 SEM was used to obtain high resolution micrographs to visually study and
compare the catalysts respective surface structures. Secondly, using the attached EDX

Page | 22
equipment it was possible to determine the elemental composition of the catalysts.
Samples were prepared by placing a small amount of finely powered sample onto a
sample stub coated with a self-adhesive carbon pad. Excess sample was removed by
blowing nitrogen across the sample stub and then the samples were coated with a fine
gold film. The accelerating voltage used was 20 kV.
Thermogravemetric Analysis
Thermogravimetric Analysis (TGA) was carried out using Mettler-Toledo
TGA/sDTA851e. The samples were run in a 70 μL aluminium oxide crucible, between
25°C and 700°C with a ramp rate of 5°C per minute. All experiments were conducted
in a nitrogen atmosphere. This technique was used to study the weight loss of the
catalysts and in the case of the AlPO series to try and determine at what point the
templating agent started to decompose.
Physisorption analysis
Surface area analysis was carried out using a Micrometrics ASAP 2010. Approximately
0.15 g of each catalyst was weighed, placed in a pre-weighed glass sample holder and
attached to the ASAP 2010. The sample was then placed under vacuum, heated to
150°C and left overnight to fully remove all water from the sample. After the sample
had been sufficiently dried, it was then connected to a nitrogen line and testing was
undertaken. Samples were prepared and run with the assistance of Dr Runjie Mao.
The data collected from the ASAP 2010 contained information about the surface area
and porosity of the catalysts.
Infrared Spectroscopy
Fourier Transformed Infrared spectroscopy (FT-IR) was used predominately to analyse
the phosphorus groups in the catalysts and the organic templating agent. Samples
were placed on the IR neat and were recorded on a Thermo NICOLET IR200 FT-IR,

Page | 23
between 400 cm-1 to 3800 cm-1 using an attenuated total reflectance accessory for 16
scans.
Nuclear Magnetic Resonance
Both aluminium, phosphorus and MQMAS aluminium solid state experiments were
conducted on all catalyst samples. Samples were prepared by tightly packing a 4 mm
zirconia rotor with the desired catalyst. All samples were prepared and run by Mr
Patrick Cookson. All solid state experiments were carried out on a Bruker Avance II+
400 MHz spectrometer, with ammonium phosphate and yttrium aluminium garnet
(YAG) being used to tune the NMR to the correct nuclei. Standard 27Al experiments
were single pulse excitation acquisitions without decoupling, with a recycle delay of
0.5 s and a spinning speed of 12 kHz. 31P experiments were single pulse excitation
acquisitions using the Zg pulse program, with a recycle delay of 0.3 s and a spinning
speed of either 6 kHz or 7 kHz. Aluminium triple quantum MAS experiments were
carried out using pulses of 8.5 μs, 2.5 μs and 45 μs. The MAS rotational rate was 12
kHz and each sample was run for 2048 scans. All solid state experiments were carried
out at room temperature.
Carbon solution experiments were conducted on the catalytic reaction mixtures.
Samples were prepared by taking a 0.1 g sample and dissolving it in 500 µl of
deuterated dimethyl sulfoxide (DMSO). Samples were analysed using a Bruker Fourier
300 (300 MHz) spectrometer. To ensure the best possible results, a custom 13C NMR
experiment was set up using the pulse program ZgPg30, with a relaxation delay of 4 s
and each sample being run for 512 scans. All solution experiments were carried out at
room temperature.
Gas Chromatography – Mass Spectrometry
GCMS was used to analyse the catalytic reactions to aid in determination of products
and side-products. Samples were prepared by taking a small quantity of the reaction
solution and diluting it with methanol, this was then directly injected into the GCMS.
All analysis was carried out on a Thermo Scientific Trace Ultra GC and DSQ II MS.
Page | 24
2.5: Characterisation of aluminium phosphate series catalysts
2.5.1: Infrared Spectroscopy
The five aluminium phosphate catalysts were analysed by FT-IR and as can be seen
from Figures 2.1 – 2.5, all spectra indicate that similar structures have been formed
with the same functional groups present. Out of the 5 AlPO based catalysts, both
DJP011 (Figure 2.1) and DJP015 (Figure 2.2) have slightly different IR spectra compared
to the other catalysts. In the case of DJP011 there is a very shallow change in intensity
between 3200cm-1 and 2700cm-1 which could be masking a very small OH peak caused
by the bridging hydroxyl group. This could be caused by either poor formation of the
titanium doped catalyst or could be indicative of a more crystalline structure
compared to the other doped AlPOs.
Unlike DJP011 (which has a very broad and shallow peak from 3200cm-1 to 2500cm-1),
the remaining AlPO catalysts show clearly a bridging hydroxyl group, with a peak at
>3150cm-1, however this is most clearly identifiable on the un-doped AlPO DJP015.
The other noticeable difference when comparing the IR spectrum of DJP015 to any of
the other doped AlPO catalysts is that the relative transmittance is higher and the
peaks are better defined. This could be caused by the structure of DJP015. The XRD
analysis (Section 2.5.2) shows that the structure is very well defined and is mostly a
single phase unlike the majority of the doped metal AlPOs which appear to be
multiphasic; the exception being DJP018, which also shows slightly better defined
peaks in its IR spectra.
The assignment of the absoption bands have been made by using data taken from
Nakamoto [50] and Socrates [51]. Shown in Tables 2.2 – 2.6.

Page | 25
Figure 2.1: IR spectrum of DJP011 (Ti doped)
Table 2.2: IR data for DJP011
Wavenumbers (cm-1
) Intensity (%T) Assignment
2570.36 92.491 C – H stretching
2364.16 92.169 CO2 stretching
2215.51 94.374 NH2 stretching
2131.88 95.784 N – H stretching
1519.20 94.876 N – H deformation
1448.18 94.960 -CH2- scissoring
1021.35 43.390 P – O vibrational
790.54 80.432 NH3+ rocking
755.21 84.558 CH2 rocking
723.35 83.108 CH2 rocking
700.96 84.694 C – C stretching
625.50 84.694 Al – O stretching
528.23 59.642 P – O bending
505.03 50.555 Al – O vibrational
446.54 58.457 P – O bending

Page | 26
Figure 2.2: IR spectrum of DJP015
Table 2.3: IR data for DJP015
Wavenumbers (cm-1
) Intensity (%T) Assignment
3170 94.551 O – H stretching (bridging hydroxyl)
3046 90.094 N – H stretching
2153 95.294 N – H stretching
2027 95.336 P = O stretching
1632 94.009 NH3+ bending
1585 92.818 NH3+ deformation
1519 88.643 N – H deformation
1328 94.981 CH2 twisting
1208 90.185 P = O stretching
1155 75.463 -CH2 – CH2- (C-C doublet)
1129 67.922 -CH2 – CH2- (C-C doublet)
990 51.807 O – H bending (bridging hydroxyl)
828 91.687 -CH2-NH2
795 72.190 NH3+ rocking
754 84.172 CH2 rocking
728 82.057 CH2 rocking
699 71.325 C – C stretching
622 51.063 Al – O stretching
567 65.243 C – N bending
526 37.456 P – O bending
506 22.405 Al – O vibrational
472 31.131 P – O bending

Page | 27
Figure 2.3: IR Spectrum of DJP017 (Zn doped)
Table 2.4: IR data for DJP017
Wavenumbers (cm-1
) Intensity (%T) Assignment
3046 97.552 N – H stretching
2358 97.943 CO2 stretching
2184 97.215 N – H stretching
2041 97.249 P = O stretching
1999 97.426 NH3+ deformation
1519 96.697 N – H deformation
1156 85.756 -CH2 – CH2- (C-C doublet)
1130 82.062 -CH2 – CH2- (C-C doublet)
1032 47.834 P – O vibrational
990 74.052 O – H bending (bridging hydroxyl)
797 89.010 NH3+ rocking
754 94.671 CH2 rocking
725 90.934 CH2 rocking
699 84.520 C – C stretching
625 74.438 Al – O stretching
567 79.984 C – N bending
527 62.588 P – O bending
506 50.487 Al – O vibrational
467 74.190 P – O bending
Page | 28
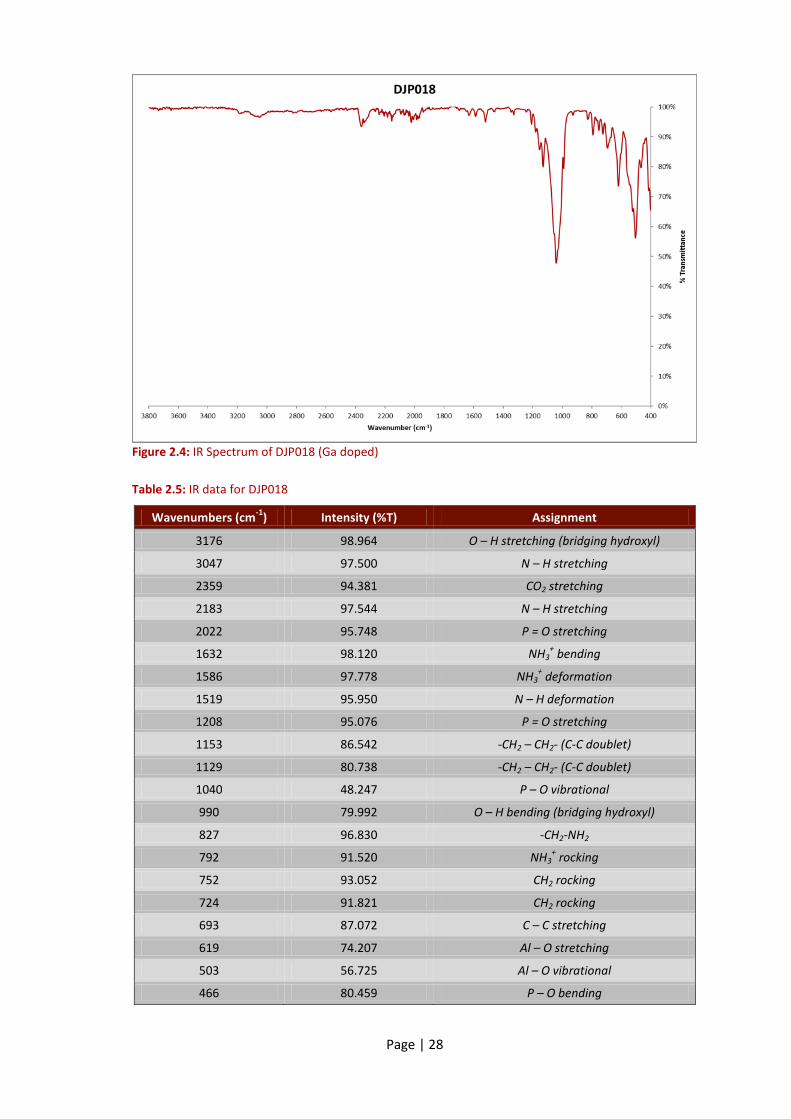
Figure 2.4: IR Spectrum of DJP018 (Ga doped)
Table 2.5: IR data for DJP018
Wavenumbers (cm-1
) Intensity (%T) Assignment
3176 98.964 O – H stretching (bridging hydroxyl)
3047 97.500 N – H stretching
2359 94.381 CO2 stretching
2183 97.544 N – H stretching
2022 95.748 P = O stretching
1632 98.120 NH3+ bending
1586 97.778 NH3+ deformation
1519 95.950 N – H deformation
1208 95.076 P = O stretching
1153 86.542 -CH2 – CH2- (C-C doublet)
1129 80.738 -CH2 – CH2- (C-C doublet)
1040 48.247 P – O vibrational
990 79.992 O – H bending (bridging hydroxyl)
827 96.830 -CH2-NH2
792 91.520 NH3+ rocking
752 93.052 CH2 rocking
724 91.821 CH2 rocking
693 87.072 C – C stretching
619 74.207 Al – O stretching
503 56.725 Al – O vibrational
466 80.459 P – O bending

Page | 29
Figure 2.5: IR spectrum of DJP019 (Co doped)
Table 2.6: IR data for DJP019
Wavenumbers (cm-1
) Intensity (%T) Assignment
3182 97.186 O – H stretching (bridging hydroxyl)
3047 94.740 N – H stretching
2364 97.591 CO2 stretching
2171 96.876 N – H stretching
2040 96.900 P = O stretching
1632 96.760 NH3+ bending
1585 96.358 NH3+ deformation
1519 93.568 N – H deformation
1328 97.403 CH2 twisting
1208 93.072 P = O stretching
1155 80.423 -CH2 – CH2- (C-C doublet)
1129 75.067 -CH2 – CH2- (C-C doublet)
1028 36.338 P – O vibrational
990 70.395 O – H bending (bridging hydroxyl)
796 82.891 NH3+ rocking
754 90.516 CH2 rocking
727 87.356 CH2 rocking
623 63.368 Al – O stretching
527 50.828 P – O bending
507 38.364 Al – O vibrational
473 74.469 P – O bending

Page | 30
2.5.2: X-Ray Diffraction and X-Ray Fluorescence analysis
All five AlPO derived catalysts were characterised using both X-Ray Diffraction (XRD)
and X-Ray Fluorescence (XRF) analysis. The data gathered from using XRD is useful in
two respects; first the raw data (intensity and 2θ) can be plotted to form an XRD
pattern which can be visually compared to others. Secondly, XRD was used to
determine the crystallinity of the sample and its phase purity. If the diffraction pattern
is unknown then indexing must be conducted to determine the properties of the
sample, such as its unit cell parameters. Auto indexing programs calculate potential
unit cell parameters from peak lists, which if need be can be further refined until the
correct unit cell is found. Several autoindexing programs were used to process the
collected data, they were; ITO [52], TREOR [53] and DICVOL [54]. Three autoindexing
programs were used, as alluded to by David et al. [55], because each one processes the
data in a different way and therefore if one program cannot find a correct indexing
solution another may.
The XRF results show (Appendix 5.2) that there are no major impurities in the samples
and that chosen metal dopants had been incorporated into their resptive catalysts
(Table 2.7).
Table 2.7: XRF elemental analysis
Catalyst XRF element peak (radiation band)
DJP011 Aluminium (kα), Phosphorous (kα), Titanium (kα), Rhodium (Lα)
DJP015 Aluminium (kα), Phosphorous (kα), Rhodium (Lα)
DJP017 Aluminium (kα), Phosphorous (kα), Zinc (kα), Rhodium (Lα)
DJP018 Aluminium (kα), Phosphorous (kα), Gallium (kα), Rhodium (Lα)
DJP019 Aluminium (kα), Phosphorous (kα), Cobalt (Kα), Rhodium (Lα)
From a visual comparison of the XRD patterns Figure 2.6, it can be seen that there are
many similarities between the respective structures of all five AlPO catalysts. All five
XRD patterns were searched against both the Crystallographic Open Database (COD)
and the PDF-4+ database provided by The International Centre for Diffraction Data
(ICDD) however, no exact matches were found indicating that these materials could be
novel. It is worth noting that there are several extra peaks in samples DJP011 and
DJP017. This could indicate that the material is multi-phasic as opposed to being a

Page | 31
more uniform singular phase or that some unwanted side-product is present in the
crystal structure, which formed during the synthesis. Alternatively, it could show that
both catalysts have different crystal structures when compared with the other
catalysts synthesised. Both DJP011 and DJP017 have been doped with titanium and
zinc respectively.
Indexing was also performed on all recorded XRD data from the five catalysts, with
results shown in Table 2.8. Again the trend, highlighted by a visual comparison of the
XRD patterns, is shown in the results of the autoindexing with both DJP011 and DJP017
providing different results when compared with the other catalysts in the series. All
AlPO series catalysts bar DJP011 and DJP017 have high Figures of Merit (FoM), greater
than 20, and have very similar unit cell parameters as well as sharing similar space
groups.
Table 2.8: Unit cell parameters of AlPO series catalysts
A high FoM is important as it is used to determine the accuracy of the autoindexing
process. If the material being analysed contains more than one phase then this can
show “erroneous” pea s in the XR pattern, which in turn ma es it impossible to index
the material correctly. If a sample contains either a single phase or is only slightly
multi-phasic then it will have a high FoM. However the more multi-phasic it becomes
the lower the FoM. According to Blake et al. [56] FoMs can be calculated quickly and
give an indication of quality, therefore correlating with the confidence and accuracy of
the results.
The estimated unit cell parameters were then refined using Celref V3 in order to
determine how accurate the initial refinement process was and if need be to identify
any erroneous peaks. If any erroneous peaks were identified whilst refining the data,
A (Å) B (Å) C (Å) α β γ
DJP011 19.395 10.705 17.545 90.000 102.108 90.000 Monoclinic 8.0 P21/n
DJP015 14.527 9.417 9.607 90.000 98.286 90.000 Monoclinic 39.0 P21/c
DJP017 13.891 14.546 8.573 100.638 104.257 81.537 Triclinic 6.0 P1
DJP018 14.554 9.445 9.615 90.000 98.331 90.000 Monoclinic 42.0 P2/c
DJP019 14.517 9.411 9.596 90.000 98.193 90.000 Monoclinic 45.0 P21/c
Space GroupCrystal SystemCatalystFigure of
Merit
Unit Cell Parameters

Page | 32
this information would then be used to generate a new set of initial unit cell
parameters and the process would be repeated. As can be seen from Table 2.9, the
initial unit cell parameters were relatively accurate (estimated standard deviations in
parenthesis) and no erroneous peaks were identified during the refinement process. A
list of the full refined unit cell and lattice parameters can be found for each catalyst in
Appendix 5.6
Table 2.9: Refined unit cell parameters for AlPO catalysts
Figure 2.6: XRD patterns for aluminium phosphate series catalysts
A (Å) B (Å) C (Å) α β γ
DJP011 19.4021 (0.0413) 10.6952 (0.0064) 17.5564 (0.0336) 90.000 102.06 (0.357) 90.000
DJP015 14.5338 (0.0051) 9.4145 (0.0030) 9.6076 (0.0029) 90.000 98.290 90.000
DJP017 13.8877 (0.0179) 14.5656 (0.0191) 8.5739 (0.0096) 100.670 (0.084) 104.240 (0.080) 81.490 (0.082)
DJP018 14.5611 (0.0083) 9.4475 (0.0035) 9.6135 (0.0042) 90.000 92.260 (0.066) 90.000
DJP019 14.5294 (0.0117) 9.4133 (0.0038) 9.6018 (0.007) 90.000 98.230 (0.121) 90.000
CatalystRefined Unit Cell Parameters

Page | 33
2.5.3: Solid-state NMR
Both 27Al and 31P solid-state NMR were used to analyse all samples. Figure 2.7 to
Figure 2.11 show the 31P NMR spectra of each AlPO based catalyst and the 27Al spectra
are shown in Appendix 5.3. From the 27Al NMR spectra, it can be determined that
there is are multiple aluminium environments in all the AlPO series catalysts
synthesised, although one environment is much more clearly visible than the others, as
there is a single peak well defined peak with associated spinning side-bands and then
there are potentially two other peaks hidden in the broad peak present around
15ppm.
However this is not the case when analysing the 31P NMRs for all of the AlPO series
catalysts. Here multiple main peaks are present, indicating the presence of more than
one phosphorus environment. By overlaying the spectra collected at different
frequencies, it is clear that there are at least two different environments. On several
of the 31P NMRs at least four main peaks are present; but on the NMRs which only
show 2 peaks, the peaks are quite broad. These multiple peaks have most likely been
caused by chemical shift anisotropy (CSA), which happens when a polycrystalline
sample is analysed. Therefore it is probable that only two phosphorous environments
are present in the AlPO series catalysts, despite there being multiple peaks.

Page | 34
Figure 2.7: 31
P NMR spectrum of DJP011 (Ti doped)
Figure 2.8: 31
P NMR spectrum of DJP015

Page | 35
Figure 2.9: 31
P NMR spectrum of DJP017 (Zn doped)
Figure 2.10: 31
P NMR spectrum of DJP018 (Ga doped)

Page | 36
Figure 2.11: 31
P NMR spectrum of DJP019 (Co doped)
Since 27Al is a quadrupolar nucleus, 27Al Multiple Quantum Magic Angle Spinning
(MQMAS) NMR spectroscopy was also conducted on all AlPO series catalysts.
Although 1D-MQMAS NMR provides a similar function to that of a standard 27Al
experiment (although both experiments have different acquisition programs) 1D-
MQMAS can be combined with 2D-MQMAS NMR techniques to provide much more
useful data. Should more than one peak be found in a 1D-MQMAS spectrum, 2D-
MQMAS can be used to view spectra without 2nd order quadrupolar effects. The 1-D
MQMAS NMRs collected can be seen in Appendix 5.4. From the MQMAS NMRs it can
be confirmed that there is only a single aluminium environment in all AlPO series
catalysts analysed except for the 1D-MQMAS spectra of DJP011, where the single peak
appears to be splitting into two different peaks. However, this could only be
confirmed by conducting a 2D-MQMAS experiment on the sample.

Page | 37
2.5.4: Surface properties and decomposition analysis
Surface area analysis was carried out using a Micrometrics ASAP 2010. There are two
different types of calculation used to work out the surface area of a material, either
using the Langmuir isotherm or the Brunauer Emmett Teller (BET) equation. The
Langmuir isotherm bases its calculations on a single layer of gas absorbed on to the
surface of the material being analysed. Although it is a useful result to obtain, it has
largely been superseded by the BET equation. The BET equation is largely an extension
of the Langmuir isotherm. The BET isotherm differs in three key assumptions: gas
molecules can absorb on to an infinite number of layers in a material, there are no
interactions between layers, as there are no interaction between the layers the
Langmuir isotherm can be applied to each layer. Shown below (Table 2.10) are the
results of the surface area analysis of the AlPO series catalysts.
Table 2.10: Surface area analysis results for AlPO series
Catalyst BET surface area
(m2/g) Total pore volume
(cm3/g) Average pore diameter (Å)
DJP011 2.528 0.0039 62.52
DJP015 6.193 0.0096 62.27
DJP017 6.073 0.0093 61.47
DJP018 9.222 0.0157 68.33
DJP019 10.699 0.0186 69.55
From the surface area results, some interesting conclusions can be drawn about the
AlPO series catalysts. All catalysts share similar pore diameters (approx. average 65Å),
yet the surface areas are, in some cases, several times larger. This in part can be
explained by examining the scanning electron micrographs obtained of the catalysts
synthesised. Although all the catalysts appear to be similarly porous, the physical
structure and the orientation of the crystals within the structures differ greatly.
DJP011 exhibits a very disorganised structure with varying crystal shapes and sizes,
much more so than any of the other AlPO series catalysts. Not surprisingly the
scanning electron micrograph for DJP015 showed a very regular structure with clearly
defined fairly uniform crystals (Figure 2.12). DJP018 was visually similar (not
unsurprising as the gallium doped into the structure is very similar to aluminium)
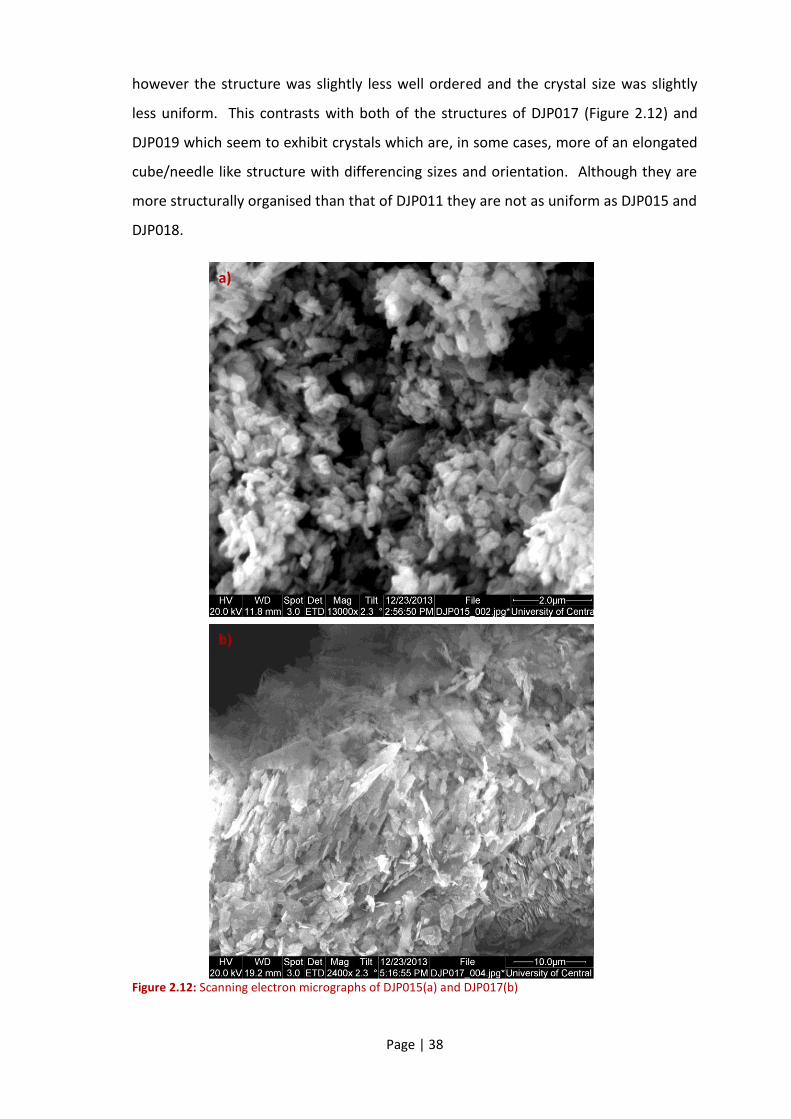
Page | 38
however the structure was slightly less well ordered and the crystal size was slightly
less uniform. This contrasts with both of the structures of DJP017 (Figure 2.12) and
DJP019 which seem to exhibit crystals which are, in some cases, more of an elongated
cube/needle like structure with differencing sizes and orientation. Although they are
more structurally organised than that of DJP011 they are not as uniform as DJP015 and
DJP018.
Figure 2.12: Scanning electron micrographs of DJP015(a) and DJP017(b)
a)
b)

Page | 39
The EDX results collected are shown in Table 2.11. These results confirm that the
chosen metals were successfully doped into the AlPO structure, however there are two
interesting observations to make from the data obtained. First there appears to be no
correlation between the amounts of aluminium substituted for the doped metals, with
only DJP017 being the closest to reaching the 25% doped content (approx. 22% gallium
doped). Therefore it is also interesting to note that despite the varying amounts of
doped metals in the AlPO structures the ratio between oxygen, phosphorus and metals
in the doped AlPOs is very similar to that of the undoped AlPO (O:4, P:1, Al:1).
Although there is a slight increase in the amount of phosphorus found in the doped
catalysts leading to an approximate ratio of O:4, P:1.05 and M:0.95.
Table 2.11: EDX results for AlPO catalysts
As shown in the TGA plots below (Figure 2.13 - Figure 2.17), all AlPO catalysts behave
similarly (apart from DJP011) and started to decompose at approximately the same
temperature despite there being differences in their crystal structures and
compositions. All AlPOs lost approximately 16% of their mass during the experiment,
except for DJP011, which lost approximately 22% of its mass. It is also important to
note that, when compared to the other AlPO catalysts synthesised, DJP011 shows two
distinct mass losses occurring in quick succession suggesting a multi-stage
decomposition. This is not unexpected as the AlPOs contain a templating agent that
was not removed after synthesis and all the samples were not kept in a dry
atmosphere, therefore the samples will contain trace amount of water as well.
O Al P Ti Zn Ga Co
DJP011 38.80% (56.38%) 15.31% (13.19%) 30.79% (23.11%) 15.11% (7.33%) -------- -------- --------
DJP015 53.01% (67.19%) 21.12% (15.87%) 25.87% (16.94%) -------- -------- -------- --------
DJP017 38.62% (59.09%) 12.41% (11.26%) 27.21% (21.51%) -------- 21.76% (8.15%) -------- --------
DJP018 38.02% (56.34%) 19.67% (17.29%) 28.19% (21.58%) -------- -------- 14.12% (4.80%) --------
DJP019 39.02% (54.44%) 24.71% (20.44%) 33.31% (24.00%) -------- -------- -------- 2.96% (1.12%)
CatalystEDX results for AlPO catalysts, weight % (Atom %)

Page | 40
Figure 2.13: TGA curve of DJP011 (Ti doped)
Figure 2.14: TGA curve of DJP015

Page | 41
Figure 2.15: TGA curve of DJP017 (Zn doped)
Figure 2.16: TGA curve of DJP018 (Ga doped)

Page | 42
Figure 2.17: TGA curve of DJP019 (Co doped)

Page | 43
2.6: Characterisation of α-zirconium phosphate catalyst
2.6.1: Infrared Spectroscopy
The α-zirconium phosphate IR spectrum differs greatly from that of the aluminium
phosphate based catalysts (Figure 2.1 - Figure 2.5, see pages 25 - 29). This is mainly
due to the fact that α-zirconium phosphate is synthesised without the need for an
organic template. As can be seen from the data below, there are clearly defined
hydroxyl peaks at 3589 cm-1 and 3509 cm-1, confirming the presence of the P – OH in
the inter region area.
The assignment of the absoption bands have been made by using data taken from
Horsley et al. [57] and Nakamoto [50].
Figure 2.18: IR spectrum of DJP016
Correlation table shown on next page.

Page | 44
Table 2.12: IR data for DJP016
Wavenumbers (cm-1
) Intensity (%T) Assignment
3589 85.841 O – H bridging hydroxyl
3509 89.546 O – H bridging hydroxyl
3139 84.191 H – O – H vibrational (lattice water)
2358 88.515 CO2 stretching
2153 92.641 P – OH stretching
2018 93.261 P = O stretching
1616 88.315 H – O – H vibrational (lattice water)
1247 85.473 P – OH deformation
1021 15.669 P – O vibrational
956 21.180 P – O vibrational
593 54.378 P – O bending
497 39.806 P – O bending
2.6.2: X-Ray Diffraction and X-Ray Fluorescence analysis
The XRF and XRD data collected for DJP016, show that there were no chemical
impurities detected by XRF (Appendix 5.2) analysis. This is confirmed by the unit cell
parameter data shown in Table 2.13. Since the FoM is 24, it is reasonable to assume
that the unit cell data is accurate and confirms the structure of DJP016 as α-ZrP. When
comparing the unit cell parameters to that of the α-zirconium phosphate synthesised
by Troup and Clearfield [36], the A, B, C and β parameters are concordant to 1 decimal
place and both samples share the same space group (P21/n). These results confirm
that DJP016 is α-zirconium phosphate. The refined unit cell and lattice parameters can
be found in Appendix 5.6.
Table 2.13: Unit cell parameters of α-ZrP catalyst
Table 2.14: Refined unit cell parameters for α-ZrP
A (Å) B (Å) C (Å) α β γ
DJP016 15.422 5.288 9.038 90.000 101.747 90.000 Monoclinic 24.0 P21/n
CatalystUnit Cell Parameters
Space GroupCrystal SystemFigure of
Merit
A (Å) B (Å) C (Å) α β γ
DJP016 15.425 (0.0057) 5.2894 (0.0015) 9.032 (0.0046) 90.000 101.750 90.000
CatalystRefined Unit Cell Parameters

Page | 45
2.6.3: Solid-state NMR
Figure 2.19: 31
P NMR spectrum of α-ZrP catalyst
Only 31P solid-state NMR was used to analyse the α-zirconium phosphate catalyst.
There was no zirconium based NMR study as the sample holders (rotors) are made out
of zirconia therefore preventing the experiment to run as it would be impossible to
analyse the spectra produced. Similarly there were no MQMAS NMRs performed on
the catalyst. Figure 2.19 shows the 31P NMR spectra of DJP016, run at 6 kHz. Present
in the spectra is the single main peak (-13.79 ppm) and two pairs of spinning side
bands (indicated by asterix). With only one main peak showing, it is confirmed that
the phosphorus atoms in this particular α-zirconium phosphate structure are all in the
same environment. Furthermore this suggests that the material contains only one
phase.
2.6.4: Surface properties and decomposition analysis
Compared with the surface area results obtained from the AlPO catalysts (Table 2.10),
DJP016 shows markedly different properties. As shown in Table 2.15, α-ZrP has a
similar surface area compared to the AlPO series, however average pore diameter is

Page | 46
approximately a third the size of the AlPO catalysts, at only 41.9Å. From analysing the
scanning electron micrograph of DJP016 (Figure 2.20), it shows that the catalyst has a
fairly uniform structure and all the crystals are all of a relatively similar size and shape
(it is interesting to note that it is visually very similar to DJP015). This similar visual
appearance to some of the AlPO catalysts may also explain why it has a comparable
total pore volume to some of the AlPO catalysts. The EDX analysis of the catalyst
confirms the results obtained from the XRF and that the correct ratios of Zr, P and O
are present in the sample, Table 2.16.
Figure 2.20: Scanning electron micrograph of DJP016
Table 2.15: Surface area analysis results for α-ZrP
Catalyst BET surface area
(m2/g) Total pore volume
(cm3/g) Average pore diameter (Å)
DJP016 4.532 0.0048 41.88
Table 2.16: EDX analysis of α-ZrP catalyst
Catalyst EDX results for α-ZrP catalyst, weight % (Atom %)
O Zr P
DJP016 40.62 (70.12) 39.47 (12.03) 19.91 (17.85)

Page | 47
Compared to the TGA plots of the AlPO series catalysts (Figure 2.13 - Figure 2.17), the
TGA plot obtained for α-ZrP shows that it starts to decompose at a much lower
temperature than that of the AlPOs, this is most likely due to the loss of water from
the interlayer spaces whereas the AlPOs contain ethylenediamine which would have to
decompose as well. Despite the decomposition starting sooner than in the AlPO
catalysts, approximately the same percentage weight loss occurred between the
different types.
Figure 2.21: TGA curve of DJP016
Page | 48
2.7: Summary
In summary, whilst there are some definite similarities between AlPO series catalysts
and the α-zirconium phosphate catalyst, there are also several key differences. Even
though all bar one of the catalysts (DJP017) exhibit similar monoclinic crystal structure,
the AlPO catalysts contain multiple phosphorous environments which are not present
in α-ZrP. In addition α-ZrP does not contain an organic template, which could affect its
ability as a catalyst. The structural differences shown in the IR spectra of the AlPO
catalysts confirm that, in terms of structure, the catalysts differ slightly from one
another despite having the same theoretical crystal structure and sharing the same
space group.
It is also interesting to note the correlation between the “phasic purity” of the
catalysts’ structures and the metals doped into them. Both the un-doped catalysts (α-
ZrP and AlPO) retained their correct crystal structures and had high FoMs, as did the
gallium (+3) doped AlPO since it has the same oxidation state as aluminium and has a
similar ionic radius. Conversely the cobalt doped AlPO also has a high FoM and the
highest surface area of all the AlPO catalysts tested but its visual appearance is very
disorganised and XRD differs slightly from the other high FoM AlPOs. This contrasts
with the titanium (+4) and zinc (+2) doped AlPO catalysts, which have oxidation states
that differ from that of aluminium, have slightly different crystal structures and low
FoMs, indicating that they contained more than one phase.

Page | 49
Chapter 3: Catalytic testing and results
3.1: Introduction
It was decided that two methods of analysis should be used to determine the catalytic
efficiency of the selected catalysts. The first method was by measuring the amount of
glycerol carbonate synthesised at the end of the reaction. This could be regarded as a
normal method of determining catalytic efficiency, however it does not provide a very
effective picture of the overall reaction as it only provides data for the chosen
endpoint of the reaction.
The second method was to measure the amount of ammonia released over the
duration of the reaction. The results generated from this method are, by themselves,
less useful than the absolute yield of glycerol carbonate produced. However, when
this data is combined with the yields synthesised, a more complete picture is built up.
As previously stated, when the reaction proceeds, 2 moles of ammonia are evolved for
every mole of glycerol carbonate synthesised. Therefore by correlating the moles of
ammonia and glycerol carbonate it appears possible to determine how efficient the
catalyst is in aiding the synthesis of glycerol carbonate. Any difference between the
2:1 molar ratio could indicate that other side-products are being synthesised or that
there are issues with the catalyst, such as a loss of efficiency through the reaction.

Page | 50
3.2: Method development and reaction set-up
A series of experiments was carried out, to find the optimum conditions to conduct the
catalytic testing. The first series of experiments determined the type of reaction set-
up to be used, while the second series of experiments determined the optimum
reaction conditions to synthesise glycerol carbonate.
There were many variables to take into consideration when determining the reaction
set-up. One method was to conduct the reaction at atmospheric pressure, with
nitrogen bubbled through the reaction solution to remove the ammonia produced and
to provide an inert environment. The second method involved conducting the
reaction, with a similar set-up, under a reduced pressure of around 20 millibar. The
reaction set-up comprised a round bottom flask, single-necked for the experiments
conducted under vacuum and two-necked for the experiments conducted under
nitrogen, connected to a jacketed water condenser. If the reaction was to be
conducted at atmospheric pressure then a Dreschel bottle was attached, via tubing, to
the top of the condenser. However if the reaction was to be carried out under
reduced pressure then the top of the condenser was attached to a rotary-vane pump
and the Dreschel bottle attached to the exhaust port of the vacuum pump.
The Dreschel bottle was filled with 500 ml of distilled water and used to trap the
ammonia evolved from the reactions as ammonium hydroxide. This allowed for easy
quantification of ammonia evolved as this could be calculated by using a simple
titration. By titrating a 50 ml aliquot taken from the Dreschel bottle with 1M
hydrochloric acid (HCl) the moles of ammonia can be calculated. From this, the mass of
ammonia evolved was calculated and plotted against the amount of glycerol carbonate
synthesised as shown in Figure 3.1. The red plots correlate to testing conducted at
atmospheric pressure with a N2 stream with black showing the experiments that were
conducted under vacuum. The black trendline is the trend of the data set whilst the
red trendline shows the ideal ammonia to glycerol carbonate ratio.

Page | 51
Figure 3.1: Correlation between glycerol carbonate and ammonia evolved
As can be seen in Figure 3.1 there is a strong correlation within the data set. However
this does not entirely correlate with the anticipated ammonia:glycerol carbonate
ration of 2:1, with only one data point being within a 5% error of the ideal. Although
this may in part be caused by the method of ammonia capture (with some of the
ammonia lost in the vacuum pump for the reactions carried out under vacuum).
Therefore, it was decided that the main catalytic testing would be carried out under
vacuum as it was a simpler reaction set-up and reduced the risk of potential
contaminants and leakages. The round bottom flask would be charged with 9.0g of
urea, 20.7g of glycerol (a molar ratio of 1:1.5) and 0.1g of the chosen catalyst. The
reaction would be heated to between 138 - 142°C for 3 hours.

Page | 52
3.3: Results
3.3.1: Ammonia capture results
As alluded to in section 3.2, the ammonia that is evolved during the reaction is
“trapped” in a Dreschel bottle containing 500 ml of distilled water. For each catalytic
test, the amount of ammonia produced was monitored every 30 minutes. For each
data set, 3x 50 ml aliquots of ammonia hydroxide solution were removed from the
Dreschel bottle and titrated against 1M HCl solution with phenolphthalein as the
indicator.
Figure 3.2: Graph showing the cumulative ammonia captured per reaction
These results were then recorded (Appendix 5.1) and plotted as a function of time
(Figure 3.2). As can be seen from the figure above, all the reactions proceeded to
release ammonia at similar rates with the exceptions of DJP016 and DJP015 which
were above and below the group average respectively.
All bar two of the reactions, the un-catalysed control (DJP000) and DJP019, show a
steady rise in the amount of ammonia produced through the first 90-120 minutes and
then a gradual levelling out/decrease in the amount of ammonia evolved. The un-
catalysed reaction (DJP000) and DJP019 instead shows a gentle “ ” curve plot. This is

Page | 53
interesting as it shows that when compared with the catalysed reactions, the initial
release of ammonia is much slower in the first hour, however it then rapidly starts to
increase over the next 30 to 60 minutes until it stabilises out.
3.3.2: Glycerol carbonate yields
Accurately determining the amount of glycerol carbonate synthesised during the
catalytic reaction proved difficult, since the reaction mixture contained several
different polyols and unreacted glycerol all of which have very high boiling points
(>290°C at atmospheric pressure). To complicate matters further, glycerol, glycerol
carbonate and the polyol side-products are all structurally similar and therefore their
physical chemical properties such as polarity, viscosity and hygroscopy are similar.
This means that classical methods of separation, such as organic extraction (as
suggested and used by Aresta et al. [45], [58]) or column chromatography did not
provide satisfactory results. The only other method of extraction which could be used
was fraction distillation under vacuum. However since the amounts that were being
used were small, this was not a practical set-up with regard to the equipment
available. Therefore another method for quantifying the amount of glycerol carbonate
synthesised was required.
The method that was instead chosen to quantify the amount of glycerol carbonate
synthesised was 13C NMR spectroscopy. It was felt that 13C NMR offered the best
balance between time taken to calculate the yield of glycerol carbonate and accuracy
of results. In order to use 13C NMR as a quantitative analytical technique, a method of
correlating peak area to the amount of glycerol carbonate present in the sample was
needed. To that effect, a range of standard samples comprising of different
glycerol:glycerol carbonate ratios were prepared. Glycerol:glycerol carbonate
standards with ratios between 90:10 and 30:70 were produced. From these NMR
spectra, the four glycerol carbonate peaks were identified and their integrals plotted,
to form calibration curves. It is believed this method of quantification should be
accurate to within ±10% of the actual yield. From the results collected for each

Page | 54
reaction, the best two results were used to calculate the amount of glycerol carbonate
synthesised per reaction and the yield with respect to urea. This is shown in Table 3.1.
Table 3.1: Processed data showing the mass and yields of glycerol carbonate
As shown in the table above, most reactions produced a similar amount of glycerol
carbonate with the exception of the reactions conducted with DJP016 and DJP019.
The average yield is approximately 22.66%, the reaction catalysed by DJP015 produces
a yield that is 25% lower than the average and DJP019 40% above average. These
results raise two interesting points; the amount of glycerol carbonate synthesised is,
for the most part, not affected by the choice of catalyst used and that the worst
preforming and best performing catalysts both share the same crystal structure.
Catalyst Reaction Estimated GC (%w/w) Estimated GC mass (g)Estimated Average GC
mass (g)
Estimated % yield for
GC wrt Urea
a 17.45% 4.276
b 12.57% 3.224
a 13.63% 3.223
b 13.03% 3.179
a 14.03% 3.524
b 11.26% 2.862
a 20.98% 5.181
b 16.28% 4.362
a 15.36% 3.887
b 13.70% 3.581
a 15.34% 3.930
b 13.77% 3.548
a 21.32% 5.897
b 19.80% 5.419DJP019 5.658 32.00%
DJP017 3.734 21.12%
DJP018 3.739 21.15%
DJP015 3.193 18.06%
DJP016 4.771 26.98%
DJP000 3.750 21.21%
DJP011 3.201 18.11%

Page | 55
3.4: Summary
Both the ammonia captured and glycerol carbonate synthesised seem to show similar
trends, with the majority of the catalysts showing no change in yield or catalytic
activity when compared to an un-catalysed reaction. Although the reaction containing
DJP016 evolved the most ammonia, DJP019 produced the largest yield of glycerol
carbonate. However these results are within the experimental error.
Theoretically the reaction to form glycerol carbonate, assuming the reaction
favourably produces glycerol carbonate and not side-products, produces two moles of
ammonia for every one mole of glycerol carbonate. Therefore there should be a
strong correlation between moles produced, of both ammonia and glycerol carbonate,
and catalytic performance. This correlation is shown in Table 3.2, where the average
molar ratio is 1.9:1. However, with the exception of DJP019 all of the catalysts tested
would fall within a 10% experimental error of each other potentially suggesting that
DJP019 is the only catalyst exhibiting useful catalytic properties.
Table 3.2: Table comparing molar ratios of glycerol carbonate and ammonia
Glycerol carbonate : Ammonia
DJP000 3.750 1.0 : 2.0 1.061
DJP011 3.201 1.0 : 2.3 1.012
DJP015 3.193 1.0 : 1.9 0.823
DJP016 4.771 1.0 : 1.8 1.191
DJP017 3.734 1.0 : 2.1 1.078
DJP018 3.739 1.0 : 2.1 1.053
DJP019 5.658 1.0 : 1.4 1.069
CatalystMass of glycerol
carbonate (g)Mass of ammonia (g)
Molar ratio

Page | 56
Chapter 4: Conclusions and future work
4.1: Conclusions
Surface area analysis of the catalysts has produced some interesting results, with all
surface areas being less than 20m2. This is lower than expected when compared to
traditional AlPOs and zeolites, especially for catalysts, where the greater surface area
can allow a higher catalytic activity. Despite the low surface area, the catalytic activity
has been satisfactory, with the average yield of glycerol carbonate being
approximately 23% and the best catalyst yielding 32%. Similar work has been carried
out by Aresta et al. [45], in which the gamma form of zirconium phosphate is used to
catalyse the reaction, producing an average yield of 50.5% [58]. However without
being able to replicate the exact testing conditions used by Aresta et al. it is impossible
to definitively say whether γ-ZrP is a better catalyst than the doped or un-doped
AlPOs.
One hypothesis as to why lower yields of glycerol carbonate were obtained (compared
to when using a γ-ZrP catalyst) is that the catalysts synthesised during this project
exhibit lower surface areas. A lower surface area means there will be fewer potential
acid sites available for the catalytic reaction to take place and therefore more catalyst
is required to produce the same yield. The lower surface area is in part caused by the
chosen method of synthesis, which produces a larger crystal structure compared to
other methods. It is also important to note the differences between the gamma and
alpha forms of zirconium phosphate and their related catalytic effectiveness.
Comparing the results obtained by Aresta et al. using γ-ZrP compared to the testing
carried out on α-ZrP it appears that γ-ZrP is a better catalyst than α-ZrP. This could
possibly be explained by difference in the chemical structure of the two forms:
whereas α-ZrP [Zr(HPO4)2·H2O] is much more tightly bonded and co-ordinated when
compared with γ-ZrP [Zr(PO4)(H2PO4)·2H2O], which has an inherently more “flexible”
structure because of its higher water content.

Page | 57
Another factor to consider is that of selectivity of the catalyst and the effect of the
template present in the AlPOs synthesised. It was decided that after synthesising the
AlPOs that they would not be calcined to remove the ethylenediamine template as this
could lead to a possible collapse of the layered structure. Instead it was postulated
that since the reaction is carried out at a temperature slightly greater than that of the
boiling point of ethylenediamine, it would be removed from the AlPO structure during
the reaction and instead the glycerol/urea reaction media would enter the catalyst
allowing the catalytic reaction to take place more efficiently. Since the reaction was
carried out at just above the boiling point of ethylenediamine the template should
have evaporated, especially since the reaction was carried out under a reduced
pressure thus reducing the boiling point further. However, traces of ethylenediamine
should still be present in the reaction mixture at the end of the reaction. After
studying the 13C NMRs taken of the reaction solutions, there is no peak at
approximately 44ppm, which would be indicative of ethylenediamine being present
(see NMR below).
Figure 4.1: 13
C NMR of catalytic reaction showing no ethylenediamine peak
The absence of the ethylenediamine peak suggests that the template did not leave the
catalysts as planned and therefore this could potentially explain why the AlPO catalysts
did not perform as well as the α-ZrP catalyst. With the template still present in the

Page | 58
structure the majority of the internal surface would be blocked, denying any internal
acids sites to the reaction. This greatly reduces the efficiency of the AlPO catalysts as
all catalytic reactions would have to take place on the external surface only. Similarly,
the proposed structure of the AlPOs (see Figure 4.2), suggests that if the template does
not come out of the structure during the reaction then the hydrogen bonding
interactions between the internal bridging hydroxyls (Brønsted acid sites) and the basic
NH2 groups in the ethylenediamine template will effectively reduce the acidity of the
AlPO catalysts.
Figure 4.2: Proposed structure of undoped AlPO with template. Adapted from [59] Key: Grey - aluminium, Red - oxygen, Purple – phosphorus, Black - carbon, Blue – nitrogen, Yellow - hydrogen
Similarly when comparing the 13C NMR spectra of the reaction mixtures (Appendix 5.5)
it is apparent that that there are more peaks present than those which were
anticipated (the peaks for glycerol, urea and glycerol carbonate). This suggests that
side-products are forming in the reaction as well as glycerol carbonate. However
analysing and quantifying these side-products is difficult for reasons listed previously.
Since several of the compounds are chiral the 1H NMRs display multiple sets of
overlapping pea s ma ing it almost impossible to differentiate between the “real” and
other peaks caused by the chirality of the compounds. This makes the determination

Page | 59
of the products by NMR extremely difficult. Since it is also believed that the side-
products will contain similar functional groups to those of both the starting materials
and glycerol carbonate, they cannot be identified by FT-IR and as the compounds are
not fluorescent this rules out analysis by UV-VIS spectroscopy.
This only leaves analysis by mass spectroscopy. However, this again presents a
problem as the side-products are likely to have similar structures, therefore different
compounds could produce similar mass fragments, especially since the compounds are
quite bulky and therefore likely to be broken up when ionised. There are 4 unknown
peaks in the 60 ppm to 80 ppm and 3 unknown peaks between 150 ppm and 158 ppm.
Shown in the table below are the most likely unknown compounds that could match
with the unknown 13C peaks and results from GC-MS analysis.
Table 4.1: Potential unknown compounds found in reaction mixtures
Potential side-products identified
Mass: 135.12 Type: reaction intermediate
Mass: 161.11 Type: side-product
Mass: 262.17 Type: side-product
Mass: 178.43 Type: side-product
It is interesting to find the reaction intermediate glycerol carbamate present in the GC-
MS results, as it was thought that the carbamate would readily cyclicise and form
glycerol carbonate and not remain as glycerol carbamate. This points to a potential
reason as to why the yield of glycerol carbonate was relatively low when compared to
the work of Aresta et al. It suggests that there was not enough energy provided to the
reaction to force the cyclicisation (suggesting that the reaction had not completed
after 3 hours) or that the catalyst present in the reaction did not reduce the activation
energy of the second step sufficiently for it to proceed at a much quicker rate. This

Page | 60
could be caused by either the catalyst becoming poisoned/losing its efficiency too
quickly or that the catalyst is instead more suited to catalysing the first stage and not
the second stage of the reaction.
Although it has been confirmed that it is possible to dope different metals of different
oxidation states into the AlPO structure, there appears to be no direct correlation
between the amount doped in and any chemical properties of the metal chosen. This
is unusual as it would be expected that metal atoms with a larger ionic radius than that
of aluminium would find it harder to be doped into the structure. However, based on
EDX analysis the following amounts of metals were substituted in place of aluminium;
35% for titanium, 42% for zinc, 22% for gallium and 5% for cobalt (all values based on
atom% in the samples analysed). This suggests that other factors such as the solubility
of the metal salt in the reaction mixture and the dispersion of the metal salt in the
reaction mixture need to be examined.

Page | 61
4.2: Future work
There are several areas of potential future work within this project, including; acidity
determination, structural differences between doped and un-doped catalysts,
continuing to test the remaining synthesised catalysts, different catalyst to reactant
ratios and forming catalysts with different templates.
Since the catalysts synthesised are being developed for their acidic properties, it is
important to determine how acidic they are and how they compare to other known
solid acid catalysts. The easiest and one of the most common methods of carrying out
acidity testing is by temperature-programmed desorption of ammonia (NH3-TPD). This
method, as outlined by Takahara et al. [60], uses mass spectrometry to monitor the
evolved ammonia during the test. However, the AlPO catalysts which were
synthesised in this project still contain the ethylenediamine template, which when
heated to decomposition will produce several products including ammonia. This
would therefore, provide erroneous results and another method should be sought.
Another common way of determining the acidity of solid catalysts is to use FT-IR and
treat the acid catalyst with a probe molecule. The most common probe molecule used
is pyridine as it can be used to detect both Brønsted and Lewis acid sites. As reported
by Reddy et al. [61] Brønsted acid sites show up 1540 cm-1 and Lewis acid sites at 1450
cm-1. The IR spectra were recorded between 1350 cm-1 and 1650 cm-1 using a DRIFTS
cell attachment. The samples are heated for 1 hour at 100°C to remove any water that
may be present in the sample. The sample (approx. 50 mg) is placed in the sample
holder and exposed to a small quantity of pyridine. It is then placed into an oven at
120°C for 1 hour to remove any physisorbed pyridine. After allowing the sample to
cool, it is placed in the DRIFTS cell and run for 250 scans with KBr used for the
background. Alternatively, Zecchina et al. [62] have studied the use of ammonia and
Armaroli et al. [63] have used the weakly basic acetonitrile as potential probe
molecules for acid site determination using both FT-IR and DRIFTS techniques.
Page | 62
Schrader and Cheng [64] have used Raman spectroscopy to characterise the acid sites
present in Co-Mo/γ-Al2O3 catalysts using adsorbed pyridine as the probe molecule. For
the samples to be tested the catalysts were prepared by pressing them into 13 cm
disks. To analyse one of the disks, it was placed in a rotating cell (atmosphere
controlled) and evacuated to 1.333x10⁻⁸ bar for 2 hours. After 2 hours the cell was
exposed to pyridine vapours for 1 hour and then the Raman spectra were collected at
room temperature. The rotating cell is required to prevent signal loss caused by the
laser beam continually hitting the same point, resulting in damage to the sample.
Compared to NH3-TPD and IR/Raman spectroscopy, solid state NMR is a relatively new
technique for determining the acidity of solid catalysts. Zheng et al. [65] have
reviewed 4 different molecules for their potential as probe molecules in conjunction
with NMR analysis. The four different molecules chosen were; perdeuterated pyridine
(pyridine-d5), trimethylphosphine (31P-TMP), trimethylphosphine oxide (31P-TMPO) and
13C-acetone (2-13C-acetone). An idea as to the strength of the acid sites can be given
by observing the chemical shift of the peak(s) in the NMR spectra whereas the peak
intensity will give an indication of the number of acid sites present in the sample. By
running multiple calibration standards the acidity of the solid catalysts can be
determined with reasonable accuracy, however there are still several issues with using
solid state NMR which need to be resolved. Both pyridine-d5 and 2-13C-acetone can
only be used to determine the Brønsted acidity of the catalysts, unlike 31P-TMP and
31P-TMPO which can be used to detect both Lewis and Brønsted acid sites. However,
31P-TMP is extremely pyrophoric and both 31P-TMP and 31P-TMPO are highly toxic
meaning that sample preparation is much more complex. The other point for
consideration is that the probe molecules reviewed are currently relatively expensive,
however other potential and much cheaper probe molecules such as acetonitrile
(acetonitrile-d3) have been proposed for future study.
Similarly another area of potential work is that of altering the ratio of catalyst to
reactant. As shown by the results from the doped AlPOs, the catalysts do help speed
up the initial stage of the reaction however their effect tends to lessen mid-way

Page | 63
through the reaction cycle and ends up producing a similar amount of product as the
un-catalysed reaction. As they do show an initial increase over that of the un-
catalysed reaction, it is reasonable to assume that the doped metal AlPOs lose their
catalytic properties much more quickly than that of DJP015. This means that if there
was an increase in the amount of catalyst (in relation to the starting materials) present
in the reaction, the yield of glycerol carbonate could be improved.
Another potential avenue of future work is to change the template used to synthesise
the layered phosphate catalysts. Ethylenediamine is a short chained flat molecule and
therefore the interlayer spacing in the structure of the AlPOs will be small, as the
templating agent will lie in the plane that provides the least resistance (x,z not x,y). By
varying the template, the interlayer spacing can be increased or decreased accordingly.
If a template such as urea, or another branched chain molecule, was to be used in
synthesising layered phosphate catalysts the interlayer spacing could be increased
(due to its more “3- imensional shape”) increasing the surface area and potentially
increasing the catalytic activity of the catalysts.
During this project several other doped metal phosphate catalysts were synthesised.
Both the vanadium (V) and chromium (Cr) doped AlPOs contained approximately 25%
doped metal, whereas both the gold (Au) and praseodymium (Pr) containing AlPOs
were doped to approximately 10%. Both gold (0.85Å)[66] and praseodymium
(0.99Å)[66] have much larger ionic radii when compared to the ionic radius of
aluminium (0.535Å)[66], almost a 100% increase. Therefore although both metals
were introduced in their +3 states, making it easier to form the doped AlPO, it was
decided that in an attempt to keep the crystal structure similar to that of un-doped
aluminium phosphate, a smaller quantity of the chosen metals would be doped in.
However, the catalytic properties of these metals or the effect of the different crystal
structures have on the glycerolysis reaction have yet to be tested and therefore, this
remains one area that should be explored further.

Page | 64
4.3: Summary
During this project a series of doped and undoped metal phosphate catalysts have
been successfully synthesised and characterised by various analytical means. Both the
undoped AlPO and α-ZrP were highly crystalline single phase materials, with the doped
AlPOs varying from a relatively pure single phase to amorphous materials. The
catalysts ability in aiding the glycerolysis of urea was also tested and compared to work
previously conducted by Aresta et al. [45]. Although glycerol carbonate was
successfully synthesised the yields obtained were unfortunately comparable to that of
the uncatalysed control reaction, an average yield of 23%. However, the results do
provide an indication as to which catalysts display the highest selectivity, namely α-ZrP
and DJP019; conversely the undoped AlPO was the least selective of the catalysts
tested. Therefore, it is possible to say that the catalytic activity is as follows;
DJP019>DJP016>DJP018>DJP011>DJP017>DJP015. This indicates that the dopent
metal also has an effect on potential catalytic properties of the catalysts as well as
their structure.
Several reasons as to why the catalysts did not perform in a similar manner to γ-ZrP
have been discussed. This has led to possible future avenues of work which could
potentially increase the catalytic effectiveness of the doped AlPOs; including doping
different metals into the structure, changing the templating agent and calcining the
catalysts before the reaction.
Page | 65
Appendices
Appendix 5.1: Ammonia capture data
Appendix 5.2: XRF spectra
Appendix 5.3: 27Al NMR spectra
Appendix 5.4: 1D-MQMAS NMR spectra
Appendix 5.5: Annotated catalytic reaction NMRs
Appendix 5.6: Refined lattice and unit cell parameters

Page | 66
Appendix 5.1: Ammonia capture data
Table 5.1: Ammonia capture data for DJP011
Table 5.2: Ammonia capture data for DJP015
Sample
Number
Time
(minutes)Aliquot
Quantity of 1M HCl
used (ml)
Quantity of Ammonia
captured (g)
Standard Diviation of
sample
Average quantity of
Ammonia captured (g)
Cumulative average
amount captured (g)
a 0.00 0.000
b 0.00 0.000
c 0.00 0.000
a 3.80 1.332
b 3.85 1.349
c 3.85 1.349
a 5.40 1.892
b 5.40 1.892
c 5.45 1.910
a 4.55 1.594
b 4.50 1.577
c 4.50 1.577
a 4.90 1.717
b 4.90 1.717
c 4.85 1.699
a 3.60 1.261
b 3.65 1.279
c 3.65 1.279
a 3.75 1.314
b 3.80 1.332
c 3.75 1.314
5 150 0.00826 0.420 2.599
6 180 0.00826 0.438 3.037
3 90 0.00826 0.531 1.606
4 120 0.00826 0.572 2.178
1 30 0.00826 0.444 0.444
2 60 0.00826 0.631 1.075
0 0 0.00000 0.000 0.000
Sample
Number
Time
(minutes)Aliquot
Quantity of 1M HCl
used (ml)
Quantity of Ammonia
captured (g)
Standard Diviation of
sample
Average quantity of
Ammonia captured (g)
Cumulative average
amount captured (g)
a 0.00 0.000
b 0.00 0.000
c 0.00 0.000
a 3.75 1.314
b 3.65 1.279
c 3.75 1.314
a 5.70 1.997
b 5.70 1.997
c 5.60 1.962
a 5.20 1.822
b 5.20 1.822
c 5.25 1.840
a 4.40 1.542
b 4.45 1.559
c 4.35 1.524
a 4.40 1.542
b 4.45 1.559
c 4.40 1.542
a 4.20 1.472
b 4.20 1.472
c 4.15 1.454
5 150 0.00826 0.514 2.739
6 180 0.00826 0.491 3.230
3 90 0.00826 0.607 1.711
4 120 0.01431 0.514 2.225
1 30 0.01652 0.438 0.438
2 60 0.01652 0.666 1.104
0 0 0.00000 0.000 0.000

Page | 67
Table 5.3: Ammonia capture data for DJP016
Table 5.4: Ammonia capture data for DJP017
Sample
Number
Time
(minutes)Aliquot
Quantity of 1M HCl
used (ml)
Quantity of Ammonia
captured (g)
Standard Diviation of
sample
Average quantity of
Ammonia captured (g)
Cumulative average
amount captured (g)
a 0.00 0.000
b 0.00 0.000
c 0.00 0.000
a 4.65 1.629
b 4.70 1.647
c 4.70 1.647
a 5.20 1.822
b 5.15 1.805
c 5.20 1.822
a 5.30 1.857
b 5.35 1.875
c 5.35 1.875
a 4.45 1.559
b 4.45 1.559
c 4.45 1.559
a 3.70 1.296
b 3.65 1.279
c 3.70 1.296
a 4.40 1.542
b 4.45 1.559
c 4.40 1.542
0 0 0.00000 0.000 0.000
2 60 0.01012 0.607 1.150
1 30 0.01012 0.543 0.543
4 120 0.00000 0.520 2.289
3 90 0.01012 0.619 1.770
6 180 0.01012 0.514 3.235
5 150 0.01012 0.432 2.721
Sample
Number
Time
(minutes)Aliquot
Quantity of 1M HCl
used (ml)
Quantity of Ammonia
captured (g)
Standard Diviation of
sample
Average quantity of
Ammonia captured (g)
Cumulative average
amount captured (g)
a 0.00 0.000
b 0.00 0.000
c 0.00 0.000
a 4.60 1.612
b 4.60 1.612
c 4.65 1.629
a 5.90 2.067
b 5.95 2.085
c 5.90 2.067
a 6.30 2.208
b 6.30 2.208
c 6.25 2.190
a 5.80 2.032
b 5.85 2.050
c 5.85 2.050
a 3.60 1.261
b 3.60 1.261
c 3.60 1.261
a 4.40 1.542
b 4.45 1.559
c 4.40 1.542
5 150 0.00000 0.420 3.060
6 180 0.01012 0.514 3.574
3 90 0.01012 0.736 1.962
4 120 0.01012 0.677 2.640
2 60 0.01012 0.689 1.226
1 30 0.01012 0.537 0.537
0 0 0.00000 0.000 0.000

Page | 68
Table 5.5: Ammonia capture data for DJP018
Table 5.6: Ammonia capture data for DJP019
Sample
Number
Time
(minutes)Aliquot
Quantity of 1M HCl
used (ml)
Quantity of Ammonia
captured (g)
Standard Diviation of
sample
Average quantity of
Ammonia captured (g)
Cumulative average
amount captured (g)
a 0.00 0.000
b 0.00 0.000
c 0.00 0.000
a 3.95 1.384
b 3.90 1.367
c 3.90 1.367
a 5.20 1.822
b 5.25 1.840
c 5.25 1.840
a 4.50 1.577
b 4.50 1.577
c 4.50 1.577
a 4.55 1.594
b 4.60 1.612
c 4.60 1.612
a 4.80 1.682
b 4.80 1.682
c 4.80 1.682
a 4.05 1.419
b 4.05 1.419
c 4.00 1.402
5 150 0.00000 0.561 2.686
6 180 0.01012 0.473 3.159
3 90 0.00000 0.526 1.594
4 120 0.01012 0.531 2.126
2 60 0.01012 0.607 1.069
1 30 0.01012 0.461 0.461
0 0 0.00000 0.000 0.000
Sample
Number
Time
(minutes)Aliquot
Quantity of 1M HCl
used (ml)
Quantity of Ammonia
captured (g)
Standard Diviation of
sample
Average quantity of
Ammonia captured (g)
Cumulative average
amount captured (g)
a 0.00 0.000
b 0.00 0.000
c 0.00 0.000
a 2.70 0.946
b 2.50 0.876
c 2.50 0.876
a 3.10 1.086
b 3.10 1.086
c 3.00 1.051
a 5.35 1.875
b 5.35 1.875
c 5.30 1.857
a 6.50 2.278
b 6.50 2.278
c 6.55 2.295
a 5.10 1.787
b 5.15 1.805
c 5.15 1.805
a 4.70 1.647
b 4.75 1.664
c 4.70 1.647
5 150 0.01012 0.596 2.657
6 180 0.01012 0.549 3.206
3 90 0.01012 0.625 1.302
4 120 0.01012 0.759 2.062
1 30 0.04046 0.315 0.315
2 60 0.02023 0.362 0.677
0 0 0.00000 0.000 0.000

Page | 69
Table 5.7: Ammonia capture data for un-catalysed reaction
Sample
Number
Time
(minutes)Aliquot
Quantity of 1M HCl
used (ml)
Quantity of Ammonia
captured (g)
Standard Diviation of
sample
Average quantity of
Ammonia captured (g)
Cumulative average
amount captured (g)
a 0.00 0.000
b 0.00 0.000
c 0.00 0.000
a 2.40 0.841
b 2.40 0.841
c 2.40 0.841
a 4.45 1.559
b 4.40 1.542
c 4.40 1.542
a 6.60 2.313
b 6.50 2.278
c 6.60 2.313
a 4.70 1.647
b 4.70 1.647
c 4.70 1.647
a 4.50 1.577
b 4.50 1.577
c 4.50 1.577
a 4.60 1.612
b 4.65 1.629
c 4.65 1.629
0 0 0.00000 0.000 0.000
2 60 0.01012 0.520 0.800
1 30 0.00000 0.280 0.280
4 120 0.00000 0.549 2.120
3 90 0.02023 0.771 1.571
6 180 0.01012 0.537 3.183
5 150 0.00000 0.526 2.646

Page | 70
Appendix 5.2: XRF spectra
Figure 5.1: XRF spectrum for DJP011
Figure 5.2: XRF spectrum for DJP015

Page | 71
Figure 5.3: XRF spectrum for DJP016
Figure 5.4: XRF spectrum for DJP017

Page | 72
Figure 5.5 XRF spectrum for DJP018
Figure 5.6 XRF spectrum for DJP019

Page | 73
Appendix 5.3: 27Al NMR spectra
Figure 5.7: 27
Al NMR spectrum of DJP011
Figure 5.8: 27
Al NMR spectrum of DJP015
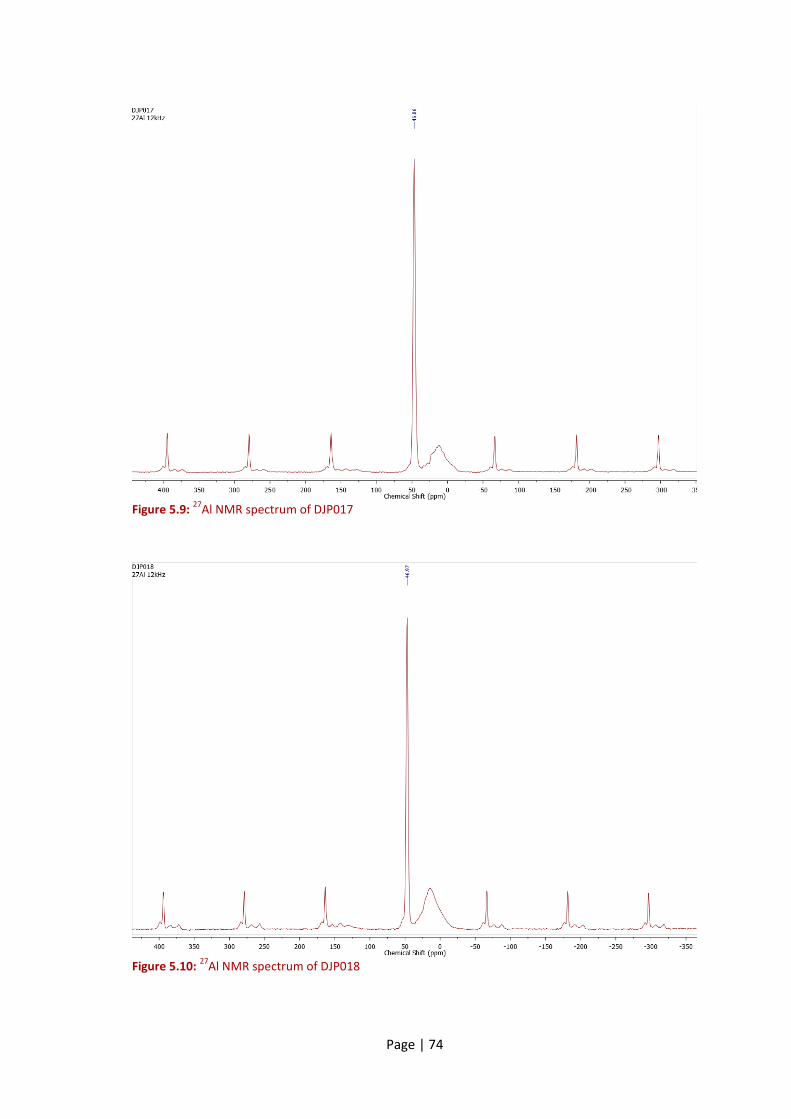
Page | 74
Figure 5.9: 27
Al NMR spectrum of DJP017
Figure 5.10: 27
Al NMR spectrum of DJP018

Page | 75
Figure 5.11: 27
Al NMR spectrum of DJP019

Page | 76
Appendix 5.4: 1D-MQMAS NMR spectra
Figure 5.12: 1D-MQMAS spectrum of DJP011
Figure 5.13: 1D-MQMAS spectrum of DJP015

Page | 77
Figure 5.14: 1D-MQMAS spectrum of DJP017
Figure 5.15: 1D-MQMAS spectrum of DJP018

Page | 78
Figure 5.16: 1D-MQMAS spectrum of DJP019

Page | 79
Appendix 5.5: Annotated catalytic reaction NMRs
Figure 5.17: Annotated 13
C NMR for DJP000 (reaction 1)
38.8
4So
lve
nt
DM
SO
39.1
2So
lve
nt
DM
SO
39.4
0So
lve
nt
DM
SO
39.6
7So
lve
nt
DM
SO
39.9
5So
lve
nt
DM
SO
40.2
3So
lve
nt
DM
SO
40.5
1So
lve
nt
DM
SO
60.5
2U
nkn
ow
n C
om
po
un
d
61.0
2C
om
po
un
dG
lyce
rol C
arb
on
ate
63.1
9U
nkn
ow
n C
om
po
un
d
63.4
2St
arti
ng
Mat
eri
alG
lyce
rol
65.7
2U
nkn
ow
n C
om
po
un
d
66.3
0C
om
po
un
dG
lyce
rol C
arb
on
ate
70.1
7U
nkn
ow
n C
om
po
un
d
72.8
7St
arti
ng
Mat
eri
alG
lyce
rol
77.4
8C
om
po
un
dG
lyce
rol C
arb
on
ate
155.
69U
nkn
ow
n C
om
po
un
d
155.
98C
om
po
un
dG
lyce
rol C
arb
on
ate
157.
23U
nkn
ow
n C
om
po
un
d
157.
48U
nkn
ow
n C
om
po
un
d
160.
55St
arti
ng
Mat
eri
alU
rea
An
no
tati
on
Pe
ak
(pp
m)
Pe
ak T
ype

Page | 80
Figure 5.18: Annotated 13
C NMR for DJP000 (reaction 2)
38.7
9So
lve
nt
DM
SO
39.0
7So
lve
nt
DM
SO
39.3
5So
lve
nt
DM
SO
39.6
3So
lve
nt
DM
SO
39.9
1So
lve
nt
DM
SO
40.1
9So
lve
nt
DM
SO
40.4
6So
lve
nt
DM
SO
60.5
2U
nkn
ow
n C
om
po
un
d
61.0
1C
om
po
un
dG
lyce
rol C
arb
on
ate
63.1
7U
nkn
ow
n C
om
po
un
d
63.4
1St
arti
ng
Mat
eri
alG
lyce
rol
65.7
3U
nkn
ow
n C
om
po
un
d
66.3
0C
om
po
un
dG
lyce
rol C
arb
on
ate
70.1
6U
nkn
ow
n C
om
po
un
d
72.8
6St
arti
ng
Mat
eri
alG
lyce
rol
75.5
4U
nkn
ow
n C
om
po
un
d
77.4
8C
om
po
un
dG
lyce
rol C
arb
on
ate
155.
71U
nkn
ow
n C
om
po
un
d
155.
97C
om
po
un
dG
lyce
rol C
arb
on
ate
157.
24U
nkn
ow
n C
om
po
un
d
157.
49U
nkn
ow
n C
om
po
un
d
160.
55St
arti
ng
Mat
eri
alU
rea
Pe
ak
(pp
m)
Pe
ak T
ype
An
no
tati
on

Page | 81
Figure 5.19: Annotated 13
C NMR for DJP000 (reaction 3)
38.8
1So
lve
nt
DM
SO
39.0
9So
lve
nt
DM
SO
39.3
7So
lve
nt
DM
SO
39.6
5So
lve
nt
DM
SO
39.9
2So
lve
nt
DM
SO
40.2
0So
lve
nt
DM
SO
40.4
8So
lve
nt
DM
SO
60.5
2U
nkn
ow
n C
om
po
un
d
61.0
2C
om
po
un
dG
lyce
rol C
arb
on
ate
63.1
8U
nkn
ow
n C
om
po
un
d
63.4
1St
arti
ng
Mat
eri
alG
lyce
rol
65.7
2U
nkn
ow
n C
om
po
un
d
66.3
0C
om
po
un
dG
lyce
rol C
arb
on
ate
70.1
7U
nkn
ow
n C
om
po
un
d
72.8
6St
arti
ng
Mat
eri
alG
lyce
rol
75.5
3U
nkn
ow
n C
om
po
un
d
77.4
8C
om
po
un
dG
lyce
rol C
arb
on
ate
155.
70U
nkn
ow
n C
om
po
un
d
155.
98C
om
po
un
dG
lyce
rol C
arb
on
ate
157.
24U
nkn
ow
n C
om
po
un
d
157.
49U
nkn
ow
n C
om
po
un
d
160.
57St
arti
ng
Mat
eri
alU
rea
Pe
ak
(pp
m)
Pe
ak T
ype
An
no
tati
on

Page | 82
Figure 5.20: Annotated 13
C NMR for DJP011 (reaction 1)
38.5
1So
lve
nt
DM
SO
38.7
8So
lve
nt
DM
SO
39.0
6So
lve
nt
DM
SO
39.3
4So
lve
nt
DM
SO
39.6
2So
lve
nt
DM
SO
39.9
0So
lve
nt
DM
SO
40.1
8So
lve
nt
DM
SO
60.4
9U
nkn
ow
n C
om
po
un
d
60.9
8C
om
po
un
dG
lyce
rol C
arb
on
ate
63.0
0U
nkn
ow
n C
om
po
un
d
63.2
9St
arti
ng
Mat
eri
alG
lyce
rol
65.7
7U
nkn
ow
n C
om
po
un
d
66.3
1C
om
po
un
dG
lyce
rol C
arb
on
ate
70.0
7U
nkn
ow
n C
om
po
un
d
72.7
3St
arti
ng
Mat
eri
alG
lyce
rol
75.5
5U
nkn
ow
n C
om
po
un
d
77.4
9C
om
po
un
dG
lyce
rol C
arb
on
ate
155.
84U
nkn
ow
n C
om
po
un
d
156.
09C
om
po
un
dG
lyce
rol C
arb
on
ate
157.
40U
nkn
ow
n C
om
po
un
d
157.
66U
nkn
ow
n C
om
po
un
d
160.
83St
arti
ng
Mat
eri
alU
rea
Pe
ak
(pp
m)
Pe
ak T
ype
An
no
tati
on

Page | 83
Figure 5.21: Annotated 13
C NMR for DJP011 (reaction 2)
38.5
0So
lve
nt
DM
SO
38.7
8So
lve
nt
DM
SO
39.0
6So
lve
nt
DM
SO
39.3
4So
lve
nt
DM
SO
39.6
2So
lve
nt
DM
SO
39.9
0So
lve
nt
DM
SO
40.1
8So
lve
nt
DM
SO
60.4
9U
nkn
ow
n C
om
po
un
d
60.9
8C
om
po
un
dG
lyce
rol C
arb
on
ate
63.0
0U
nkn
ow
n C
om
po
un
d
63.2
9C
om
po
un
dG
lyce
rol
65.7
7U
nkn
ow
n C
om
po
un
d
66.3
1C
om
po
un
dG
lyce
rol C
arb
on
ate
70.0
7U
nkn
ow
n C
om
po
un
d
72.7
3C
om
po
un
dG
lyce
rol
75.5
5U
nkn
ow
n C
om
po
un
d
77.4
9C
om
po
un
dG
lyce
rol C
arb
on
ate
155.
84U
nkn
ow
n C
om
po
un
d
156.
08C
om
po
un
dG
lyce
rol C
arb
on
ate
157.
40U
nkn
ow
n C
om
po
un
d
157.
65U
nkn
ow
n C
om
po
un
d
160.
83St
arti
ng
Mat
eri
alU
rea
Pe
ak
(pp
m)
Pe
ak T
ype
An
no
tati
on

Page | 84
Figure 5.22: Annotated 13
C NMR for DJP011 (reaction 3)
38.5
0So
lve
nt
DM
SO
38.7
7So
lve
nt
DM
SO
39.0
5So
lve
nt
DM
SO
39.3
3So
lve
nt
DM
SO
39.6
1So
lve
nt
DM
SO
39.8
9So
lve
nt
DM
SO
40.1
7So
lve
nt
DM
SO
60.4
9U
nkn
ow
n C
om
po
un
d
60.9
8C
om
po
un
dG
lyce
rol C
arb
on
ate
63.0
0U
nkn
ow
n C
om
po
un
d
63.2
8St
arti
ng
Mat
eri
alG
lyce
rol
65.7
7U
nkn
ow
n C
om
po
un
d
66.3
1C
om
po
un
dG
lyce
rol C
arb
on
ate
70.0
7U
nkn
ow
n C
om
po
un
d
72.7
3St
arti
ng
Mat
eri
alG
lyce
rol
75.5
5U
nkn
ow
n C
om
po
un
d
77.4
9C
om
po
un
dG
lyce
rol C
arb
on
ate
155.
85U
nkn
ow
n C
om
po
un
d
156.
10C
om
po
un
dG
lyce
rol C
arb
on
ate
157.
41U
nkn
ow
n C
om
po
un
d
157.
66U
nkn
ow
n C
om
po
un
d
160.
86St
arti
ng
Mat
eri
alU
rea
An
no
tati
on
Pe
ak
(pp
m)
Pe
ak T
ype

Page | 85
Figure 5.23: Annotated 13
C NMR for DJP015 (reaction 1)
38.8
0So
lve
nt
DM
SO
39.0
8So
lve
nt
DM
SO
39.3
6So
lve
nt
DM
SO
39.6
4So
lve
nt
DM
SO
39.9
1So
lve
nt
DM
SO
40.1
9So
lve
nt
DM
SO
40.4
7So
lve
nt
DM
SO
60.5
2U
nkn
ow
n C
om
po
un
d
61.0
2C
om
po
un
dG
lyce
rol C
arb
on
ate
63.1
8St
arti
ng
Mat
eri
alG
lyce
rol
63.4
1U
nkn
ow
n C
om
po
un
d
65.7
2U
nkn
ow
n C
om
po
un
d
66.3
0C
om
po
un
dG
lyce
rol C
arb
on
ate
70.1
6U
nkn
ow
n C
om
po
un
d
72.8
6St
arti
ng
Mat
eri
alG
lyce
rol
75.5
4U
nkn
ow
n C
om
po
un
d
77.4
8C
om
po
un
dG
lyce
rol C
arb
on
ate
155.
70U
nkn
ow
n C
om
po
un
d
156.
00C
om
po
un
dG
lyce
rol C
arb
on
ate
157.
26U
nkn
ow
n C
om
po
un
d
157.
50U
nkn
ow
n C
om
po
un
d
160.
62St
arti
ng
Mat
eri
alU
rea
Pe
ak
(pp
m)
Pe
ak T
ype
An
no
tati
on

Page | 86
Figure 5.24: Annotated 13
C NMR for DJP015 (reaction 2)
38.8
2So
lve
nt
DM
SO
39.1
0So
lve
nt
DM
SO
39.3
8So
lve
nt
DM
SO
39.6
5So
lve
nt
DM
SO
39.9
3So
lve
nt
DM
SO
40.2
1So
lve
nt
DM
SO
40.4
9So
lve
nt
DM
SO
60.5
2U
nkn
ow
n C
om
po
un
d
61.0
2C
om
po
un
dG
lyce
rol C
arb
on
ate
63.1
8St
arti
ng
Mat
eri
alG
lyce
rol
63.4
2U
nkn
ow
n C
om
po
un
d
65.7
2U
nkn
ow
n C
om
po
un
d
66.3
0C
om
po
un
dG
lyce
rol C
arb
on
ate
70.1
7U
nkn
ow
n C
om
po
un
d
72.8
7St
arti
ng
Mat
eri
alG
lyce
rol
75.5
3U
nkn
ow
n C
om
po
un
d
77.4
8C
om
po
un
dG
lyce
rol C
arb
on
ate
155.
69U
nkn
ow
n C
om
po
un
d
155.
98C
om
po
un
dG
lyce
rol C
arb
on
ate
157.
24U
nkn
ow
n C
om
po
un
d
157.
48U
nkn
ow
n C
om
po
un
d
160.
56St
arti
ng
Mat
eri
alU
rea
Pe
ak
(pp
m)
Pe
ak T
ype
An
no
tati
on

Page | 87
Figure 5.25: Annotated 13
C NMR for DJP015 (reaction 3)
38.8
2So
lve
nt
DM
SO
39.1
0So
lve
nt
DM
SO
39.3
7So
lve
nt
DM
SO
39.6
5So
lve
nt
DM
SO
39.9
3So
lve
nt
DM
SO
40.2
1So
lve
nt
DM
SO
40.4
9So
lve
nt
DM
SO
60.5
2U
nkn
ow
n C
om
po
un
d
61.0
2C
om
po
un
dG
lyce
rol C
arb
on
ate
63.1
8St
arti
ng
Mat
eri
alG
lyce
rol
63.4
1U
nkn
ow
n C
om
po
un
d
65.7
2U
nkn
ow
n C
om
po
un
d
66.3
0C
om
po
un
dG
lyce
rol C
arb
on
ate
70.1
7U
nkn
ow
n C
om
po
un
d
72.8
7St
arti
ng
Mat
eri
alG
lyce
rol
75.5
4U
nkn
ow
n C
om
po
un
d
77.4
8C
om
po
un
dG
lyce
rol C
arb
on
ate
155.
69U
nkn
ow
n C
om
po
un
d
155.
99C
om
po
un
dG
lyce
rol C
arb
on
ate
157.
24U
nkn
ow
n C
om
po
un
d
157.
49U
nkn
ow
n C
om
po
un
d
160.
58St
arti
ng
Mat
eri
alU
rea
Pe
ak
(pp
m)
Pe
ak T
ype
An
no
tati
on

Page | 88
Figure 5.26: Annotated 13
C NMR for DJP016 (reaction 1)
38.8
2So
lve
nt
DM
SO
39.1
0So
lve
nt
DM
SO
39.3
8So
lve
nt
DM
SO
39.6
5So
lve
nt
DM
SO
39.9
3So
lve
nt
DM
SO
40.2
1So
lve
nt
DM
SO
40.4
9So
lve
nt
DM
SO
60.5
2U
nkn
ow
n C
om
po
un
d
61.0
2C
om
po
un
dG
lyce
rol C
arb
on
ate
63.1
8St
arti
ng
Mat
eri
alG
lyce
rol
63.4
2U
nkn
ow
n C
om
po
un
d
65.7
2U
nkn
ow
n C
om
po
un
d
66.3
0C
om
po
un
dG
lyce
rol C
arb
on
ate
70.1
7U
nkn
ow
n C
om
po
un
d
72.8
7St
arti
ng
Mat
eri
alG
lyce
rol
75.5
4U
nkn
ow
n C
om
po
un
d
77.4
8C
om
po
un
dG
lyce
rol C
arb
on
ate
155.
69U
nkn
ow
n C
om
po
un
d
155.
99C
om
po
un
dG
lyce
rol C
arb
on
ate
157.
24U
nkn
ow
n C
om
po
un
d
157.
49U
nkn
ow
n C
om
po
un
d
160.
59St
arti
ng
Mat
eri
alU
rea
Pe
ak
(pp
m)
Pe
ak T
ype
An
no
tati
on

Page | 89
Figure 5.27: Annotated 13
C NMR for DJP016 (reaction 2)
38.8
4So
lve
nt
DM
SO
39.1
2So
lve
nt
DM
SO
39.4
0So
lve
nt
DM
SO
39.6
8So
lve
nt
DM
SO
39.9
5So
lve
nt
DM
SO
40.2
3So
lve
nt
DM
SO
40.5
1So
lve
nt
DM
SO
60.5
3U
nkn
ow
n C
om
po
un
d
61.0
2C
om
po
un
dG
lyce
rol C
arb
on
ate
63.1
9St
arti
ng
Mat
eri
alG
lyce
rol
63.4
3U
nkn
ow
n C
om
po
un
d
65.7
2U
nkn
ow
n C
om
po
un
d
66.3
0C
om
po
un
dG
lyce
rol C
arb
on
ate
70.1
8U
nkn
ow
n C
om
po
un
d
72.8
8St
arti
ng
Mat
eri
alG
lyce
rol
75.5
3U
nkn
ow
n C
om
po
un
d
77.4
8C
om
po
un
dG
lyce
rol C
arb
on
ate
155.
68U
nkn
ow
n C
om
po
un
d
155.
95C
om
po
un
dG
lyce
rol C
arb
on
ate
157.
22U
nkn
ow
n C
om
po
un
d
157.
46U
nkn
ow
n C
om
po
un
d
160.
49St
arti
ng
Mat
eri
alU
rea
Pe
ak
(pp
m)
Pe
ak T
ype
An
no
tati
on

Page | 90
Figure 5.28: Annotated 13
C NMR for DJP016 (reaction 3)
38.8
3So
lve
nt
DM
SO
39.1
1So
lve
nt
DM
SO
39.3
9So
lve
nt
DM
SO
39.6
6So
lve
nt
DM
SO
39.9
4So
lve
nt
DM
SO
40.2
2So
lve
nt
DM
SO
40.5
0So
lve
nt
DM
SO
60.5
3U
nkn
ow
n C
om
po
un
d
61.0
2C
om
po
un
dG
lyce
rol C
arb
on
ate
63.1
9St
arti
ng
Mat
eri
alG
lyce
rol
63.4
2U
nkn
ow
n C
om
po
un
d
65.7
2U
nkn
ow
n C
om
po
un
d
66.3
0C
om
po
un
dG
lyce
rol C
arb
on
ate
70.1
7U
nkn
ow
n C
om
po
un
d
72.8
7St
arti
ng
Mat
eri
alG
lyce
rol
75.5
4U
nkn
ow
n C
om
po
un
d
77.4
8C
om
po
un
dG
lyce
rol C
arb
on
ate
155.
69U
nkn
ow
n C
om
po
un
d
155.
97C
om
po
un
dG
lyce
rol C
arb
on
ate
157.
23U
nkn
ow
n C
om
po
un
d
157.
48U
nkn
ow
n C
om
po
un
d
160.
55St
arti
ng
Mat
eri
alU
rea
Pe
ak
(pp
m)
Pe
ak T
ype
An
no
tati
on

Page | 91
Figure 5.29: Annotated 13
C NMR for DJP017 (reaction 1)
38.8
0So
lve
nt
DM
SO
39.0
8So
lve
nt
DM
SO
39.3
6So
lve
nt
DM
SO
39.6
3So
lve
nt
DM
SO
39.9
1So
lve
nt
DM
SO
40.1
9So
lve
nt
DM
SO
40.4
7So
lve
nt
DM
SO
60.5
2U
nkn
ow
n C
om
po
un
d
61.0
2C
om
po
un
dG
lyce
rol C
arb
on
ate
63.1
7St
arti
ng
Mat
eri
alG
lyce
rol
63.4
1U
nkn
ow
n C
om
po
un
d
65.7
2U
nkn
ow
n C
om
po
un
d
66.3
0C
om
po
un
dG
lyce
rol C
arb
on
ate
70.1
6U
nkn
ow
n C
om
po
un
d
72.8
6St
arti
ng
Mat
eri
alG
lyce
rol
75.5
4U
nkn
ow
n C
om
po
un
d
77.4
8C
om
po
un
dG
lyce
rol C
arb
on
ate
155.
70U
nkn
ow
n C
om
po
un
d
156.
00C
om
po
un
dG
lyce
rol C
arb
on
ate
157.
25U
nkn
ow
n C
om
po
un
d
157.
50U
nkn
ow
n C
om
po
un
d
160.
61St
arti
ng
Mat
eri
alU
rea
Pe
ak
(pp
m)
Pe
ak T
ype
An
no
tati
on
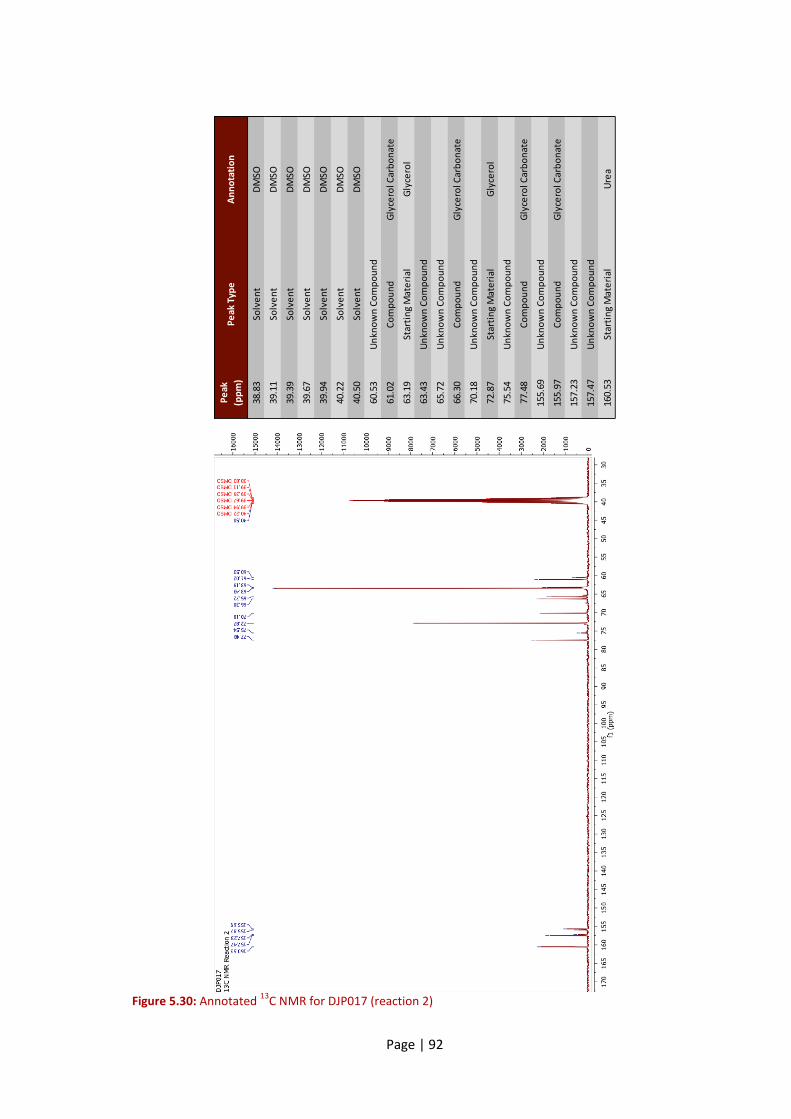
Page | 92
Figure 5.30: Annotated 13
C NMR for DJP017 (reaction 2)
38.8
3So
lve
nt
DM
SO
39.1
1So
lve
nt
DM
SO
39.3
9So
lve
nt
DM
SO
39.6
7So
lve
nt
DM
SO
39.9
4So
lve
nt
DM
SO
40.2
2So
lve
nt
DM
SO
40.5
0So
lve
nt
DM
SO
60.5
3U
nkn
ow
n C
om
po
un
d
61.0
2C
om
po
un
dG
lyce
rol C
arb
on
ate
63.1
9St
arti
ng
Mat
eri
alG
lyce
rol
63.4
3U
nkn
ow
n C
om
po
un
d
65.7
2U
nkn
ow
n C
om
po
un
d
66.3
0C
om
po
un
dG
lyce
rol C
arb
on
ate
70.1
8U
nkn
ow
n C
om
po
un
d
72.8
7St
arti
ng
Mat
eri
alG
lyce
rol
75.5
4U
nkn
ow
n C
om
po
un
d
77.4
8C
om
po
un
dG
lyce
rol C
arb
on
ate
155.
69U
nkn
ow
n C
om
po
un
d
155.
97C
om
po
un
dG
lyce
rol C
arb
on
ate
157.
23U
nkn
ow
n C
om
po
un
d
157.
47U
nkn
ow
n C
om
po
un
d
160.
53St
arti
ng
Mat
eri
alU
rea
Pe
ak
(pp
m)
Pe
ak T
ype
An
no
tati
on

Page | 93
Figure 5.31: Annotated 13
C NMR for DJP017 (reaction 3)
38.8
2So
lve
nt
DM
SO
39.1
0So
lve
nt
DM
SO
39.3
8So
lve
nt
DM
SO
39.6
6So
lve
nt
DM
SO
39.9
3So
lve
nt
DM
SO
40.2
1So
lve
nt
DM
SO
40.4
9So
lve
nt
DM
SO
60.5
2U
nkn
ow
n C
om
po
un
d
61.0
2C
om
po
un
dG
lyce
rol C
arb
on
ate
63.1
9St
arti
ng
Mat
eri
alG
lyce
rol
63.4
2U
nkn
ow
n C
om
po
un
d
65.7
2U
nkn
ow
n C
om
po
un
d
66.3
0C
om
po
un
dG
lyce
rol C
arb
on
ate
70.1
7U
nkn
ow
n C
om
po
un
d
72.8
7St
arti
ng
Mat
eri
alG
lyce
rol
75.5
3U
nkn
ow
n C
om
po
un
d
77.4
8C
om
po
un
dG
lyce
rol C
arb
on
ate
155.
69U
nkn
ow
n C
om
po
un
d
155.
98C
om
po
un
dG
lyce
rol C
arb
on
ate
157.
24U
nkn
ow
n C
om
po
un
d
157.
48U
nkn
ow
n C
om
po
un
d
160.
57St
arti
ng
Mat
eri
alU
rea
Pe
ak
(pp
m)
Pe
ak T
ype
An
no
tati
on

Page | 94
Figure 5.32: Annotated 13
C NMR for DJP018 (reaction 1)
38.8
1So
lve
nt
DM
SO
39.0
9So
lve
nt
DM
SO
39.3
7So
lve
nt
DM
SO
39.6
5So
lve
nt
DM
SO
39.9
3So
lve
nt
DM
SO
40.2
0So
lve
nt
DM
SO
40.4
8So
lve
nt
DM
SO
60.5
2U
nK
no
wn
Co
mp
ou
nd
61.0
2C
om
po
un
dG
lyce
rol C
arb
on
ate
63.1
8St
arti
ng
Mat
eri
alG
lyce
rol
63.4
1U
nK
no
wn
Co
mp
ou
nd
65.7
2U
nK
no
wn
Co
mp
ou
nd
66.3
0C
om
po
un
dG
lyce
rol C
arb
on
ate
70.1
7U
nK
no
wn
Co
mp
ou
nd
72.8
7St
arti
ng
Mat
eri
alG
lyce
rol
75.5
4U
nK
no
wn
Co
mp
ou
nd
77.4
8C
om
po
un
dG
lyce
rol C
arb
on
ate
155.
69U
nK
no
wn
Co
mp
ou
nd
155.
99C
om
po
un
dG
lyce
rol C
arb
on
ate
157.
25U
nK
no
wn
Co
mp
ou
nd
157.
49U
nK
no
wn
Co
mp
ou
nd
160.
60St
arti
ng
Mat
eri
alU
rea
Pe
ak
(pp
m)
Pe
ak T
ype
An
no
tati
on

Page | 95
Figure 5.33: Annotated 13
C NMR for DJP018 (reaction 2)
38.8
0So
lve
nt
DM
SO
39.0
8So
lve
nt
DM
SO
39.3
6So
lve
nt
DM
SO
39.6
4So
lve
nt
DM
SO
39.9
1So
lve
nt
DM
SO
40.1
9So
lve
nt
DM
SO
40.4
7So
lve
nt
DM
SO
60.5
2U
nkn
ow
n C
om
po
un
d
61.0
2C
om
po
un
dG
lyce
rol C
arb
on
ate
63.1
8St
arti
ng
Mat
eri
alG
lyce
rol
63.4
1U
nkn
ow
n C
om
po
un
d
65.7
2U
nkn
ow
n C
om
po
un
d
66.3
0C
om
po
un
dG
lyce
rol C
arb
on
ate
70.1
7U
nkn
ow
n C
om
po
un
d
72.8
6St
arti
ng
Mat
eri
alG
lyce
rol
75.5
4U
nkn
ow
n C
om
po
un
d
77.4
8C
om
po
un
dG
lyce
rol C
arb
on
ate
155.
70U
nkn
ow
n C
om
po
un
d
155.
99C
om
po
un
dG
lyce
rol C
arb
on
ate
157.
24U
nkn
ow
n C
om
po
un
d
157.
49U
nkn
ow
n C
om
po
un
d
160.
59St
arti
ng
Mat
eri
alU
rea
Pe
ak
(pp
m)
Pe
ak T
ype
An
no
tati
on
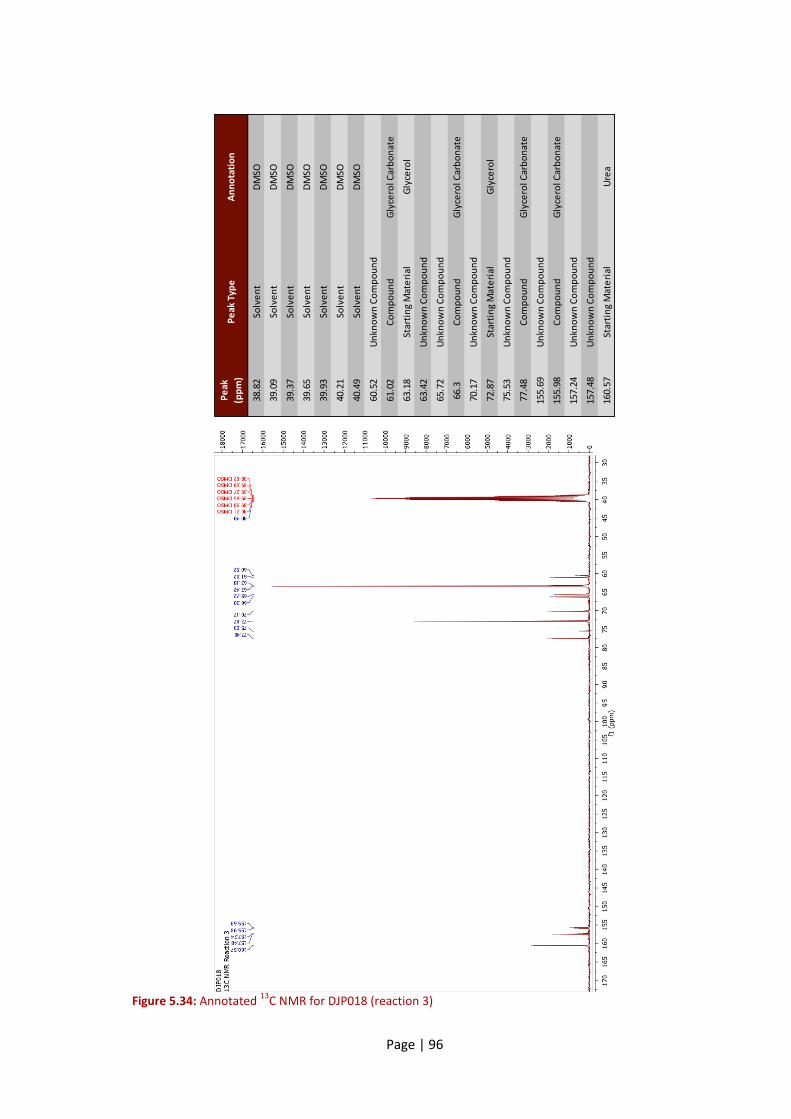
Page | 96
Figure 5.34: Annotated 13
C NMR for DJP018 (reaction 3)
38.8
2So
lve
nt
DM
SO
39.0
9So
lve
nt
DM
SO
39.3
7So
lve
nt
DM
SO
39.6
5So
lve
nt
DM
SO
39.9
3So
lve
nt
DM
SO
40.2
1So
lve
nt
DM
SO
40.4
9So
lve
nt
DM
SO
60.5
2U
nkn
ow
n C
om
po
un
d
61.0
2C
om
po
un
dG
lyce
rol C
arb
on
ate
63.1
8St
arti
ng
Mat
eri
alG
lyce
rol
63.4
2U
nkn
ow
n C
om
po
un
d
65.7
2U
nkn
ow
n C
om
po
un
d
66.3
Co
mp
ou
nd
Gly
cero
l Car
bo
nat
e
70.1
7U
nkn
ow
n C
om
po
un
d
72.8
7St
arti
ng
Mat
eri
alG
lyce
rol
75.5
3U
nkn
ow
n C
om
po
un
d
77.4
8C
om
po
un
dG
lyce
rol C
arb
on
ate
155.
69U
nkn
ow
n C
om
po
un
d
155.
98C
om
po
un
dG
lyce
rol C
arb
on
ate
157.
24U
nkn
ow
n C
om
po
un
d
157.
48U
nkn
ow
n C
om
po
un
d
160.
57St
arti
ng
Mat
eri
alU
rea
Pe
ak
(pp
m)
Pe
ak T
ype
An
no
tati
on

Page | 97
Figure 5.35: Annotated 13
C NMR for DJP019 (reaction 1)
38.7
0So
lve
nt
DM
SO
38.9
8So
lve
nt
DM
SO
39.2
6So
lve
nt
DM
SO
39.5
4So
lve
nt
DM
SO
39.8
2So
lve
nt
DM
SO
40.1
0So
lve
nt
DM
SO
40.3
8So
lve
nt
DM
SO
60.4
1U
nkn
ow
n C
om
po
un
d
60.9
0C
om
po
un
dG
lyce
rol C
arb
on
ate
63.0
7St
arti
ng
Mat
eri
alG
lyce
rol
63.3
0U
nkn
ow
n C
om
po
un
d
65.6
0U
nkn
ow
n C
om
po
un
d
66.1
8C
om
po
un
dG
lyce
rol C
arb
on
ate
70.0
5U
nkn
ow
n C
om
po
un
d
72.7
5St
arti
ng
Mat
eri
alG
lyce
rol
75.4
2U
nkn
ow
n C
om
po
un
d
77.3
6C
om
po
un
dG
lyce
rol C
arb
on
ate
155.
57U
nkn
ow
n C
om
po
un
d
155.
84C
om
po
un
dG
lyce
rol C
arb
on
ate
157.
10U
nkn
ow
n C
om
po
un
d
157.
35U
nkn
ow
n C
om
po
un
d
160.
39St
arti
ng
Mat
eri
alU
rea
Pe
ak
(pp
m)
Pe
ak T
ype
An
no
tati
on

Page | 98
Figure 5.36: Annotated 13
C NMR for DJP019 (reaction 2)
38.8
0So
lve
nt
DM
SO
39.0
8So
lve
nt
DM
SO
39.3
6So
lve
nt
DM
SO
39.6
3So
lve
nt
DM
SO
39.9
1So
lve
nt
DM
SO
40.1
9So
lve
nt
DM
SO
40.4
7So
lve
nt
DM
SO
60.4
9U
nkn
ow
n C
om
po
un
d
60.9
8C
om
po
un
dG
lyce
rol C
arb
on
ate
63.1
6St
arti
ng
Mat
eri
alG
lyce
rol
63.3
9U
nkn
ow
n C
om
po
un
d
65.6
8U
nkn
ow
n C
om
po
un
d
66.2
6C
om
po
un
dG
lyce
rol C
arb
on
ate
70.1
4U
nkn
ow
n C
om
po
un
d
72.8
4St
arti
ng
Mat
eri
alG
lyce
rol
75.5
0U
nkn
ow
n C
om
po
un
d
77.4
4C
om
po
un
dG
lyce
rol C
arb
on
ate
155.
65U
nkn
ow
n C
om
po
un
d
155.
92C
om
po
un
dG
lyce
rol C
arb
on
ate
157.
18U
nkn
ow
n C
om
po
un
d
157.
43U
nkn
ow
n C
om
po
un
d
160.
46St
arti
ng
Mat
eri
alU
rea
Pe
ak
(pp
m)
Pe
ak T
ype
An
no
tati
on

Page | 99
Figure 5.37: Annotated 13
C spectrum for DJP019 (reaction 3)
38.7
7So
lve
nt
DM
SO
39.0
5So
lve
nt
DM
SO
39.3
3So
lve
nt
DM
SO
39.6
1So
lve
nt
DM
SO
39.8
9So
lve
nt
DM
SO
40.1
7So
lve
nt
DM
SO
40.4
5So
lve
nt
DM
SO
60.4
8U
nkn
ow
n C
om
po
un
d
60.9
8C
om
po
un
dG
lyce
rol C
arb
on
ate
63.1
5St
arti
ng
Mat
eri
alG
lyce
rol
63.3
7U
nkn
ow
n C
om
po
un
d
65.6
8U
nkn
ow
n C
om
po
un
d
66.2
7C
om
po
un
dG
lyce
rol C
arb
on
ate
70.1
3U
nkn
ow
n C
om
po
un
d
72.8
3St
arti
ng
Mat
eri
alG
lyce
rol
75.5
0U
nkn
ow
n C
om
po
un
d
77.4
4C
om
po
un
dG
lyce
rol C
arb
on
ate
155.
66U
nkn
ow
n C
om
po
un
d
155.
97C
om
po
un
dG
lyce
rol C
arb
on
ate
157.
22U
nkn
ow
n C
om
po
un
d
157.
46U
nkn
ow
n C
om
po
un
d
160.
59St
arti
ng
Mat
eri
alU
rea
Pe
ak
(pp
m)
Pe
ak T
ype
An
no
tati
on

Page | 100
Appendix 5.6: Refined lattice parameters
Table 5.8: Refined lattice parameters for DJP011
Refined Unit Cell
A= 19.4021(41), B= 10.6952(6), C= 17.5564(34), α= 90.00, β= 102.06(357), γ= 90.00
H K L 2θ (obs) 2θ (cal) Difference
-1 0 1 6.1832 6.1791 0.0041
0 1 1 9.7371 9.7436 -0.0065
-1 1 1 10.4202 10.3278 0.0924
1 1 1 11.2119 11.2610 -0.0491
0 1 2 13.2326 13.2256 0.0070
-1 0 3 15.1862 15.2083 -0.0221
3 0 1 15.9065 15.9141 -0.0076
1 0 3 17.1152 17.0932 0.0220
-2 1 3 18.3152 18.3309 -0.0157
-1 2 2 19.6054 19.6016 0.0038
-2 0 4 20.8710 20.8575 0.0135
3 2 0 21.7514 21.7649 -0.0135
0 1 4 22.3316 22.3190 0.0126
3 0 3 23.0663 23.0357 0.0306
1 2 3 23.8475 23.8993 -0.0518
-3 2 3 25.0117 25.0221 -0.0104
-1 3 1 25.7965 25.7550 0.0415
0 2 4 26.6198 26.6316 -0.0118
0 1 5 27.2581 27.2785 -0.0204
-1 3 3 29.3800 29.3726 0.0074
2 1 5 30.6732 30.6463 0.0269
4 2 3 31.6591 31.6791 -0.0200
-7 1 1 33.4439 33.4411 0.0028
0 4 1 33.9231 33.9329 -0.0098
Refined Lattice Parameters for DJP011
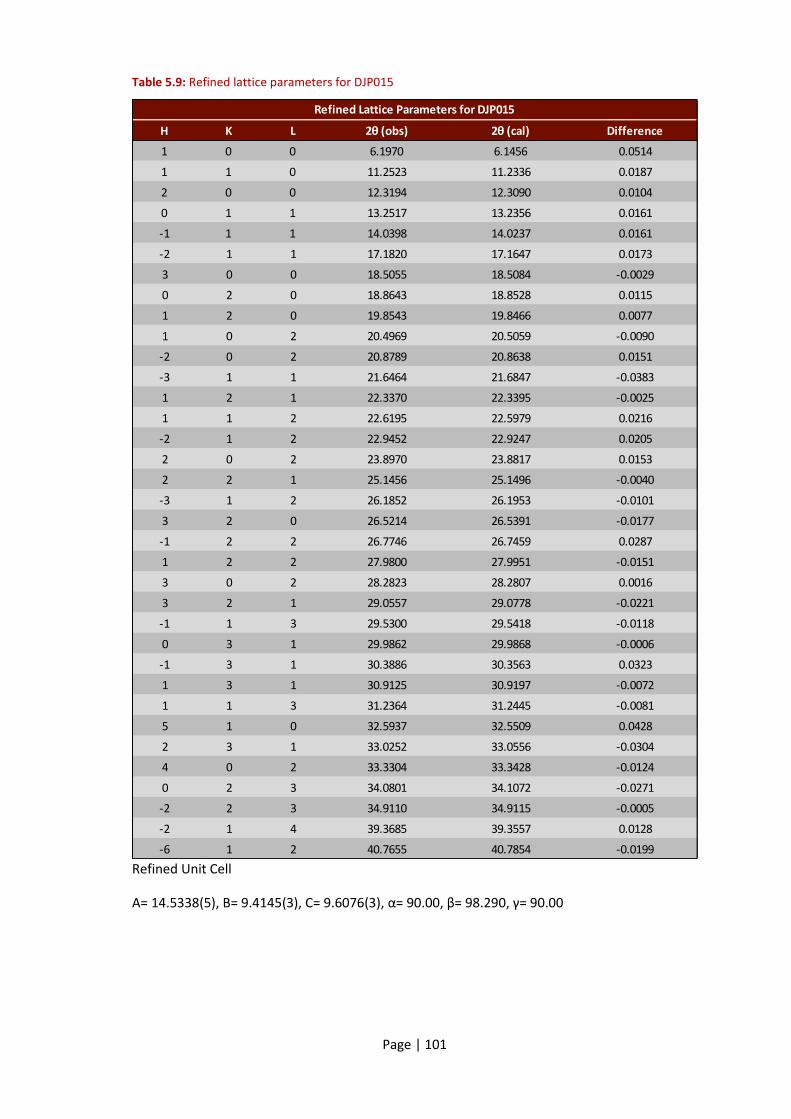
Page | 101
Table 5.9: Refined lattice parameters for DJP015
Refined Unit Cell
A= 14.5338(5), B= 9.4145(3), C= 9.6076(3), α= 90.00, β= 98.290, γ= 90.00
H K L 2θ (obs) 2θ (cal) Difference
1 0 0 6.1970 6.1456 0.0514
1 1 0 11.2523 11.2336 0.0187
2 0 0 12.3194 12.3090 0.0104
0 1 1 13.2517 13.2356 0.0161
-1 1 1 14.0398 14.0237 0.0161
-2 1 1 17.1820 17.1647 0.0173
3 0 0 18.5055 18.5084 -0.0029
0 2 0 18.8643 18.8528 0.0115
1 2 0 19.8543 19.8466 0.0077
1 0 2 20.4969 20.5059 -0.0090
-2 0 2 20.8789 20.8638 0.0151
-3 1 1 21.6464 21.6847 -0.0383
1 2 1 22.3370 22.3395 -0.0025
1 1 2 22.6195 22.5979 0.0216
-2 1 2 22.9452 22.9247 0.0205
2 0 2 23.8970 23.8817 0.0153
2 2 1 25.1456 25.1496 -0.0040
-3 1 2 26.1852 26.1953 -0.0101
3 2 0 26.5214 26.5391 -0.0177
-1 2 2 26.7746 26.7459 0.0287
1 2 2 27.9800 27.9951 -0.0151
3 0 2 28.2823 28.2807 0.0016
3 2 1 29.0557 29.0778 -0.0221
-1 1 3 29.5300 29.5418 -0.0118
0 3 1 29.9862 29.9868 -0.0006
-1 3 1 30.3886 30.3563 0.0323
1 3 1 30.9125 30.9197 -0.0072
1 1 3 31.2364 31.2445 -0.0081
5 1 0 32.5937 32.5509 0.0428
2 3 1 33.0252 33.0556 -0.0304
4 0 2 33.3304 33.3428 -0.0124
0 2 3 34.0801 34.1072 -0.0271
-2 2 3 34.9110 34.9115 -0.0005
-2 1 4 39.3685 39.3557 0.0128
-6 1 2 40.7655 40.7854 -0.0199
Refined Lattice Parameters for DJP015

Page | 102
Table 5.10: Refined lattice parameters for DJP016
Refined Unit Cell
A= 15.425(6), B= 5.2894(2), C= 9.032(5), α= 90.00, β= 101.75, γ= 90.00
H K L 2θ (obs) 2θ (cal) Difference
-1 0 1 10.5458 10.5140 0.0318
2 0 0 11.7937 11.7202 0.0735
1 0 1 12.6136 12.5883 0.0253
-3 0 1 18.4583 18.4207 0.0376
-1 1 1 19.8656 19.8269 0.0387
0 0 2 20.1048 20.0838 0.0210
3 0 1 22.0367 22.0258 0.0109
-3 1 1 25.0360 25.0046 0.0314
2 0 2 25.3348 25.3318 0.0030
-2 1 2 27.0848 27.0824 0.0024
3 1 1 27.8169 27.8067 0.0102
4 1 0 29.0984 29.0594 0.0390
0 2 0 33.9079 33.8965 0.0114
4 0 2 34.2286 34.2285 0.0001
1 2 1 36.2907 36.2923 -0.0016
5 1 1 37.4128 37.4501 -0.0373
3 0 3 38.3781 38.4039 -0.0258
-6 1 2 41.1812 41.1874 -0.0062
-4 2 1 41.7432 41.7594 -0.0162
2 2 2 42.7915 42.7864 0.0051
-4 2 2 44.3577 44.3699 -0.0122
6 0 2 44.8872 44.9227 -0.0355
7 1 1 48.5766 48.5824 -0.0058
-6 2 2 51.2975 51.3109 -0.0134
-5 2 3 51.9165 51.8814 0.0351
1 2 4 55.4423 55.4516 -0.0093
0 3 2 56.1509 56.1654 -0.0145
3 3 2 60.7759 60.7816 -0.0057
Refined Lattice Parameters for DJP016

Page | 103
Table 5.11: Refined lattice parameters for DJP017
Refined Unit Cell
A= 13.8877(18), B= 14.5656(19), C= 8.5739(10), α= 100.67(84), β= 104.24(80), γ= 81.49(82)
H K L 2θ (obs) 2θ (cal) Difference
0 -1 0 6.1994 6.2109 -0.0115
-1 -1 0 8.5022 8.5700 -0.0678
-1 1 0 9.5683 9.5464 0.0219
-1 0 1 11.2475 11.3059 -0.0584
0 -1 1 11.5891 11.5787 0.0104
0 1 1 13.2546 13.2607 -0.0061
-2 -1 0 13.9764 14.0075 -0.0311
0 -2 1 15.1811 15.1603 0.0208
-2 -2 0 17.1836 17.1884 -0.0048
1 -2 1 17.9462 18.0089 -0.0627
-1 2 1 18.5029 18.5367 -0.0338
2 0 1 18.8617 18.9017 -0.0400
2 -2 0 19.1739 19.1599 0.0140
-3 0 0 19.8710 19.9041 -0.0331
1 -3 0 20.4914 20.5262 -0.0348
-1 -1 2 20.8817 20.8787 0.0030
0 0 2 21.6462 21.6505 -0.0043
-3 -2 0 22.3214 22.3566 -0.0352
2 -2 1 22.5662 22.5501 0.0161
2 2 1 22.9425 22.8315 0.1110
0 1 2 23.4072 23.4700 -0.0628
-1 3 1 23.8912 23.8972 -0.0060
-3 -3 1 25.1410 25.0484 0.0926
3 -1 1 25.6967 25.6728 0.0239
-2 -3 2 26.2144 26.2930 -0.0786
-2 -4 1 26.5192 26.4920 0.0272
0 2 2 26.7712 26.7032 0.0680
-3 1 2 27.9983 28.0275 -0.0292
-2 2 2 28.2889 28.2480 0.0409
2 1 2 29.0806 29.0819 -0.0013
1 4 1 29.5264 29.5782 -0.0518
-3 3 1 30.3796 30.3602 0.0194
3 3 1 30.9062 30.9299 -0.0237
-4 2 1 31.2310 31.2272 0.0038
-2 3 2 32.5970 32.5882 0.0088
-1 -3 3 34.0567 34.0199 0.0368
4 -3 0 34.4368 34.4238 0.0130
1 0 3 34.9130 34.9131 -0.0001
0 -3 3 35.2324 35.2294 0.0030
-5 -2 3 40.7813 40.7782 0.0031
Refined Lattice Parameters for DJP017

Page | 104
Table 5.12: Refined lattice parameters for DJP018
Refined Unit Cell
A= 14.5611(8), B= 9.4475(4), C= 9.6135(4), α= 90.00, β= 92.26(66), γ= 90.00
H K L 2θ (obs) 2θ (cal) Difference
1 0 0 6.1938 6.1337 0.0601
1 1 0 11.2236 11.1995 0.0241
2 0 0 12.3072 12.2851 0.0221
0 1 1 13.2248 13.2078 0.0170
-1 1 1 14.0109 13.9952 0.0157
1 1 1 15.1740 15.1312 0.0428
-2 1 1 17.1461 17.1309 0.0152
3 0 0 18.4819 18.4723 0.0096
0 2 0 18.8048 18.7863 0.0185
1 2 0 19.7871 19.7796 0.0075
1 0 2 20.4753 20.4864 -0.0111
-2 0 2 20.8569 20.8465 0.0104
-3 1 1 21.6208 21.6425 -0.0217
1 2 1 22.2748 22.2750 -0.0002
1 1 2 22.5807 22.5662 0.0145
-2 1 2 22.9037 22.8951 0.0086
2 0 2 23.8621 23.8516 0.0105
2 2 1 25.0812 25.0811 0.0001
-3 1 2 26.1476 26.1582 -0.0106
3 2 0 26.4806 26.4654 0.0152
-1 2 2 26.7038 26.6897 0.0141
1 2 2 27.9168 27.9347 -0.0179
-2 2 2 28.2208 28.2049 0.0159
3 2 1 28.9956 29.0033 -0.0077
-1 1 3 29.4842 29.5144 -0.0302
0 3 1 29.8770 29.8881 -0.0111
1 3 1 30.8048 30.8198 -0.0150
1 1 3 31.1766 31.2097 -0.0331
-5 1 1 32.5350 32.5532 -0.0182
-3 1 3 32.9346 32.9243 0.0103
4 0 2 33.2787 33.2874 -0.0087
0 2 3 34.0249 34.0526 -0.0277
-2 2 3 34.8374 34.8571 -0.0197
3 3 1 36.0934 36.0990 -0.0056
-3 2 3 36.9037 36.9239 -0.0202
2 2 3 37.7876 37.7520 0.0356
1 0 4 39.2687 39.2705 -0.0018
-3 0 4 39.8501 39.8030 0.0471
-6 1 2 40.6971 40.7147 -0.0176
Refined Lattice Parameters for DJP018

Page | 105
Table 5.13: Refined lattice parameters for DJP019
Refined Unit Cell
A= 14.5294(12), B= 9.4133(4), C= 9.6018(7), α= 90.00, β= 98.23(121), γ= 90.00
H K L 2θ (obs) 2θ (cal) Difference
1 0 0 6.1729 6.1466 0.0263
1 1 0 11.2708 11.2351 0.0357
2 0 0 12.3270 12.3109 0.0161
0 1 1 13.2604 13.2394 0.021
-1 1 1 14.0531 14.0316 0.0215
1 1 1 15.2000 15.1634 0.0366
-2 1 1 17.1880 17.1754 0.0126
3 0 0 18.5172 18.5112 0.006
0 2 0 18.8692 18.8551 0.0141
1 0 2 20.4930 20.5085 -0.0155
-2 0 2 20.8913 20.8830 0.0083
-3 1 1 21.6566 21.6971 -0.0405
1 2 1 22.3395 22.3410 -0.0015
1 1 2 22.6243 22.6008 0.0235
-2 1 2 22.9376 22.9427 -0.0051
2 0 2 23.8942 23.8800 0.0142
2 2 1 25.1453 25.1494 -0.0041
3 2 0 26.5226 26.5428 -0.0202
-1 2 2 26.7697 26.7579 0.0118
3 0 2 28.2685 28.2763 -0.0078
3 2 1 29.0543 29.0768 -0.0225
0 3 1 29.9908 29.9915 -0.0007
1 3 1 30.9142 30.9226 -0.0084
1 1 3 31.2392 31.2513 -0.0121
-5 0 2 34.0679 34.0527 0.0152
-2 2 3 34.9109 34.9340 -0.0231
Refined Lattice Parameters for DJP018

Page | 106
References
1. Johnson, D. T.; Taconi, K. A., The glycerin glut: Options for the value-added conversion
of crude glycerol resulting from biodiesel production. Environmental Progress 2007, 26
(4), 338-348.
2. US Energy Information Administration. Monthly Biodiesel Production Report (October
2013); US Department of Energy: Washington, DC, 2013.
3. Pagliaro, M.; Ciriminna, R.; Kimura, H.; Rossi, M.; Della Pina, C., From Glycerol to Value-
Added Products. Angewandte Chemie International Edition 2007, 46 (24), 4434-4440.
4. Behr, A.; Eilting, J.; Irawadi, K.; Leschinski, J.; Lindner, F., Improved utilisation of
renewable resources: New important derivatives of glycerol. Green Chem 2008, 10 (1),
13-30.
5. Habe, H.; Shimada, Y.; Yakushi, T.; Hattori, H.; Ano, Y.; Fukuoka, T.; Kitamoto, D.;
Itagaki, M.; Watanabe, K.; Yanagishita, H.; Matsushita, K.; Sakaki, K., Microbial
Production of Glyceric Acid, an Organic Acid That Can Be Mass Produced from Glycerol.
Appl. Environ. Microbiol. 2009, 75 (24), 7760-7766.
6. Carrettin, S.; McMorn, P.; Johnston, P.; Griffin, K.; Hutchings, G. J., Selective oxidation
of glycerol to glyceric acid using a gold catalyst in aqueous sodium hydroxide. Chemical
Communications 2002, (7), 696-697.
7. Zeng, A.-P.; Biebl, H., Bulk Chemicals from Biotechnology: The Case of 1,3-Propanediol
Production and the New Trends. In Tools and Applications of Biochemical Engineering
Science, Springer Berlin Heidelberg: 2002; Vol. 74, pp 239-259.
8. Kurosaka, T.; Maruyama, H.; Naribayashi, I.; Sasaki, Y., Production of 1,3-propanediol
by hydrogenolysis of glycerol catalyzed by Pt/WO3/ZrO2. Catalysis Communications
2008, 9 (6), 1360-1363.
9. Di Serio, M.; Casale, L.; Tesser, R.; Santacesaria, E., New Process for the Production of
Glycerol tert-Butyl Ethers†. Energy & Fuels 2010, 24 (9), 4668-4672.

Page | 107
10. Xiao, L.; Mao, J.; Zhou, J.; Guo, X.; Zhang, S., Enhanced performance of HY zeolites by
acid wash for glycerol etherification with isobutene. Applied Catalysis A: General 2011,
393 (1–2), 88-95.
11. Soares, R. R.; Simonetti, D. A.; Dumesic, J. A., Glycerol as a Source for Fuels and
Chemicals by Low-Temperature Catalytic Processing. Angewandte Chemie
International Edition 2006, 45 (24), 3982-3985.
12. Simonetti, D. A.; Kunkes, E. L.; Dumesic, J. A., Gas-phase conversion of glycerol to
synthesis gas over carbon-supported platinum and platinum–rhenium catalysts.
Journal of Catalysis 2007, 247 (2), 298-306.
13. Sonnati, M. O.; Amigoni, S.; de Givenchy, E. P. T.; Darmanin, T.; Choulet, O.; Guittard,
F., Glycerol carbonate as a versatile building block for tomorrow: synthesis, reactivity,
properties and applications. Green Chem 2013, 15 (2), 283-306.
14. Aresta, M.; Dibenedetto, A.; Nocito, F.; Pastore, C., A study on the carboxylation of
glycerol to glycerol carbonate with carbon dioxide: The role of the catalyst, solvent and
reaction conditions. Journal of Molecular Catalysis A: Chemical 2006, 257 (1–2), 149-
153.
15. Vieville, C.; Yoo, J. W.; Pelet, S.; Mouloungui, Z., Synthesis of glycerol carbonate by
direct carbonatation of glycerol in supercritical CO2 in the presence of zeolites and ion
exchange resins. Catalysis Letters 1998, 56 (4), 245-247.
16. Hammond, C.; Lopez-Sanchez, J. A.; Hasbi Ab Rahim, M.; Dimitratos, N.; Jenkins, R. L.;
Carley, A. F.; He, Q.; Kiely, C. J.; Knight, D. W.; Hutchings, G. J., Synthesis of glycerol
carbonate from glycerol and urea with gold-based catalysts. Dalton Transactions 2011,
40 (15), 3927-3937.
17. Climent, M. J.; Corma, A.; De Frutos, P.; Iborra, S.; Noy, M.; Velty, A.; Concepción, P.,
Chemicals from biomass: Synthesis of glycerol carbonate by transesterification and
carbonylation with urea with hydrotalcite catalysts. The role of acid–base pairs.
Journal of Catalysis 2010, 269 (1), 140-149.

Page | 108
18. Ochoa-Gómez, J. R.; Gómez-Jiménez-Aberasturi, O.; Maestro-Madurga, B.; Pesquera-
Rodríguez, A.; Ramírez-López, C.; Lorenzo-Ibarreta, L.; Torrecilla-Soria, J.; Villarán-
Velasco, M. C., Synthesis of glycerol carbonate from glycerol and dimethyl carbonate
by transesterification: Catalyst screening and reaction optimization. Applied Catalysis
A: General 2009, 366 (2), 315-324.
19. Wilson, S. T.; Lok, B. M.; Messina, C. A.; Cannan, T. R.; Flanigen, E. M.,
Aluminophosphate Molecular-Sieves - a New Class of Microporous Crystalline
Inorganic Solids. J Am Chem Soc 1982, 104 (4), 1146-1147.
20. Oliver, S.; Kuperman, A.; Ozin, G. A., A New Model for Aluminophosphate Formation:
Transformation of a Linear Chain Aluminophosphate to Chain, Layer, and Framework
Structures. Angewandte Chemie International Edition 1998, 37 (1-2), 46-62.
21. Brill, R.; Debretteville, A. P., On the chemical bond type in AlPO4. Acta
Crystallographica 1955, 8 (9), 567-570.
22. Middel oop, V.; Jacques, . M.; ’Brien, M.; Beale, .; Barnes, P.,
Hydrothermal/autoclave synthesis of AlPO-5: a prototype space/time study of
crystallisation gradients. J Mater Sci 2008, 43 (7), 2222-2228.
23. Wilson, S. T.; Lok, B. M.; Messina, C. A.; Cannan, T. R.; Flanigen, E. M.,
Aluminophosphate molecular sieves: a new class of microporous crystalline inorganic
solids. J Am Chem Soc 1982, 104 (4), 1146-1147.
24. Jones, R. H.; Thomas, J. M.; Chen, J.; Xu, R.; Huo, Q.; Li, S.; Ma, Z.; Chippindale, A. M.,
Structure of an Unusual Aluminium Phosphate ([Al5P6O24H]2- 2[N(C2H5)3H]+ · 2H2O) JDF-
20 with Large Elliptical Apertures. J Solid State Chem 1993, 102 (1), 204-208.
25. Chippindale, A. M.; Turner, C., The Synthesis and Characterization of a One-
Dimensional Aluminophosphate: [C10N2H9] [Al(PO4)(PO2(OH)2)]. J Solid State Chem
1997, 128 (2), 318-322.
26. Chippindale, A. M.; Cowley, A. R., Heteroatom-substituted microporous gallium
phosphates. Microporous and Mesoporous Materials 1998, 21 (4–6), 271-279.
Page | 109
27. Wragg, D. S.; Slawin, A. M. Z.; Morris, R. E., The role of added water in the ionothermal
synthesis of microporous aluminium phosphates. Solid State Sciences 2009, 11 (2),
411-416.
28. Parnham, E. R.; Morris, R. E., The Ionothermal Synthesis of Cobalt Aluminophosphate
Zeolite Frameworks. J Am Chem Soc 2006, 128 (7), 2204-2205.
29. Kannan, C.; Sivakami, K.; Ilavarasi Jeyamalar, J., A simple method for the synthesis of
thermally stable large pore mesoporous aluminophosphate molecular sieves.
Materials Letters 2013, 113 (0), 93-95.
30. Sreenivasulu, P.; Nandan, D.; Kumar, M.; Viswanadham, N., Synthesis and catalytic
applications of hierarchical mesoporous AlPO4/ZnAlPO4 for direct hydroxylation of
benzene to phenol using hydrogen peroxide. Journal of Materials Chemistry A 2013, 1
(10), 3268-3271.
31. Shiju, N. R.; Fiddy, S.; Sonntag, O.; Stockenhuber, M.; Sankar, G., Selective oxidation of
benzene to phenol over FeAlPO catalysts using nitrous oxide as oxidant. Chemical
Communications 2006, (47), 4955-4957.
32. Zhou, L.; Xu, J.; Chen, C.; Wang, F.; Li, X., Synthesis of Fe, Co, and Mn substituted AlPO-
5 molecular sieves and their catalytic activities in the selective oxidation of
cyclohexane. J Porous Mater 2008, 15 (1), 7-12.
33. ChandraKishore, S.; Pandurangan, A., Synthesis and characterization of Y-shaped
carbon nanotubes using Fe/AlPO4 catalyst by CVD. Chemical Engineering Journal 2013,
222 (0), 472-477.
34. Clearfield, A.; Stynes, J. A., The preparation of crystalline zirconium phosphate and
some observations on its ion exchange behaviour. Journal of Inorganic and Nuclear
Chemistry 1964, 26 (1), 117-129.
35. Poojary, D. M.; Shpeizer, B.; Clearfield, A., X-Ray powder structure and Rietveld
refinement of [gamma]-zirconium phosphate, Zr(PO4)(H2PO4)·2H2O. Journal of the
Chemical Society, Dalton Transactions 1995, (1), 111-113.

Page | 110
36. Troup, J. M.; Clearfield, A., Mechanism of ion exchange in zirconium phosphates. 20.
Refinement of the crystal structure of .alpha.-zirconium phosphate. Inorganic
Chemistry 1977, 16 (12), 3311-3314.
37. Trobajo, C.; Khainakov, S. A.; Espina, A.; García, J. R., n the ynthesis of α-Zirconium
Phosphate. Chemistry of Materials 2000, 12 (6), 1787-1790.
38. Sun, L.; Boo, W. J.; Sue, H.-J.; Clearfield, A., Preparation of [small alpha]-zirconium
phosphate nanoplatelets with wide variations in aspect ratios. New Journal of
Chemistry 2007, 31 (1), 39-43.
39. Naik, A. H.; Thakkar, N. V.; Dharwadkar, S. R.; Singh Mudher, K. D.; Venugopal, V.,
Microwave assisted low temperature synthesis of sodium zirconium phosphate
(NaZr2P3O12). J Therm Anal Calorim 2004, 78 (3), 707-713.
40. Burnell, V. A.; Readman, J. E.; Tang, C. C.; Parker, J. E.; Thompson, S. P.; Hriljac, J. A.,
Synthesis and structural characterisation using Rietveld and pair distribution function
analysis of layered mixed titanium-zirconium phosphates. J Solid State Chem 2010, 183
(9), 2196-2204.
41. Clearfield, A.; Frianeza, T. N., On the mechanism of ion exchange in zirconium
phosphates—XXII mixed zirconium titanium phosphates. Journal of Inorganic and
Nuclear Chemistry 1978, 40 (11), 1925-1932.
42. Kapoor, M. P.; Inaga i, .; Yoshida, ., Novel Zirconium−Titanium Phosphates
Mesoporous Materials for Hydrogen Production by Photoinduced Water Splitting. The
Journal of Physical Chemistry B 2005, 109 (19), 9231-9238.
43. Scheetz, B. E.; Agrawal, D. K.; Breval, E.; Roy, R., Sodium zirconium phosphate (NZP) as
a host structure for nuclear waste immobilization: A review. Waste Management
1994, 14 (6), 489-505.
44. Rao, K. N.; Sridhar, A.; Lee, A. F.; Tavener, S. J.; Young, N. A.; Wilson, K., Zirconium
phosphate supported tungsten oxide solid acid catalysts for the esterification of
palmitic acid. Green Chem 2006, 8 (9), 790-797.

Page | 111
45. Aresta, M.; Dibenedetto, A.; Nocito, F.; Ferragina, C., Valorization of bio-glycerol: New
catalytic materials for the synthesis of glycerol carbonate via glycerolysis of urea.
Journal of Catalysis 2009, 268 (1), 106-114.
46. Readman, J. E. The synthesis and Characterisation of some Aluminium Phosphates and
Related Phases. Oxford Univeristy, Pembroke College, Oxford, 1996.
47. Chippindale, A. M.; Walton, R. I., [C9H20N][Al2(HPO4)2(PO4)]: An Aluminium Phosphate
with a New Layer Topology. J Solid State Chem 1999, 145 (2), 731-738.
48. Bond, A. D.; Chippindale, A. M.; Cowley, A. R.; Readman, J. E.; Powell, A. V., Synthesis
and characterisation of transition-metal-substituted gallium phosphates with the
laumontite structure. Zeolites 1997, 19 (5–6), 326-333.
49. AXS, B. DIFFRAC.EVA, 3.0; Bruker: 2012.
50. Nakamoto, K., Infrared Spectra of Inorganic and Coordination Compounds. John Wiley
& Sons, Inc.: USA, 1963.
51. Socrates, G., Infrared and Raman Characterisitc Group Frequencies. 3rd ed.; John Wiley
& Sons Ltd.: Chichester, England, 2001.
52. Visser, J., A fully automatic program for finding the unit cell from powder data. Journal
of Applied Crystallography 1969, 2 (3), 89-95.
53. Altomare, A.; Giacovazzo, C.; Guagliardi, A.; Moliterni, A. G. G.; Rizzi, R.; Werner, P.-E.,
New techniques for indexing: N-TREOR in EXPO. Journal of Applied Crystallography
2000, 33 (4), 1180-1186.
54. Boultif, A.; Louer, D., Indexing of powder diffraction patterns for low-symmetry lattices
by the successive dichotomy method. Journal of Applied Crystallography 1991, 24 (6),
987-993.
55. David, W. I. F.; Shankland, K.; McCusker, L. B.; Baerlocher, C., Structure Determination
from Powder Diffraction Data. Oxford University Press Inc.: United States, 2011.

Page | 112
56. Blake, A. J.; Clegg, W.; Cole, J. M.; Evans, J. S. O.; Main, P.; Parsons, S.; Watkin, D. J.,
Crystal Structure Analysis Principles and Practice. 2nd ed.; Oxford University Press:
Great Britian, 2009.
57. orsley, . E.; Nowell, . V.; tewart, . T., The infrared and Raman spectra of α-
zirconium phosphate. Spectrochimica Acta Part A: Molecular Spectroscopy 1974, 30
(2), 535-541.
58. Dubois, J.-L.; Aresta, M. Synthesis process of polyol carbonate from polyols, conducted
in using a solvent selective for polyols carbonates. EP2174937, 08/10/2008, 2013.
59. Jones, R. H.; Thomas, J. M.; Huo, Q.; Xu, R.; Hursthouse, M. B.; Chen, J., The synthesis
and crystal structure of a novel clay-like gallophosphate with sub-unit-cell
intergrowths of ethylenediamine: [GaPO4(OH)]-0·5(H3NCH2CH2NH3)2+. Journal of the
Chemical Society, Chemical Communications 1991, (21), 1520-1522.
60. Takahara, I.; Saito, M.; Inaba, M.; Murata, K., Dehydration of Ethanol into Ethylene
over Solid Acid Catalysts. Catalysis Letters 2005, 105 (3-4), 249-252.
61. Ravindra Reddy, C.; Nagendrappa, G.; Jai Prakash, B. S., Surface acidity study of Mn+-
montmorillonite clay catalysts by FT-IR spectroscopy: Correlation with esterification
activity. Catalysis Communications 2007, 8 (3), 241-246.
62. Zecchina, A.; Marchese, L.; Bordiga, S.; Pazè, C.; Gianotti, E., Vibrational Spectroscopy
of NH4+ Ions in Zeolitic Materials: n IR tudy. The Journal of Physical Chemistry B
1997, 101 (48), 10128-10135.
63. Armaroli, T.; Busca, G.; Carlini, C.; Giuttari, M.; Raspolli Galletti, A. M.; Sbrana, G., Acid
sites characterization of niobium phosphate catalysts and their activity in fructose
dehydration to 5-hydroxymethyl-2-furaldehyde. Journal of Molecular Catalysis A:
Chemical 2000, 151 (1–2), 233-243.
64. Schrader, G. L.; Cheng, C. P., Laser Raman spectroscopy of cobalt-
molybdenum/.gamma.-aluminum oxide catalysts. Characterization using pyridine
adsorption. The Journal of Physical Chemistry 1983, 87 (19), 3675-3681.

Page | 113
65. Zheng, A.; Liu, S.-B.; Deng, F., Acidity characterization of heterogeneous catalysts by
solid-state NMR spectroscopy using probe molecules. Solid State Nuclear Magnetic
Resonance 2013, 55–56 (0), 12-27.
66. Shannon, R., Revised effective ionic radii and systematic studies of interatomic
distances in halides and chalcogenides. Acta Crystallographica Section A 1976, 32 (5),
751-767.