Embed Size (px)
Citation preview
ECLAC / ILO
The employment situation in Latin America and the CaribbeanOctober 2012
Number 7
2012-848
Foreword
The global economic situation is slowing the region’s economiesFor the labour markets of Latin America and the Caribbean, the first half of 2012 was marked by slow economic growth worldwide and an outlook clouded by uncertainty in the euro zone and the slowdown projected for the United States and China. Economic activity in the region was impacted primarily through the trade channel as demand for export products slid and the terms of trade worsened, if only slightly. The flow of remittances from migrant workers in European countries —especially Spain— was down as well.
Against this backdrop, the region’s economic growth continued to slow and is expected to stand at 3.2% for the year after reaching 6.0% in 2010 and 4.3% in 2011.1 An even sharper slowdown was prevented chiefly by domestic consumption, particularly household consumption on the strength of a labour market boosted by higher employment rates and wages.
The employment rate for the first half of 2012, at 56.0%, was 0.5 percentage points higher than for the same period in 2011. This increase, on top of fairly widespread rises in real labour income, drove household purchasing power up sharply. In many countries, job quality continued to improve thanks to brisk wage employment creation, significant increases in formal employment and a lower underemployment rate.
For now, the labour markets are still on a positive pathWith the labour markets still on relatively sound footing, the labour supply is increasing as women enter the labour markets at a higher rate. As a result, the long-term trend is still towards a gradual narrowing of the participation gap between men and women.
A 0.4 percentage point decrease in the urban unemployment rate between the first half of 2011 and the first half of 2012 was behind the surging employment rate for a group of 10 countries with quarterly data.
ECLAC and ILO project that positive labour market trends will slacken during the second half of the year, which would put the region’s open urban unemployment rate at an average of 6.4% for 2012. This figure is, in any event, substantially lower than the 6.7% posted in 2011.
Barriers to youth labour-market integrationYoung people of both sexes usually face particular barriers to entering the labour market, as can be seen in their high unemployment rates (between 2.3 times and 5.5 times higher than for adults), precarious jobs and low income. There are structural problems, as well, including the high percentage of young women devoted to household tasks (two thirds of the young women who are neither enrolled in school nor have a job). This is indicative of the unresolved issue of redistributing housework among household members so that young men and women
1 See ECLAC (2012).
Contents Foreword ................................ 1
I. Labour-market performance in the first half of 2012 ........ 3
II. Youth employment during the global economic crisis and the subsequent recovery phase .................. 8
III. Decent work for young people: key policy issues and lessons learned in Latin America and the Caribbean .................. 13
Bibliography .......................... 19
Annex 1 ................................. 20 Annex 2 ................................. 24
2 ECLAC/ILONumber 7
can develop professionally. The challenges that young people face in entering the labour market do more than cause problems at the individual and family level. They are a drag on the future social and economic development of the countries and can (as we have seen elsewhere in the world) spark sharp social and political conflict and impact governance. To address this issue, in June 2012 the ILO International Labour Conference launched a broad-based discussion on the matter.2
Young people were hit by the crisis as hard as adults, but they are still staying in school longer
Not only do young people face structural barriers to entering the labour force: the chain of economic crises has often taken a particularly hard toll on them. This happens when they are treated as a secondary labour force in order to adjust employment to fluctuations in aggregate demand and in the labor market. Nevertheless, as seen in section II of The employment situation in Latin America and the Caribbean, the 2008-2009 crisis had a similar impact on young people and adults in terms of labour-market integration. In the aggregate for 13 countries of the region, the youth unemployment rate was 2.9 times the rate for adults
2 See ILO (2012b)
in 2007 and dipped slightly to 2.8 times in 2009. On the upside, the crisis did not halt the trend towards young men and women staying in the education system longer (the percentage of young people attending school rose by 1.4 percentage points between 2007 and 2009), nor did it trigger a jump in the percentage of young people not in employment, education or training (20.4% in 2007; 20.5% in 2009). And efforts to safeguard the progress made towards better job quality for adults and young people alike did not come to a standstill during the crisis.
During the recovery between 2009 and 2011, the unemployment rate dropped slightly more for adults than for young people, and the percentage working in private firms with more than 10 employees recovered more quickly for adults than for young people. The percentage of young people not in employment, education or training fell slightly, from 20.5% to 20.3%. Overall, youth and adult employment rate trends were quite similar between 2007 and 2009 and during the 2009-2011 recovery.
In short, despite the potential threats stemming from the international economic situation and the risk of a deepening crisis in some European countries, the region’s labour indicators (both situational and structural) are sounder than before the 2008-2009 crisis.
2 See ILO (2012b).
Elizabeth Tinoco Assistant Director-General
Regional Director Regional Office for Latin America and the Caribbean
International Labour Organization (ILO)
Alicia BárcenaUnder-Secretary-General of the United Nations
Executive Secretary Economic Commission for Latin America
and the Caribbean (ECLAC)
3The employment situation in Latin America and the Caribbean
IntroductionThe economic upturn in Latin America and the Caribbean after the region pulled through the economic and financial crisis of 2008-2009 had a positive impact on its labour markets. For 2010 and 2011 together, the urban employment rate rose by 1.2 percentage points, pushing the urban unemployment rate down by 1.4 percentage points to stand at 6.7% (the lowest since the early 1990s) despite an increase in the labour-force participation rate that was above the recent trend. Over the two-year period, the absolute number of urban unemployed in Latin America and the Caribbean fell by approximately 2 million people. In addition, the composition of employment returned to its favourable pre-crisis path as wage employment —especially, formal wage employment— climbed.
But economic growth in the countries of the region was already slowing in 2011 (4.3%, down from 6.0% in 2010) and, with some exceptions, the pace slackened further in the first half of 2012. A major factor was the global economic cooldown, which impacted Latin America and the Caribbean chiefly through sagging international trade and falling prices for many of the region’s commodity exports (except food). The international financial markets showed marked volatility, but this
did not worsen the terms of access to external financing for the countries of the region. In this weak external scenario, the region’s economy continued to grow, owing mainly to strong household consumption demand that was boosted, as will be seen below, by labour indicators that were still trending up and an expanding supply of credit. By midyear, growth in some countries was even outpacing projections, fuelled by investment and by exports to the United States, where the modest recovery pushed external demand up, especially for the countries in the northern part of the region. Nevertheless, the pace of economic growth for Latin America and the Caribbean as a whole continued to slow and only expanded by some 3% for the first half of the year.
The first section of this edition of The employment situation in Latin America and the Caribbean examines the impact of this slowdown on labour markets during the first half of 2012. The second section looks at how recent economic crises and recoveries have affected youth labour-market integration, which represents a key challenge in terms of achieving full and productive employment and decent work for all, which is one of the targets set in the framework of the Millennium Development Goals.
A. The main variables
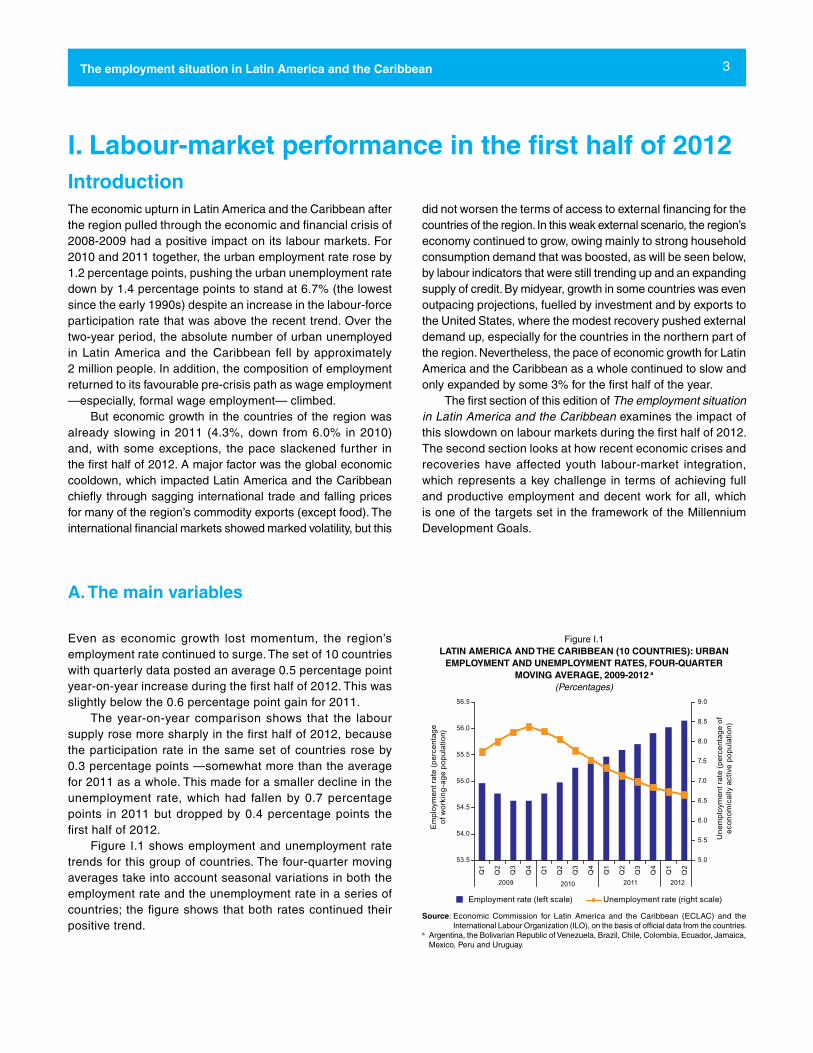
Even as economic growth lost momentum, the region’s employment rate continued to surge. The set of 10 countries with quarterly data posted an average 0.5 percentage point year-on-year increase during the first half of 2012. This was slightly below the 0.6 percentage point gain for 2011.
The year-on-year comparison shows that the labour supply rose more sharply in the first half of 2012, because the participation rate in the same set of countries rose by 0.3 percentage points —somewhat more than the average for 2011 as a whole. This made for a smaller decline in the unemployment rate, which had fallen by 0.7 percentage points in 2011 but dropped by 0.4 percentage points the first half of 2012.
Figure I.1 shows employment and unemployment rate trends for this group of countries. The four-quarter moving averages take into account seasonal variations in both the employment rate and the unemployment rate in a series of countries; the figure shows that both rates continued their positive trend.
Figure I.1LATIN AMERICA AND THE CARIBBEAN (10 COUNTRIES): URBAN
EMPLOYMENT AND UNEMPLOYMENT RATES, FOUR-QUARTER MOVING AVERAGE, 2009-2012 a
(Percentages)
53.5
54.0
54.5
55.0
55.5
56.0
56.5
5.0
5.5
6.0
6.5
7.0
7.5
8.0
8.5
9.0
Em
ploy
men
t rat
e (p
erce
ntag
eof
wor
king
-age
pop
ulat
ion)
Une
mpl
oym
ent r
ate
(per
cent
age
ofec
onom
ical
ly a
ctiv
e po
pula
tion)
Employment rate (left scale) Unemployment rate (right scale)
Q1
Q2
Q3
Q4
Q1
Q2
Q3
Q4
Q1
Q2
Q3
Q4
Q1
Q2
2009 2010 2011 2012
Source: Economic Commission for Latin America and the Caribbean (ECLAC) and the International Labour Organization (ILO), on the basis of official data from the countries.
a Argentina, the Bolivarian Republic of Venezuela, Brazil, Chile, Colombia, Ecuador, Jamaica, Mexico, Peru and Uruguay.
I. Labour-market performance in the first half of 2012
4 ECLAC/ILONumber 7
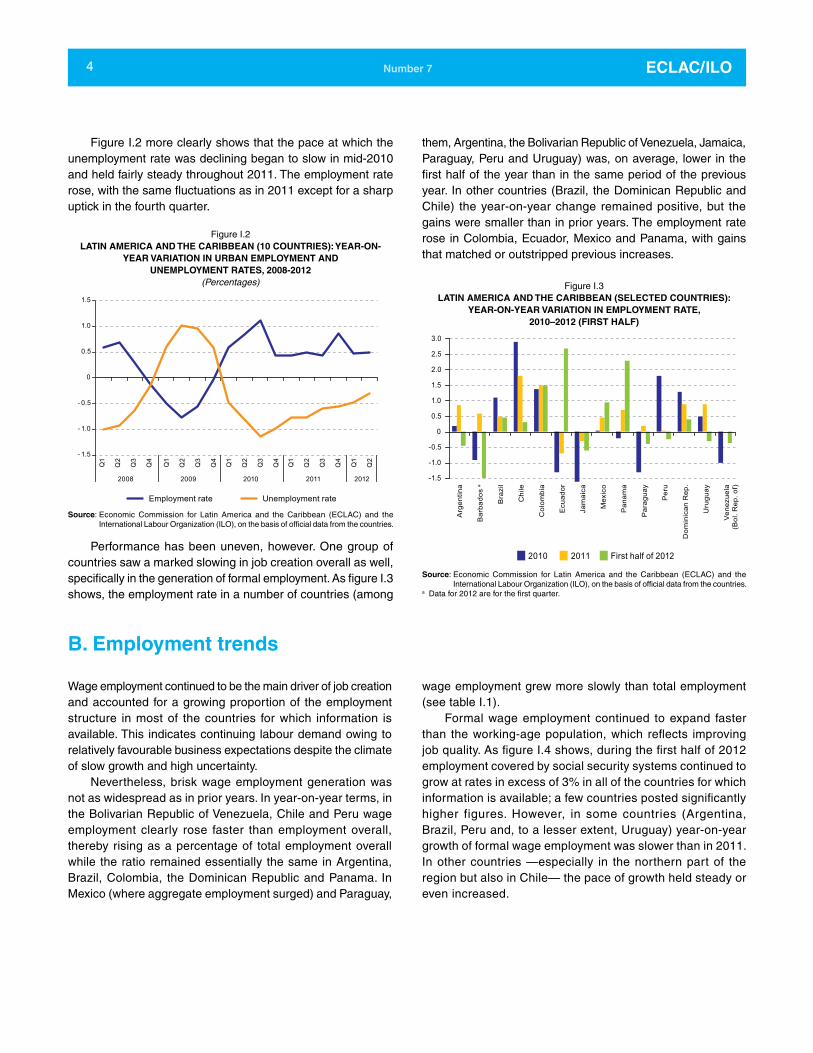
Figure I.2 more clearly shows that the pace at which the unemployment rate was declining began to slow in mid-2010 and held fairly steady throughout 2011. The employment rate rose, with the same fluctuations as in 2011 except for a sharp uptick in the fourth quarter.
Figure I.2LATIN AMERICA AND THE CARIBBEAN (10 COUNTRIES): YEAR-ON-
YEAR VARIATION IN URBAN EMPLOYMENT AND UNEMPLOYMENT RATES, 2008-2012
(Percentages)
- 1.5
- 1.0
- 0.5
0
0.5
1.0
1.5
Employment rate Unemployment rate
Q1
Q2
Q3
Q4
Q1
Q2
Q3
Q4
Q1
Q2
Q3
Q4
Q1
Q2
Q3
Q4
Q1
Q2
2008 2009 2010 2011 2012
Source: Economic Commission for Latin America and the Caribbean (ECLAC) and the International Labour Organization (ILO), on the basis of official data from the countries.
Performance has been uneven, however. One group of countries saw a marked slowing in job creation overall as well, specifically in the generation of formal employment. As figure I.3 shows, the employment rate in a number of countries (among
them, Argentina, the Bolivarian Republic of Venezuela, Jamaica, Paraguay, Peru and Uruguay) was, on average, lower in the first half of the year than in the same period of the previous year. In other countries (Brazil, the Dominican Republic and Chile) the year-on-year change remained positive, but the gains were smaller than in prior years. The employment rate rose in Colombia, Ecuador, Mexico and Panama, with gains that matched or outstripped previous increases.
Figure I.3LATIN AMERICA AND THE CARIBBEAN (SELECTED COUNTRIES):
YEAR-ON-YEAR VARIATION IN EMPLOYMENT RATE, 2010–2012 (FIRST HALF)
-1.5
-1.0
-0.5
0
0.5
1.0
1.5
2.0
2.5
3.0
2010 2011 First half of 2012
Arg
entin
a
Bar
bado
s a
Bra
zil
Chi
le
Col
ombi
a
Ecu
ador
Jam
aica
Mex
ico
Pan
ama
Par
agua
y
Per
u
Dom
inic
an R
ep.
Uru
guay
Ven
ezue
la(B
ol. R
ep. o
f)
Source: Economic Commission for Latin America and the Caribbean (ECLAC) and the International Labour Organization (ILO), on the basis of official data from the countries.
a Data for 2012 are for the first quarter.
B. Employment trends
Wage employment continued to be the main driver of job creation and accounted for a growing proportion of the employment structure in most of the countries for which information is available. This indicates continuing labour demand owing to relatively favourable business expectations despite the climate of slow growth and high uncertainty.
Nevertheless, brisk wage employment generation was not as widespread as in prior years. In year-on-year terms, in the Bolivarian Republic of Venezuela, Chile and Peru wage employment clearly rose faster than employment overall, thereby rising as a percentage of total employment overall while the ratio remained essentially the same in Argentina, Brazil, Colombia, the Dominican Republic and Panama. In Mexico (where aggregate employment surged) and Paraguay,
wage employment grew more slowly than total employment (see table I.1).
Formal wage employment continued to expand faster than the working-age population, which reflects improving job quality. As figure I.4 shows, during the first half of 2012 employment covered by social security systems continued to grow at rates in excess of 3% in all of the countries for which information is available; a few countries posted significantly higher figures. However, in some countries (Argentina, Brazil, Peru and, to a lesser extent, Uruguay) year-on-year growth of formal wage employment was slower than in 2011. In other countries —especially in the northern part of the region but also in Chile— the pace of growth held steady or even increased.

5The employment situation in Latin America and the Caribbean
Figure I.4LATIN AMERICA (SELECTED COUNTRIES) YEAR-ON-YEAR RATES OF
VARIATION IN FORMAL WAGE EMPLOYMENT, FIRST HALF OF 2011-FIRST HALF OF 2012
(Percentages)
Arge
ntin
a a
Braz
il
Chi
le
Cos
ta R
ica
Mex
ico
Nic
arag
ua
Peru
Uru
guay
0
1
2
3
4
5
6
7
8
9
First semester 2011Second semester 2011First semester 2012 b
Source: Economic Commission for Latin America and the Caribbean (ECLAC) and the International Labour Organization (ILO), on the basis of official data from the countries.
a The right bar refers to the first quarter of 2012.b Preliminary data.
The steady improvement in job quality can also be seen in the percentage of employed persons in the category of visible underemployment, that is, the employed who are willing and able to work more hours per week than their current job allows. In six of the nine countries for which information on the first half of 2012 is available (Brazil, Chile, Ecuador, Paraguay, Peru and
Uruguay), the visible underemployment rate was down from the same period in 2011. In Argentina it was virtually unchanged; in Colombia and Mexico it rose slightly.
Employment generation by branch of activity was concentrated in new tertiary-sector jobs. In the few countries for which information is available, long-term trends held as agricultural employment fell as a percentage of total employment. Employment in the manufacturing sector, which had, in recent years, accounted for a substantial proportion of new jobs in the region, also saw generally lower proportions. Productivity gains outpaced wage increases over the past few years (and kept labour costs from rising), so weaker external demand (coupled in some cases with the loss of competitiveness caused by currency appreciation) apparently curbed job creation in the manufacturing industry.
Employment trends in the construction sector were mixed, with several countries reporting an increase in proportion to total employment thanks to strong domestic demand while employment in this sector rose only slightly in other countries.
Branches of activity in the tertiary sector therefore saw the largest increases as a percentage of employment thanks to strong job creation in commerce, restaurants and hotels (Jamaica, Panama and Peru), financial services, real estate and business services (Brazil) and social, community and personal services (Argentina, Bolivarian Republic of Venezuela, Chile and Colombia).
Table I.1LATIN AMERICA (SELECTED COUNTRIES): PROPORTION OF WAGE EMPLOYMENT TO TOTAL EMPLOYMENT,
FIRST SEMESTER 2011 AND FIRST SEMESTER 2012(Percentages)
First half 2011 First half 2012
Argentina Thirty-one urban agglomerations 76.7 76.8Brazil Six metropolitan areas 77.3 77.3 Chile National total 68.5 70.5Colombia National total 42.8 42.8Mexico National total 66.4 66.2Panama National total 67.6 67.5Paraguay Asunción and urban areas of the Central Department 59.6 58.9Peru Lima (metropolitan area) 61.2 62.6Dominican Republic National total 51.7 51.8Venezuela (Bolivarian Republic of) National total 57.6 58.4
Source: Economic Commission for Latin America and the Caribbean (ECLAC) and the International Labour Organization (ILO), on the basis of official data from the countries.
C. Participation, employment and unemployment, by sex
Unemployment among men and women followed similar paths during the economic and financial crisis of 2009 and the subsequent recovery in 2010 and 2011. In 14 countries for which information is available, the simple average urban
unemployment rate rose 1.0 percentage points for men and 0.8 percentage points for women after falling by 0.8 percentage points for both in 2010 and 2011 combined. But behind this similar behaviour are different patterns. As a simple average
6 ECLAC/ILONumber 7
for the same countries, the labour-force participation rate for women increased in both periods (by 0.3 percentage points and 0.4 percentage points, respectively) while the rate for men contracted slightly (falling by 0.2 percentage points and 0.1 percentage points, respectively). The long-term trends thus held, with a steady albeit modest increase in the global labour-force
participation rate and a gradual narrowing of the participation gap between men and women. The male participation rate was hit harder by the 2009 crisis, falling by 0.9 percentage points while the figure for women held steady. During the recovery, the rates for both sexes saw solid increases (0.5 percentage points and 0.7 percentage points, respectively).
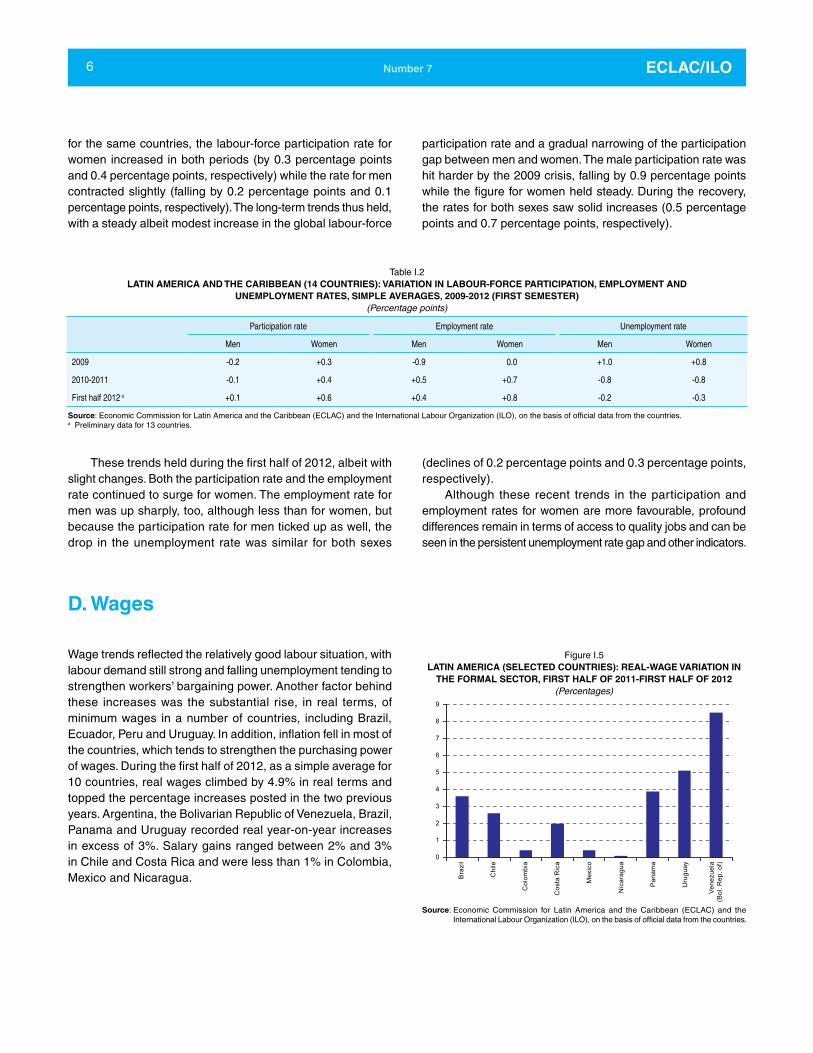
Table I.2LATIN AMERICA AND THE CARIBBEAN (14 COUNTRIES): VARIATION IN LABOUR-FORCE PARTICIPATION, EMPLOYMENT AND
UNEMPLOYMENT RATES, SIMPLE AVERAGES, 2009-2012 (FIRST SEMESTER)(Percentage points)
Participation rate Employment rate Unemployment rate
Men Women Men Women Men Women
2009 -0.2 +0.3 -0.9 0.0 +1.0 +0.8
2010-2011 -0.1 +0.4 +0.5 +0.7 -0.8 -0.8
First half 2012 a +0.1 +0.6 +0.4 +0.8 -0.2 -0.3
Source: Economic Commission for Latin America and the Caribbean (ECLAC) and the International Labour Organization (ILO), on the basis of official data from the countries.a Preliminary data for 13 countries.
These trends held during the first half of 2012, albeit with slight changes. Both the participation rate and the employment rate continued to surge for women. The employment rate for men was up sharply, too, although less than for women, but because the participation rate for men ticked up as well, the drop in the unemployment rate was similar for both sexes
(declines of 0.2 percentage points and 0.3 percentage points, respectively).
Although these recent trends in the participation and employment rates for women are more favourable, profound differences remain in terms of access to quality jobs and can be seen in the persistent unemployment rate gap and other indicators.
D. Wages
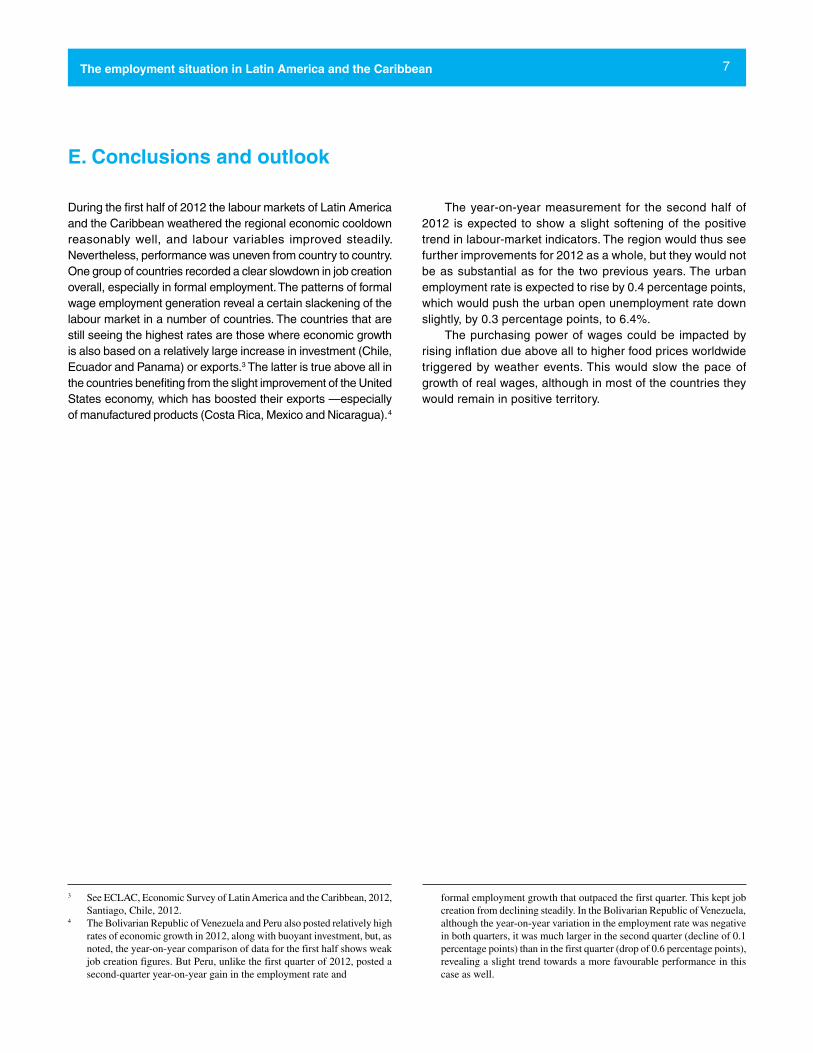
Wage trends reflected the relatively good labour situation, with labour demand still strong and falling unemployment tending to strengthen workers’ bargaining power. Another factor behind these increases was the substantial rise, in real terms, of minimum wages in a number of countries, including Brazil, Ecuador, Peru and Uruguay. In addition, inflation fell in most of the countries, which tends to strengthen the purchasing power of wages. During the first half of 2012, as a simple average for 10 countries, real wages climbed by 4.9% in real terms and topped the percentage increases posted in the two previous years. Argentina, the Bolivarian Republic of Venezuela, Brazil, Panama and Uruguay recorded real year-on-year increases in excess of 3%. Salary gains ranged between 2% and 3% in Chile and Costa Rica and were less than 1% in Colombia, Mexico and Nicaragua.
Figure I.5LATIN AMERICA (SELECTED COUNTRIES): REAL-WAGE VARIATION IN
THE FORMAL SECTOR, FIRST HALF OF 2011-FIRST HALF OF 2012(Percentages)
0
1
2
3
4
5
6
7
8
9
Bra
zil
Chi
le
Col
ombi
a
Cos
ta R
ica
Mex
ico
Nic
arag
ua
Pan
ama
Uru
guay
Vene
zuel
a(B
ol. R
ep. o
f)
Source: Economic Commission for Latin America and the Caribbean (ECLAC) and the International Labour Organization (ILO), on the basis of official data from the countries.
7The employment situation in Latin America and the Caribbean
E. Conclusions and outlook
During the first half of 2012 the labour markets of Latin America and the Caribbean weathered the regional economic cooldown reasonably well, and labour variables improved steadily. Nevertheless, performance was uneven from country to country. One group of countries recorded a clear slowdown in job creation overall, especially in formal employment. The patterns of formal wage employment generation reveal a certain slackening of the labour market in a number of countries. The countries that are still seeing the highest rates are those where economic growth is also based on a relatively large increase in investment (Chile, Ecuador and Panama) or exports.3 The latter is true above all in the countries benefiting from the slight improvement of the United States economy, which has boosted their exports —especially of manufactured products (Costa Rica, Mexico and Nicaragua). 4
3 See ECLAC, Economic Survey of Latin America and the Caribbean, 2012, Santiago, Chile, 2012.
4 The Bolivarian Republic of Venezuela and Peru also posted relatively high rates of economic growth in 2012, along with buoyant investment, but, as noted, the year-on-year comparison of data for the first half shows weak job creation figures. But Peru, unlike the first quarter of 2012, posted a second-quarter year-on-year gain in the employment rate and
The year-on-year measurement for the second half of 2012 is expected to show a slight softening of the positive trend in labour-market indicators. The region would thus see further improvements for 2012 as a whole, but they would not be as substantial as for the two previous years. The urban employment rate is expected to rise by 0.4 percentage points, which would push the urban open unemployment rate down slightly, by 0.3 percentage points, to 6.4%.
The purchasing power of wages could be impacted by rising inflation due above all to higher food prices worldwide triggered by weather events. This would slow the pace of growth of real wages, although in most of the countries they would remain in positive territory.
formal employment growth that outpaced the first quarter. This kept job creation from declining steadily. In the Bolivarian Republic of Venezuela, although the year-on-year variation in the employment rate was negative in both quarters, it was much larger in the second quarter (decline of 0.1 percentage points) than in the first quarter (drop of 0.6 percentage points), revealing a slight trend towards a more favourable performance in this case as well.
8 ECLAC/ILONumber 7
The shortage of decent work —one of the hallmarks of the region’s labour markets— erodes current and future well-being for society as a whole. Young people face specific hurdles as they look for productive employment, and labour indicators (such as income, unemployment and job security) are significantly worse for their group than for adults. Young people are also a heterogeneous group: within each age subcategory, their circumstances vary widely by sex, educational level and socioeconomic, ethnic and geographical background. To a certain extent, deprivation is transferred intergenerationally throughout the life cycle, limiting young people’s employment trajectory and, ultimately, forming a barrier to the sustained development of society. Youth employment is therefore a strategic item on the public policy agenda.5
As well as encountering structural barriers when looking for productive employment, young people are also disadvantaged by the ups and downs of the economy, given that employment opportunities vary considerably over the business cycle. Specifically, young people may be the hardest hit during an economic slowdown or crisis. Companies’ first step may be to stop hiring new staff (at a time when young people are already over-represented among the unemployed) and, should the economic outlook grow bleaker, young people are often the
5 For an analysis of the characteristics of the labour-market participation of young people in Latin America, see International Labour Organization (ILO), Decent Work and Youth in Latin America, Lima 2010. The subject of labour-market participation forms part of a broader analysis of capacity-building, access to opportunities and exposure to risk among young people that is presented in Economic Commission for Latin America and the Caribbean (ECLAC))/Ibero-American Youth Organization (OIJ), Juventud y cohesión social en Iberoamérica: Un modelo para armar (LC/G.2391). Santiago, 2008 [Spanish only].
II. Youth employment during the global economic crisis and the subsequent recovery phase
first to be let go, as the newest and least experienced staff. Furthermore, during a recovery, companies may prefer to hire experienced staff to meet renewed demand for their products and therefore choose more mature adults over young people.
As discussed in previous editions of the bulletin, the region has weathered fairly well the difficult international environment that followed the outbreak of the crisis in late 2008. Although unemployment rose in most countries, the increase was smaller than originally estimated and the trend reversed earlier than expected. Similarly, employment quality deteriorated little and some countries were even able to continue the process of progressive formalization. The region’s economy rallied relatively quickly from the second half of 2009 on, and mechanisms that had helped to substantially improve employment conditions prior to the crisis were reinstated.
Part II of this edition of the bulletin looks at youth employment in Latin America during the recent crisis and the subsequent upturn. It considers whether young people were disproportionately affected and whether youth employment recovered more slowly than the average. The analysis is based on special tabulations of household surveys conducted in 13 countries in 2007, 2009 and 2011 (before, during and after the crisis, respectively).
A. Youth employment and unemployment during the crisis
The consequences of the crisis pushed unemployment up in most countries in the region between 2007 and 2009, although some, such as the Bolivarian Republic of Venezuela, Brazil, Peru and Uruguay, were able to keep their rates constant or even reduce them during this period (see annex 1). Youth unemployment also rose, which should be a cause of particular concern, given that unemployment
among 15- to 24-year-olds prior to the crisis was already between 2.3 and 5.5 times higher than among adults aged 25 and over.
Nevertheless, analysis shows that during the crisis the gap between youth and adult unemployment widened in five economies, but narrowed in eight, including the largest countries: Brazil (where youth unemployment outstripped adult unemployment by a factor of 3.4 in 2007, dropping to 3.2 in 2009) and Mexico (where it edged down from a factor of 2.7 to 2.5). Overall for the 13 countries, the gap narrowed from a factor of 2.9 in 2007 to 2.8 in 2009. The gap in the case of women remained unchanged at 2.8 and in several countries the variations favoured women less than men. As the crisis receded between 2009 and 2011, the overall gap between youth and overall adult unemployment grew in nine countries and shrank in four (see figure II.1).
5 For an analysis of the characteristics of the labour-market participation of young people in Latin America, see International Labour Organization (ILO), Decent Work and Youth in Latin America, Lima 2010. The subject of labour-market participation forms part of a broader analysis of capacity-building, access to opportunities and exposure to risk among young people that is presented in Economic Commission for Latin America and the Caribbean (ECLAC))/Ibero-American Youth Organization (OIJ), Juventud y cohesión social en Iberoamérica: Un modelo para armar (LC/G.2391). Santiago, 2008 [Spanish only].
Introduction
9The employment situation in Latin America and the Caribbean
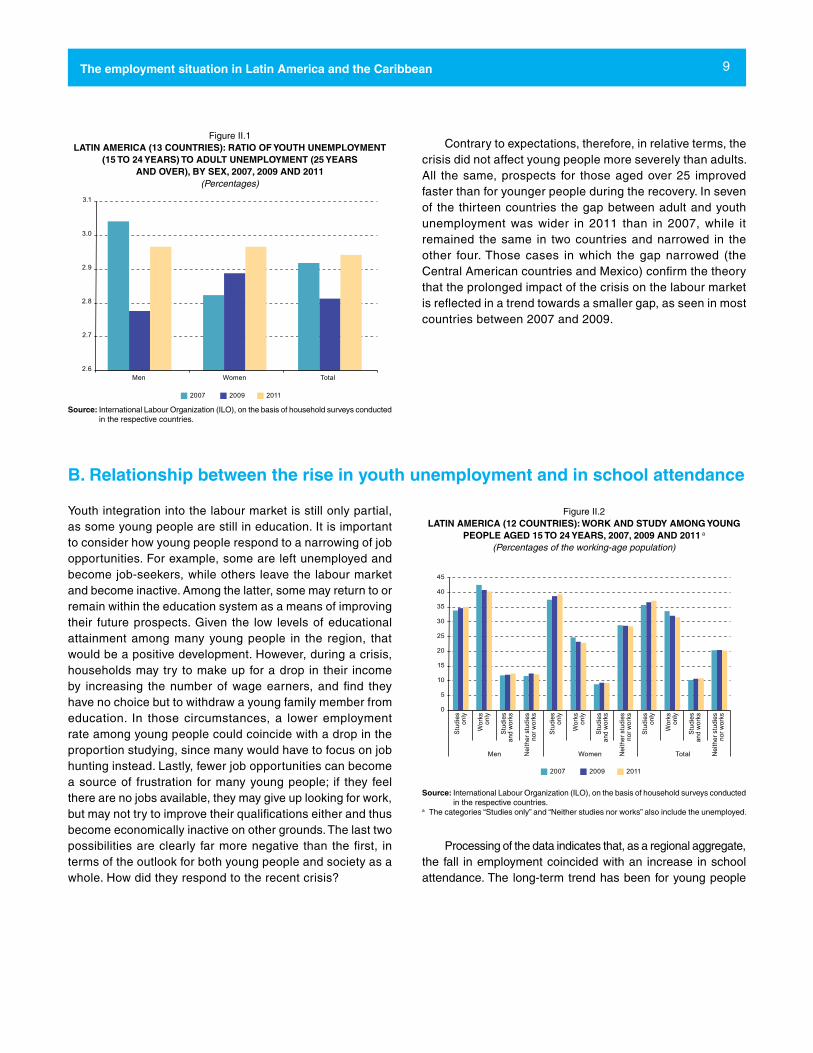
Figure II.1LATIN AMERICA (13 COUNTRIES): RATIO OF YOUTH UNEMPLOYMENT
(15 TO 24 YEARS) TO ADULT UNEMPLOYMENT (25 YEARS AND OVER), BY SEX, 2007, 2009 AND 2011
(Percentages)
2.6
2.7
2.8
2.9
3.0
3.1
Men Women Total
2007 2009 2011
Source: International Labour Organization (ILO), on the basis of household surveys conducted in the respective countries.
Contrary to expectations, therefore, in relative terms, the crisis did not affect young people more severely than adults. All the same, prospects for those aged over 25 improved faster than for younger people during the recovery. In seven of the thirteen countries the gap between adult and youth unemployment was wider in 2011 than in 2007, while it remained the same in two countries and narrowed in the other four. Those cases in which the gap narrowed (the Central American countries and Mexico) confirm the theory that the prolonged impact of the crisis on the labour market is reflected in a trend towards a smaller gap, as seen in most countries between 2007 and 2009.
B. Relationship between the rise in youth unemployment and in school attendance
Youth integration into the labour market is still only partial, as some young people are still in education. It is important to consider how young people respond to a narrowing of job opportunities. For example, some are left unemployed and become job-seekers, while others leave the labour market and become inactive. Among the latter, some may return to or remain within the education system as a means of improving their future prospects. Given the low levels of educational attainment among many young people in the region, that would be a positive development. However, during a crisis, households may try to make up for a drop in their income by increasing the number of wage earners, and find they have no choice but to withdraw a young family member from education. In those circumstances, a lower employment rate among young people could coincide with a drop in the proportion studying, since many would have to focus on job hunting instead. Lastly, fewer job opportunities can become a source of frustration for many young people; if they feel there are no jobs available, they may give up looking for work, but may not try to improve their qualifications either and thus become economically inactive on other grounds. The last two possibilities are clearly far more negative than the first, in terms of the outlook for both young people and society as a whole. How did they respond to the recent crisis?
Figure II.2LATIN AMERICA (12 COUNTRIES): WORK AND STUDY AMONG YOUNG
PEOPLE AGED 15 TO 24 YEARS, 2007, 2009 AND 2011 a
(Percentages of the working-age population)
0
5
10
15
20
25
30
35
40
45
Stud
ies
only
Wor
kson
ly
Stud
ies
and
wor
ks
Nei
ther
stu
dies
nor w
orks
Men Women Total
2007 2009 2011
Stud
ies
only
Wor
kson
ly
Stud
ies
and
wor
ks
Nei
ther
stu
dies
nor w
orks
Stud
ies
only
Wor
kson
ly
Stud
ies
and
wor
ks
Nei
ther
stu
dies
nor w
orks
Source: International Labour Organization (ILO), on the basis of household surveys conducted in the respective countries.
a The categories “Studies only” and “Neither studies nor works” also include the unemployed.
Processing of the data indicates that, as a regional aggregate, the fall in employment coincided with an increase in school attendance. The long-term trend has been for young people
10 ECLAC/ILONumber 7
to spend longer in the education system, and graduate with increasingly higher levels of education, on average, and the data show that nothing has changed in that regard (see figure II.2). The proportion of young people who are not in education, employment or training (including the unemployed) also remained largely unchanged. Thus, during these challenging times for the economy and for employment, a more positive outlook has prevailed among young people and their families in terms of their future job prospects.
Conditional cash transfer programmes that reward young people’s continued education may well have contributed to this outcome (see part III). An analysis by country (see annex 2) confirms that, in countries where youth employment fell, the rate of education rose (with the sole exception of Panama).
At the same time, the proportion of young people who are both working and studying has continued to climb gradually, both during the crisis and during the recovery. On the positive
side, this suggests that the need to earn money did not force them to abandon their studies; moreover, work experience may benefit their employment status and conditions further down the line, since lack of experience tends to be a fundamental hurdle in that regard. On the other hand, a heavy workload tends to affect academic performance, and juggling work and studies could have a negative impact on the future job prospects of these young people, especially when compared with their age-peers who are able to devote themselves exclusively to their studies.
Lastly, the percentage of young people who neither study nor work has risen, but only slightly, in almost every country, and has even fallen in some cases. The only exception is Mexico, where the rate rose by 1.5 percentage points between 2007 and 2009. Generally speaking, there has been no drop in the percentage of young people studying following the economic upturn of 2009-2011, and the long-term trend described above has continued.
C. Young people not in education, employment or training (NEETs) and the impact of gender
As seen in the previous section, the rate of young people who are not in education, employment or training (sometimes referred to as NEETs) varied little during the recent crisis and the subsequent recovery. This is good news, since it means that the squeeze in employment opportunities did not generate excessive frustration, which could have led young people to withdraw en masse from both the education system and the labour market. Yet there is a structural problem that is affecting the employment prospects of a large proportion of young people, especially women. This becomes apparent from an analysis of
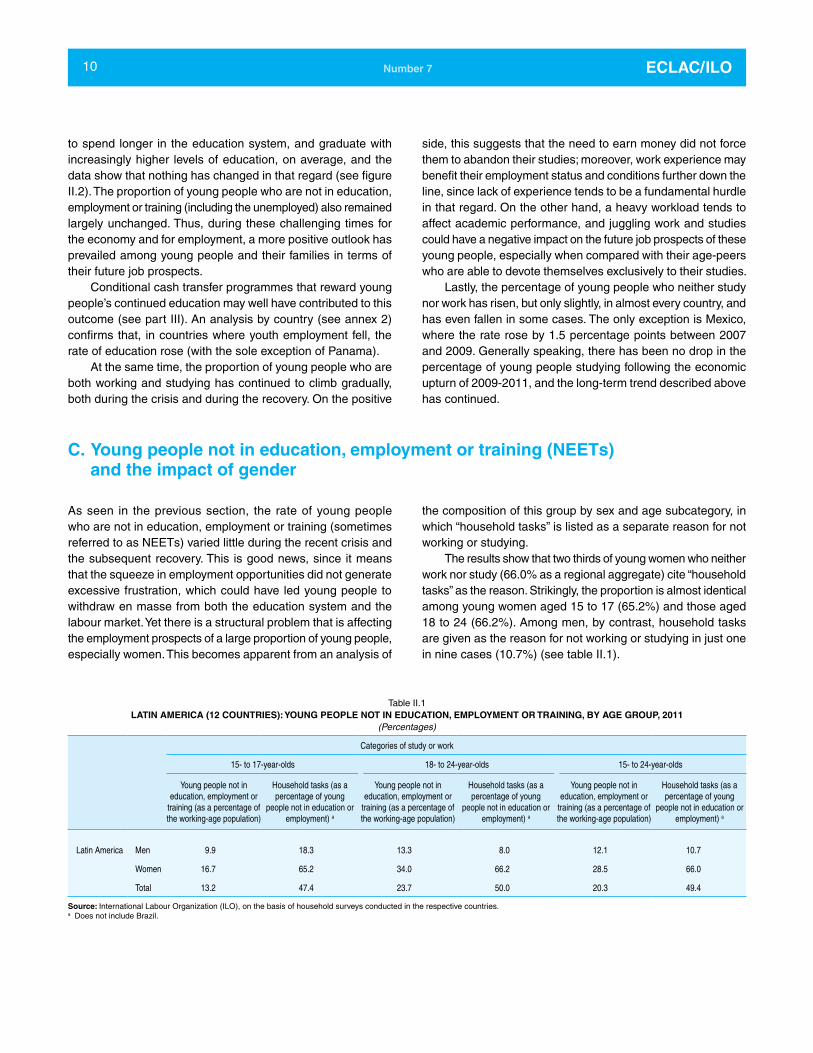
the composition of this group by sex and age subcategory, in which “household tasks” is listed as a separate reason for not working or studying.
The results show that two thirds of young women who neither work nor study (66.0% as a regional aggregate) cite “household tasks” as the reason. Strikingly, the proportion is almost identical among young women aged 15 to 17 (65.2%) and those aged 18 to 24 (66.2%). Among men, by contrast, household tasks are given as the reason for not working or studying in just one in nine cases (10.7%) (see table II.1).
Table II.1LATIN AMERICA (12 COUNTRIES): YOUNG PEOPLE NOT IN EDUCATION, EMPLOYMENT OR TRAINING, BY AGE GROUP, 2011
(Percentages)
Categories of study or work
15- to 17-year-olds 18- to 24-year-olds 15- to 24-year-olds
Young people not in education, employment or
training (as a percentage of the working-age population)
Household tasks (as a percentage of young
people not in education or employment) a
Young people not in education, employment or
training (as a percentage of the working-age population)
Household tasks (as a percentage of young
people not in education or employment) a
Young people not in education, employment or
training (as a percentage of the working-age population)
Household tasks (as a percentage of young
people not in education or employment) a
Latin America Men 9.9 18.3 13.3 8.0 12.1 10.7
Women 16.7 65.2 34.0 66.2 28.5 66.0
Total 13.2 47.4 23.7 50.0 20.3 49.4
Source: International Labour Organization (ILO), on the basis of household surveys conducted in the respective countries. a Does not include Brazil.

11The employment situation in Latin America and the Caribbean
Among young people not in education, employment or training, therefore, two very different situations emerge. On the one hand, the high percentage of young women devoted to household tasks points to a problem that is not just a matter of young people’s job prospects, but has more to do with work and family, and in particular with the distribution of tasks among household members.6
On the other hand, a significant percentage of young men (and young women too, to a lesser degree) do not work, study
6 The proportion of women devoted to household tasks has nevertheless fallen markedly in recent decades.
or perform household tasks. As noted earlier, some of them are looking for work, but others are not engaged in any of these activities. Although many young people find themselves temporarily in this situation, as part of a transition between different employment or educational activities, there is a core group of young people who are excluded (or have excluded themselves, to a certain extent). This calls for a public policy response for the sake of both young people’s own life prospects and social cohesion.
D. The decline and recovery of youth employment in companies with more than 10 workers
Among medium-sized and large companies, economic crises leading to drops in sales of products and services generally result in job cuts. In those circumstances, companies may try to retain their most experienced workers and lay off those with least seniority —who tend to include younger employees. An alternative strategy would be to cut fewer jobs among the highest paid (generally those with more experience) and retain more lower paid workers (primarily younger employees). An analysis of these points and the quality of employment among adults and young people can be conducted on the basis of the tabulated data.
The proportion of young people hired by companies with more than 10 workers in the private sector is higher than the proportion of adults aged 25 and over hired by those firms. This is due to the fact that youth is underrepresented in the public sector and among independent workers. Nevertheless, the share of young people employed by private companies with more than 10 workers fell in most countries in the region in 2007-2009, while no clear trend was seen among adult workers (see figures II.3 and II.4). By contrast, there was no deterioration in the quality of employment, gauged by the existence of a formal labour contract and social security coverage, for adults or young people. However, in several countries in the region, the gap in the quality of employment between young people and adults is vast.
Figure II.3LATIN AMERICA (SELECTED COUNTRIES): PROPORTION OF YOUNG
PEOPLE EMPLOYED BY COMPANIES WITH MORE THAN 10 WORKERS, 2007, 2009 AND 2011 a
(Percentages of total employment)
0
10
20
30
40
50
60
70
80
Latin
Am
eric
a
Arg
entin
a
Bra
zil
Chi
le
Par
agua
y
Uru
guay
Col
ombi
a
Ecu
ador
Per
u
Vene
zuel
a(B
ol. R
ep. o
f)
Cos
ta R
ica
El S
alva
dor
Mex
ico
Pan
ama
2007 2009 2011
Source: International Labour Organization (ILO), on the basis of household countries conducted in the respective countries.
a Young people aged 15 to 24.
Figure II.4LATIN AMERICA (SELECTED COUNTRIES): PROPORTION OF ADULTS
EMPLOYED BY COMPANIES WITH MORE THAN 10 WORKERS, 2007, 2009 AND 2011 a
(Percentages of total employment)
0
10
20
30
40
50
60
Latin
Am
eric
a
Arg
entin
a
Bra
zil
Chi
le
Par
agua
y
Uru
guay
Col
ombi
a
Ecu
ador
Per
u
Vene
zuel
a(B
ol. R
ep. o
f)
Cos
ta R
ica
El S
alva
dor
Mex
ico
Pan
ama
2007 2009 2011
Source: International Labour Organization (ILO), on the basis of household countries conducted in the respective countries.
a Adults aged 25 and over.
6 The proportion of women devoted to household tasks has nevertheless fallen markedly in recent decades.
12 ECLAC/ILONumber 7
During the upturn from 2009 to 2011, jobs in private companies with more than 10 workers rose as a proportion of overall employment for both adults and young people in the large majority of countries.
In 2011, the percentage of young people employed by companies of this size was greater than or equal to the percentage in 2007 in seven countries, while it was lower in six countries.
E. Conclusions
In sum, although the international crisis had a similar impact on young people and those aged 25 and over, the former started out from a less favourable position, with higher unemployment and more precarious working conditions. On a positive note, the downturn in employment prospects did not upset the long-term trend towards spending longer in the education system. However, there remains a significant proportion of young people who are not in education, employment or training —including a striking proportion of young women devoted to household tasks— whose
potential future employability, and indeed life options, will be fraught with difficulties. As to the quality of employment, the proportion of young people employed by private firms with more than 10 workers has fallen, but the proportion of adults over age 25 has not. Among those in wage employment, the available indicators on the existence of a formal labour contract and social security coverage show no deterioration for either group. Since the recovery began, labour-market indicators have been improving for both young people and adults aged 25 and over.
13The employment situation in Latin America and the Caribbean
III. Decent work for young people: key policy issues and lessons learned in Latin America and the Caribbean
which complement the 2005 resolution and, in many cases, make it operational.
During 2005-2012, many of the countries of Latin America and the Caribbean developed policies that promote decent work for young people in order to tackle the challenges associated with youth employment. This considerable experience has shown that there are no simple, comprehensive solutions to the problem, and that sustained action on a variety of fronts is required to redress such complex structural situations. This section examines the principal lines of action and provides some specific examples.
The resolution concerning youth employment adopted by the International Labour Conference in 2005 defined a comprehensive set of policies and programmes for tackling the issue. They ranged from macroeconomic policies and regulatory frameworks for promoting a higher rate of employment growth, to labour market policies and targeted interventions directed at disadvantaged groups of young people. In June 2012, the Conference held a general discussion on the basis of the report “The youth employment crisis: Time for action” and adopted a number of conclusions
A. Growth strategy, macroeconomic policies and youth employment
Creating jobs for the millions of young men and women who enter the labour market each year is essential for building more prosperous economies. Not only is it important to create enough jobs, however; they must be decent jobs.
As the data in this report show, the global financial crisis of 2008-2009 sent youth unemployment rates spiralling up, both in advanced economies and in Latin America and the Caribbean. The countries that best weathered the situation demonstrated the vital role of growth strategies and sound macroeconomic policies for generating productive and sustainable job opportunities.
The policies that have been implemented to tackle the crisis, particularly in Latin America, have been extensively documented and analysed by ECLAC and ILO.7 Many of the countries of Latin America adopted measures designed to mitigate the impact of the crisis by focusing on the workforce in general and, in particular, on the most vulnerable workers, including young people. As the recovery began, many of these measures were adapted to the new scenario.
7 For more information on policies designed to reactivate the economy and protect jobs and people, see ECLAC (2012), ECLAC/ILO (2011) and the ILO Global Job Crisis Observatory [online] (http://www.oit.org.pe/3/).
The past few years have been witness to a diverse set of interventions. At policy level, laws to improve working conditions and access to the labour market for young people were enacted in Colombia, Costa Rica, Honduras, Nicaragua, Peru and Uruguay. In the area of social protection, programmes for hard-to-employ young people and conditional cash transfer programmes to improve school enrolment and retention rates were designed and implemented. As for labour administration policies, public employment programmes have been enhanced and, in many cases, tailored to the young population. This is the case in Argentina, Costa Rica, Honduras, Peru and Uruguay, among others. Some countries, such as Costa Rica, El Salvador, Honduras, Jamaica, Nicaragua, Paraguay and Peru, have adopted or are creating national youth employment action plans. These instruments seek to consolidate national youth employment policies and strategies at the institutional level and coordinate and integrate them better in order to avoid wasting or duplicating efforts.
Introduction
14 ECLAC/ILONumber 7
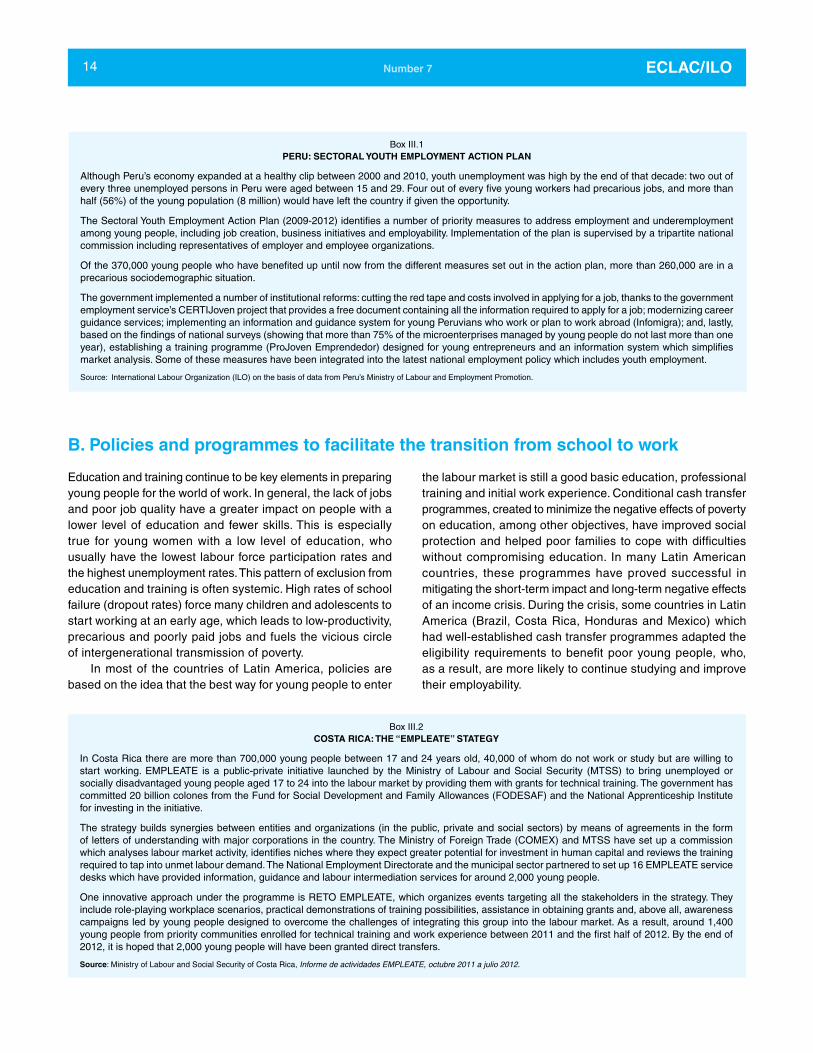
Box III.1PERU: SECTORAL YOUTH EMPLOYMENT ACTION PLAN
Although Peru’s economy expanded at a healthy clip between 2000 and 2010, youth unemployment was high by the end of that decade: two out of every three unemployed persons in Peru were aged between 15 and 29. Four out of every five young workers had precarious jobs, and more than half (56%) of the young population (8 million) would have left the country if given the opportunity.
The Sectoral Youth Employment Action Plan (2009-2012) identifies a number of priority measures to address employment and underemployment among young people, including job creation, business initiatives and employability. Implementation of the plan is supervised by a tripartite national commission including representatives of employer and employee organizations.
Of the 370,000 young people who have benefited up until now from the different measures set out in the action plan, more than 260,000 are in a precarious sociodemographic situation.
The government implemented a number of institutional reforms: cutting the red tape and costs involved in applying for a job, thanks to the government employment service’s CERTIJoven project that provides a free document containing all the information required to apply for a job; modernizing career guidance services; implementing an information and guidance system for young Peruvians who work or plan to work abroad (Infomigra); and, lastly, based on the findings of national surveys (showing that more than 75% of the microenterprises managed by young people do not last more than one year), establishing a training programme (ProJoven Emprendedor) designed for young entrepreneurs and an information system which simplifies market analysis. Some of these measures have been integrated into the latest national employment policy which includes youth employment.
Source: International Labour Organization (ILO) on the basis of data from Peru’s Ministry of Labour and Employment Promotion.
B. Policies and programmes to facilitate the transition from school to work
Education and training continue to be key elements in preparing young people for the world of work. In general, the lack of jobs and poor job quality have a greater impact on people with a lower level of education and fewer skills. This is especially true for young women with a low level of education, who usually have the lowest labour force participation rates and the highest unemployment rates. This pattern of exclusion from education and training is often systemic. High rates of school failure (dropout rates) force many children and adolescents to start working at an early age, which leads to low-productivity, precarious and poorly paid jobs and fuels the vicious circle of intergenerational transmission of poverty.
In most of the countries of Latin America, policies are based on the idea that the best way for young people to enter
the labour market is still a good basic education, professional training and initial work experience. Conditional cash transfer programmes, created to minimize the negative effects of poverty on education, among other objectives, have improved social protection and helped poor families to cope with difficulties without compromising education. In many Latin American countries, these programmes have proved successful in mitigating the short-term impact and long-term negative effects of an income crisis. During the crisis, some countries in Latin America (Brazil, Costa Rica, Honduras and Mexico) which had well-established cash transfer programmes adapted the eligibility requirements to benefit poor young people, who, as a result, are more likely to continue studying and improve their employability.
Box III.2COSTA RICA: THE “EMPLEATE” STATEGY
In Costa Rica there are more than 700,000 young people between 17 and 24 years old, 40,000 of whom do not work or study but are willing to start working. EMPLEATE is a public-private initiative launched by the Ministry of Labour and Social Security (MTSS) to bring unemployed or socially disadvantaged young people aged 17 to 24 into the labour market by providing them with grants for technical training. The government has committed 20 billion colones from the Fund for Social Development and Family Allowances (FODESAF) and the National Apprenticeship Institute for investing in the initiative.
The strategy builds synergies between entities and organizations (in the public, private and social sectors) by means of agreements in the form of letters of understanding with major corporations in the country. The Ministry of Foreign Trade (COMEX) and MTSS have set up a commission which analyses labour market activity, identifies niches where they expect greater potential for investment in human capital and reviews the training required to tap into unmet labour demand. The National Employment Directorate and the municipal sector partnered to set up 16 EMPLEATE service desks which have provided information, guidance and labour intermediation services for around 2,000 young people.
One innovative approach under the programme is RETO EMPLEATE, which organizes events targeting all the stakeholders in the strategy. They include role-playing workplace scenarios, practical demonstrations of training possibilities, assistance in obtaining grants and, above all, awareness campaigns led by young people designed to overcome the challenges of integrating this group into the labour market. As a result, around 1,400 young people from priority communities enrolled for technical training and work experience between 2011 and the first half of 2012. By the end of 2012, it is hoped that 2,000 young people will have been granted direct transfers.
Source: Ministry of Labour and Social Security of Costa Rica, Informe de actividades EMPLEATE, octubre 2011 a julio 2012.
15The employment situation in Latin America and the Caribbean
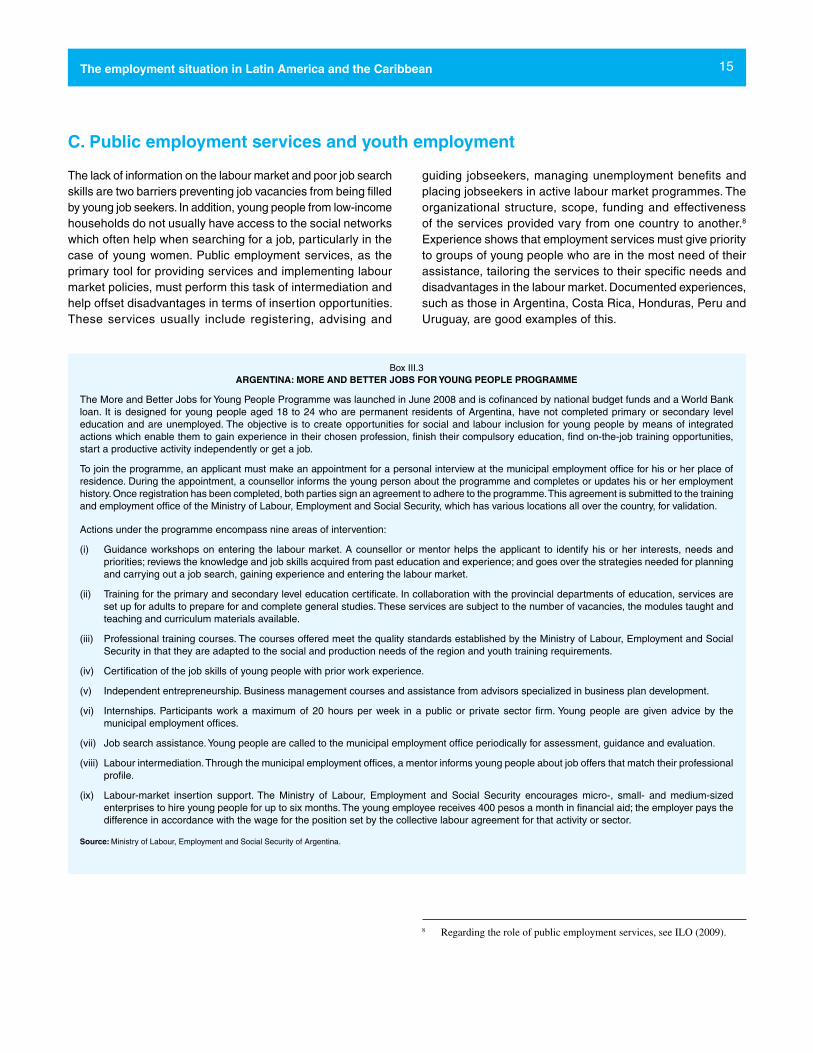
C. Public employment services and youth employment
The lack of information on the labour market and poor job search skills are two barriers preventing job vacancies from being filled by young job seekers. In addition, young people from low-income households do not usually have access to the social networks which often help when searching for a job, particularly in the case of young women. Public employment services, as the primary tool for providing services and implementing labour market policies, must perform this task of intermediation and help offset disadvantages in terms of insertion opportunities. These services usually include registering, advising and
guiding jobseekers, managing unemployment benefits and placing jobseekers in active labour market programmes. The organizational structure, scope, funding and effectiveness of the services provided vary from one country to another.8 Experience shows that employment services must give priority to groups of young people who are in the most need of their assistance, tailoring the services to their specific needs and disadvantages in the labour market. Documented experiences, such as those in Argentina, Costa Rica, Honduras, Peru and Uruguay, are good examples of this.
8 Regarding the role of public employment services, see ILO (2009).
Box III.3ARGENTINA: MORE AND BETTER JOBS FOR YOUNG PEOPLE PROGRAMME
The More and Better Jobs for Young People Programme was launched in June 2008 and is cofinanced by national budget funds and a World Bank loan. It is designed for young people aged 18 to 24 who are permanent residents of Argentina, have not completed primary or secondary level education and are unemployed. The objective is to create opportunities for social and labour inclusion for young people by means of integrated actions which enable them to gain experience in their chosen profession, finish their compulsory education, find on-the-job training opportunities, start a productive activity independently or get a job.
To join the programme, an applicant must make an appointment for a personal interview at the municipal employment office for his or her place of residence. During the appointment, a counsellor informs the young person about the programme and completes or updates his or her employment history. Once registration has been completed, both parties sign an agreement to adhere to the programme. This agreement is submitted to the training and employment office of the Ministry of Labour, Employment and Social Security, which has various locations all over the country, for validation.
Actions under the programme encompass nine areas of intervention:
(i) Guidance workshops on entering the labour market. A counsellor or mentor helps the applicant to identify his or her interests, needs and priorities; reviews the knowledge and job skills acquired from past education and experience; and goes over the strategies needed for planning and carrying out a job search, gaining experience and entering the labour market.
(ii) Training for the primary and secondary level education certificate. In collaboration with the provincial departments of education, services are set up for adults to prepare for and complete general studies. These services are subject to the number of vacancies, the modules taught and teaching and curriculum materials available.
(iii) Professional training courses. The courses offered meet the quality standards established by the Ministry of Labour, Employment and Social Security in that they are adapted to the social and production needs of the region and youth training requirements.
(iv) Certification of the job skills of young people with prior work experience.
(v) Independent entrepreneurship. Business management courses and assistance from advisors specialized in business plan development.
(vi) Internships. Participants work a maximum of 20 hours per week in a public or private sector firm. Young people are given advice by the municipal employment offices.
(vii) Job search assistance. Young people are called to the municipal employment office periodically for assessment, guidance and evaluation.
(viii) Labour intermediation. Through the municipal employment offices, a mentor informs young people about job offers that match their professional profile.
(ix) Labour-market insertion support. The Ministry of Labour, Employment and Social Security encourages micro-, small- and medium-sized enterprises to hire young people for up to six months. The young employee receives 400 pesos a month in financial aid; the employer pays the difference in accordance with the wage for the position set by the collective labour agreement for that activity or sector.
Source: Ministry of Labour, Employment and Social Security of Argentina.
16 ECLAC/ILONumber 7
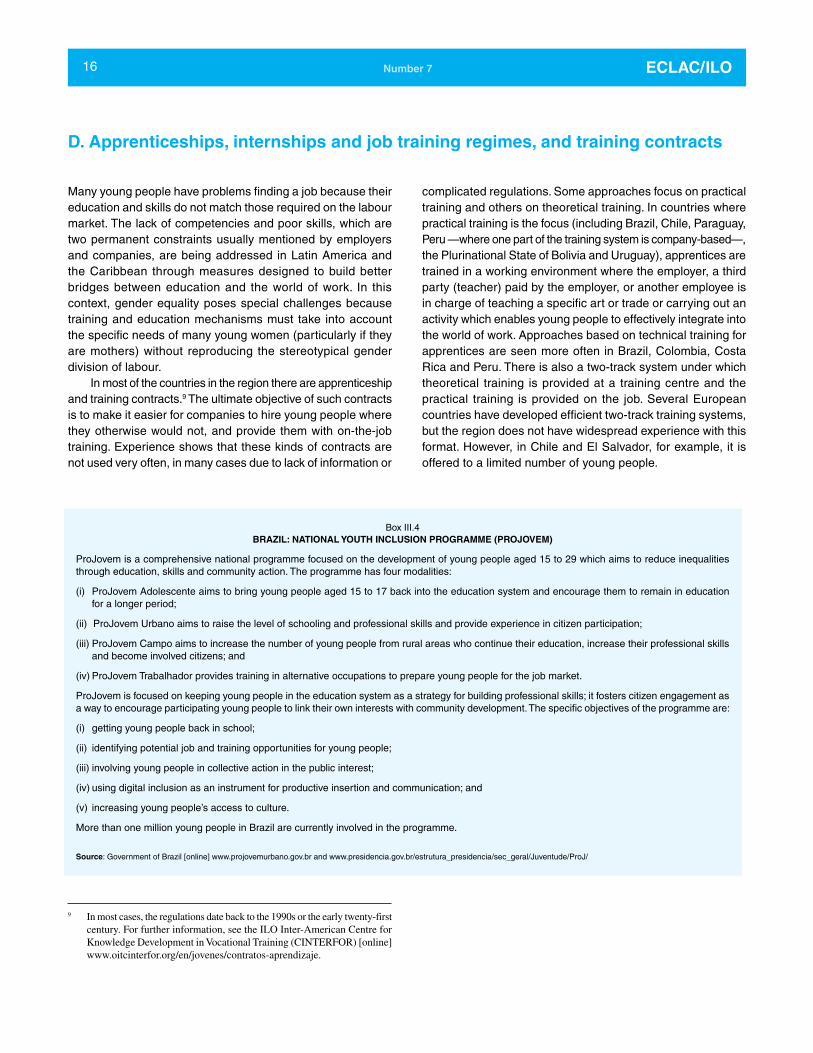
D. Apprenticeships, internships and job training regimes, and training contracts
Many young people have problems finding a job because their education and skills do not match those required on the labour market. The lack of competencies and poor skills, which are two permanent constraints usually mentioned by employers and companies, are being addressed in Latin America and the Caribbean through measures designed to build better bridges between education and the world of work. In this context, gender equality poses special challenges because training and education mechanisms must take into account the specific needs of many young women (particularly if they are mothers) without reproducing the stereotypical gender division of labour.
In most of the countries in the region there are apprenticeship and training contracts.9 The ultimate objective of such contracts is to make it easier for companies to hire young people where they otherwise would not, and provide them with on-the-job training. Experience shows that these kinds of contracts are not used very often, in many cases due to lack of information or
9 In most cases, the regulations date back to the 1990s or the early twenty-first century. For further information, see the ILO Inter-American Centre for Knowledge Development in Vocational Training (CINTERFOR) [online] www.oitcinterfor.org/en/jovenes/contratos-aprendizaje.
complicated regulations. Some approaches focus on practical training and others on theoretical training. In countries where practical training is the focus (including Brazil, Chile, Paraguay, Peru —where one part of the training system is company-based—, the Plurinational State of Bolivia and Uruguay), apprentices are trained in a working environment where the employer, a third party (teacher) paid by the employer, or another employee is in charge of teaching a specific art or trade or carrying out an activity which enables young people to effectively integrate into the world of work. Approaches based on technical training for apprentices are seen more often in Brazil, Colombia, Costa Rica and Peru. There is also a two-track system under which theoretical training is provided at a training centre and the practical training is provided on the job. Several European countries have developed efficient two-track training systems, but the region does not have widespread experience with this format. However, in Chile and El Salvador, for example, it is offered to a limited number of young people.
9 In most cases, the regulations date back to the 1990s or the early twenty-first century. For further information, see the ILO Inter-American Centre for Knowledge Development in Vocational Training (CINTERFOR) [online] www.oitcinterfor.org/en/jovenes/contratos-aprendizaje.
Box III.4BRAZIL: NATIONAL YOUTH INCLUSION PROGRAMME (PROJOVEM)
ProJovem is a comprehensive national programme focused on the development of young people aged 15 to 29 which aims to reduce inequalities through education, skills and community action. The programme has four modalities:
(i) ProJovem Adolescente aims to bring young people aged 15 to 17 back into the education system and encourage them to remain in education for a longer period;
(ii) ProJovem Urbano aims to raise the level of schooling and professional skills and provide experience in citizen participation;
(iii) ProJovem Campo aims to increase the number of young people from rural areas who continue their education, increase their professional skills and become involved citizens; and
(iv) ProJovem Trabalhador provides training in alternative occupations to prepare young people for the job market.
ProJovem is focused on keeping young people in the education system as a strategy for building professional skills; it fosters citizen engagement as a way to encourage participating young people to link their own interests with community development. The specific objectives of the programme are:
(i) getting young people back in school;
(ii) identifying potential job and training opportunities for young people;
(iii) involving young people in collective action in the public interest;
(iv) using digital inclusion as an instrument for productive insertion and communication; and
(v) increasing young people’s access to culture.
More than one million young people in Brazil are currently involved in the programme.
Source: Government of Brazil [online] www.projovemurbano.gov.br and www.presidencia.gov.br/estrutura_presidencia/sec_geral/Juventude/ProJ/

17The employment situation in Latin America and the Caribbean
E. Youth entrepreneurship and self-employment
Box III.5MEXICO: THE YOUNG ENTREPRENEURS MODEL
According to a survey on how young people perceive the labour market conducted by the ILO Office for Mexico and Cuba in July 2012, the young people surveyed reported that lack of work experience is the principal reason for not having a decent job. Indeed, 81% said that they believe that the government could do more to help them find a job or set up their own business in the future. Survey participants reported that the principal obstacles to starting a business include lack of capital (29%), followed by the lack of information and the right advice (19% and 11%, respectively).
The Young Entrepreneurs Model is an initiative of the Ministry of the Economy designed to encourage entrepreneurship among young people through a programme which provides them with the tools required to develop skills, attitudes and values associated with business life. It focuses on meeting the requirements and needs identified by the young people and gives them the opportunity to develop and follow through on a business plan based on their innovative ideas. The initiative conducts workshops and provides creative tools such as a CD set with videos, success stories, videoconferences and workshops offered in most of the states in the country. Workshop content is highly relevant because the workshops were designed by high-level educational institutions.
To date, 178 transfers have been made and 2,345 workshops have provided training for 82,600 young entrepreneurs. Some of the factors which have contributed to the success of this programme include cooperation with technical and higher education institutions to identify potential participants, ideas for developing business plans and additional training opportunities; the participation of the local private sector in advising new businesses owners; and the Mexico Emprende centres which provide other services linked with the Secretariat of Economy.
Source: International Labour Organization, ILO Office for Mexico and Cuba.
An array of public- and private-sector actions seek to promote entrepreneurship among young people and to help them overcome barriers to starting their own business, such as insufficient access to financing and the lack of physical capital. There is a wealth of experience in the region involving public or
private backing for youth business training courses, campaigns designed to change social and cultural attitudes regarding youth entrepreneurship, improved access to financing, mentoring, business support services and an improved regulatory and administrative environment.
F. Wage subsidies and youth employment
Box III.6CHILE: LAW 20338 ON YOUTH EMPLOYMENT SUBSIDIES
Under the law that created youth employment subsidies, enacted on 25 March 2009, dependent workers must, in order to be eligible, be covered by the Labour Code, be between 18 and 25 years of age, be part of a family in the poorest 40% of the population of Chile and have a gross annual income of less than 4,320,000 pesos during the calendar year in which the subsidy is paid (360,000 pesos per month, equivalent to about US$ 653). Self-employed workers must, in addition to meeting the aforementioned age and family group requirements, prove that their gross annual income is less than 4,320,000 pesos (approximately US$ 7,720 dollars), meet other requirements set out in the income tax law and be up-to-date with their compulsory pension and health contributions.
This initiative, which is part of the fiscal stimulus package implemented in 2009, provides a benefit equivalent to 30% of gross annual income. Twenty per cent is given directly to the employee; 10% goes to the employer for hiring the young person, up to 576,000 pesos per year. The subsidy decreases gradually, down to zero if gross annual income exceeds 4,320,000 pesos. To qualify for the subsidy, the employer must have paid the employee’s social security contributions on time.
Beneficiaries must have successfully completed secondary level education and be formally employed or self-employed. To encourage young people to stay in school, the subsidy payment period may be extended if the beneficiary is studying. The add-on period is equivalent to the length of the additional schooling and applies exclusively to employees under 27 years of age.
Source: Economic Commission for Latin America and the Caribbean (ECLAC) on the basis of law number 20338.
The demand for young workers can be increased by means of properly designed wage subsidies or reduced social security contributions. Wage subsidies make it easier for young workers to enter the labour market and, during economic recessions,
could help to mitigate both the impact on employment and the devaluation of workforce skills. For this reason, wage subsidy initiatives in some countries have targeted young people (see box III.6).

18 ECLAC/ILONumber 7
Social dialogue is, above all, a fundamental principal of democracy. It protects the right of different stakeholder groups to express their views on public policies which affect their interests and ensures that their opinions are seriously taken into consideration when public policies are developed and implemented. Social dialogue can take the form of negotiation, consultations or the simple exchange of information between government representatives, employers and employees in relation to issues of common interest. Before the 101st session of the International Labour Conference, ILO held a number of national consultation forums with youth organizations during which the issue of youth employment was discussed. In Latin America, 12 national forums were held and served as a meeting point between young people and members of ILO.10
10 National forums on youth employment were held in Argentina, Brazil, Chile, Colombia, Costa Rica, El Salvador, Honduras, Mexico, Peru, Trinidad and Tobago and Uruguay. Fort the conclusions drawn by these forums, see ILO (2012d).
Overall, wage subsidies have had a positive impact on youth employment in advanced and emerging economies alike. Evaluations of wage subsidies that are available show that this type of aid is very effective when it is designed to address specific disadvantages for young people in the labour market and is time-limited (ILO, 2012b). Untargeted subsidies usually
generate labour-market distortions in the form of inertia and substitution effects because the length of employment is restricted to the duration of support. Evaluation findings also highlight the advantages of combining subsidies with on-the-job training programmes and other measures as part of comprehensive service packages designed for young workers.
G. Social dialogue and youth participation
The past few years have brought very interesting new developments in Latin America and the Caribbean which combine social dialogue with youth participation. For example, in Peru, young people who are representatives of organizations are taking part in the Youth Employment Board created by the highest tripartite authority, the National Labour and Employment Promotion Council. In Costa Rica, El Salvador, Nicaragua and Paraguay, young people are actively participating in discussions on national youth employment plans; in Uruguay they played an important role in national dialogues which resulted in agreements on promoting decent work for young people.
H. Conclusions
Young people find it difficult to enter the labour market even during periods of economic growth. The global financial crisis has made the problem of entering the labour market and obtaining a decent job for this group even worse. In Latin America, however, young people have not been been affected disproportionately. In any event, unless policies are implemented to maintain the number and quality of jobs for young people, young workers may have to wait to reap the benefits of economic recovery. Obviously, supply-side measures will be effective once the economy increases labour demand.
There is no one single formula or solution. The political response to the problem of youth employment will depend on the nature and seriousness of the crisis in each country. Governments and social partners are in the best position to identify the most feasible national policy options which may improve the outcome of youth employment efforts once the economic recovery has gathered momentum. An important message for policymakers in all countries is that the policy options must be part of an integrated framework for promoting economic and employment recovery.
19The employment situation in Latin America and the Caribbean
Bibliography
ECLAC (Economic Commission for Latin America and the Caribbean) (2012), Economic Survey of Latin America and the Caribbean, 2012 (LC/G.2546), Santiago, Chile.
ECLAC/ILO (Economic Commission for Latin America and the Caribbean/International Labour Organization) (2011), The Employment Situation in Latin America and the Caribbean, ECLAC/ILO Bulletin, No. 5, Santiago, Chile.
ILO (International Labour Organization) (2012a), Global Employment Trends for Youth 2012, Geneva, May.
(2012b), The Youth Employment Crisis: Time for Action (ILC.101/V), Geneva.
(2012c), Resolution The youth employment crisis: A call for action, 101st Session of the International Labour Conference, Geneva [online] http://www.ilo.org/wcmsp5/groups/
public/---ed_norm/---relconf/documents/meetingdocument/wcms_187080.pdf.
(2012d), Los jóvenes hablan: Foros nacionales de empleo juvenil en América Latina y el Caribe [online] http://www.ilo.org/public/libdoc/ilo/2012/112B09_92_span.pdf.
(2011), Policy Options to Support Young Workers During Economic Recovery. Policy Brief, 14 February [online] http://www.ilo.org/wcmsp5/groups/public/---ed_emp/documents/publication/wcms_151459.pdf.
(2010), Decent Work and Youth in Latin America, 2010, Lima, Regional Office for Latin America and the Caribbean.
(2009), ILO Support for the Role of Public Employment Services in the Labour Market (GB.306/ESP/3/2), Geneva, Governing Body, November.
20 ECLAC/ILONumber 7
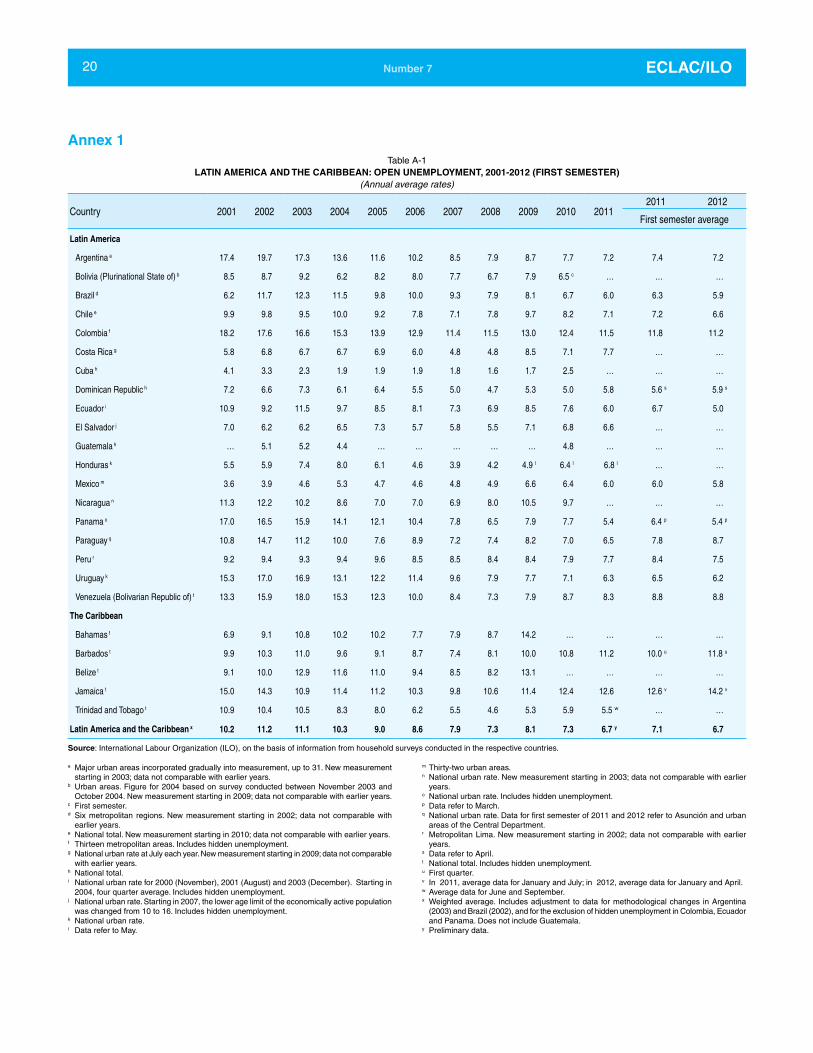
Table A-1LATIN AMERICA AND THE CARIBBEAN: OPEN UNEMPLOYMENT, 2001-2012 (FIRST SEMESTER)
(Annual average rates)
Country 2001 2002 2003 2004 2005 2006 2007 2008 2009 2010 20112011 2012
First semester average
Latin America
Argentina a 17.4 19.7 17.3 13.6 11.6 10.2 8.5 7.9 8.7 7.7 7.2 7.4 7.2
Bolivia (Plurinational State of) b 8.5 8.7 9.2 6.2 8.2 8.0 7.7 6.7 7.9 6.5 c … … …
Brazil d 6.2 11.7 12.3 11.5 9.8 10.0 9.3 7.9 8.1 6.7 6.0 6.3 5.9
Chile e 9.9 9.8 9.5 10.0 9.2 7.8 7.1 7.8 9.7 8.2 7.1 7.2 6.6
Colombia f 18.2 17.6 16.6 15.3 13.9 12.9 11.4 11.5 13.0 12.4 11.5 11.8 11.2
Costa Rica g 5.8 6.8 6.7 6.7 6.9 6.0 4.8 4.8 8.5 7.1 7.7 … …
Cuba h 4.1 3.3 2.3 1.9 1.9 1.9 1.8 1.6 1.7 2.5 … … …
Dominican Republic h 7.2 6.6 7.3 6.1 6.4 5.5 5.0 4.7 5.3 5.0 5.8 5.6 s 5.9 s
Ecuador i 10.9 9.2 11.5 9.7 8.5 8.1 7.3 6.9 8.5 7.6 6.0 6.7 5.0
El Salvador j 7.0 6.2 6.2 6.5 7.3 5.7 5.8 5.5 7.1 6.8 6.6 … …
Guatemala k … 5.1 5.2 4.4 … … … … … 4.8 … … …
Honduras k 5.5 5.9 7.4 8.0 6.1 4.6 3.9 4.2 4.9 l 6.4 l 6.8 l … …
Mexico m 3.6 3.9 4.6 5.3 4.7 4.6 4.8 4.9 6.6 6.4 6.0 6.0 5.8
Nicaragua n 11.3 12.2 10.2 8.6 7.0 7.0 6.9 8.0 10.5 9.7 … … …
Panama o 17.0 16.5 15.9 14.1 12.1 10.4 7.8 6.5 7.9 7.7 5.4 6.4 p 5.4 p
Paraguay q 10.8 14.7 11.2 10.0 7.6 8.9 7.2 7.4 8.2 7.0 6.5 7.8 8.7
Peru r 9.2 9.4 9.3 9.4 9.6 8.5 8.5 8.4 8.4 7.9 7.7 8.4 7.5
Uruguay k 15.3 17.0 16.9 13.1 12.2 11.4 9.6 7.9 7.7 7.1 6.3 6.5 6.2
Venezuela (Bolivarian Republic of) t 13.3 15.9 18.0 15.3 12.3 10.0 8.4 7.3 7.9 8.7 8.3 8.8 8.8
The Caribbean
Bahamas t 6.9 9.1 10.8 10.2 10.2 7.7 7.9 8.7 14.2 … … … …
Barbados t 9.9 10.3 11.0 9.6 9.1 8.7 7.4 8.1 10.0 10.8 11.2 10.0 u 11.8 u
Belize t 9.1 10.0 12.9 11.6 11.0 9.4 8.5 8.2 13.1 … … … …
Jamaica t 15.0 14.3 10.9 11.4 11.2 10.3 9.8 10.6 11.4 12.4 12.6 12.6 v 14.2 v
Trinidad and Tobago t 10.9 10.4 10.5 8.3 8.0 6.2 5.5 4.6 5.3 5.9 5.5 w … …
Latin America and the Caribbean x 10.2 11.2 11.1 10.3 9.0 8.6 7.9 7.3 8.1 7.3 6.7 y 7.1 6.7
Source: International Labour Organization (ILO), on the basis of information from household surveys conducted in the respective countries.
Annex 1
a Major urban areas incorporated gradually into measurement, up to 31. New measurement starting in 2003; data not comparable with earlier years.
b Urban areas. Figure for 2004 based on survey conducted between November 2003 and October 2004. New measurement starting in 2009; data not comparable with earlier years.
c First semester.d Six metropolitan regions. New measurement starting in 2002; data not comparable with
earlier years.e National total. New measurement starting in 2010; data not comparable with earlier years.f Thirteen metropolitan areas. Includes hidden unemployment.g National urban rate at July each year. New measurement starting in 2009; data not comparable
with earlier years.h National total. i National urban rate for 2000 (November), 2001 (August) and 2003 (December). Starting in
2004, four quarter average. Includes hidden unemployment.j National urban rate. Starting in 2007, the lower age limit of the economically active population
was changed from 10 to 16. Includes hidden unemployment.k National urban rate.i Data refer to May.
m Thirty-two urban areas.n National urban rate. New measurement starting in 2003; data not comparable with earlier
years.o National urban rate. Includes hidden unemployment.p Data refer to March.q National urban rate. Data for first semester of 2011 and 2012 refer to Asunción and urban
areas of the Central Department.r Metropolitan Lima. New measurement starting in 2002; data not comparable with earlier
years.s Data refer to April.t National total. Includes hidden unemployment.u First quarter.v In 2011, average data for January and July; in 2012, average data for January and April.w Average data for June and September.x Weighted average. Includes adjustment to data for methodological changes in Argentina
(2003) and Brazil (2002), and for the exclusion of hidden unemployment in Colombia, Ecuador and Panama. Does not include Guatemala.
y Preliminary data.
21The employment situation in Latin America and the Caribbean
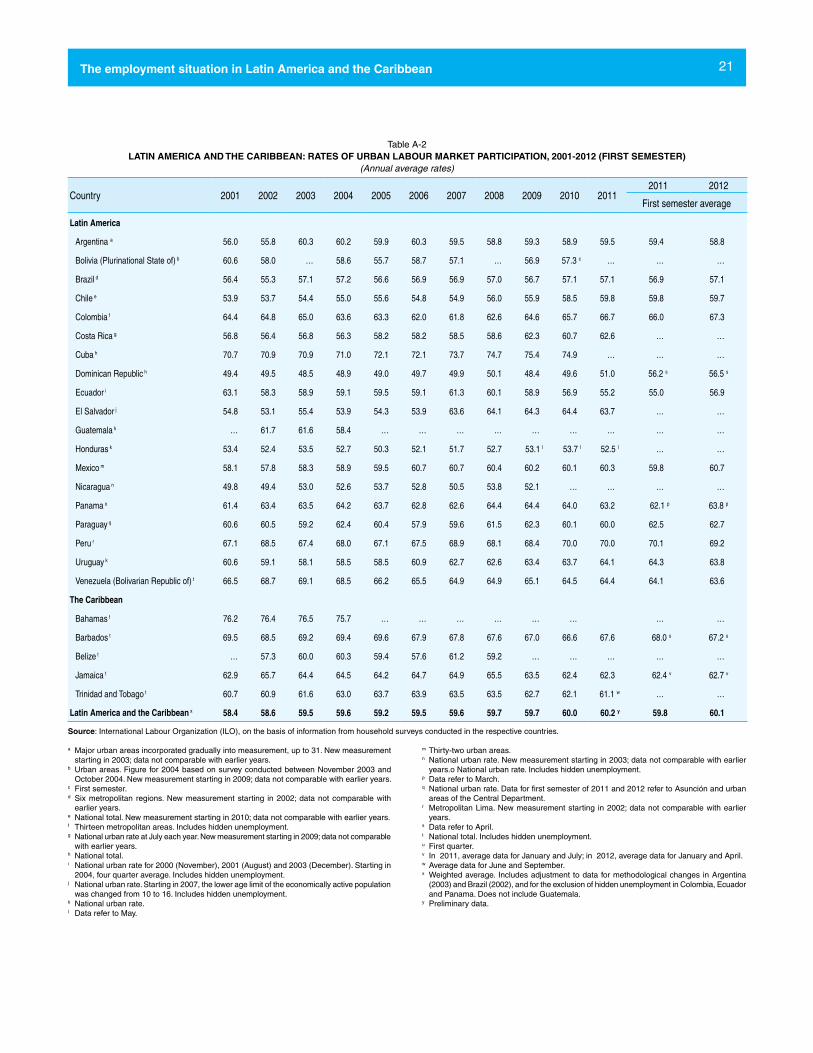
Table A-2LATIN AMERICA AND THE CARIBBEAN: RATES OF URBAN LABOUR MARKET PARTICIPATION, 2001-2012 (FIRST SEMESTER)
(Annual average rates)
Country 2001 2002 2003 2004 2005 2006 2007 2008 2009 2010 20112011 2012
First semester average
Latin America
Argentina a 56.0 55.8 60.3 60.2 59.9 60.3 59.5 58.8 59.3 58.9 59.5 59.4 58.8
Bolivia (Plurinational State of) b 60.6 58.0 … 58.6 55.7 58.7 57.1 … 56.9 57.3 c … … …
Brazil d 56.4 55.3 57.1 57.2 56.6 56.9 56.9 57.0 56.7 57.1 57.1 56.9 57.1
Chile e 53.9 53.7 54.4 55.0 55.6 54.8 54.9 56.0 55.9 58.5 59.8 59.8 59.7
Colombia f 64.4 64.8 65.0 63.6 63.3 62.0 61.8 62.6 64.6 65.7 66.7 66.0 67.3
Costa Rica g 56.8 56.4 56.8 56.3 58.2 58.2 58.5 58.6 62.3 60.7 62.6 … …
Cuba h 70.7 70.9 70.9 71.0 72.1 72.1 73.7 74.7 75.4 74.9 … … …
Dominican Republic h 49.4 49.5 48.5 48.9 49.0 49.7 49.9 50.1 48.4 49.6 51.0 56.2 s 56.5 s
Ecuador i 63.1 58.3 58.9 59.1 59.5 59.1 61.3 60.1 58.9 56.9 55.2 55.0 56.9
El Salvador j 54.8 53.1 55.4 53.9 54.3 53.9 63.6 64.1 64.3 64.4 63.7 … …
Guatemala k … 61.7 61.6 58.4 … … … … … … … … …
Honduras k 53.4 52.4 53.5 52.7 50.3 52.1 51.7 52.7 53.1 l 53.7 l 52.5 l … …
Mexico m 58.1 57.8 58.3 58.9 59.5 60.7 60.7 60.4 60.2 60.1 60.3 59.8 60.7
Nicaragua n 49.8 49.4 53.0 52.6 53.7 52.8 50.5 53.8 52.1 … … … …
Panama o 61.4 63.4 63.5 64.2 63.7 62.8 62.6 64.4 64.4 64.0 63.2 62.1 p 63.8 p
Paraguay q 60.6 60.5 59.2 62.4 60.4 57.9 59.6 61.5 62.3 60.1 60.0 62.5 62.7
Peru r 67.1 68.5 67.4 68.0 67.1 67.5 68.9 68.1 68.4 70.0 70.0 70.1 69.2
Uruguay k 60.6 59.1 58.1 58.5 58.5 60.9 62.7 62.6 63.4 63.7 64.1 64.3 63.8
Venezuela (Bolivarian Republic of) t 66.5 68.7 69.1 68.5 66.2 65.5 64.9 64.9 65.1 64.5 64.4 64.1 63.6
The Caribbean
Bahamas t 76.2 76.4 76.5 75.7 … … … … … … … …
Barbados t 69.5 68.5 69.2 69.4 69.6 67.9 67.8 67.6 67.0 66.6 67.6 68.0 u 67.2 u
Belize t … 57.3 60.0 60.3 59.4 57.6 61.2 59.2 … … … … …
Jamaica t 62.9 65.7 64.4 64.5 64.2 64.7 64.9 65.5 63.5 62.4 62.3 62.4 v 62.7 v
Trinidad and Tobago t 60.7 60.9 61.6 63.0 63.7 63.9 63.5 63.5 62.7 62.1 61.1 w … …
Latin America and the Caribbean x 58.4 58.6 59.5 59.6 59.2 59.5 59.6 59.7 59.7 60.0 60.2 y 59.8 60.1
Source: International Labour Organization (ILO), on the basis of information from household surveys conducted in the respective countries.
a Major urban areas incorporated gradually into measurement, up to 31. New measurement starting in 2003; data not comparable with earlier years.
b Urban areas. Figure for 2004 based on survey conducted between November 2003 and October 2004. New measurement starting in 2009; data not comparable with earlier years.
c First semester.d Six metropolitan regions. New measurement starting in 2002; data not comparable with
earlier years.e National total. New measurement starting in 2010; data not comparable with earlier years.f Thirteen metropolitan areas. Includes hidden unemployment.g National urban rate at July each year. New measurement starting in 2009; data not comparable
with earlier years.h National total. i National urban rate for 2000 (November), 2001 (August) and 2003 (December). Starting in
2004, four quarter average. Includes hidden unemployment.j National urban rate. Starting in 2007, the lower age limit of the economically active population
was changed from 10 to 16. Includes hidden unemployment.k National urban rate.l Data refer to May.
m Thirty-two urban areas.n National urban rate. New measurement starting in 2003; data not comparable with earlier
years.o National urban rate. Includes hidden unemployment.p Data refer to March.q National urban rate. Data for first semester of 2011 and 2012 refer to Asunción and urban
areas of the Central Department.r Metropolitan Lima. New measurement starting in 2002; data not comparable with earlier
years.s Data refer to April.t National total. Includes hidden unemployment.u First quarter.v In 2011, average data for January and July; in 2012, average data for January and April.w Average data for June and September.x Weighted average. Includes adjustment to data for methodological changes in Argentina
(2003) and Brazil (2002), and for the exclusion of hidden unemployment in Colombia, Ecuador and Panama. Does not include Guatemala.
y Preliminary data.
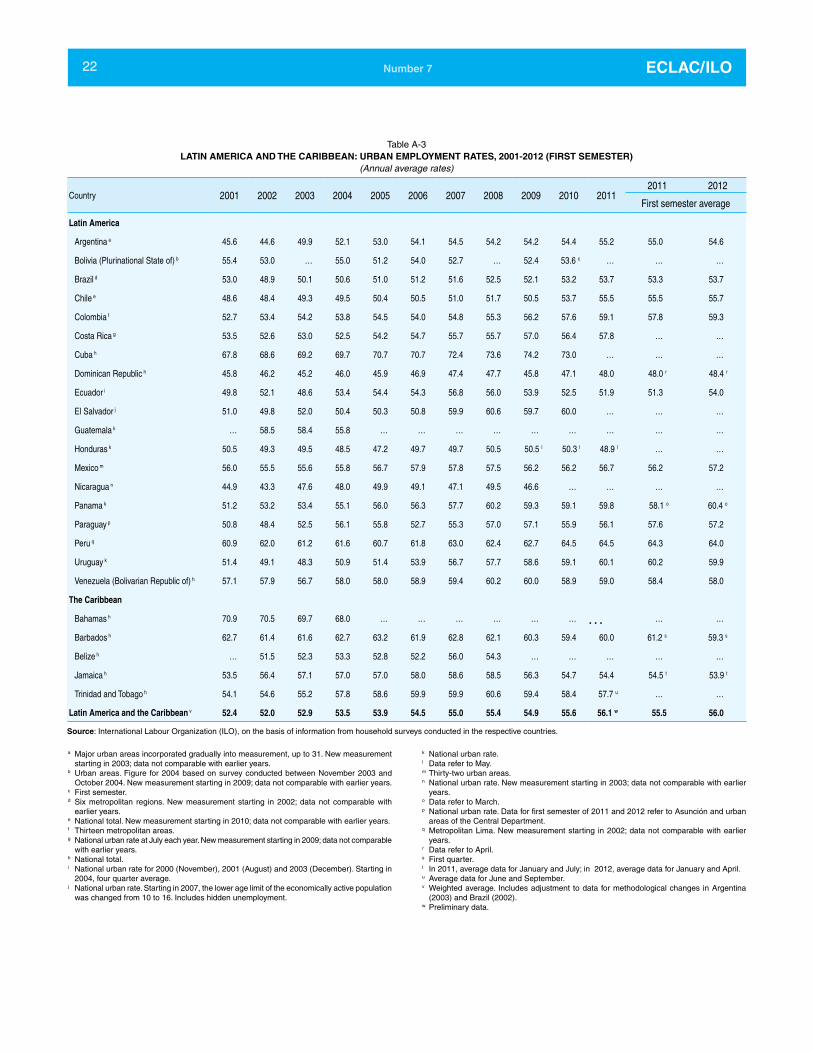
22 ECLAC/ILONumber 7
Table A-3LATIN AMERICA AND THE CARIBBEAN: URBAN EMPLOYMENT RATES, 2001-2012 (FIRST SEMESTER)
(Annual average rates)
Country 2001 2002 2003 2004 2005 2006 2007 2008 2009 2010 20112011 2012
First semester average
Latin America
Argentina a 45.6 44.6 49.9 52.1 53.0 54.1 54.5 54.2 54.2 54.4 55.2 55.0 54.6
Bolivia (Plurinational State of) b 55.4 53.0 … 55.0 51.2 54.0 52.7 … 52.4 53.6 c … … …
Brazil d 53.0 48.9 50.1 50.6 51.0 51.2 51.6 52.5 52.1 53.2 53.7 53.3 53.7
Chile e 48.6 48.4 49.3 49.5 50.4 50.5 51.0 51.7 50.5 53.7 55.5 55.5 55.7
Colombia f 52.7 53.4 54.2 53.8 54.5 54.0 54.8 55.3 56.2 57.6 59.1 57.8 59.3
Costa Rica g 53.5 52.6 53.0 52.5 54.2 54.7 55.7 55.7 57.0 56.4 57.8 … …
Cuba h 67.8 68.6 69.2 69.7 70.7 70.7 72.4 73.6 74.2 73.0 … … …
Dominican Republic h 45.8 46.2 45.2 46.0 45.9 46.9 47.4 47.7 45.8 47.1 48.0 48.0 r 48.4 r
Ecuador i 49.8 52.1 48.6 53.4 54.4 54.3 56.8 56.0 53.9 52.5 51.9 51.3 54.0
El Salvador j 51.0 49.8 52.0 50.4 50.3 50.8 59.9 60.6 59.7 60.0 … … …
Guatemala k … 58.5 58.4 55.8 … … … … … … … … …
Honduras k 50.5 49.3 49.5 48.5 47.2 49.7 49.7 50.5 50.5 l 50.3 l 48.9 l … …
Mexico m 56.0 55.5 55.6 55.8 56.7 57.9 57.8 57.5 56.2 56.2 56.7 56.2 57.2
Nicaragua n 44.9 43.3 47.6 48.0 49.9 49.1 47.1 49.5 46.6 … … … …
Panama k 51.2 53.2 53.4 55.1 56.0 56.3 57.7 60.2 59.3 59.1 59.8 58.1 o 60.4 o
Paraguay p 50.8 48.4 52.5 56.1 55.8 52.7 55.3 57.0 57.1 55.9 56.1 57.6 57.2
Peru q 60.9 62.0 61.2 61.6 60.7 61.8 63.0 62.4 62.7 64.5 64.5 64.3 64.0
Uruguay k 51.4 49.1 48.3 50.9 51.4 53.9 56.7 57.7 58.6 59.1 60.1 60.2 59.9
Venezuela (Bolivarian Republic of) h 57.1 57.9 56.7 58.0 58.0 58.9 59.4 60.2 60.0 58.9 59.0 58.4 58.0
The Caribbean
Bahamas h 70.9 70.5 69.7 68.0 … … … … … … … … …
Barbados h 62.7 61.4 61.6 62.7 63.2 61.9 62.8 62.1 60.3 59.4 60.0 61.2 s 59.3 s
Belize h … 51.5 52.3 53.3 52.8 52.2 56.0 54.3 … … … … …
Jamaica h 53.5 56.4 57.1 57.0 57.0 58.0 58.6 58.5 56.3 54.7 54.4 54.5 t 53.9 t
Trinidad and Tobago h 54.1 54.6 55.2 57.8 58.6 59.9 59.9 60.6 59.4 58.4 57.7 u … …
Latin America and the Caribbean v 52.4 52.0 52.9 53.5 53.9 54.5 55.0 55.4 54.9 55.6 56.1 w 55.5 56.0
Source: International Labour Organization (ILO), on the basis of information from household surveys conducted in the respective countries.
a Major urban areas incorporated gradually into measurement, up to 31. New measurement starting in 2003; data not comparable with earlier years.
b Urban areas. Figure for 2004 based on survey conducted between November 2003 and October 2004. New measurement starting in 2009; data not comparable with earlier years.
c First semester.d Six metropolitan regions. New measurement starting in 2002; data not comparable with
earlier years.e National total. New measurement starting in 2010; data not comparable with earlier years.f Thirteen metropolitan areas. g National urban rate at July each year. New measurement starting in 2009; data not comparable
with earlier years.h National total. i National urban rate for 2000 (November), 2001 (August) and 2003 (December). Starting in
2004, four quarter average.j National urban rate. Starting in 2007, the lower age limit of the economically active population
was changed from 10 to 16. Includes hidden unemployment.
k National urban rate.l Data refer to May.m Thirty-two urban areas.n National urban rate. New measurement starting in 2003; data not comparable with earlier
years.o Data refer to March.p National urban rate. Data for first semester of 2011 and 2012 refer to Asunción and urban
areas of the Central Department.q Metropolitan Lima. New measurement starting in 2002; data not comparable with earlier
years.r Data refer to April.s First quarter.t In 2011, average data for January and July; in 2012, average data for January and April.u Average data for June and September.v Weighted average. Includes adjustment to data for methodological changes in Argentina
(2003) and Brazil (2002).w Preliminary data.
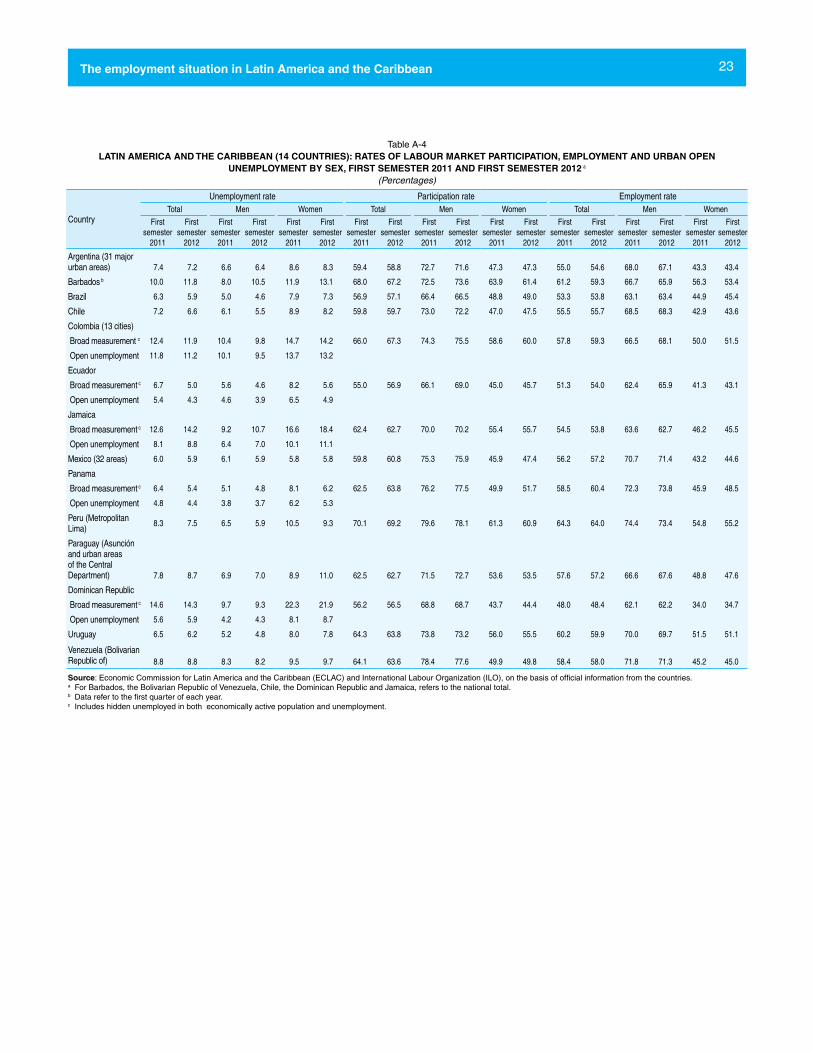
23The employment situation in Latin America and the Caribbean
Table A-4LATIN AMERICA AND THE CARIBBEAN (14 COUNTRIES): RATES OF LABOUR MARKET PARTICIPATION, EMPLOYMENT AND URBAN OPEN
UNEMPLOYMENT BY SEX, FIRST SEMESTER 2011 AND FIRST SEMESTER 2012 a
(Percentages)
Country
Unemployment rate Participation rate Employment rateTotal Men Women Total Men Women Total Men Women
First semester
2011
First semester
2012
First semester
2011
First semester
2012
First semester
2011
First semester
2012
First semester
2011
First semester
2012
First semester
2011
First semester
2012
First semester
2011
First semester
2012
First semester
2011
First semester
2012
First semester
2011
First semester
2012
First semester
2011
First semester
2012
Argentina (31 major urban areas) 7.4 7.2 6.6 6.4 8.6 8.3 59.4 58.8 72.7 71.6 47.3 47.3 55.0 54.6 68.0 67.1 43.3 43.4
Barbados b 10.0 11.8 8.0 10.5 11.9 13.1 68.0 67.2 72.5 73.6 63.9 61.4 61.2 59.3 66.7 65.9 56.3 53.4
Brazil 6.3 5.9 5.0 4.6 7.9 7.3 56.9 57.1 66.4 66.5 48.8 49.0 53.3 53.8 63.1 63.4 44.9 45.4
Chile 7.2 6.6 6.1 5.5 8.9 8.2 59.8 59.7 73.0 72.2 47.0 47.5 55.5 55.7 68.5 68.3 42.9 43.6
Colombia (13 cities)
Broad measurement c 12.4 11.9 10.4 9.8 14.7 14.2 66.0 67.3 74.3 75.5 58.6 60.0 57.8 59.3 66.5 68.1 50.0 51.5
Open unemployment 11.8 11.2 10.1 9.5 13.7 13.2
Ecuador
Broad measurement c 6.7 5.0 5.6 4.6 8.2 5.6 55.0 56.9 66.1 69.0 45.0 45.7 51.3 54.0 62.4 65.9 41.3 43.1
Open unemployment 5.4 4.3 4.6 3.9 6.5 4.9
Jamaica
Broad measurement c 12.6 14.2 9.2 10.7 16.6 18.4 62.4 62.7 70.0 70.2 55.4 55.7 54.5 53.8 63.6 62.7 46.2 45.5
Open unemployment 8.1 8.8 6.4 7.0 10.1 11.1
Mexico (32 areas) 6.0 5.9 6.1 5.9 5.8 5.8 59.8 60.8 75.3 75.9 45.9 47.4 56.2 57.2 70.7 71.4 43.2 44.6
Panama
Broad measurement c 6.4 5.4 5.1 4.8 8.1 6.2 62.5 63.8 76.2 77.5 49.9 51.7 58.5 60.4 72.3 73.8 45.9 48.5
Open unemployment 4.8 4.4 3.8 3.7 6.2 5.3
Peru (Metropolitan Lima)
8.3 7.5 6.5 5.9 10.5 9.3 70.1 69.2 79.6 78.1 61.3 60.9 64.3 64.0 74.4 73.4 54.8 55.2
Paraguay (Asunción and urban areas of the Central Department) 7.8 8.7 6.9 7.0 8.9 11.0 62.5 62.7 71.5 72.7 53.6 53.5 57.6 57.2 66.6 67.6 48.8 47.6
Dominican Republic
Broad measurement c 14.6 14.3 9.7 9.3 22.3 21.9 56.2 56.5 68.8 68.7 43.7 44.4 48.0 48.4 62.1 62.2 34.0 34.7
Open unemployment 5.6 5.9 4.2 4.3 8.1 8.7
Uruguay 6.5 6.2 5.2 4.8 8.0 7.8 64.3 63.8 73.8 73.2 56.0 55.5 60.2 59.9 70.0 69.7 51.5 51.1
Venezuela (Bolivarian Republic of) 8.8 8.8 8.3 8.2 9.5 9.7 64.1 63.6 78.4 77.6 49.9 49.8 58.4 58.0 71.8 71.3 45.2 45.0
Source: Economic Commission for Latin America and the Caribbean (ECLAC) and International Labour Organization (ILO), on the basis of official information from the countries.a For Barbados, the Bolivarian Republic of Venezuela, Chile, the Dominican Republic and Jamaica, refers to the national total.b Data refer to the first quarter of each year.c Includes hidden unemployed in both economically active population and unemployment.
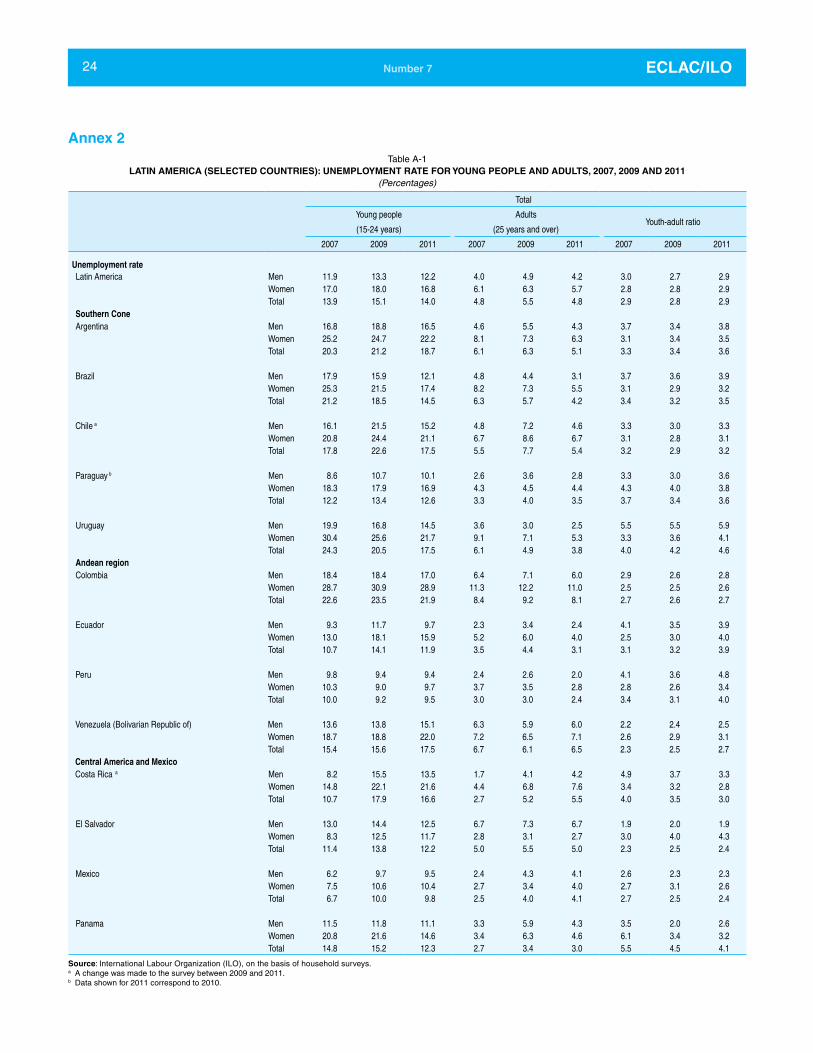
24 ECLAC/ILONumber 7
Table A-1LATIN AMERICA (SELECTED COUNTRIES): UNEMPLOYMENT RATE FOR YOUNG PEOPLE AND ADULTS, 2007, 2009 AND 2011
(Percentages)
Total
Young people AdultsYouth-adult ratio
(15-24 years) (25 years and over)
2007 2009 2011 2007 2009 2011 2007 2009 2011
Unemployment rateLatin America Men 11.9 13.3 12.2 4.0 4.9 4.2 3.0 2.7 2.9
Women 17.0 18.0 16.8 6.1 6.3 5.7 2.8 2.8 2.9 Total 13.9 15.1 14.0 4.8 5.5 4.8 2.9 2.8 2.9
Southern ConeArgentina Men 16.8 18.8 16.5 4.6 5.5 4.3 3.7 3.4 3.8
Women 25.2 24.7 22.2 8.1 7.3 6.3 3.1 3.4 3.5 Total 20.3 21.2 18.7 6.1 6.3 5.1 3.3 3.4 3.6
Brazil Men 17.9 15.9 12.1 4.8 4.4 3.1 3.7 3.6 3.9 Women 25.3 21.5 17.4 8.2 7.3 5.5 3.1 2.9 3.2 Total 21.2 18.5 14.5 6.3 5.7 4.2 3.4 3.2 3.5
Chile a Men 16.1 21.5 15.2 4.8 7.2 4.6 3.3 3.0 3.3 Women 20.8 24.4 21.1 6.7 8.6 6.7 3.1 2.8 3.1 Total 17.8 22.6 17.5 5.5 7.7 5.4 3.2 2.9 3.2
Paraguay b Men 8.6 10.7 10.1 2.6 3.6 2.8 3.3 3.0 3.6 Women 18.3 17.9 16.9 4.3 4.5 4.4 4.3 4.0 3.8 Total 12.2 13.4 12.6 3.3 4.0 3.5 3.7 3.4 3.6
Uruguay Men 19.9 16.8 14.5 3.6 3.0 2.5 5.5 5.5 5.9 Women 30.4 25.6 21.7 9.1 7.1 5.3 3.3 3.6 4.1 Total 24.3 20.5 17.5 6.1 4.9 3.8 4.0 4.2 4.6
Andean regionColombia Men 18.4 18.4 17.0 6.4 7.1 6.0 2.9 2.6 2.8
Women 28.7 30.9 28.9 11.3 12.2 11.0 2.5 2.5 2.6 Total 22.6 23.5 21.9 8.4 9.2 8.1 2.7 2.6 2.7
Ecuador Men 9.3 11.7 9.7 2.3 3.4 2.4 4.1 3.5 3.9 Women 13.0 18.1 15.9 5.2 6.0 4.0 2.5 3.0 4.0 Total 10.7 14.1 11.9 3.5 4.4 3.1 3.1 3.2 3.9
Peru Men 9.8 9.4 9.4 2.4 2.6 2.0 4.1 3.6 4.8 Women 10.3 9.0 9.7 3.7 3.5 2.8 2.8 2.6 3.4 Total 10.0 9.2 9.5 3.0 3.0 2.4 3.4 3.1 4.0
Venezuela (Bolivarian Republic of) Men 13.6 13.8 15.1 6.3 5.9 6.0 2.2 2.4 2.5 Women 18.7 18.8 22.0 7.2 6.5 7.1 2.6 2.9 3.1 Total 15.4 15.6 17.5 6.7 6.1 6.5 2.3 2.5 2.7
Central America and MexicoCosta Rica a Men 8.2 15.5 13.5 1.7 4.1 4.2 4.9 3.7 3.3
Women 14.8 22.1 21.6 4.4 6.8 7.6 3.4 3.2 2.8 Total 10.7 17.9 16.6 2.7 5.2 5.5 4.0 3.5 3.0
El Salvador Men 13.0 14.4 12.5 6.7 7.3 6.7 1.9 2.0 1.9 Women 8.3 12.5 11.7 2.8 3.1 2.7 3.0 4.0 4.3 Total 11.4 13.8 12.2 5.0 5.5 5.0 2.3 2.5 2.4
Mexico Men 6.2 9.7 9.5 2.4 4.3 4.1 2.6 2.3 2.3 Women 7.5 10.6 10.4 2.7 3.4 4.0 2.7 3.1 2.6 Total 6.7 10.0 9.8 2.5 4.0 4.1 2.7 2.5 2.4
Panama Men 11.5 11.8 11.1 3.3 5.9 4.3 3.5 2.0 2.6 Women 20.8 21.6 14.6 3.4 6.3 4.6 6.1 3.4 3.2 Total 14.8 15.2 12.3 2.7 3.4 3.0 5.5 4.5 4.1
Source: International Labour Organization (ILO), on the basis of household surveys.a A change was made to the survey between 2009 and 2011.b Data shown for 2011 correspond to 2010.
Annex 2

25The employment situation in Latin America and the Caribbean
Table A-2LATIN AMERICA (SELECTED COUNTRIES): EMPLOYMENT, EDUCATION AND TRAINING, YOUNG PEOPLE AGED 15-24 YEARS, 2007, 2009 AND 2011
(Percentages)
Categories of study of work
In education or training only a In employment In employment, education or training
Not in employment, education or training a
2007 2009 2011 2007 2009 2011 2007 2009 2011 2007 2009 2011
Unemployment rateLatin America Men 33.9 34.7 35.1 42.7 40.8 40.3 11.8 12.0 12.4 11.7 12.5 12.1
Women 37.5 38.7 39.4 24.7 23.3 22.8 8.8 9.4 9.3 28.9 28.6 28.5Total 35.7 36.7 37.2 33.6 32.1 31.6 10.3 10.7 10.8 20.4 20.5 20.3
Southern ConeArgentina Men 42.3 43.0 44.7 32.6 31.0 31.3 11.2 10.2 10.1 13.9 15.8 13.8
Women 48.4 50.1 52.0 17.8 15.3 15.4 9.7 10.3 9.6 24.1 24.3 22.9Total 45.4 46.6 48.4 25.2 23.2 23.4 10.4 10.3 9.9 19.0 20.0 18.3
Brazil Men 33.8 34.8 34.4 36.0 35.8 37.4 15.1 14.6 14.7 15.1 14.8 13.6 Women 36.7 37.3 36.7 26.0 26.4 28.0 12.6 13.0 13.1 24.7 23.3 22.3 Total 35.2 36.1 35.5 31.0 31.0 32.7 13.9 13.8 13.9 19.9 19.1 17.9
Paraguay b Men 23.0 22.7 25.4 47.5 45.2 44.3 19.3 23.8 19.6 10.2 8.3 10.6 Women 34.9 31.7 34.7 23.3 23.3 22.8 12.1 17.6 13.9 29.7 27.5 28.6 Total 28.9 27.0 29.9 35.4 34.6 34.0 15.7 20.8 16.9 19.9 17.6 19.3
Uruguay Men 34.3 35.8 31.1 40.5 39.1 42.4 10.7 11.9 10.6 14.5 13.2 16.0Women 43.3 43.5 40.2 21.2 21.3 23.6 10.4 12.7 12.4 25.2 22.5 23.7Total 38.8 39.6 35.5 30.9 30.3 33.3 10.5 12.3 11.4 19.8 17.8 19.7
Andean regionColombia Men 35.9 34.6 32.9 39.2 40.1 40.6 8.3 10.0 12.3 16.6 15.4 14.2
Women 35.4 35.8 35.1 21.9 21.9 23.1 6.4 7.7 8.9 36.4 34.5 32.8 Total 35.7 35.2 34.0 30.5 31.0 31.9 7.3 8.9 10.6 26.5 25.0 23.4
Ecuador Men 34.5 38.0 42.7 43.7 41.1 38.0 14.2 12.3 11.0 7.7 8.6 8.3 Women 38.4 43.3 48.7 24.9 21.5 17.6 11.3 10.5 8.8 25.5 24.7 24.9 Total 36.4 40.6 45.6 34.5 31.5 28.0 12.8 11.4 9.9 16.4 16.5 16.4
Peru Men 24.5 24.2 25.1 48.1 45.2 44.5 12.6 15.3 15.4 14.8 15.3 14.9 Women 24.2 24.8 26.8 36.6 35.5 35.4 11.8 13.8 12.3 27.4 25.9 25.5 Total 24.3 24.5 26.0 42.4 40.4 40.0 12.2 14.6 13.9 21.1 20.5 20.1
Venezuela (Bolivarian Republic of) Men 38.0 38.7 43.3 45.2 44.4 34.3 8.4 8.3 11.7 8.4 8.6 10.8 Women 51.8 52.6 54.5 23.4 23.4 12.5 7.2 6.8 10.1 17.6 17.2 22.8 Total 44.5 45.2 48.8 35.0 34.6 23.6 7.8 7.6 10.9 12.7 12.6 16.7
Central America and MexicoCosta Rica c Men 32.8 38.4 39.8 43.6 34.7 33.3 15.0 14.1 15.5 8.6 12.8 11.4
Women 40.5 44.8 47.7 19.7 15.6 15.4 13.5 12.6 13.2 26.3 27.1 23.7 Total 36.6 41.5 43.7 31.6 25.5 24.5 14.3 13.4 14.4 17.5 19.6 17.4
El Salvador Men 30.7 32.7 34.2 51.0 47.8 48.7 9.5 10.5 9.6 8.8 9.0 7.5 Women 35.0 35.3 36.0 23.1 24.3 24.0 6.7 6.0 5.6 35.2 34.5 34.4 Total 32.9 34.0 35.1 36.7 35.8 36.5 8.1 8.2 7.6 22.3 22.0 20.8
Mexico Men 33.5 35.2 34.4 46.0 42.5 43.3 11.9 11.4 11.4 8.6 11.0 11.0 Women 36.7 38.3 37.7 24.5 21.6 22.8 7.1 7.1 6.8 31.7 33.0 32.7 Total 35.2 36.7 36.1 34.9 32.0 32.9 9.4 9.2 9.0 20.6 22.1 21.9
Panama Men 35.3 32.2 35.5 43.5 44.5 41.1 11.5 12.8 11.6 9.6 10.5 11.8 Women 42.7 43.3 45.1 18.9 17.9 16.7 8.2 9.0 8.2 30.1 29.8 30.0 Total 39.0 37.7 40.3 31.4 31.3 28.8 9.9 10.9 9.9 19.8 20.1 21.0
Source: International Labour Organization (ILO), on the basis of household surveys. a These categories include the unemployed.b Data shown for 2011 correspond to 2010.c A change was made to the survey between 2009 and 2011.
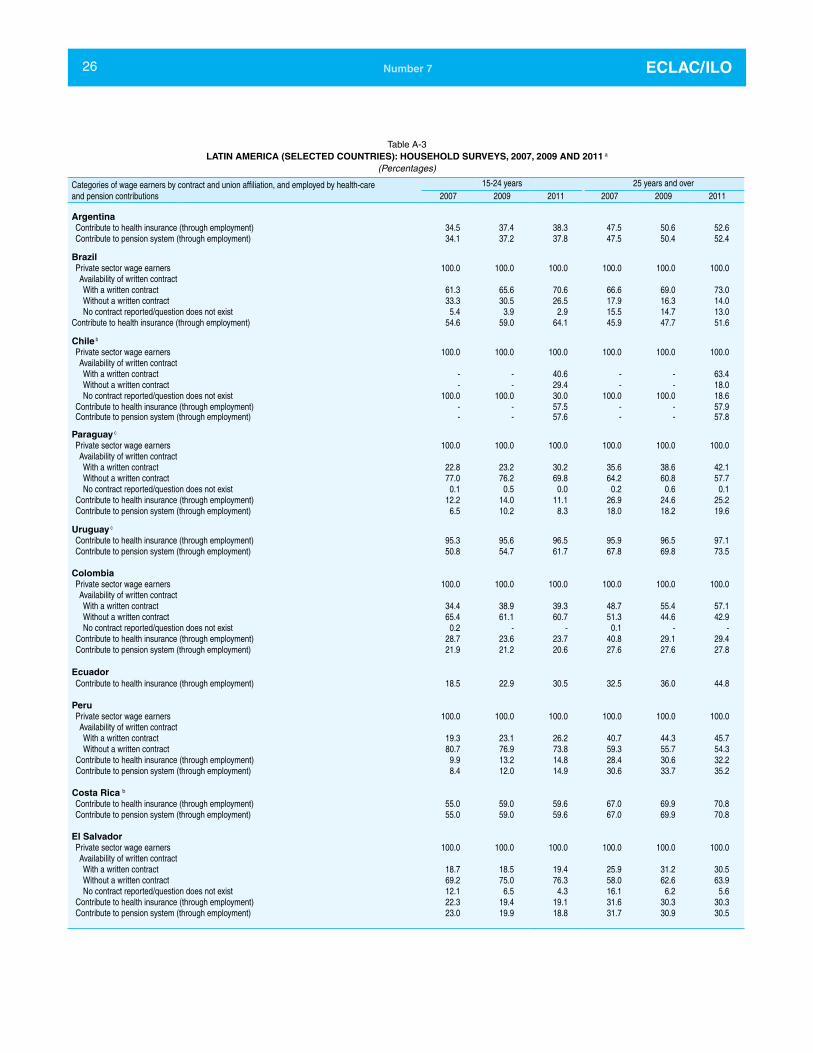
26 ECLAC/ILONumber 7
Table A-3LATIN AMERICA (SELECTED COUNTRIES): HOUSEHOLD SURVEYS, 2007, 2009 AND 2011 a
(Percentages)
Categories of wage earners by contract and union affiliation, and employed by health-care and pension contributions
15-24 years 25 years and over2007 2009 2011 2007 2009 2011
ArgentinaContribute to health insurance (through employment) 34.5 37.4 38.3 47.5 50.6 52.6 Contribute to pension system (through employment) 34.1 37.2 37.8 47.5 50.4 52.4
BrazilPrivate sector wage earners 100.0 100.0 100.0 100.0 100.0 100.0 Availability of written contractWith a written contract 61.3 65.6 70.6 66.6 69.0 73.0 Without a written contract 33.3 30.5 26.5 17.9 16.3 14.0 No contract reported/question does not exist 5.4 3.9 2.9 15.5 14.7 13.0
Contribute to health insurance (through employment) 54.6 59.0 64.1 45.9 47.7 51.6
Chile b
Private sector wage earners 100.0 100.0 100.0 100.0 100.0 100.0 Availability of written contractWith a written contract - - 40.6 - - 63.4 Without a written contract - - 29.4 - - 18.0 No contract reported/question does not exist 100.0 100.0 30.0 100.0 100.0 18.6
Contribute to health insurance (through employment) - - 57.5 - - 57.9 Contribute to pension system (through employment) - - 57.6 - - 57.8
Paraguay c
Private sector wage earners 100.0 100.0 100.0 100.0 100.0 100.0 Availability of written contractWith a written contract 22.8 23.2 30.2 35.6 38.6 42.1 Without a written contract 77.0 76.2 69.8 64.2 60.8 57.7 No contract reported/question does not exist 0.1 0.5 0.0 0.2 0.6 0.1
Contribute to health insurance (through employment) 12.2 14.0 11.1 26.9 24.6 25.2 Contribute to pension system (through employment) 6.5 10.2 8.3 18.0 18.2 19.6
Uruguay c
Contribute to health insurance (through employment) 95.3 95.6 96.5 95.9 96.5 97.1 Contribute to pension system (through employment) 50.8 54.7 61.7 67.8 69.8 73.5
Colombia
Private sector wage earners 100.0 100.0 100.0 100.0 100.0 100.0 Availability of written contractWith a written contract 34.4 38.9 39.3 48.7 55.4 57.1 Without a written contract 65.4 61.1 60.7 51.3 44.6 42.9 No contract reported/question does not exist 0.2 - - 0.1 - -
Contribute to health insurance (through employment) 28.7 23.6 23.7 40.8 29.1 29.4 Contribute to pension system (through employment) 21.9 21.2 20.6 27.6 27.6 27.8
EcuadorContribute to health insurance (through employment) 18.5 22.9 30.5 32.5 36.0 44.8
PeruPrivate sector wage earners 100.0 100.0 100.0 100.0 100.0 100.0 Availability of written contractWith a written contract 19.3 23.1 26.2 40.7 44.3 45.7 Without a written contract 80.7 76.9 73.8 59.3 55.7 54.3
Contribute to health insurance (through employment) 9.9 13.2 14.8 28.4 30.6 32.2 Contribute to pension system (through employment) 8.4 12.0 14.9 30.6 33.7 35.2
Costa Rica b
Contribute to health insurance (through employment) 55.0 59.0 59.6 67.0 69.9 70.8 Contribute to pension system (through employment) 55.0 59.0 59.6 67.0 69.9 70.8
El SalvadorPrivate sector wage earners 100.0 100.0 100.0 100.0 100.0 100.0 Availability of written contractWith a written contract 18.7 18.5 19.4 25.9 31.2 30.5 Without a written contract 69.2 75.0 76.3 58.0 62.6 63.9 No contract reported/question does not exist 12.1 6.5 4.3 16.1 6.2 5.6
Contribute to health insurance (through employment) 22.3 19.4 19.1 31.6 30.3 30.3 Contribute to pension system (through employment) 23.0 19.9 18.8 31.7 30.9 30.5

27The employment situation in Latin America and the Caribbean
Table A-3 (concluded)
Categories of wage earners by contract, union affiliation and employed by health-care and pension contributions
15-24 years 25 years and over2007 2009 2011 2007 2009 2011
MexicoPrivate sector wage earners 100.0 100.0 100.0 100.0 100.0 100.0 Availability of written contractWith a written contract 35.5 33.5 34.3 46.2 46.7 46.8 Without a written contract 63.6 65.1 64.7 53.0 52.1 52.3 No contract reported/question does not exist 0.9 1.4 1.0 0.9 1.2 1.0
Contribute to health insurance (through employment) 31.8 28.7 29.0 37.7 37.4 36.8
PanamaPrivate sector wage earners 100.0 100.0 100.0 100.0 100.0 100.0 Availability of written contractWith a written contract 61.1 63.3 71.1 72.4 73.0 79.6 Without a written contract 38.9 36.7 28.9 27.6 27.0 20.4
Union affiliationNone reported/question does not exist 100.0 100.0 100.0 100.0 100.0 100.0
Contribute to health insurance (through employment) 35.0 39.9 45.5 50.5 51.5 55.2 Contribute to pension system (through employment) 35.0 39.9 45.5 50.5 51.5 55.2
Source: International Labour Organization (ILO), on the basis of household surveys.a Only categories with information available are reported.b A change was made to the survey between 2009 and 2011.c Data shown for 2011 correspond to 2010.

http://www.eclac.org/http://www.ilo.org/