Embed Size (px)
Citation preview
Positioning on the GlobalValue Chain Map:Where do You Want to Be?by Erik van der Marel, Senior Economist at ECIPE
ECIPE OCCASIONAL PAPER • No. 01/2015
2
JEL Codes F13, F14, F15, F23, O24 Keywords Global Value Chains, Trade Policy, Trade in Value-added
Positioning on the Global Value Chain Map: Where do You Want to Be?by Erik van der Marel, Senior Economist at ECIPE in Brussels ([email protected])
The author wishes to thank Maria Salfi for excellent research assistance.
INTRODUCTION
In recent years the concept of trade has changed from a final good crossing from one country to another to complex and sophisticated structures of trade in inputs across national borders before they become a final good. This is the world of global supply chains or, as they have recently become known, global value chains. Importantly, it requires a new paradigm of trade policy, one where the cost and benefits of trade policy are assessed differently than in the past.
Worldwide flows of goods and services have vastly increased in the past decades and enabled an ever-larger number of countries to participate in trade. For instance, global trade in goods in-creased by a factor of 10 between 1980 and 2011, whereas this figure for services is 3 and that of financial flows 1.5. At the same time Foreign Direct Investment (FDI) has increased by a factor of 6 since 1990. These numbers reflect the high degree of internationalisation of entire pro-duction processes. In great part this is due to a significant decrease of trade costs that has taken place over the last several decades. Not only have tariffs and quotas gone down, other trade costs such as transportation and information and communication technology have also been reduced massively, allowing many countries to join global value chains (GVCs).
Therefore almost all countries participate in global supply chains through various industry activ-ities in which they specialise. However, where exactly countries are positioned within the GVC space remains unclear. Are countries really taking part in these value chains in different ways? If so, where are countries located within the overall spectrum of supply chains with respect to production and trade? And, what do the GVCs in which they participate look like? More im-portantly, what does the location within the GVC mean for the set of policies each country is advised to pursue in order to take optimal advantage of GVCs? These are questions this paper tries to explore for a wide variety of countries, covering both developed and developing econo-mies but with a special focus on the economies of the European Union (EU) and their relative positions.
Uncovering a country’s location in the GVC map is important as it can provide important pol-icy guidance, especially within the EU where members are creating a common internal market and converging policies that are relevant to this new reality of trade. With the rise of GVCs in recent years, various so-called ‘new’ policy measures, going beyond traditional trade policy, have become important factors of trade. Examples include investment barriers, labour market inef-ficiencies, or obstacles to innovation. All these barriers are key to production and trade within GVCs, but their scale and scope including the applicability for each country remains unclear. As a result, in addition to developing a GVC map for countries this paper also tries to set out the relevance of each of the new and traditional trade policy measures related to GVCs for a set of countries, including some emerging countries.
ECIPE OCCASIONAL PAPER • No. 01/2015
3
ecipe occasional paper — no. 01/2015
Moreover, once we know the relative position of each country in the overall range of GVCs, it is possible to drill down into the specifics of sectors in which each of the economies specialise. Although analysing policy requirements at an aggregate level may be useful from a country-wide perspective, it could mask great differences in terms of policy needs for each sector specifically in which a country is trading. Therefore, based on a country’s relative location in the overall GVC map this paper will furthermore analyse some case studies in an attempt to reveal which policy measures are most important for a sector in which a country has a comparative advantage so it could optimise the gains from trade within GVCs.
The conclusion of this paper confirms to a large extent the previous literature on GVCs, but there are important differences. One example is that larger markets such as France, Italy or even China do indeed show lower participation figures in GVCs than smaller countries, which is explained by their higher domestic production of inputs. In other words, smaller countries just trade more in GVCs. Yet, the relative position within GVCs of each of these countries diverges greatly and therefore requires a different set of policies in order to benefit from trade. For instance, based on our analysis the overall participation of Spain and Italy in GVCs could be further enhanced by implementing the more traditional trade measures such as a smooth customs operations system or regulations in product markets whereas France’s position is most likely to be caused by a lack of focus on measures such as ICT-related capital and intangible capital stock formation in addition to their high barriers in services. Again, this paper will furthermore refine such policy conclusion by going deeper into the specific industry sectors of some of the countries.
The remainder of this paper is organised as follows. It begins by evaluating the importance of global supply chains for every country and their relative position in the GVC space with a par-ticular focus on EU economies. It then explores and assesses which policy measures are most important to explain each of these countries’ position in the GVC diagram. The next section examines the sector-specific policies based on the specialisation patterns that countries have in GVCs. Hence, it identifies possible barriers to production and trade in GVCs and discusses the effect of reforms of these barriers for reaching higher gains from GVC trade. The final section concludes this paper with a discussion of additional policy options.
1 WHERE ARE COUNTRIES POSITIONED ON THE GVC MAP?
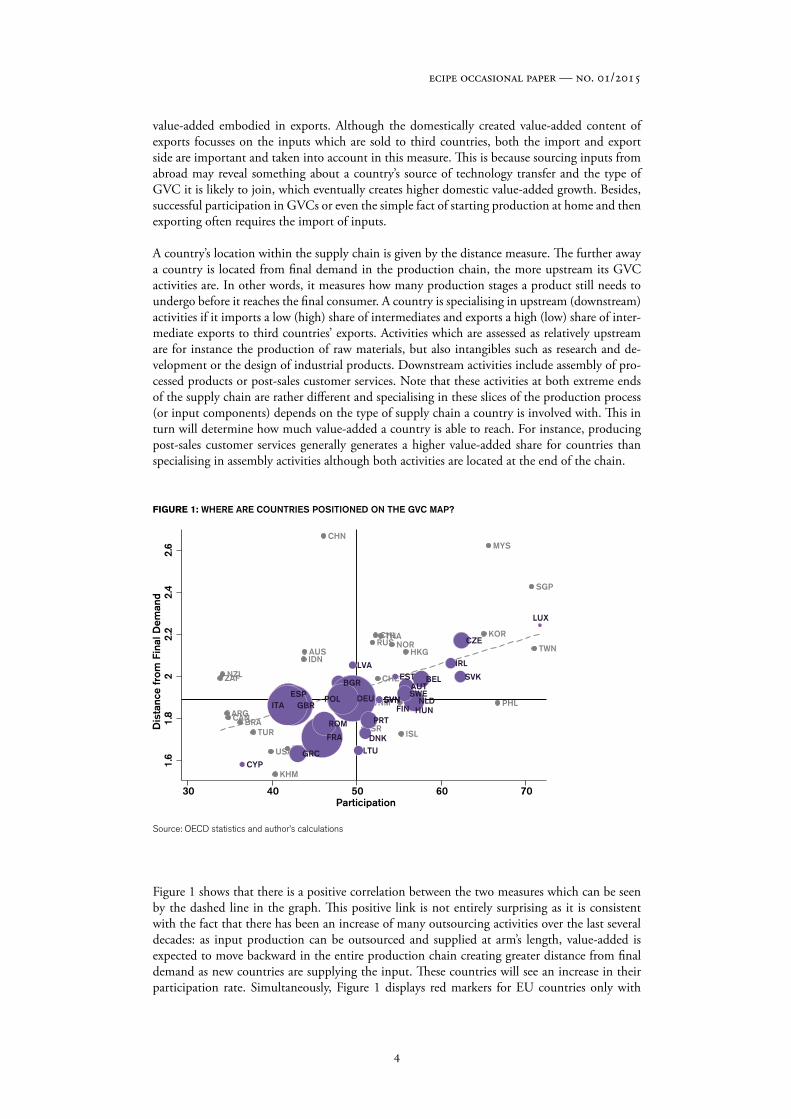
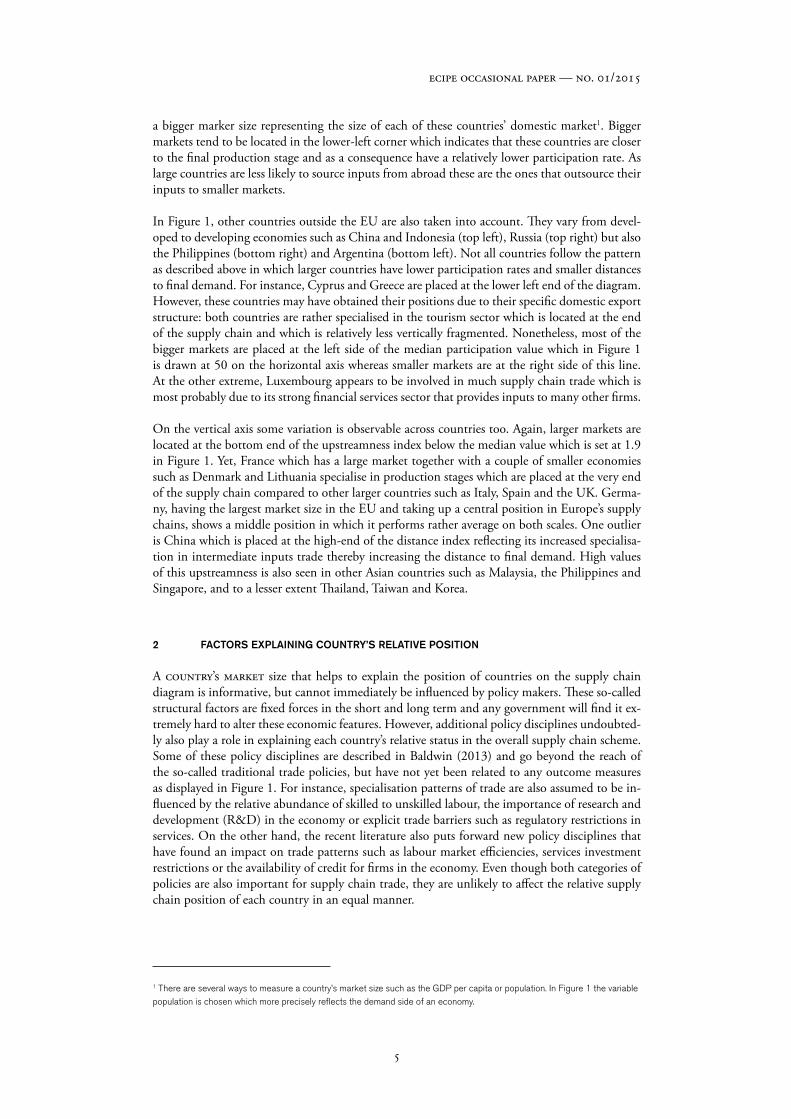
As more and more countries have become involved in GVC trade, mapping out where each country is placed inside the world of supply chains is increasingly relevant. The recent empirical trade literature has set out several indicators that measure the scale and location of each country’s GVCs by taking stock of all the supply chains in which they are active. The scale indicates a country’s relative position in terms of its reach in GVCs whereas the location specifies where ex-actly a country is trading in the production process. Using data from the OECD we can illustrate these two dimensions; we therefore select the participation index shown on the x-axis of Figure 1 which reflects the extent to which each country takes part in a vertically fragmented production process and the distance from final demand displayed on the y-axis of Figure 1. This last indicator indicating location measures how far countries are situated from the final downstream industry in the production process that deals with final demand in the supply chain. Often this is also called the ‘upstreamness’ of a country or industry according to the work of Antràs et al. (2012) and Fally (2012), i.e. the further away an industry is from final demand, the more upstream this sector is classified. In Figure 1 therefore, the vertical axis tells us something about the degree to which countries are trading in GVCs whereas the horizontal axis gives information about a country’s production pattern in the supply chain.
A high participation index reveals that a country takes deeper part in the value chain by trading many inputs that are either imported from abroad (so-called backward linkages) or are pro-duced domestically and are exported for a third country’s exports (so-called forward linkages). Greater participation of a country creates a greater scope for reaping a higher share of domestic
4
ecipe occasional paper — no. 01/2015
value-added embodied in exports. Although the domestically created value-added content of exports focusses on the inputs which are sold to third countries, both the import and export side are important and taken into account in this measure. This is because sourcing inputs from abroad may reveal something about a country’s source of technology transfer and the type of GVC it is likely to join, which eventually creates higher domestic value-added growth. Besides, successful participation in GVCs or even the simple fact of starting production at home and then exporting often requires the import of inputs.
A country’s location within the supply chain is given by the distance measure. The further away a country is located from final demand in the production chain, the more upstream its GVC activities are. In other words, it measures how many production stages a product still needs to undergo before it reaches the final consumer. A country is specialising in upstream (downstream) activities if it imports a low (high) share of intermediates and exports a high (low) share of inter-mediate exports to third countries’ exports. Activities which are assessed as relatively upstream are for instance the production of raw materials, but also intangibles such as research and de-velopment or the design of industrial products. Downstream activities include assembly of pro-cessed products or post-sales customer services. Note that these activities at both extreme ends of the supply chain are rather different and specialising in these slices of the production process (or input components) depends on the type of supply chain a country is involved with. This in turn will determine how much value-added a country is able to reach. For instance, producing post-sales customer services generally generates a higher value-added share for countries than specialising in assembly activities although both activities are located at the end of the chain.
FIGURE 1: WHERE ARE COUNTRIES POSITIONED ON THE GVC MAP?
Source: OECD statistics and author’s calculations
Figure 1 shows that there is a positive correlation between the two measures which can be seen by the dashed line in the graph. This positive link is not entirely surprising as it is consistent with the fact that there has been an increase of many outsourcing activities over the last several decades: as input production can be outsourced and supplied at arm’s length, value-added is expected to move backward in the entire production chain creating greater distance from final demand as new countries are supplying the input. These countries will see an increase in their participation rate. Simultaneously, Figure 1 displays red markers for EU countries only with
ARG
AUS
BRACAN
CHE
CHL
CHN
HKGIDN
IND
ISLISR
JPN
KHM
KOR
MEX
MLT
MYS
NOR
NZL
PHL
RUS
SGP
THA
TUR
TWN
USA
VNM
ZAF
1.6
1.8
22.
22.
42.
6D
ista
nce
from
Fin
al D
eman
d
30 40 50 60 70Participation
DNK
CYPGRC
FRA
ROM
LTU
PRT
ESP POLITA
DEU
BGR
LVAEST BEL
AUTSWE
NLDHUN
LUX
SVN
SVK
IRL
CZE
FINGBRSVN
5
ecipe occasional paper — no. 01/2015
a bigger marker size representing the size of each of these countries’ domestic market1. Bigger markets tend to be located in the lower-left corner which indicates that these countries are closer to the final production stage and as a consequence have a relatively lower participation rate. As large countries are less likely to source inputs from abroad these are the ones that outsource their inputs to smaller markets.
In Figure 1, other countries outside the EU are also taken into account. They vary from devel-oped to developing economies such as China and Indonesia (top left), Russia (top right) but also the Philippines (bottom right) and Argentina (bottom left). Not all countries follow the pattern as described above in which larger countries have lower participation rates and smaller distances to final demand. For instance, Cyprus and Greece are placed at the lower left end of the diagram. However, these countries may have obtained their positions due to their specific domestic export structure: both countries are rather specialised in the tourism sector which is located at the end of the supply chain and which is relatively less vertically fragmented. Nonetheless, most of the bigger markets are placed at the left side of the median participation value which in Figure 1 is drawn at 50 on the horizontal axis whereas smaller markets are at the right side of this line. At the other extreme, Luxembourg appears to be involved in much supply chain trade which is most probably due to its strong financial services sector that provides inputs to many other firms.
On the vertical axis some variation is observable across countries too. Again, larger markets are located at the bottom end of the upstreamness index below the median value which is set at 1.9 in Figure 1. Yet, France which has a large market together with a couple of smaller economies such as Denmark and Lithuania specialise in production stages which are placed at the very end of the supply chain compared to other larger countries such as Italy, Spain and the UK. Germa-ny, having the largest market size in the EU and taking up a central position in Europe’s supply chains, shows a middle position in which it performs rather average on both scales. One outlier is China which is placed at the high-end of the distance index reflecting its increased specialisa-tion in intermediate inputs trade thereby increasing the distance to final demand. High values of this upstreamness is also seen in other Asian countries such as Malaysia, the Philippines and Singapore, and to a lesser extent Thailand, Taiwan and Korea.
2 FACTORS EXPLAINING COUNTRY’S RELATIVE POSITION
A country’s market size that helps to explain the position of countries on the supply chain diagram is informative, but cannot immediately be influenced by policy makers. These so-called structural factors are fixed forces in the short and long term and any government will find it ex-tremely hard to alter these economic features. However, additional policy disciplines undoubted-ly also play a role in explaining each country’s relative status in the overall supply chain scheme. Some of these policy disciplines are described in Baldwin (2013) and go beyond the reach of the so-called traditional trade policies, but have not yet been related to any outcome measures as displayed in Figure 1. For instance, specialisation patterns of trade are also assumed to be in-fluenced by the relative abundance of skilled to unskilled labour, the importance of research and development (R&D) in the economy or explicit trade barriers such as regulatory restrictions in services. On the other hand, the recent literature also puts forward new policy disciplines that have found an impact on trade patterns such as labour market efficiencies, services investment restrictions or the availability of credit for firms in the economy. Even though both categories of policies are also important for supply chain trade, they are unlikely to affect the relative supply chain position of each country in an equal manner.
1 There are several ways to measure a country’s market size such as the GDP per capita or population. In Figure 1 the variable population is chosen which more precisely reflects the demand side of an economy.
6
ecipe occasional paper — no. 01/2015
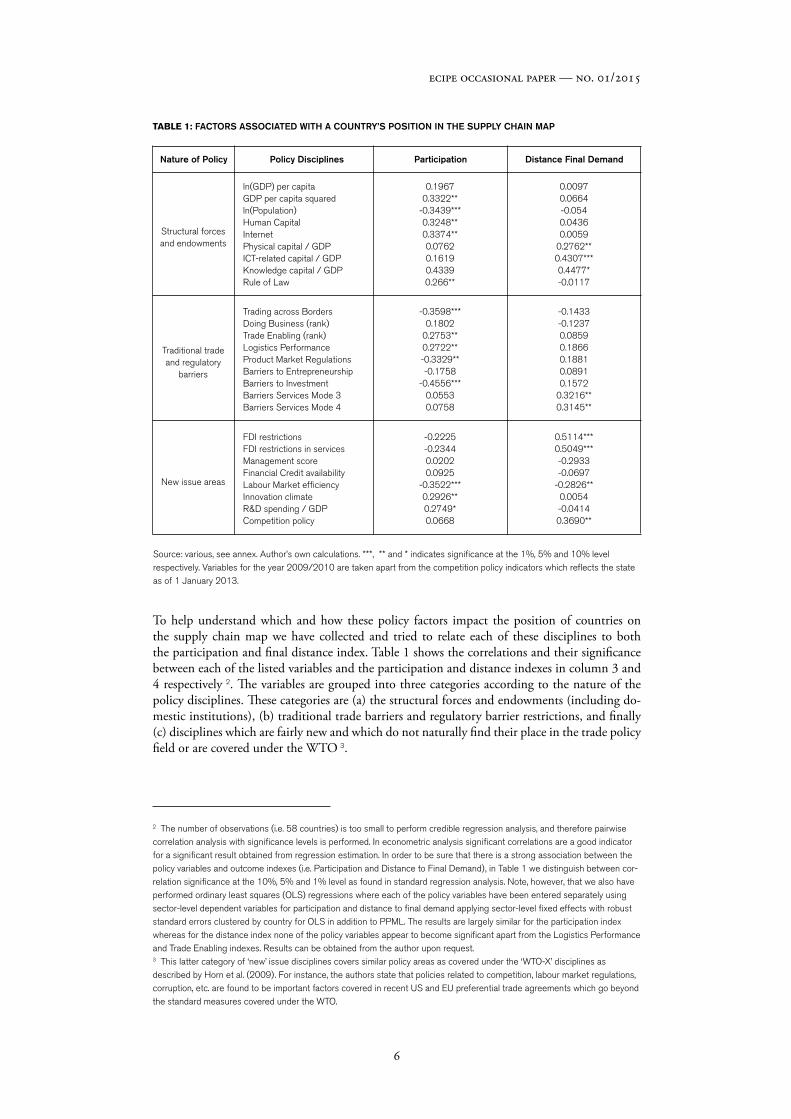
Policy Disciplines Participation Distance Final DemandNature of Policy
Structural forcesand endowments
ln(GDP) per capitaGDP per capita squaredln(Population)Human CapitalInternetPhysical capital / GDPICT-related capital / GDPKnowledge capital / GDPRule of Law
0.19670.3322**
-0.3439***0.3248**0.3374**0.07620.16190.43390.266**
0.00970.0664-0.0540.04360.0059
0.2762**0.4307***0.4477*-0.0117
Traditional trade and regulatory
barriers
Trading across BordersDoing Business (rank)Trade Enabling (rank)Logistics PerformanceProduct Market RegulationsBarriers to EntrepreneurshipBarriers to InvestmentBarriers Services Mode 3Barriers Services Mode 4
-0.3598***0.1802
0.2753**0.2722**-0.3329**-0.1758
-0.4556***0.05530.0758
-0.1433-0.12370.08590.18660.18810.08910.1572
0.3216**0.3145**
New issue areas
FDI restrictionsFDI restrictions in servicesManagement scoreFinancial Credit availabilityLabour Market efficiencyInnovation climateR&D spending / GDPCompetition policy
-0.2225-0.23440.02020.0925
-0.3522***0.2926**0.2749*0.0668
0.5114***0.5049***-0.2933-0.0697
-0.2826**0.0054-0.04140.3690**
TABLE 1: FACTORS ASSOCIATED WITH A COUNTRY’S POSITION IN THE SUPPLY CHAIN MAP
To help understand which and how these policy factors impact the position of countries on the supply chain map we have collected and tried to relate each of these disciplines to both the participation and final distance index. Table 1 shows the correlations and their significance between each of the listed variables and the participation and distance indexes in column 3 and 4 respectively 2. The variables are grouped into three categories according to the nature of the policy disciplines. These categories are (a) the structural forces and endowments (including do-mestic institutions), (b) traditional trade barriers and regulatory barrier restrictions, and finally (c) disciplines which are fairly new and which do not naturally find their place in the trade policy field or are covered under the WTO 3.
2 The number of observations (i.e. 58 countries) is too small to perform credible regression analysis, and therefore pairwise correlation analysis with significance levels is performed. In econometric analysis significant correlations are a good indicator for a significant result obtained from regression estimation. In order to be sure that there is a strong association between the policy variables and outcome indexes (i.e. Participation and Distance to Final Demand), in Table 1 we distinguish between cor-relation significance at the 10%, 5% and 1% level as found in standard regression analysis. Note, however, that we also have performed ordinary least squares (OLS) regressions where each of the policy variables have been entered separately using sector-level dependent variables for participation and distance to final demand applying sector-level fixed effects with robust standard errors clustered by country for OLS in addition to PPML. The results are largely similar for the participation index whereas for the distance index none of the policy variables appear to become significant apart from the Logistics Performance and Trade Enabling indexes. Results can be obtained from the author upon request. 3 This latter category of ‘new’ issue disciplines covers similar policy areas as covered under the ‘WTO-X’ disciplines as described by Horn et al. (2009). For instance, the authors state that policies related to competition, labour market regulations, corruption, etc. are found to be important factors covered in recent US and EU preferential trade agreements which go beyond the standard measures covered under the WTO.
Source: various, see annex. Author’s own calculations. ***, ** and * indicates significance at the 1%, 5% and 10% level respectively. Variables for the year 2009/2010 are taken apart from the competition policy indicators which reflects the state as of 1 January 2013.
7
ecipe occasional paper — no. 01/2015
As expected the size of the domestic market measured by population correlates strongly with the extent to which countries participate in GVC, but does not tell us much about a country’s position relative to the final downstream industry. In other words, countries with bigger markets will tend to find themselves in the lower end of the participation index as found in Figure 1. Interestingly, although a country’s GDP per capita does not seem to be related to the participa-tion index, richer countries appear to participate in GVCs at an increasing rate. This reflects the U-shaped relationship as found in Lopez-Gonzalez (2012): less developed or emerging countries see high participation rates, which levels off the richer a country becomes and then increases again past a certain threshold 4.
Factor endowments matter as well for participating in supply chains. Both the extent to which countries have good human capital rates and have high scores on internet penetration are posi-tively and significantly related to the participation index. This means that countries with more skilled workers and with the right infrastructure to develop human capital and with high connec-tivity through the internet will see higher participation rates in vertically fragmented production chains. As part of the ‘endowment’ structure of a country, the strength of domestic institutions is also important in explaining the rate of participation as the variable Rule of Law is positive and significant. The index Rule of Law is the most commonly used proxy for measuring the strength of domestic institutions within a country. On the other hand, physical capital which is used for ICT cannot explain participation but does relate well to the remoteness to final demand, i.e. countries endowed with more physical or ICT-related capital relative to their overall economies (i.e. GDP) are associated with increased distances from final demand of consumers. In addition, intangible capital such as capital used for R&D, design, advertising, market research, training and organisational structure is also significantly correlated with the distance index albeit at the 10 percent level 5. All three types of capital therefore seem to play an important role for activities at the beginning of the supply chain.
Most of the traditional and regulatory barriers in trade do also matter for participating in sup-ply chains. Table 1 shows that higher barriers related to time and costs for transporting a good (excluding tariffs) as measured by the sub-index of the Doing Business database called ‘Trading across Borders’ is associated with lower rate on the participation index. The overall rank index of the Doing Business data does not correlate significantly with the participation index. This latter index covers a wider range of non-tariff barriers (NTBs) such as the time is takes to get electricity, the costs and time to obtain construction permits, to register property or to pay taxes. None of these additional barrier issues seem to be significantly associated with participating in GVCs. On the other hand, the Trade Enabling index measuring similar tariff and NTBs such as border administration, physical and communication infrastructure and the regulatory business environment is substantially correlated albeit its large set of indicators which are covered by this index. Unsurprisingly, logistics are also highly correlated with participation scores in supply chains as the Logistics Performance index is positively significant. This means that a higher index performance on logistics relates with greater participation in GVCs.
Furthermore, purely domestic regulatory barriers also seem to matter as measured by the OECD’s Product Market Regulations (PMR). However, they are rather to be found in the area of trade and investment policies such as explicit barriers of FDI or tariffs, or implicit policies such as differential treatment of foreign suppliers and barriers to trade facilitation, which is measured by
4 Another explanation may be that at the extreme end of the GDP figure we see various very small countries such as Sin-gapore and Luxembourg which determine in large part the higher values of the participation index. At the same time these countries are known to have an ‘entrepôt’ function in international trade.5 Note that although this variable is only significantly correlated at the 10 percent level, only 14 observations are obtainable which increases substantially the standard-deviation. For this variable taken from Corrado et al. (2012) the so-called ‘new intangibles’ measure is selected which means that all intangible assets are included which are outside the scope of what can be otherwise measured on the National Accounts. The latter covers issues such as software (in addition to mineral exploitation and artistic originals) which are moreover only partly covered by the ICT-related capital stock.
8
ecipe occasional paper — no. 01/2015
the index ‘Barriers to investment’, a sub-index of the PMR. The other two sub-indices – ‘State Control’ or ‘Barriers to Entrepreneurship’ – do not seem to matter for the extent to which coun-tries participate in supply chains.
However, none of these traditional trade and regulatory barriers seem to matter for where coun-tries are located vis-à-vis final demand, except regulatory services barriers. The services barriers in Table 1 are taken from the World Bank’s ‘Services Restrictiveness Index’ (STRI) and are broken up for each country between the different modes of supply 6. As one can see, both barriers in Mode 3 (commercial presence of a firm abroad) and Mode 4 (temporary migration) do matter for where in the chain countries are specialising. In fact, higher regulatory barriers in services are linked to greater distances from final demand. This result seems intuitive as many services activities take place at the end of the supply chain such as marketing, customer services, retailing and delivery. Interestingly, both the movement of the factors of production, namely capital in the form of FDI (Mode 3) and labour in the form of temporary labour mobility (Mode 4) are critical factors. Examples of barriers in Mode 3 would include capital restrictions whereas a case of a barrier in labour mobility could be restrictions with respect to short-term business visas for managers.
This pattern is confirmed when looking at the last category of policy disciplines which represent the new issue areas often not covered in multilateral trade negotiations at the WTO. These are restrictions explicitly targeted to FDI (as opposed to the index under the PMR), labour market reforms, financial credit availability, competition policy or the overall climate of innovation and research and development (R&D). These are disciplines which have recently been discovered to have an influence on the trade performance of firms, but are not dealt with in conventional trade agreements although increasingly covered under recently conducted Preferential Trade Agree-ments (PTAs) (Baldwin, 2012). Again, barriers targeting the movement of factors of production seem to matter to a significant extent for explaining where countries are located in the supply chain as both restrictions in FDI (particularly in services) and the efficient organisation of the labour market are highly correlated. Surprisingly, a climate that is conducive to innovation or higher R&D spending are not related to this location in the supply chain as is often claimed (Taglioni and Winkler, 2014). In contrast, a stronger case for competition policy is associated with greater distances from the final production stage meaning that this policy becomes impor-tant for countries active at a relatively early stage of the supply chain.
In summary, different policies matter for different dimensions measuring the supply chain trade. Traditional factors related to trade such as market size, skilled workers, transport and burdensome procedures and customs in addition to a conducive innovation climate and labour market situa-tion seem to matter for participating in GVCs. On the other hand, policies related to capital (and ICT-related capital in particular), services trade and FDI together with competition policy and labour market efficiencies appear to matter for where countries are located in the supply chain.
3 WHERE IS THE VALUE-ADDED?
In the world of GVCs, what ultimately matters is how much value-added a country is capable of exporting which is embodied in (gross) exports. The supply chain enables countries to reap a slice of the total value-added creation within an entire production process. This value-added can be created at the beginning, middle and the end of the supply chain or be dependent on whether intermediates are domestically created or transhipped through an economy. Usually the
6 Trade in services can take up various modes of delivery of which Mode 1 is cross-border trade, Mode 2 involves the movement of consumers to another country (such as education and tourism), Mode 3 covers services suppliers establishing a commercial presence abroad in the consumer’s country, and finally Mode 4 stands for the temporary movement of the services producer or services supplier abroad.
9
ecipe occasional paper — no. 01/2015
value-added can be divided up into different components, namely direct domestic, indirect and foreign value-added. Domestic value-added is created and put forward by the sector itself whereas indirect value-added originates from domestic intermediate inputs used in the final sector or are re-imported after being exported at the first stage of the production chain. Foreign value-added is value-added created abroad and used domestically in the supply chain after importing.
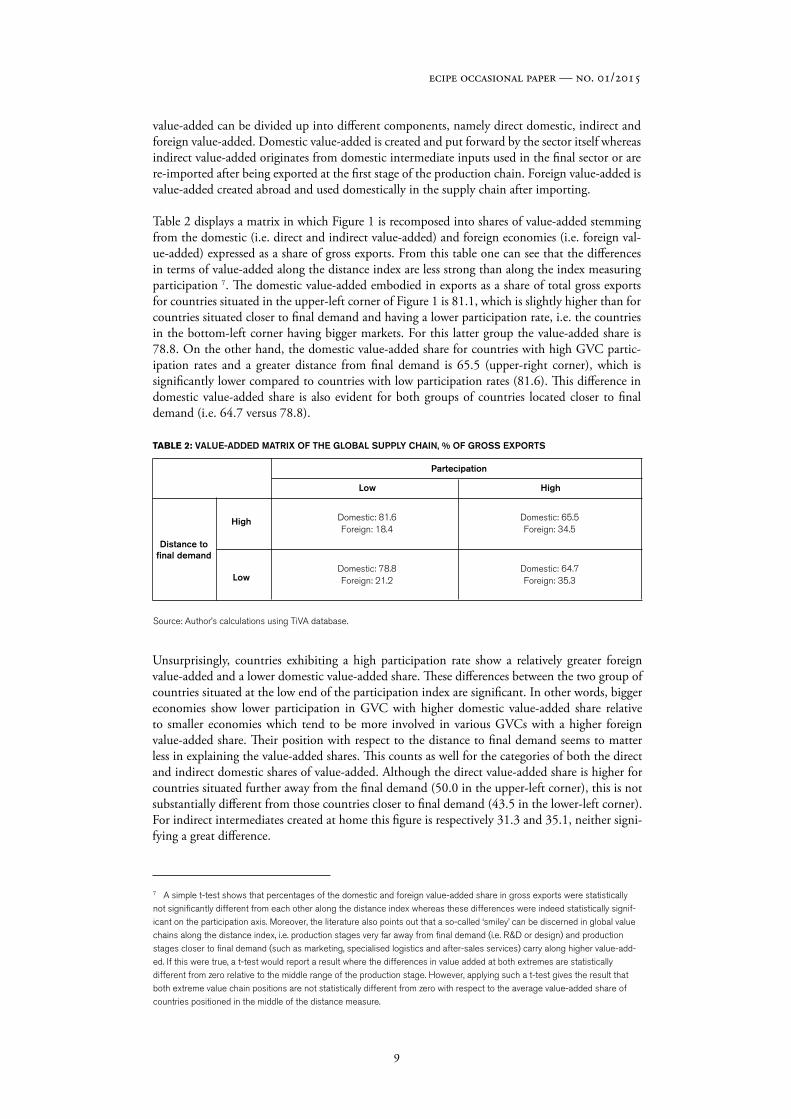
Table 2 displays a matrix in which Figure 1 is recomposed into shares of value-added stemming from the domestic (i.e. direct and indirect value-added) and foreign economies (i.e. foreign val-ue-added) expressed as a share of gross exports. From this table one can see that the differences in terms of value-added along the distance index are less strong than along the index measuring participation 7. The domestic value-added embodied in exports as a share of total gross exports for countries situated in the upper-left corner of Figure 1 is 81.1, which is slightly higher than for countries situated closer to final demand and having a lower participation rate, i.e. the countries in the bottom-left corner having bigger markets. For this latter group the value-added share is 78.8. On the other hand, the domestic value-added share for countries with high GVC partic-ipation rates and a greater distance from final demand is 65.5 (upper-right corner), which is significantly lower compared to countries with low participation rates (81.6). This difference in domestic value-added share is also evident for both groups of countries located closer to final demand (i.e. 64.7 versus 78.8).
TABLE 2: VALUE-ADDED MATRIX OF THE GLOBAL SUPPLY CHAIN, % OF GROSS EXPORTS
Low High
Distance tofinal demand
Domestic: 81.6 Foreign: 18.4
Domestic: 65.5Foreign: 34.5
7 A simple t-test shows that percentages of the domestic and foreign value-added share in gross exports were statistically not significantly different from each other along the distance index whereas these differences were indeed statistically signif-icant on the participation axis. Moreover, the literature also points out that a so-called ‘smiley’ can be discerned in global value chains along the distance index, i.e. production stages very far away from final demand (i.e. R&D or design) and production stages closer to final demand (such as marketing, specialised logistics and after-sales services) carry along higher value-add-ed. If this were true, a t-test would report a result where the differences in value added at both extremes are statistically different from zero relative to the middle range of the production stage. However, applying such a t-test gives the result that both extreme value chain positions are not statistically different from zero with respect to the average value-added share of countries positioned in the middle of the distance measure.
Partecipation
High
LowDomestic: 78.8Foreign: 21.2
Domestic: 64.7Foreign: 35.3
Source: Author’s calculations using TiVA database.
Unsurprisingly, countries exhibiting a high participation rate show a relatively greater foreign value-added and a lower domestic value-added share. These differences between the two group of countries situated at the low end of the participation index are significant. In other words, bigger economies show lower participation in GVC with higher domestic value-added share relative to smaller economies which tend to be more involved in various GVCs with a higher foreign value-added share. Their position with respect to the distance to final demand seems to matter less in explaining the value-added shares. This counts as well for the categories of both the direct and indirect domestic shares of value-added. Although the direct value-added share is higher for countries situated further away from the final demand (50.0 in the upper-left corner), this is not substantially different from those countries closer to final demand (43.5 in the lower-left corner). For indirect intermediates created at home this figure is respectively 31.3 and 35.1, neither signi-fying a great difference.
10
ecipe occasional paper — no. 01/2015
Therefore, countries with lower GVC participation rates are creating higher value-added. But these countries are often the ones with larger markets as they are generally less dependent on trade relative to smaller economies. However, acquiring greater domestic value-added is somewhat bet-ter connected for both smaller and larger economies with GVC activities that are located further away from rather than closer to final demand, although this difference is not substantial.
3.1 ON WHICH POLICIES SHOULD A COUNTRY CONCENTRATE?
As we have seen in Table 1, the effects of the various policies have a heterogeneous effect in that not all barrier issues will qualitatively be of equal importance to each country. Therefore, a pregnant question for policy makers is: on which policies disciplines should one focus so as to reap as much exported value-added based on a country’s position on the supply chain map? Some countries will do better to concentrate on the measures that are highly related to increasing par-ticipation in global value chains since their exported value-added is composed of many foreign in-termediate inputs whereas for other countries it makes more sense to focus on the policy barriers that related to their location within the production chain, i.e. whether they are far away or closer to final demand as these economies produce relatively more domestic value-added.
Note that although it looks as if a focus on the participation level would generate less value-added compared to domestically produced value-added, this is not necessarily the case for various rea-sons. One is that there is a strong correlation between the growth of GVC participation and the growth of domestically produced value-added embodied in exports, especially for the manufac-turing sector. Second, the growth of foreign value-added in gross exports is significantly associated with higher growth of domestic value-added. This means that importing foreign inputs have the advantage of increasing production, therefore productivity and eventually reaping higher export-ed value-added. Third, importing value-added is often accompanied with importing technology transfer, which in turn affects the growth of the domestic value-added that a country exports.
As the participation index measures the specialisation pattern of countries trading in inputs both from the perspective of imports and exports, a third indicator connects this intermediary trade with the length of the supply chain a country is involved in. This index covering the length of the entire supply chain measures the (average) number of production stages a country is engaged in across all sectors. It therefore gives a good picture of the level of opportunities a country can exploit to ultimately export value-added.
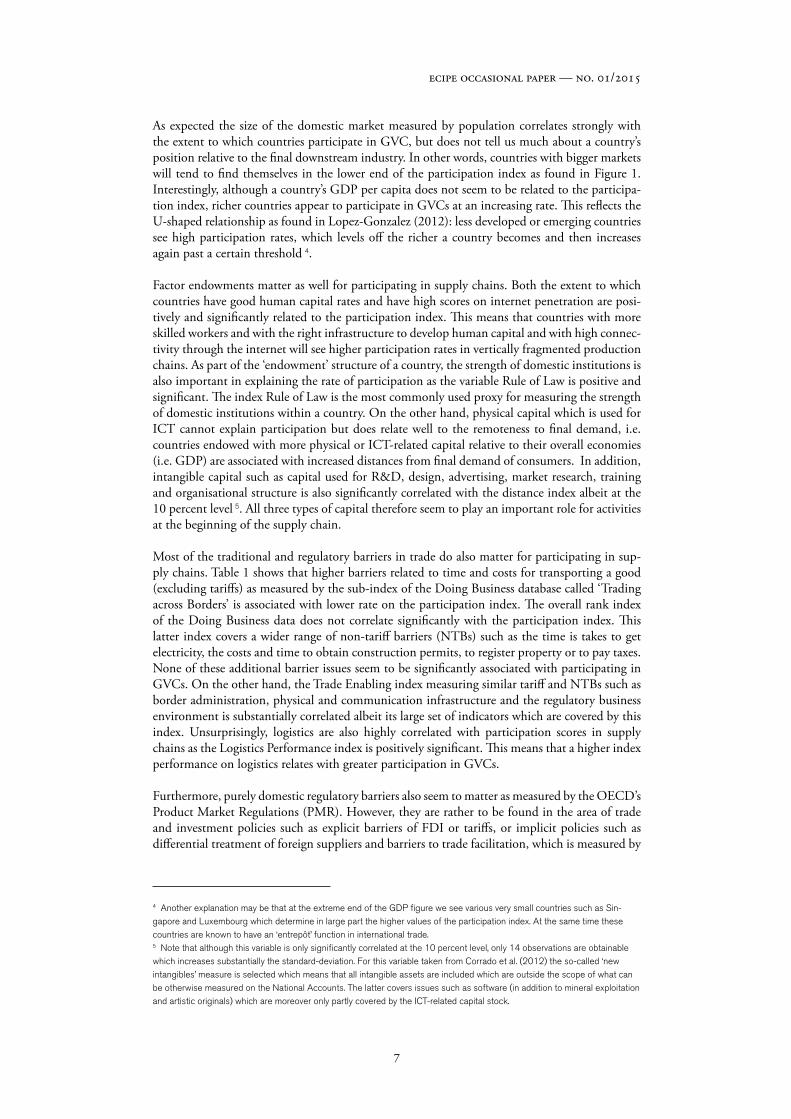
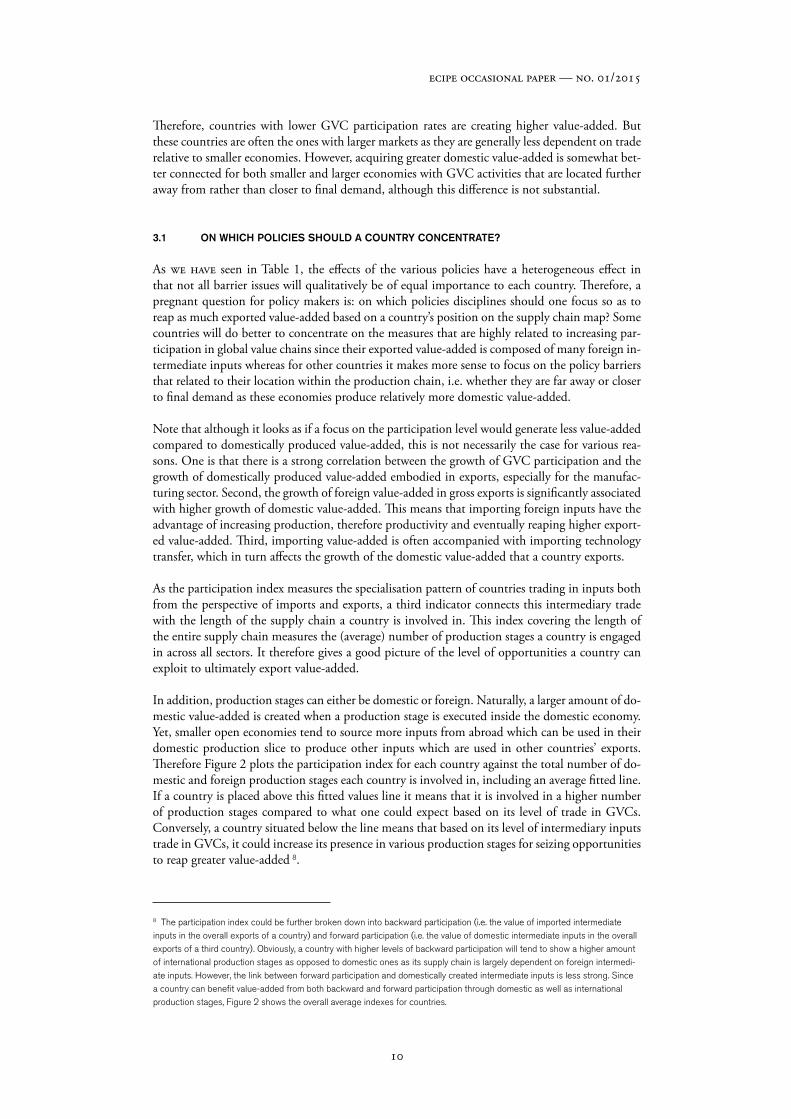
In addition, production stages can either be domestic or foreign. Naturally, a larger amount of do-mestic value-added is created when a production stage is executed inside the domestic economy. Yet, smaller open economies tend to source more inputs from abroad which can be used in their domestic production slice to produce other inputs which are used in other countries’ exports. Therefore Figure 2 plots the participation index for each country against the total number of do-mestic and foreign production stages each country is involved in, including an average fitted line. If a country is placed above this fitted values line it means that it is involved in a higher number of production stages compared to what one could expect based on its level of trade in GVCs. Conversely, a country situated below the line means that based on its level of intermediary inputs trade in GVCs, it could increase its presence in various production stages for seizing opportunities to reap greater value-added 8.
8 The participation index could be further broken down into backward participation (i.e. the value of imported intermediate inputs in the overall exports of a country) and forward participation (i.e. the value of domestic intermediate inputs in the overall exports of a third country). Obviously, a country with higher levels of backward participation will tend to show a higher amount of international production stages as opposed to domestic ones as its supply chain is largely dependent on foreign intermedi-ate inputs. However, the link between forward participation and domestically created intermediate inputs is less strong. Since a country can benefit value-added from both backward and forward participation through domestic as well as international production stages, Figure 2 shows the overall average indexes for countries.
11
ecipe occasional paper — no. 01/2015
FIGURE 2: PARTICIPATION AND NUMBER OF PRODUCTION STAGES IN THE GLOBAL VALUE CHAIN
Source: OECD statistics and author’s calculation
For instance, although the Netherlands shows a high participation rate, it could nonetheless increase the numbers of production stages it is involved in. This means that there is still scope for intensifying its position along the participation index thereby focussing on policy measures affecting a country’s location on the GVC map. These measures are the traditional and regulatory policy disciplines or the policies related to labour market efficiency and innovation which are all associated with the participation index as shown in Table 1. As a matter of fact, the Netherlands shows some barriers to entrepreneurship which are situated in the area of regulatory protection on incumbents and also has a relatively low efficiency score in its labour market compared to other countries.
Similarly, Lithuania also seems to underperform in terms of production stages compared to what could be expected regarding its level of GVC participation, especially to other Eastern European countries to which a lot of GVC activities have been outsourced. Going into the policy specifics of Lithuania data shows that in order to increase its performance on the participation index, it could focus more on its differential treatment of foreign suppliers in investment which is still relatively burdensome as illustrated by several sub-indicators of the PMR. Furthermore, statistics reveal that it can further improve its performance related to logistics and labour market efficiency as scores in these two policy areas are relatively low for Lithuania.
Other countries such as Italy, the UK and Spain take part in as many production stages as could be expected based on their level of GVC participation. Italy is placed on the fitted values line whereas Spain is even above the line. This means that focusing on the policy issues that affect a country’s participation rate would compromise greater gains in value-added by concentrating measures that impacts a country’s location on the distance index instead. For instance, data reveals that Spain has below average ICT-capital investments as part of its GDP and still has high barriers on Mode 4 services trade. In the same way, the UK could further decrease its barriers in Mode 4 services trade so as to intensify its location in the production chain or could focus on several of its remaining FDI barriers, namely on operational restrictions such as restrictions on the establish-ment of branches, reciprocity clauses or on profit and capital repatriation. These restrictions are somewhat higher for the UK than the overall OECD average. Italy shows low scores on ICT-re-lated capital investments, labour market efficiency and barriers on Mode 4.
ARG
AUS
BRACAN
CHECHL
CHN
HKG
IDN
IND
ISLISR
JPN
KHM
KOR
MEX
MLT
MYS
NOR
NZL
PHL
RUS
SGP
THA
TUR
TWN
USA
VNM
ZAF
1.5
22.
5N
o. p
rodu
ctio
n st
ages
30 40 50 60 70Participation
DNK
CYP
GRCFRA
ROM
LTU
PRT
GBR
ESPPOL
ITADEU
BGR
LVA
EST
BELAUT
SWE
SVN
NLD
HUNLUX
SVK
IRL
CZE
FIN
12
ecipe occasional paper — no. 01/2015
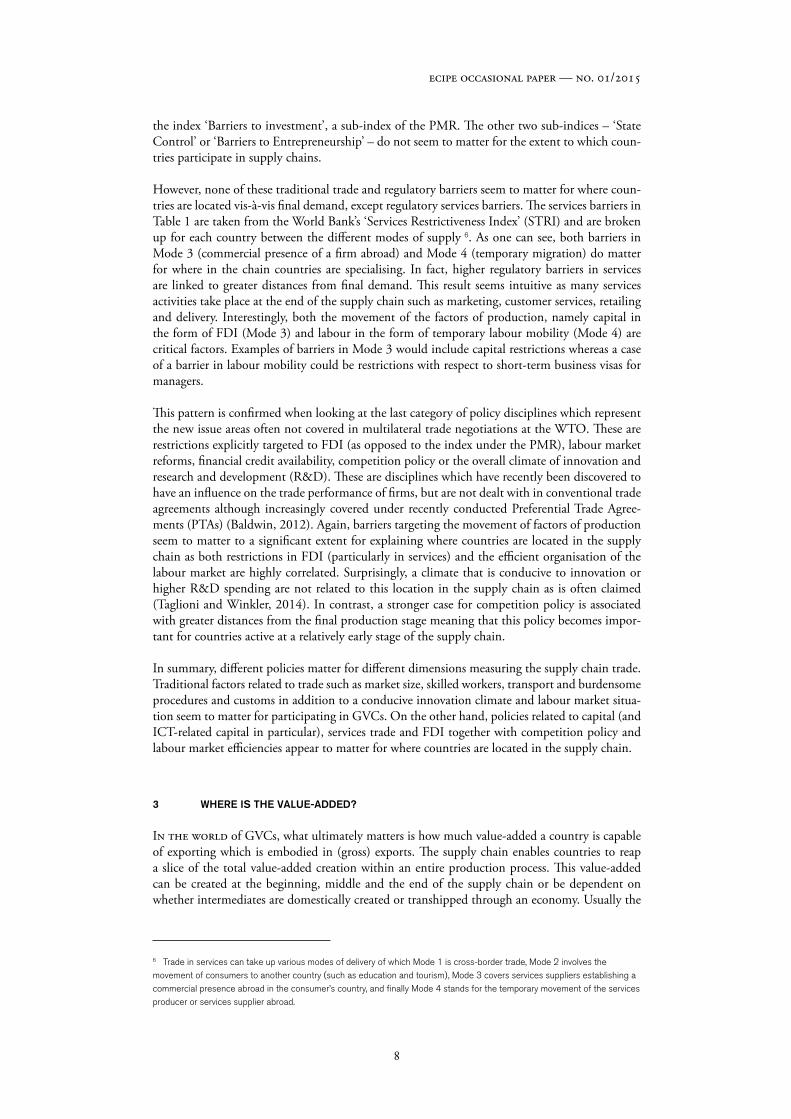
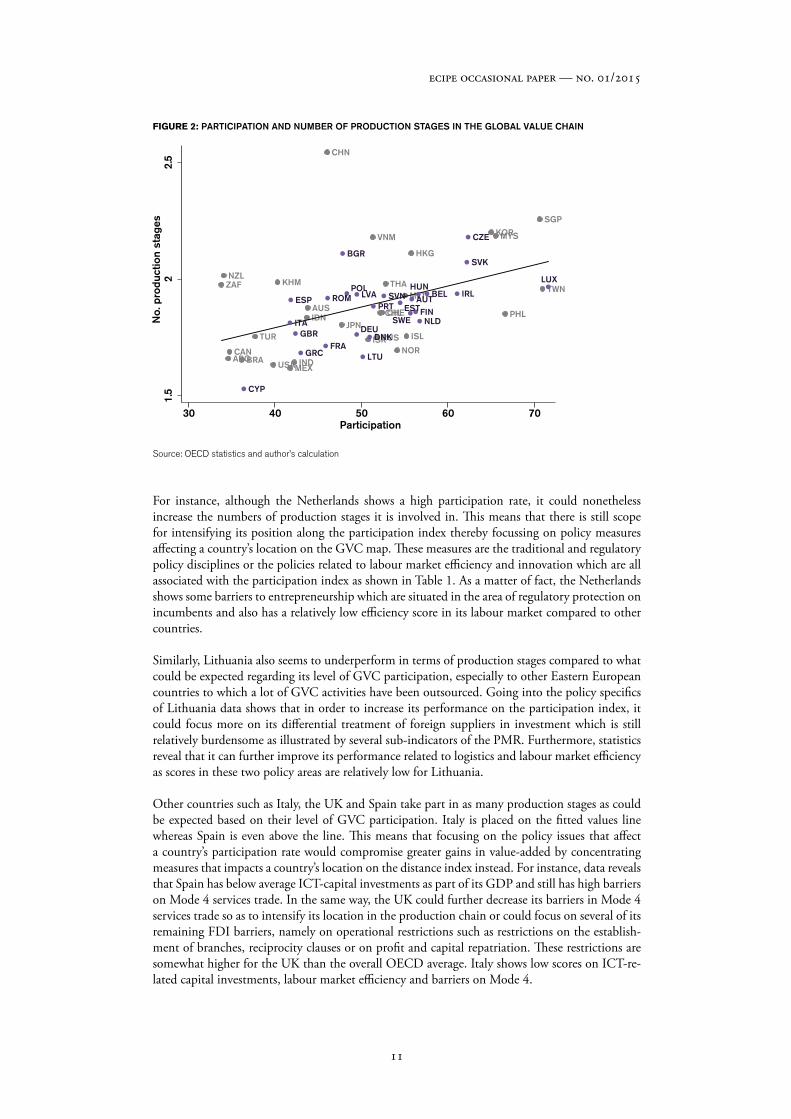
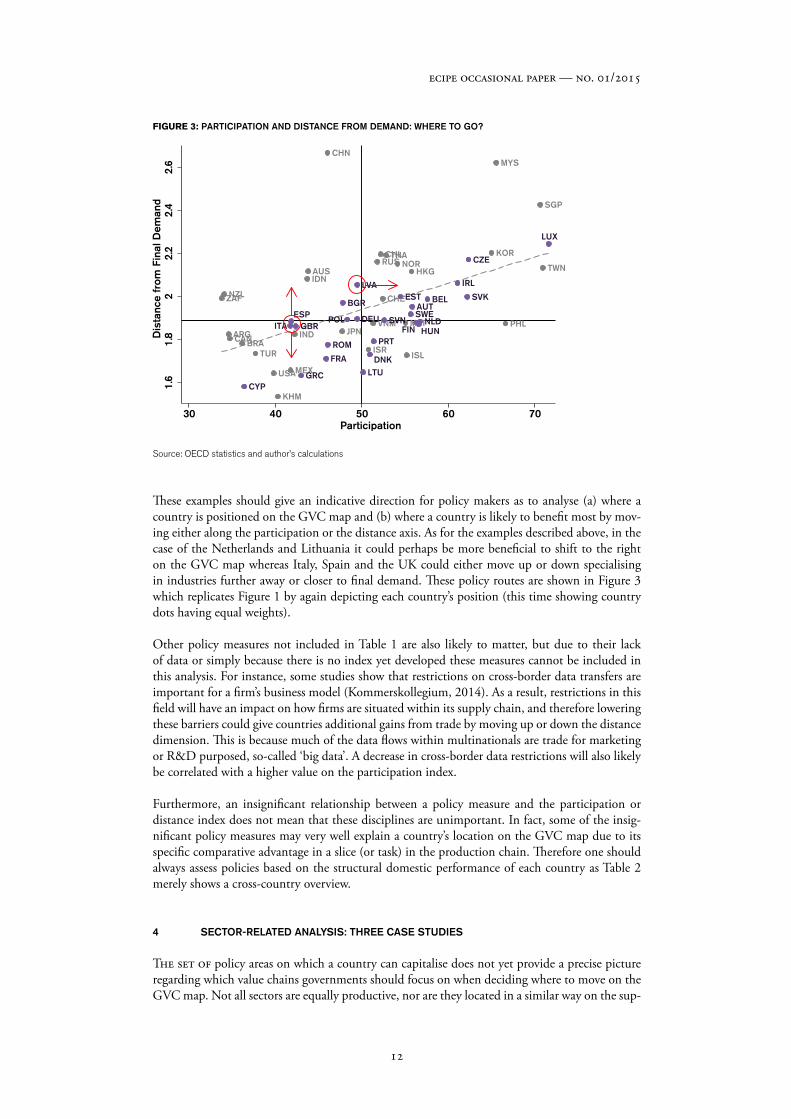
FIGURE 3: PARTICIPATION AND DISTANCE FROM DEMAND: WHERE TO GO?
Source: OECD statistics and author’s calculations
These examples should give an indicative direction for policy makers as to analyse (a) where a country is positioned on the GVC map and (b) where a country is likely to benefit most by mov-ing either along the participation or the distance axis. As for the examples described above, in the case of the Netherlands and Lithuania it could perhaps be more beneficial to shift to the right on the GVC map whereas Italy, Spain and the UK could either move up or down specialising in industries further away or closer to final demand. These policy routes are shown in Figure 3 which replicates Figure 1 by again depicting each country’s position (this time showing country dots having equal weights).
Other policy measures not included in Table 1 are also likely to matter, but due to their lack of data or simply because there is no index yet developed these measures cannot be included in this analysis. For instance, some studies show that restrictions on cross-border data transfers are important for a firm’s business model (Kommerskollegium, 2014). As a result, restrictions in this field will have an impact on how firms are situated within its supply chain, and therefore lowering these barriers could give countries additional gains from trade by moving up or down the distance dimension. This is because much of the data flows within multinationals are trade for marketing or R&D purposed, so-called ‘big data’. A decrease in cross-border data restrictions will also likely be correlated with a higher value on the participation index.
Furthermore, an insignificant relationship between a policy measure and the participation or distance index does not mean that these disciplines are unimportant. In fact, some of the insig-nificant policy measures may very well explain a country’s location on the GVC map due to its specific comparative advantage in a slice (or task) in the production chain. Therefore one should always assess policies based on the structural domestic performance of each country as Table 2 merely shows a cross-country overview.
4 SECTOR-RELATED ANALYSIS: THREE CASE STUDIES
The set of policy areas on which a country can capitalise does not yet provide a precise picture regarding which value chains governments should focus on when deciding where to move on the GVC map. Not all sectors are equally productive, nor are they located in a similar way on the sup-
ARG
AUS
BRACAN
CHE
CHL
CHN
HKGIDN
IND
ISLISR
JPN
KHM
KOR
MEX
MLT
MYS
NOR
NZL
PHL
RUS
SGP
THA
TUR
TWN
USA
VNM
ZAF
1.6
1.8
22.
22.
42.
6D
ista
nce
from
Fin
al D
eman
d
30 40 50 60 70Participation
DNK
CYPGRC
FRA
ROM
LTU
PRT
GBRESP POL
ITADEU
BGR
LVAEST BEL
AUTSWE
SVN NLDHUN
LUX
SVK
IRL
CZE
FIN
13
ecipe occasional paper — no. 01/2015
ply chain diagram. To find out how countries can proceed to determine the policy focus within the supply chain framework, this paper will focus on some examples for Latvia, Italy and France. Each of these countries are placed on a different position between the two GVC dimensions as presented in Figure 1 and disaggregated sectoral analysis could further reveal an indicative direc-tion that policy makers should move along – either the participation or distance axis (or both) – for the intermediate goods and services their economies are trading. This is in order to optimally realise the gains from value-added trade.
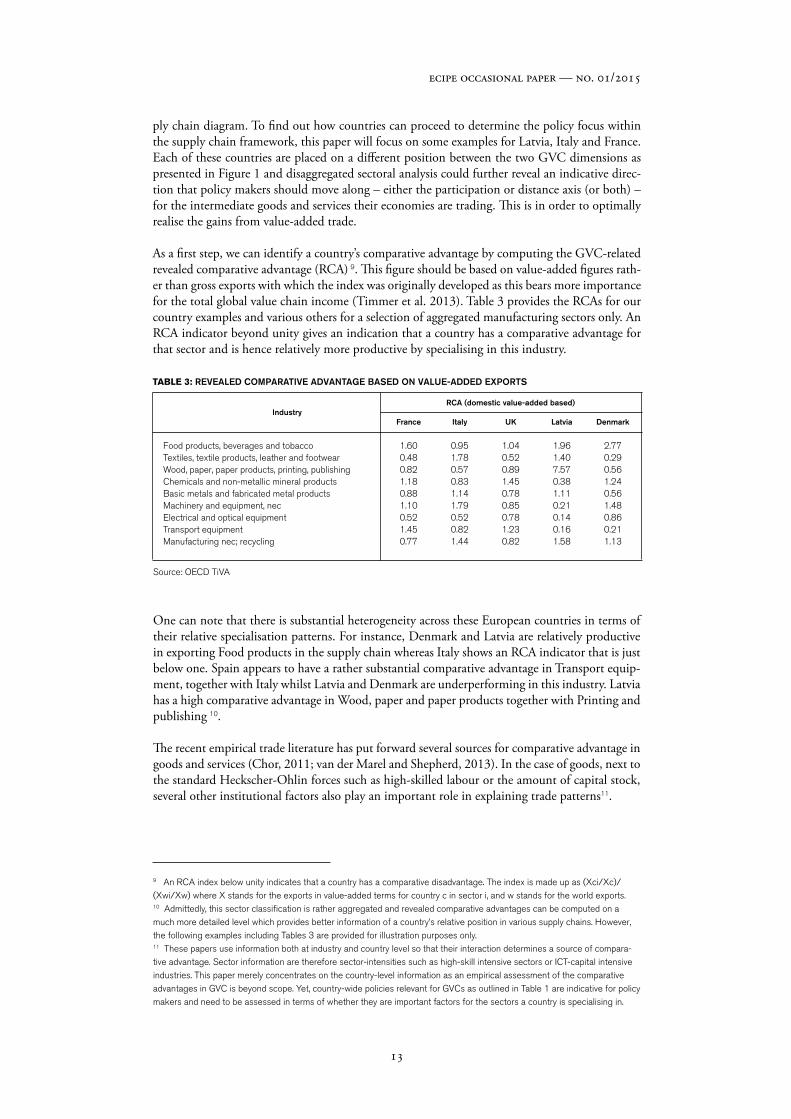
As a first step, we can identify a country’s comparative advantage by computing the GVC-related revealed comparative advantage (RCA) 9. This figure should be based on value-added figures rath-er than gross exports with which the index was originally developed as this bears more importance for the total global value chain income (Timmer et al. 2013). Table 3 provides the RCAs for our country examples and various others for a selection of aggregated manufacturing sectors only. An RCA indicator beyond unity gives an indication that a country has a comparative advantage for that sector and is hence relatively more productive by specialising in this industry.
TABLE 3: REVEALED COMPARATIVE ADVANTAGE BASED ON VALUE-ADDED EXPORTS
France Italy UK Latvia Denmark
Source: OECD TiVA
One can note that there is substantial heterogeneity across these European countries in terms of their relative specialisation patterns. For instance, Denmark and Latvia are relatively productive in exporting Food products in the supply chain whereas Italy shows an RCA indicator that is just below one. Spain appears to have a rather substantial comparative advantage in Transport equip-ment, together with Italy whilst Latvia and Denmark are underperforming in this industry. Latvia has a high comparative advantage in Wood, paper and paper products together with Printing and publishing 10.
The recent empirical trade literature has put forward several sources for comparative advantage in goods and services (Chor, 2011; van der Marel and Shepherd, 2013). In the case of goods, next to the standard Heckscher-Ohlin forces such as high-skilled labour or the amount of capital stock, several other institutional factors also play an important role in explaining trade patterns11.
RCA (domestic value-added based)Industry
Food products, beverages and tobaccoTextiles, textile products, leather and footwearWood, paper, paper products, printing, publishingChemicals and non-metallic mineral productsBasic metals and fabricated metal productsMachinery and equipment, nec Electrical and optical equipmentTransport equipmentManufacturing nec; recycling
1.600.480.821.180.881.100.521.450.77
0.951.780.570.831.141.790.520.821.44
1.040.520.891.450.780.850.781.230.82
1.961.407.570.381.110.210.140.161.58
2.770.290.561.240.561.480.860.211.13
9 An RCA index below unity indicates that a country has a comparative disadvantage. The index is made up as (Xci/Xc)/(Xwi/Xw) where X stands for the exports in value-added terms for country c in sector i, and w stands for the world exports.10 Admittedly, this sector classification is rather aggregated and revealed comparative advantages can be computed on a much more detailed level which provides better information of a country’s relative position in various supply chains. However, the following examples including Tables 3 are provided for illustration purposes only. 11 These papers use information both at industry and country level so that their interaction determines a source of compara-tive advantage. Sector information are therefore sector-intensities such as high-skill intensive sectors or ICT-capital intensive industries. This paper merely concentrates on the country-level information as an empirical assessment of the comparative advantages in GVC is beyond scope. Yet, country-wide policies relevant for GVCs as outlined in Table 1 are indicative for policy makers and need to be assessed in terms of whether they are important factors for the sectors a country is specialising in.
14
ecipe occasional paper — no. 01/2015
Examples of the latter includes the strength of domestic institutions in the form of rule of law, the availability of private credit for firms in the economy, or the degree of flexibility of a labour market. Both these categories of determinants are taken up in our analysis as previously discussed. In what follows, this section will outline an application of the analysis given above including the policies related to comparative advantage to specific industry sectors of the selected countries, na-mely Latvia’s Wood, paper and paper products, printing and publishing sector, Italy’s Machinery and equipment (nec) industry, and Frances’s Transport equipment sector.
4.1 LATVIA’S WOOD, PAPER AND PAPER PRODUCTS SECTOR
The Wood, paper and paper products industry (including publishing and printing) is a fo-rest-based sector in which most sub-sectors use wood and paper as their main inputs. The more specialised sectors such as cork or pulp industries are also covered in this industry classification. Most of the products that this sector produces are used as inputs for other downstream industries. In particular, the wood sector provides products which are consumed in Construction. Almost all the sub-sectors are rather resources- and labour-intensive industries with low technology utilisa-tion. Some of the value chains such as the wood furniture sector are so-called buyer-driven chains which means that the chain’s competitiveness is in large part determined by the lead firms which act as a final buyer (Gereffi, 1994).
The EU has a competitive position in this sector with both Sweden and Finland leading the Euro-pean market in the pulp and paper industry. Although the world market is dominated by China, Canada and the US, world production output of paper and paper board (excluding pulp) is also marked by the participation of Germany, Japan and South Korea. The wood industry has mostly small- and medium-sized enterprises (SMEs). Most of the inputs for this sector are sourced within the EU market (around 90%) whilst the rest is imported from outside.
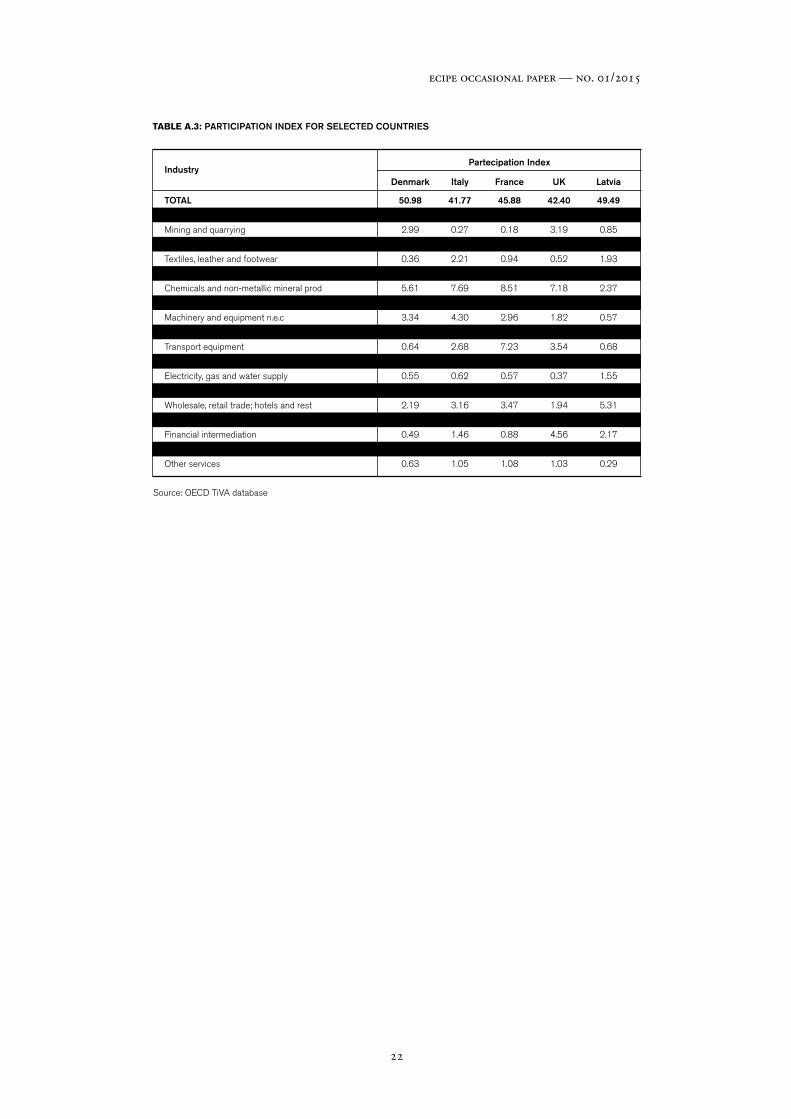
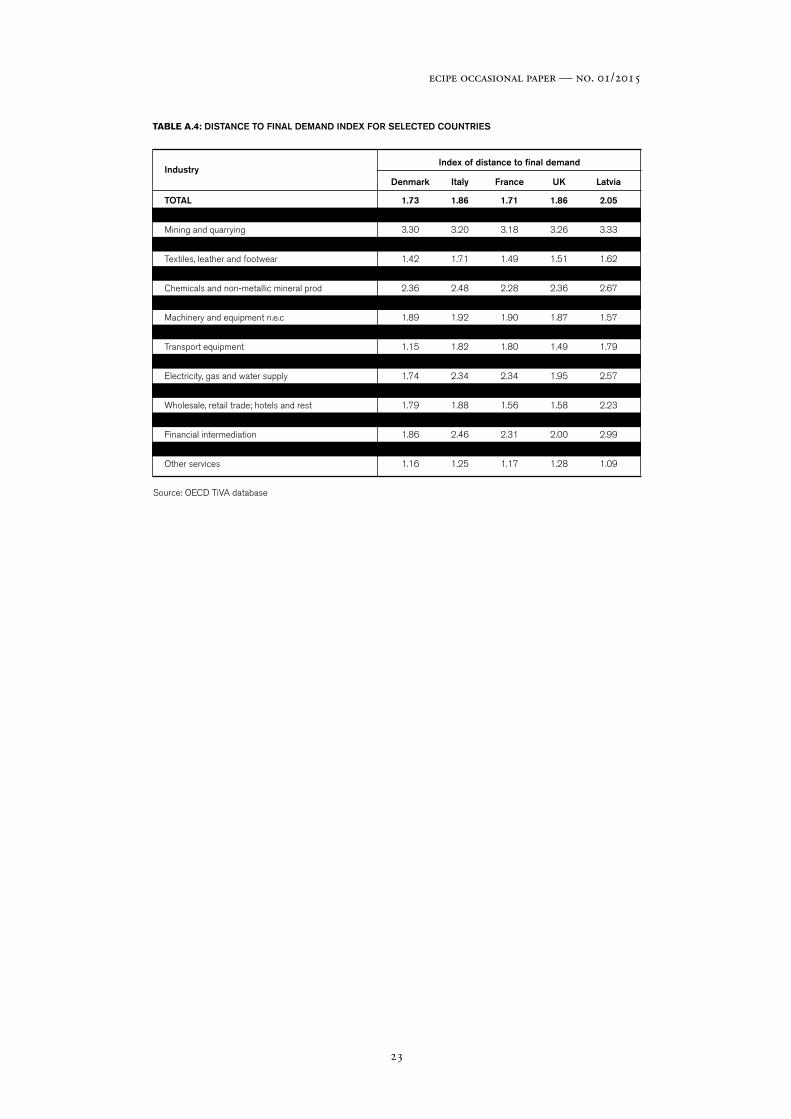
Concentrating on Latvia’s Wood, paper and paper products sector, data of the participation index shows that Latvia is also very much involved in intermediate inputs trade through supply chains in this sector. It participates heavily through both imports (domestic production or so-called backward linkages) and exports (exporting for third countries’ exports, i.e. forward linkages) with an overall index value of 7.3 which is fairly high (see annex, Table A.3). At the same time, Latvia shows a relatively high value on the distance index suggesting that its specialisation pattern in this industry sector is close to the beginning of the supply chain (i.e. 2.9, see annex, Table A.4). Depending on which stage of the GVC most of the value-added of the Wood, paper and paper products industry is situated, Latvia has two choices: either move further upstream along the distance axis as it is already relatively far away from final demand compared to other domestic sectors or intensify its intermediate inputs trade participation in existing and potentially other supply chains in this sector. For instance, if Latvia has a competitive position by tapping value-ad-ded which would otherwise be less when moving forward in the production chain, it could better expand and intensify its trade in the slice of the production process where it is currently located.
Given these two choices one could assess whether there is still enough scope for Latvia to actually intensify trade in its current production slice. Enhancing Latvia’s GVC participation can be done through expanding the numbers of production stages it is involved in within the wood and paper industry. In order to do so, Figure A.1 replicates Figure 2 by relating the participation index and the number of production stages index of each country, but this time for the Wood, paper and paper product industry. The figure shows that Latvia is placed below the fitted values line which means that based on its level of intermediate input trade (i.e. participation index) there is still some opportunity left to increase the number of production stages in this sector in an attempt to reap more value-added. Therefore it would make sense for Latvia to capitalise on the policy disciplines that affect its participation in GVC trade, ideally tailored to this sector. For instance, looking inside the policy variables that correlated significantly with the participation index, Lat-via’s import procedure is on average still somewhat time-consuming as it takes 11 days to import
15
ecipe occasional paper — no. 01/2015
a good compared to other European countries specialising in wood and paper such as Finland and Germany (7 days) or Sweden (6 days) which is measured by the ‘Trading across Borders’ index in Table 1.
In addition, there is still some room for improvement in Latvia on the performance of its logistics sector. Compared to Sweden and Finland, but also other countries, Latvia could furthermore improve on the efficiency of the clearance process by border control agencies and the state of infrastructure such as ports, roads and railroads as measured by the ‘Logistical Performance’ in-dex. Furthermore, as we have seen there are also some other new trade policy disciplines that can have an effect on the participation index. Indeed, some sectors could for instance require a flexible labour market if sales volatility is very high as indicated by Melitz and Cuñat (2012) so as to adjust quickly. However, various sub-sectors within the Wood and paper classification such as Converted paper products or Newspaper publishing actually experience low sales volatility and therefore a focus on Latvia’s labour market efficiency would be relatively less meaningful in this particular instance.
4.2 ITALY’S MACHINERY AND EQUIPMENT SECTOR
The Machinery and equipment industry produces inputs for mainly Mining, Other manufactu-ring industries such as domestic appliances as well as for the Energy and Construction sector. Some of the sub-sectors are Agricultural and forestry machinery, General purpose machinery, and Industrial processes machinery. The sector also covers Arms and ammunition. Throughout the sector’s sub-categories, technological advancements play a pivotal role, which are passed through inside the supply chain as a productivity enhancing feature to many downstream industries. Inter-mediate trade is an extremely important factor in the Machinery and equipment sector and trade in this sector was growing strongly before the crisis which indicates that many firms are likely offshoring parts of their production processes abroad.
Within the EU, both Germany and Italy are leading the Machinery and equipment sector thereby being the third largest provider of employment next to Food products manufacturing and the Fa-bricated metal products industry. Large- to medium-sized companies are relatively important in this sector across most European countries which may explain the high offshore activities as these firms are more likely to offshore, although small enterprises do play a large role in this sector in Spain and Greece. The Machinery and equipment industry also entails many goods that are cove-red under the Information Technology Agreement (ITA), and compared to other manufacturing industries the average length of the global value chain in this sector has been increasing, which in part is of course due to the introduction of the agreement.
The supply chain map suggests that Italy is relatively well-positioned in the Machinery and equipment sector by its high participation index, namely 4.3 (see annex, Table A.3). Yet, Italy’s backward participation position is greater than its forward participation position which means that it imports more intermediate inputs in this sector than it exports for third countries exports. This may point to the fact that Italy uses many of these intermediate inputs in other industries domestically and they are sold within its own economy. Italy’s position of 1.9 on the index me-asuring the distance to final demand is in line with Italy’s overall average position and points to the fact that Italy is specialising somewhat closer to final demand relative to all other countries trading in this industry (see annex, Table A.4). Therefore Italy could shift the production line in Machinery and equipment even further downstream by pushing its position closer to the end of the production chain. Conversely, however, it could also decide to concentrate on expanding its supply chain trade (i.e. exports) participation of intermediate input in this sector for third coun-tries as there is still some potential for doing so.
Choosing between these two strategies, Figure A.2 shows that there is still some room for Italy to expand its involvement in the number of production stages in the Machinery sector based

16
ecipe occasional paper — no. 01/2015
on what one could expect compared to its level of GVC participation in this industry. In other words, Italy is placed just below the fitted values line. However, compared to other countries in the EU that generate high value-added in this sector such as Germany, France, the UK, Sweden and even Spain, Italy is involved in actually quite a number of production stages. As a result the value-added gains from specialising its production line closer to final demand may outweigh the benefits from reaping value-added through solely increasing its participation in supply chain trade. In order to profit most from a shift in location within the value chain, Italy could reform policies that are strongly related to the final distance index in Table 1 such as regulations in FDI, services or the labour market.
Looking at each of these policy issues more closely it appears that although Italy’s Machinery sec-tor is free of FDI restrictions, some relatively high barriers to FDI still exist in sectors supplying inputs to this sector, namely Transportation services. This is shown both on the OECD FDI re-strictiveness index, but also on the STRI index for Mode 3 taken from the World Bank for trade in international passenger and shipping services as well as for road and rail transportation services. In addition, very high barriers still exist in Mode 4 for Professional services and additional barriers exist in Business services. Italy’s industrial sector, including the Machinery industry, is to a very large extent dependent on cost-effective services supply and moving forward or backward on the production chain generally implies that services activities will play an even larger role in reaping value-added (Cattaneo and Miroudot, 2013). For instance, if Italy decides to move further down-stream along the supply chain specific services tasks such as logistics, marketing and brand design are becoming more important (WEF, 2012). These are precisely the services sectors in which Italy has relatively higher restrictions.
4.3 FRANCE’S TRANSPORT EQUIPMENT SECTOR
The Transport Equipment sector has been an increasingly important sector and is key for the European economy. The expansion of this sector in is in large part thanks to the increased trada-bility of goods and services which are being transported over an ever larger distance. The sector is divided into several sub-sectors of which the motor vehicle sector is by far the most important one. Other sub-sectors are the construction and reparation of ships and boats, railway equipment, aircraft and spacecraft, plus other miscellaneous transport equipment. In many of this sector’s activities the production chain is based on a pyramidal structure in which there are a few large manufacturing companies around which several first-tier suppliers are organised which are often also global firms. They provide complex sub-systems, parts and accessories to the lead firms in the chain and cooperate with smaller specialised lower-tier subcontractors.
Within the EU, France is the second largest producer in the Transport equipment sector in terms of value-added and employment after Germany, particularly in the motor vehicle industry. GVCs in the motor vehicle industry are organised around neighbouring countries, just as in North Ame-rica and Mexico (around NAFTA) and in Asia which means that intra-regional input sourcing is spread over three geographical blocks. Larger vehicle parts and systems suppliers are often locali-sed around their larger customer firms, which is most likely due to the high transportation costs in this sector. Overall, large (tangible) investments are made in the Motor vehicle sector which are on average higher than in other manufacturing industries. At the same time, the automotive industry (both suppliers and manufacturers) also becomes increasingly dependent on intangible assets related to customer relations, marketing and technology at both the beginning and the end of the supply chain (KPMG, 2010).
France’s position on the supply chain diagram makes clear that it participates to a very high extent as the index is around 7.2 percent (see annex, Table A.3). Its location relative to final demand shows that France takes up an average position of 1.8 however (see annex, Table A.4). This po-sition is somewhat lower but still comparable with Germany (another great producer of motor vehicles within the EU) which is around 1.9. Yet, these figures are much lower compared to Japan (2.4) and Korea (2.3) which are therefore on average placed much further away from the last
17
ecipe occasional paper — no. 01/2015
production stage. Looking at Figure A.3 it seems that France’s involvement in production stages is in line with what one could expect based on its level of participation even though it seems that relative to Germany, Japan or Korea this could be somewhat further expanded. It therefore seems that France is faced with a choice of moving further downstream or upstream.
The main policies that determine a country’s position relative to final demand are for France still somewhat behind the main average compared to its comparators. For instance, in France services restrictions are still very high in various transport sub-sectors such as rail (completely closed) and road freight. Other policy indicators show that France’s labour market could be more efficient as it scores below the European average and although output and volatility in this sector has decre-ased, the automobile sector could in particular still benefit from a more flexible adjustment in employment (Ramey and Vine, 2006). Adjusting these policy disciplines could as a consequence be favourable for a strategy to shift closer to the final production stage.
In contrast, some of the other disciplines that are correlated with shifting further at the beginning of the supply chain are particularly low for France. It scores low on ICT-related capital which is only 0.07 percent of its GDP compared to Germany (0.12), Japan, (0.11) and the US (0.16). And although its knowledge capital share in GDP is in line with other European countries (0.16), it compares low with the US (0.26). In particular, the latter two policy items play an important role for an upgrading strategy in the supply chain in such a way that it carries along higher va-lue-added. This can be done through the development of new concepts, product design and basic innovation and R&D (function upgrading) at the early stages of the chain or can be performed through innovative managerial skills and organisational structures (chain upgrading) so that in-dustries such as the automobile industry in addition move more upstream (OECD, 2013).
5 CONCLUSION
This paper has looked at the determinants for positioning on the GVC map. As such it can be considered a first step to a GVC roadmap for policy makers which makes explicit for which speci-fic aspect of the value chain policies are important. The two main indicators used for developing a so-called GVC diagram are the extent to which countries participate in trading the myriad of intermediate inputs, both on the import side as well as on the export side as well as a measure telling countries how they are connected to the average distance to the final production stage, i.e. whether countries are producing and trading in the relative upstream or downstream stages of the supply chain.
The analysis suggests that for each of these two dimensions a different set of policy sets are requi-red. The participation level necessitates traditional trade policies such as the ease of trading across borders for not only tariffs but also time, speed and administrative procedures in addition to the regulations of markets, and even policies related to the innovation climate. Hence, all these poli-cies are associated with intensifying a country’s position in the supply chain. On the other hand, services policies, labour market flexibility and both capital related to ICT and knowledge seem to be more important for shifting location within a GVC.
Undoubtedly other factors also do play a role in explaining a country’s location on the GVC map. However, more research will need to be done in order to explore these issues. This paper has used the many existing index indicators that are found and used in the empirical trade literature, but other policy disciplines which seem harder to quantify do also matter. For instance, more and more industries are experiencing a so-called ‘servicification’ of the production process which re-quires the optimal allocation of information, often implying cross-border data flows. Currently, no index measuring the restrictiveness of data flows exists. When more policy indicators are at hand, policy makers will be able to further scrutinise what is important for them in the GVC.
18
ecipe occasional paper — no. 01/2015
REFERENCES
Allemani, E., C. Klein, I. Koske, C. Vitale and I. Wanner (2013) ‘New Indicators of Competition Law and Policy for OECD and non-OECD Countries’, OECD Economics Department Working Papers No 1104, Paris: OECD.
Antràs, P., D. Chor, T. Fally and R. Hillberry (2012) ‘Measuring the Upstreamness of Production and Trade Flows’, American Economic Review, Vol. 102, Issue 3, pages 412-416.
Baldwin, R. (2012) ‘WTO 2.0: Global Governance of Supply-Chain Trade’, CEPR Policy Insight, No. 64, London: CEPR.
Baldwin, R. (2013) ‘Global Supply Chains: Why They Emerged, Why They Matter, and Where They Are Going’, in (eds) Deborah K. Elms and Patrick Low: Global Value Chains in a Changing World, Geneva: WTO.
Bloom, N. and J. van Rheenen (2010) ‘Why Do Management Practises Differ across Firms and Countries’, Journal of Economic Perspectives, Vol. 24, No. 1, pages 203-224.
Beck, T., A. Demirguc-Kunt and R. Levine (2000) ‘A New Database on Financial Development and Structure’, World Bank Economic Review, Vol. 14, pages 597-605, Update 2013.
Cattaneo, O. and S. Miroudot (2013) ‘From Global Value Chains to Global Development Chains: An Analysis of Recent Changes in Trade Pattern and Development Paradigms’, in E. Zedillo and B. Hoekman (eds) 21st Century Trade Policy: Back to the Past?, New Haven CT: Yale University Press.
Chor, D. (2011) ‘Unpacking Sources of Comparative Advantage: A Quantitative Approach’, Jour-nal of International Economics, Vol. 82, No. 2, pages 152-167.
Corrado, C., J. Haskel, C. Jona-Lasinio and M. Iommi (2012) ‘Intangible Capital and Growth in Advanced Economies: Measurement Methods and Comparative Results’, IntanInvest Working Paper.
Fally, T. (2012) ‘Production Staging: Measurement and Facts’, previously entitled: ‘On the Fragmen-tation of Production in the US’, mimeo.
Gereffi, G. (1994) ‘The Organization of Buyer-Driven Global Commodity Chains: How US Retai-lers Shape Overseas Production Networks’, in (eds) G. Gereffi and M. Korzeniewicz: Commodity Chains and Global Capitalism, Westport, CT: Praeger.
Horn, H., P.C. Mavroidis and A. Sapir (2009) ‘Beyond the WTO? An Anatomy of EU and US Preferential Trade Agreements’, Bruegel Blueprints Series No. 7, Brussels: Bruegel.
Kommerskollegium (2014) ‘No Transfer, No Trade: The Importance of Cross-Border Data Transfers for Companies Based in Sweden’, Stockholm: Kommerskollegium / National Board of Trade.
KPMG (2010) ‘Intangible Assets and Goodwill in the Context of Business Combinations: An Indu-stry Study’, Corporate Finance Advisory, Munich: KPMG.
Lopez-Gonzalez, J. (2012) ‘Vertical Specialization and New Regionalism’, PhD Thesis, University of Sussex, April 2012.
Melitz, M. and A. Cuñat (2012) ‘Volatility, Labour Market Flexibility, and the Patterns of Compa-rative Advantage’, Journal of the European Economic Association, Vol. 10, pages 225-254.
19
ecipe occasional paper — no. 01/2015
OECD (2013) ‘Upgrading in Global Value Chains: The Role of Knowledge-Based Capital’, Interconnected Economies: Benefiting from Global Value Chains, Paris: OECD.
Ramey, D. and D. Vine (2006) ‘Declining Volatility in the US Automobile Industry’, American Economic Review, Vol. 96, No. 5, pages 1876-1889.
Taglioni, D and D. Winkler (2015) ‘Making Global Value Chains Work for Development’, The World Bank Group Trade and Competitiveness Global Practise, Washington DC: The World Bank.
Timmer, M.P., B. Los, R. Streher and G.J. de Vries (2013) ‘Fragmentation, Incomes and Jobs: An Analysis of European Competitiveness’, Economic Policy, Vol. 28, Issue 76, pages 613-661.
van der Marel, E. and B. Shepherd (2013) ‘International Tradability Indices for Services’, World Bank Policy Research Paper Series No. 6712, Washington DC: World Bank.
WEF (2012) ‘The Shifting Geography of Global Value Chains: Implications for Developing Coun-tries and Trade Policy’, Davos: World Economic Forum.
20
ecipe occasional paper — no. 01/2015
ANNEX
Forward Participation
BackwardParticipation
ln(GDP) per capita
GDP per capita squared
ln(Population)
Human Capital
Internet
Physical capital / GDP
ICT-related capital / GDP
Knowledge capital / GDP
Rule of Law
Trading across Borders
Logistics Performance
Trade Enabling
Product Market Regulations
Barriers to Entrepreneurship
Barriers to Investment
FDI restrictions
FDI restrictions in services
Management
Financial credit availability
Labour Market
Innovation
R&D spending / GDP
Barriers Services Mode 3
Barriers Services Mode 4
Doing Business
Competition policy
0.1697
0.0097
0.1443
0.1305
0.0736
0.0697
-0.1577
0.0221
0.0545
-0.0791
0.0657
0.1087
-0.0214
-0.1137
0.0252
0.1858
0.2014
0.4290*
-0.0820
-0.1919
0.0401
0.1387
0.162
0.0717
-0.0200
-0.1549
0.0514
0.2652**
-0.3741***
-0.1333
0.2283*
0.0181
0.2443
0.3619
0.1892
-0.2591*
0.1833
0.1666
-0.2556
-0.0718
-0.3833**
-0.2946**
-0.3140**
-0.2351
0.1254
-0.1737
0.2191
0.1601
-0.0679
0.0147
0.1683
0.1484
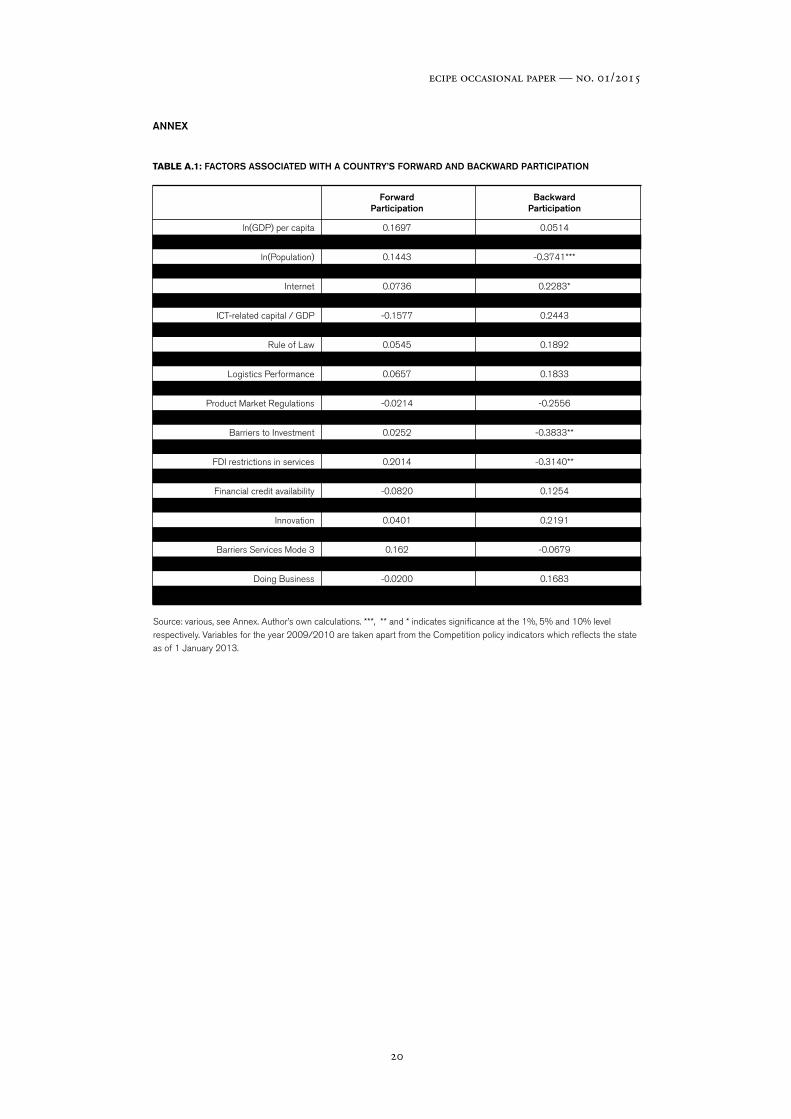
TABLE A.1: FACTORS ASSOCIATED WITH A COUNTRY’S FORWARD AND BACKWARD PARTICIPATION
Source: various, see Annex. Author’s own calculations. ***, ** and * indicates significance at the 1%, 5% and 10% level respectively. Variables for the year 2009/2010 are taken apart from the Competition policy indicators which reflects the state as of 1 January 2013.
21
ecipe occasional paper — no. 01/2015
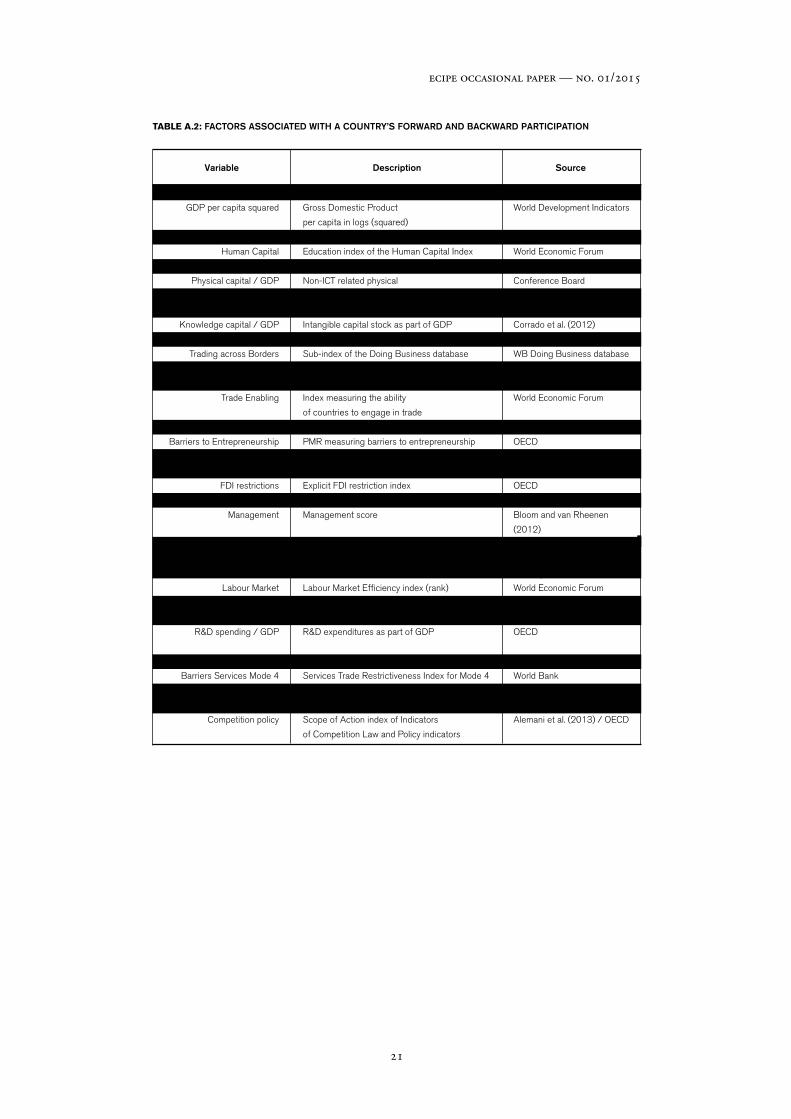
TABLE A.2: FACTORS ASSOCIATED WITH A COUNTRY’S FORWARD AND BACKWARD PARTICIPATION
ln(GDP) per capita
GDP per capita squared
ln(Population)
Human Capital
Internet
Physical capital / GDP
ICT-related capital / GDP
Knowledge capital / GDP
Rule of Law
Trading across Borders
Logistics Performance
Trade Enabling
Product Market Regulations
Barriers to Entrepreneurship
Barriers to Investment
FDI restrictions
FDI restrictions in services
Management
Financial credit availability
Labour Market
Innovation
R&D spending / GDP
Barriers Services Mode 3
Barriers Services Mode 4
Doing Business
Competition policy
Variable Description Source
World Development Indicators
World Development Indicators
World Development Indicators
World Economic Forum
World Development Indicators
Conference Board
Conference Board
Corrado et al. (2012)
WB Governance Indicators
WB Doing Business database
World Bank
World Economic Forum
OECD
OECD
OECD
OECD
OECD
Bloom and van Rheenen
(2012)
Beck et al. (2000); Financial
Structure and Economic
Development Database
World Economic Forum
Cornell University
/ INSEAD / WIPO
OECD
World Bank
World Bank
World Bank
Alemani et al. (2013) / OECD
Gross Domestic Product per capita in logs
Gross Domestic Product
per capita in logs (squared)
Population in logs
Education index of the Human Capital Index
Internet users per 100 people
Non-ICT related physical
capital stock as part of GDP
ICT related capital stock as part of GDP
Intangible capital stock as part of GDP
Rule of law Index
Sub-index of the Doing Business database
Index for measuring logistics
performance of countries
Index measuring the ability
of countries to engage in trade
Index measuring Product Market Regulations
PMR measuring barriers to entrepreneurship
PMR measuring barriers
to investment & trade facilitation
Explicit FDI restriction index
FDI restrictions index for services
Management score
Credit extended by banks and non-banks
to the private sector as part of GDP
Labour Market Efficiency index (rank)
Global Innovation Index
R&D expenditures as part of GDP
Services Trade Restrictiveness Index for Mode 3
Services Trade Restrictiveness Index for Mode 4
Overall ranking of all indicators
of Doing Business index
Scope of Action index of Indicators
of Competition Law and Policy indicators
22
ecipe occasional paper — no. 01/2015
TABLE A.3: PARTICIPATION INDEX FOR SELECTED COUNTRIES
TOTAL
Agriculture
Mining and quarrying
Food products and beverages
Textiles, leather and footwear
Wood, paper, paper prod, printing, publ
Chemicals and non-metallic mineral prod
Basic metals and fabricated metal products
Machinery and equipment n.e.c
Electrical and optical equipment
Transport equipment
Manufacturing n.e.c; recycling
Electricity, gas and water supply
Construction
Wholesale, retail trade; hotels and rest
Transport and storage; post and telecom
Financial intermediation
Business services
Other services
IndustryPartecipation Index
50.98
0.83
2.99
2.90
0.36
0.70
5.61
2.14
3.34
3.44
0.64
0.73
0.55
0.18
2.19
20.11
0.49
3.15
0.63
41.77
0.31
0.27
0.97
2.21
0.96
7.69
5.21
4.30
2.79
2.68
1.01
0.62
0.28
3.16
2.78
1.46
4.01
1.05
45.88
1.42
0.18
1.74
0.94
1.06
8.51
3.54
2.96
2.86
7.23
0.55
0.57
0.16
3.47
3.05
0.88
5.69
1.08
42.40
0.17
3.19
0.82
0.52
0.86
7.18
2.58
1.82
2.94
3.54
0.52
0.37
0.28
1.94
2.58
4.56
7.47
1.03
49.49
3.79
0.85
2.46
1.93
7.40
2.37
4.69
0.57
1.18
0.68
1.30
1.55
1.34
5.31
8.67
2.17
2.93
0.29
Denmark Italy France UK Latvia
Source: OECD TiVA database
23
ecipe occasional paper — no. 01/2015
TABLE A.4: DISTANCE TO FINAL DEMAND INDEX FOR SELECTED COUNTRIES
Source: OECD TiVA database
TOTAL
Agriculture
Mining and quarrying
Food products and beverages
Textiles, leather and footwear
Wood, paper, paper prod, printing, publ
Chemicals and non-metallic mineral prod
Basic metals and fabricated metal products
Machinery and equipment n.e.c
Electrical and optical equipment
Transport equipment
Manufacturing n.e.c; recycling
Electricity, gas and water supply
Construction
Wholesale, retail trade; hotels and rest
Transport and storage; post and telecom
Financial intermediation
Business services
Other services
IndustryIndex of distance to final demand
1.73
2.04
3.30
1.51
1.42
2.43
2.36
2.79
1.89
1.89
1.15
1.53
1.74
1.39
1.79
2.47
1.86
1.91
1.16
1.86
1.76
3.20
1.45
1.71
2.61
2.48
2.82
1.92
2.21
1.82
1.57
2.34
1.49
1.88
2.45
2.46
1.98
1.25
1.71
2.29
3.18
1.45
1.49
2.27
2.28
2.73
1.90
2.16
1.80
1.54
2.34
1.32
1.56
2.21
2.31
1.97
1.17
1.86
1.72
3.26
1.66
1.51
2.19
2.36
2.63
1.87
1.82
1.49
1.60
1.95
1.67
1.58
2.30
2.00
2.24
1.28
2.05
2.54
3.33
1.37
1.62
2.82
2.67
2.90
1.57
1.95
1.79
1.58
2.57
2.16
2.23
2.53
2.99
1.90
1.09
Denmark Italy France UK Latvia
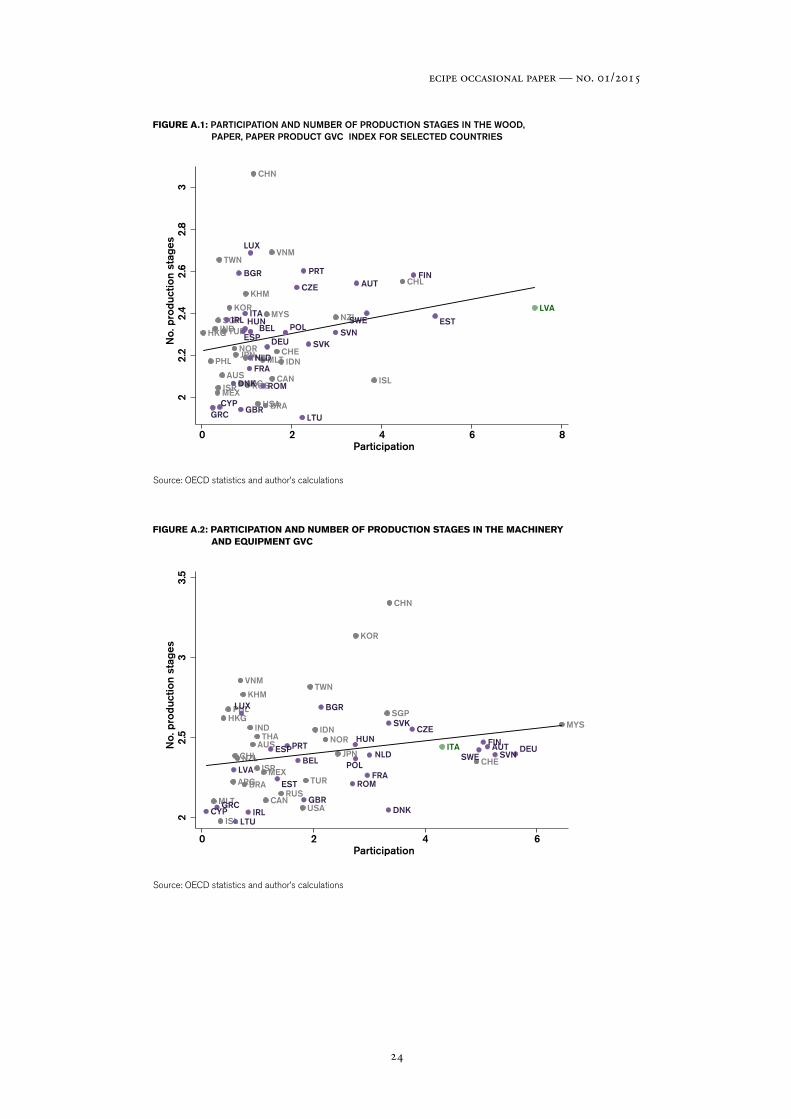
24
ecipe occasional paper — no. 01/2015
FIGURE A.1: PARTICIPATION AND NUMBER OF PRODUCTION STAGES IN THE WOOD, PAPER, PAPER PRODUCT GVC INDEX FOR SELECTED COUNTRIES
AUS CAN
CHL
ISLISR
JPN
KOR
MEX
NZL
NOR CHE
TUR
USABRA
CHN
IND
IDN
RUSARG
KHM
TWN
HKG
MYS
MLTPHL
SGP
THA
VNM
LVA
22.
22.
42.
62.
83
No.
pro
duct
ion
stag
es
0 2 4 6 8Participation
DNK
CYPGRC
FRA
ROM
LTU
PRT
GBR
ESPPOL
DEU
BGR
ESTBEL
AUT
SWESVN
NLD
HUN
LUX
SVK
IRL
CZEFIN
ITA
Source: OECD statistics and author’s calculations
FIGURE A.2: PARTICIPATION AND NUMBER OF PRODUCTION STAGES IN THE MACHINERY AND EQUIPMENT GVC
Source: OECD statistics and author’s calculations
AUS
CAN
CHL
ISL
ISR
JPN
KOR
MEX
NZL
NOR
CHE
TUR
USA
BRA
CHN
IND IDN
RUSARG
KHMTWN
HKGMYS
MLT
PHL SGP
THA
VNM
ITA
22.
53
3.5
No.
pro
duct
ion
stag
es
0 2 4 6Participation
DNKCYPGRC
FRAROM
LTU
PRT
GBR
ESP
POL
DEU
BGR
LVA
EST
BEL
AUTSWE SVNNLD
HUN
LUX
SVK
IRL
CZE
FIN
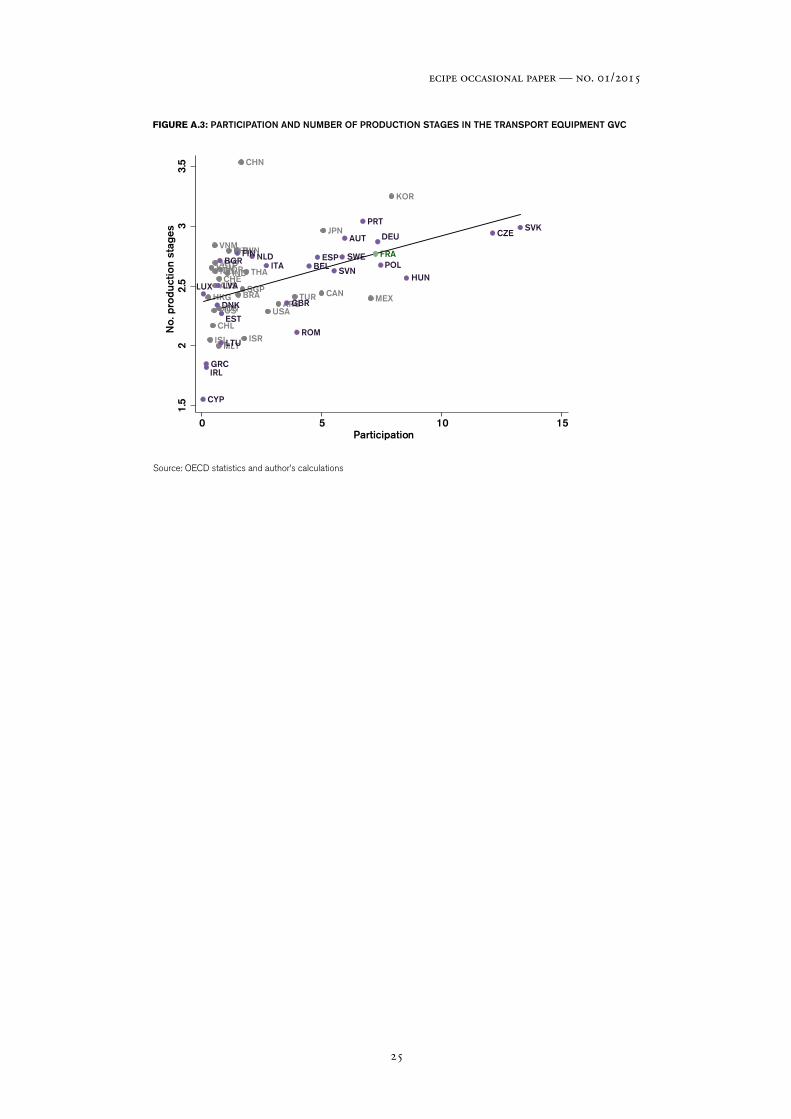
25
ecipe occasional paper — no. 01/2015
FIGURE A.3: PARTICIPATION AND NUMBER OF PRODUCTION STAGES IN THE TRANSPORT EQUIPMENT GVC
Source: OECD statistics and author’s calculations
AUSCAN
CHL
ISL ISR
JPN
KOR
MEX
NZLNORCHE
TUR
USA
BRA
CHN
IND
IDNRUSARG
KHM
TWN
HKG
MYS
MLT
PHL
SGP
THA
VNMFRA
1.5
22.
53
3.5
No.
pro
duct
ion
stag
es
0 5 10 15Participation
DNK
CYP
GRC
ROMLTU
PRT
GBR
ESPPOLITA
DEU
BGR
LVA
EST
BEL
AUT
SWE
SVN
NLD
HUNLUX
SVK
IRL
CZE
FIN